Embed Size (px)
Citation preview
Woodrow Wilson School Graduate Policy Workshop _____________________________________________________________________________
Addressing Multifamily Affordable Rental Housing Needs after Superstorm Sandy Recommendations to the New Jersey Housing and Mortgage Finance Agency _____________________________________________________________________________
Authors Anna Fogel, Jonathan Hayes, Benjamin Horowitz, Adam Kent, Corey Parson, Angelo Isaac Sandoval, Timothy Schuringa, Tiana Thomas Project Advisor David N. Kinsey, FAICP January 2014

2

3
Acknowledgements
The authors thank the following experts who graciously shared their time and insights. We also thank our professor, David N. Kinsey, as well as the staff of the Woodrow Wilson School and the New Jersey Housing and Mortgage Finance Agency, who made this workshop possible. The analysis and recommendations in the report are solely the responsibility of its authors, and should not be construed as the expressed or implied views of any other individuals or entities. Chris Akbari, The ITEX Group
Joe Anguiano, State of Texas General Land Office
Linda Bass, Mississippi Development Authority
Chuck Bearman, Mississippi Development Authority
Liza Bergeron, Louisiana Housing Corporation
Gerald Blessey, Gulf Coast Housing Director
Irene Chang-Cimino, US Department of Housing & Urban Development-President's Hurricane Sandy Rebuilding Taskforce
Arnold Cohen, Hoursing and Community Development Network of New Jersey
Joe Compian, Galveston Advocacy Group Leader
Jeff Crozier, State of Texas General Land Office
Jeff Crum, New Jersey Community Capital
Aldo Davila, State of Texas General Land Office
Susannah Dyen, Alliance for Just Rebuilding
Phil Eide, Hope Enterprise Corporation
Danielle Esser, New Jersey Housing and Mortgage Finance Agency
Lorena Gaibor, Housing and Community Development Network of New Jersey
Monika Gerhart, Greater New Orleans Fair Housing Action Center
Adam Gordon, Fair Share Housing Center
Stedman Grigsby, City of Houston, Housing and Community Development Department
Elaine Gross, ERASE Racism
Ted Guillot, Louisiana Housing Corporation
David Hancock, Mississippi Home Corporation
Patrick Haughey, Louisiana Housing Alliance
Bobby Hensley, Biloxi Housing Authority
Jason Holoubek, Avenue Community Development Corporation
Kelsey Johnson, Gulf Coast Community Design Studio
John Jopling, Mississippi Center for Justice
Patrick Jordan, Enterprise Community Partners
Peter Kasabach, New Jersey Future
Diane Kinnane, Community Investment Strategies, Inc.
Dara Kovel, Conneticut Housing Finance Authority
Kimberly La Rosa, Gulf Coast Renaissance Corporation
Alice Law, City of Galveston, Grants and Housing Department
Yvonne Layton, Mississippi Development Authority
Gaile Levinson, Supportive Housing Association of New Jersey
Charles Lewis, Conifer Realty
4
Lindsey Lewis, Greater New Orleans Housing Alliance
Claudia Lovas, New Jersey Housing and Mortgage Finance Agency
Jay Lynch, Tom's River Township
Jon Mabry, Mississippi Development Authority
Kayla Malsbury, New Jersey Housing and Mortgage Finance Agency
Anthony L. Marchetta, New Jersey Housing and Mortgage Finance Agency
Mark Mauriello, New Jersey Department of Environmental Protection
Melissa McCrumb, Make the Road New York
Stacy McEachern, Mississippi Development Authority
Steve McIntyre, Galveston Advocacy Group Leaders
Maria Luisa Mercado, Galveston Family Law Attorney
Ben Mokry, Mississippi Home Corporation
Charles Morris, Mississippi Home Corporation
Andreanecia Morris, Providence Community Housing
Neal Morris, Redmellon
Reilly Morse, Mississippi Center for Justice
John M. Murray, New Jersey Housing and Mortgage Finance Agency
Laura Murrell, Galveston Advocacy Group Leaders
DC Navarrette, California Tax Credit Allocation Committee
Jeffrey Oakman, Community Investment Strategies, Inc.
Shola Olayote, Enterprise Community Partners
Katina Pace, Mississippi Home Corporation
Chrishelle Palay, Texas Appleseed and Texas Low Income Housing Information Service
Eta Paransky, City of Houston, Housing and Community Development Department
Sterling Patrick, City of Galveston, Grants and Housing Department
Alice Riener, New Orleans AIDS Task Force
Nell Rodgers, Mississippi Development Authority
Linda Rubenstein, East Brunswick Community Housing Corporation
Louis Russell, Louisiana Housing Corporation
Laurie Schoeman, Enterprise Community Partners
Barbara Schoor, Community Investment Strategies, Inc.
Jennifer Simcovitch, ERASE Racism
Madison Sloan, Texas Appleseed and Texas Low Income Housing Information Service
Gregory Stankiewicz, New Jersey Community Capital
Chris Sturm, New Jersey Future
Laura Tuggle, Southeast Louisiana Legal Services
Debbie Urban, New Jersey Housing and Mortgage Finance Agency
Loretta Wallace, Louisiana Housing Corporation
Helen Werby, Biloxi Housing Authority
Mary Weselcouch, NYU Furman Center for Real Estate and Urban Policy
Janel Young, Louisiana Housing Corporation

5
Executive Summary
Nearly six months after The U.S. Department of Housing and Urban Development (HUD) allocated the first of three tranches of Community Development Block Grant-Disaster Recovery (CDBG-DR) dollars to New Jersey, the New Jersey Housing and Mortgage Finance Agency (NJHMFA) sought to better understand the impact of its CDBG-DR-funded programs. NJHMFA called on a team of graduate students at the Woodrow Wilson School of Public and International Affairs at Princeton University to help with this analysis.
This report analyzes the first round of CDBG-DR funding for affordable rental housing and
recommends changes to the New Jersey’s Low Income Housing Tax Credit (LIHTC) program, its Qualified Allocation Plan (QAP), and other related CDBG-DR programs. Our key findings include:
• The efficiency of 9% LIHTC allocations improved in 2013, to a per-LMI-unit amount $17,646 in 2013, compared with a three-year average of $21,713 from 2010-2012
• The 2013 QAP’s higher-opportunity incentives generated mixed results – the transit accessibility incentive appears to have increased accessibility for new projects across multiple measures, while the education quality incentive appears to be ineffective when projects are analyzed at the school-level
• The average 2010-2013 4% LIHTC family unit is located in a census tract with a poverty rate ten percentage points higher than the average 9% project and an unemployment rate that is 50% higher
Based on our evaluation of the 2013 QAP, we recommend the following three changes to the
QAP:
1. Incentivize the placement of 4% LIHTC-financed developments that also receive CDBG-DR money in higher-opportunity areas
2. Offer additional incentives for building in high-opportunity areas with 9% tax credits 3. Set goals for higher-opportunity developments based on the current QAP and monitor
progress, adjusting the QAP as needed
Additionally, we recommend the following ten changes to NJHMFA’s CDBG-DR-funded programs and related procedures:
1. Advocate that the Department of Community Affairs (DCA) allocate at least 40% of any future CDBG-DR housing funds to rental programs
2. Use zip code-level data to better target CDBG-DR dollars to storm damaged-areas 3. Streamline the environmental review process for CDBG-DR-funded projects 4. Use CDBG-DR funds from the second and third tranches to implement risk mitigation
activities for affordable multifamily rental housing 5. Partner with Community Development Financial Institutions (CDFIs) to leverage their
expertise in distributing funding for affordable rental housing development 6. Publish summary quarterly reports on the Fund for Restoration of Multifamily Housing
(FRM) and Sandy Special Needs Housing Fund (SSNHF) budgets, allocations, and obligations on NJHMFA’s website

6
7. Assign NJHMFA staff member to analyze data and facilitate data collaboration, particularly in disaster response
8. Provide training to Public Housing Authorities (PHAs) on using the unified application for multifamily rental housing production (UNIAP) to apply for the FRM-PHA program.
9. Increase the stock of affordable rental units by establishing a set-aside from the second tranche to fund the conversion of market rate units to affordable units
10. Provide training and funding to HUD-approved housing counselors for rental housing counseling

7
List of Photos, Figures, and Tables Cover Photo: Conifer Realty, LLC Figure 1: 2013 9% LIHTC Allocation by County Figure 2: 2013 Family Cycle HOPE IV/Choice Neighborhoods Reservations not located within a Qualified Census Tract Figure 3: Zip code targeting using FEMA registrant data Figure 4: FEMA registrants and FRM distribution within the nine most-impacted counties Figure 5: FEMA registrant renters earning <$60,000 and new 9% LIHTC units being produced by county Figure 6: Market rate conversion areas: Middlesex County Figure 7: Framework for CDBG-DR Administration & Recommendations Table 1: Developer Characteristics Table 2: 2013 9% LIHTC Allocations Table 3: 2010–2012 9% LIHTC Allocations Table 4: 2013 9% LIHTC Equity & CDBG-DR Allocations Table 5: 2010–2012 9% LIHTC Equity Table 6: Neighborhood Income and Poverty Characteristics Table 7: Other Neighborhood Characteristics Table 8: 2010–2013 4% vs. 9% Obligated & Committed Projects, Census Tract Income Table 9: 2010–2013 4% vs. 9% Obligated & Committed Projects, Deconcentration of Poverty Table 10: Family Units: 2010–2013 4% vs. 2013 9% Obligated & Committed Projects, Neighborhood Characteristics Table 11: Senior Units: 2010–2013 4% vs. 9% Obligated & Committed Projects, Neighborhood Characteristics Table 12: Major or substantial damage and new 9% LIHTC units in the nine most-impacted counties
8
Table of Contents
Executive Summary .............................................................................................................. 5
List of Photos, Figures, and Tables ...................................................................................... 7
Introduction .......................................................................................................................... 9
Section I: Impact of Superstorm Sandy on New Jersey ................................................... 10
Section II: Evaluation of NJHMFA’s First Tranche ............................................................. 14
Section III: Recommendations ........................................................................................... 27
Part A: QAP Recommendations ...................................................................................... 27
Part B: CDBG-‐DR Recommendations .............................................................................. 34
Conclusion ........................................................................................................................... 63
Appendix ............................................................................................................................. 65
References ........................................................................................................................... 70
9
Introduction
On October 29, 2012, Superstorm Sandy wrought unprecedented destruction on New Jersey’s housing stock. The storm damaged or destroyed 346,000 units, rendering 22,000 of those units inhabitable and displacing about 12,500 households. In response to the devastation, Congress allocated $16 billion in relief for Sandy victims through the Disaster Relief Appropriations Act of 2013. The U.S. Department of Housing and Urban Development (HUD) distributes the money via Community Development Block Grant-Disaster Recovery (CDBG-DR) funds.
On April 29, 2013, HUD approved New Jersey’s $1.8 billion Action Plan for its first tranche of CDBG-DR funding. The Action Plan included the Fund for Restoration of Multifamily Housing (FRM), a $179 million fund for developing large (25-unit or larger) multi-family rental affordable housing developments for families and seniors. The Action Plan also set aside $25 million for the Sandy Special Needs Housing Fund (SSNHF).
New Jersey’s Housing and Mortgage Finance Agency (NJHMFA) is responsible for distributing the FRM and SSNHF dollars. NJHMFA also manages the State’s Low Income Housing Tax Credit (LIHTC) program, its related Qualified Allocation Plan (QAP), and several financing options for construction of affordable housing.
We prepared this report for NJHMFA with the following objectives:
• to analyze the first round of CDBG-DR funding for affordable rental housing; • to pass along lessons learned from other disaster-stricken areas on allocating the second
tranche of CDBG-DR funds; and • to recommend changes to the QAP or CDBG-DR-funded programs based on our
evaluation of the first round (due to a shortage of relevant data on special needs housing, we focus on the FRM program and not the SSNHF program).
The remainder of this report is structured as follows: Section I describes the impact Sandy had on New Jersey’s affordable rental market, the federal and state response to the disaster, and the key state actors; Section II analyzes the effectiveness of the first tranche of CDBG-DR funds; and Section III provides recommendations for the second tranche of CDBG-DR funds, future allocations of LIHTC, and potential changes to the QAP.
10
Section I: Impact of Superstorm Sandy on New Jersey
On October 29, 2012 Superstorm Sandy hit the East Coast with record-breaking force. This
severe weather system affected 24 states and caused approximately 185 fatalities in the United States, 35 of which were in New Jersey. Superstorm Sandy was the deadliest storm outside of the South since Hurricane Agnes, 40 years prior.1;2 Insurance companies estimated $50 billion in damages, placing Sandy sixth on an inflation-adjusted list of the most expensive storms in the United States since 1900.3
New Jersey bore the brunt of the impact. Immediately after the storm, an estimated 2.6
million New Jersey residents were without power, at least one-third of those residents lacked power for six days, 362,334 were under a boil water advisory,4 infrastructure was destroyed, and entire industries were decimated.5 A report from Rutgers estimated an $11.7 billion loss to the Garden State’s gross domestic product—a measure that excludes capital and housing losses.6
Superstorm Sandy caused extensive damage to New Jersey’s housing stock. According to Governor Christie’s office, 346,000 housing units were damaged or destroyed, rendering 22,000 of those units inhabitable and displacing about 12,500 households that needed disaster-related housing assistance. FEMA reported receiving 231,118 applications. FEMA registrants were disproportionately poor relative to New Jersey’s population. Enterprise Community Partners estimates that the storm affected 113,209 low-income households, defined as making less than $45,000 annually.7
In November 2012, the State of New Jersey and the Federal Emergency Management
Agency estimated that the state needed 6,500 additional units of permanent housing for post-Sandy housing recovery, assuming all 6,000 then-available existing rental units were occupied by displaced households. In February 2013, Governor Christie reported that 42,000 families remained homeless.8 The Affordable Housing Market
Even prior to Superstorm Sandy, New Jersey had a tight rental market. According to the National Low Income Housing Coalition, New Jersey’s housing wage, defined as the hourly earnings that would be required to pay for a fair market two-bedroom rental if housing payments are not to exceed 30% of the renter’s income, was the fourth highest in the country.9 The shortage of affordable options is reflected in the high numbers of renters who are cost-
1 Service Assessment: Hurricane/Post-Tropical Cyclone Sandy, October 22-29, 2012. 2 FEMA-4086-DR-NJ Hurricane Sandy Disaster Housing Strategic Plan, November 26, 2012. 3 Blake et al., Tropical Cylcone Report: Hurricane Sandy. 4 Ibid, FEMA-4086-DR-NJ. 5 Superstorm Sandy Survey: Impact on New Jersey Coastal Residents. 6 Mantell et al., The Economic and Fiscal Impacts of Hurricane Sandy in New Jersey: A Macroeconomic Analysis. 7 Enterprise Community Partners, Measuring the Response to Hurricane Sandy: FEMA Assistance Analysis for New Jersey and New York. 8 Delli Santi, Angela, “Christie Thanks Obama for Sandy Response, Urges Parties to Cooperate.” 9 Bravve, Bolton, and Crowley, Out of Reach 2013.

11
burdened, with 54% of New Jersey renters paying 30% or more of their income towards rent;10 this is the tenth highest rate in the nation.11
Strong demand for housing after the storm exacerbated the shortage of affordable units, resulting in extremely low vacancy rates. In May 2012, just before Sandy, the New York Times reported that the average vacancy rate for rental apartments statewide was 3.7%, the lowest level since 2001.12 This is defined in the market as “virtually full occupancy” and market experts projected rising rents in coming years.13 After the storm, demand has driven vacancy rates below one percent in some areas.14
This tight rental market is especially concerning given the disproportionate representation of low and moderate-income families in the rental population. Approximately 35% of housing units in New Jersey are renter-occupied, and these renters have a median household income of $39,000. In contrast, the median household income of owners is $91,000.15
In addition, New Jersey has a shortage of supportive housing for individuals with special needs. A 1999 U.S. Supreme Court decision, Olmstead v. L.C., prevents the state from institutionalizing individuals capable of living in supportive housing, increasing housing demand significantly. In 2007, the New Jersey Department of Human Services (DHS) released a plan to transition 1,850 individuals from state development centers to supportive housing by 2015.16 To date, however, DHS has transitioned fewer than 700 individuals to supportive housing.17 Further, a federal study found that housing discrimination against people with special needs occurs even more often than discrimination against African-Americans or Latinos.18 The Federal and State Response to Housing Recovery
On January 29, 2013, the Federal government enacted the $61 billion Disaster Relief Appropriations Act of 2013, allotting $16 billion in CDBG-DR funding for post-Sandy disaster relief and long-term recovery. New Jersey received $5.4 billion in CDBG-DR funds, and in March 2013 HUD allocated the first tranche of $1.83 billion.
In New Jersey, the Department of Community Affairs (DCA) distributes CDBG-DR dollars
under the guidance of a DCA-developed, HUD-approved Action Plan. About two-thirds of the first tranche is dedicated to housing. Two affordable housing programs are administered by NJHMFA:
10 “American FactFinder.” 11 “Housing Cost Burden - Renters (New Jersey).” 12 Capuzzo, Jill, “A Tilt Toward Renting.” 13 Ibid. 14 “Year-Round Renters Struggle to Find Homes after Hurricane Sandy.” 15 “American FactFinder.” 16 New Jersey Department of Human Services: Division of Development Disabilities, “NJ Path to Progress.” 17 “Department of Human Services: Statistics and Other Resources.” 18 Brief of Amici Curiae, The Corporation for Supportive Housing and Supportive Housing Association of New Jersey.
12
• $179 million to fund construction of large (>25 units) multi-family affordable rental housing developments for families and seniors (Fund for Restoration of Multi-family Housing or FRM) and
• $25 million to fund special needs housing (Sandy Special Needs Housing Fund or SSNHF).
New Jersey planned to leverage the CDBG-DR allocation with its existing Low Income Housing Tax Credit (LIHTC) program. The LIHTC program has grown to be the nation’s most effective rental affordable housing production mechanism since its origins in 1986. LIHTC-financed units must be affordable (maximum 30% of income for rent and utilities) for households with incomes from 30% to 60% of Area Median Income (AMI). More general background on the LIHTC program is provided where appropriate in the section on the Evaluation of NJHMFA’s First Tranche.
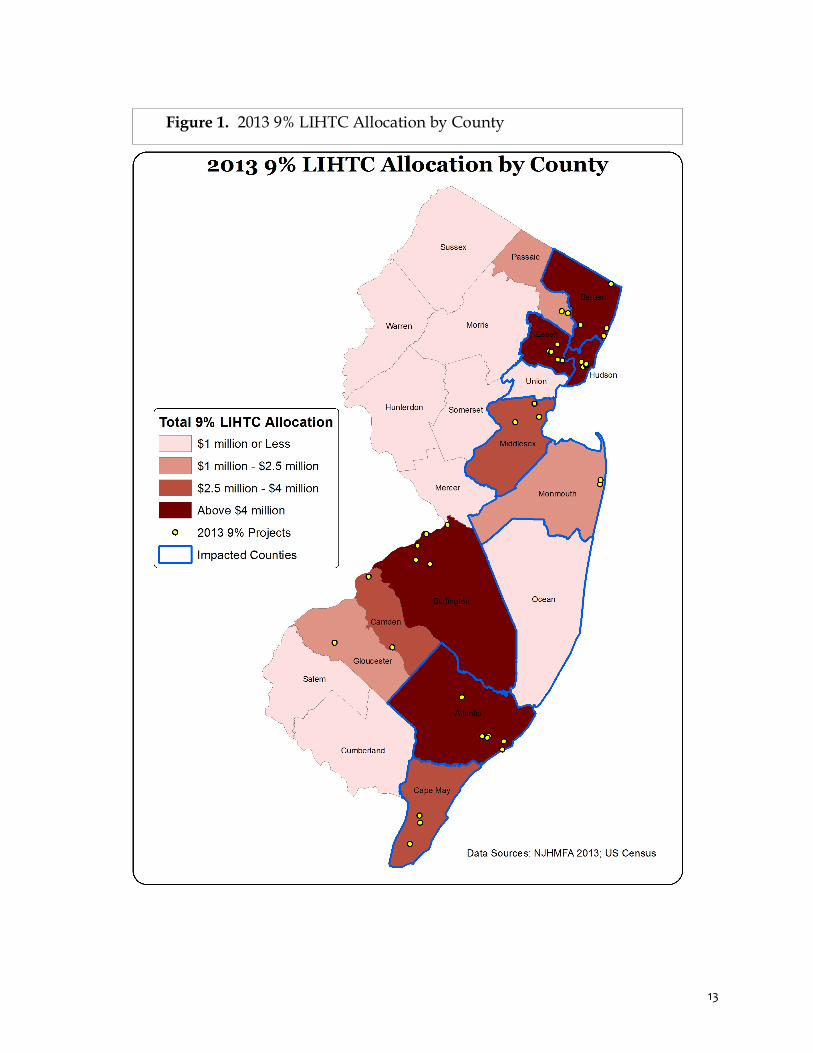
In 2013, the federal government allocated $2.25 per capita in 9% credits to New Jersey. New Jersey also chose to forward-allocate its 9% credits for 2014. The $40.6 million in 9% credits, along with $123 million in CDBG-DR funding, are now tied to projects that are expected to generate 2,355 deed-restricted units.19 Figure 1 maps all 2013 9% projects, as well as details total LIHTC allocation by county.
States may also issue less valuable, non-competitive 4% tax credits subsidizing 30% of a
project’s qualified basis—New Jersey finances these credits through the sale of tax-exempt bonds. 19 “New Jersey Housing and Mortgage Finance Agency - Allocation Awards - Current and Historical.”
13
Figure 1. 2013 9% LIHTC Allocation by County

14
Section II: Evaluation of NJHMFA’s First Tranche
This section provides a statistical context for NJHMFA’s use of LIHTC and CDBG-DR
resources in 2013. The findings presented here will be referenced throughout several recommendations later in the paper and directly inform our analysis of the 2013 QAP, presented at the conclusion of this section.
First, we detail our data and methodology. We then analyze the outcomes of the 2013 LIHTC funding process by comparing 2013 to previous years, as well as CDBG-funded projects to non-CDBG-funded projects. Next, we offer a potential framework to evaluate the efficacy of leveraging the NJHMFA’s first tranche of CDBG-DR allocation with the LIHTC program. We then compare obligated and committed 4% LIHTC projects with obligated and committed 9% LIHTC projects to provide a basis for understanding the implications of using CDBG-DR dollars for 4% projects moving forward. Finally, we use this analysis to inform our findings about the effectiveness of the revised 2013 Qualified Allocation Plan.
Data and Methodology Data
This section aggregates data from a number of sources. Information on individual LIHTC projects come from the Reservation Lists and Ranking Charts provided on NJHMFA’s website.20 NJHMFA also provided up-to-date LIHTC equity amounts and FRM/SSNHF commitments. In addition to NJHMFA, at the state level, transportation data from New Jersey Transit are downloaded from the New Jersey Geographic Information Network.21
We draw further project neighborhood information from census-tract level data reported in
the United States Census Bureau’s 2007-2011 American Community Survey (ACS). To assess the Qualified Census Tract set-asides, we use HUD’s Qualified Census Tract map for both 2010-2012 and for 2013.22
When government-collected data were unavailable, we relied on publicly available,
privately aggregated data – specifically, Walk Score and Great Schools ratings. Walk Score is a measure intended to express the ease of living in an area without a car; we used this as a measure of sustainability and a complement to the New Jersey Transit data. Great Schools is a website that ranks schools within a state on a score of 1 to 10 based on the school’s standardized test data; a score of 3 means that a school scored between the 20th and 30th percentile on a state’s standardized tests. 23 Because school-level New Jersey testing data are not readily available, we relied on the Great Schools score to assess the quality of neighborhood educational institutions.
20 http://www.nj.gov/dca/hmfa/developers/credits/allocations/awards.shtml 21 New Jersey Geographic Information Network data are available online at https://njgin.state.nj.us/NJ_NJGINExplorer/index.jsp 22 The 2013 HUD QCT map can be found here: http://www.huduser.org/QCT2013/qctmap.html. The 2010-2012 HUD QCT map
can be found here: http://209.48.228.153/qctmap.html#. 23 Projects were assigned a Great Schools score based on the nearest elementary school. Projects that are closest to a private
elementary school are re-coded to represent the overall school district rating.
15
Methodology
We geocoded project addresses using ArcGIS software. These addresses are then matched to ACS data, Walk Score, Great Schools, and NJ Transit data to provide quantitative measures for comparison. To calculate the “average unit” for each class and year of LIHTC, we assigned every project a weighted value based on its proportion of deed-restricted units relative to its class. For example, if a project containing 150 LMI units funded by 9% credits was built in a year where a total of 1,000 LMI units were constructed using 9% credits, that project’s weighted value would be .15; each characteristic of that project would be multiplied by the weighted value and added with all other relevant projects to create a weighted “average 9% LIHTC unit.” 4% units were weighted based on the list of all projects receiving 42(m) letters available at NJHMFA’s website, which were not categorized by year. Background on the 2013 Qualified Allocation Plan
In addition to CDBG-DR dollars, this section also uses the available data to evaluate New Jersey’s QAP. The 2013 QAP was the result of NJHMFA’s two-year QAP revision process, which included input from advocates. Advocates consider it one of the most progressive in the country,24 with incentives for developers to locate projects near high-job growth areas and high-performing schools; to decrease New Jersey’s concentration of poverty; to practice environmental sustainability and green building; and to provide units and support services for disabled, homeless, and other special needs populations. In grading New Jersey’s QAP on the green building practices it promotes in the nation, Global Green USA gave New Jersey an A, scoring 47 out of 50 total points.25
In May 2013, NJHMFA adopted the revised QAP, months before NJHMFA began
distributing CDBG-DR funds. As a result, the first round of the FRM and SSHNF applications served as its initial test. 2013 funded projects may not entirely reflect the goals outlined in the new QAP due to a number of complementary reasons. First, given the desire to rebuild as quickly as possible, applicants with “ready to go” projects that are potentially more aligned to the prior QAP, may have been given priority. Additionally, given the vast influx of federal dollars, NJHMFA could fund more projects in 2013, which means that some projects receiving funds in 2013 may not have scored high enough to receive funds in prior years. Even so, by analyzing the 2013 round and comparing results to prior years, we can gain insight into whether or not the new QAP achieved its desired effect in the first year of implementation. The analysis below can serve as a starting point for further monitoring and evaluation regarding the effectiveness of the QAP in meeting NJHMFA’s goals. Fulfilling Set-‐Asides
Both the Family and Senior Cycles include set-asides for the purpose of guaranteeing specific types of development. The Family Cycle and Senior Cycle include a HOPE VI/Choice Neighborhoods set-aside, in which NJHMFA assigns the first reservation in each cycle to the highest-ranking HOPE VI or Choice Neighborhoods application with a majority of units located
24 Interview with advocacy community, October 2013. 25 Fuhry, Lauren, DeCoursey, Jillian, and Wells, Walker, 2013 QAP Analysis: Green Building Criteria in Low-Income Housing Tax Credit
Programs.
16
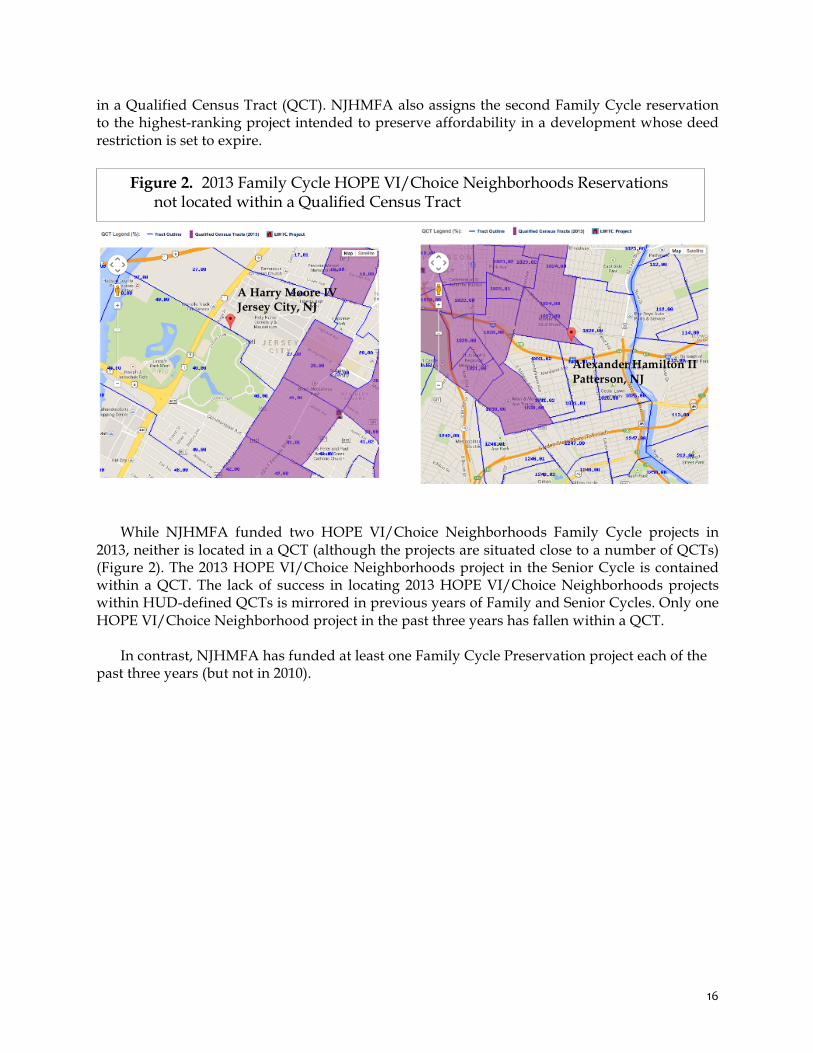
in a Qualified Census Tract (QCT). NJHMFA also assigns the second Family Cycle reservation to the highest-ranking project intended to preserve affordability in a development whose deed restriction is set to expire.
While NJHMFA funded two HOPE VI/Choice Neighborhoods Family Cycle projects in
2013, neither is located in a QCT (although the projects are situated close to a number of QCTs) (Figure 2). The 2013 HOPE VI/Choice Neighborhoods project in the Senior Cycle is contained within a QCT. The lack of success in locating 2013 HOPE VI/Choice Neighborhoods projects within HUD-defined QCTs is mirrored in previous years of Family and Senior Cycles. Only one HOPE VI/Choice Neighborhood project in the past three years has fallen within a QCT.
In contrast, NJHMFA has funded at least one Family Cycle Preservation project each of the past three years (but not in 2010).
Figure 2. 2013 Family Cycle HOPE VI/Choice Neighborhoods Reservations not located within a Qualified Census Tract
A Harry Moore IV Jersey City, NJ
Alexander Hamilton II Patterson, NJ
17
Developer Characteristics
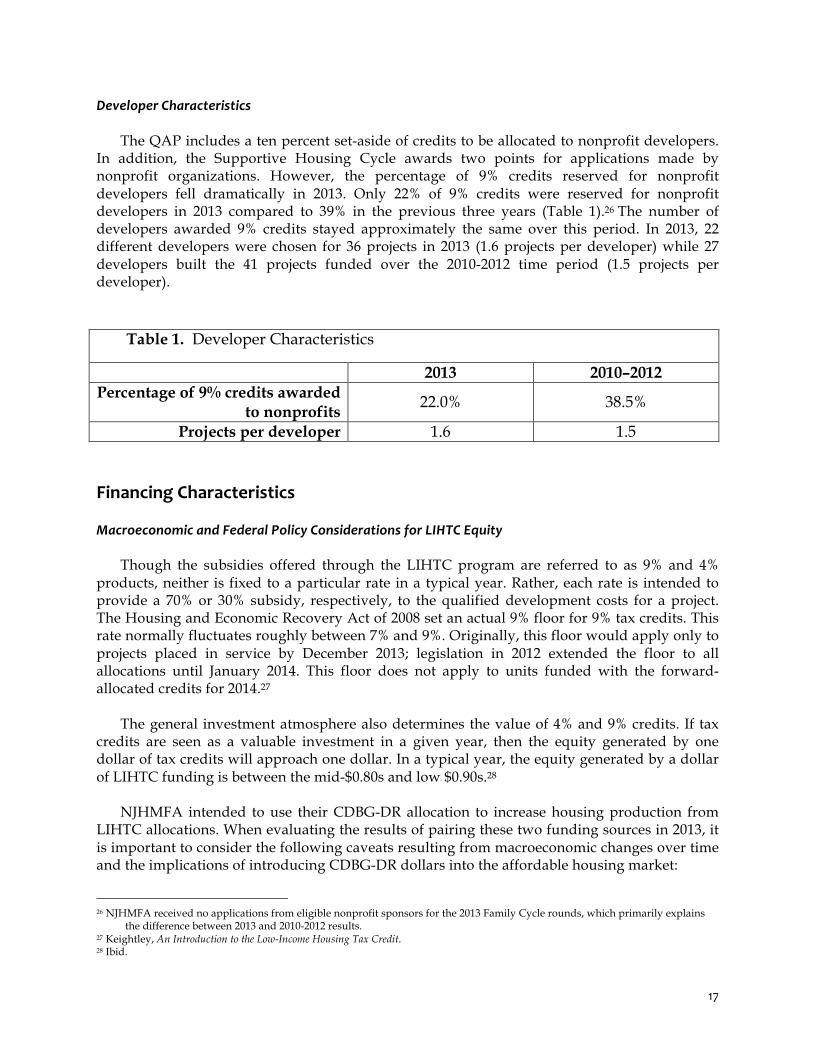
The QAP includes a ten percent set-aside of credits to be allocated to nonprofit developers. In addition, the Supportive Housing Cycle awards two points for applications made by nonprofit organizations. However, the percentage of 9% credits reserved for nonprofit developers fell dramatically in 2013. Only 22% of 9% credits were reserved for nonprofit developers in 2013 compared to 39% in the previous three years (Table 1).26 The number of developers awarded 9% credits stayed approximately the same over this period. In 2013, 22 different developers were chosen for 36 projects in 2013 (1.6 projects per developer) while 27 developers built the 41 projects funded over the 2010-2012 time period (1.5 projects per developer).
Table 1. Developer Characteristics
2013 2010–2012 Percentage of 9% credits awarded
to nonprofits 22.0% 38.5%
Projects per developer 1.6 1.5 Financing Characteristics Macroeconomic and Federal Policy Considerations for LIHTC Equity
Though the subsidies offered through the LIHTC program are referred to as 9% and 4% products, neither is fixed to a particular rate in a typical year. Rather, each rate is intended to provide a 70% or 30% subsidy, respectively, to the qualified development costs for a project. The Housing and Economic Recovery Act of 2008 set an actual 9% floor for 9% tax credits. This rate normally fluctuates roughly between 7% and 9%. Originally, this floor would apply only to projects placed in service by December 2013; legislation in 2012 extended the floor to all allocations until January 2014. This floor does not apply to units funded with the forward-allocated credits for 2014.27
The general investment atmosphere also determines the value of 4% and 9% credits. If tax credits are seen as a valuable investment in a given year, then the equity generated by one dollar of tax credits will approach one dollar. In a typical year, the equity generated by a dollar of LIHTC funding is between the mid-$0.80s and low $0.90s.28
NJHMFA intended to use their CDBG-DR allocation to increase housing production from LIHTC allocations. When evaluating the results of pairing these two funding sources in 2013, it is important to consider the following caveats resulting from macroeconomic changes over time and the implications of introducing CDBG-DR dollars into the affordable housing market:
26 NJHMFA received no applications from eligible nonprofit sponsors for the 2013 Family Cycle rounds, which primarily explains
the difference between 2013 and 2010-2012 results. 27 Keightley, An Introduction to the Low-Income Housing Tax Credit. 28 Ibid.
18
• Reports from developers in New Jersey and Louisiana indicate that construction and
general project costs increase through various channels in the post-storm environment. Unusual expenses accrue due to labor shortages, delays due to infrastructure deterioration, and increases in insurance premiums.
• In addition to generating a need for more staff hours to meet administrative requirements, new regulations increase the cost of actual construction. For example, the use of CDBG-DR dollars triggers prevailing wage requirements; LIHTC financing does not.
• In general, LIHTC equity ratios were down in 2013.29 New research also showed that a $0.35 gap in equity ratios across markets could be explained by the presence of different demand for Community Reinvestment Act interest from area investors.30
LIHTC Allocation Efficiency
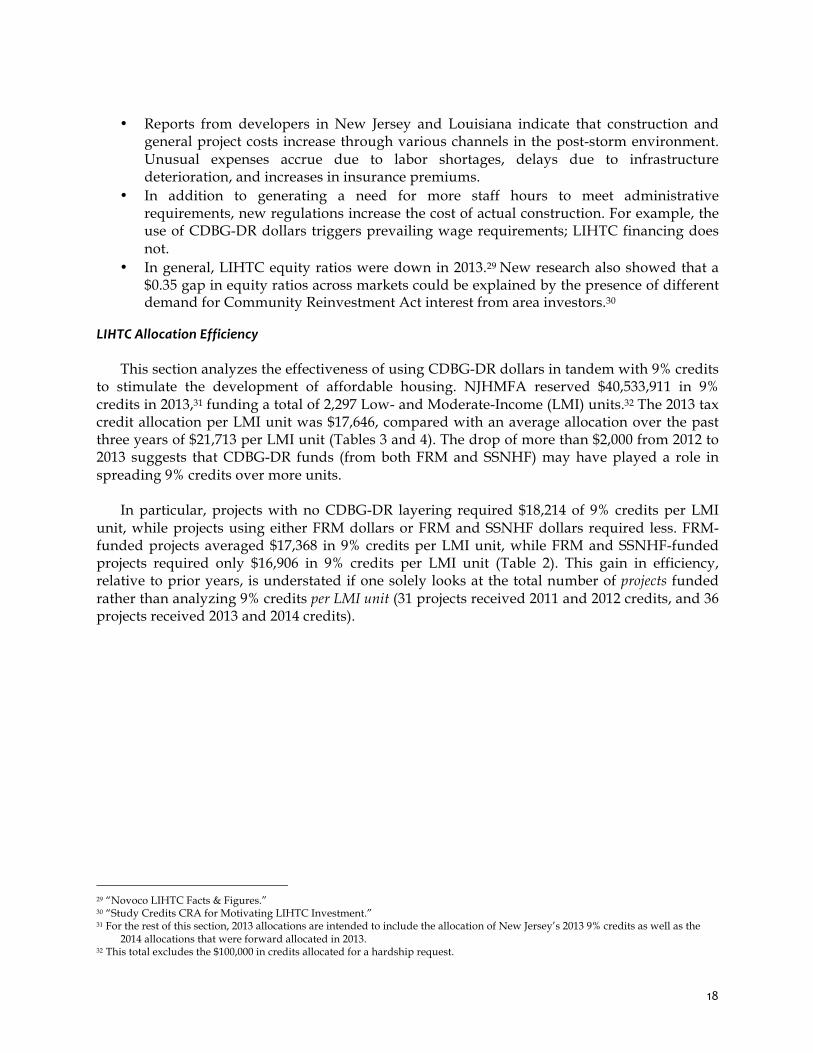
This section analyzes the effectiveness of using CDBG-DR dollars in tandem with 9% credits to stimulate the development of affordable housing. NJHMFA reserved $40,533,911 in 9% credits in 2013,31 funding a total of 2,297 Low- and Moderate-Income (LMI) units.32 The 2013 tax credit allocation per LMI unit was $17,646, compared with an average allocation over the past three years of $21,713 per LMI unit (Tables 3 and 4). The drop of more than $2,000 from 2012 to 2013 suggests that CDBG-DR funds (from both FRM and SSNHF) may have played a role in spreading 9% credits over more units.
In particular, projects with no CDBG-DR layering required $18,214 of 9% credits per LMI unit, while projects using either FRM dollars or FRM and SSNHF dollars required less. FRM-funded projects averaged $17,368 in 9% credits per LMI unit, while FRM and SSNHF-funded projects required only $16,906 in 9% credits per LMI unit (Table 2). This gain in efficiency, relative to prior years, is understated if one solely looks at the total number of projects funded rather than analyzing 9% credits per LMI unit (31 projects received 2011 and 2012 credits, and 36 projects received 2013 and 2014 credits).
29 “Novoco LIHTC Facts & Figures.” 30 “Study Credits CRA for Motivating LIHTC Investment.” 31 For the rest of this section, 2013 allocations are intended to include the allocation of New Jersey’s 2013 9% credits as well as the
2014 allocations that were forward allocated in 2013. 32 This total excludes the $100,000 in credits allocated for a hardship request.
19
Table 2. 2013 9% LIHTC Allocations
Allocation
per LMI Unit Total
Allocation Total LMI
Units 9% LIHTC $17,646 $40,533,911 2297
Projects with No CDBG-DR Layering $18,214 $13,769,628 756 Projects with FRM Layering $17,368 $26,764,283 1541
Projects with FRM and SSNHF Layering $16,906 $2,958,485 175 *CDBG allocations only apply to projects that received LIHTC credit allocations
Table 3. 2010–2012 9% LIHTC Allocations
Allocation
per LMI Unit Total
Allocation Total LMI
Units 2010 $25,187 $16,421,816 652 2011 $20,232 $16,327,209 807 2012 $19,719 $19,068,571 967
2010–2012 Average $21,713 $17,272,532 809 *2013 Dollars
LIHTC Equity and CDBG-‐DR Funds
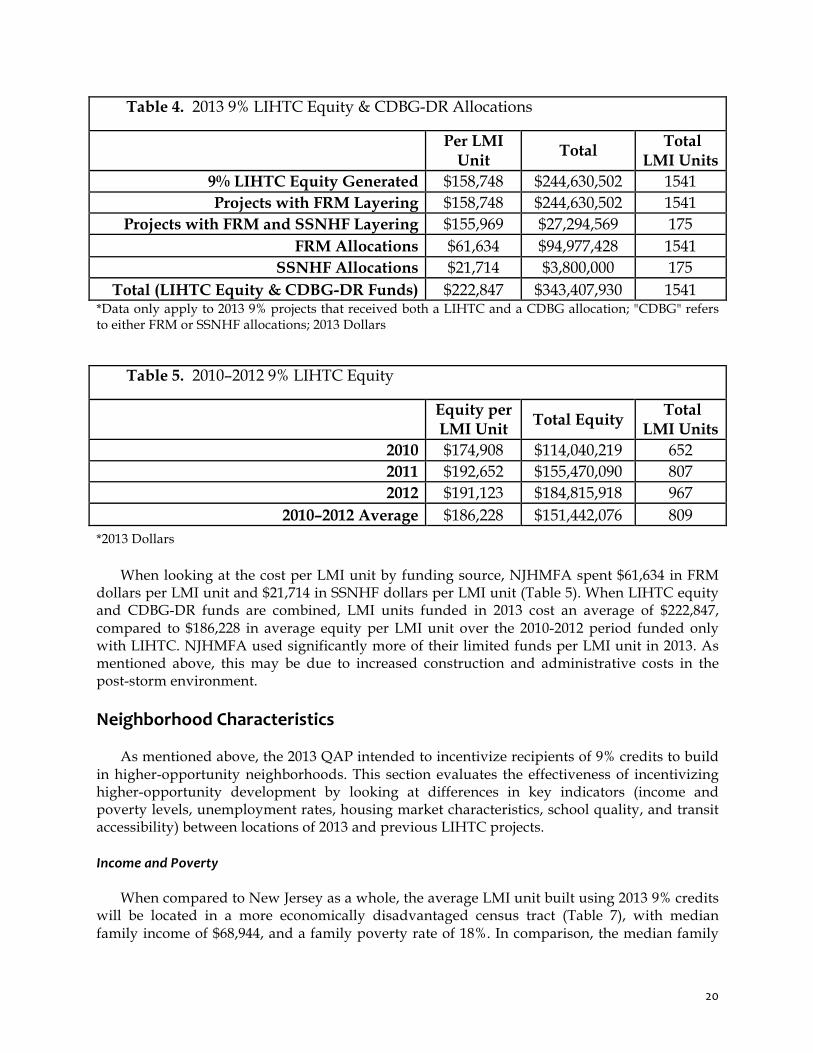
Over the past three years, 9% LIHTC equity averaged $186,228 per LMI unit, but in 2013, projects receiving LIHTC and CDBG-DR funds generated only $158,748 of equity per LMI unit (Tables 5 and 6; data on LIHTC projects that did not receive CDBG-DR funds are unavailable). This decrease may be explained by some of the market factors described previously, as well as the additional CDBG-DR funds that contributed to these developments. Also, total construction costs are not yet available for 2013 LIHTC-financed projects, making it difficult to assess whether the drop in credits-per-unit is a result of lower eligible bases.
20
Table 4. 2013 9% LIHTC Equity & CDBG-DR Allocations
Per LMI
Unit Total
Total LMI Units
9% LIHTC Equity Generated $158,748 $244,630,502 1541 Projects with FRM Layering $158,748 $244,630,502 1541
Projects with FRM and SSNHF Layering $155,969 $27,294,569 175 FRM Allocations $61,634 $94,977,428 1541
SSNHF Allocations $21,714 $3,800,000 175 Total (LIHTC Equity & CDBG-DR Funds) $222,847 $343,407,930 1541
*Data only apply to 2013 9% projects that received both a LIHTC and a CDBG allocation; "CDBG" refers to either FRM or SSNHF allocations; 2013 Dollars
Table 5. 2010–2012 9% LIHTC Equity
Equity per LMI Unit
Total Equity Total
LMI Units 2010 $174,908 $114,040,219 652 2011 $192,652 $155,470,090 807 2012 $191,123 $184,815,918 967
2010–2012 Average $186,228 $151,442,076 809 *2013 Dollars
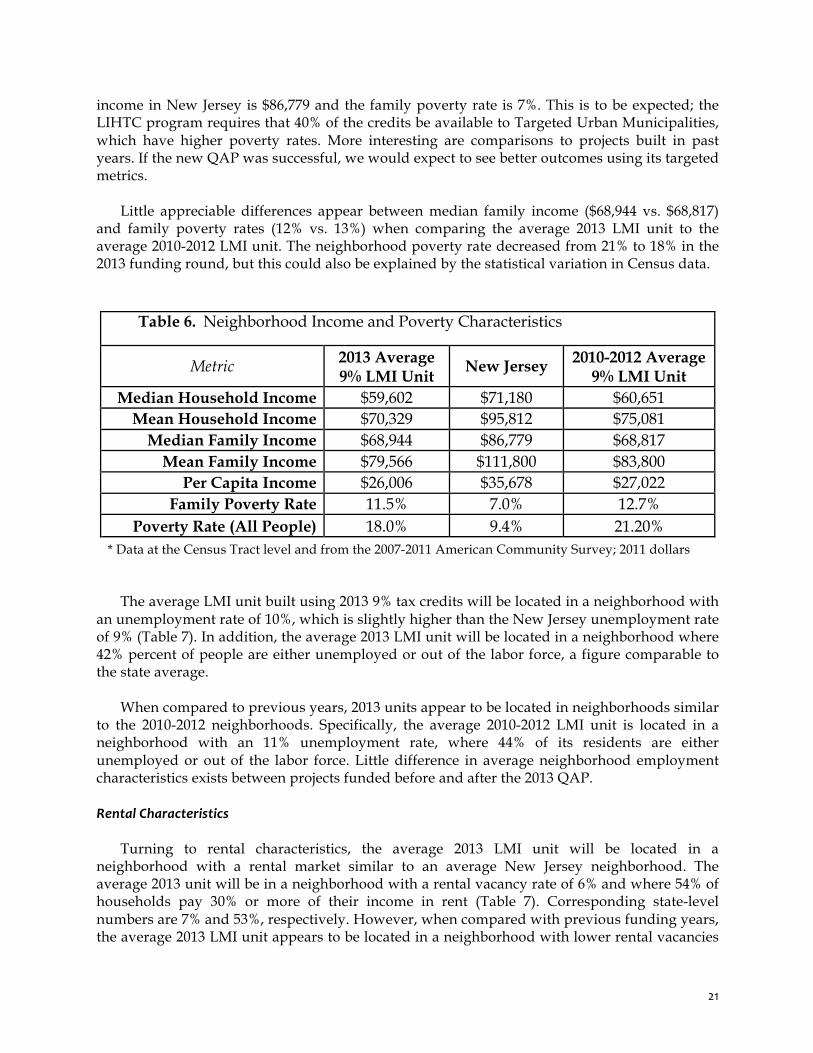
When looking at the cost per LMI unit by funding source, NJHMFA spent $61,634 in FRM dollars per LMI unit and $21,714 in SSNHF dollars per LMI unit (Table 5). When LIHTC equity and CDBG-DR funds are combined, LMI units funded in 2013 cost an average of $222,847, compared to $186,228 in average equity per LMI unit over the 2010-2012 period funded only with LIHTC. NJHMFA used significantly more of their limited funds per LMI unit in 2013. As mentioned above, this may be due to increased construction and administrative costs in the post-storm environment.
Neighborhood Characteristics
As mentioned above, the 2013 QAP intended to incentivize recipients of 9% credits to build in higher-opportunity neighborhoods. This section evaluates the effectiveness of incentivizing higher-opportunity development by looking at differences in key indicators (income and poverty levels, unemployment rates, housing market characteristics, school quality, and transit accessibility) between locations of 2013 and previous LIHTC projects.
Income and Poverty
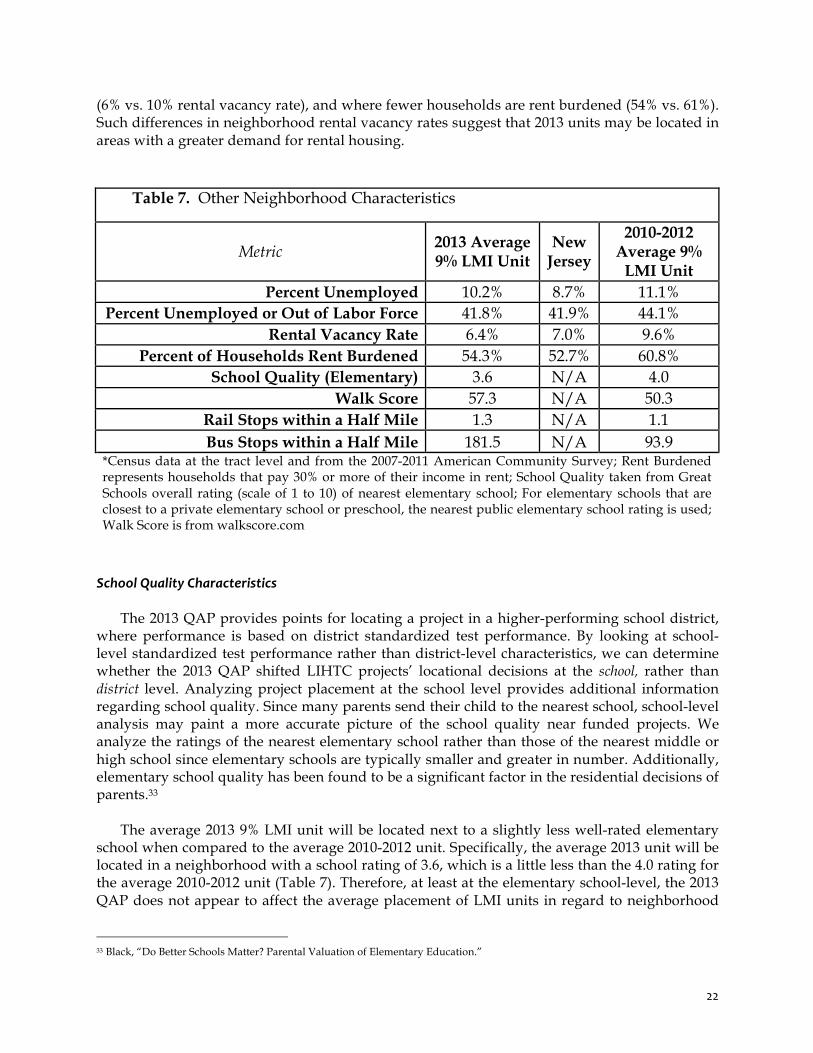
When compared to New Jersey as a whole, the average LMI unit built using 2013 9% credits will be located in a more economically disadvantaged census tract (Table 7), with median family income of $68,944, and a family poverty rate of 18%. In comparison, the median family
21
income in New Jersey is $86,779 and the family poverty rate is 7%. This is to be expected; the LIHTC program requires that 40% of the credits be available to Targeted Urban Municipalities, which have higher poverty rates. More interesting are comparisons to projects built in past years. If the new QAP was successful, we would expect to see better outcomes using its targeted metrics.
Little appreciable differences appear between median family income ($68,944 vs. $68,817) and family poverty rates (12% vs. 13%) when comparing the average 2013 LMI unit to the average 2010-2012 LMI unit. The neighborhood poverty rate decreased from 21% to 18% in the 2013 funding round, but this could also be explained by the statistical variation in Census data.
Table 6. Neighborhood Income and Poverty Characteristics
Metric 2013 Average 9% LMI Unit
New Jersey 2010-2012 Average 9% LMI Unit
Median Household Income $59,602 $71,180 $60,651 Mean Household Income $70,329 $95,812 $75,081
Median Family Income $68,944 $86,779 $68,817 Mean Family Income $79,566 $111,800 $83,800
Per Capita Income $26,006 $35,678 $27,022 Family Poverty Rate 11.5% 7.0% 12.7%
Poverty Rate (All People) 18.0% 9.4% 21.20% * Data at the Census Tract level and from the 2007-2011 American Community Survey; 2011 dollars
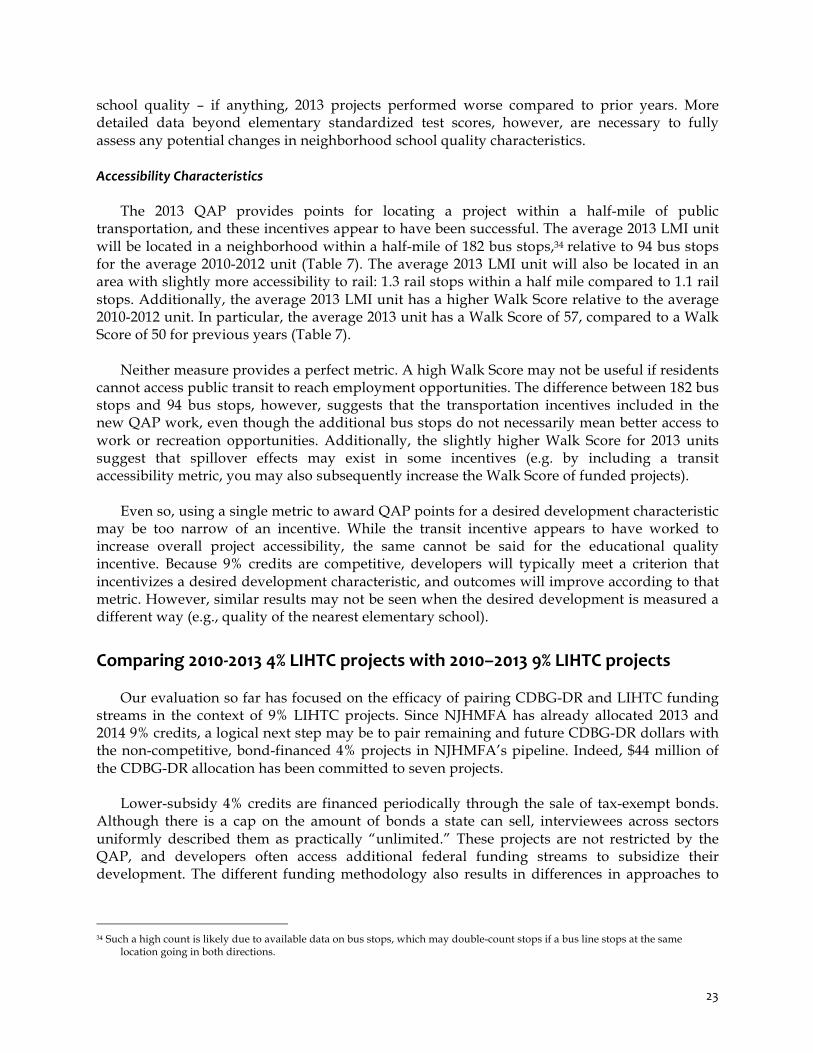
The average LMI unit built using 2013 9% tax credits will be located in a neighborhood with an unemployment rate of 10%, which is slightly higher than the New Jersey unemployment rate of 9% (Table 7). In addition, the average 2013 LMI unit will be located in a neighborhood where 42% percent of people are either unemployed or out of the labor force, a figure comparable to the state average.
When compared to previous years, 2013 units appear to be located in neighborhoods similar to the 2010-2012 neighborhoods. Specifically, the average 2010-2012 LMI unit is located in a neighborhood with an 11% unemployment rate, where 44% of its residents are either unemployed or out of the labor force. Little difference in average neighborhood employment characteristics exists between projects funded before and after the 2013 QAP. Rental Characteristics
Turning to rental characteristics, the average 2013 LMI unit will be located in a neighborhood with a rental market similar to an average New Jersey neighborhood. The average 2013 unit will be in a neighborhood with a rental vacancy rate of 6% and where 54% of households pay 30% or more of their income in rent (Table 7). Corresponding state-level numbers are 7% and 53%, respectively. However, when compared with previous funding years, the average 2013 LMI unit appears to be located in a neighborhood with lower rental vacancies
22
(6% vs. 10% rental vacancy rate), and where fewer households are rent burdened (54% vs. 61%). Such differences in neighborhood rental vacancy rates suggest that 2013 units may be located in areas with a greater demand for rental housing.
Table 7. Other Neighborhood Characteristics
Metric 2013 Average 9% LMI Unit
New Jersey
2010-2012 Average 9%
LMI Unit Percent Unemployed 10.2% 8.7% 11.1%
Percent Unemployed or Out of Labor Force 41.8% 41.9% 44.1% Rental Vacancy Rate 6.4% 7.0% 9.6%
Percent of Households Rent Burdened 54.3% 52.7% 60.8% School Quality (Elementary) 3.6 N/A 4.0
Walk Score 57.3 N/A 50.3 Rail Stops within a Half Mile 1.3 N/A 1.1 Bus Stops within a Half Mile 181.5 N/A 93.9
*Census data at the tract level and from the 2007-2011 American Community Survey; Rent Burdened represents households that pay 30% or more of their income in rent; School Quality taken from Great Schools overall rating (scale of 1 to 10) of nearest elementary school; For elementary schools that are closest to a private elementary school or preschool, the nearest public elementary school rating is used; Walk Score is from walkscore.com
School Quality Characteristics
The 2013 QAP provides points for locating a project in a higher-performing school district, where performance is based on district standardized test performance. By looking at school-level standardized test performance rather than district-level characteristics, we can determine whether the 2013 QAP shifted LIHTC projects’ locational decisions at the school, rather than district level. Analyzing project placement at the school level provides additional information regarding school quality. Since many parents send their child to the nearest school, school-level analysis may paint a more accurate picture of the school quality near funded projects. We analyze the ratings of the nearest elementary school rather than those of the nearest middle or high school since elementary schools are typically smaller and greater in number. Additionally, elementary school quality has been found to be a significant factor in the residential decisions of parents.33
The average 2013 9% LMI unit will be located next to a slightly less well-rated elementary
school when compared to the average 2010-2012 unit. Specifically, the average 2013 unit will be located in a neighborhood with a school rating of 3.6, which is a little less than the 4.0 rating for the average 2010-2012 unit (Table 7). Therefore, at least at the elementary school-level, the 2013 QAP does not appear to affect the average placement of LMI units in regard to neighborhood
33 Black, “Do Better Schools Matter? Parental Valuation of Elementary Education.”
23
school quality – if anything, 2013 projects performed worse compared to prior years. More detailed data beyond elementary standardized test scores, however, are necessary to fully assess any potential changes in neighborhood school quality characteristics. Accessibility Characteristics
The 2013 QAP provides points for locating a project within a half-mile of public transportation, and these incentives appear to have been successful. The average 2013 LMI unit will be located in a neighborhood within a half-mile of 182 bus stops,34 relative to 94 bus stops for the average 2010-2012 unit (Table 7). The average 2013 LMI unit will also be located in an area with slightly more accessibility to rail: 1.3 rail stops within a half mile compared to 1.1 rail stops. Additionally, the average 2013 LMI unit has a higher Walk Score relative to the average 2010-2012 unit. In particular, the average 2013 unit has a Walk Score of 57, compared to a Walk Score of 50 for previous years (Table 7).
Neither measure provides a perfect metric. A high Walk Score may not be useful if residents cannot access public transit to reach employment opportunities. The difference between 182 bus stops and 94 bus stops, however, suggests that the transportation incentives included in the new QAP work, even though the additional bus stops do not necessarily mean better access to work or recreation opportunities. Additionally, the slightly higher Walk Score for 2013 units suggest that spillover effects may exist in some incentives (e.g. by including a transit accessibility metric, you may also subsequently increase the Walk Score of funded projects).
Even so, using a single metric to award QAP points for a desired development characteristic
may be too narrow of an incentive. While the transit incentive appears to have worked to increase overall project accessibility, the same cannot be said for the educational quality incentive. Because 9% credits are competitive, developers will typically meet a criterion that incentivizes a desired development characteristic, and outcomes will improve according to that metric. However, similar results may not be seen when the desired development is measured a different way (e.g., quality of the nearest elementary school).
Comparing 2010-‐2013 4% LIHTC projects with 2010–2013 9% LIHTC projects
Our evaluation so far has focused on the efficacy of pairing CDBG-DR and LIHTC funding streams in the context of 9% LIHTC projects. Since NJHMFA has already allocated 2013 and 2014 9% credits, a logical next step may be to pair remaining and future CDBG-DR dollars with the non-competitive, bond-financed 4% projects in NJHMFA’s pipeline. Indeed, $44 million of the CDBG-DR allocation has been committed to seven projects.
Lower-subsidy 4% credits are financed periodically through the sale of tax-exempt bonds.
Although there is a cap on the amount of bonds a state can sell, interviewees across sectors uniformly described them as practically “unlimited.” These projects are not restricted by the QAP, and developers often access additional federal funding streams to subsidize their development. The different funding methodology also results in differences in approaches to
34 Such a high count is likely due to available data on bus stops, which may double-count stops if a bus line stops at the same
location going in both directions.
24
“making the numbers work.” For example, 45% of 4% units built from 2010-2013 were built in new developments; by comparison, 81% of 9% units were newly constructed.35
This section looks how projects traditionally financed with 4% credits differ from those
funded with 9% credits. After separating family units from senior units, we found substantial differences between 4% LIHTC projects and 2013 9% LIHTC projects. Comparing neighborhood characteristics of 4% and 9% projects
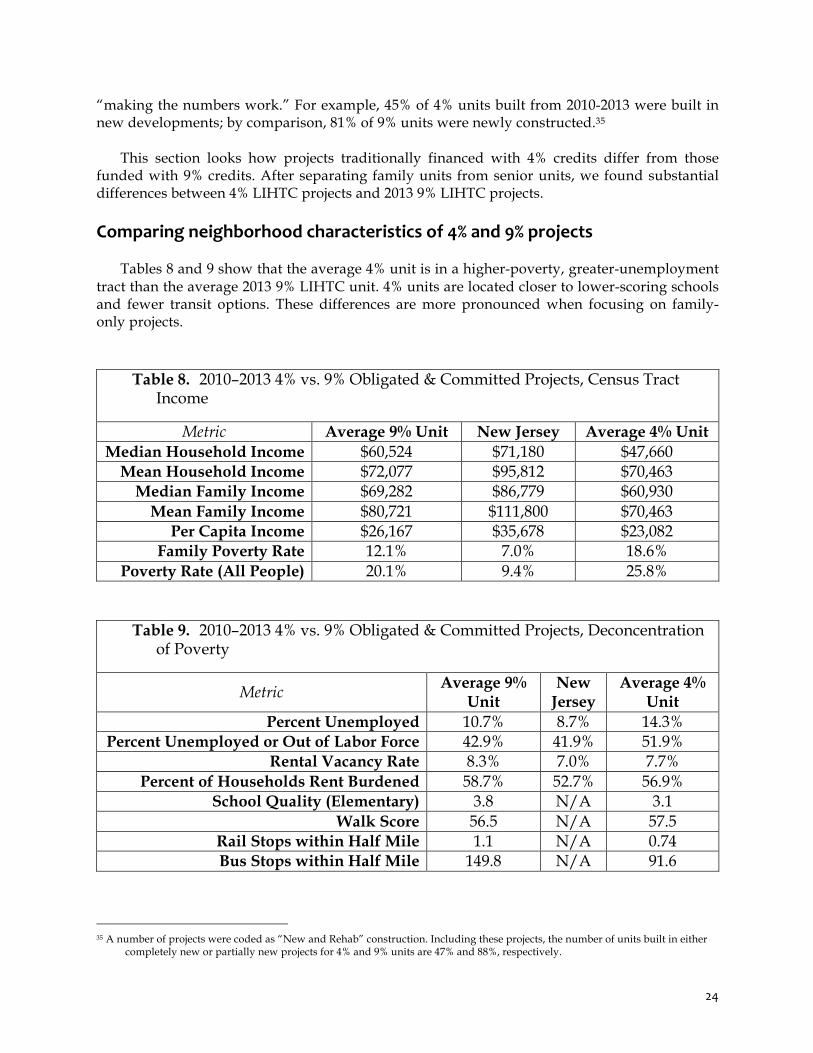
Tables 8 and 9 show that the average 4% unit is in a higher-poverty, greater-unemployment tract than the average 2013 9% LIHTC unit. 4% units are located closer to lower-scoring schools and fewer transit options. These differences are more pronounced when focusing on family-only projects.
Table 8. 2010–2013 4% vs. 9% Obligated & Committed Projects, Census Tract Income
Metric Average 9% Unit New Jersey Average 4% Unit Median Household Income $60,524 $71,180 $47,660
Mean Household Income $72,077 $95,812 $70,463 Median Family Income $69,282 $86,779 $60,930
Mean Family Income $80,721 $111,800 $70,463 Per Capita Income $26,167 $35,678 $23,082
Family Poverty Rate 12.1% 7.0% 18.6% Poverty Rate (All People) 20.1% 9.4% 25.8%
Table 9. 2010–2013 4% vs. 9% Obligated & Committed Projects, Deconcentration of Poverty
Metric Average 9% Unit
New Jersey
Average 4% Unit
Percent Unemployed 10.7% 8.7% 14.3% Percent Unemployed or Out of Labor Force 42.9% 41.9% 51.9%
Rental Vacancy Rate 8.3% 7.0% 7.7% Percent of Households Rent Burdened 58.7% 52.7% 56.9%
School Quality (Elementary) 3.8 N/A 3.1 Walk Score 56.5 N/A 57.5
Rail Stops within Half Mile 1.1 N/A 0.74 Bus Stops within Half Mile 149.8 N/A 91.6
35 A number of projects were coded as “New and Rehab” construction. Including these projects, the number of units built in either
completely new or partially new projects for 4% and 9% units are 47% and 88%, respectively.
25
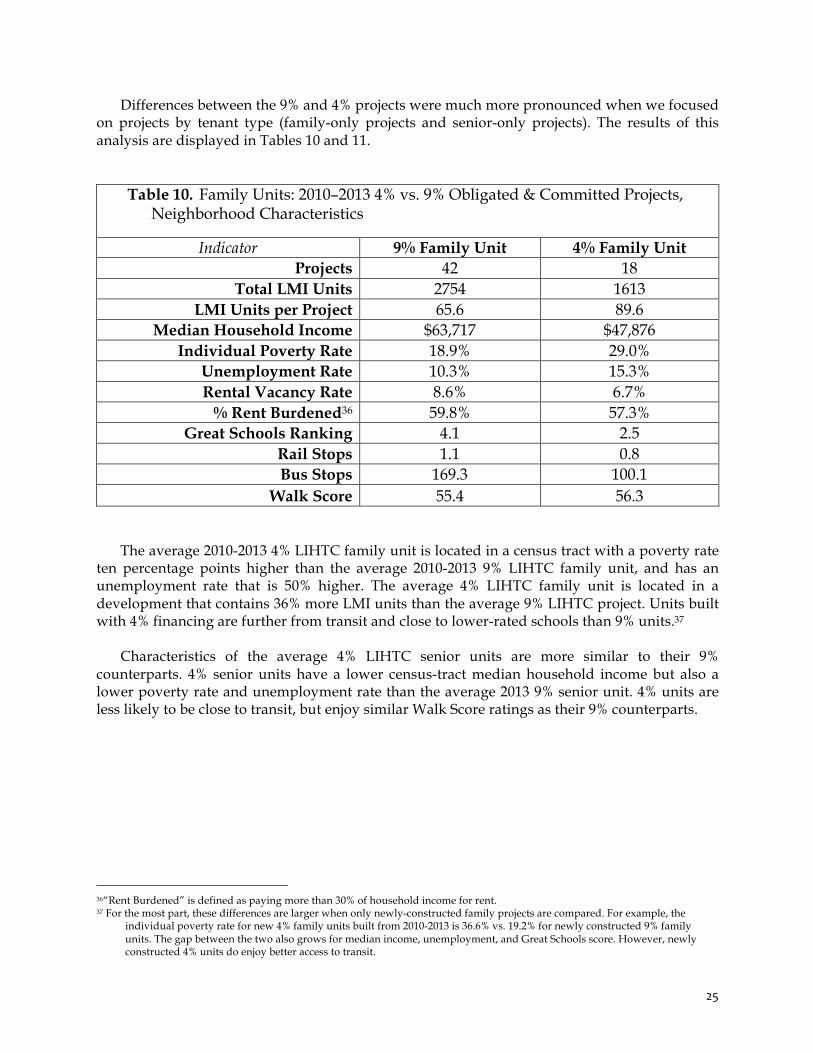
Differences between the 9% and 4% projects were much more pronounced when we focused on projects by tenant type (family-only projects and senior-only projects). The results of this analysis are displayed in Tables 10 and 11.
Table 10. Family Units: 2010–2013 4% vs. 9% Obligated & Committed Projects, Neighborhood Characteristics
Indicator 9% Family Unit 4% Family Unit Projects 42 18
Total LMI Units 2754 1613 LMI Units per Project 65.6 89.6
Median Household Income $63,717 $47,876 Individual Poverty Rate 18.9% 29.0%
Unemployment Rate 10.3% 15.3% Rental Vacancy Rate 8.6% 6.7%
% Rent Burdened36 59.8% 57.3% Great Schools Ranking 4.1 2.5
Rail Stops 1.1 0.8 Bus Stops 169.3 100.1
Walk Score 55.4 56.3
The average 2010-2013 4% LIHTC family unit is located in a census tract with a poverty rate ten percentage points higher than the average 2010-2013 9% LIHTC family unit, and has an unemployment rate that is 50% higher. The average 4% LIHTC family unit is located in a development that contains 36% more LMI units than the average 9% LIHTC project. Units built with 4% financing are further from transit and close to lower-rated schools than 9% units.37
Characteristics of the average 4% LIHTC senior units are more similar to their 9% counterparts. 4% senior units have a lower census-tract median household income but also a lower poverty rate and unemployment rate than the average 2013 9% senior unit. 4% units are less likely to be close to transit, but enjoy similar Walk Score ratings as their 9% counterparts.
36“Rent Burdened” is defined as paying more than 30% of household income for rent. 37 For the most part, these differences are larger when only newly-constructed family projects are compared. For example, the
individual poverty rate for new 4% family units built from 2010-2013 is 36.6% vs. 19.2% for newly constructed 9% family units. The gap between the two also grows for median income, unemployment, and Great Schools score. However, newly constructed 4% units do enjoy better access to transit.

26
Table 11. Senior Units: 2010–2013 4% vs. 9% Obligated & Committed Projects, Neighborhood Characteristics
Indicator 2013 9% Senior Unit
4% Senior Unit (All Years)
Projects 19 6 Total LMI Units 1179 706
LMI Units per Project 62.1 117.7 Median Household Income $53,066 $47,167
Poverty Rate 22.7% 18.7% Unemployment Rate 11.7% 12.1% Rental Vacancy Rate 7.6% 10.1%
% Rent Burdened 56.1% 55.8% Great Schools Ranking 3.0 4.5
Rail Stops 1.14 0.5 Bus Stops 104.3 72.3
Walk Score 59.3 60.4
The reason for the differences between family-only and senior-only projects have important implications as the NJHMFA considers using CDBG-DR dollars from the second and third tranches with 4% credits to increase affordable housing production. Specifically, NJHMFA should consider how well projects financed with 4% credits align with desired housing characteristics reflected in the QAP scoring criteria.
27
Section III: Recommendations
Part A: QAP Recommendations
The following recommendations are based on the above analysis of NJHMFA’s 2013 LIHTC and CDBG-DR programs and a comparison of New Jersey’s QAP with other states’ QAPs.
QAP Recommendation #1: Incentivize the placement of 4% LIHTC-‐financed developments that also receive CDBG-‐DR money in higher-‐opportunity areas
Expected Impact:
If NJHMFA used FRM funds to incentivize developers to locate future 4% projects in areas similar to 9% projects, it could shift 4% units into higher-opportunity census tracts.
As discussed in the section on the Evaluation of NJHMFA’s First Tranche, developers
located 2010-2013 9% LIHTC-financed projects in higher-opportunity areas than the 2010-2013 4% LIHTC-financed projects. When compared to the 9% developments, the census tracts for the average 4% family unit had:
• a poverty rate ten percentage points higher; • a 50% higher unemployment rate; • less rail and bus stops within a half mile; • proximity to elementary schools averaging 1.6 points less via Great Schools.
Without the pressure to compete for points on the QAP or access higher equity from 9%
LIHTC, developers did not advance NJHMFA’s goal of locating affordable housing in higher-opportunity areas. Given that the 2013 and 2014 9% credits are already allocated, going forward without altering the current process may result in locating 4% LIHTC projects layered with second- and third-tranche CDBG-DR dollars in lower-opportunity areas in comparison with the first-tranche, 2013 9% LIHTC-financed projects.
To incentivize 4% LIHTC development in higher-opportunity areas, NJHMFA could require developers to compete for points, similar to the QAP process for 9% credits. NJHMFA could accomplish this by leveraging CDBG-DR funds. If NJHMFA packages enough CDBG-DR funds with 4% credits, it could create equity levels near 9% credits. This might stimulate sufficient competition from developers to meet similar point totals and location requirements as under the 9% QAP.
To ensure that the competitive process results in developers meeting point targets, NJHMFA should initially require a minimum number of points to receive CDBG-DR funds.
28
Once NJHMFA determines that sufficient competition exists among developers to reach similar point totals as the 9% LIHTC under the QAP, it would no longer have to monitor the minimum requirements.
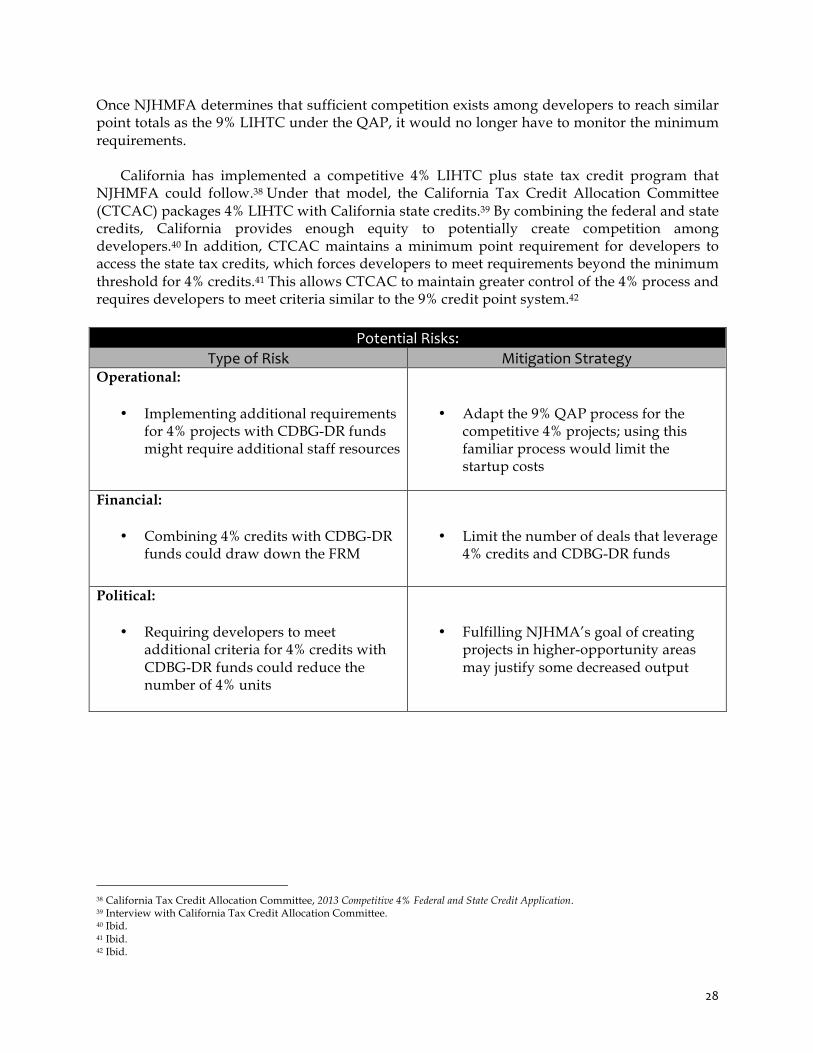
California has implemented a competitive 4% LIHTC plus state tax credit program that NJHMFA could follow.38 Under that model, the California Tax Credit Allocation Committee (CTCAC) packages 4% LIHTC with California state credits.39 By combining the federal and state credits, California provides enough equity to potentially create competition among developers.40 In addition, CTCAC maintains a minimum point requirement for developers to access the state tax credits, which forces developers to meet requirements beyond the minimum threshold for 4% credits.41 This allows CTCAC to maintain greater control of the 4% process and requires developers to meet criteria similar to the 9% credit point system.42
Potential Risks: Type of Risk Mitigation Strategy
Operational:
• Implementing additional requirements for 4% projects with CDBG-DR funds might require additional staff resources
• Adapt the 9% QAP process for the competitive 4% projects; using this familiar process would limit the startup costs
Financial:
• Combining 4% credits with CDBG-DR funds could draw down the FRM
• Limit the number of deals that leverage 4% credits and CDBG-DR funds
Political:
• Requiring developers to meet additional criteria for 4% credits with CDBG-DR funds could reduce the number of 4% units
• Fulfilling NJHMA’s goal of creating projects in higher-opportunity areas may justify some decreased output
38 California Tax Credit Allocation Committee, 2013 Competitive 4% Federal and State Credit Application. 39 Interview with California Tax Credit Allocation Committee. 40 Ibid. 41 Ibid. 42 Ibid.
29
QAP Recommendation #2: Offer additional incentives for building in high-‐opportunity areas with 9% tax credits
Expected Impact:
Offering a variety of additional incentives could make projects in higher-opportunity areas more financially feasible and spur development in these areas.
Even though New Jersey included new incentives in the 2013 QAP, many neighborhood
characteristics of 2013 9% LIHTC projects are similar to neighborhood characteristics of projects financed from 2010-2012. This could be partially due to the 2013 targeting of the nine most-impacted counties, or the speed in which funding was disbursed. However, New Jersey could consider further revisions to the QAP to more effectively incentivize higher-opportunity development.
New Jersey currently uses competitive points to incentivize development in high-opportunity areas. Even with competitive points, barriers such as higher per-unit development costs might exclude projects in higher-opportunity neighborhoods. Other states use different strategies to incentivize development; these include offering basis boosts, creating targeted set-asides, issuing policy statements, or setting threshold requirements.43
Given these options and NJHMFA’s interest in promoting development in higher-opportunity areas, NJHMFA could create a set-aside for project applications in higher-opportunity neighborhoods. The set-aside could include projects that meet certain minimum criteria in terms of higher school quality and improved job opportunities. To recognize the higher cost of project development in these neighborhoods, NJHMFA could allocate a basis boost of 30%, similar to the basis boosts offered during the 9% LIHTC allocations for Sandy.44
Another option to address the increased cost of developing in higher-opportunity
neighborhoods would be to layer the 9% tax credits with 4% tax credits for certain costs. For example, Connecticut allows for layering of 4% and 9% tax credits for building acquisition and rehabilitation.45 Another option would be to include land purchase as an eligible activity for CDBG-DR, something that New Jersey currently prohibits. However, it will be important for NJHMFA to ensure the criteria for this set-aside is sufficiently strict to only fund development in significantly higher-opportunity areas.
43 Khadduri, Jill, Creating Balance in the Locations of LIHTC Development: The Role of Qualified Allocation Plans. 44 The first Sandy round of 9%LIHTC and FRM offered a 10% increase in total development costs per unit, affecting the basis, and
the 2013 rounds offered a 30% basis boost in Qualified Census Tracts/Difficult to Development Areas. Please see the New Jersey LIHTC application form for more details.
45 CHFA, “CHFA Low-Income Housing Tax Credit Program.”
30
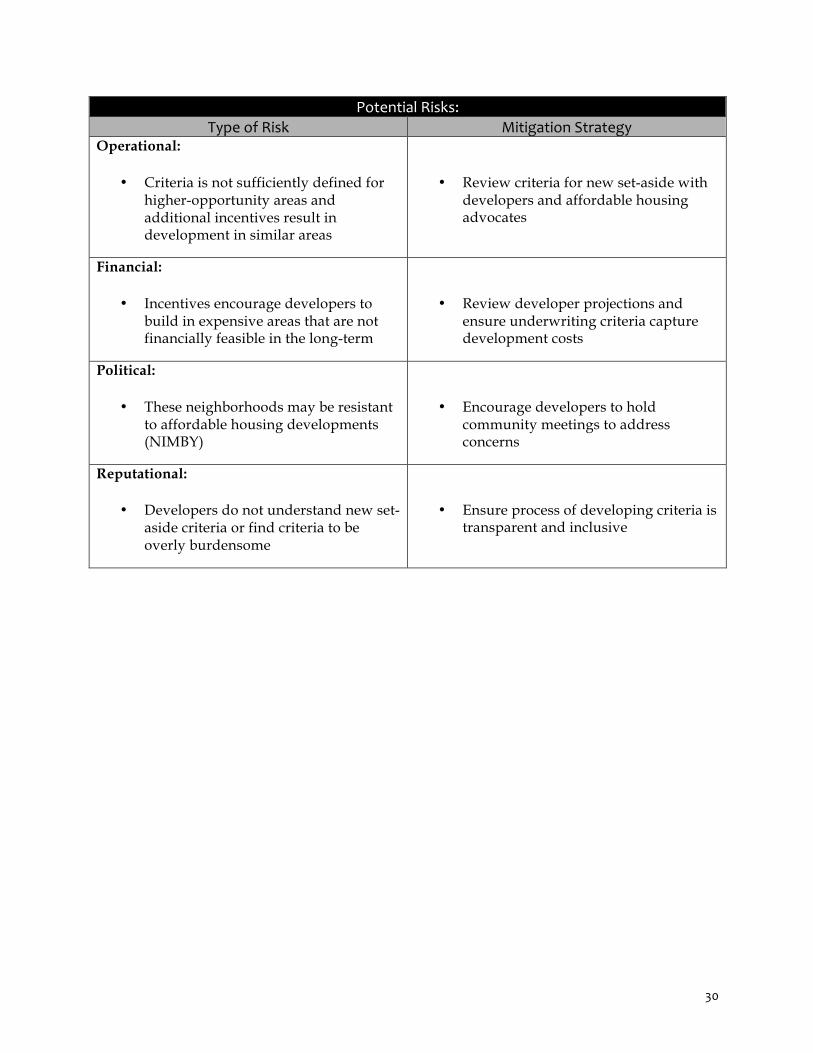
Potential Risks: Type of Risk Mitigation Strategy
Operational:
• Criteria is not sufficiently defined for higher-opportunity areas and additional incentives result in development in similar areas
• Review criteria for new set-aside with developers and affordable housing advocates
Financial:
• Incentives encourage developers to build in expensive areas that are not financially feasible in the long-term
• Review developer projections and ensure underwriting criteria capture development costs
Political:
• These neighborhoods may be resistant to affordable housing developments (NIMBY)
• Encourage developers to hold community meetings to address concerns
Reputational:
• Developers do not understand new set-aside criteria or find criteria to be overly burdensome
• Ensure process of developing criteria is transparent and inclusive
31
QAP Recommendation #3: Set goals for higher-‐opportunity developments based on the current QAP and monitor progress, adjusting the QAP as needed
Expected Impact:
Establishing goals of measurable outcomes and incorporating these into the evaluation of the QAP would allow for a more efficient and effective allocation of limited resources, ultimately facilitating the production of more housing in higher-opportunity neighborhoods.
Recommendation 3.1: Perform a comprehensive evaluation of current 4%, 9%, and CDBG-‐DR-‐funded projects
Building on the evaluation from this report, NJHMFA could engage an external organization or retain an in-house employee with the requisite policy evaluation skills to conduct a comprehensive analysis of its portfolio. Our initial evaluation laid a foundation for a more sophisticated, ongoing analysis of NJHMFA programs.
For example, a subsequent evaluation could identify a similar housing market in another
state to serve as a control for New Jersey. This would allow NJHMFA to better isolate the effects of particular policy changes in the QAP or CDBG-DR programs. The improved effectiveness of NJHMFA’s programs as a result of this type of evaluation would justify using CDBG-DR resources to engage an outside consultant. Recommendation 3.2: Identify additional metrics from the evaluation that best correlate with desired outcomes
In order to define higher-opportunity neighborhoods, New Jersey uses a variety of metrics,
including measures of school district quality, job proximity, and transit accessibility. Because opportunity is complex to define, NJHMFA should evaluate projects based on multiple metrics—both the metrics included in the QAP and additional measures correlated with the desired outcomes. These additional metrics could include income-based measures and housing market characteristics, such as minority concentration and the percentage of housing units that are single-family or owner-occupied.46
Using additional indicators to measure school quality could also be helpful. The QAP
currently uses school district data to determine school quality. However, variance in school quality within districts can be quite large. Despite the fact that 9% projects received points for school quality, the elementary schools nearest to the 2013 9% LIHTC projects were, on average, low-performing schools (Great Schools score of 3.6 out of 10); in fact, these schools were ranked slightly lower than the ones closest to the 2010-2012 9% LIHTC projects (see Table 9). Switching to a school-level measure like other states—including Massachusetts, which focuses on the quality of secondary schools, and Georgia and Texas, which focus on the quality of primary schools—could ensure that LIHTC projects are located not just within better school districts, but
46 Khadduri, Jill, Creating Balance in the Locations of LIHTC Development: The Role of Qualified Allocation Plans.
32
closer to good schools.47 In addition, the QAP should focus on the performance of elementary schools, as good secondary schools can mask a combination of poor and strong feeder schools.
Similarly, a broader set of indicators could help ensure more housing production in areas of
economic opportunity. Currently, NJHMFA incentivizes locations where public- and private-sector jobs total at least 95% of the housing units. The QAP could use multiple metrics in addition to employment opportunity, including poverty statistics and median household income, as measurements of neighborhood opportunity.
NJHMFA could also ensure that points awarded for neighborhood characteristics cannot be
received for meeting other, unrelated criteria; for example, in the Family Cycle, applicants can receive five points for either i) Low-density buildings where at least 25% of the tax credit units are large family units or ii) projects located within a transit-oriented development where at least five percent of the tax credit units are large family units. To receive these five points, developers could avoid transit-oriented development by instead building low-density buildings. Recommendation 3.3: Set specific goals for higher-‐opportunity developments
Once NJHMFA has identified a broader set of indicators that correlate with its desired
outcomes, it should use these measures to establish a specific definition for what constitutes a higher-opportunity neighborhood. NJHMFA should set targets for the number of housing units to be produced in higher-opportunity areas in each cycle. After NJHMFA or its consultant completes a thorough evaluation of the current portfolio (Recommendation 3.1), NJHMFA would be better equipped to set ambitious, yet feasible, goals for future cycles, using past performance as a baseline.
Both Pennsylvania and Massachusetts have adopted the strategy of setting specific targets
for the number of LIHTC units built in higher-opportunity areas, providing them with objective standards on which to evaluate the success of the current QAP and propose future changes.48 Furthermore, according to a 2013 report on state QAPs released by Abt Associates, making these targets public can serve a number of useful functions, including guiding public comments on proposed QAP revisions and clarifying the rationale behind policy changes.49 Recommendation 3.4: Continually monitor performance based on identified metrics, adjusting QAP as needed to meet organizational goals
After a consultant establishes the evaluation framework, NJHMFA could continue using this
model at minimal cost. In CDBG-DR Recommendation #7, below, we have also recommended assigning a data analyst that could monitor this evaluation process and incorporate current and future disaster recovery programs into the model.
47 Ibid. 48 Ibid. 49 Ibid.
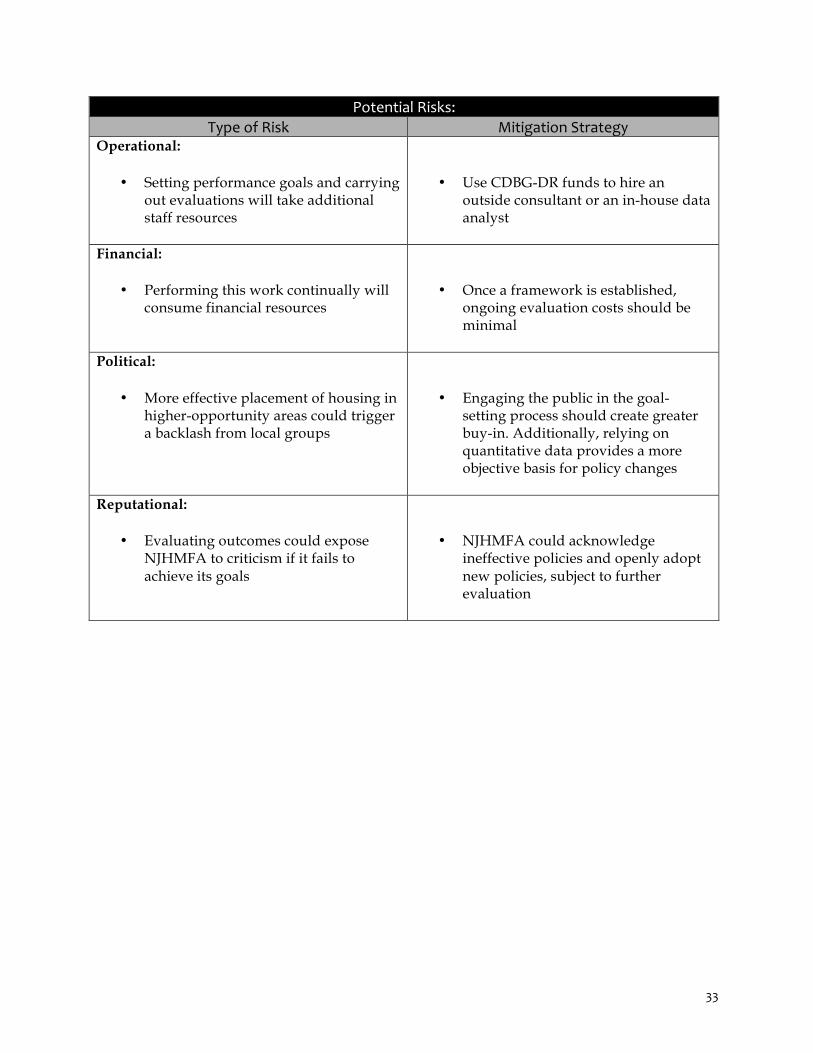
33
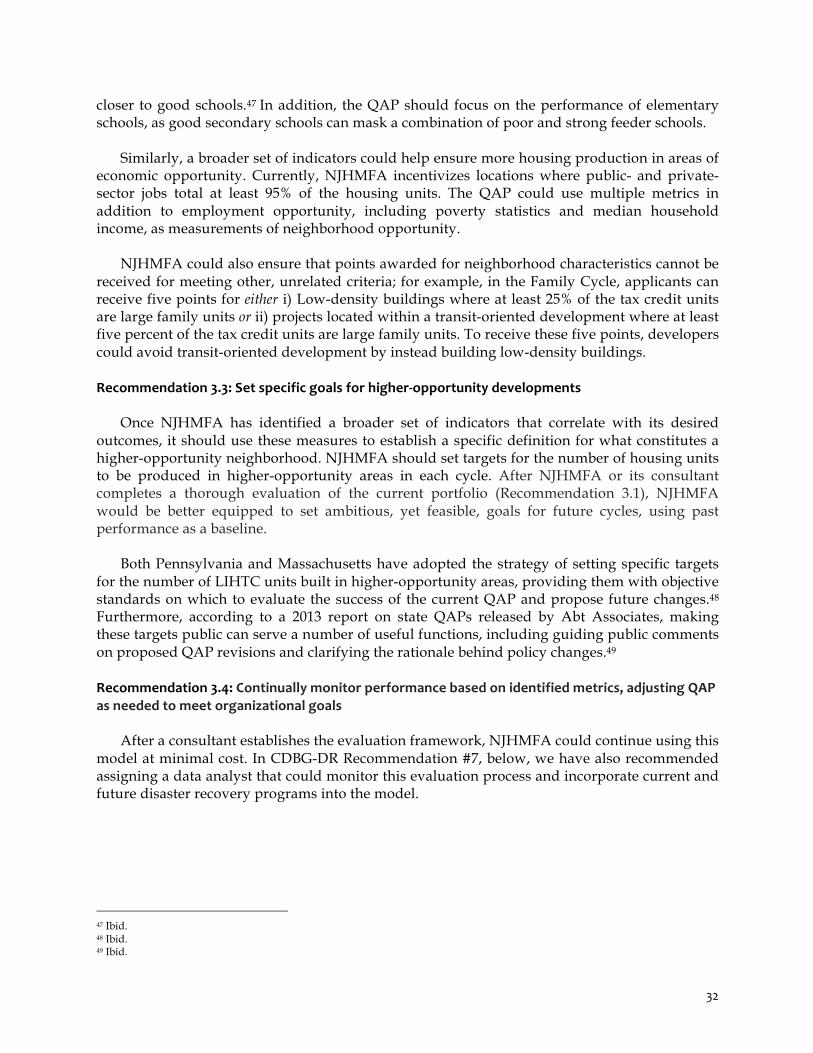
Potential Risks: Type of Risk Mitigation Strategy
Operational:
• Setting performance goals and carrying out evaluations will take additional staff resources
• Use CDBG-DR funds to hire an outside consultant or an in-house data analyst
Financial:
• Performing this work continually will consume financial resources
• Once a framework is established, ongoing evaluation costs should be minimal
Political:
• More effective placement of housing in higher-opportunity areas could trigger a backlash from local groups
• Engaging the public in the goal-setting process should create greater buy-in. Additionally, relying on quantitative data provides a more objective basis for policy changes
Reputational:
• Evaluating outcomes could expose NJHMFA to criticism if it fails to achieve its goals
• NJHMFA could acknowledge ineffective policies and openly adopt new policies, subject to further evaluation
34
Part B: CDBG-‐DR Recommendations
The following recommendations are based on analysis of NJHMFA’s and other state agencies’ CDBG-DR programs in addition to interviews with a variety of stakeholders, including non-profit and for-profit developers, advocacy groups, and other organizations involved in disaster recovery housing efforts. CDBG-‐DR Recommendation #1: Advocate that DCA allocate at least 40% of any future CDBG-‐DR housing funds to rental programs
Expected Impact:
DCA has proposed to reallocate $145 million of the first tranche from economic development to housing programs; allocating 40% of this would result in an additional $58 million for affordable rental units. If DCA applied these funds to FRM, assuming the same level of leveraging of CDBG-DR funding as achieved in the first six months,50 it would fund more than 972 family and senior affordable housing units. In the second and future tranches, DCA could expect similar leveraging.
In the first tranche, DCA allocated 33% of housing funding to rental programs, and only
28% to exclusively rental programs, both of which were below the estimated impact on renters.51 DCA proposed to reallocate $145 million of first tranche funds from small business programs to homeownership housing programs. Allocating an additional $145 million to homeownership programs would result in only 25% of housing funds allocated to exclusively rental programs and 70% to homeownership programs.
In order to best serve unmet housing needs in New Jersey, at least 40% of this additional
$145 million for housing, or $58 million, should go towards rental programs; this would result in the allocation of 29.3% of total housing funding to exclusively rental programs, likely still below renter unmet needs. In addition, DCA should continue to allocate 40% of housing funding to rental housing in the second and future tranches. While NJHMFA does not have direct influence over DCA’s proposed allocation between rental and homeownership programs, advocacy efforts could influence DCA’s proposed Action Plan to HUD.
To support this recommendation, this section expands on the controversies surrounding
storm impact analysis and presents evidence for greater aid to New Jersey renters. Federal and State-‐level Most-‐Impacted Methodology
The HUD methodology for calculating impact relies on formulas for unmet homeowner and renter needs. However, this methodology downplays renter needs by focusing on a narrow
50 As of August 30, 2013, NJHMFA leveraged $142,655,627 of CDBG-DR funds with LIHTC and NJHMFA financing to fund 2,392
units through the FRM program. This averages to $59,638.54 of CDBG-DR funding per unit. 51 The Blight Reduction Pilot Program and Home Buyer Assistance Program are open to renters and homeowners, while the FRM,
Landlord Rental Repair, Pre-Development Funds, Incentives for Landlords and SSMHF target only renters.
35
band of renters. While the homeowner needs category includes all homes with uninsured coverage over $8,000, the renter needs category includes only units with more than $2,000 in personal damage and which are occupied by a tenant making less than $30,000.52,53 In addition, homeowners have a greater incentive to report damage to FEMA.
In its first tranche allocation, DCA initially submitted a community Action Plan to HUD that only devoted 22% of available funds to renters.54 DCA used the same methodology described by HUD, but supplemented FEMA’s estimated damages with private construction cost data; its final needs assessment does not differentiate between rental and owner-occupied needs. It is likely that DCA’s rental estimates were biased downwards through the same assumptions as HUD, but with slightly different data.55
FEMA data is difficult to interpret for the purpose of estimating renter damage. For example, a renter could now have an uninhabitable unit, despite limited property damage, while a renter reporting substantial damage might have a habitable unit. As a result, we recommend alternative metrics that use the total number of low-to-middle income registrants—those earning less than $60,000—to gauge impact, as well as the number of registrants suffering major or substantial damage. Applying FEMA Verified Loss data
Using alternative methodologies, housing advocates estimated a much higher impact on renters. Based on FEMA data on damage to housing, Enterprise Community Partners estimated that 43% of FEMA registrants in New Jersey were renters.56 The Furman Center for Real Estate and Urban Policy estimated that renters suffered 40% of housing damage.57 New Jersey increased its proposed allocation of first tranche housing funds for renters from the initial proposal of 22% to 33%. Interviewees attributed this change to legal action based on analyses by groups such as the Furman Center and Enterprise.
The Furman Center followed New York State’s methodology, which used the FEMA
verified loss estimates (FVL) as a starting point. New York State recognized that FEMA FVL systematically underestimates impacts on renter-occupied properties partly because damage to renter-occupied households is reported at a much lower rate than damage to owner-occupied households. New York State entered every impacted property (renter- and owner-occupied) into a GIS system based on property address.58 It then calculated the average FVL for all owner-occupied properties on each block and applied this average to each rental property on the block, reasoning that rental properties should, on average, experience the same amount of damage as neighboring owner-occupied residences.59 Using New York State’s methodology, the Furman Center estimated that renters suffered 40% of renters suffered housing damage in New Jersey.
52 Property damage to renters making more than $30,000 per year is excluded because the property owner is presumed to have
insurance. 53 Allocations, Common Application, Waivers, and Alternative Requirements for Grantees Receiving Community Development Block Grant
(CDBG) Disaster Recover Funds in Response to Hurricane Sandy. 54 Interviews with the New Jersey development community. 55 New Jersey’s CDBG Disaster Recovery Action Plan. 56 Enterprise Community Partners, Measuring the Response to Hurricane Sandy: FEMA Assistance Analysis for New Jersey and New York. 57 Furman Center for Real Estate and Urban Policy, “Furman Center and Enterprise Joint Press Release on New FEMA Sandy Data.” 58 New York State Homes and Community Renewal: Office of Community Renewal, State of New York Action Plan for Community
Development Block Grant Program Disaster Recovery. 59 Ibid.
36
Renters are disproportionately low and moderate-‐income families and therefore have a greater need for the disaster recovery funding
As noted in the section on the Impact of Superstorm Sandy on New Jersey, New Jersey renters have a significantly lower median income than homeowners: according to FEMA data, two-thirds of renters impacted by Sandy lived on an annual income below $30,000.60 In addition, renters face a unique set of challenges: Enterprise Community Partners reported that 32% of renter households in damaged buildings wanted to move out after the storm, but could not because of a lease, and 43% of renter households reported that their landlord had not prepared the building for Sandy.61 HUD disaster recovery should target these low-income households who have the greatest barriers to rebuilding.
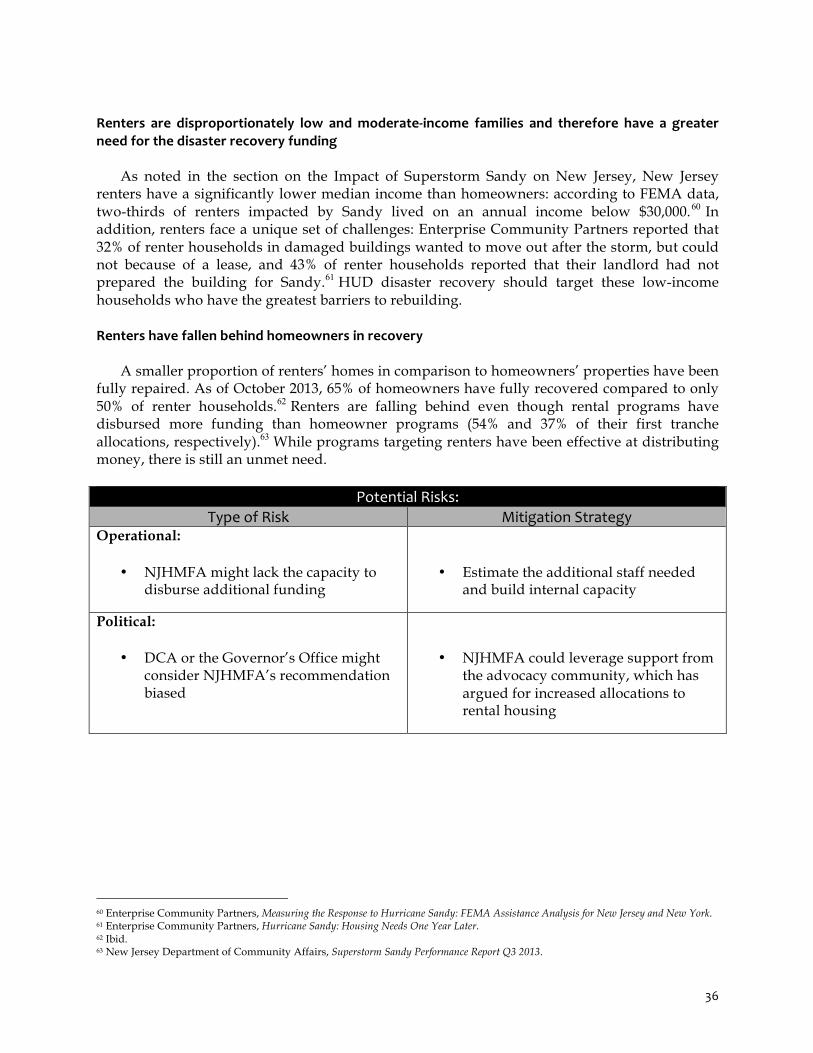
Renters have fallen behind homeowners in recovery
A smaller proportion of renters’ homes in comparison to homeowners’ properties have been fully repaired. As of October 2013, 65% of homeowners have fully recovered compared to only 50% of renter households.62 Renters are falling behind even though rental programs have disbursed more funding than homeowner programs (54% and 37% of their first tranche allocations, respectively).63 While programs targeting renters have been effective at distributing money, there is still an unmet need.
Potential Risks: Type of Risk Mitigation Strategy
Operational:
• NJHMFA might lack the capacity to disburse additional funding
• Estimate the additional staff needed and build internal capacity
Political:
• DCA or the Governor’s Office might consider NJHMFA’s recommendation biased
• NJHMFA could leverage support from the advocacy community, which has argued for increased allocations to rental housing
60 Enterprise Community Partners, Measuring the Response to Hurricane Sandy: FEMA Assistance Analysis for New Jersey and New York. 61 Enterprise Community Partners, Hurricane Sandy: Housing Needs One Year Later. 62 Ibid. 63 New Jersey Department of Community Affairs, Superstorm Sandy Performance Report Q3 2013.

37
CDBG-‐DR Recommendation #2: Use zip code-‐level data to better target CDBG-‐DR dollars to storm damaged-‐areas
Expected Impact:
Targeting FRM dollars to the top quartile of impacted zip codes would cover 91% of FEMA renter registrants. Providing incentives for zip codes with both high levels of FEMA-registered renters and Halpin-identified municipalities would provide geographic flexibility to developers while also targeting development to areas of need.
Our analysis below indicates that the 9% LIHTC development planned throughout 2013 is
unevenly distributed at the county level based on FEMA’s data. At the zip code level, there is considerable mismatch between where Superstorm Sandy had its greatest impact and where new 9%-financed affordable units will be available. Affordable housing needs in impacted areas could potentially be addressed by 4%-funded projects; however, when this report was published, the data necessary to make that determination were not available. Furthermore, our evaluation of 4% projects with NJHMFA approval demonstrates a distinct difference in the neighborhood characteristics where the two types of projects are located.
In the future, targeting at the zip code level will more precisely steer relief money while
providing flexibility to build units in sustainable, financially feasible areas. Figure 3 demonstrates a zip code-based approach that would allow FRM dollars to be spent in roughly the top quartile of damaged zip codes. If zip code level targeting is found to exclude too many high-opportunity areas, GIS technology could be used to devise a map that also allows for a reasonable buffer around impacted zip codes.
An alternative to a buffer may be to include alternative measures for storm damage. For
example, in October 2013, Rutgers’ Stephanie Hoopes Halpin aggregated multiple data sources to create a Community Hardship Index measuring the impact of Superstorm Sandy at the municipal and county level. The index combines data from FEMA, the National Flood Insurance Program, the New Jersey Department of Banking and Insurance, New Jersey 2-1-1 calls and utility company reports, and the U.S. Small Business Administration. Using robust metrics, Halpin found that six of the 31 hardest hit municipalities are not located within the nine most-impacted counties.64 Using this alternative metric as a complement to the zip code level targeting would ensure that highly-impacted communities have access to NJHMFA’s CDBG-DR funding.
64 Halpin, The Impact of Superstorm Sandy on New Jersey Towns and Households. Municipalities scoring highly on the Community
Hardship index included Flemington, Stockton, Carlstadt, Califon, and Far Hills.
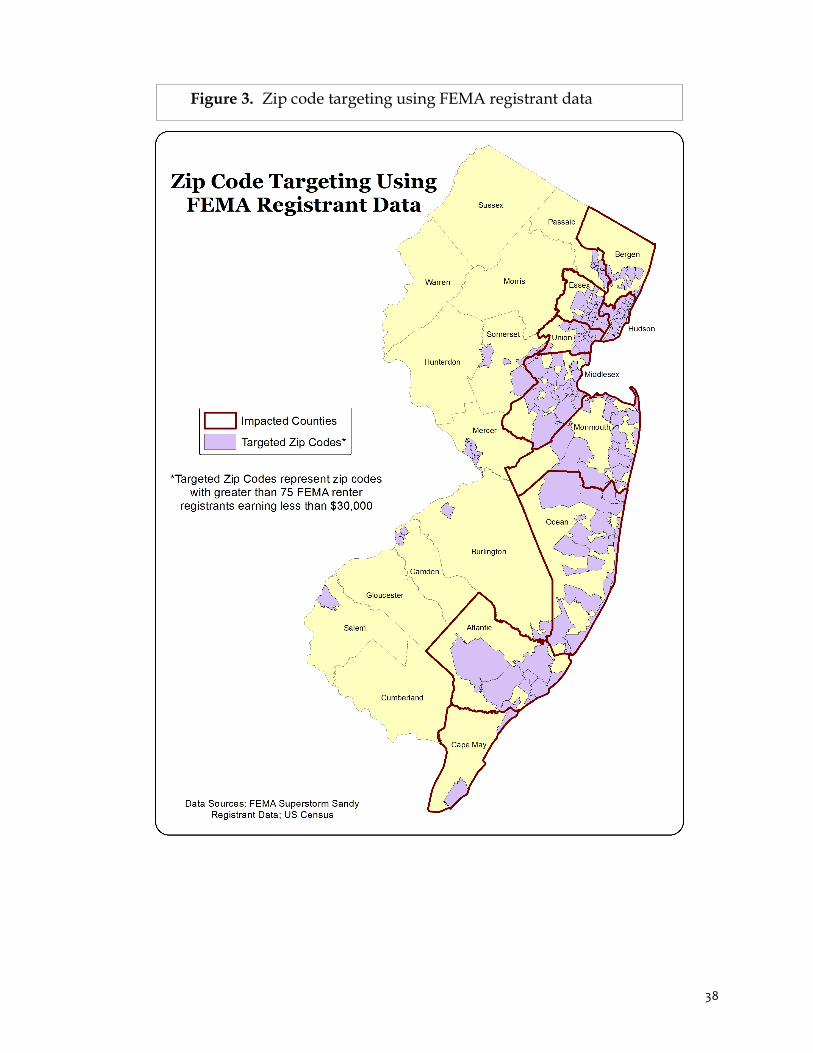
38
Figure 3. Zip code targeting using FEMA registrant data
39
Analysis
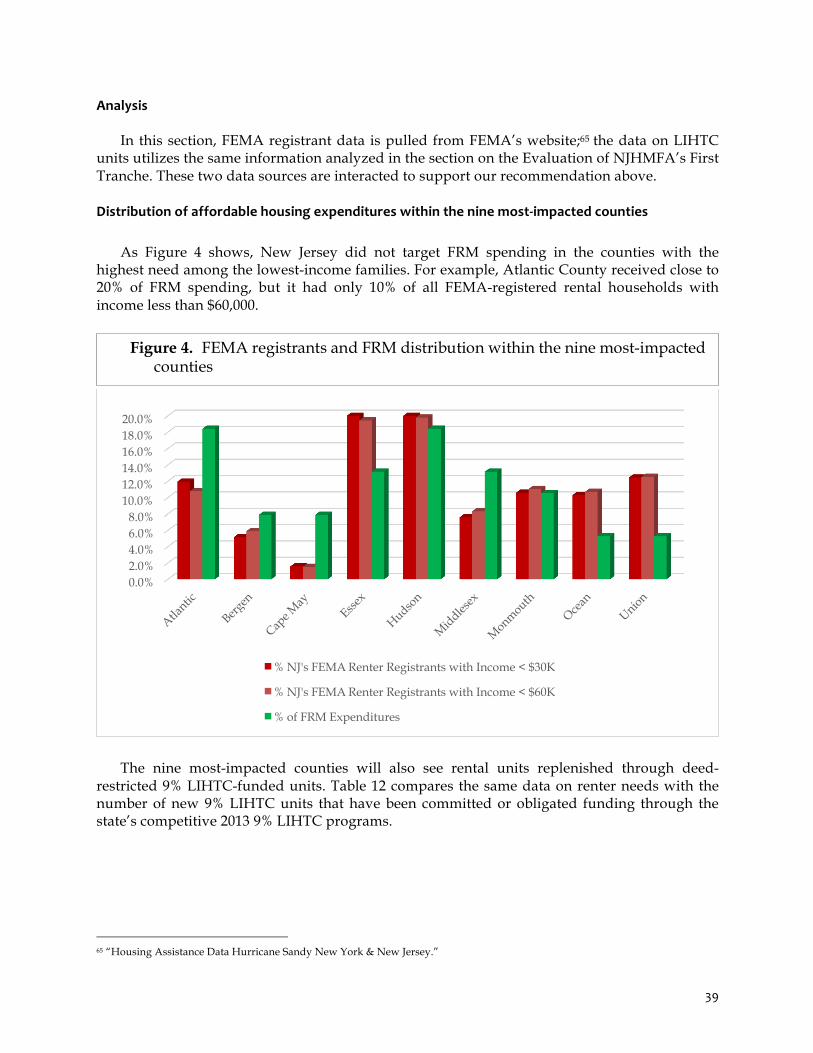
In this section, FEMA registrant data is pulled from FEMA’s website;65 the data on LIHTC units utilizes the same information analyzed in the section on the Evaluation of NJHMFA’s First Tranche. These two data sources are interacted to support our recommendation above. Distribution of affordable housing expenditures within the nine most-‐impacted counties
As Figure 4 shows, New Jersey did not target FRM spending in the counties with the highest need among the lowest-income families. For example, Atlantic County received close to 20% of FRM spending, but it had only 10% of all FEMA-registered rental households with income less than $60,000.
The nine most-impacted counties will also see rental units replenished through deed-
restricted 9% LIHTC-funded units. Table 12 compares the same data on renter needs with the number of new 9% LIHTC units that have been committed or obligated funding through the state’s competitive 2013 9% LIHTC programs.
65 “Housing Assistance Data Hurricane Sandy New York & New Jersey.”
0.0% 2.0% 4.0% 6.0% 8.0%
10.0% 12.0% 14.0% 16.0% 18.0% 20.0%
% NJ's FEMA Renter Registrants with Income < $30K
% NJ's FEMA Renter Registrants with Income < $60K
% of FRM Expenditures
Figure 4. FEMA registrants and FRM distribution within the nine most-impacted counties
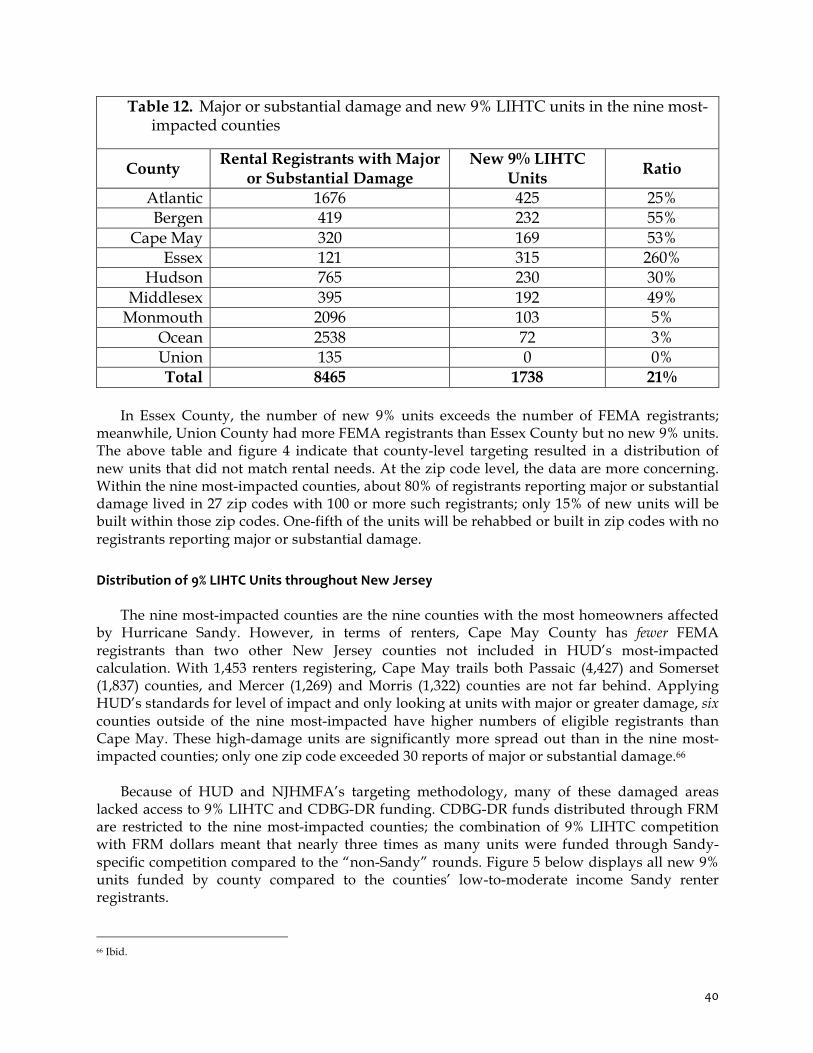
40
Table 12. Major or substantial damage and new 9% LIHTC units in the nine most-impacted counties
County Rental Registrants with Major
or Substantial Damage New 9% LIHTC
Units Ratio
Atlantic 1676 425 25% Bergen 419 232 55%
Cape May 320 169 53% Essex 121 315 260%
Hudson 765 230 30% Middlesex 395 192 49%
Monmouth 2096 103 5% Ocean 2538 72 3% Union 135 0 0% Total 8465 1738 21%
In Essex County, the number of new 9% units exceeds the number of FEMA registrants;
meanwhile, Union County had more FEMA registrants than Essex County but no new 9% units. The above table and figure 4 indicate that county-level targeting resulted in a distribution of new units that did not match rental needs. At the zip code level, the data are more concerning. Within the nine most-impacted counties, about 80% of registrants reporting major or substantial damage lived in 27 zip codes with 100 or more such registrants; only 15% of new units will be built within those zip codes. One-fifth of the units will be rehabbed or built in zip codes with no registrants reporting major or substantial damage. Distribution of 9% LIHTC Units throughout New Jersey
The nine most-impacted counties are the nine counties with the most homeowners affected by Hurricane Sandy. However, in terms of renters, Cape May County has fewer FEMA registrants than two other New Jersey counties not included in HUD’s most-impacted calculation. With 1,453 renters registering, Cape May trails both Passaic (4,427) and Somerset (1,837) counties, and Mercer (1,269) and Morris (1,322) counties are not far behind. Applying HUD’s standards for level of impact and only looking at units with major or greater damage, six counties outside of the nine most-impacted have higher numbers of eligible registrants than Cape May. These high-damage units are significantly more spread out than in the nine most-impacted counties; only one zip code exceeded 30 reports of major or substantial damage.66
Because of HUD and NJHMFA’s targeting methodology, many of these damaged areas lacked access to 9% LIHTC and CDBG-DR funding. CDBG-DR funds distributed through FRM are restricted to the nine most-impacted counties; the combination of 9% LIHTC competition with FRM dollars meant that nearly three times as many units were funded through Sandy-specific competition compared to the “non-Sandy” rounds. Figure 5 below displays all new 9% units funded by county compared to the counties’ low-to-moderate income Sandy renter registrants.
66 Ibid.
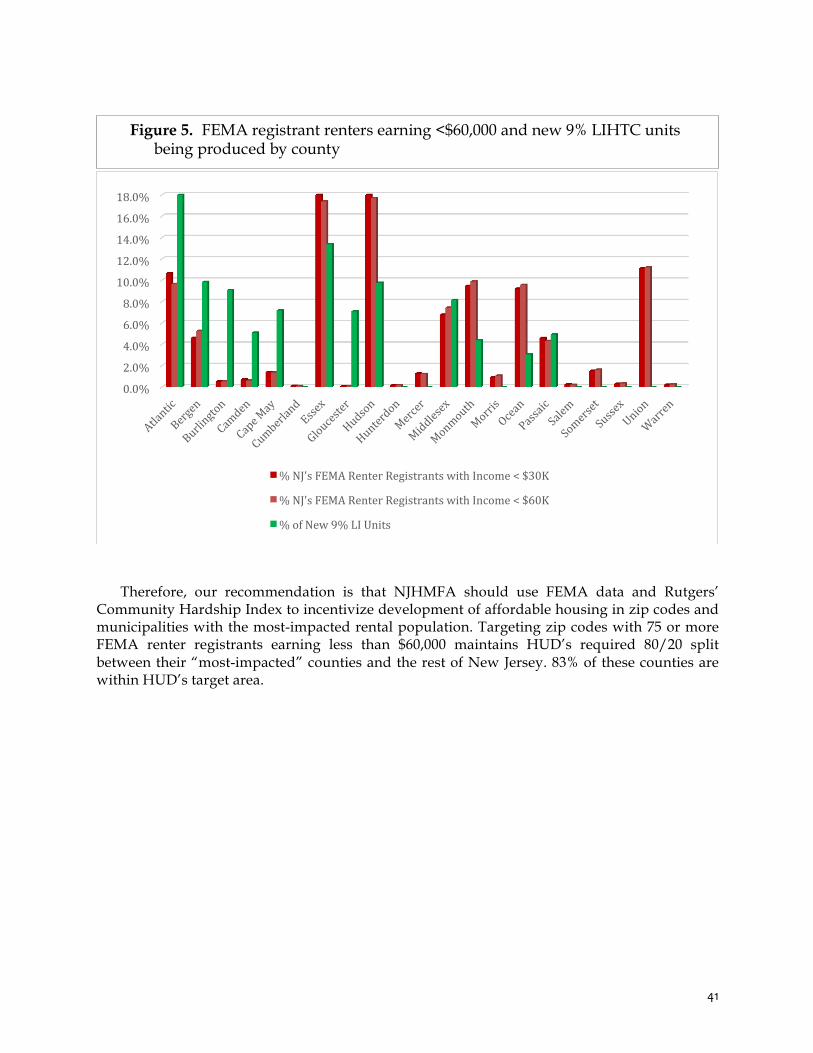
41
Therefore, our recommendation is that NJHMFA should use FEMA data and Rutgers’
Community Hardship Index to incentivize development of affordable housing in zip codes and municipalities with the most-impacted rental population. Targeting zip codes with 75 or more FEMA renter registrants earning less than $60,000 maintains HUD’s required 80/20 split between their “most-impacted” counties and the rest of New Jersey. 83% of these counties are within HUD’s target area.
0.0%
2.0%
4.0%
6.0%
8.0%
10.0%
12.0%
14.0%
16.0%
18.0%
% NJ's FEMA Renter Registrants with Income < $30K
% NJ's FEMA Renter Registrants with Income < $60K
% of New 9% LI Units
Figure 5. FEMA registrant renters earning <$60,000 and new 9% LIHTC units being produced by county
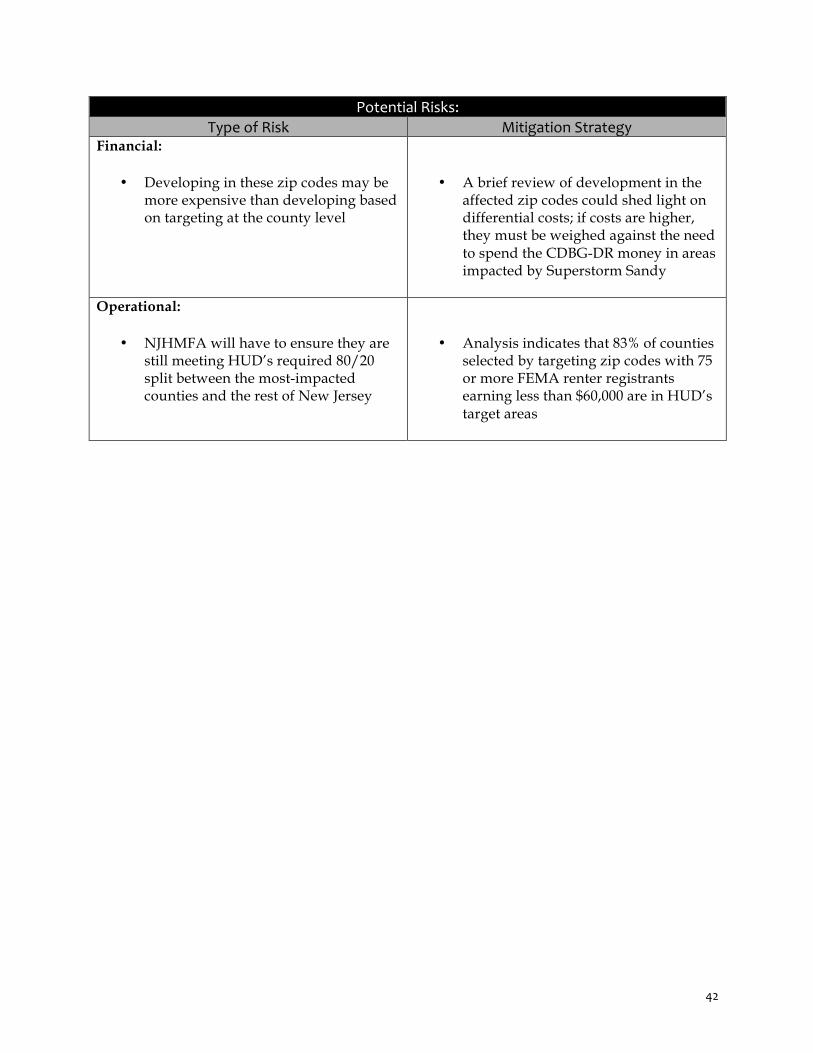
42
Potential Risks: Type of Risk Mitigation Strategy
Financial:
• Developing in these zip codes may be more expensive than developing based on targeting at the county level
• A brief review of development in the affected zip codes could shed light on differential costs; if costs are higher, they must be weighed against the need to spend the CDBG-DR money in areas impacted by Superstorm Sandy
Operational:
• NJHMFA will have to ensure they are still meeting HUD’s required 80/20 split between the most-impacted counties and the rest of New Jersey
• Analysis indicates that 83% of counties selected by targeting zip codes with 75 or more FEMA renter registrants earning less than $60,000 are in HUD’s target areas
43
CDBG-‐DR Recommendation #3: Streamline the environmental review process for CDBG-‐DR-‐funded projects
Expected Impact:
By coordinating the environmental review and permitting processes for affordable housing developments, NJHMFA could significantly reduce the time of construction. Also, clarifying the CDBG-DR review process could limit the resources spent on the environmental review.
Prior to building affordable housing with CDBG-DR funds, developers must complete
numerous land use and environmental reviews. Appendix D shows the steps that a New Jersey developer must complete prior to finishing construction. If streamlining the process could reduce or combine a number of these steps, it would improve the efficiency of disbursing the second and third tranches of CDBG-DR funds, a stated goal for NJHMFA. NJHMFA could improve this process and reduce the time required to complete CDBG-DR-funded projects in the following five ways: Recommendation 3.1: Support a statewide review to identify impediments and solutions to regulatory delays in CDBG-‐DR funded projects
Although NJHMFA does not have the authority to implement a statewide analysis of environmental reviews and permitting procedures, it could suggest the process to the governor’s office. The federal government has started a similar process to coordinate permitting and environmental reviews following a natural disaster. The Sandy Recovery Improvement Act of 2013 created, among other things, a unified federal review of compliance with environmental and historical requirements under federal law for disaster recovery projects and allowed HUD and its grantees to adopt reviews across agencies.67 The steering group, which includes the Council on Environmental Quality, the Department of Homeland Security, the Federal Emergency Management Agency, and the Advisory Council on Historic Preservation, leads the unified review.68 The steering group also created three working groups: policy, capacity building, and data/information technology.69 The unified review process calls for Federal agencies involved in disaster recovery to:
• Identify obstacles in the environmental and historic preservation review of services,
grants, and other assistance in disaster recovery; • Identify tools or other resources that could improve the ability to assist with or
participate in environmental and historic preservation reviews for disaster recovery projects;
• Recommend how the environmental and historic preservation review process could be made more efficient and effective for disaster recovery;
• Identify prior or ongoing efforts to improve the environmental and historic preservation review process efficiency and effectiveness; and
67 “Sandy Recovery Improvement Act of 2013.” 68 “ACHP | Unified Federal Review.” Hurricane Sandy Rebuilding Task Force, Hurricane Sandy Rebuilding Strategy. 57-59 69 “ACHP | Unified Federal Review.”
44
• Provide examples of best practices and lessons learned that improve the efficiency and effectiveness of environmental and historic preservation reviews.70
HUD has encouraged state agencies to implement reviews of the permitting and environmental review process. Its notice for the second tranche of CDBG-DR funding states “grantees should identify opportunities to expedite and improve other types of review processes, including historic review and other environmental analyses, through programmatic agreements or consultation, and through participation in the Regional Coordination Working group . . . .”71
HUD has already cited two examples from New Jersey as successful coordination efforts.72
First, FEMA, HUD, and New Jersey agencies implemented a single federal review of housing recovery projects that reduced redundancy. Second, after Superstorm Sandy, FEMA, the New Jersey State Historic Preservation Officer, the New Jersey State Office of Emergency Management, the Advisory Council on Historic Preservation, and four Indian Tribes entered an agreement to address both state and federal historic preservation regulations,73 which HUD expanded to include DCA and CDBG-DR projects.74
HMFA could suggest a similar unified review of permitting and environmental
requirements for CDBG-DR funded projects in New Jersey. As part of a review process, NJHMFA would assist with coordinating similar working groups across state and local agencies, developers, and HUD officials to identify inefficiencies and duplication across agencies and possible solutions. The same five goals established by the federal review process would address the concerns affordable housing developers have raised as impediments to construction. This would improve the CDBG-DR process not only for FRM and SSNHF, but also for future LIHTC projects that require coordination of permissions across state and local agencies. Recommendation 3.2: Provide additional training sessions for developers and their consultants to improve compliance with CDBG-‐DR environmental reviews
To improve the success rate of environmental reviews mandated by the CDBG-DR funding, NJHMFA could provide additional training sessions for developers and their consultants. In these sessions, NJHMFA could present checklists and forms detailing the requirements of the review and examples of applications that failed to comply. Also, by encouraging a dialogue with developers at these sessions, NJHMFA could learn aspects of the review that cause the most problems and lead to non-compliance. Based on these discussions with developers and their consultants, NJHMFA could also gauge whether recommendations 3.3, 3.4, and 3.5, below, might result in a higher percentage of successful applications.
70 Executive Office of the President: Council on Environmental Quality, “Unified Federal Review Letter.” 71 “Second Allocation, Waivers, and Alternative Requirements for Grantees Receiving Community Development Block Grant
(CDBG) Disaster Recovery Funds in Response to Hurricane Sandy,” 25. 72 “Written Testimony of Yolanda Chavez Deputy Assistant Secretary for Grant Programs, Office of Community Planning and
Development, U.S. Department of Housing and Urban Development (HUD) Hearing before the House Subcommittee on Economic Development, Public Buildings and Emergency Management,” 3. Hurricane Sandy Rebuilding Task Force, Hurricane Sandy Rebuilding Strategy. 59.
73 “Written Testimony of Yolanda Chavez Deputy Assistant Secretary for Grant Programs, Office of Community Planning and Development, U.S. Department of Housing and Urban Development (HUD) Hearing before the House Subcommittee on Economic Development, Public Buildings and Emergency Management,” 3.
74 Ibid.

45
Recommendation 3.3: Designate a point person for environmental issues at NJHMFA
While engaging in a unified review of the environmental and permitting process, NJHMFA should designate a liaison with the New Jersey Department of Environmental Protection (DEP). Affordable housing developers note that coordination with state reviews and permitting could be improved if NJHMFA had a contact person at DEP. If a developer with LIHTC or CDBG-DR funds had a separate review process at DEP, it could contact NJHMFA’s point person with coordination or technical issues that conflict between the two agencies. This could reduce construction delays and improve efficiency. Recommendation 3.4: Develop a New Jersey-‐based environmental review operation manual
Transparency and consistency in CDBG-DR environmental reviews could smooth the process and improve the efficiency of affordable housing construction. In interviews with developers, many mentioned that the lack of a well-defined process slowed development; developers commented that they did not know what steps to take and received conflicting answers from separate inquiries to NJHMFA.
HUD has created, and posted to its website, a Manual for HUD Staff to Conduct an Environmental Review (Manual).75 The Manual includes links to additional resources, such as the Environmental Assessment Guide for Housing Projects (Handbook 1390.2) and the Environmental Review Guide for CDBG-DR Programs. These guides contain detailed checklists, instructions for compliance review, and a process for scheduling environmental assessments to coordinate with project planning.76 A similar, publically-available guidebook for NJHMFA’s New Jersey-specific environmental review of CDBG-funded projects would clarify the process for developers, improve efficiency, and ensure consistent application of the regulations across developments. Recommendation 3.5: Improve capacity of consultants on CDBG-‐DR environmental reviews and New Jersey regulatory issues
Affordable housing developers in New Jersey have noted that some NJHMFA consultants lack a thorough understanding of New Jersey’s land use laws, permitting procedures, and state environmental review process. Improving the capacity of the consultants used for the CDBG-DR process and increasing the transparency of their selection could increase trust and communication with affordable housing developers.
The Department of Treasury has issued requests for quotes and awarded contracts for environmental assessment field contractors and environmental and historic preservation reviews for seven DCA and Economic Development Agency CDBG-DR programs.77 NJHMFA could request additional quotes for environmental reviews of the FRM and SSNHF.
75 “Manual for HUD Staff to Conduct an Environmental Review/U.S. Department of Housing and Urban Development (HUD).” 76 Office of Community Planning and Development, U.S. Department of Housing and Urban Development, “Environmental Review
Guide for Community Development Block Grant Programs.” 77 “Program Manager Contractor and Environmental Assessment Field Contractors for Environmental and Historic Preservation
Reviews New Jersey’s CDBG-DR Grant Program,” 16.
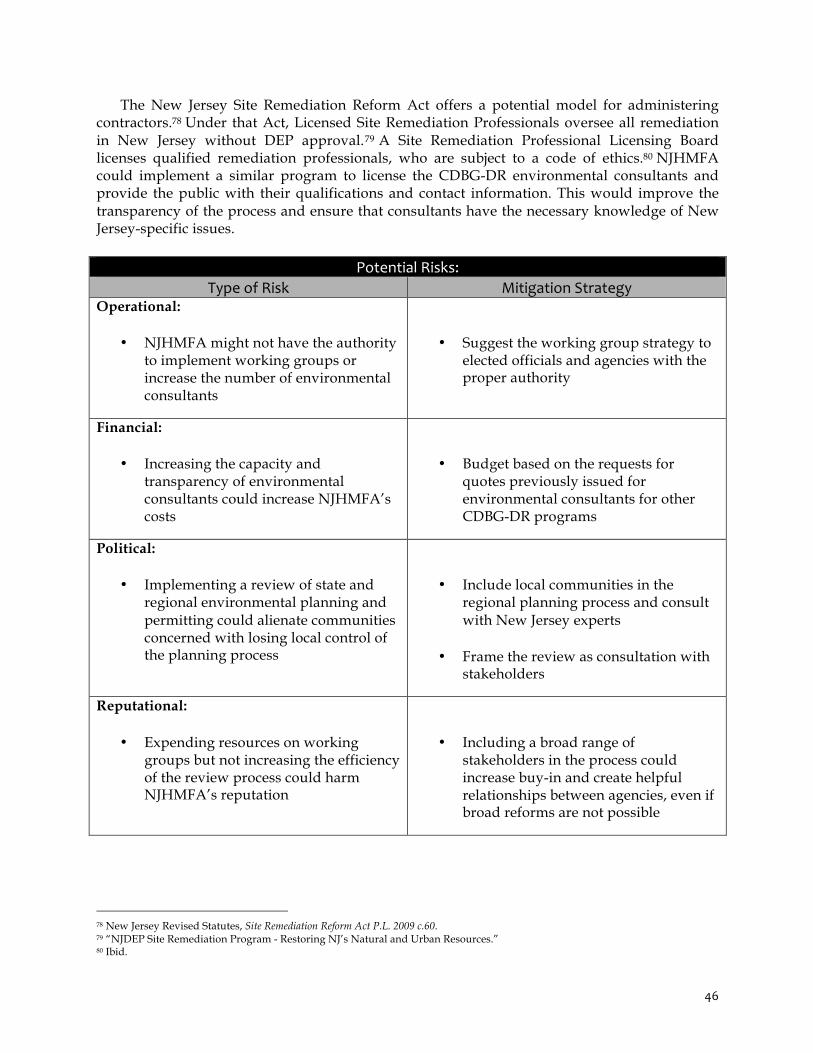
46
The New Jersey Site Remediation Reform Act offers a potential model for administering contractors.78 Under that Act, Licensed Site Remediation Professionals oversee all remediation in New Jersey without DEP approval.79 A Site Remediation Professional Licensing Board licenses qualified remediation professionals, who are subject to a code of ethics.80 NJHMFA could implement a similar program to license the CDBG-DR environmental consultants and provide the public with their qualifications and contact information. This would improve the transparency of the process and ensure that consultants have the necessary knowledge of New Jersey-specific issues.
Potential Risks: Type of Risk Mitigation Strategy
Operational:
• NJHMFA might not have the authority to implement working groups or increase the number of environmental consultants
• Suggest the working group strategy to elected officials and agencies with the proper authority
Financial:
• Increasing the capacity and transparency of environmental consultants could increase NJHMFA’s costs
• Budget based on the requests for quotes previously issued for environmental consultants for other CDBG-DR programs
Political:
• Implementing a review of state and regional environmental planning and permitting could alienate communities concerned with losing local control of the planning process
• Include local communities in the regional planning process and consult with New Jersey experts
• Frame the review as consultation with stakeholders
Reputational:
• Expending resources on working groups but not increasing the efficiency of the review process could harm NJHMFA’s reputation
• Including a broad range of stakeholders in the process could increase buy-in and create helpful relationships between agencies, even if broad reforms are not possible
78 New Jersey Revised Statutes, Site Remediation Reform Act P.L. 2009 c.60. 79 “NJDEP Site Remediation Program - Restoring NJ’s Natural and Urban Resources.” 80 Ibid.
47
CDBG-‐DR Recommendation #4: Use CDBG-‐DR funds from the second and third tranches to implement risk mitigation activities for affordable multifamily rental housing
Expected Impact:
Performing mitigation assessments and requiring the use of resilient building codes for at-risk properties could reduce the risk of future storm damage to current and future affordable multifamily housing developments.
Recommendation 4.1: Recommend that DCA allocate funding in the second and third tranches for mitigation assessments of federally-‐assisted affordable multifamily buildings in NJHMFA’s portfolio and located in the 100-‐year floodplain
While the HUD notice for the first tranche required grantees to address the “rehabilitation, mitigation, and new construction needs” of each impacted Public Housing Authority, the notice for the second allocation of CDBG-DR funds expands this requirement to include all HUD-assisted and LIHTC-financed multifamily housing.81
Although direct damage to LIHTC properties from Superstorm Sandy was limited in New Jersey, more than a dozen LIHTC properties are located in the 100-year floodplain (Appendix B). Even if these properties experienced little or no direct damage from Sandy, their presence in the floodplain means that they may be at risk of future flood damage. Mitigation assessments of at-risk affordable multifamily rental properties could determine the extent of the threat these properties face and provide cost estimates for protecting vital building infrastructure, such as HVAC and electrical equipment.
Teams of engineers in New York City are currently carrying out these assessments with
funding from a HUD Section 4 grant. 82 FEMA’s Mitigation Assessment Team also recommended assessments of this kind in its November 2013 report on New York and New Jersey.83 NJHMFA could use assessments to estimate costs of implementing risk mitigation strategies and prioritize those that are most likely to help buildings recover quickly from future disasters. Recommendation 4.2: Require all new LIHTC and FRM properties located in the 100-‐year floodplain to be built according to resilient building standards
The second HUD notice recommends that all reconstruction of subsidized multifamily housing be done according to model resilient building standards. Examples of resilient building standards include the International Code Council’s I-Codes, the Insurance Institute for Business and Home Safety FORTIFIED home programs, and standards being developed by the American
81 Department of Housing and Urban Development, “Second Allocation, Waivers, and Alternative Requirements for Grantees
Receiving CDBG-DR Funds in Response to Hurricane Sandy.” 82 Laurie Schoeman, Interview with Enterprise Community Partners. 83 FEMA, Mitigation Assessment Team Report: Hurricane Sandy in New Jersey and New York.
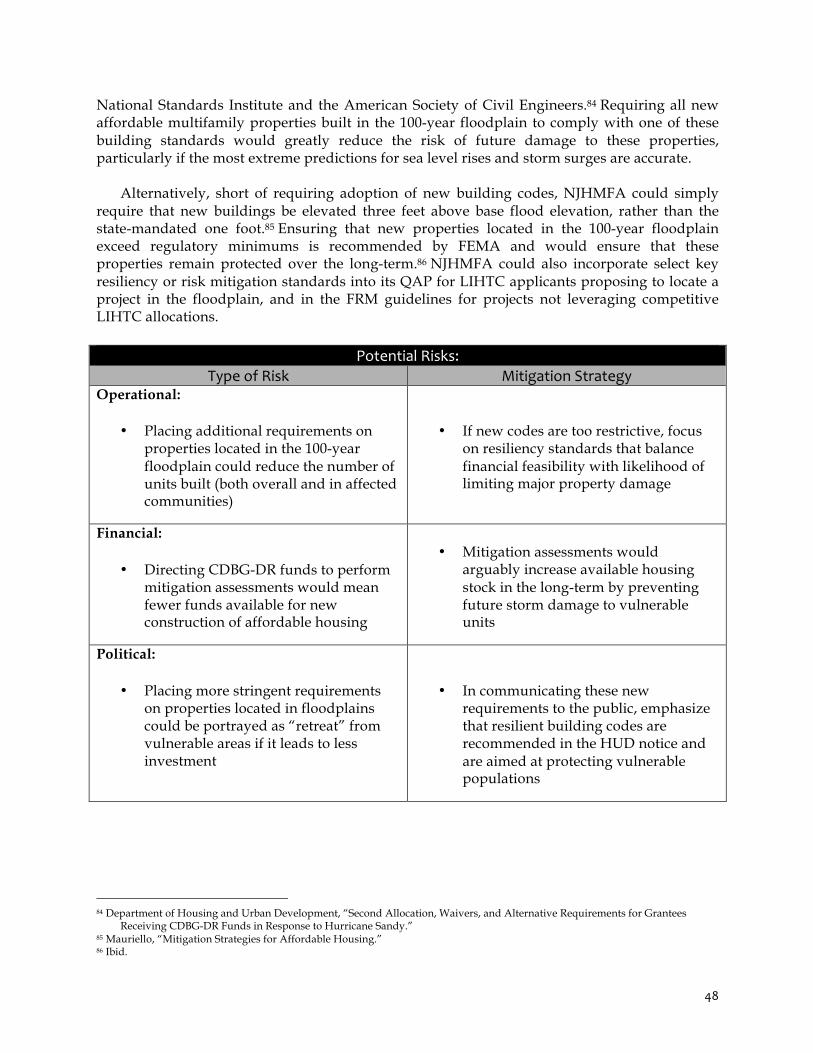
48
National Standards Institute and the American Society of Civil Engineers.84 Requiring all new affordable multifamily properties built in the 100-year floodplain to comply with one of these building standards would greatly reduce the risk of future damage to these properties, particularly if the most extreme predictions for sea level rises and storm surges are accurate.
Alternatively, short of requiring adoption of new building codes, NJHMFA could simply
require that new buildings be elevated three feet above base flood elevation, rather than the state-mandated one foot.85 Ensuring that new properties located in the 100-year floodplain exceed regulatory minimums is recommended by FEMA and would ensure that these properties remain protected over the long-term.86 NJHMFA could also incorporate select key resiliency or risk mitigation standards into its QAP for LIHTC applicants proposing to locate a project in the floodplain, and in the FRM guidelines for projects not leveraging competitive LIHTC allocations.
Potential Risks: Type of Risk Mitigation Strategy
Operational:
• Placing additional requirements on properties located in the 100-year floodplain could reduce the number of units built (both overall and in affected communities)
• If new codes are too restrictive, focus on resiliency standards that balance financial feasibility with likelihood of limiting major property damage
Financial:
• Directing CDBG-DR funds to perform mitigation assessments would mean fewer funds available for new construction of affordable housing
• Mitigation assessments would
arguably increase available housing stock in the long-term by preventing future storm damage to vulnerable units
Political:
• Placing more stringent requirements on properties located in floodplains could be portrayed as “retreat” from vulnerable areas if it leads to less investment
• In communicating these new requirements to the public, emphasize that resilient building codes are recommended in the HUD notice and are aimed at protecting vulnerable populations
84 Department of Housing and Urban Development, “Second Allocation, Waivers, and Alternative Requirements for Grantees
Receiving CDBG-DR Funds in Response to Hurricane Sandy.” 85 Mauriello, “Mitigation Strategies for Affordable Housing.” 86 Ibid.
49
CDBG-‐DR Recommendation #5: Partner with Community Development Financial Institutions (CDFIs) to leverage their expertise in distributing funding for affordable rental housing development
Expected Impact:
A $30 million disbursement of CDBG-DR funds to CDFIs would result in the development of 1,200 units of affordable housing, assuming an estimated development cost of $100,000 per unit and a CDBG-DR-funded 25% subsidy per unit. This would allow for greater CDBG-DR leveraging than NJHMFA currently achieves: CDFIs anticipate using $25,000 of CDBG-DR funding per unit, significantly lower than NJHMFA’s use of close to $60,000 per unit through August 2013.
NJHMFA should issue a Request for Proposal to CDFIs to disburse $30 million for
affordable rental housing development. To ensure applicants have the necessary capacity to manage such a program, NJHMFA could use minimum asset and experience-based criteria to select appropriate institutions. Address unmet rental housing needs by funding smaller, non-‐profit developers
CDFIs are an important tool in New Jersey for creating affordable housing. New Jersey CDFIs have significant capacity: 17 U.S. Treasury-certified CDFIs have received more than $530 million in CDFI Fund awards and tax credits.87 New Jersey Community Capital (NJCC), the largest CDFI in the state, has invested more than $380 million in capital and has created or preserved more than 9,000 units of affordable housing. CDFIs disburse funding in a flexible, rapid manner that many financial entities, including NJHMFA, cannot accomplish. For example, after Superstorm Sandy, NJCC launched REBUILD New Jersey, a fund to provide disaster loans for small businesses that disbursed funding rapidly, often within 7 days, if the applicant met minimum criteria.88
In addition to their efficiency, CDFIs develop scattered-site and smaller-scale projects, which NJHMFA does not fund. These projects are important for addressing unmet rental housing needs, but require expertise in underwriting non-profit and smaller developers and the capacity to disburse numerous, smaller loans. While these barriers prevent NJHMFA from directly funding this type of development, CDFIs would be a natural partner.
Finally, NJHMFA did not receive any applications from eligible non-profit developers in the
2013 Sandy and non-Sandy family application cycles. Collaborating with CDFIs would allow NJHMFA to fund more non-profit developers.
87 U.S. Department of the Treasury, Community Development Financial Institutions Response to Superstorm Sandy: Impact Assessment. 88 Pinsky, Mark, “New Hope in the New Year for Sandy-Affected Businesses.”

50
The Federal government, particularly HUD, supports CDFI collaboration and partnerships
The Federal government strongly supports public-private-partnerships (PPPs) and collaboration with CDFIs. In HUD’s second tranche notice, it explicitly mentioned the benefits of working with CDFIs:
Grantees are encouraged, where appropriate, to leverage grant funds with public and private funding sources—including through infrastructure banks, Community Development Finance Institutions, and other intermediaries—and to make use of evidence-based strategies, including social impact bonds and other pay-for-success strategies.89
The Federal government further emphasized its commitment to CDFIs in the Hurricane Sandy Rebuilding Task Force, which encouraged states to leverage public, private, and philanthropic funding for affordable housing development.90
Partnering with CDFIs would allow NJHMFA to build off its success in private partnerships and prepare for future disasters
Partnering with CDFIs to develop affordable rental housing would allow NJHMFA to build off its success in leveraging private funding. NJHMFA has previously funded CDFI project development as part of its CHOICES in Homeownership Program.91 The program allowed NJHMFA and a private lender, chosen by the developer, to each provide 50% of the project financing while NJHMFA provided a subsidy to cover any gap in development costs and the sales price. In 2012, the program won awards from the Urban Land Institute and National Council of State Housing Agencies.92 Building on this experience with inter-creditor agreements would raise NJHMFA’s national profile in innovative housing development financing.
Finally, partnering with CDFIs would enable NJHMFA to increase the leveraging of CDBG-DR funds with additional sources of private capital and philanthropic dollars.
89 Department of Housing and Urban Development, “Second Allocation, Waivers, and Alternative Requirements for Grantees
Receiving CDBG-DR Funds in Response to Hurricane Sandy.” 90 Hurricane Sandy Rebuilding Task Force, Hurricane Sandy Rebuilding Strategy. 91 New Jersey Community Capital, “Jersey City’s ‘Newest Oldest Neighborhood’ Sees Conversion of 100-Year-Old School Building
| New Jersey Community Capital.” 92 Lisa Ryan, “HMFA Receives Two National Awards for Affordable Homeownership Program.”
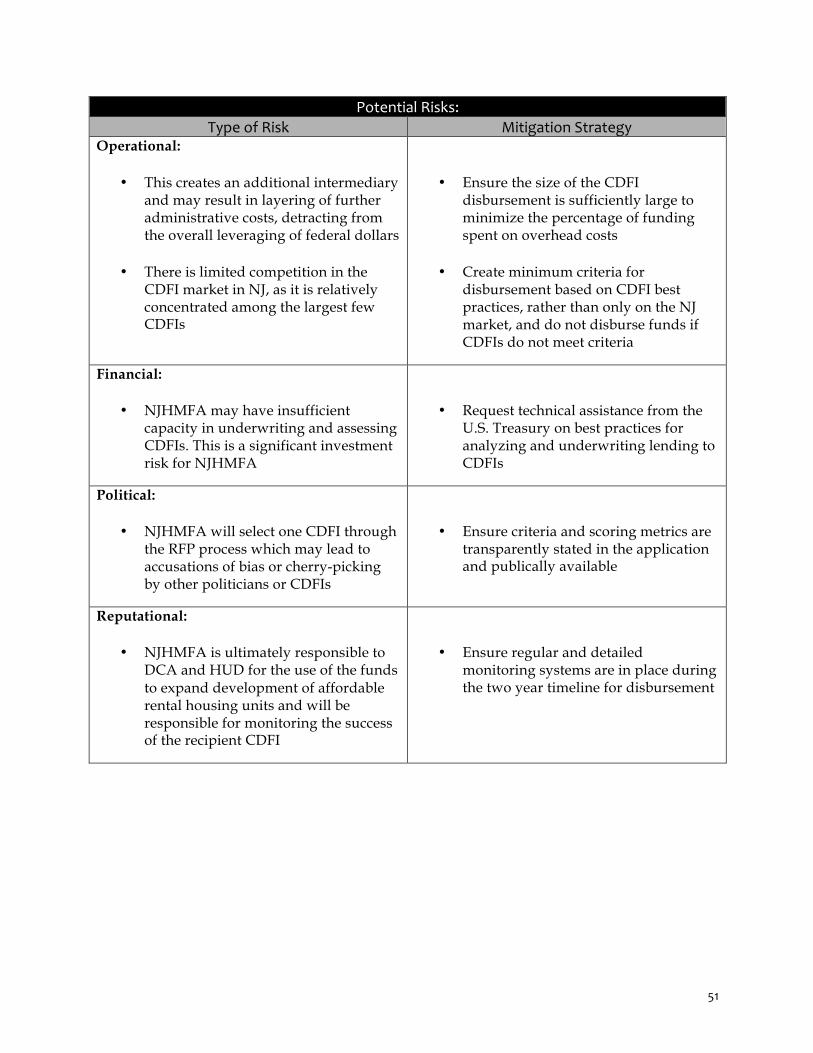
51
Potential Risks: Type of Risk Mitigation Strategy
Operational:
• This creates an additional intermediary and may result in layering of further administrative costs, detracting from the overall leveraging of federal dollars
• There is limited competition in the CDFI market in NJ, as it is relatively concentrated among the largest few CDFIs
• Ensure the size of the CDFI disbursement is sufficiently large to minimize the percentage of funding spent on overhead costs
• Create minimum criteria for disbursement based on CDFI best practices, rather than only on the NJ market, and do not disburse funds if CDFIs do not meet criteria
Financial:
• NJHMFA may have insufficient capacity in underwriting and assessing CDFIs. This is a significant investment risk for NJHMFA
• Request technical assistance from the U.S. Treasury on best practices for analyzing and underwriting lending to CDFIs
Political:
• NJHMFA will select one CDFI through the RFP process which may lead to accusations of bias or cherry-picking by other politicians or CDFIs
• Ensure criteria and scoring metrics are transparently stated in the application and publically available
Reputational:
• NJHMFA is ultimately responsible to DCA and HUD for the use of the funds to expand development of affordable rental housing units and will be responsible for monitoring the success of the recipient CDFI
• Ensure regular and detailed monitoring systems are in place during the two year timeline for disbursement
52
CDBG-‐DR Recommendation #6: Publish summary quarterly reports on FRM and SSNHF budgets, allocations, and obligations on NJHMFA’s website at http://www.state.nj.us/dca/hmfa/developers/cdbg/
Expected Impact:
Publishing data online would improve transparency and pave the way for cooperative relationships with advocacy groups.
Transparency of CDBG-DR funds is a sensitive issue. The Fair Share Housing Center has
already sued the current administration for failing to disclose how the State granted or denied eligibility for two key programs in the state’s Action Plan (Reconstruction, Rehabilitation, Elevation and Mitigation Program and Resettlement Grant; and Fund for Rehabilitation of Small Rental Properties).
Since the lawsuit, both DCA and the Office of the State Comptroller created websites
providing transparency on CDBG-DR and other post-Sandy disaster relief spending in the state.93 In addition, the federal Hurricane Sandy Rebuilding Task Force recommended that federal agencies publish data, allowing the public to monitor funds available in their community and to hold the government accountable.94 NJHMFA should continue this trend by publishing program information on its website.
The FRM and SSNHF programs are subject to additional scrutiny because of their focus on vulnerable low- and moderate-income residents. Advocates will closely monitor the second and third tranche of affordable housing allocations and the number and types of units produced. Publishing data on the disaster recovery progress would keep key stakeholders (including developers and nonprofit advocacy groups) informed of the FRM and SSNHF implementation and encourage a constructive relationship, limiting the risk of lawsuits.
This report proposes a template for a summary report which would provide more detail than what is currently available on the State’s Superstorm Sandy CDBG-DR Dashboard and in the CDBG-DR quarterly reports to HUD,95 but less detail than NJHMFA’s internal CDBG-DR status report. The sample summary report template, adapted from the Disaster Recovery Unit in the State of Louisiana’s Office of Community Development, is included in Appendix A.
93 “New Jersey Recovery Dashboard”; “NJ Sandy Transparency.” 94 Hurricane Sandy Rebuilding Task Force, Hurricane Sandy Rebuilding Strategy, 143. 95 Published at: http://www.nj.gov/dca/divisions/sandyrecovery/action/
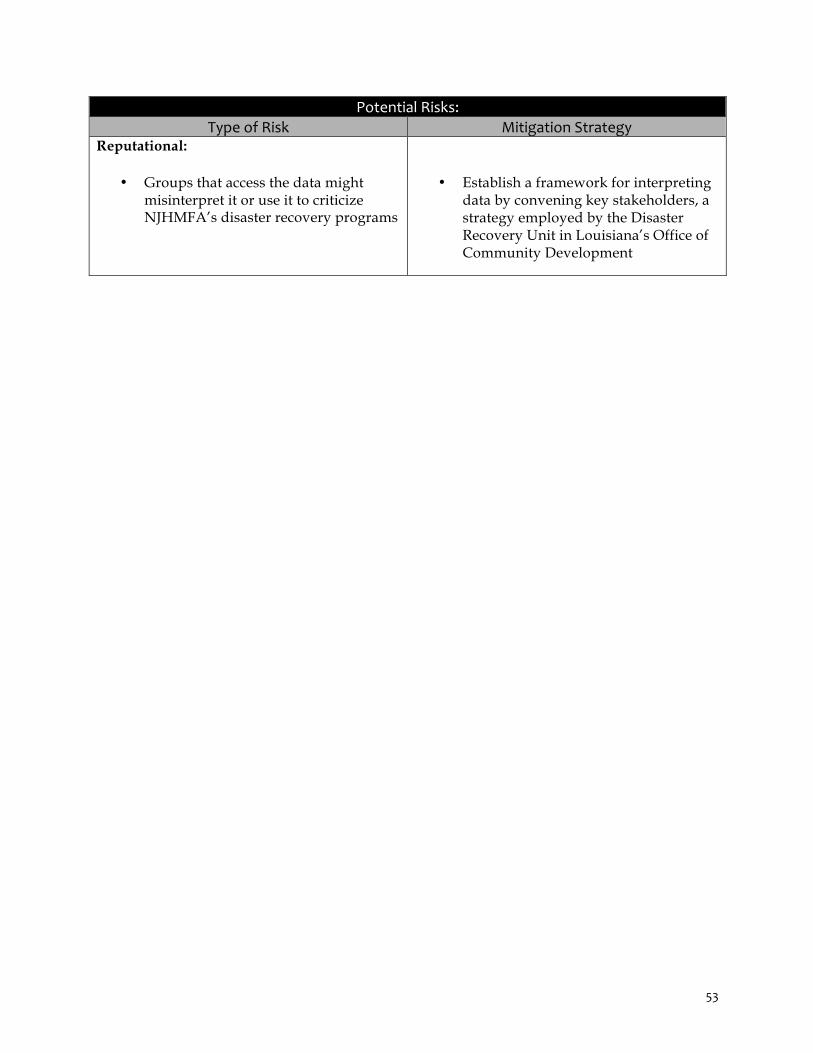
53
Potential Risks: Type of Risk Mitigation Strategy
Reputational:
• Groups that access the data might misinterpret it or use it to criticize NJHMFA’s disaster recovery programs
• Establish a framework for interpreting data by convening key stakeholders, a strategy employed by the Disaster Recovery Unit in Louisiana’s Office of Community Development
54
CDBG-‐DR Recommendation #7: Assign NJHMFA staff member to analyze data and facilitate data collaboration, particularly in disaster response
Expected Impact:
In the short term, a data analyst will enable NJHMFA to conduct the necessary internal analyses to more narrowly target second and third tranche CDBG-DR funds. In the long term, a data analyst will help NJHMFA prepare for future disasters by building institutional knowledge of internal data collection practices and federal disaster data and its limitations; such knowledge will assist the agency in crafting appropriate post-disaster responses for low- and moderate-income renters. Finally, a data analyst will help establish working relationships with key advocacy groups by sharing data and information related to the needs of low- and moderate-income renters.
Inexperience in estimating housing needs following a natural disaster limits the appropriate
distribution of disaster recovery funds, as discussed in CDBG-DR Recommendations #1 and #2. An in-house data analyst who understands the methodologies for calculating impact and unmet need, as well as the limitations of those methodologies, would allow NJHMFA to target recovery funds to low- and moderate-income tenants affected by the storm.
We recommend that the analyst undertake the following responsibilities: Recommendation 7.1: Research federal disaster data and methodologies underlying rental assistance allocations
By analyzing disaster data, NJHMFA could formulate responses that better match the impact on renters. As a starting point, the analyst could research how FEMA data was used to allocate housing funds following Sandy, as well as the methods to revise those initial estimates.96 For example, Enterprise Community Partners, the Furman Center and the Fair Share Housing Center used alternative methodologies to advocate for additional CDBG-DR allocation to renters (for a more detailed explanation, see CDBG-DR Recommendation #2).97 The State of Louisiana has also expanded on FEMA data by using Small Business Administration (SBA) economic data to assess how Hurricane Isaac affected renters in 2012.98
The federal government should reduce barriers to accessing disaster data in the coming years, particularly from the three major federal agencies involved in providing disaster relief: FEMA, HUD, and SBA. The federal Hurricane Sandy Rebuilding Task Force recommended that these agencies and all States appoint a “data steward” to facilitate data sharing following a disaster. Federal data stewards at HUD, FEMA, and SBA should “curate” their agencies’ data
96 See, for example, Furman Center for Real Estate and Urban Policy, “Furman Center and Enterprise Joint Press Release on New
FEMA Sandy Data”; Enterprise Community Partners, Measuring the Response to Hurricane Sandy: FEMA Assistance Analysis for New Jersey and New York; Enterprise Community Partners, Hurricane Sandy: Housing Needs One Year Later.
97 Interviews with New Jersey development community. 98 “Email from Louisiana Housing Corporation Re: New Impact/Needs Analysis.”
55
for state access, while state “data stewards” could funnel data requests to the federal agencies and disseminate information to local stakeholders99.
These changes at the State and federal levels should make it easier for NJHMFA personnel
to become familiar with available data and, importantly, equip NJHMFA with the information needed to craft innovative disaster recovery programs for future CDBG-DR tranches. Recommendation 7.2: In addition to QAP Recommendation #3, assess NJHMFA’s internal data collection practices and create a data inventory to inform post-‐Sandy disaster responses as well as broader affordable housing strategies
NJHMFA should assess its own data collection practices and inventory the data it collects to establish: (a) the existing information that could improve targeting of second and third round CDBG-DR funds; (b) what information is not currently collected, but might inform subsequent Sandy rounds or future disaster recovery; and (c) information that NJHMFA collects, or could collect, to improve LIHTC administration.
It might be beneficial, for example, for NJHMFA to create a database of all projects with
LIHTC awards, including information on project location, school quality, poverty rate, and other measures on which projects are judged in the QAP. Such a database would allow NJHMFA to tally aggregate project outcomes by year and comprehensively evaluate the effectiveness of changing QAP provisions on a periodic basis. Recommendation 7.3: Establish relationships with the State-‐appointed data steward and affordable housing advocates
An NJHMFA analyst could not possibly learn all of the details of federal data collection. Rather, the analyst should operate in a larger data sharing network, including other state agencies and local advocates. As the federal and state disaster data network develops, New Jersey’s “data steward” would be a key contact.
In addition, the analyst could establish working relationships with housing advocates who
have already analyzed disaster data, including Enterprise Community Partners and Fair Share Housing Center. These organizations have experience in accessing federal disaster data, applying such data to renters, and developing alternative analyses that provide more accurate need assessments. Working with these organizations would build support for NJHMFA among the advocacy community and mitigate the risk of legal action.
In our interviews with government staff in Louisiana, Mississippi, Texas, Houston, and New York City, each agency described the importance of working cooperatively with the advocacy community. In Texas and Houston, the state’s leading legal advocacy group, Texas Appleseed, successfully challenged CDBG-DR affordable housing allocations after Hurricane Ike in 2008. A resulting reconciliation agreement dictated how the second tranche of CDBG-DR funds were allocated. The State now sends plans for affordable housing projects to Texas Appleseed for courtesy review, an arrangement that the government believes is positive for affordable housing.100 99 Hurricane Sandy Rebuilding Task Force, Hurricane Sandy Rebuilding Strategy, 147–148. 100 Interview with Texas General Land Office, Disaster Recovery Unit.
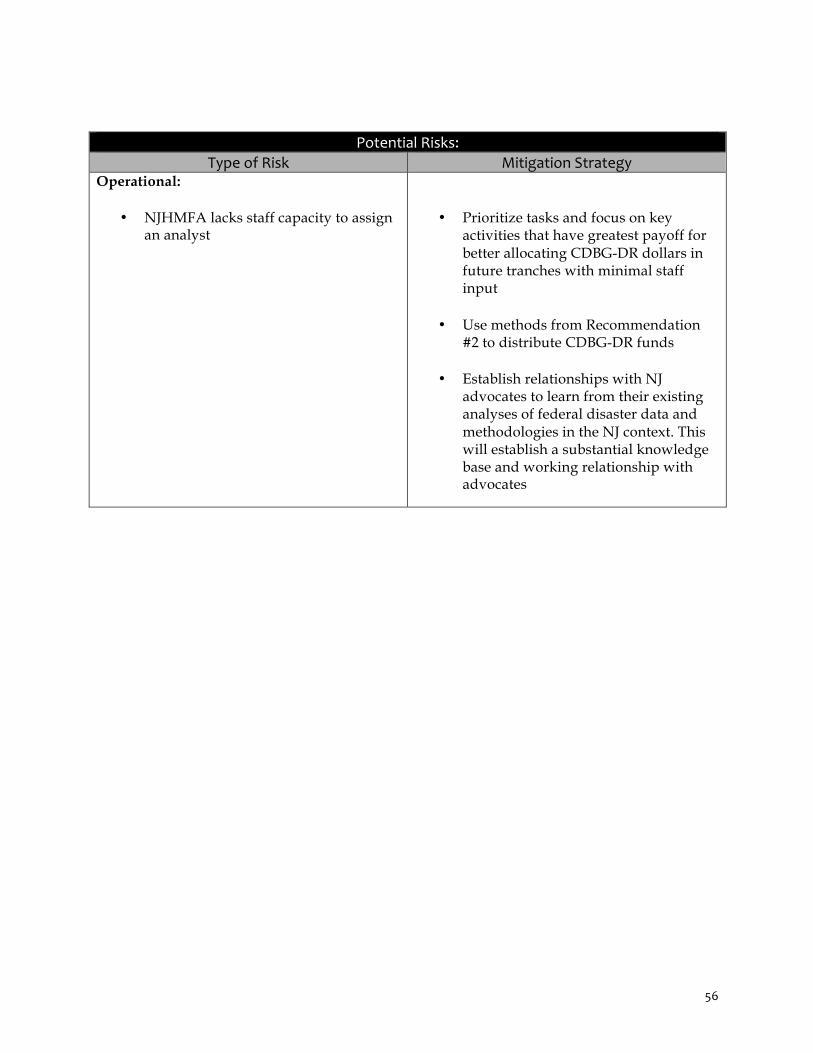
56
Potential Risks: Type of Risk Mitigation Strategy
Operational:
• NJHMFA lacks staff capacity to assign an analyst
• Prioritize tasks and focus on key activities that have greatest payoff for better allocating CDBG-DR dollars in future tranches with minimal staff input
• Use methods from Recommendation #2 to distribute CDBG-DR funds
• Establish relationships with NJ advocates to learn from their existing analyses of federal disaster data and methodologies in the NJ context. This will establish a substantial knowledge base and working relationship with advocates
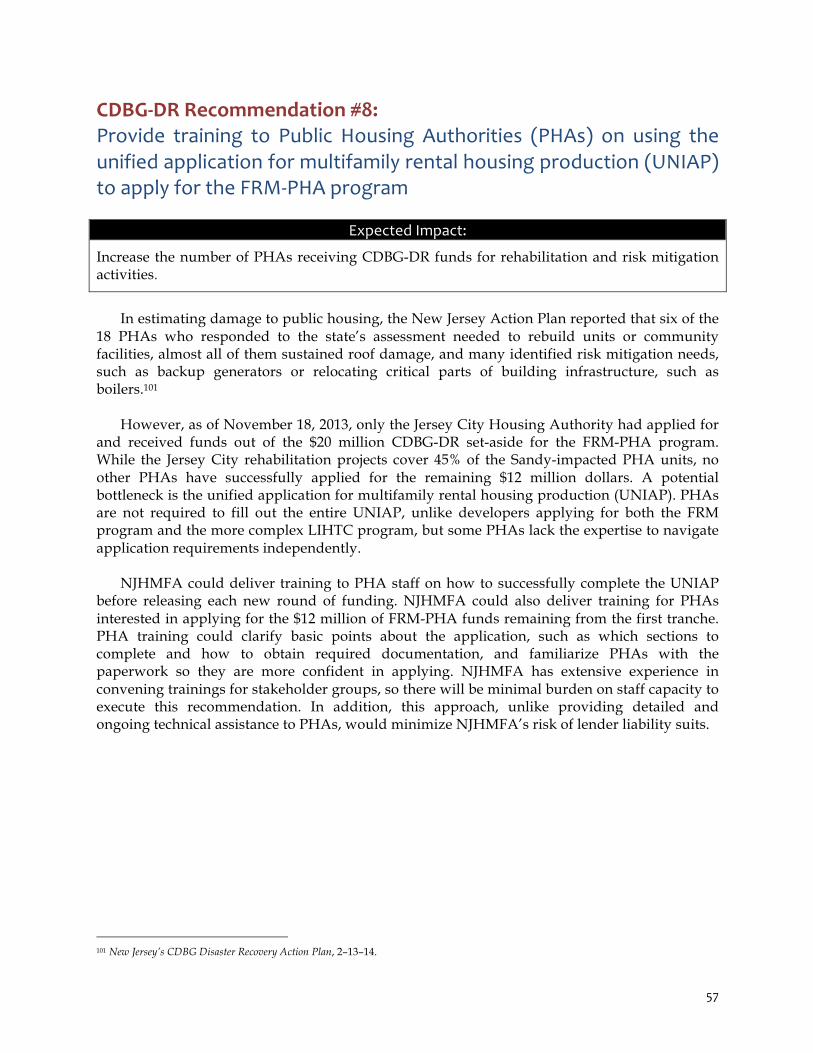
57
CDBG-‐DR Recommendation #8: Provide training to Public Housing Authorities (PHAs) on using the unified application for multifamily rental housing production (UNIAP) to apply for the FRM-‐PHA program
Expected Impact:
Increase the number of PHAs receiving CDBG-DR funds for rehabilitation and risk mitigation activities.
In estimating damage to public housing, the New Jersey Action Plan reported that six of the
18 PHAs who responded to the state’s assessment needed to rebuild units or community facilities, almost all of them sustained roof damage, and many identified risk mitigation needs, such as backup generators or relocating critical parts of building infrastructure, such as boilers.101
However, as of November 18, 2013, only the Jersey City Housing Authority had applied for
and received funds out of the $20 million CDBG-DR set-aside for the FRM-PHA program. While the Jersey City rehabilitation projects cover 45% of the Sandy-impacted PHA units, no other PHAs have successfully applied for the remaining $12 million dollars. A potential bottleneck is the unified application for multifamily rental housing production (UNIAP). PHAs are not required to fill out the entire UNIAP, unlike developers applying for both the FRM program and the more complex LIHTC program, but some PHAs lack the expertise to navigate application requirements independently.
NJHMFA could deliver training to PHA staff on how to successfully complete the UNIAP before releasing each new round of funding. NJHMFA could also deliver training for PHAs interested in applying for the $12 million of FRM-PHA funds remaining from the first tranche. PHA training could clarify basic points about the application, such as which sections to complete and how to obtain required documentation, and familiarize PHAs with the paperwork so they are more confident in applying. NJHMFA has extensive experience in convening trainings for stakeholder groups, so there will be minimal burden on staff capacity to execute this recommendation. In addition, this approach, unlike providing detailed and ongoing technical assistance to PHAs, would minimize NJHMFA’s risk of lender liability suits.
101 New Jersey’s CDBG Disaster Recovery Action Plan, 2–13–14.
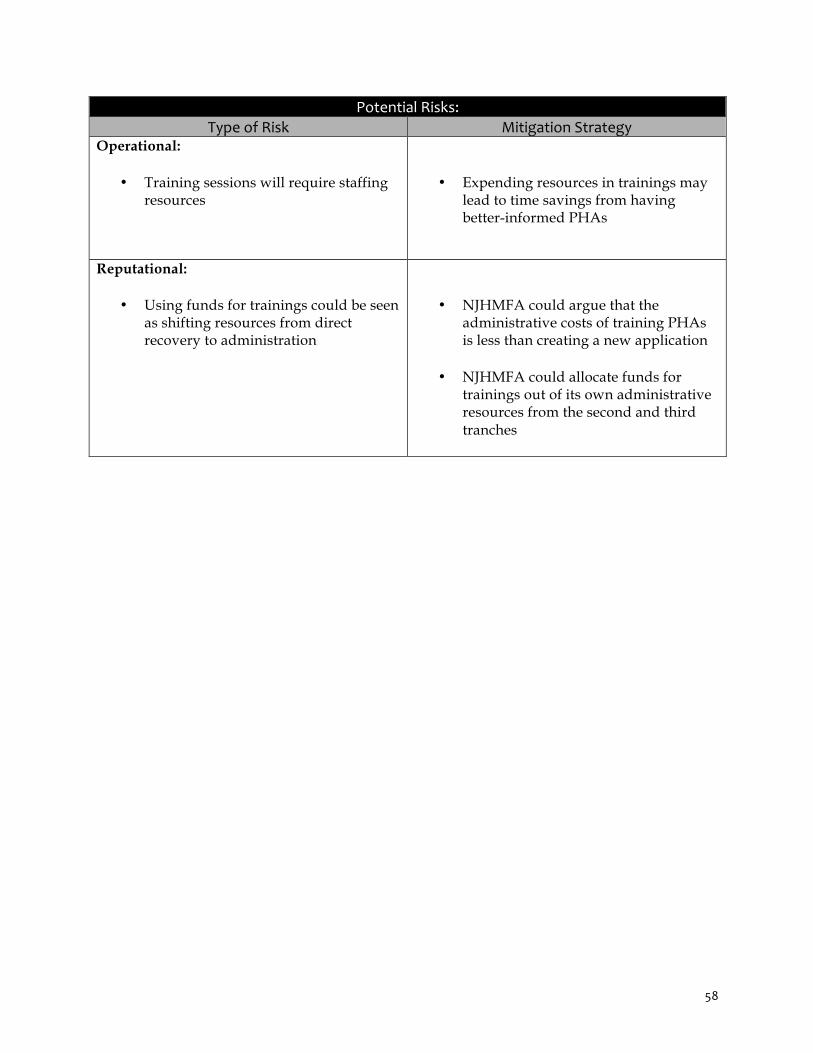
58
Potential Risks: Type of Risk Mitigation Strategy
Operational:
• Training sessions will require staffing resources
• Expending resources in trainings may lead to time savings from having better-informed PHAs
Reputational:
• Using funds for trainings could be seen as shifting resources from direct recovery to administration
• NJHMFA could argue that the administrative costs of training PHAs is less than creating a new application
• NJHMFA could allocate funds for trainings out of its own administrative resources from the second and third tranches
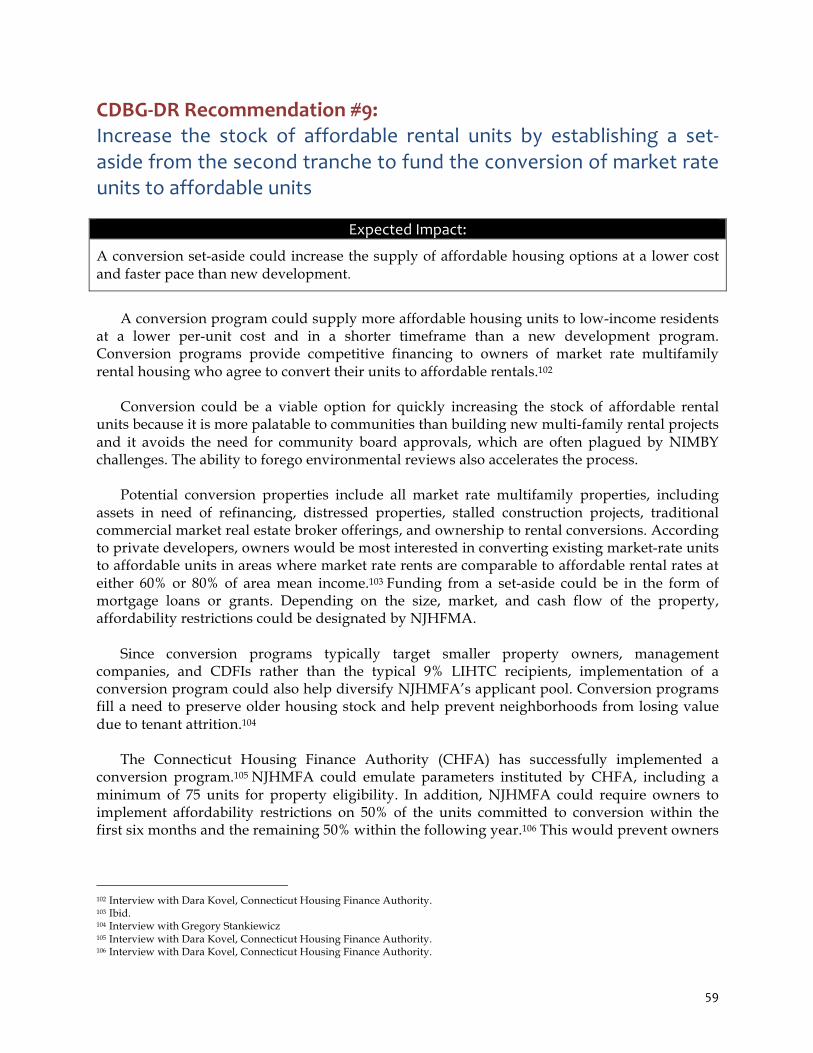
59
CDBG-‐DR Recommendation #9: Increase the stock of affordable rental units by establishing a set-‐aside from the second tranche to fund the conversion of market rate units to affordable units
Expected Impact:
A conversion set-aside could increase the supply of affordable housing options at a lower cost and faster pace than new development.
A conversion program could supply more affordable housing units to low-income residents
at a lower per-unit cost and in a shorter timeframe than a new development program. Conversion programs provide competitive financing to owners of market rate multifamily rental housing who agree to convert their units to affordable rentals.102
Conversion could be a viable option for quickly increasing the stock of affordable rental
units because it is more palatable to communities than building new multi-family rental projects and it avoids the need for community board approvals, which are often plagued by NIMBY challenges. The ability to forego environmental reviews also accelerates the process.
Potential conversion properties include all market rate multifamily properties, including assets in need of refinancing, distressed properties, stalled construction projects, traditional commercial market real estate broker offerings, and ownership to rental conversions. According to private developers, owners would be most interested in converting existing market-rate units to affordable units in areas where market rate rents are comparable to affordable rental rates at either 60% or 80% of area mean income.103 Funding from a set-aside could be in the form of mortgage loans or grants. Depending on the size, market, and cash flow of the property, affordability restrictions could be designated by NJHFMA.
Since conversion programs typically target smaller property owners, management
companies, and CDFIs rather than the typical 9% LIHTC recipients, implementation of a conversion program could also help diversify NJHMFA’s applicant pool. Conversion programs fill a need to preserve older housing stock and help prevent neighborhoods from losing value due to tenant attrition.104
The Connecticut Housing Finance Authority (CHFA) has successfully implemented a conversion program.105 NJHMFA could emulate parameters instituted by CHFA, including a minimum of 75 units for property eligibility. In addition, NJHMFA could require owners to implement affordability restrictions on 50% of the units committed to conversion within the first six months and the remaining 50% within the following year.106 This would prevent owners
102 Interview with Dara Kovel, Connecticut Housing Finance Authority. 103 Ibid. 104 Interview with Gregory Stankiewicz 105 Interview with Dara Kovel, Connecticut Housing Finance Authority. 106 Interview with Dara Kovel, Connecticut Housing Finance Authority.
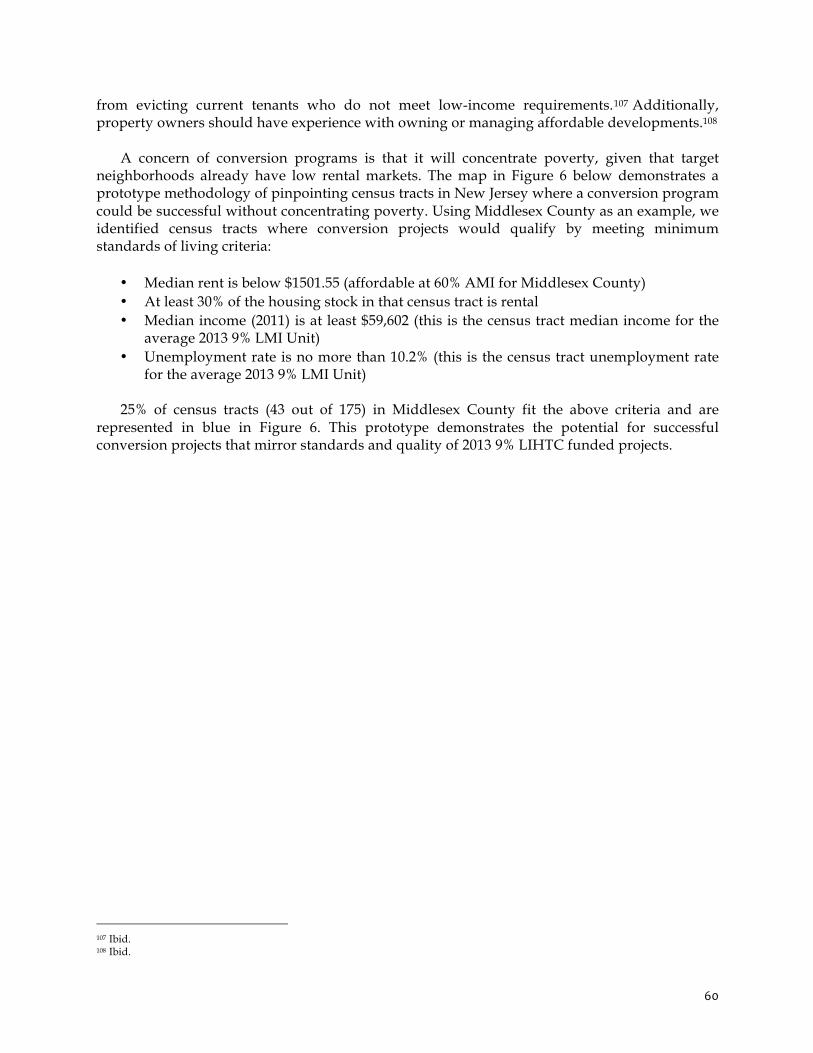
60
from evicting current tenants who do not meet low-income requirements.107 Additionally, property owners should have experience with owning or managing affordable developments.108
A concern of conversion programs is that it will concentrate poverty, given that target neighborhoods already have low rental markets. The map in Figure 6 below demonstrates a prototype methodology of pinpointing census tracts in New Jersey where a conversion program could be successful without concentrating poverty. Using Middlesex County as an example, we identified census tracts where conversion projects would qualify by meeting minimum standards of living criteria:
• Median rent is below $1501.55 (affordable at 60% AMI for Middlesex County) • At least 30% of the housing stock in that census tract is rental • Median income (2011) is at least $59,602 (this is the census tract median income for the
average 2013 9% LMI Unit) • Unemployment rate is no more than 10.2% (this is the census tract unemployment rate
for the average 2013 9% LMI Unit)
25% of census tracts (43 out of 175) in Middlesex County fit the above criteria and are represented in blue in Figure 6. This prototype demonstrates the potential for successful conversion projects that mirror standards and quality of 2013 9% LIHTC funded projects.
107 Ibid. 108 Ibid.
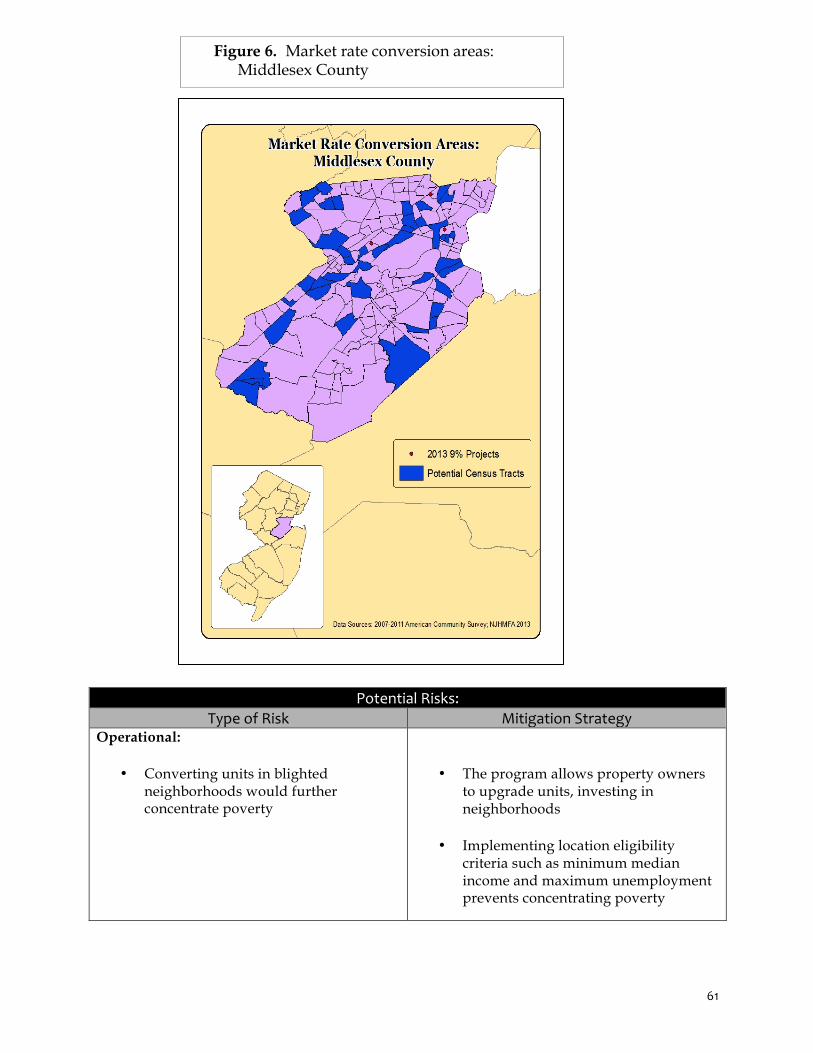
61
Potential Risks: Type of Risk Mitigation Strategy
Operational:
• Converting units in blighted neighborhoods would further concentrate poverty
• The program allows property owners to upgrade units, investing in neighborhoods
• Implementing location eligibility criteria such as minimum median income and maximum unemployment prevents concentrating poverty
Figure 6. Market rate conversion areas: Middlesex County
62
CDBG-‐DR Recommendation #10: Provide training and funding to HUD-‐approved housing counselors for rental housing counseling
Expected Impact:
Increasing the availability of rental housing counseling will improve the uptake of rental resources by low- and moderate-income displaced renters.
As of November 30, 2013, 51 HUD-approved housing counseling agencies served New
Jersey.109 Of those, only 28 listed rental counseling as a service. To ensure displaced residents have decent and stable housing, NJHMFA should train housing counselors to assist renters, not just homeowners. Alternatively, NJHMFA could expand its existing foreclosure-prevention counseling program to include rental housing counseling. NJHMFA should prioritize the needs of low- and moderate-income renters to prevent them from being permanently displaced, a prominent issue in Texas, Mississippi, and Louisiana.110
Pertinent issues rental housing counselors could address include finding families a suitable residence, budgeting, accessing resources, generating credit reports, and educating renters on the different programs available to them. Rental counselors could help families navigate the complexity of options, such as those described on the New Jersey Housing Resource Center website. Such services could complement the aid provided by the long term recovery groups, since housing needs for individuals with low- and moderate-incomes will continue long after such programs end.
Potential Risks: Type of Risk Mitigation Strategy
Financial:
• It is difficult to measure and anticipate demand for rental counseling
• Concentrate trainings and resources in areas with the highest percentage of displaced residents that are renters
109 http://www.hud.gov/offices/hsg/sfh/hcc/hcs.cfm?&webListAction=search&searchstate=NJ 110 Interview with Madison Sloan, Texas Appleseed.

63
Conclusion
This report presents 13 recommendations to enhance NJHMFA’s commendable performance in promoting affordable rental housing for low- and moderate-income New Jersey residents: three recommendations on the state’s Qualified Action Plan and ten recommendations on Sandy-related CDBG-DR programs. These recommendations are based on extensive research and interviews with federal, state, and local government staff and housing advocates from six states (TX, LA, MS, NY, CT, CA), as well as New York and New Jersey. We aimed to present recommendations that capitalize on NJHMFA’s existing strengths while envisioning how NJHMFA could continue improving its promotion of affordable housing.
As a starting point, NJHMFA’s 2013 QAP is one of the most progressive in the country. If
implemented, the three QAP recommendations would sharpen NJHFMA’s existing tools to incentivize affordable housing development in high-opportunity areas. Some recommendations would require fine-tuning of existing QAP scoring criteria, such as using school-level instead of district-level data to judge educational opportunities.
Our field research in Texas, Mississippi, Louisiana and New York yielded affordable
housing strategies and lessons learned that we incorporated into our recommendations. The following framework summarizes NJHMFA’s five principal CDBG-DR activities and Figure 7 shows how each of our CDBG-DR recommendations fit into these activities:
1. Receive CDBG-DR funds 2. Analyze how to allocate CDBG-DR funds 3. Allocate CDBG-DR funds to specific programs 4. Assist potential CDBG-DR recipients in accessing funds 5. Share progress
Throughout our research, interviewees praised NJHMFA for leveraging CDBG-DR funds to construct new affordable housing rather than limiting funds to rehabilitation and risk mitigation activities, as in other Sandy-affected areas. We hope our recommendations provide a vision for how NJHMFA could not only better address Sandy-affected renters, but also serve as a national model for other disaster-affected areas in the future.
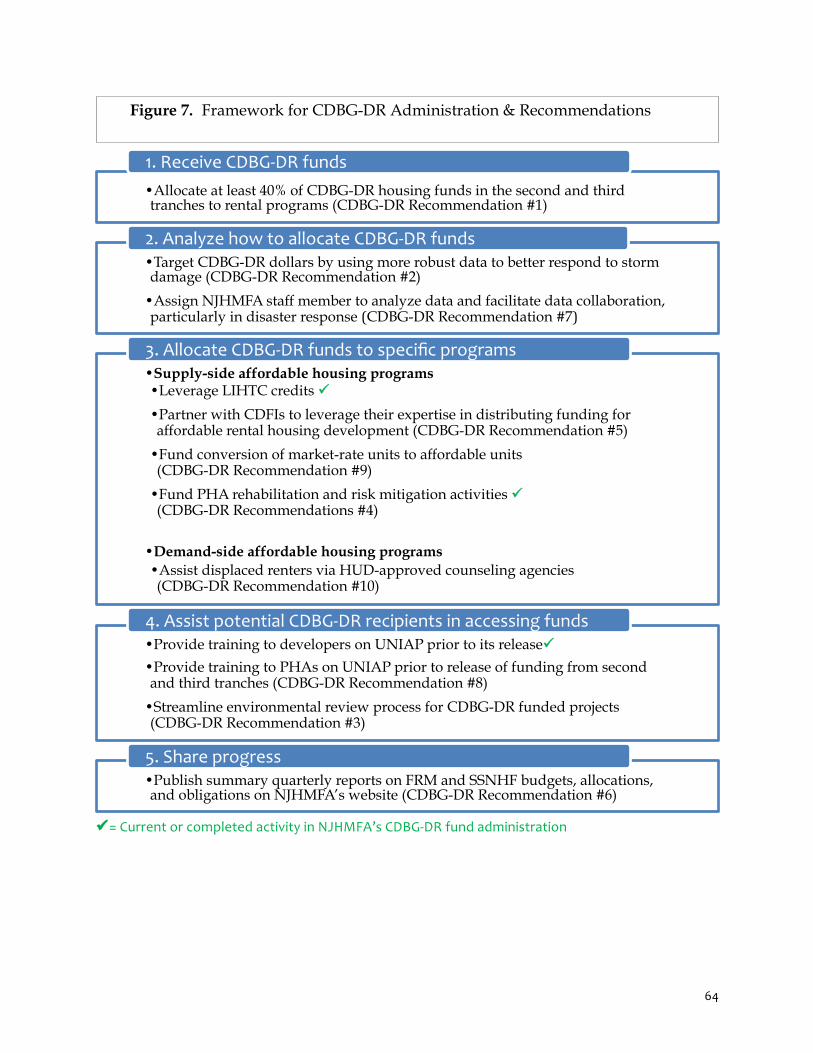
64
ü= Current or completed activity in NJHMFA’s CDBG-‐DR fund administration
• Allocate at least 40% of CDBG-DR housing funds in the second and third tranches to rental programs (CDBG-DR Recommendation #1)
1. Receive CDBG-‐DR funds
• Target CDBG-DR dollars by using more robust data to better respond to storm damage (CDBG-DR Recommendation #2)
• Assign NJHMFA staff member to analyze data and facilitate data collaboration, particularly in disaster response (CDBG-DR Recommendation #7)
2. Analyze how to allocate CDBG-‐DR funds
• Supply-side affordable housing programs • Leverage LIHTC credits ü
• Partner with CDFIs to leverage their expertise in distributing funding for affordable rental housing development (CDBG-DR Recommendation #5)
• Fund conversion of market-rate units to affordable units (CDBG-DR Recommendation #9)
• Fund PHA rehabilitation and risk mitigation activities ü (CDBG-DR Recommendations #4)
• Demand-side affordable housing programs • Assist displaced renters via HUD-approved counseling agencies (CDBG-DR Recommendation #10)
3. Allocate CDBG-‐DR funds to specific programs
• Provide training to developers on UNIAP prior to its releaseü
• Provide training to PHAs on UNIAP prior to release of funding from second and third tranches (CDBG-DR Recommendation #8)
• Streamline environmental review process for CDBG-DR funded projects (CDBG-DR Recommendation #3)
4. Assist potential CDBG-‐DR recipients in accessing funds
• Publish summary quarterly reports on FRM and SSNHF budgets, allocations, and obligations on NJHMFA’s website (CDBG-DR Recommendation #6)
5. Share progress
Figure 7. Framework for CDBG-DR Administration & Recommendations

65
Appendix Appendix A: Sample Superstorm Sandy Disaster Recovery Quarterly Progress Report
SUPERSTORM SANDY DISASTER RECOVERY QUARTERLY PROGRESS REPORT
OCTOBER - DECEMBER 2013 SCOPE The State of New Jersey has received $1.83 billion in the first round of CDBG—Disaster Recovery (CDBG-DR) funds from the U.S. Department of Housing and Urban Development for recovery from Superstorm Sandy. This report provides quarterly financial and progress updates on the three programs administered by the New Jersey Housing Mortgage and Finance Agency (NJHMFA): (1) Fund for Restoration of Large Multifamily Buildings (FRM); (2) Sandy Special Needs Housing Fund (SSNHF); and (3) Sandy Homebuyer Assistance Program (SHAP). It is intended to provide high-level progress updates by program area to the public. More details on each program can be found in the New Jersey Action Plan available at http://www.state.nj.us/dca/announcements/approved/sandy.html.
NJHMFA HOUSING RECOVERY PROGRAMS
Program Allocated Obligated Unobligated % Obl Expended % Exp
FRM $179,520,000 $115,620,398 $43,899,602 72.48% n/a n/a SSNHF $25,000,000 $7,653,462
$$17,346,53
8 30.61% n/a n/a
SHAP $25,000,000 n/a n/a n/a $530,000 2.12%
TOTAL $204,520,000 n/a n/a n/a n/a n/a FUND FOR RESTORATION OF LARGE MULTIFAMILY BUILDINGS (FRM) The fund will provide multiple funding mechanisms to facilitate the creation of quality, affordable housing units to help New Jersey recover from the loss of multi-family housing. CDBG-DR funds will be provided as zero- and low-interest loans to qualified developers to leverage 9% and 4% low-income housing tax credits, tax-exempt bonds and stand-alone financing to support development (FRM). In addition, a portion of the fund will be used to assist in the development of new permanent supportive housing units for people with special needs as well as public housing and other federally-supported housing (FRM-SSNHF). The State has also established a set-aside of $20,000,000 to provide the necessary resources to support repairs to damaged public housing units, damaged federally-owned housing units, and damaged HUD assisted multifamily housing (FRM-PHA). Budget: Sub-program Allocated Obligated Unobligated % Obl Expended % Exp Balance
FRM $179,520,000 FRM-‐SSNHF Not specified N/A FRM-‐PHA111 Not specified N/A
Indicator Target Prior Qtr Current Qtr % of Goal
Number of rental units created Number of affordable units created Number of affordable units preserved
111 PHA = public housing authority
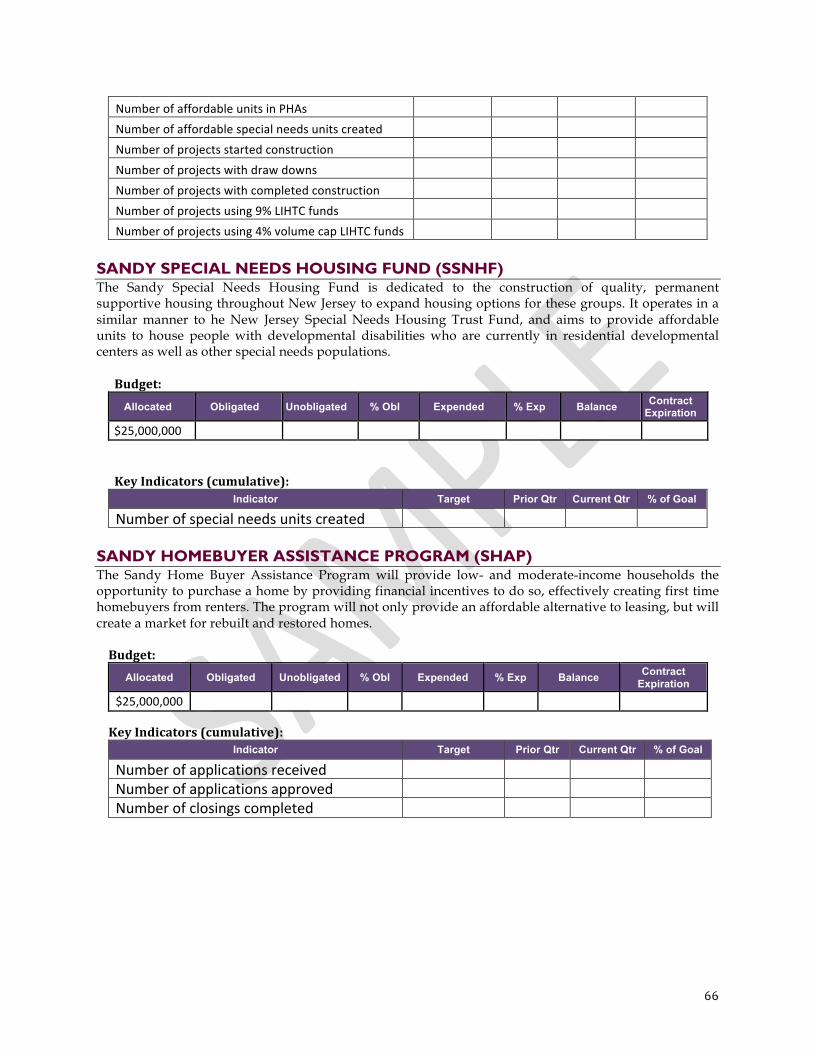
66
Number of affordable units in PHAs Number of affordable special needs units created Number of projects started construction Number of projects with draw downs Number of projects with completed construction Number of projects using 9% LIHTC funds Number of projects using 4% volume cap LIHTC funds
SANDY SPECIAL NEEDS HOUSING FUND (SSNHF) The Sandy Special Needs Housing Fund is dedicated to the construction of quality, permanent supportive housing throughout New Jersey to expand housing options for these groups. It operates in a similar manner to he New Jersey Special Needs Housing Trust Fund, and aims to provide affordable units to house people with developmental disabilities who are currently in residential developmental centers as well as other special needs populations.
Budget:
Allocated Obligated Unobligated % Obl Expended % Exp Balance Contract Expiration
$25,000,000
Key Indicators (cumulative): Indicator Target Prior Qtr Current Qtr % of Goal
Number of special needs units created SANDY HOMEBUYER ASSISTANCE PROGRAM (SHAP) The Sandy Home Buyer Assistance Program will provide low- and moderate-income households the opportunity to purchase a home by providing financial incentives to do so, effectively creating first time homebuyers from renters. The program will not only provide an affordable alternative to leasing, but will create a market for rebuilt and restored homes. Budget:
Allocated Obligated Unobligated % Obl Expended % Exp Balance Contract Expiration
$25,000,000 Key Indicators (cumulative):
Indicator Target Prior Qtr Current Qtr % of Goal
Number of applications received Number of applications approved Number of closings completed
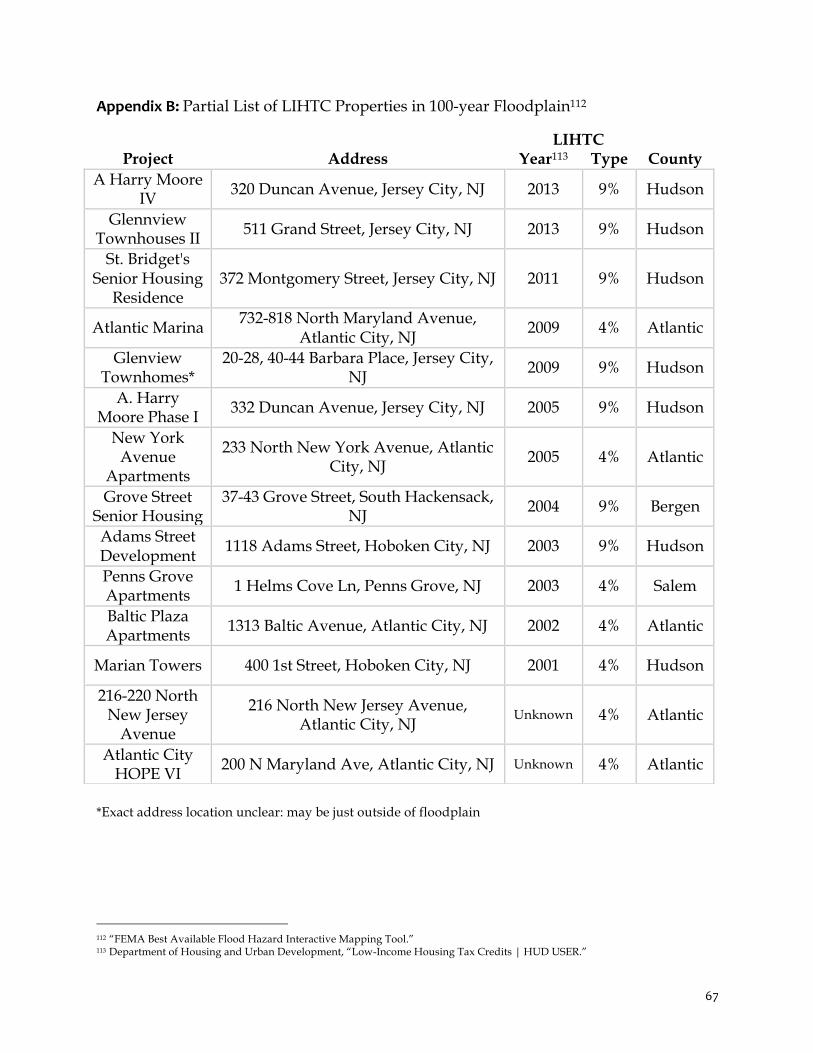
67
Appendix B: Partial List of LIHTC Properties in 100-year Floodplain112
*Exact address location unclear: may be just outside of floodplain
112 “FEMA Best Available Flood Hazard Interactive Mapping Tool.” 113 Department of Housing and Urban Development, “Low-Income Housing Tax Credits | HUD USER.”
LIHTC
Project Address Year113 Type County A Harry Moore
IV 320 Duncan Avenue, Jersey City, NJ 2013 9% Hudson
Glennview Townhouses II
511 Grand Street, Jersey City, NJ 2013 9% Hudson St. Bridget's
Senior Housing Residence
372 Montgomery Street, Jersey City, NJ 2011 9% Hudson
Atlantic Marina 732-818 North Maryland Avenue,
Atlantic City, NJ 2009 4% Atlantic
Glenview Townhomes*
20-28, 40-44 Barbara Place, Jersey City, NJ
2009 9% Hudson A. Harry
Moore Phase I 332 Duncan Avenue, Jersey City, NJ 2005 9% Hudson
New York Avenue
Apartments
233 North New York Avenue, Atlantic City, NJ
2005 4% Atlantic
Grove Street Senior Housing
37-43 Grove Street, South Hackensack, NJ
2004 9% Bergen Adams Street Development
1118 Adams Street, Hoboken City, NJ 2003 9% Hudson Penns Grove Apartments
1 Helms Cove Ln, Penns Grove, NJ 2003 4% Salem Baltic Plaza Apartments
1313 Baltic Avenue, Atlantic City, NJ 2002 4% Atlantic
Marian Towers 400 1st Street, Hoboken City, NJ 2001 4% Hudson 216-220 North
New Jersey Avenue
216 North New Jersey Avenue, Atlantic City, NJ
Unknown 4% Atlantic
Atlantic City HOPE VI
200 N Maryland Ave, Atlantic City, NJ Unknown 4% Atlantic

68
Appendix C: Housing Recovery Programs Implemented with CDBG-DR Funding
Type of Housing Program States
State-wide funding for repair and reconstruction of affordable multi-family rental housing (in the form of low or no interest loans)
TX, NY, MS, LA, CT, NJ, NY
Regional/Local level distribution of funds for affordable multi-family rental housing
TX, LA, NY
Repair and Reconstruction of Damaged Homes
TX, NY
Home Resiliency and Risk Mitigation
NY
Multi-family Property Resiliency and Risk Mitigation
NY
Home Buyout Programs
NY
Affordable Home Construction
MS
Utilizing CDBG-DR funding to increase LIHTC credit allocations
MS, LA
Set-aside for Supportive Housing Services
LA
Rental Housing Counseling
NY
Public Housing Rehabilitation
TX, NY, NJ, LA, MS
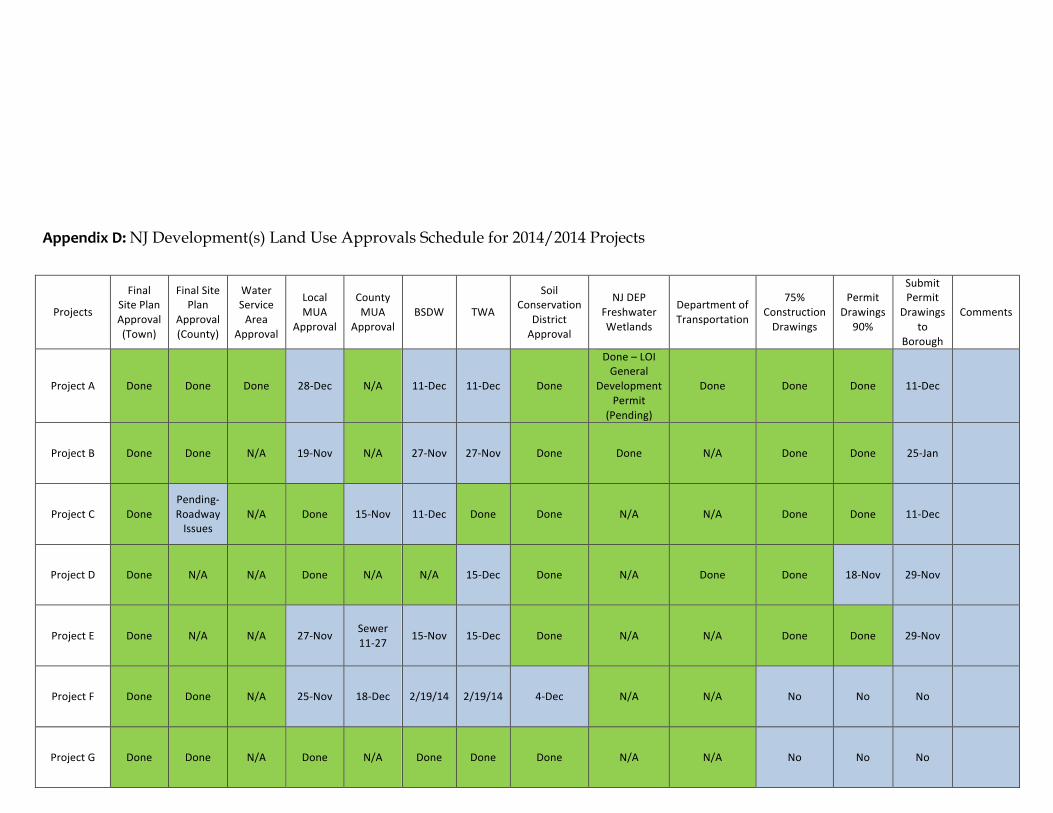
69
Appendix D: NJ Development(s) Land Use Approvals Schedule for 2014/2014 Projects
Projects
Final Site Plan Approval (Town)
Final Site Plan
Approval (County)
Water Service Area
Approval
Local MUA
Approval
County MUA
Approval BSDW TWA
Soil Conservation
District Approval
NJ DEP Freshwater Wetlands
Department of Transportation
75% Construction Drawings
Permit Drawings
90%
Submit Permit
Drawings to
Borough
Comments
Project A Done Done Done 28-‐Dec N/A 11-‐Dec 11-‐Dec Done
Done – LOI General
Development Permit
(Pending)
Done Done Done 11-‐Dec
Project B Done Done N/A 19-‐Nov N/A 27-‐Nov 27-‐Nov Done Done N/A Done Done 25-‐Jan
Project C Done Pending-‐Roadway Issues
N/A Done 15-‐Nov 11-‐Dec Done Done N/A N/A Done Done 11-‐Dec
Project D Done N/A N/A Done N/A N/A 15-‐Dec Done N/A Done Done 18-‐Nov 29-‐Nov
Project E Done N/A N/A 27-‐Nov Sewer 11-‐27 15-‐Nov 15-‐Dec Done N/A N/A Done Done 29-‐Nov
Project F Done Done N/A 25-‐Nov 18-‐Dec 2/19/14 2/19/14 4-‐Dec N/A N/A No No No
Project G Done Done N/A Done N/A Done Done Done N/A N/A No No No

70
References
“ACHP | Unified Federal Review.” Accessed November 24, 2013. http://www.achp.gov/unified_federal_review.html.
Allocations, Common Application, Waivers, and Alternative Requirements for Grantees Receiving Community Development Block Grant (CDBG) Disaster Recover Funds in Response to Hurricane Sandy, 2013.
“American FactFinder.” Accessed November 24, 2013. http://factfinder2.census.gov/faces/nav/jsf/pages/index.xhtml.
Black, Sandra E. “Do Better Schools Matter? Parental Valuation of Elementary Education.” Federal Reserve Bank of New York Research Paper #9729 (September 1997). http://www.newyorkfed.org/research/staff_reports/research_papers/9729.pdf
Blake, Eric S., Todd B. Kimberlain, Robert J. Berg, John P. Cangialosi, and John L. Beven II. Tropical Cylcone Report: Hurricane Sandy, October 2012. http://www.nhc.noaa.gov/data/tcr/AL182012_Sandy.pdf.
Bravve, Elina, Megan Bolton, and Sheila Crowley. Out of Reach 2013. National Low Income Housing Coalition, March 2013. http://nlihc.org/sites/default/files/oor/2013_OOR.pdf.
California Tax Credit Allocation Committee. 2013 Competitive 4% Federal and State Credit Application, June 6, 2013. http://www.treasurer.ca.gov/ctcac/2013/secondround/applications/fourpercent/869.pdf.
Capuzzo, Jill. “A Tilt Toward Renting.” The New York Times, May 17, 2012. http://www.nytimes.com/2012/05/20/realestate/new-jersey-in-the-region-a-tilt-toward-renting.html.
CHFA. “CHFA Low-Income Housing Tax Credit Program.” CHFA. Accessed December 21, 2013. http://www.chfa.org/Rental%20Housing/for%20Developers%20and%20Sponsors/Funding%20Initiatives/Tax%20Credit%20Programs/LIHTC%20Program.aspx.
Crozier, Jeff. Interview with Texas General Land Office, Disaster Recovery Unit, November 1, 2013. Delli Santi, Angela. “Christie Thanks Obama for Sandy Response, Urges Parties to Cooperate.” The Press
of Atlantic City, June 2013. http://www.pressofatlanticcity.com/news/breaking/aboard-n-j-chamber-of-commerce-train-to-d-c/article_205a1758-6b9e-11e2-98cc-001a4bcf887a.html?mode=jqm.
Department of Housing and Urban Development. “Low-Income Housing Tax Credits | HUD USER.” Accessed December 20, 2013. http://www.huduser.org/portal/datasets/lihtc.html#data.
———. “Second Allocation, Waivers, and Alternative Requirements for Grantees Receiving CDBG-DR Funds in Response to Hurricane Sandy,” October 2013. http://portal.hud.gov/hudportal/documents/huddoc?id=5696-n-06_cdbg-frnotice.pdf.
“Department of Human Services: Statistics and Other Resources.” Accessed November 24, 2013. http://www.state.nj.us/humanservices/ddd/programs/olmstead/oipac.html.
Enterprise Community Partners. Hurricane Sandy: Housing Needs One Year Later. Enterprise Community Partners, October 2013. https://s3.amazonaws.com/KSPProd/ERC_Upload/0083708.pdf.
———. Measuring the Response to Hurricane Sandy: FEMA Assistance Analysis for New Jersey and New York. Enterprise Community Partners and The Furman Center at NYU, March 2013.
Executive Office of the President: Council on Environmental Quality. “Unified Federal Review Letter,” May 17, 2013. http://www.saa.org/Portals/0/SAA/GovernmentAffairs/Unified%20Federal%20Review%20Letter%2017May2013.pdf.
FEMA. Mitigation Assessment Team Report: Hurricane Sandy in New Jersey and New York, November 27, 2013. http://www.fema.gov/media-library-data/1385587599782-2af51c5c5047035232256eeb8da18316/Sandy_MAT_Ch7_508post.pdf.
“FEMA Best Available Flood Hazard Interactive Mapping Tool.” Accessed November 20, 2013. http://fema.maps.arcgis.com/home/webmap/viewer.html?webmap=2f0a884bfb434d76af8c15c26541a545.
71
Fuhry, Lauren, DeCoursey, Jillian, and Wells, Walker. 2013 QAP Analysis: Green Building Criteria in Low-Income Housing Tax Credit Programs. Global Green USA, November 2013. http://globalgreen.org/pdfs/2013QAP_FINAL.pdf.
Furman Center for Real Estate and Urban Policy. “Low-Income Renters Impacted by Hurricane Sandy in Greatest Need of Assistance Suggests New Reports Released by Enterprise Community Partners and NYU’s Furman Center for Real Estate & Urban Policy,” March 6, 2013. http://furmancenter.org/files/pr/Release_Joint_Furman_Enterprise_New_FEMA_Sandy_data_030613_1.pdf.
Halpin, Stephanie Hoopes. The Impact of Superstorm Sandy on New Jersey Towns and Households. Rutgers SPAA Newark, n.d.
“Housing Assistance Data Hurricane Sandy New York & New Jersey.” Accessed October 23, 2013. http://www.fema.gov/media-library/assets/documents/30714?id=6963.
“Housing Cost Burden - Renters (New Jersey).” Accessed October 20, 2013. http://scorecard.assetsandopportunity.org/2013/measure/housing-cost-burden-renters?state=nj.
Hurricane Sandy Rebuilding Task Force. Hurricane Sandy Rebuilding Strategy, August 2013. http://portal.hud.gov/hudportal/documents/huddoc?id=HSRebuildingStrategy.pdf.
Interview with California Tax Credit Allocation Committee, December 3, 2013. Keightley, Mark. An Introduction to the Low-Income Housing Tax Credit. Congressional Research Service,
February 12, 2013. www.fas.org/sgp/crs/misc/RS22389.pdf . Khadduri, Jill. Creating Balance in the Locations of LIHTC Development: The Role of Qualified Allocation Plans.
Poverty & Race Research Action Council; Abt Associates, February 2013. http://www.prrac.org/pdf/Balance_in_the_Locations_of_LIHTC_Developments.pdf.
Laurie Schoeman. Interview with Enterprise Community Partners, November 8, 2013. Lisa Ryan. “HMFA Receives Two National Awards for Affordable Homeownership Program.” New Jersey
Housing and Mortgage Finance Agency, October 23, 2012. http://njhousing.gov/dca/hmfa/media/news/2012/approved/20121023.html.
Mantell, Nancy H., Joseph J. Seneca, Michael L. Lahr, and Will Irving. The Economic and Fiscal Impacts of Hurricane Sandy in New Jersey: A Macroeconomic Analysis. Rutgers Regional Report. Rutgers University’s Edward J. Bloustein School of Planning and Public Policy, January 2013. http://policy.rutgers.edu/reports/rrr/RRR34jan13.pdf.
“Manual for HUD Staff to Conduct an Environmental Review/U.S. Department of Housing and Urban Development (HUD).” Accessed December 1, 2013. http://portal.hud.gov/hudportal/HUD?src=/program_offices/comm_planning/environment/lawsandregs/compliance/forms/trngmanual/.
Mauriello, Mark. “Mitigation Strategies for Affordable Housing,” December 3, 2013. New Jersey Community Capital. “Jersey City’s ‘Newest Oldest Neighborhood’ Sees Conversion of 100-
Year-Old School Building | New Jersey Community Capital.” New Jersey Community Capital, June 25, 2012. http://www.newjerseycommunitycapital.org/2012/06/25/jersey-citys-newest-oldest-neighborhood-sees-conversion-of-100-year-old-school-building/.
New Jersey Department of Community Affairs. Superstorm Sandy Performance Report Q3 2013, October 2013. http://www.nj.gov/dca/divisions/sandyrecovery/pdf/Sandy3Q2013QPR.pdf.
New Jersey Department of Human Services: Division of Development Disabilities. “NJ Path to Progress,” May 2, 2007. http://nasuad.org/sites/nasuad/files/hcbs/files/110/5484/NJ_Path_to_Progress.pdf.
“New Jersey Housing and Mortgage Finance Agency - Allocation Awards - Current and Historical.” Accessed November 25, 2013. http://www.state.nj.us/dca/hmfa/developers/credits/allocations/awards.shtml.
“New Jersey Recovery Dashboard.” New Jersey Recovery Dashboard. Accessed November 30, 2013. https://www.newjerseyrebuild.org/.
New Jersey Revised Statutes. Site Remediation Reform Act P.L. 2009 c.60, 2009. http://www.nj.gov/dep/srp/regs/statutes/srra.pdf.
72
New Jersey’s CDBG Disaster Recovery Action Plan. New Jersey Department of Community Affairs, March 27, 2013.
New York State Homes and Community Renewal: Office of Community Renewal. State of New York Action Plan for Community Development Block Grant Program Disaster Recovery, April 2013. http://www.ny.gov/assets/documents/CDBGActionPlan.pdf.
“NJ Sandy Transparency.” NJ Sandy Transparency. Accessed November 30, 2013. http://nj.gov/comptroller/sandytransparency/.
“NJDEP Site Remediation Program - Restoring NJ’s Natural and Urban Resources.” Accessed November 28, 2013. http://www.state.nj.us/dep/srp/.
“Novoco LIHTC Facts & Figures.” Accessed December 2, 2013. http://www.novoco.com/low_income_housing/facts_figures/.
Office of Community Planning and Development, U.S. Department of Housing and Urban Development. “Environmental Review Guide for Community Development Block Grant Programs,” n.d. http://development.ohio.gov/files/cs/ERGuideforCDBGP.pdf.
Pinsky, Mark. “New Hope in the New Year for Sandy-Affected Businesses.” The Huffington Post, January 14, 2013. http://www.huffingtonpost.com/mark-pinsky/new-hope-in-the-new-year_b_2473466.html.
“Program Manager Contractor and Environmental Assessment Field Contractors for Environmental and Histroic Preservation Reviews New Jersey’s CDBG-DR Grant Program.” Accessed December 1, 2013. http://nj.gov/comptroller/sandytransparency/contracts/pdf/berger_solicitation.pdf.
Sanders, Matthew. “Email from Louisiana Housing Corporation Re: New Impact/Needs Analysis,” November 21, 2013.
“Sandy Recovery Improvement Act of 2013,” January 29, 2013. http://www.gpo.gov/fdsys/pkg/PLAW-113publ2/html/PLAW-113publ2.htm.
“Second Allocation, Waivers, and Alternative Requirements for Grantees Receiving Community Development Block Grant (CDBG) Disaster Recovery Funds in Response to Hurricane Sandy.” Accessed November 24, 2013. http://portal.hud.gov/hudportal/documents/huddoc?id=5696-n-06_cdbg-frnotice.pdf.
Service Assessment: Hurricane/Post-Tropical Cyclone Sandy, October 22-29, 2012. National Oceanic and Atmospheric Administration, May 2013. www.nws.noaa.gov/os/assessments/pdfs/Sandy13.pdf .
“Study Credits CRA for Motivating LIHTC Investment.” Housing Finance. Accessed December 2, 2013. http://www.housingfinance.com/lihtc/the-cra-effect.aspx.
Superstorm Sandy Survey: Impact on New Jersey Coastal Residents. Monmouth University Polling Institute & Jersey Shore Partnership Foundation, n.d. http://www.monmouth.edu/assets/0/32212254770/32212254991/32212254992/32212254994/32212254995/30064771087/706eded0-a50e-49b2-8db2-30febe55399e.pdf.
U.S. Department of the Treasury. Community Development Financial Institutions Response to Superstorm Sandy: Impact Assessment. U.S. Department of the Treasury, 2013.
“Written Testimony of Yolanda Chavez Deputy Assistant Secretary for Grant Programs, Office of Community Planning and Development, U.S. Department of Housing and Urban Development (HUD) Hearing before the House Subcommittee on Economic Development, Public Buildings and Emergency Management.” Accessed December 1, 2013. http://transport.house.gov/uploadedfiles/documents/2013-09-18-chavez.pdf.
“Year-Round Renters Struggle to Find Homes after Hurricane Sandy.” NJ.com. Accessed October 20, 2013. http://www.nj.com/hurricanesandy/2013/06/year-round_renters_struggle_to.html.