Embed Size (px)
Citation preview
65Zn: A Measurement of Electron-Capture Decays UsingData from the KDK Experiment
Lilianna Hariasz
(Queen’s University)On behalf of the KDK collaboration
Winter Nuclear & Particle Physics Virtual ConferenceFebruary 11, 2021
1 / 27
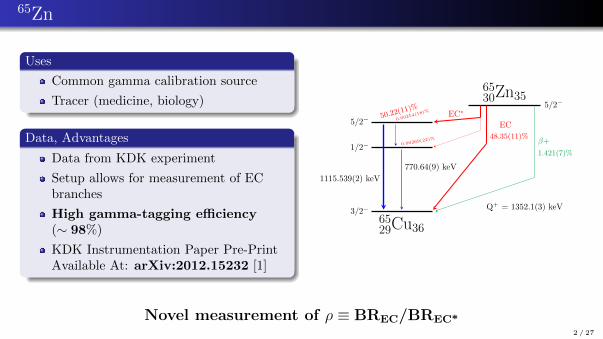
65Zn
Uses
Common gamma calibration source
Tracer (medicine, biology)
Data, Advantages
Data from KDK experiment
Setup allows for measurement of ECbranches
High gamma-tagging efficiency(∼ 98%)
KDK Instrumentation Paper Pre-PrintAvailable At: arXiv:2012.15232 [1]
6530Zn35
5/2−
5/2−50.22(11)%
0.00254
(18)%
1/2−0.002
69(22)%
3/2−
6529Cu36
EC∗
EC
48.35(11)%
1115.539(2) keV
770.64(9) keV
β+
1.421(7)%
Q+ = 1352.1(3) keV
Novel measurement of ρ ≡ BREC/BREC*2 / 27
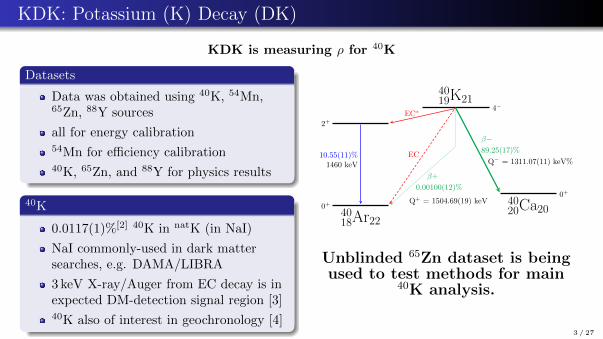
KDK: Potassium (K) Decay (DK)
KDK is measuring ρ for 40K
Datasets
Data was obtained using 40K, 54Mn,65Zn, 88Y sources
all for energy calibration54Mn for efficiency calibration40K, 65Zn, and 88Y for physics results
40K
0.0117(1)%[2] 40K in natK (in NaI)
NaI commonly-used in dark mattersearches, e.g. DAMA/LIBRA
3 keV X-ray/Auger from EC decay is inexpected DM-detection signal region [3]40K also of interest in geochronology [4]
4019K21
4−
2+
0+
4018Ar22
4020Ca20
0+
EC∗
EC10.55(11)%1460 keV
β+
0.00100(12)%
Q+ = 1504.69(19) keV
β−89.25(17)%
Q− = 1311.07(11) keV%
Unblinded 65Zn dataset is beingused to test methods for main
40K analysis.
3 / 27
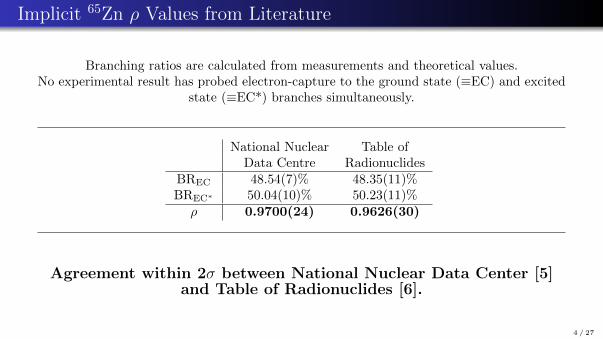
Implicit 65Zn ρ Values from Literature
Branching ratios are calculated from measurements and theoretical values.No experimental result has probed electron-capture to the ground state (≡EC) and excited
state (≡EC*) branches simultaneously.
National Nuclear Table ofData Centre Radionuclides
BREC 48.54(7)% 48.35(11)%BREC∗ 50.04(10)% 50.23(11)%ρ 0.9700(24) 0.9626(30)
Agreement within 2σ between National Nuclear Data Center [5]and Table of Radionuclides [6].
4 / 27
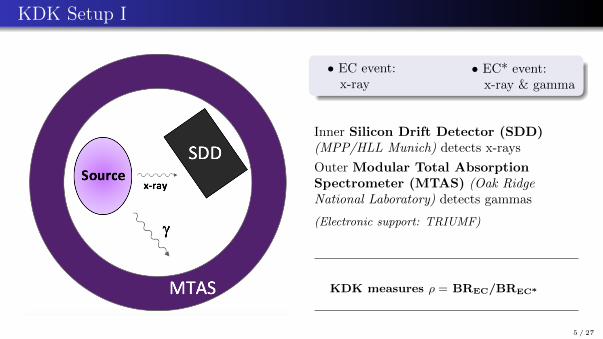
KDK Setup I
• EC event:x-ray
• EC* event:x-ray & gamma
Inner Silicon Drift Detector (SDD)(MPP/HLL Munich) detects x-rays
Outer Modular Total AbsorptionSpectrometer (MTAS) (Oak RidgeNational Laboratory) detects gammas
(Electronic support: TRIUMF)
KDK measures ρ = BREC/BREC*
5 / 27
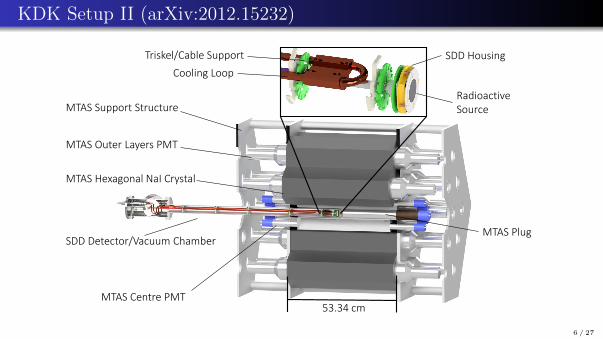
KDK Setup II (arXiv:2012.15232)
MTAS Support Structure
MTAS Outer Layers PMT
MTAS Hexagonal NaI Crystal
SDD Detector/Vacuum Chamber
MTAS Centre PMT
MTAS Plug
SDD HousingTriskel/Cable Support
Cooling Loop
Radioactive Source
53.34 cm
6 / 27
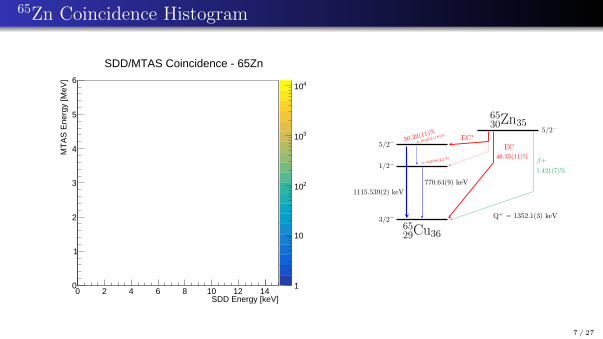
65Zn Coincidence Histogram
0 2 4 6 8 10 12 14SDD Energy [keV]
0
1
2
3
4
5
6
MT
AS
Ene
rgy
[MeV
]
1
10
210
310
410
SDD/MTAS Coincidence - 65Zn
6530Zn35
5/2−
5/2−50.22(11)%
0.00254
(18)%
1/2−0.002
69(22)%
3/2−
6529Cu36
EC∗
EC
48.35(11)%
1115.539(2) keV
770.64(9) keV
β+
1.421(7)%
Q+ = 1352.1(3) keV
7 / 27
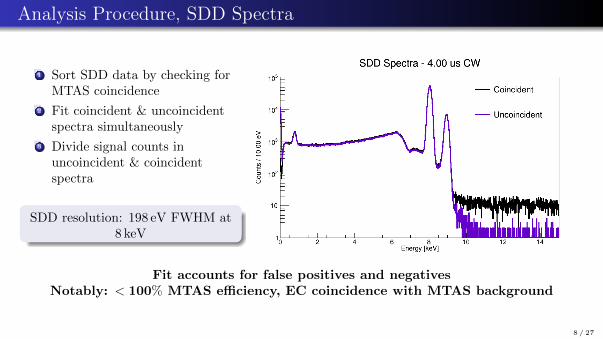
Analysis Procedure, SDD Spectra
1 Sort SDD data by checking forMTAS coincidence
2 Fit coincident & uncoincidentspectra simultaneously
3 Divide signal counts inuncoincident & coincidentspectra
SDD resolution: 198 eV FWHM at8 keV
Fit accounts for false positives and negativesNotably: < 100% MTAS efficiency, EC coincidence with MTAS background
8 / 27
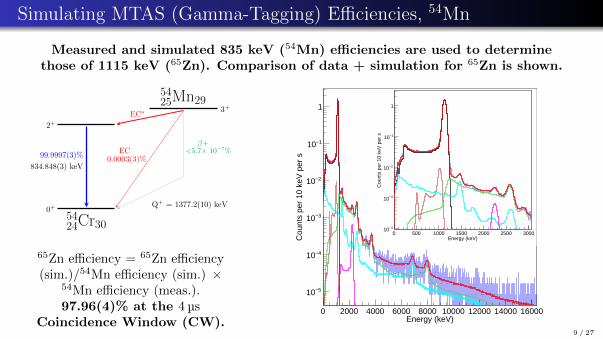
Simulating MTAS (Gamma-Tagging) Efficiencies, 54Mn
Measured and simulated 835 keV (54Mn) efficiencies are used to determinethose of 1115 keV (65Zn). Comparison of data + simulation for 65Zn is shown.
5425Mn29
3+
2+
0+
5424Cr30
EC∗
EC0.0003(3)%99.9997(3)%
834.848(3) keV
β+<5.7× 10⁻⁷%
Q+ = 1377.2(10) keV
65Zn efficiency = 65Zn efficiency(sim.)/54Mn efficiency (sim.) ×
54Mn efficiency (meas.).97.96(4)% at the 4 µs
Coincidence Window (CW).0 2000 4000 6000 8000 10000 12000 14000 16000
Energy (keV)
5−10
4−10
3−10
2−10
1−10
1
Cou
nts
per
10 k
eV p
er s
0 500 1000 1500 2000 2500 3000Energy (keV)
4−10
3−10
2−10
1−10
1
Cou
nts
per
10 k
eV p
er s
9 / 27
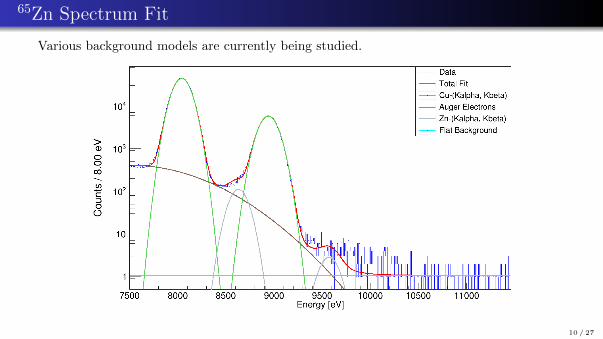
65Zn Spectrum Fit
Various background models are currently being studied.
10 / 27
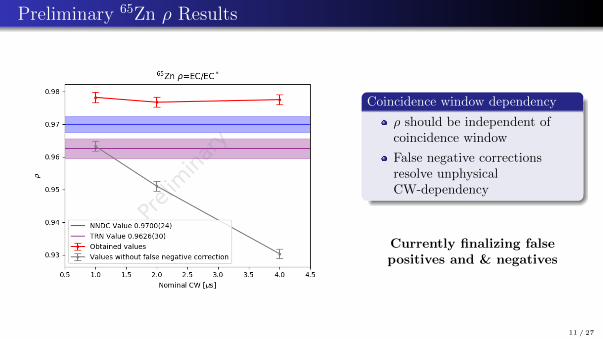
Preliminary 65Zn ρ Results
Coincidence window dependency
ρ should be independent ofcoincidence window
False negative correctionsresolve unphysicalCW-dependency
Currently finalizing falsepositives and & negatives
11 / 27
Summary
KDK is measuring several rare decays, with results applicable to many fields
The 65Zn dataset obtained as part of KDK is being used to test analysis methods, andto obtain physics results
The apparatus, featuring a high-efficiency gamma detector and high-resolution x-raydetector, provides a novel measurement method for 65Zn decays
False positive and false negative corrections are ongoing
Final results to be published in the near future
[7, 5, 6]
12 / 27
Thank you to the KDK Collaboration
N. Brewer1, H. Davis2,3, P.C.F. Di Stefano4, E. Lukosi2,3, B.C. Rasco1,K.P. Rykaczewski1, M. Stukel4, and the KDK Collaboration
1Oak Ridge National Laboratory Physics Division, Oak Ridge, TN, U.S.A, 2Department of
Nuclear Engineering, University of Tennessee, Knoxville, TN, USA, 3Joint Institute for Nuclear
Physics and Applications, Oak Ridge, TN, U.S.A, 4Queen’s University, Kingston, Ontario,
Canada
13 / 27
References I
[1] M. Stukel, B. C. Rasco, N. T. Brewer, P. C. F. Di Stefano, K. P. Rykaczewski,H. Davis, E. D. Lukosi, L. Hariasz, M. Constable, P. Davis, K. Dering, A. Fija lkowska,Z. Gai, K. C. Goetz, R. K. Grzywacz, J. Kostensalo, J. Ninkovic, P. Lechner, Y. Liu,M. Mancuso, C. L. Melcher, F. Petricca, C. Rouleau, P. Squillari, L. Stand, D. W.Stracener, J. Suhonen, M. Wolinska-Cichocka, and I. Yavin.A novel experimental system for the kdk measurement of the 40k decay scheme relevantfor rare event searches.arXiv:2012.15232, 2020.
[2] Jun Chen.Nuclear data sheets for a= 40.Nuclear Data Sheets, 140:1–376, 2017.
[3] Josef Pradler, Balraj Singh, and Itay Yavin.On an unverified nuclear decay and its role in the dama experiment.Physics Letters B, 720(4-5):399–404, 2013.
14 / 27
References II
[4] Jack Carter, Ryan B Ickert, Darren F Mark, Marissa M Tremblay, Alan J Cresswell,and David CW Sanderson.Production of 40 Ar by an overlooked mode of 40 K decay with implications for K-Argeochronology.Geochronology, 2(2):355–365, 2020.
[5] E. Browne and J.K. Tuli.Nuclear Data Sheets for A = 65.Nuclear Data Sheets, 111(9):2425–2553, September 2010.
[6] M. M. Be, V. Chiste, C. Dulieu, E. Browne, C. Baglin, V. Chechev, N. Kuzmenco,R. Helmer, F. Kondev, and D. MacMahon.Table of Radionuclides (vol. 3–A= 3 to 244).Monographie BIPM, 5, 2006.
15 / 27
References III
[7] P. C. F. Di Stefano, N. Brewer, A. Fijalkowska, Z. Gai, K. C. Goetz, R. Grzywacz,D. Hamm, P. Lechner, Y. Liu, and E. Lukosi.The KDK (potassium decay) experiment.In Journal of Physics: Conference Series, volume 1342, page 012062. IOP Publishing,2020.
[8] Marie-Martin Be, Venassa Chiste, C Dulieu, X Mougeot, V Chechev, F Kondev,A Nichols, X Huang, and B Wang.Table of radionuclides (comments on evaluations).Monographie BIPM-5, 7, 1999.
16 / 27

Extra Slides
17 / 27
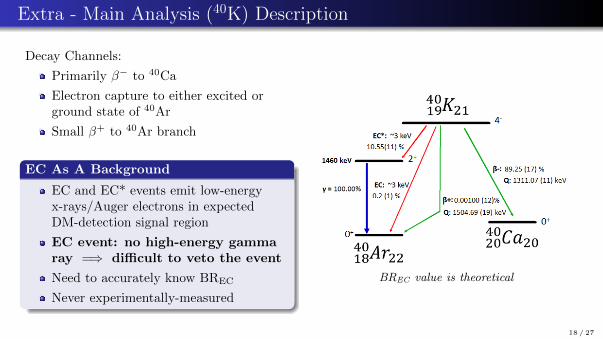
Extra - Main Analysis (40K) Description
Decay Channels:
Primarily β− to 40Ca
Electron capture to either excited orground state of 40Ar
Small β+ to 40Ar branch
EC As A Background
EC and EC* events emit low-energyx-rays/Auger electrons in expectedDM-detection signal region
EC event: no high-energy gammaray =⇒ difficult to veto the event
Need to accurately know BREC
Never experimentally-measured
BREC value is theoretical
18 / 27
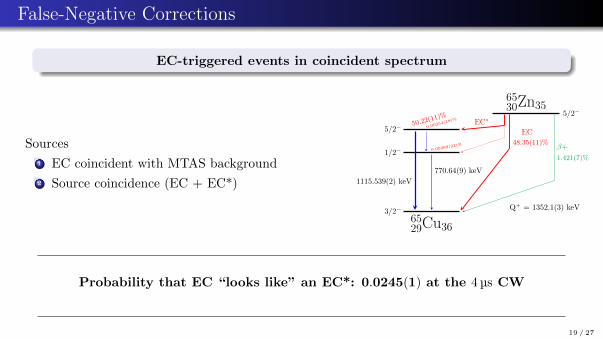
False-Negative Corrections
EC-triggered events in coincident spectrum
Sources
1 EC coincident with MTAS background
2 Source coincidence (EC + EC*)
6530Zn35
5/2−
5/2−50.22(11)%
0.00254
(18)%
1/2−0.002
69(22)%
3/2−
6529Cu36
EC∗
EC
48.35(11)%
1115.539(2) keV
770.64(9) keV
β+
1.421(7)%
Q+ = 1352.1(3) keV
Probability that EC “looks like” an EC*: 0.0245(1) at the 4 µs CW
19 / 27
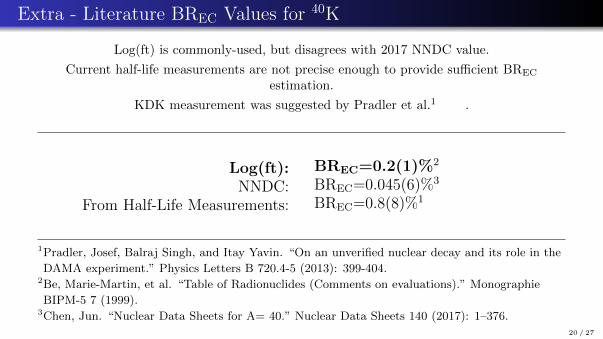
Extra - Literature BREC Values for 40K
Log(ft) is commonly-used, but disagrees with 2017 NNDC value.
Current half-life measurements are not precise enough to provide sufficient BREC
estimation.
KDK measurement was suggested by Pradler et al.1 ([3]).
Log(ft):NNDC:
From Half-Life Measurements:
BREC=0.2(1)%2[8]BREC=0.045(6)%3[2]BREC=0.8(8)%1[3]
1Pradler, Josef, Balraj Singh, and Itay Yavin. “On an unverified nuclear decay and its role in the1DAMA experiment.” Physics Letters B 720.4-5 (2013): 399-404.2Be, Marie-Martin, et al. “Table of Radionuclides (Comments on evaluations).” Monographie1BIPM-5 7 (1999).3Chen, Jun. “Nuclear Data Sheets for A= 40.” Nuclear Data Sheets 140 (2017): 1–376.
20 / 27
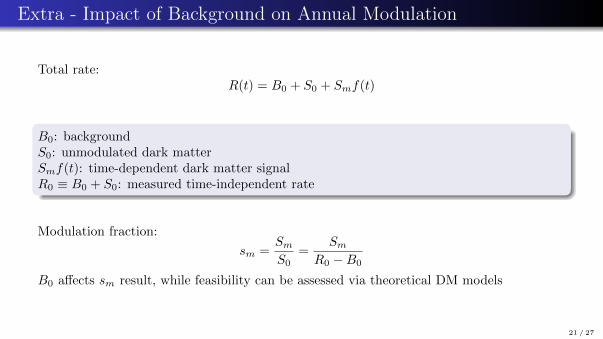
Extra - Impact of Background on Annual Modulation
Total rate:R(t) = B0 + S0 + Smf(t)
B0: backgroundS0: unmodulated dark matterSmf(t): time-dependent dark matter signalR0 ≡ B0 + S0: measured time-independent rate
Modulation fraction:
sm =SmS0
=Sm
R0 −B0
B0 affects sm result, while feasibility can be assessed via theoretical DM models
21 / 27
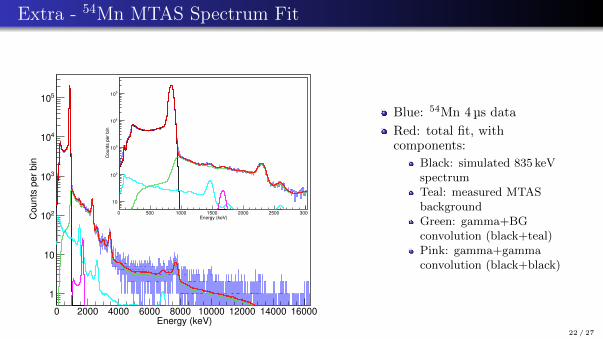
Extra - 54Mn MTAS Spectrum Fit
Energy (keV)0 2000 4000 6000 8000 10000 12000 14000 16000
Counts
per
bin
1
10
210
310
410
510
Energy (keV)0 500 1000 1500 2000 2500 3000
Co
un
ts p
er
bin
10
210
310
410
510
Blue: 54Mn 4 µs data
Red: total fit, withcomponents:
Black: simulated 835 keVspectrumTeal: measured MTASbackgroundGreen: gamma+BGconvolution (black+teal)Pink: gamma+gammaconvolution (black+black)
22 / 27
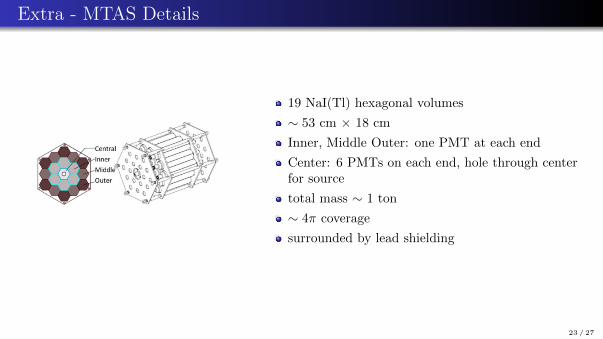
Extra - MTAS Details
19 NaI(Tl) hexagonal volumes
∼ 53 cm × 18 cm
Inner, Middle Outer: one PMT at each end
Center: 6 PMTs on each end, hole through centerfor source
total mass ∼ 1 ton
∼ 4π coverage
surrounded by lead shielding
23 / 27
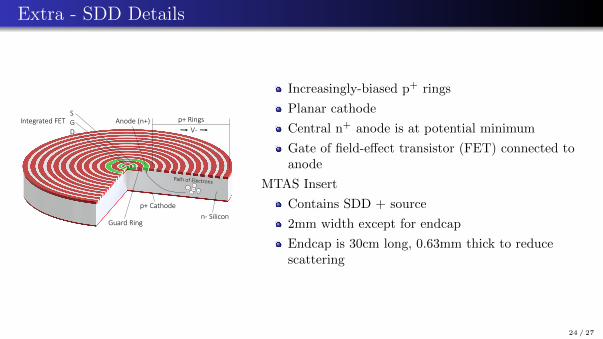
Extra - SDD Details
p+ Rings
V-
p+ Cathode
Anode (n+)
n- SiliconGuard Ring
Integrated FETSGD
Increasingly-biased p+ rings
Planar cathode
Central n+ anode is at potential minimum
Gate of field-effect transistor (FET) connected toanode
MTAS Insert
Contains SDD + source
2mm width except for endcap
Endcap is 30cm long, 0.63mm thick to reducescattering
24 / 27
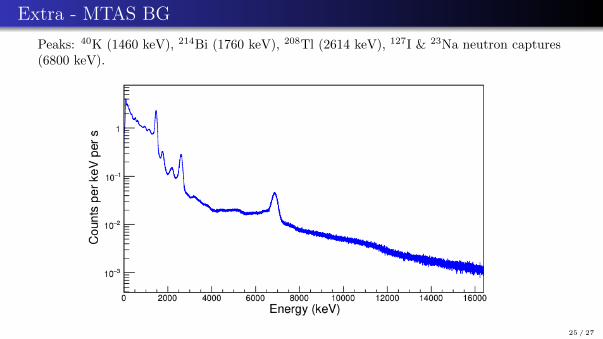
Extra - MTAS BG
Peaks: 40K (1460 keV), 214Bi (1760 keV), 208Tl (2614 keV), 127I & 23Na neutron captures(6800 keV).
25 / 27
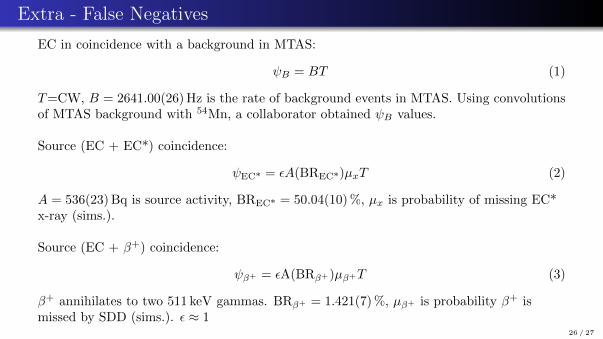
Extra - False Negatives
EC in coincidence with a background in MTAS:
ψB = BT (1)
T=CW, B = 2641.00(26) Hz is the rate of background events in MTAS. Using convolutionsof MTAS background with 54Mn, a collaborator obtained ψB values.
Source (EC + EC*) coincidence:
ψEC* = εA(BREC*)µxT (2)
A = 536(23) Bq is source activity, BREC* = 50.04(10) %, µx is probability of missing EC*x-ray (sims.).
Source (EC + β+) coincidence:
ψβ+ = εA(BRβ+)µβ+T (3)
β+ annihilates to two 511 keV gammas. BRβ+ = 1.421(7) %, µβ+ is probability β+ ismissed by SDD (sims.). ε ≈ 1
26 / 27
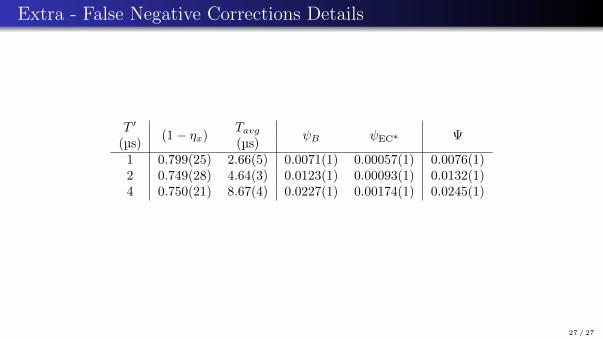
Extra - False Negative Corrections Details
T ′(1− ηx)
Tavg ψB ψEC* Ψ(µs) (µs)
1 0.799(25) 2.66(5) 0.0071(1) 0.00057(1) 0.0076(1)2 0.749(28) 4.64(3) 0.0123(1) 0.00093(1) 0.0132(1)4 0.750(21) 8.67(4) 0.0227(1) 0.00174(1) 0.0245(1)
27 / 27


![arXiv:1905.09407v2 [astro-ph.SR] 28 May 2019 · 2 electron capture on 20 Ne at somewhat higher densities. Previous studies [5{7,10{14] have considered that elec-tron capture on 20](https://img.pdfslide.tips/doc/110x75/5f4fb906df27e54bc0072d72/arxiv190509407v2-astro-phsr-28-may-2019-2-electron-capture-on-20-ne-at-somewhat.jpg)