Embed Size (px)
Citation preview
������������� ����� ����������������������
��������������� �������������������������
������������������������� �
Nanggroe Aceh Darrussalam Bali Jln. Tgk. H. M. Daud Beureueh No. 50 Jl. Raya Puputan No. 1 Renon, DenpasarBanda Aceh Telp./Fax: (0651) 23005 / 33632 Telp./Fax: (0361) 238159 / 238162Email: [email protected] E-mail : [email protected]
Sumatera Utara Nusa Tenggara Barat Jln. Asrama No. 179, Medan-20123 Jl. Gunung Rinjani No. 2 , Mataram 83125Telp./Fax: (061) 8452343 / 8459966 Telp./Fax: (0370) 641242 / 623801 E-mail : [email protected] E-mail: [email protected]
Sumatera Barat Nusa Tenggara Timur Jl. Khatib Sulaiman No. 48, Padang 25136 Jl.R. Suprapto No. 5, Kupang 85111Telp./Fax: (0751) 442158-60 / 442161 Telp. (0380) 826289, 833124 E-mail : [email protected] E-mail: [email protected]
Riau Kalimantan BaratJl. Pattimura No. 12, Pekanbaru 28131 Jl. Sutan Sjahrir No. 24/42, Pontianak 78116Telp./Fax: (0761) 21336 Telp./Fax: (0561) 735345, 765742 / 732184 E-mail: [email protected] Email:[email protected]
Jambi Kalimantan Tengah Jl. A. Yani No. 4, Telanaipura, Jambi 36122 Jl. Kapten P. Tendean No. 6 Palangka Raya 73112,Telp./Fax: (0741) 60497 / 60802 Telp./Fax: (0536) 28105 / 21380 E-mail: [email protected] Email:[email protected]
Sumatera Selatan Kalimantan SelatanJln. Kapt. Anwar Sastro No.1694/1131, Palembang Jl. KS. Tubun No. 117, Banjarmasin 7024230129 Telp./Fax: (0711) 318456, 353174 Telp./Fax: (0511) 262314 / 261585 E-mail: [email protected] Email:[email protected]
Bangka Belitung Kalimantan Timur Kompl. Perkantoran, Kel. Air Itam, Kec. Bukit Intan Jl. Kemakmuran No. 4. Samarinda 75117Telp./Fax: (0717) 439421 / 439422 Telp./Fax: (0541) 743372 / 201121 E-mail: [email protected] Email:[email protected]
Bengkulu Sulawesi Utara Jl. Adam Malik Km. 8 Kec. Gading Cempaka, Jl. 17 Agustus, Manado 95119 Bengkulu 38225,Telp./Fax: (0736) 349117/ 21613 Telp./Fax: (0431) 862204 / 862204 E-mail: [email protected] E-mail : [email protected]
Lampung GorontaloJl. Basuki Rahmat No. 54 Telukbetung Jl.Kasuari Baru No. 6, Kota Gorontalo, Bandar Lampung 35215 Telp./Fax: (0435) 824802 / 824802Telp./Fax: (0721) 482909 / 484329 E-mail:[email protected] : [email protected]
Kepulauan Riau Sulawesi Tengah Jl. Ir. Sutami No. 34 Jl. Prof. Moh. Yamin No. 48, Palu 94114Tanjung Pinang 29100 Telp./Fax: (0451) 483610, 483611 / 483612Telp.: (0771) 23680 E-mail : [email protected]
DKI Jakarta Sulawesi Selatan Jl. Medan Merdeka Selatan No.8-9 Blok D, Jl. Haji Bau No. 6, Makassar 90125Lt. 3 Jakarta Pusat Telp./Fax: (0411) 872844, 854838 / 851225Telp./Fax: (021) 3822290 / 3840084 Email:[email protected]: [email protected]
Banten Sulawesi BaratKomp. Pusat Perkantoran Prop. Banten (KP3B) Jl. KH. Ahad No.9Jl.Palima Majasari, Telp.: (0254) 7038810 Mamuju 91511E-mail: [email protected] Telp.: (0426) 2116
Jawa Barat Sulawesi Tenggara Jl. PHH Mustapa No. 43 , Bandung 40124 Jl. Made Sabara No. 3, Kendari 93111Telp. /Fax: (022)7272595, 7201696 / 7213572 Telp./Fax: (0401) 321751 / 322355E-mail: [email protected] E-mail : [email protected]
Jawa Tengah Maluku Jl. Pahlawan 6, Semarang 50241 Jl. Haruhun, Karang Panjang Telp./Fax: (024) 8311242, 8412802 / 8311195 (Kompleks Puleh) Ambon 97121E-mail: [email protected] Telp./ (0911) 353306, 342280
E-mail : [email protected]
D.I. Yogyakarta Maluku Utara Jl. Brigjen Katamso (THR), Yogyakarta Jl. Inpres Ubo-Ubo, Ternate 97717Telp./Fax: (0274) 373871 / 375310 Telp./Fax: (0921) 327878 E-mail: [email protected] E-mail: [email protected]
Jawa Timur Papua Jl. Raya Kendangsari Industri 43-44, Jl. Dr. Sam Ratulangi Dok II, Jayapura 99112Surabaya Telp./Fax: (031) 8438873 / 8494007 Telp./Fax: (0967) 534519 / 536490E-mail: [email protected] E-mail: [email protected]
Irian Jaya BaratJl. Trikora Wosi, Monokwari Irian Jaya BaratTelp./Fax: (0986) 211237 / 211241
Alamat Badan Pusat Statistik Provinsi/ BPS Statistics Provincial Offices
������������������������������� ���������������
���������������������������� ������ ��!�"���� ���
#���$���%�&'()%�&�*�$+,����*���'��--...�%�&�*�$+
�������������� ������������������������������������������������� ����������������������� ���������������������
�
1. Deputi Bidang Metodologi dan Informasi Statistik1.1 Direktorat Metodologi Statistik1.2 Direktorat Diseminasi Statistik1.3 Direktorat Sistem Informasi Statistik
2. Deputi Bidang Statistik Sosial2.1 Direktorat Statistik Kependudukan2.2 Direktorat Statistik Kesejahteraan Rakyat2.3 Direktorat Statistik Ketahanan Sosial
3. Deputi Bidang Statistik Ekonomi3.1 Direktorat Statistik Pertanian3.2 Direktorat Statistik Industri3.3 Direktorat Statistik Keuangan dan Harga3.4 Direktorat Statistik Perdagangan dan Jasa
4. Deputi Bidang Neraca dan Analisis Statistik4.1 Direktorat Neraca Produksi4.2 Direktorat Neraca Konsumsi.4.3 Direktorat Analisis Statistik
Sumber data :
1. Deputy Director General for Methodology and Statistical Information
1.1 Directorate of Statistical Methodology1.2 Directorate of Statistical Dissemination1.3 Directorate of Statistical Information System
2. Deputy Director General for Social Statistics2.1 Directorate of Population Statistics2.2 Directorate of Social Welfare Statistics2.3 Directorate of Social Resilience Statistics
3. Deputy Director General for Economic Statistics3.1 Directorate of Agricultural Statistics3.2 Directorate of Industrial Statistics3.3 Directorate of Financial and Price Statistics3.4 Directorate of Trade and Services Statistics
4. Deputy Director General for National Accounts and Statistical Analysis
4.1 Directorate of Production Accounts4.2 Directorate of Consumption Accounts4.3 Directorate of Statistical analysis
Source data :
Indikator Penting/ Main Indicator 1
1. Keadaan Geografi/ Geographical Situation 3
Tabel 1.1 Jumlah Daerah Administrasi di Indonesia 3
Number of Administrative Units in Indonesia 1998-2005
Tabel 1.2 Jumlah Daerah Administrasi Menurut Propinsi di Indonesia 4
Number of Administrative Units by Province in Indonesia 2005
Tabel 1.3 Luas Daerah di Indonesia 5
The Total Area in Indonesia, 2005
2. Penduduk dan Ketenagakerjaan/ Population and Labor 6
Tabel 2.1 Jumlah Penduduk Indonesia 6 Number of Population in Indonesia, 1930 - 2011 ( ribu/ thousand)
Tabel 2.2 Persentase dan Kepadatan Penduduk Menurut Propinsi 7
Percentage and Population Density by Provincy 2004,2005
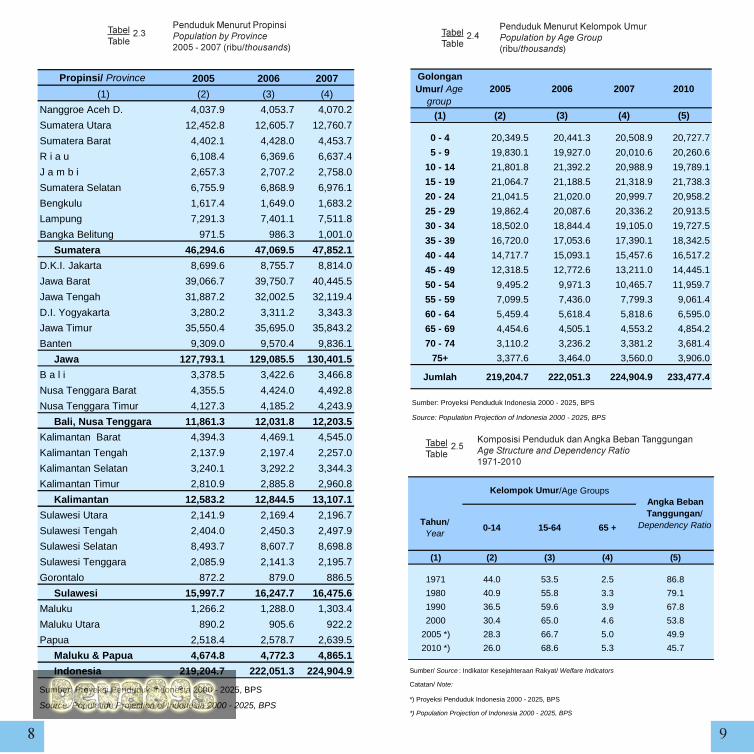
Tabel 2.3 Penduduk Menurut Propinsi 8
Population by Province, 2005 - 2007 ( ribu/ thousands)
Tabel 2.4 Penduduk Menurut Kelompok Umur 9 Population by Age Group ( ribu/ thousands)
Tabel 2.5 Komposisi Penduduk dan Angka Beban Tanggungan 9
Age Structure and Dependency Ratio, 1971 - 2010
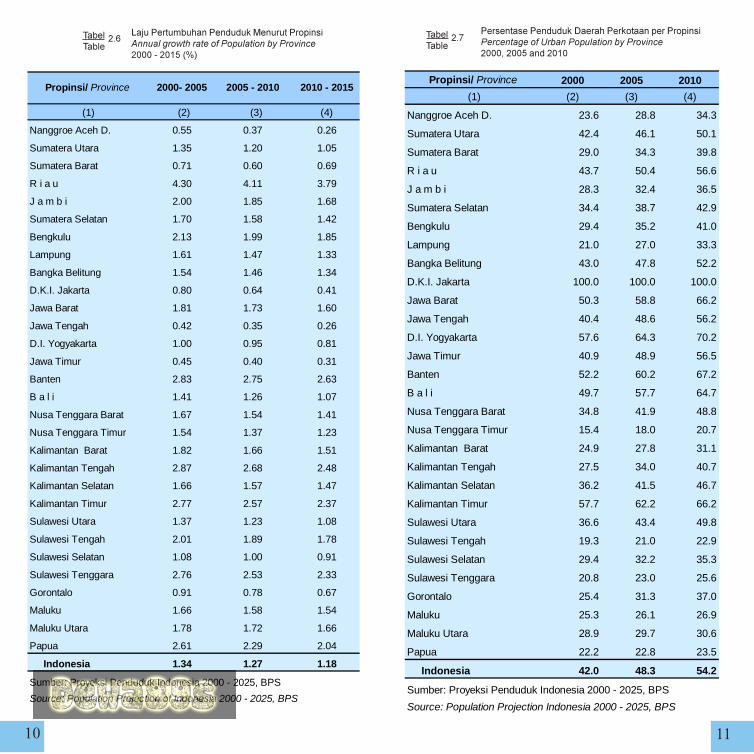
Tabel 2.6 Laju Pertumbuhan Penduduk Menurut Propinsi 10
Annual growth rate of Population by Province 2000-2015 (%)
Tabel 2.7 Persentase Penduduk Daerah Perkotaan per Propinsi 11
Percentage of Urban Population by Province 2000, 2005
and 2010
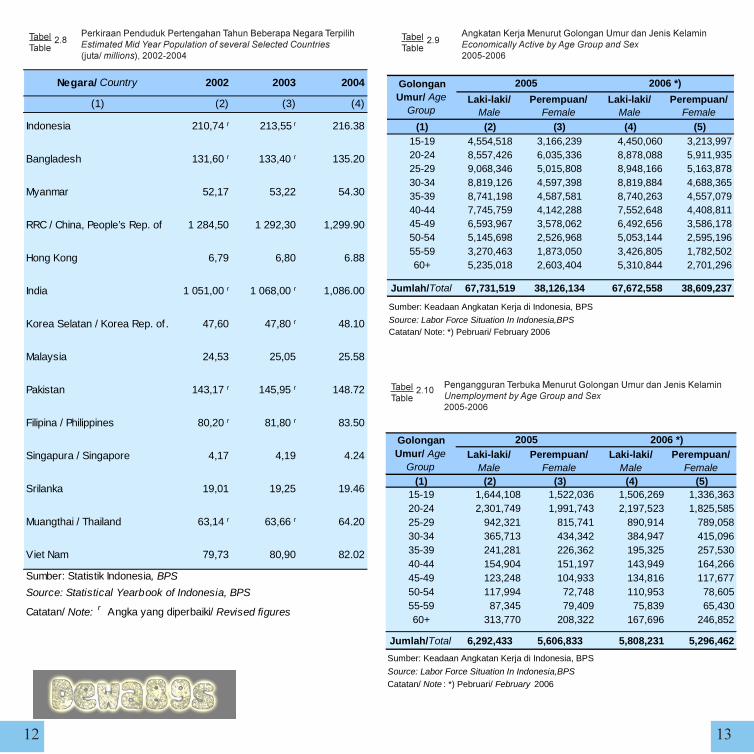
Tabel 2.8 Perkiraan Penduduk Pertengahan Tahun Beberapa Negara 12
Terpilih/ Estimated Mid Year Population of several Selected
Countries (juta/ million ), 2002-2004
Tabel 2.9 Angkatan Kerja Menurut Golongan Umur dan Jenis Kelamin 13
Economically Active by Age Group and Sex 2005 - 2006
Tabel 2.10 Pengangguran Terbuka Menurut Golongan Umur dan 13
Jenis Kelamin
Unemployment by Age Group and Sex 2005 - 2006
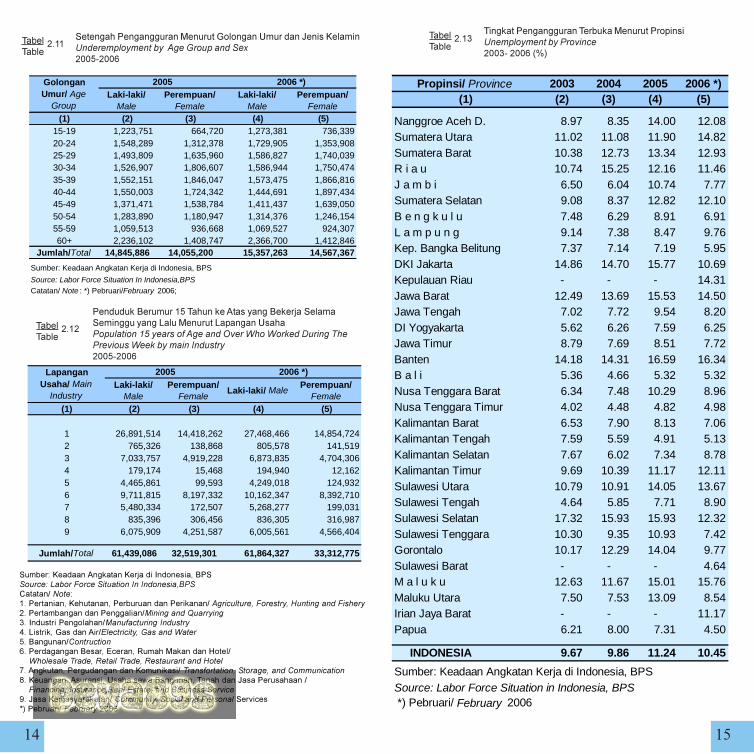
Tabel 2.11 Setengah Pengangguran Menurut Golongan Umur dan 13
Jenis Kelamin
Underemployment by Age Group and Sex 2005 - 2006
Tabel 2.12 Penduduk Berumur 15 Tahun ke Atas yang Bekerja Selama 14
Seminggu yang Lalu Menurut Lapangan Usaha
Population 15 years of Age and Over Who Worked During
The Previous Week by main Industry 2005 - 2006
Tabel 2.13 Tingkat Pengangguran Terbuka Menurut Propinsi 15
Unemployment by Province 2003 - 2006 (%)
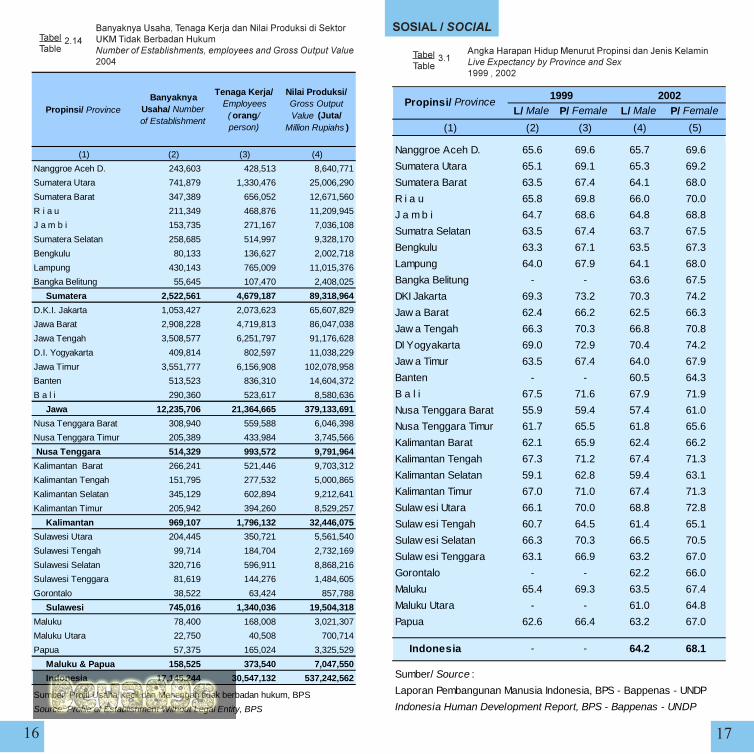
Tabel 2.14 Banyaknya Usaha, Tenaga Kerja dan Nilai Produksi Di Sektor 16
UKM Tidak Berbadan Hukum
Number of Establishments,worker Engaged, Gross Output
Value 2004
Halaman/ Page
Daftar Isi/ List of Tables
�����
3. Sosial/ Social 17
Tabel 3.1 Angka Harapan Hidup Menurut Propinsi dan Jenis Kelamin 17
Live Expectancy by Province and Sex, 1999, 2002
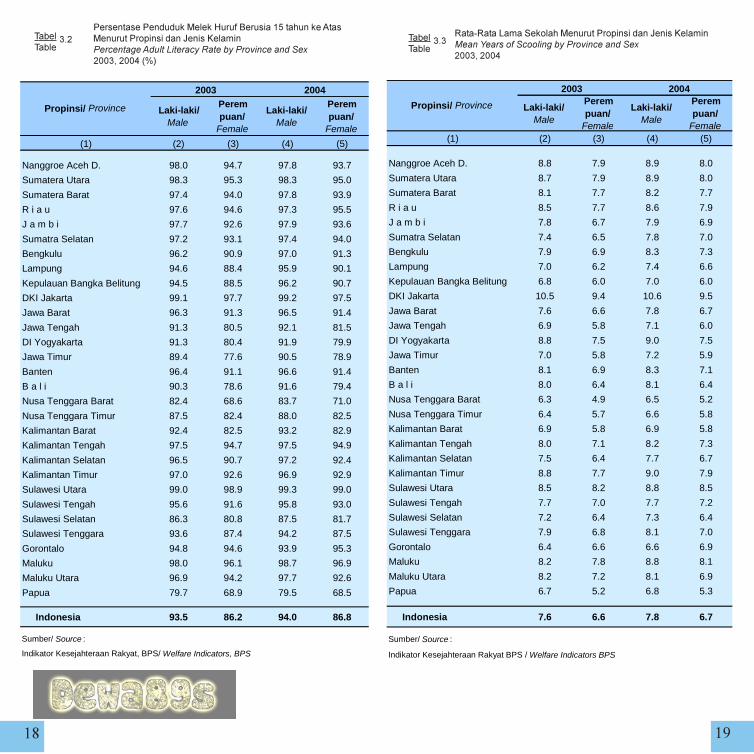
Tabel 3.2 Persentase Penduduk Melek Huruf Berusia 15 tahun ke Atas 18
Menurut Propinsi dan Jenis Kelamin
Percentage Adult Literacy Rate by Province and Sex,
2003 - 2004 (%)
Tabel 3.3 Rata-rata Lama Sekolah Menurut Propinsi dan Jenis Kelamin 19
Mean Years of Scooling by Province and Sex, 2003 - 2004
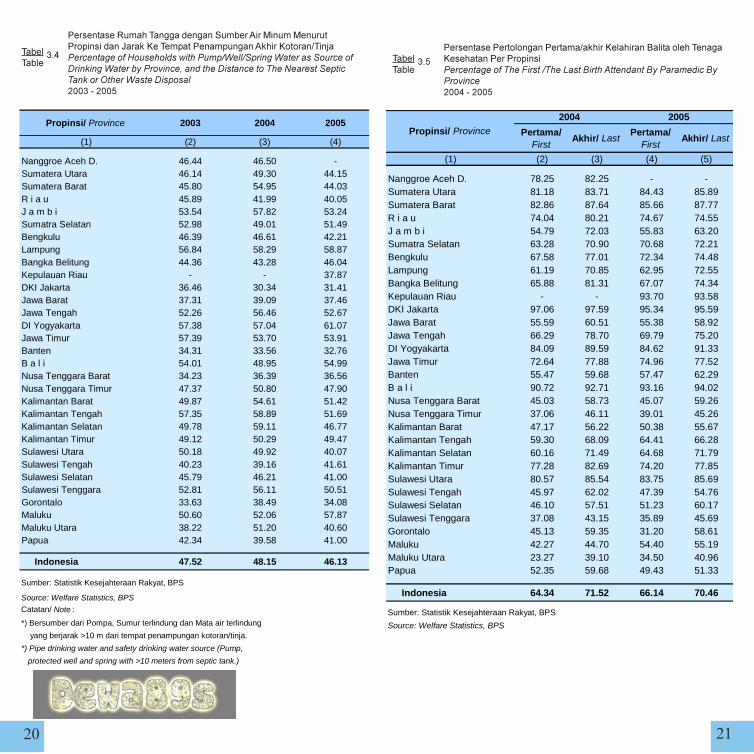
Tabel 3.4 Persentase Rumah Tangga dengan Sumber Air Minum 20
Menurut Propinsi dan Jarak Ke Tempat Penampungan Akhir
Kotoran/Tinja
Percentage of Households with Pump/Well/Spring Water as
Source of Drinking Water by Province, and the Distance to
The Nearest Septic Tank or Other Waste Disposal
Tabel 3.5 Persentase Pertolongan Pertama/akhir Kelahiran Balita oleh 21
Tenaga Kesehatan Per Propinsi
Percentage of the First/ the Last by Birth Attendant Paramedic
by Province, 2004 - 2005
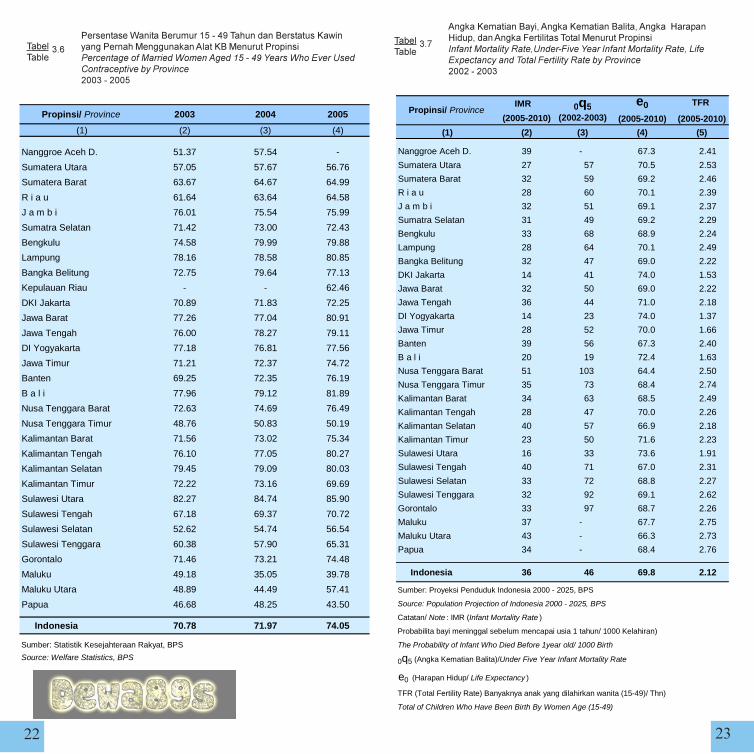
Tabel 3.6 Persentase Wanita Berumur 15 - 49 Tahun dan Berstatus 22
Kawin yang Pernah Menggunakan Alat KB Menurut Propinsi
Percentage of Married Women Aged 15 - 49 Years Who
Ever Used Contraceptive by Province 2003 - 2005
Tabel 3.7 Angka Kematian Bayi, Angka Kematian Balita, Angka 23
Harapan Hidup, dan Angka Fertilitas Total Menurut Propinsi
Infant Mortality Rate,Under-Five Year Infant Mortality Rate, Life
Expectancy and Total Fertility Rate by Province, 2002 - 2003
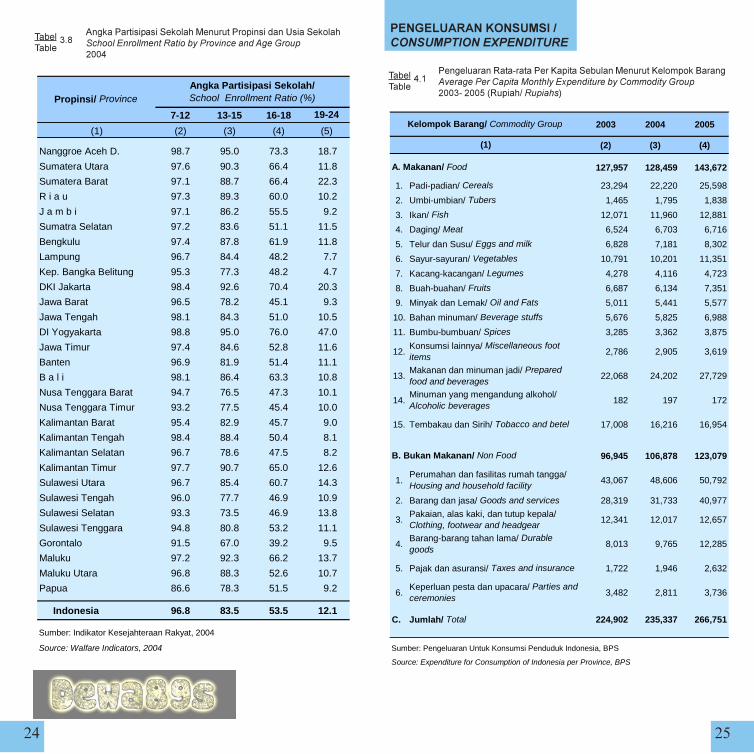
Tabel 3.8 Angka Partisipasi Sekolah Menurut Propinsi dan Usia Sekolah 24
School Enrollment Ratio by Province and Age Group 2004
4. Pengeluaran Konsumsi/ Consumtion Expenditure 25
Tabel 4.1 Pengeluaran Rata-rata Per Kapita Sebulan Menurut 25
Kelompok Barang
Average Per Capita Monthly Expenditure by Commodity
Group 2003 - 2005 ( Rupiah/ Rupiahs)
Tabel 4.2 Konsumsi Rata-rata Per Kapita Seminggu Beberapa Macam 26
Bahan Makanan Penting
Weekly Average per Capita Consumtion of Several
Food Items 2002 - 2005
Tabel 4.3 Pengeluaran Per Kapita Per Bulan Menurut Propinsi 27
Average Per Capita Monthly Expenditure by Province, 1999, 2002
5. Kemiskinan/ Poverty 28
Tabel 5.1 Jumlah Penduduk Miskin Per Propinsi 28
Number of Population Below the Poverty Line,
2004 ( ribu/ thousand)
Tabel 5.2 Garis Kemiskinan Per Kapita Per Bulan Menurut Propinsi 29
Poverty Line Per Capita Monthly by Propinsi,
2004 (Rp/Kapita/Bln)/ (Rupiahs/capita/month)
Tabel 5.3 Gini Ratio Per Propinsi, 1996, 1999 dan 2002 30
Gini Ratio by Province 1996, 1999 and 2002
Daftar Isi/ List of TablesHalaman/
Page
6. Pertanian/ Agriculture 31
Tabel 6.1 Luas Panen dan Produksi Padi dan Tanaman Pangan 31
Harvested Area and Production of Paddy and Rate of
Food Crops, 2004 - 2006
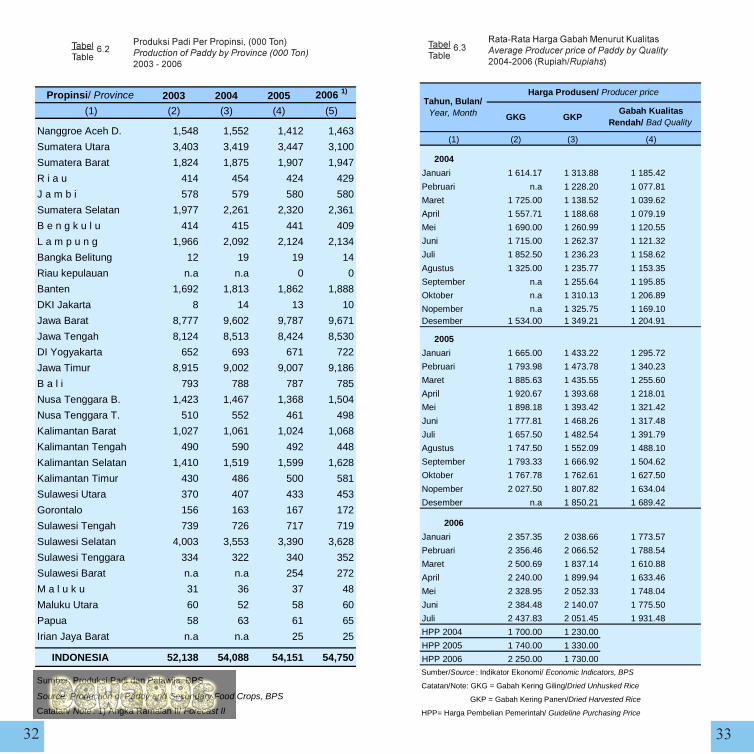
Tabel 6.2 Produksi Padi Per Propinsi 32 Production of Paddy by Province ( ribu/ thousand Ton)
Tabel 6.3 Rata-Rata Harga Gabah Menurut Kualitas/ Average 33
Producer price of Paddy by Quality, 2004-2006 (Rupiahs)
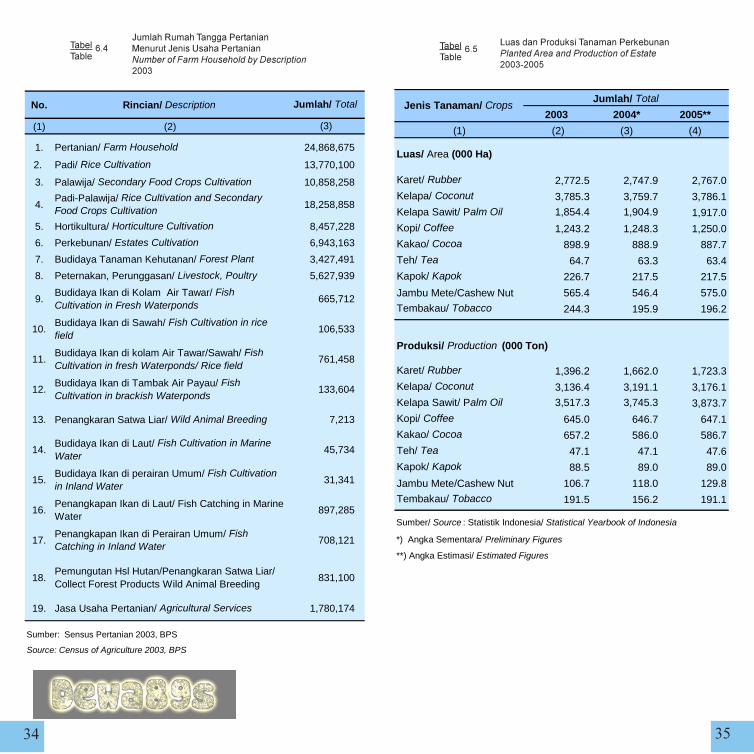
Tabel 6.4 Jumlah Rumah Tangga Pertanian Menurut Jenis Usaha 34
Pertanian 2003
Number of Farm Household by Description 2003
Tabel 6.5 Luas dan Produksi Tanaman Perkebunan 35
Planted Area and Production of Estate 2003-2005
Tabel 6.6 Persentase Banyaknya Ternak Menurut Jenis 36
Percentage of Livestock by Type, 2001-2004
Tabel 6.7 Persentase Banyaknya Unggas Menurut Jenis 36
Percentage of Poultry by Type, 2001-2004
Tabel 6.8 Persentase Produksi Perikanan Menurut Jenis 37
Percentage of Fisheries Production by Type of Fishery
,2000-2003
Tabel 6.9 Banyaknya Rumah Tangga , Rumah Tangga Pertanian, dan 38
Rumah Tangga Petani Gurem Menurut Propinsi
Number of Household, Farm Household, and Gurem
Farmer Household by Province, 2004
Tabel 6.10 Produksi Buah-Buahan 39
Production of Fruit Crops, 2002-2004 (Ton)
Tabel. 6.11 Produksi Sayuran 40
Production of Vegatables, 2002-2004 (Ton)
7. Perindustrian/ Manufacturing 41
Tabel 7.1 Indeks Produksi Industri Besar dan Sedang, 41
Production Indices of Large and Medium Manufacturing
Establishments (2000 = 100) 2003 - 2005
Tabel 7.2 Energi Konsumsi Listrik, LPG dan Gas Alam 42
Energy Consumption of Electricity, LPG and Natural Gas
2000 - 2002
8. Perdagangan Luar Negeri/ Foreign Trade 43
Tabel 8.1 Nilai Ekspor Menurut Negara Tujuan Utama 43
(Nilai FOB : Juta US $), 2002 - 2005
Value of Exports by Major Country of Destination
(FOB value : million US $), 2002 - 2005
Tabel 8.2 Nilai Impor Menurut Negara Asal Utama 44
(Nilai CIF : Juta US $), 2002 - 2005
Value of Imports by Major Country of Origin
(CIF value : million US $), 2002 - 2005
Daftar Isi/ List of TablesHalaman/
Page
�� �
Tabel 8.3 Ekspor Migas dan Beberapa Produk Unggulan 45
Barang Non Migas, 2002 - 2005
Exports of Oil and Gas, Non Oil and Gas Product, 2002 - 2005
Tabel 8.4 Impor Barang Modal dan Beberapa Komoditi Barang, 46
Imports of Capitals Goods and Commodities Group 2002-2005
Tabel 8.5 Neraca Perdagangan Barang Migas dan Non Migas 47
Balance of Trade of Oil & Gas and Non Oil & Gas
( Juta/ Million US $), 2004 - 2006
Tabel 8.6 Ekspor Lima Besar Golongan Barang per Bulan, 48
Exports Value by Commodity Group
2005 - 2006, ( Juta/ Million US $)
Tabel 8.7 Impor Lima Besar Golongan Barang per Bulan, 49
Imports Value by Commodity Group
2005 - 2006, ( Juta / Million US $)
9. Parawisata dan Transportasi/ Tourism and Transportation 50
Tabel 9.1 Jumlah Wisatawan Asing yang Datang Melalui 13 Pintu 50
Masuk Utama
Number of Foreign Tourist Arrivals Through 13 main
Ports of Entry, 2003 - 2006
Tabel 9.2 Jumlah Wisatawan Asing yang Datang Melalui 3 Bandar 50
Udara
Number of Foreign Tourist Arrivals Through 3 main Ports
of Entry, 1998 - 2006
Tabel 9.3 Rata-rata Pengeluaran Wisman per Kunjungan dan 51
Rata-rata Lama Tinggal Menurut Negara Tempat Tinggal,
Average Expenditure Per Visit and Average Length
of Stay of International by Country of Residence, 2004-2005
Tabel 9.4 Wisatawan Asing yang Datang ke Indonesia Menurut 52
Negara Tempat Tinggal
Arrivals of Foreign Tourists in Indonesia by Country
of Residence, 2002 - 2005
Tabel 9.5 Jumlah Penumpang Dalam Negeri Menurut Jenis Angkutan 53
Number of Passenger by Domestic Cargo
( ribu orang/ thousand people)
Tabel 9.6 Jumlah Barang Dalam Negeri Menurut Jenis Angkutan 54
Number of Freigth by Domestic Cargo ( ribu/ thousand Ton)
2004-2006
10. Keuangan dan Harga-Harga/ Finance and Prices 55
Tabel 10.1 Realisasi Pendapatan Negara 55
Government Revenues, 2003 - 2005 ( Triliun/ Trillion Rupiahs)
Tabel 10.2 Realisasi Pengeluaran Negara 56
Actual Government Expenditures, 2003-2005 (Trillion Rupiahs)
Tabel 10.3 Uang Beredar dan Perubahan Faktor-faktor yang 57
Mempengaruhi Uang Beredar
Money Supply and its Change of Affecting Factors
2003 - 2005 ( Milliar/ Billion Rupiahs)
Daftar Isi/ List of TablesHalaman/
Page
Tabel 10.4 Perkembangan Harga Rata - Rata Valuta Asing dan Harga 58
Emas di Pasaran Jakarta (Rupiah)
Average Prices of Foreign Currencies and Gold in Jakarta
Market, 1999 - 2006 (Rupiahs)
Tabel 10.5 Laju Inflasi Nasional 59
Inflation Rate in Indonesia Januari, 2002 - 2006
Tabel 10.6 Inflasi Nasional Tahun ke Tahun 59
Inflation Rate in Indonesia Year on Year, 2001 - 2006
Tabel 10.7 Laju Inflasi menurut Kelompok Komponen 60
Inflation Rate by Component Groups, 2006
Tabel 10.8 Sumbangan Kelompok Komponen terhadap Inflasi nasional 60
The Influence of Component Group to National Inflation, 2006
Tabel 10.9 IHK 45 Kota Per Bulan di Indonesia/ 61
Monthly CPI of 45 City In Indonesia, 2006
Tabel 10.10 Inflasi di 45 Kota 62
Inflation Rate of 45 Cities, 2006
Tabel 10.11 Inflasi di 45 Kota 63
Inflation Rate of 45 Cities, 2001-2005
Tabel 10.12 Indeks Tendensi Bisnis Triwulan I-1999 s.d Triwulan I-2006 64
dan Perkiraan Triwulan II-2006
The Business Tendency Index Quarter I-1999 to I-2006
and Its Prospect in Quarter II-2006
Tabel 10.13 Indeks Tendensi Konsumen Triwulan I-1999 s.d I-2006 dan 65
Perkiraan Triwulan II-2006
The Consumer Tendency Index Quarter I-1999 to I-2006
and Its Prospect in Quarter II-2006
Tabel 10.14 Nilai Tukar Petani di 23 Propinsi 66
Farmers Terms of Trade in 23 Provinces, 2006
11. Pendapatan Nasional dan Regional/ National and Regional Income 67
Tabel 11.1 Produk Domestik Regional Bruto Atas Dasar Harga Berlaku 67
Menurut Propinsi, 2002 - 2004 (Juta Rupiah)
Gross Regional Domestic Product at Current Prices
by Provinces, 2000-2004 (Million Rupiahs)
Tabel 11.2 Produk Domestik Regional Bruto Atas Dasar Harga Konstan 68
2000 Menurut Propinsi, 2002 - 2004 (Juta Rupiah)
Gross Regional Domestic Product at 2000 Constant Prices
by Provinces, 2000-2004 (Million Rupiahs)
Tabel 11.3 Produk Domestik Bruto Atas Dasar Harga Berlaku 69
Menurut Lapangan Usaha (Miliar Rupiah)
Gross Domestic Product At Current Market Prices
by Industrial origin, 2003-2005 (Billion Rupiahs)
Tabel 11.4 Produk Domestik Bruto Atas Dasar Harga Dasar Konstan 70
2000 Menurut Lapangan Usaha (Miliar Rupiah)
Gross Domestic Product At 2000 Constant Market Prices
by Industrial origin, 2003-2005 (Billion Rupiahs)
Halaman/ Page
Daftar Isi/ List of Tables
��
��������������� ������������
���������������������������������� ���
����������
�
Tabel 11.5 Produk Domestik Bruto Atas Dasar Harga Berlaku 71
Menurut Jenis Pengeluaran (Miliar Rupiah)
Gross Domestic Product At Current Market Prices
by Type of Expenditure, 2003-2005 (Billion Rupiahs)
Tabel 11.6 Produk Domestik Bruto Atas Dasar Harga Dasar Konstan 72
2000, Menurut Jenis Pengeluaran (Miliar Rupiah)
Gross Domestic Product At 2000 Constan Market Prices
by Type of Expenditure, 2003-2005 (Billion Rupiahs)
Tabel 11.7 Produk Domestik Bruto Atas Dasar Harga Berlaku 73
Menurut Lapangan Usaha (Miliar Rupiah)
Gross Domestic Product At Current Market Prices
by Industrial origin, 2005 (Billion Rupiahs)
Tabel 11.8 Produk Domestik Bruto Atas Harga Dasar Konstan 74
2000 Menurut Lapangan Usaha (Miliar Rupiah)
Gross Domestic Product At 2000 Constan Market Prices
by Industrial origin, 2005 (Billion Rupiahs)
Tabel 11.9 Produk Domestik Bruto Atas Dasar Harga Berlaku 75
Menurut Pengeluaran (Miliar Rupiah)
Gross Domestic Product At Current Market Prices
by Type of Expenditure, 2005 (Billion Rupiahs)
Tabel 11.10 Produk Domestik Bruto Atas Dasar Dasar Harga Konstan 76
2000 Menurut Pengeluaran (Miliar Rupiah)
Gross Domestic Product At 2000 Constan Market Prices
by Type of Expenditure, 2005 (Billion Rupiahs)
Tabel 11.11 Produk Domestik Bruto, PDB per Kapita dan Pendapatan 77
Nasional Per Kapita (Rupiah)
Gross Domestic Product, Per Capita Gross Domestic
Product, and Per Capita Gross National Product (Rps),
1995 - 2005 (Rps),
Tabel 11.12 Distribusi Persentase PDRB Atas Dasar Harga Berlaku 78
Menurut Propinsi dan Lapangan Usaha
Percentage Distribution of GRGP at Current Price by
Province and Industrial Origin, 2003-2004
Daftar Isi/ List of TablesHalaman/
Page
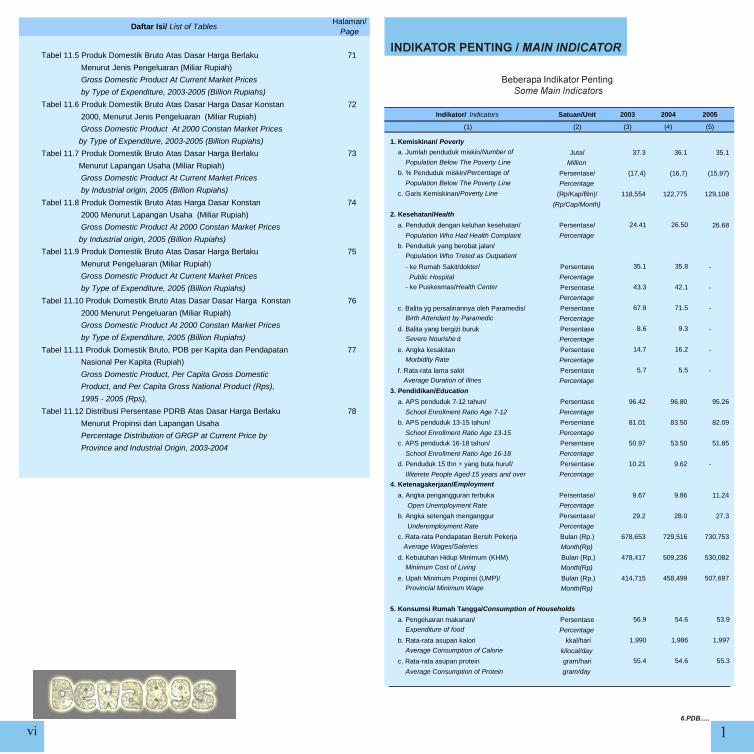
Indikator/ Indicators Satuan/Unit 2003 2004 2005
(1) (2) (3) (4) (5)
1. Kemiskinan/ Poverty
a. Jumlah penduduk miskin/Number of Juta/ 37.3 36.1 35.1
Population Below The Poverty Line Million
b. % Penduduk miskin/Percentage of Persentase/ (17,4) (16,7) (15,97)
Population Below The Poverty Line Percentage
c. Garis Kemiskinan/Poverty Line (Rp/Kap/Bln)/ 118,554 122,775 129,108
(Rp/Cap/Month)
2. Kesehatan/Health
a. Penduduk dengan keluhan kesehatan/ Persentase/ 24.41 26.50 26.68
Population Who Had Health Complaint Percentage
b. Penduduk yang berobat jalan/
Population Who Treted as Outpatient
- ke Rumah Sakit/dokter/ Persentase 35.1 35.8 -
Public Hospital Percentage
- ke Puskesmas/Health Center Persentase 43.3 42.1 -
Percentage
c. Balita yg persalinannya oleh Paramedis/ Persentase 67.9 71.5 -
Birth Attendant by Paramedic Percentage
d. Balita yang bergizi buruk Persentase 8.6 9.3 -
Severe Nourishe d Percentage
e. Angka kesakitan Persentase 14.7 16.2 -
Morbidity Rate Percentage
f. Rata-rata lama sakit Persentase 5.7 5.5 -
Average Duration of Illnes Percentage
3. Pendidikan/Education
a. APS penduduk 7-12 tahun/ Persentase 96.42 96.80 95.26
School Enrollment Ratio Age 7-12 Percentage
b. APS penduduk 13-15 tahun/ Persentase 81.01 83.50 82.09
School Enrollment Ratio Age 13-15 Percentage
c. APS penduduk 16-18 tahun/ Persentase 50.97 53.50 51.85
School Enrollment Ratio Age 16-18 Percentage
d. Penduduk 15 thn + yang buta huruf/ Persentase 10.21 9.62 -
Illiterete People Aged 15 years and over Percentage
4. Ketenagakerjaan/Employment
a. Angka pengangguran terbuka Persentase/ 9.67 9.86 11.24
Open Unemployment Rate Percentage
b. Angka setengah menganggur Persentase/ 29.2 28.0 27.3
Underemployment Rate Percentage
c. Rata-rata Pendapatan Bersih Pekerja Bulan (Rp.) 678,653 729,516 730,753
Average Wages/Saleries Month(Rp)
d. Kebutuhan Hidup Minimum (KHM) Bulan (Rp.) 478,417 509,236 530,082
Minimum Cost of Living Month(Rp)
e. Upah Minimum Propinsi (UMP)/ Bulan (Rp.) 414,715 458,499 507,697
Provincial Minimum Wage Month(Rp)
5. Konsumsi Rumah Tangga/Consumption of Households
a. Pengeluaran makanan/ Persentase 56.9 54.6 53.9
Expenditure of food Percentage
b. Rata-rata asupan kalori kkal/hari 1,990 1,986 1,997
Average Consumption of Calorie kilocal/day
c. Rata-rata asupan protein gram/hari 55.4 54.6 55.3
Average Consumption of Protein gram/day
��������������� ���� ��������������
� �
����� ����� ������������������������������������ �� ������ ����������� !"���#
���������������������������������� ���
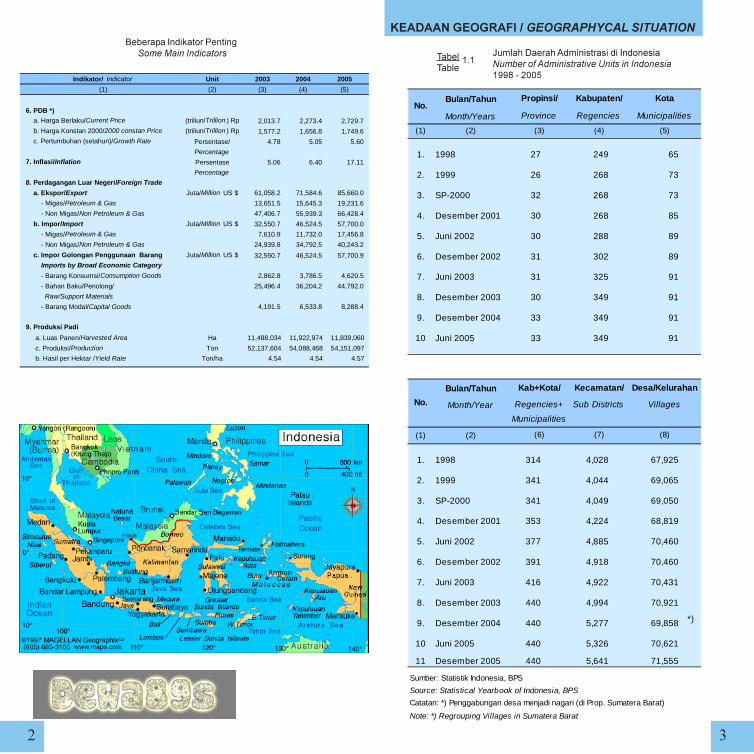
Bulan/Tahun
Month/Years
(1) (2)
1. 1998 27 249 65
2. 1999 26 268 73
3. SP-2000 32 268 73
4. Desember 2001 30 268 85
5. Juni 2002 30 288 89
6. Desember 2002 31 302 89
7. Juni 2003 31 325 91
8. Desember 2003 30 349 91
9. Desember 2004 33 349 91
10 Juni 2005 33 349 91
Bulan/Tahun
Month/Year
(1) (2)
1. 1998 314 4,028 67,925
2. 1999 341 4,044 69,065
3. SP-2000 341 4,049 69,050
4. Desember 2001 353 4,224 68,819
5. Juni 2002 377 4,885 70,460
6. Desember 2002 391 4,918 70,460
7. Juni 2003 416 4,922 70,431
8. Desember 2003 440 4,994 70,921
9. Desember 2004 440 5,277 69,858 *)
10 Juni 2005 440 5,326 70,621
11 Desember 2005 440 5,641 71,555
Sumber: Statistik Indonesia, BPS
Source: Statistical Yearbook of Indonesia, BPS
Catatan: *) Penggabungan desa menjadi nagari (di Prop. Sumatera Barat)
Note: *) Regrouping Villages in Sumatera Barat
No.
No.
Municipalities
Sub Districts Villages
(5)
Municipalities
Regencies+
Kabupaten/ Kota
(6) (7) (8)
Desa/KelurahanKab+Kota/ Kecamatan/
Province Regencies
(4)(3)
Propinsi/
$����$����
�%�
Indikator/ Indicator Unit 2003 2004 2005
(1) (2) (3) (4) (5)
6. PDB *) a. Harga Berlaku/Current Price (triliun/Trillion ) Rp 2,013.7 2,273.4 2,729.7
b. Harga Konstan 2000/2000 constan Price (triliun/Trillion ) Rp 1,577.2 1,656.8 1,749.6
c. Pertumbuhan (setahun)/Growth Rate Persentase/ 4.78 5.05 5.60
Percentage
7. Inflasi/Inflation Persentase 5.06 6.40 17.11
Percentage
8. Perdagangan Luar Negeri/Foreign Trade
a. Ekspor/Export Juta/Million US $ 61,058.2 71,584.6 85,660.0
- Migas/Petroleum & Gas 13,651.5 15,645.3 19,231.6
- Non Migas/Non Petroleum & Gas 47,406.7 55,939.3 66,428.4
b. Impor/Import Juta/Million US $ 32,550.7 46,524.5 57,700.0
- Migas/Petroleum & Gas 7,610.9 11,732.0 17,456.8
- Non Migas/Non Petroleum & Gas 24,939.8 34,792.5 40,243.2
c. Impor Golongan Penggunaan Barang Juta/Million US $ 32,550.7 46,524.5 57,700.9
Imports by Broad Economic Category
- Barang Konsumsi/Consumption Goods 2,862.8 3,786.5 4,620.5
- Bahan Baku/Penolong/ 25,496.4 36,204.2 44,792.0
Raw/Support Materials
- Barang Modal/Capital Goods 4,191.5 6,533.8 8,288.4
a. Luas Panen/Harvested Area Ha 11,488,034 11,922,974 11,839,060
c. Produksi/Production Ton 52,137,604 54,088,468 54,151,097
b. Hasil per Hektar /Yield Rate Ton/ha 4.54 4.54 4.57
9. Produksi Padi
� �
����� ����� �����������&������������������������������������� �� ������ ������������������������#
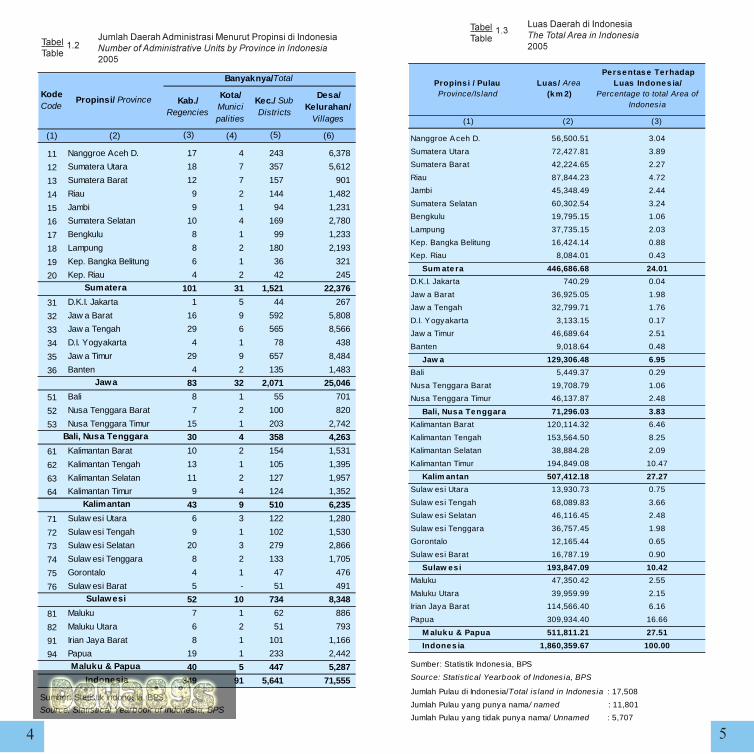
'�������� ��������������� �������������������#
(1) (2) (4) (6)
11 Nanggroe Aceh D. 17 4 243 6,378
12 Sumatera Utara 18 7 357 5,612
13 Sumatera Barat 12 7 157 901
14 Riau 9 2 144 1,482
15 Jambi 9 1 94 1,231
16 Sumatera Selatan 10 4 169 2,780
17 Bengkulu 8 1 99 1,233
18 Lampung 8 2 180 2,193
19 Kep. Bangka Belitung 6 1 36 321
20 Kep. Riau 4 2 42 245
101 31 1,521 22,376
31 D.K.I. Jakarta 1 5 44 267
32 Jaw a Barat 16 9 592 5,808
33 Jaw a Tengah 29 6 565 8,566
34 D.I. Yogyakarta 4 1 78 438
35 Jaw a Timur 29 9 657 8,484
36 Banten 4 2 135 1,483
83 32 2,071 25,046
51 Bali 8 1 55 701
52 Nusa Tenggara Barat 7 2 100 820
53 Nusa Tenggara Timur 15 1 203 2,742
30 4 358 4,263
61 Kalimantan Barat 10 2 154 1,531
62 Kalimantan Tengah 13 1 105 1,395
63 Kalimantan Selatan 11 2 127 1,957
64 Kalimantan Timur 9 4 124 1,352
43 9 510 6,235
71 Sulaw esi Utara 6 3 122 1,280
72 Sulaw esi Tengah 9 1 102 1,530
73 Sulaw esi Selatan 20 3 279 2,866
74 Sulaw esi Tenggara 8 2 133 1,705
75 Gorontalo 4 1 47 476
76 Sulaw esi Barat 5 - 51 491
52 10 734 8,348
81 Maluku 7 1 62 886
82 Maluku Utara 6 2 51 793
91 Irian Jaya Barat 8 1 101 1,166
94 Papua 19 1 233 2,442
40 5 447 5,287
349 91 5,641 71,555
Sumber: Statistik Indonesia, BPSSource: Statistical Yearbook of Indonesia, BPS
(5)
Sumatera
Jawa
Bali, Nusa Tenggara
Kalimantan
Sulawesi
Maluku & Papua
Indonesia
(3)
Kota/ Municipalities
Kec./ Sub Districts
Desa/ Kelurahan/
Villages
Banyaknya/Total
Kab./ Regencies
Propinsi/ ProvinceKode Code
(1) (3)
Nanggroe Aceh D. 56,500.51 3.04
Sumatera Utara 72,427.81 3.89
Sumatera Barat 42,224.65 2.27
Riau 87,844.23 4.72
Jambi 45,348.49 2.44
Sumatera Selatan 60,302.54 3.24
Bengkulu 19,795.15 1.06
Lampung 37,735.15 2.03
Kep. Bangka Belitung 16,424.14 0.88
Kep. Riau 8,084.01 0.43
Sum ate ra 446,686.68 24.01
D.K.I. Jakarta 740.29 0.04
Jaw a Barat 36,925.05 1.98
Jaw a Tengah 32,799.71 1.76
D.I. Yogyakarta 3,133.15 0.17
Jaw a Timur 46,689.64 2.51
Banten 9,018.64 0.48
Jaw a 129,306.48 6.95
Bali 5,449.37 0.29
Nusa Tenggara Barat 19,708.79 1.06
Nusa Tenggara Timur 46,137.87 2.48
Bali, Nusa Tenggara 71,296.03 3.83
Kalimantan Barat 120,114.32 6.46
Kalimantan Tengah 153,564.50 8.25
Kalimantan Selatan 38,884.28 2.09
Kalimantan Timur 194,849.08 10.47
Kalim antan 507,412.18 27.27
Sulaw esi Utara 13,930.73 0.75
Sulaw esi Tengah 68,089.83 3.66
Sulaw esi Selatan 46,116.45 2.48
Sulaw esi Tenggara 36,757.45 1.98
Gorontalo 12,165.44 0.65
Sulaw esi Barat 16,787.19 0.90
Sulaw esi 193,847.09 10.42
Maluku 47,350.42 2.55
Maluku Utara 39,959.99 2.15
Irian Jaya Barat 114,566.40 6.16
Papua 309,934.40 16.66
M aluk u & Papua 511,811.21 27.51
Indones ia 1,860,359.67 100.00
Jumlah Pulau di Indonesia/Total is land in Indonesia : 17,508
Jumlah Pulau yang punya nama/ named : 11,801
Jumlah Pulau yang tidak punya nama/ Unnamed : 5,707
Propins i / Pulau Province/Is land
Luas/ Area (k m 2)
Perse ntas e Terhadap Luas Indones ia/
Percentage to total Area of Indonesia
(2)
Sumber: Statis tik Indonesia, BPS
Source: Statis tical Yearbook of Indonesia, BPS
$����$����
�%($����$����
�%�
� �
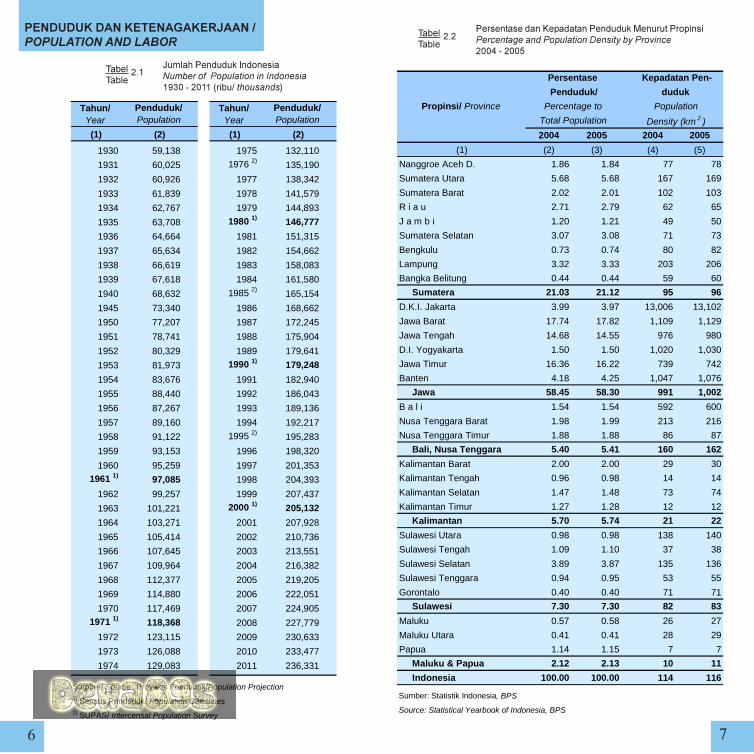
������������������������� ��������������
����� ������������������������������� ������������ (�"����)����* �������+
�����������,��������������&����������������� ������������� ������� ���������������-"���#
2004 2005 2004 2005
(1) (2) (3) (4) (5)
Nanggroe Aceh D. 1.86 1.84 77 78
Sumatera Utara 5.68 5.68 167 169
Sumatera Barat 2.02 2.01 102 103
R i a u 2.71 2.79 62 65
J a m b i 1.20 1.21 49 50
Sumatera Selatan 3.07 3.08 71 73
Bengkulu 0.73 0.74 80 82
Lampung 3.32 3.33 203 206
Bangka Belitung 0.44 0.44 59 60
Sumatera 21.03 21.12 95 96
D.K.I. Jakarta 3.99 3.97 13,006 13,102
Jawa Barat 17.74 17.82 1,109 1,129
Jawa Tengah 14.68 14.55 976 980
D.I. Yogyakarta 1.50 1.50 1,020 1,030
Jawa Timur 16.36 16.22 739 742
Banten 4.18 4.25 1,047 1,076
Jawa 58.45 58.30 991 1,002
B a l i 1.54 1.54 592 600
Nusa Tenggara Barat 1.98 1.99 213 216
Nusa Tenggara Timur 1.88 1.88 86 87
Bali, Nusa Tenggara 5.40 5.41 160 162
Kalimantan Barat 2.00 2.00 29 30
Kalimantan Tengah 0.96 0.98 14 14
Kalimantan Selatan 1.47 1.48 73 74
Kalimantan Timur 1.27 1.28 12 12
Kalimantan 5.70 5.74 21 22
Sulawesi Utara 0.98 0.98 138 140
Sulawesi Tengah 1.09 1.10 37 38
Sulawesi Selatan 3.89 3.87 135 136
Sulawesi Tenggara 0.94 0.95 53 55
Gorontalo 0.40 0.40 71 71
Sulawesi 7.30 7.30 82 83
Maluku 0.57 0.58 26 27
Maluku Utara 0.41 0.41 28 29
Papua 1.14 1.15 7 7
Maluku & Papua 2.12 2.13 10 11
Indonesia 100.00 100.00 114 116
Kepadatan Pen-
duduk
Persentase
Penduduk/
Propinsi/ Province Percentage to
Total Population
Population
Density (km 2 )
Sumber: Statistik Indonesia, BPS
Source: Statistical Yearbook of Indonesia, BPS
Tahun/ Year
Tahun/ Year
(1) (1)
1930 59,138 1975 132,110
1931 60,025 1976 2) 135,190
1932 60,926 1977 138,342
1933 61,839 1978 141,579
1934 62,767 1979 144,893
1935 63,708 1980 1) 146,777
1936 64,664 1981 151,315
1937 65,634 1982 154,662
1938 66,619 1983 158,083
1939 67,618 1984 161,580
1940 68,632 1985 2)165,154
1945 73,340 1986 168,662
1950 77,207 1987 172,245
1951 78,741 1988 175,904
1952 80,329 1989 179,641
1953 81,973 1990 1) 179,248
1954 83,676 1991 182,940
1955 88,440 1992 186,043
1956 87,267 1993 189,136
1957 89,160 1994 192,217
1958 91,122 1995 2) 195,283
1959 93,153 1996 198,320
1960 95,259 1997 201,3531961 1) 97,085 1998 204,393
1962 99,257 1999 207,437
1963 101,221 2000 1) 205,132
1964 103,271 2001 207,928
1965 105,414 2002 210,736
1966 107,645 2003 213,551
1967 109,964 2004 216,382
1968 112,377 2005 219,205
1969 114,880 2006 222,051
1970 117,469 2007 224,9051971 1) 118,368 2008 227,779
1972 123,115 2009 230,633
1973 126,088 2010 233,477
1974 129,083 2011 236,331
Sumber/ Source : Proyeksi Penduduk/Population Projection 1) Sensus Penduduk/ Population Censuses2) SUPAS/ Intercensal Population Survey
Penduduk/ Population
(2)
Penduduk/ Population
(2)
$����$����
�%�
$����$����
�%�
�
�������&������������������ ����������������#"���.)����* �������+
�������&�����,�������/��������� ���������������)����* �������+
,�������������������������$����������� ��� ���������������� � ��� .�"����
Golongan Umur/ Age
group2005 2006 2007 2010
(1) (2) (3) (4) (5)
0 - 4 20,349.5 20,441.3 20,508.9 20,727.7
5 - 9 19,830.1 19,927.0 20,010.6 20,260.6
10 - 14 21,801.8 21,392.2 20,988.9 19,789.1
15 - 19 21,064.7 21,188.5 21,318.9 21,738.3
20 - 24 21,041.5 21,020.0 20,999.7 20,958.2
25 - 29 19,862.4 20,087.6 20,336.2 20,913.5
30 - 34 18,502.0 18,844.4 19,105.0 19,727.5
35 - 39 16,720.0 17,053.6 17,390.1 18,342.5
40 - 44 14,717.7 15,093.1 15,457.6 16,517.2
45 - 49 12,318.5 12,772.6 13,211.0 14,445.1
50 - 54 9,495.2 9,971.3 10,465.7 11,959.7
55 - 59 7,099.5 7,436.0 7,799.3 9,061.4
60 - 64 5,459.4 5,618.4 5,818.6 6,595.0
65 - 69 4,454.6 4,505.1 4,553.2 4,854.2
70 - 74 3,110.2 3,236.2 3,381.2 3,681.4
75+ 3,377.6 3,464.0 3,560.0 3,906.0
Jumlah 219,204.7 222,051.3 224,904.9 233,477.4
Source: Population Projection of Indonesia 2000 - 2025, BPS
Sumber: Proyeksi Penduduk Indonesia 2000 - 2025, BPS
Tahun/ Year
0-14 15-64 65 +
(1) (2) (3) (4) (5)
1971 44.0 53.5 2.5 86.8
1980 40.9 55.8 3.3 79.1
1990 36.5 59.6 3.9 67.8
2000 30.4 65.0 4.6 53.8
2005 *) 28.3 66.7 5.0 49.9
2010 *) 26.0 68.6 5.3 45.7
Sumber/ Source : Indikator Kesejahteraan Rakyat/ Welfare Indicators
Catatan/ Note:
*) Proyeksi Penduduk Indonesia 2000 - 2025, BPS
*) Population Projection of Indonesia 2000 - 2025, BPS
Angka Beban Tanggungan/
Dependency Ratio
Kelompok Umur/Age Groups
Propinsi/ Province 2007
(1) (4)
Nanggroe Aceh D. 4,037.9 4,053.7 4,070.2
Sumatera Utara 12,452.8 12,605.7 12,760.7
Sumatera Barat 4,402.1 4,428.0 4,453.7
R i a u 6,108.4 6,369.6 6,637.4
J a m b i 2,657.3 2,707.2 2,758.0
Sumatera Selatan 6,755.9 6,868.9 6,976.1
Bengkulu 1,617.4 1,649.0 1,683.2
Lampung 7,291.3 7,401.1 7,511.8
Bangka Belitung 971.5 986.3 1,001.0
Sumatera 46,294.6 47,069.5 47,852.1
D.K.I. Jakarta 8,699.6 8,755.7 8,814.0
Jawa Barat 39,066.7 39,750.7 40,445.5
Jawa Tengah 31,887.2 32,002.5 32,119.4
D.I. Yogyakarta 3,280.2 3,311.2 3,343.3
Jawa Timur 35,550.4 35,695.0 35,843.2
Banten 9,309.0 9,570.4 9,836.1
Jawa 127,793.1 129,085.5 130,401.5
B a l i 3,378.5 3,422.6 3,466.8
Nusa Tenggara Barat 4,355.5 4,424.0 4,492.8
Nusa Tenggara Timur 4,127.3 4,185.2 4,243.9
Bali, Nusa Tenggara 11,861.3 12,031.8 12,203.5
Kalimantan Barat 4,394.3 4,469.1 4,545.0
Kalimantan Tengah 2,137.9 2,197.4 2,257.0
Kalimantan Selatan 3,240.1 3,292.2 3,344.3
Kalimantan Timur 2,810.9 2,885.8 2,960.8
Kalimantan 12,583.2 12,844.5 13,107.1
Sulawesi Utara 2,141.9 2,169.4 2,196.7
Sulawesi Tengah 2,404.0 2,450.3 2,497.9
Sulawesi Selatan 8,493.7 8,607.7 8,698.8
Sulawesi Tenggara 2,085.9 2,141.3 2,195.7
Gorontalo 872.2 879.0 886.5
Sulawesi 15,997.7 16,247.7 16,475.6
Maluku 1,266.2 1,288.0 1,303.4
Maluku Utara 890.2 905.6 922.2
Papua 2,518.4 2,578.7 2,639.5
Maluku & Papua 4,674.8 4,772.3 4,865.1
Indonesia 219,204.7 222,051.3 224,904.9
Sumber: Proyeksi Penduduk Indonesia 2000 - 2025, BPS
Source: Population Projection of Indonesia 2000 - 2025, BPS
2005
(2)
2006
(3)
$����$����
�%#
$����$����
�%-$����$����
�%(
���
(1) (4)
Nanggroe Aceh D. 0.55 0.37 0.26
Sumatera Utara 1.35 1.20 1.05
Sumatera Barat 0.71 0.60 0.69
R i a u 4.30 4.11 3.79
J a m b i 2.00 1.85 1.68
Sumatera Selatan 1.70 1.58 1.42
Bengkulu 2.13 1.99 1.85
Lampung 1.61 1.47 1.33
Bangka Belitung 1.54 1.46 1.34
D.K.I. Jakarta 0.80 0.64 0.41
Jawa Barat 1.81 1.73 1.60
Jawa Tengah 0.42 0.35 0.26
D.I. Yogyakarta 1.00 0.95 0.81
Jawa Timur 0.45 0.40 0.31
Banten 2.83 2.75 2.63
B a l i 1.41 1.26 1.07
Nusa Tenggara Barat 1.67 1.54 1.41
Nusa Tenggara Timur 1.54 1.37 1.23
Kalimantan Barat 1.82 1.66 1.51
Kalimantan Tengah 2.87 2.68 2.48
Kalimantan Selatan 1.66 1.57 1.47
Kalimantan Timur 2.77 2.57 2.37
Sulawesi Utara 1.37 1.23 1.08
Sulawesi Tengah 2.01 1.89 1.78
Sulawesi Selatan 1.08 1.00 0.91
Sulawesi Tenggara 2.76 2.53 2.33
Gorontalo 0.91 0.78 0.67
Maluku 1.66 1.58 1.54
Maluku Utara 1.78 1.72 1.66
Papua 2.61 2.29 2.04
Indonesia 1.34 1.27 1.18
Sumber: Proyeksi Penduduk Indonesia 2000 - 2025, BPS
Source: Population Projection of Indonesia 2000 - 2025, BPS
Propinsi/ Province 2010 - 20152000- 2005 2005 - 2010
(2) (3)
'�0��������� ��������&��������������������! ���� ����������� �����������������"���#)1+
Propinsi/ Province 2010
(1) (4)
Nanggroe Aceh D. 23.6 28.8 34.3
Sumatera Utara 42.4 46.1 50.1
Sumatera Barat 29.0 34.3 39.8
R i a u 43.7 50.4 56.6
J a m b i 28.3 32.4 36.5
Sumatera Selatan 34.4 38.7 42.9
Bengkulu 29.4 35.2 41.0
Lampung 21.0 27.0 33.3
Bangka Belitung 43.0 47.8 52.2
D.K.I. Jakarta 100.0 100.0 100.0
Jawa Barat 50.3 58.8 66.2
Jawa Tengah 40.4 48.6 56.2
D.I. Yogyakarta 57.6 64.3 70.2
Jawa Timur 40.9 48.9 56.5
Banten 52.2 60.2 67.2
B a l i 49.7 57.7 64.7
Nusa Tenggara Barat 34.8 41.9 48.8
Nusa Tenggara Timur 15.4 18.0 20.7
Kalimantan Barat 24.9 27.8 31.1
Kalimantan Tengah 27.5 34.0 40.7
Kalimantan Selatan 36.2 41.5 46.7
Kalimantan Timur 57.7 62.2 66.2
Sulawesi Utara 36.6 43.4 49.8
Sulawesi Tengah 19.3 21.0 22.9
Sulawesi Selatan 29.4 32.2 35.3
Sulawesi Tenggara 20.8 23.0 25.6
Gorontalo 25.4 31.3 37.0
Maluku 25.3 26.1 26.9
Maluku Utara 28.9 29.7 30.6
Papua 22.2 22.8 23.5
Indonesia 42.0 48.3 54.2
Sumber: Proyeksi Penduduk Indonesia 2000 - 2025, BPS
Source: Population Projection Indonesia 2000 - 2025, BPS
2000
(2)
2005
(3)
��������������������� ����������������������� ������������������ ���������������������#������
$����$����
�%.$����$����
�%�
�� ��
Negara/ Country 2002 2003 2004
(1) (2) (3) (4)
Indonesia 210,74 r 213,55 r 216.38
Bangladesh 131,60 r 133,40 r 135.20
Myanmar 52,17 53,22 54.30
RRC / China, People’s Rep. of 1 284,50 1 292,30 1,299.90
Hong Kong 6,79 6,80 6.88
India 1 051,00 r 1 068,00 r 1,086.00
Korea Selatan / Korea Rep. of. 47,60 47,80 r 48.10
Malaysia 24,53 25,05 25.58
Pakistan 143,17 r 145,95 r 148.72
Filipina / Philippines 80,20 r 81,80 r 83.50
Singapura / Singapore 4,17 4,19 4.24
Srilanka 19,01 19,25 19.46
Muangthai / Thailand 63,14 r 63,66 r 64.20
Viet Nam 79,73 80,90 82.02
Source: Statistical Yearbook of Indonesia, BPS
Catatan/ Note: r Angka yang diperbaiki/ Revised figures
Sumber: Statistik Indonesia, BPS
���������������������� �$� ���������2�����$������ "� ��� �������#���������� ������������������� ���$�� ����)0���*�������+�����"���-
������,��0�&�����3�����/���������,�����"������������� ����������������������%���#"����
���������$������&�����3�����/���������,�������������� �������������������%���#"����
Laki-laki/ Male
Perempuan/ Female
Laki-laki/ Male
Perempuan/ Female
(1) (2) (3) (4) (5)15-19 4,554,518 3,166,239 4,450,060 3,213,99720-24 8,557,426 6,035,336 8,878,088 5,911,93525-29 9,068,346 5,015,808 8,948,166 5,163,87830-34 8,819,126 4,597,398 8,819,884 4,688,36535-39 8,741,198 4,587,581 8,740,263 4,557,07940-44 7,745,759 4,142,288 7,552,648 4,408,81145-49 6,593,967 3,578,062 6,492,656 3,586,17850-54 5,145,698 2,526,968 5,053,144 2,595,19655-59 3,270,463 1,873,050 3,426,805 1,782,50260+ 5,235,018 2,603,404 5,310,844 2,701,296
Jumlah/Total 67,731,519 38,126,134 67,672,558 38,609,237
Source: Labor Force Situation In Indonesia,BPS
Sumber: Keadaan Angkatan Kerja di Indonesia, BPS
Catatan/ Note: *) Pebruari/ February 2006
2005 2006 *)Golongan Umur/ Age
Group
Laki-laki/ Male
Perempuan/ Female
Laki-laki/ Male
Perempuan/ Female
(1) (2) (3) (4) (5)15-19 1,644,108 1,522,036 1,506,269 1,336,36320-24 2,301,749 1,991,743 2,197,523 1,825,58525-29 942,321 815,741 890,914 789,05830-34 365,713 434,342 384,947 415,09635-39 241,281 226,362 195,325 257,53040-44 154,904 151,197 143,949 164,26645-49 123,248 104,933 134,816 117,67750-54 117,994 72,748 110,953 78,60555-59 87,345 79,409 75,839 65,43060+ 313,770 208,322 167,696 246,852
Jumlah/Total 6,292,433 5,606,833 5,808,231 5,296,462
Source: Labor Force Situation In Indonesia,BPSCatatan/ Note : *) Pebruari/ February 2006
Sumber: Keadaan Angkatan Kerja di Indonesia, BPS
Golongan Umur/ Age
Group
2005 2006 *)
$����$����
�%
$����$����
�%��
$����$����
�%!
�� ��
Propinsi/ Province 2003 2004 2005 2006 *)(1) (2) (3) (4) (5)
Nanggroe Aceh D. 8.97 8.35 14.00 12.08Sumatera Utara 11.02 11.08 11.90 14.82Sumatera Barat 10.38 12.73 13.34 12.93R i a u 10.74 15.25 12.16 11.46J a m b i 6.50 6.04 10.74 7.77Sumatera Selatan 9.08 8.37 12.82 12.10B e n g k u l u 7.48 6.29 8.91 6.91L a m p u n g 9.14 7.38 8.47 9.76Kep. Bangka Belitung 7.37 7.14 7.19 5.95DKI Jakarta 14.86 14.70 15.77 10.69Kepulauan Riau - - - 14.31Jawa Barat 12.49 13.69 15.53 14.50Jawa Tengah 7.02 7.72 9.54 8.20DI Yogyakarta 5.62 6.26 7.59 6.25Jawa Timur 8.79 7.69 8.51 7.72Banten 14.18 14.31 16.59 16.34B a l i 5.36 4.66 5.32 5.32Nusa Tenggara Barat 6.34 7.48 10.29 8.96Nusa Tenggara Timur 4.02 4.48 4.82 4.98Kalimantan Barat 6.53 7.90 8.13 7.06Kalimantan Tengah 7.59 5.59 4.91 5.13Kalimantan Selatan 7.67 6.02 7.34 8.78Kalimantan Timur 9.69 10.39 11.17 12.11Sulawesi Utara 10.79 10.91 14.05 13.67Sulawesi Tengah 4.64 5.85 7.71 8.90Sulawesi Selatan 17.32 15.93 15.93 12.32Sulawesi Tenggara 10.30 9.35 10.93 7.42Gorontalo 10.17 12.29 14.04 9.77Sulawesi Barat - - - 4.64M a l u k u 12.63 11.67 15.01 15.76Maluku Utara 7.50 7.53 13.09 8.54Irian Jaya Barat - - - 11.17Papua 6.21 8.00 7.31 4.50
INDONESIA 9.67 9.86 11.24 10.45
Sumber: Keadaan Angkatan Kerja di Indonesia, BPSSource: Labor Force Situation in Indonesia, BPS *) Pebruari/ February 2006
$��������������$������&��������������������� ��������������("����)1+
���������������#$� �������4�������0��������������4��'���&�����'�����/�� ������� ���&'�����������������(����)���)��*���������������������)��*����������� �����#"����
������ ���������&�����3�����/���������,����������������� ��������������������%���#"����
Laki-laki/ Male
Perempuan/ Female
Laki-laki/ Male
Perempuan/ Female
(1) (2) (3) (4) (5)15-19 1,223,751 664,720 1,273,381 736,33920-24 1,548,289 1,312,378 1,729,905 1,353,90825-29 1,493,809 1,635,960 1,586,827 1,740,03930-34 1,526,907 1,806,607 1,586,944 1,750,47435-39 1,552,151 1,846,047 1,573,475 1,866,81640-44 1,550,003 1,724,342 1,444,691 1,897,43445-49 1,371,471 1,538,784 1,411,437 1,639,05050-54 1,283,890 1,180,947 1,314,376 1,246,15455-59 1,059,513 936,668 1,069,527 924,30760+ 2,236,102 1,408,747 2,366,700 1,412,846
Jumlah/Total 14,845,886 14,055,200 15,357,263 14,567,367
Source: Labor Force Situation In Indonesia,BPSCatatan/ Note : *) Pebruari/February 2006;
Sumber: Keadaan Angkatan Kerja di Indonesia, BPS
2006 *)Golongan Umur/ Age
Group
2005
Laki-laki/ Male
Perempuan/ Female
Laki-laki/ MalePerempuan/
Female(1) (2) (3) (4) (5)
1 26,891,514 14,418,262 27,468,466 14,854,7242 765,326 138,868 805,578 141,5193 7,033,757 4,919,228 6,873,835 4,704,3064 179,174 15,468 194,940 12,1625 4,465,861 99,593 4,249,018 124,9326 9,711,815 8,197,332 10,162,347 8,392,7107 5,480,334 172,507 5,268,277 199,0318 835,396 306,456 836,305 316,9879 6,075,909 4,251,587 6,005,561 4,566,404
Jumlah/Total 61,439,086 32,519,301 61,864,327 33,312,775
Lapangan Usaha/ Main
Industry
2005 2006 *)
������������ ������������������������������������������������������������������������ ���������������������������������������������!"�������������������#�����"����������������������������������$����"��%�������" ��������������������$�����������"�������!��"��������#����� ���&�����������'����(����$���������)����������%�����������������&'�����(����)������*�����(��������*����+�����*����+�����������#����+�� �������������������������������*�������������������"����)������������,��������� ��������-�����.���������/������0�������������������"�����������+���&�������������������,���1��0�����2������)�����������������������������3�'��45��������������������66%
$����$����
�%�($����$����
�%��
$����$����
�%��
�� ��
Propinsi/ Province
Tenaga Kerja/ Employees
( orang/ person)
Nilai Produksi/ Gross Output Value (Juta/
Million Rupiahs )
(1) (3) (4)
Nanggroe Aceh D. 243,603 428,513 8,640,771
Sumatera Utara 741,879 1,330,476 25,006,290
Sumatera Barat 347,389 656,052 12,671,560
R i a u 211,349 468,876 11,209,945
J a m b i 153,735 271,167 7,036,108
Sumatera Selatan 258,685 514,997 9,328,170
Bengkulu 80,133 136,627 2,002,718
Lampung 430,143 765,009 11,015,376
Bangka Belitung 55,645 107,470 2,408,025
Sumatera 2,522,561 4,679,187 89,318,964
D.K.I. Jakarta 1,053,427 2,073,623 65,607,829
Jawa Barat 2,908,228 4,719,813 86,047,038
Jawa Tengah 3,508,577 6,251,797 91,176,628
D.I. Yogyakarta 409,814 802,597 11,038,229
Jawa Timur 3,551,777 6,156,908 102,078,958
Banten 513,523 836,310 14,604,372
B a l i 290,360 523,617 8,580,636
Jawa 12,235,706 21,364,665 379,133,691
Nusa Tenggara Barat 308,940 559,588 6,046,398
Nusa Tenggara Timur 205,389 433,984 3,745,566
Nusa Tenggara 514,329 993,572 9,791,964
Kalimantan Barat 266,241 521,446 9,703,312
Kalimantan Tengah 151,795 277,532 5,000,865
Kalimantan Selatan 345,129 602,894 9,212,641
Kalimantan Timur 205,942 394,260 8,529,257
Kalimantan 969,107 1,796,132 32,446,075
Sulawesi Utara 204,445 350,721 5,561,540
Sulawesi Tengah 99,714 184,704 2,732,169
Sulawesi Selatan 320,716 596,911 8,868,216
Sulawesi Tenggara 81,619 144,276 1,484,605
Gorontalo 38,522 63,424 857,788
Sulawesi 745,016 1,340,036 19,504,318
Maluku 78,400 168,008 3,021,307
Maluku Utara 22,750 40,508 700,714
Papua 57,375 165,024 3,325,529
Maluku & Papua 158,525 373,540 7,047,550
Indonesia 17,145,244 30,547,132 537,242,562
Sumber: Profil Usaha Kecil dan Menengah tidak berbadan hukum, BPS
Source: Profile of Establishment Without Legal Entity, BPS
(2)
Banyaknya Usaha/ Number of Establishment
��4��4�/�� ��$����,��0���2��������������������/,&$�����������5��������������"� �������� �+��������������������(� �� �,�������-
������ �����
����5�����5����&������������������,�����-����"%��� ��������������������%� �����
L/ Male P/ Female L/ Male P/ Female
(1) (2) (3) (4) (5)
Nanggroe Aceh D. 65.6 69.6 65.7 69.6
Sumatera Utara 65.1 69.1 65.3 69.2
Sumatera Barat 63.5 67.4 64.1 68.0
R i a u 65.8 69.8 66.0 70.0
J a m b i 64.7 68.6 64.8 68.8
Sumatra Selatan 63.5 67.4 63.7 67.5
Bengkulu 63.3 67.1 63.5 67.3
Lampung 64.0 67.9 64.1 68.0
Bangka Belitung - - 63.6 67.5
DKI Jakarta 69.3 73.2 70.3 74.2
Jaw a Barat 62.4 66.2 62.5 66.3
Jaw a Tengah 66.3 70.3 66.8 70.8
DI Yogyakarta 69.0 72.9 70.4 74.2
Jaw a Timur 63.5 67.4 64.0 67.9
Banten - - 60.5 64.3
B a l i 67.5 71.6 67.9 71.9
Nusa Tenggara Barat 55.9 59.4 57.4 61.0
Nusa Tenggara Timur 61.7 65.5 61.8 65.6
Kalimantan Barat 62.1 65.9 62.4 66.2
Kalimantan Tengah 67.3 71.2 67.4 71.3
Kalimantan Selatan 59.1 62.8 59.4 63.1
Kalimantan Timur 67.0 71.0 67.4 71.3
Sulaw esi Utara 66.1 70.0 68.8 72.8
Sulaw esi Tengah 60.7 64.5 61.4 65.1
Sulaw esi Selatan 66.3 70.3 66.5 70.5
Sulaw esi Tenggara 63.1 66.9 63.2 67.0
Gorontalo - - 62.2 66.0
Maluku 65.4 69.3 63.5 67.4
Maluku Utara - - 61.0 64.8
Papua 62.6 66.4 63.2 67.0
Indonesia - - 64.2 68.1
Sumber/ Source :
Laporan Pembangunan Manusia Indonesia, BPS - Bappenas - UNDP
Indonesia Human Development Report, BPS - Bappenas - UNDP
1999 2002Propinsi/ Province
$����$����
(%�
$����$����
�%�-
�� �
����������������&����5���6��������#�� �������&������������������,���������� �������� �-� ������ � ������������������%���(����-)1+
7���"7���'��������� &������������������,���������#��������������������������������%���(����-
Laki-laki/ Male
Perem puan/
Female
Laki-laki/ Male
Perem puan/
Female
(1) (2) (3) (4) (5)
Nanggroe Aceh D. 98.0 94.7 97.8 93.7
Sumatera Utara 98.3 95.3 98.3 95.0
Sumatera Barat 97.4 94.0 97.8 93.9
R i a u 97.6 94.6 97.3 95.5
J a m b i 97.7 92.6 97.9 93.6
Sumatra Selatan 97.2 93.1 97.4 94.0
Bengkulu 96.2 90.9 97.0 91.3
Lampung 94.6 88.4 95.9 90.1
Kepulauan Bangka Belitung 94.5 88.5 96.2 90.7
DKI Jakarta 99.1 97.7 99.2 97.5
Jawa Barat 96.3 91.3 96.5 91.4
Jawa Tengah 91.3 80.5 92.1 81.5
DI Yogyakarta 91.3 80.4 91.9 79.9
Jawa Timur 89.4 77.6 90.5 78.9
Banten 96.4 91.1 96.6 91.4
B a l i 90.3 78.6 91.6 79.4
Nusa Tenggara Barat 82.4 68.6 83.7 71.0
Nusa Tenggara Timur 87.5 82.4 88.0 82.5
Kalimantan Barat 92.4 82.5 93.2 82.9
Kalimantan Tengah 97.5 94.7 97.5 94.9
Kalimantan Selatan 96.5 90.7 97.2 92.4
Kalimantan Timur 97.0 92.6 96.9 92.9
Sulawesi Utara 99.0 98.9 99.3 99.0
Sulawesi Tengah 95.6 91.6 95.8 93.0
Sulawesi Selatan 86.3 80.8 87.5 81.7
Sulawesi Tenggara 93.6 87.4 94.2 87.5
Gorontalo 94.8 94.6 93.9 95.3
Maluku 98.0 96.1 98.7 96.9
Maluku Utara 96.9 94.2 97.7 92.6
Papua 79.7 68.9 79.5 68.5
Indonesia 93.5 86.2 94.0 86.8
Sumber/ Source :
Indikator Kesejahteraan Rakyat, BPS/ Welfare Indicators, BPS
2003 2004
Propinsi/ Province Laki-laki/ Male
Perem puan/
Female
Laki-laki/ Male
Perem puan/
Female(1) (2) (3) (4) (5)
Nanggroe Aceh D. 8.8 7.9 8.9 8.0
Sumatera Utara 8.7 7.9 8.9 8.0
Sumatera Barat 8.1 7.7 8.2 7.7
R i a u 8.5 7.7 8.6 7.9
J a m b i 7.8 6.7 7.9 6.9
Sumatra Selatan 7.4 6.5 7.8 7.0
Bengkulu 7.9 6.9 8.3 7.3
Lampung 7.0 6.2 7.4 6.6
Kepulauan Bangka Belitung 6.8 6.0 7.0 6.0
DKI Jakarta 10.5 9.4 10.6 9.5
Jawa Barat 7.6 6.6 7.8 6.7
Jawa Tengah 6.9 5.8 7.1 6.0
DI Yogyakarta 8.8 7.5 9.0 7.5
Jawa Timur 7.0 5.8 7.2 5.9
Banten 8.1 6.9 8.3 7.1
B a l i 8.0 6.4 8.1 6.4
Nusa Tenggara Barat 6.3 4.9 6.5 5.2
Nusa Tenggara Timur 6.4 5.7 6.6 5.8
Kalimantan Barat 6.9 5.8 6.9 5.8
Kalimantan Tengah 8.0 7.1 8.2 7.3
Kalimantan Selatan 7.5 6.4 7.7 6.7
Kalimantan Timur 8.8 7.7 9.0 7.9
Sulawesi Utara 8.5 8.2 8.8 8.5
Sulawesi Tengah 7.7 7.0 7.7 7.2
Sulawesi Selatan 7.2 6.4 7.3 6.4
Sulawesi Tenggara 7.9 6.8 8.1 7.0
Gorontalo 6.4 6.6 6.6 6.9
Maluku 8.2 7.8 8.8 8.1
Maluku Utara 8.2 7.2 8.1 6.9
Papua 6.7 5.2 6.8 5.3
Indonesia 7.6 6.6 7.8 6.7
Sumber/ Source :
Indikator Kesejahteraan Rakyat BPS / Welfare Indicators BPS
2003 2004
Propinsi/ Province
$����$����
(%($����$����
(%�
� ��
���������7��� $�����������������&���&�������������������,�$��������������� ��,�����*$�0������ �������.����������!� ������/)���/������)� ������������������*���)� �������������+���� ������ ���� ������������ ���� ����*����( ����)�� �������������("���#
�������������������������*�� ��,��� ������������ $����,��� ������������������ �����������0��� �/����-�� �1�� ��� ��� �1������������1�����������-"���#
Propinsi/ Province 2003 2004 2005
(1) (2) (3) (4)
Nanggroe Aceh D. 46.44 46.50 -Sumatera Utara 46.14 49.30 44.15Sumatera Barat 45.80 54.95 44.03R i a u 45.89 41.99 40.05J a m b i 53.54 57.82 53.24Sumatra Selatan 52.98 49.01 51.49Bengkulu 46.39 46.61 42.21Lampung 56.84 58.29 58.87Bangka Belitung 44.36 43.28 46.04Kepulauan Riau - - 37.87DKI Jakarta 36.46 30.34 31.41Jawa Barat 37.31 39.09 37.46Jawa Tengah 52.26 56.46 52.67DI Yogyakarta 57.38 57.04 61.07Jawa Timur 57.39 53.70 53.91Banten 34.31 33.56 32.76B a l i 54.01 48.95 54.99Nusa Tenggara Barat 34.23 36.39 36.56Nusa Tenggara Timur 47.37 50.80 47.90Kalimantan Barat 49.87 54.61 51.42Kalimantan Tengah 57.35 58.89 51.69Kalimantan Selatan 49.78 59.11 46.77Kalimantan Timur 49.12 50.29 49.47Sulawesi Utara 50.18 49.92 40.07Sulawesi Tengah 40.23 39.16 41.61Sulawesi Selatan 45.79 46.21 41.00Sulawesi Tenggara 52.81 56.11 50.51Gorontalo 33.63 38.49 34.08Maluku 50.60 52.06 57.87Maluku Utara 38.22 51.20 40.60Papua 42.34 39.58 41.00
Indonesia 47.52 48.15 46.13
Sumber: Statistik Kesejahteraan Rakyat, BPS
Source: Welfare Statistics, BPS
Catatan/ Note :
*) Bersumber dari Pompa, Sumur terlindung dan Mata air terlindung
yang berjarak >10 m dari tempat penampungan kotoran/tinja.
*) Pipe drinking water and safety drinking water source (Pump,
protected well and spring with >10 meters from septic tank.)
Pertama/ First
Akhir/ LastPertama/
FirstAkhir/ Last
(1) (2) (3) (4) (5)
Nanggroe Aceh D. 78.25 82.25 - -Sumatera Utara 81.18 83.71 84.43 85.89Sumatera Barat 82.86 87.64 85.66 87.77R i a u 74.04 80.21 74.67 74.55J a m b i 54.79 72.03 55.83 63.20Sumatra Selatan 63.28 70.90 70.68 72.21Bengkulu 67.58 77.01 72.34 74.48Lampung 61.19 70.85 62.95 72.55Bangka Belitung 65.88 81.31 67.07 74.34Kepulauan Riau - - 93.70 93.58DKI Jakarta 97.06 97.59 95.34 95.59Jawa Barat 55.59 60.51 55.38 58.92Jawa Tengah 66.29 78.70 69.79 75.20DI Yogyakarta 84.09 89.59 84.62 91.33Jawa Timur 72.64 77.88 74.96 77.52Banten 55.47 59.68 57.47 62.29B a l i 90.72 92.71 93.16 94.02Nusa Tenggara Barat 45.03 58.73 45.07 59.26Nusa Tenggara Timur 37.06 46.11 39.01 45.26Kalimantan Barat 47.17 56.22 50.38 55.67Kalimantan Tengah 59.30 68.09 64.41 66.28Kalimantan Selatan 60.16 71.49 64.68 71.79Kalimantan Timur 77.28 82.69 74.20 77.85Sulawesi Utara 80.57 85.54 83.75 85.69Sulawesi Tengah 45.97 62.02 47.39 54.76Sulawesi Selatan 46.10 57.51 51.23 60.17Sulawesi Tenggara 37.08 43.15 35.89 45.69Gorontalo 45.13 59.35 31.20 58.61Maluku 42.27 44.70 54.40 55.19Maluku Utara 23.27 39.10 34.50 40.96Papua 52.35 59.68 49.43 51.33
Indonesia 64.34 71.52 66.14 70.46
Sumber: Statistik Kesejahteraan Rakyat, BPS
Source: Welfare Statistics, BPS
2004 2005Propinsi/ Province
$����$����
(%#$����$����
(%-
�� ��
���������8������������#"- $� ������������,�9�4������ &�����������,�&����������������� ���������������)���������&'�2�34�#�����)���"��������$� ����� �����������������("���#
����,��������4������,�����������������5�����5�����������:���������$����&�������������� ���� ��� �� � �+����20����#������ ���� ��� �� � �+�-���"%��� ��������� ���0�� ��� �� � ����������������"���(
Propinsi/ Province 2003 2004 2005
(1) (2) (3) (4)
Nanggroe Aceh D. 51.37 57.54 -
Sumatera Utara 57.05 57.67 56.76
Sumatera Barat 63.67 64.67 64.99
R i a u 61.64 63.64 64.58
J a m b i 76.01 75.54 75.99
Sumatra Selatan 71.42 73.00 72.43
Bengkulu 74.58 79.99 79.88
Lampung 78.16 78.58 80.85
Bangka Belitung 72.75 79.64 77.13
Kepulauan Riau - - 62.46
DKI Jakarta 70.89 71.83 72.25
Jawa Barat 77.26 77.04 80.91
Jawa Tengah 76.00 78.27 79.11
DI Yogyakarta 77.18 76.81 77.56
Jawa Timur 71.21 72.37 74.72
Banten 69.25 72.35 76.19
B a l i 77.96 79.12 81.89
Nusa Tenggara Barat 72.63 74.69 76.49
Nusa Tenggara Timur 48.76 50.83 50.19
Kalimantan Barat 71.56 73.02 75.34
Kalimantan Tengah 76.10 77.05 80.27
Kalimantan Selatan 79.45 79.09 80.03
Kalimantan Timur 72.22 73.16 69.69
Sulawesi Utara 82.27 84.74 85.90
Sulawesi Tengah 67.18 69.37 70.72
Sulawesi Selatan 52.62 54.74 56.54
Sulawesi Tenggara 60.38 57.90 65.31
Gorontalo 71.46 73.21 74.48
Maluku 49.18 35.05 39.78
Maluku Utara 48.89 44.49 57.41
Papua 46.68 48.25 43.50
Indonesia 70.78 71.97 74.05
Sumber: Statistik Kesejahteraan Rakyat, BPS
Source: Welfare Statistics, BPS
IMR
(2005-2010)
(1) (2)
Nanggroe Aceh D. 39 - 67.3 2.41
Sumatera Utara 27 57 70.5 2.53
Sumatera Barat 32 59 69.2 2.46
R i a u 28 60 70.1 2.39
J a m b i 32 51 69.1 2.37
Sumatra Selatan 31 49 69.2 2.29
Bengkulu 33 68 68.9 2.24
Lampung 28 64 70.1 2.49
Bangka Belitung 32 47 69.0 2.22
DKI Jakarta 14 41 74.0 1.53
Jawa Barat 32 50 69.0 2.22
Jawa Tengah 36 44 71.0 2.18
DI Yogyakarta 14 23 74.0 1.37
Jawa Timur 28 52 70.0 1.66
Banten 39 56 67.3 2.40
B a l i 20 19 72.4 1.63
Nusa Tenggara Barat 51 103 64.4 2.50
Nusa Tenggara Timur 35 73 68.4 2.74
Kalimantan Barat 34 63 68.5 2.49
Kalimantan Tengah 28 47 70.0 2.26
Kalimantan Selatan 40 57 66.9 2.18
Kalimantan Timur 23 50 71.6 2.23
Sulawesi Utara 16 33 73.6 1.91
Sulawesi Tengah 40 71 67.0 2.31
Sulawesi Selatan 33 72 68.8 2.27
Sulawesi Tenggara 32 92 69.1 2.62
Gorontalo 33 97 68.7 2.26
Maluku 37 - 67.7 2.75
Maluku Utara 43 - 66.3 2.73
Papua 34 - 68.4 2.76
Indonesia 36 46 69.8 2.12
e0
(2005-2010)0q5
(2005-2010)
(5)(3) (4)
Catatan/ Note : IMR (Infant Mortality Rate )
Source: Population Projection of Indonesia 2000 - 2025, BPS
(2002-2003)
Total of Children Who Have Been Birth By Women Age (15-49)
e0 (Harapan Hidup/ Life Expectancy )
TFR (Total Fertility Rate) Banyaknya anak yang dilahirkan wanita (15-49)/ Thn)
The Probability of Infant Who Died Before 1year old/ 1000 Birth
Sumber: Proyeksi Penduduk Indonesia 2000 - 2025, BPS
0q5 (Angka Kematian Balita)/Under Five Year Infant Mortality Rate
Probabilita bayi meninggal sebelum mencapai usia 1 tahun/ 1000 Kelahiran)
TFR Propinsi/ Province
$����$����
(%.$����$����
(%�
�� ��
��������������������� &��������������/��������� �������"������ � � �����������������������������-
������������������ ����� ������ �������
���������7���"�������,�����������&�����,������������������������$��� ���� ����"%���� �������$������ ����������("���#)7���� * ������+
7-12 13-15 16-18
(1) (2) (3) (4)
Nanggroe Aceh D. 98.7 95.0 73.3 18.7
Sumatera Utara 97.6 90.3 66.4 11.8
Sumatera Barat 97.1 88.7 66.4 22.3
R i a u 97.3 89.3 60.0 10.2
J a m b i 97.1 86.2 55.5 9.2
Sumatra Selatan 97.2 83.6 51.1 11.5
Bengkulu 97.4 87.8 61.9 11.8
Lampung 96.7 84.4 48.2 7.7
Kep. Bangka Belitung 95.3 77.3 48.2 4.7
DKI Jakarta 98.4 92.6 70.4 20.3
Jawa Barat 96.5 78.2 45.1 9.3
Jawa Tengah 98.1 84.3 51.0 10.5
DI Yogyakarta 98.8 95.0 76.0 47.0
Jawa Timur 97.4 84.6 52.8 11.6
Banten 96.9 81.9 51.4 11.1
B a l i 98.1 86.4 63.3 10.8
Nusa Tenggara Barat 94.7 76.5 47.3 10.1
Nusa Tenggara Timur 93.2 77.5 45.4 10.0
Kalimantan Barat 95.4 82.9 45.7 9.0
Kalimantan Tengah 98.4 88.4 50.4 8.1
Kalimantan Selatan 96.7 78.6 47.5 8.2
Kalimantan Timur 97.7 90.7 65.0 12.6
Sulawesi Utara 96.7 85.4 60.7 14.3
Sulawesi Tengah 96.0 77.7 46.9 10.9
Sulawesi Selatan 93.3 73.5 46.9 13.8
Sulawesi Tenggara 94.8 80.8 53.2 11.1
Gorontalo 91.5 67.0 39.2 9.5
Maluku 97.2 92.3 66.2 13.7
Maluku Utara 96.8 88.3 52.6 10.7
Papua 86.6 78.3 51.5 9.2
Indonesia 96.8 83.5 53.5 12.1
Sumber: Indikator Kesejahteraan Rakyat, 2004
Source: Walfare Indicators, 2004
19-24
(5)
Angka Partisipasi Sekolah/ School Enrollment Ratio (%)Propinsi/ Province
2003 2004 2005
(2) (3) (4)
127,957 128,459 143,672
1. Padi-padian/ Cereals 23,294 22,220 25,598
2. Umbi-umbian/ Tubers 1,465 1,795 1,838
3. Ikan/ Fish 12,071 11,960 12,881
4. Daging/ Meat 6,524 6,703 6,716
5. Telur dan Susu/ Eggs and milk 6,828 7,181 8,302
6. Sayur-sayuran/ Vegetables 10,791 10,201 11,351
7. Kacang-kacangan/ Legumes 4,278 4,116 4,723
8. Buah-buahan/ Fruits 6,687 6,134 7,351
9. Minyak dan Lemak/ Oil and Fats 5,011 5,441 5,577
10. Bahan minuman/ Beverage stuffs 5,676 5,825 6,988
11. Bumbu-bumbuan/ Spices 3,285 3,362 3,875
12.Konsumsi lainnya/ Miscellaneous foot items
2,786 2,905 3,619
13.Makanan dan minuman jadi/ Prepared food and beverages
22,068 24,202 27,729
14.Minuman yang mengandung alkohol/ Alcoholic beverages
182 197 172
15. Tembakau dan Sirih/ Tobacco and betel 17,008 16,216 16,954
96,945 106,878 123,079
1.Perumahan dan fasilitas rumah tangga/ Housing and household facility
43,067 48,606 50,792
2. Barang dan jasa/ Goods and services 28,319 31,733 40,977
3.Pakaian, alas kaki, dan tutup kepala/ Clothing, footwear and headgear
12,341 12,017 12,657
4.Barang-barang tahan lama/ Durable goods
8,013 9,765 12,285
5. Pajak dan asuransi/ Taxes and insurance 1,722 1,946 2,632
6.Keperluan pesta dan upacara/ Parties and ceremonies
3,482 2,811 3,736
C. Jumlah/ Total 224,902 235,337 266,751
Sumber: Pengeluaran Untuk Konsumsi Penduduk Indonesia, BPS
Source: Expenditure for Consumption of Indonesia per Province, BPS
Kelompok Barang/ Commodity Group
(1)
B. Bukan Makanan/ Non Food
A. Makanan/ Food
$����$����
-%�
$����$����
(%!
�� ��
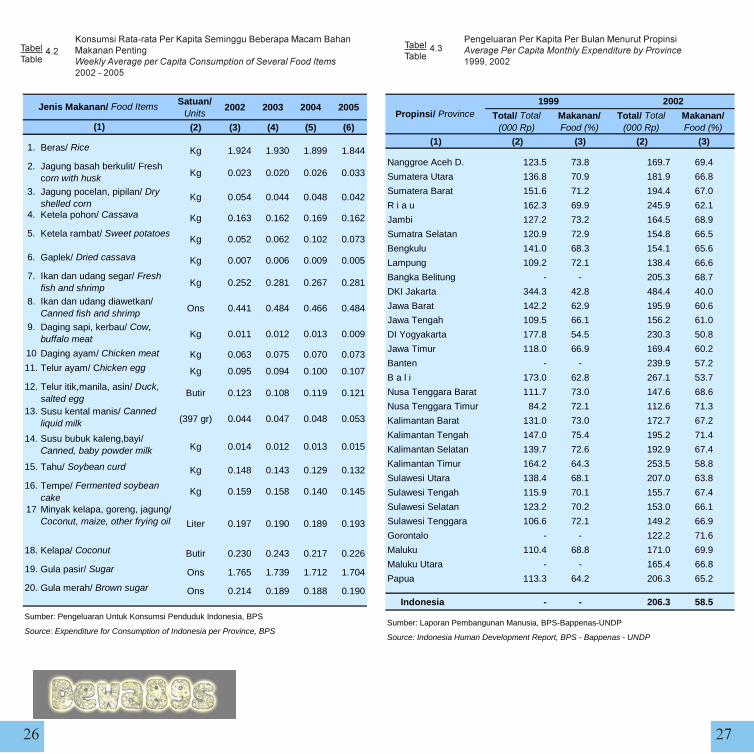
,������7���"�������,��������������������&�;���� �&���������)��*���������������$��� ��$����� ��������������0���� �������"���#
������������,������������&������������������������$��� ���� ����"%���� ��������������� �����
Satuan/ Units
2002 2003 2004 2005
(2) (3) (4) (5) (6)
1. Beras/ Rice Kg 1.924 1.930 1.899 1.844
2. Jagung basah berkulit/ Fresh corn with husk Kg 0.023 0.020 0.026 0.033
3. Jagung pocelan, pipilan/ Dry shelled corn
Kg 0.054 0.044 0.048 0.042
4. Ketela pohon/ Cassava Kg 0.163 0.162 0.169 0.162
5. Ketela rambat/ Sweet potatoesKg 0.052 0.062 0.102 0.073
6. Gaplek/ Dried cassava Kg 0.007 0.006 0.009 0.005
7. Ikan dan udang segar/ Fresh fish and shrimp Kg 0.252 0.281 0.267 0.281
8. Ikan dan udang diawetkan/ Canned fish and shrimp Ons 0.441 0.484 0.466 0.484
9. Daging sapi, kerbau/ Cow, buffalo meat Kg 0.011 0.012 0.013 0.009
10 Daging ayam/ Chicken meat Kg 0.063 0.075 0.070 0.07311. Telur ayam/ Chicken egg Kg 0.095 0.094 0.100 0.107
12. Telur itik,manila, asin/ Duck, salted egg
Butir 0.123 0.108 0.119 0.121
13. Susu kental manis/ Canned liquid milk (397 gr) 0.044 0.047 0.048 0.053
14. Susu bubuk kaleng,bayi/ Canned, baby powder milk Kg 0.014 0.012 0.013 0.015
15. Tahu/ Soybean curd Kg 0.148 0.143 0.129 0.132
16. Tempe/ Fermented soybean cake
Kg 0.159 0.158 0.140 0.145
17 Minyak kelapa, goreng, jagung/ Coconut, maize, other frying oil Liter 0.197 0.190 0.189 0.193
18. Kelapa/ Coconut Butir 0.230 0.243 0.217 0.226
19. Gula pasir/ Sugar Ons 1.765 1.739 1.712 1.704
20. Gula merah/ Brown sugar Ons 0.214 0.189 0.188 0.190
Sumber: Pengeluaran Untuk Konsumsi Penduduk Indonesia, BPS
Source: Expenditure for Consumption of Indonesia per Province, BPS
Jenis Makanan/ Food Items
(1)Total/ Total
(000 Rp)Makanan/ Food (%)
Total/ Total (000 Rp)
Makanan/ Food (%)
(1) (2) (3) (2) (3)
Nanggroe Aceh D. 123.5 73.8 169.7 69.4
Sumatera Utara 136.8 70.9 181.9 66.8
Sumatera Barat 151.6 71.2 194.4 67.0
R i a u 162.3 69.9 245.9 62.1
Jambi 127.2 73.2 164.5 68.9
Sumatra Selatan 120.9 72.9 154.8 66.5
Bengkulu 141.0 68.3 154.1 65.6
Lampung 109.2 72.1 138.4 66.6
Bangka Belitung - - 205.3 68.7
DKI Jakarta 344.3 42.8 484.4 40.0
Jawa Barat 142.2 62.9 195.9 60.6
Jawa Tengah 109.5 66.1 156.2 61.0
DI Yogyakarta 177.8 54.5 230.3 50.8
Jawa Timur 118.0 66.9 169.4 60.2
Banten - - 239.9 57.2
B a l i 173.0 62.8 267.1 53.7
Nusa Tenggara Barat 111.7 73.0 147.6 68.6
Nusa Tenggara Timur 84.2 72.1 112.6 71.3
Kalimantan Barat 131.0 73.0 172.7 67.2
Kalimantan Tengah 147.0 75.4 195.2 71.4
Kalimantan Selatan 139.7 72.6 192.9 67.4
Kalimantan Timur 164.2 64.3 253.5 58.8
Sulawesi Utara 138.4 68.1 207.0 63.8
Sulawesi Tengah 115.9 70.1 155.7 67.4
Sulawesi Selatan 123.2 70.2 153.0 66.1
Sulawesi Tenggara 106.6 72.1 149.2 66.9
Gorontalo - - 122.2 71.6
Maluku 110.4 68.8 171.0 69.9
Maluku Utara - - 165.4 66.8
Papua 113.3 64.2 206.3 65.2
Indonesia - - 206.3 58.5
Sumber: Laporan Pembangunan Manusia, BPS-Bappenas-UNDP
Source: Indonesia Human Development Report, BPS - Bappenas - UNDP
Propinsi/ Province20021999
$����$����
-%($����$����
-%�
�� �
���������� ����
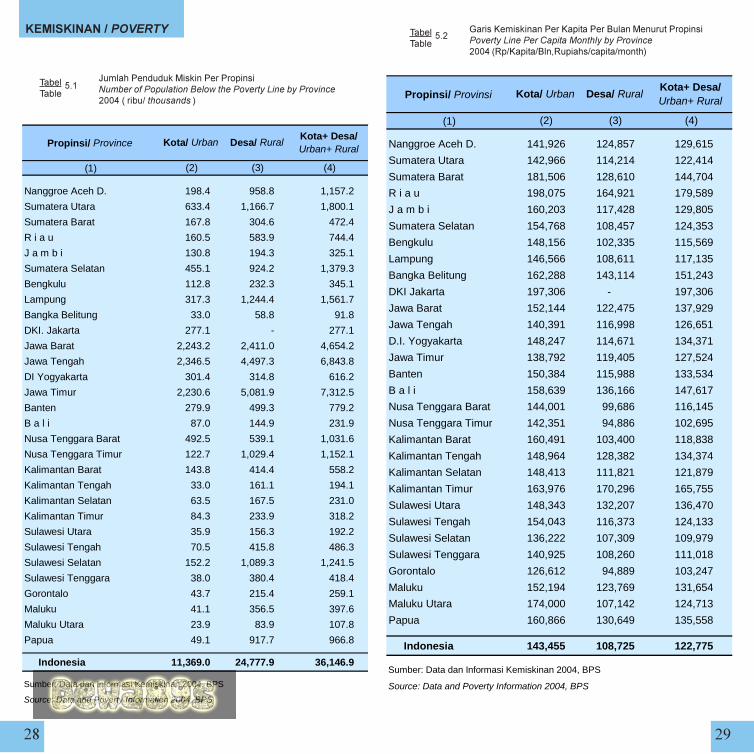
����� �������&������������������������������ ���1���!� �������� ��-����������������-)����* �������+
3����,����������,������������&����������������� ��-�������$��� ���� �����������������-)7�*,�����*���7���� �*;�����*��� +
Propinsi/ Province
(1)
Nanggroe Aceh D. 198.4 958.8 1,157.2
Sumatera Utara 633.4 1,166.7 1,800.1
Sumatera Barat 167.8 304.6 472.4
R i a u 160.5 583.9 744.4
J a m b i 130.8 194.3 325.1
Sumatera Selatan 455.1 924.2 1,379.3
Bengkulu 112.8 232.3 345.1
Lampung 317.3 1,244.4 1,561.7
Bangka Belitung 33.0 58.8 91.8
DKI. Jakarta 277.1 - 277.1
Jawa Barat 2,243.2 2,411.0 4,654.2
Jawa Tengah 2,346.5 4,497.3 6,843.8
DI Yogyakarta 301.4 314.8 616.2
Jawa Timur 2,230.6 5,081.9 7,312.5
Banten 279.9 499.3 779.2
B a l i 87.0 144.9 231.9
Nusa Tenggara Barat 492.5 539.1 1,031.6
Nusa Tenggara Timur 122.7 1,029.4 1,152.1
Kalimantan Barat 143.8 414.4 558.2
Kalimantan Tengah 33.0 161.1 194.1
Kalimantan Selatan 63.5 167.5 231.0
Kalimantan Timur 84.3 233.9 318.2
Sulawesi Utara 35.9 156.3 192.2
Sulawesi Tengah 70.5 415.8 486.3
Sulawesi Selatan 152.2 1,089.3 1,241.5
Sulawesi Tenggara 38.0 380.4 418.4
Gorontalo 43.7 215.4 259.1
Maluku 41.1 356.5 397.6
Maluku Utara 23.9 83.9 107.8
Papua 49.1 917.7 966.8
Indonesia 11,369.0 24,777.9 36,146.9
Sumber: Data dan Informasi Kemiskinan 2004, BPS
Source: Data and Poverty Information 2004, BPS
Kota+ Desa/ Urban+ Rural
(4)
Kota/ Urban Desa/ Rural
(2) (3)
Propinsi/ Provinsi
(1)
Nanggroe Aceh D. 141,926 124,857 129,615
Sumatera Utara 142,966 114,214 122,414
Sumatera Barat 181,506 128,610 144,704
R i a u 198,075 164,921 179,589
J a m b i 160,203 117,428 129,805
Sumatera Selatan 154,768 108,457 124,353
Bengkulu 148,156 102,335 115,569
Lampung 146,566 108,611 117,135
Bangka Belitung 162,288 143,114 151,243
DKI Jakarta 197,306 - 197,306
Jawa Barat 152,144 122,475 137,929
Jawa Tengah 140,391 116,998 126,651
D.I. Yogyakarta 148,247 114,671 134,371
Jawa Timur 138,792 119,405 127,524
Banten 150,384 115,988 133,534
B a l i 158,639 136,166 147,617
Nusa Tenggara Barat 144,001 99,686 116,145
Nusa Tenggara Timur 142,351 94,886 102,695
Kalimantan Barat 160,491 103,400 118,838
Kalimantan Tengah 148,964 128,382 134,374
Kalimantan Selatan 148,413 111,821 121,879
Kalimantan Timur 163,976 170,296 165,755
Sulawesi Utara 148,343 132,207 136,470
Sulawesi Tengah 154,043 116,373 124,133
Sulawesi Selatan 136,222 107,309 109,979
Sulawesi Tenggara 140,925 108,260 111,018
Gorontalo 126,612 94,889 103,247
Maluku 152,194 123,769 131,654
Maluku Utara 174,000 107,142 124,713
Papua 160,866 130,649 135,558
Indonesia 143,455 108,725 122,775
Sumber: Data dan Informasi Kemiskinan 2004, BPS
Source: Data and Poverty Information 2004, BPS
Kota+ Desa/ Urban+ Rural
(4)
Kota/ Urban Desa/ Rural
(2) (3)
$����$����
#%�
$����$����
#%�
� ��
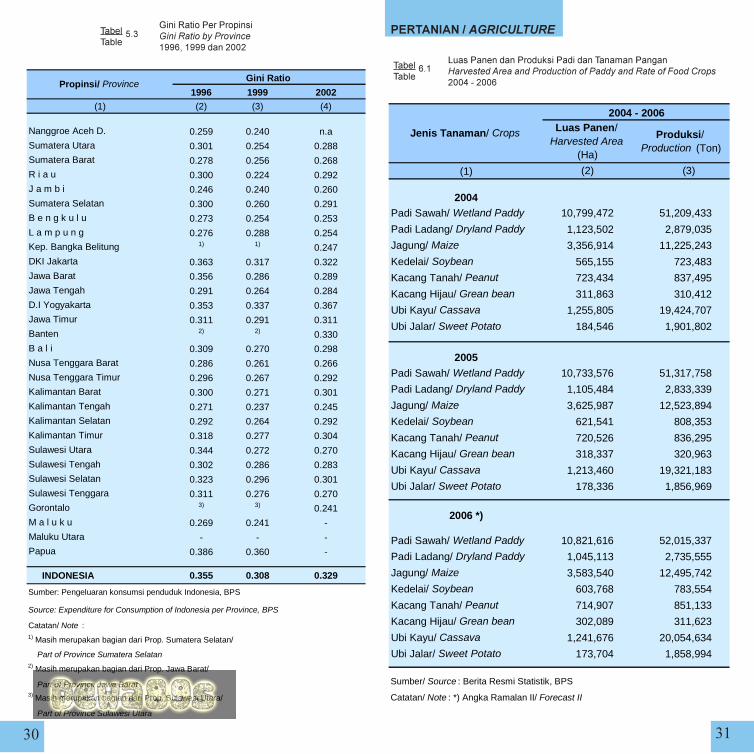
3��7������������������ � �������������� ��� ������
�������� ���������
'����������������������$��������.����� ����������������� ��������������� � �����0����$�������-"����
1996 1999 2002(1) (2) (3) (4)
Nanggroe Aceh D. 0.259 0.240 n.a
Sumatera Utara 0.301 0.254 0.288
Sumatera Barat 0.278 0.256 0.268
R i a u 0.300 0.224 0.292
J a m b i 0.246 0.240 0.260
Sumatera Selatan 0.300 0.260 0.291
B e n g k u l u 0.273 0.254 0.253
L a m p u n g 0.276 0.288 0.254
Kep. Bangka Belitung 1) 1) 0.247
DKI Jakarta 0.363 0.317 0.322
Jawa Barat 0.356 0.286 0.289
Jawa Tengah 0.291 0.264 0.284
D.I Yogyakarta 0.353 0.337 0.367
Jawa Timur 0.311 0.291 0.311
Banten 2) 2) 0.330
B a l i 0.309 0.270 0.298
Nusa Tenggara Barat 0.286 0.261 0.266
Nusa Tenggara Timur 0.296 0.267 0.292
Kalimantan Barat 0.300 0.271 0.301
Kalimantan Tengah 0.271 0.237 0.245
Kalimantan Selatan 0.292 0.264 0.292
Kalimantan Timur 0.318 0.277 0.304
Sulawesi Utara 0.344 0.272 0.270
Sulawesi Tengah 0.302 0.286 0.283
Sulawesi Selatan 0.323 0.296 0.301
Sulawesi Tenggara 0.311 0.276 0.270
Gorontalo 3) 3) 0.241
M a l u k u 0.269 0.241 -
Maluku Utara - - -
Papua 0.386 0.360 -
INDONESIA 0.355 0.308 0.329
Source: Expenditure for Consumption of Indonesia per Province, BPS
Catatan/ Note :1) Masih merupakan bagian dari Prop. Sumatera Selatan/
Part of Province Sumatera Selatan2) Masih merupakan bagian dari Prop. Jawa Barat/
Part of Province Jawa Barat3) Masih merupakan bagian dari Prop. Sulawesi Utara/
Part of Province Sulawesi Utara
Sumber: Pengeluaran konsumsi penduduk Indonesia, BPS
Gini Ratio Propinsi/ Province
(1)
2004Padi Sawah/ Wetland Paddy 10,799,472 51,209,433
Padi Ladang/ Dryland Paddy 1,123,502 2,879,035
Jagung/ Maize 3,356,914 11,225,243
Kedelai/ Soybean 565,155 723,483
Kacang Tanah/ Peanut 723,434 837,495
Kacang Hijau/ Grean bean 311,863 310,412
Ubi Kayu/ Cassava 1,255,805 19,424,707
Ubi Jalar/ Sweet Potato 184,546 1,901,802
2005Padi Sawah/ Wetland Paddy 10,733,576 51,317,758
Padi Ladang/ Dryland Paddy 1,105,484 2,833,339
Jagung/ Maize 3,625,987 12,523,894
Kedelai/ Soybean 621,541 808,353
Kacang Tanah/ Peanut 720,526 836,295
Kacang Hijau/ Grean bean 318,337 320,963
Ubi Kayu/ Cassava 1,213,460 19,321,183
Ubi Jalar/ Sweet Potato 178,336 1,856,969
2006 *)
Padi Sawah/ Wetland Paddy 10,821,616 52,015,337
Padi Ladang/ Dryland Paddy 1,045,113 2,735,555
Jagung/ Maize 3,583,540 12,495,742
Kedelai/ Soybean 603,768 783,554
Kacang Tanah/ Peanut 714,907 851,133
Kacang Hijau/ Grean bean 302,089 311,623
Ubi Kayu/ Cassava 1,241,676 20,054,634
Ubi Jalar/ Sweet Potato 173,704 1,858,994
Sumber/ Source : Berita Resmi Statistik, BPS
Catatan/ Note : *) Angka Ramalan II/ Forecast II
(2) (3)
Produksi/ Production (Ton)
Jenis Tanaman/ Crops
2004 - 2006Luas Panen/
Harvested Area (Ha)
$����$����
�%�
$����$����
#%(
�� ��
�����������������������)���$�+������ �����������������������5666���7���("����
7���"7���5����3��� &�����,������������������������������������������8���� ����-"����)7���� * ������+
Propinsi/ Province 2003 2004 2005 2006 1)
(1) (2) (3) (4) (5)
Nanggroe Aceh D. 1,548 1,552 1,412 1,463
Sumatera Utara 3,403 3,419 3,447 3,100
Sumatera Barat 1,824 1,875 1,907 1,947
R i a u 414 454 424 429
J a m b i 578 579 580 580
Sumatera Selatan 1,977 2,261 2,320 2,361
B e n g k u l u 414 415 441 409
L a m p u n g 1,966 2,092 2,124 2,134
Bangka Belitung 12 19 19 14
Riau kepulauan n.a n.a 0 0
Banten 1,692 1,813 1,862 1,888
DKI Jakarta 8 14 13 10
Jawa Barat 8,777 9,602 9,787 9,671
Jawa Tengah 8,124 8,513 8,424 8,530
DI Yogyakarta 652 693 671 722
Jawa Timur 8,915 9,002 9,007 9,186
B a l i 793 788 787 785
Nusa Tenggara B. 1,423 1,467 1,368 1,504
Nusa Tenggara T. 510 552 461 498
Kalimantan Barat 1,027 1,061 1,024 1,068
Kalimantan Tengah 490 590 492 448
Kalimantan Selatan 1,410 1,519 1,599 1,628
Kalimantan Timur 430 486 500 581
Sulawesi Utara 370 407 433 453
Gorontalo 156 163 167 172
Sulawesi Tengah 739 726 717 719
Sulawesi Selatan 4,003 3,553 3,390 3,628
Sulawesi Tenggara 334 322 340 352
Sulawesi Barat n.a n.a 254 272
M a l u k u 31 36 37 48
Maluku Utara 60 52 58 60
Papua 58 63 61 65
Irian Jaya Barat n.a n.a 25 25
INDONESIA 52,138 54,088 54,151 54,750
Sumber: Produksi Padi dan Palawija, BPS
Source: Production of Paddy and Secondary Food Crops, BPS
Catatan/ Note : 1) Angka Ramalan II/ Forecast II
GKG GKP
(1) (2) (3)
2004
Januari 1 614.17 1 313.88 1 185.42
Pebruari n.a 1 228.20 1 077.81
Maret 1 725.00 1 138.52 1 039.62
April 1 557.71 1 188.68 1 079.19
Mei 1 690.00 1 260.99 1 120.55
Juni 1 715.00 1 262.37 1 121.32
Juli 1 852.50 1 236.23 1 158.62
Agustus 1 325.00 1 235.77 1 153.35
September n.a 1 255.64 1 195.85
Oktober n.a 1 310.13 1 206.89
Nopember n.a 1 325.75 1 169.10Desember 1 534.00 1 349.21 1 204.91
2005
Januari 1 665.00 1 433.22 1 295.72
Pebruari 1 793.98 1 473.78 1 340.23
Maret 1 885.63 1 435.55 1 255.60
April 1 920.67 1 393.68 1 218.01
Mei 1 898.18 1 393.42 1 321.42
Juni 1 777.81 1 468.26 1 317.48
Juli 1 657.50 1 482.54 1 391.79
Agustus 1 747.50 1 552.09 1 488.10
September 1 793.33 1 666.92 1 504.62
Oktober 1 767.78 1 762.61 1 627.50
Nopember 2 027.50 1 807.82 1 634.04
Desember n.a 1 850.21 1 689.42
2006
Januari 2 357.35 2 038.66 1 773.57
Pebruari 2 356.46 2 066.52 1 788.54
Maret 2 500.69 1 837.14 1 610.88
April 2 240.00 1 899.94 1 633.46
Mei 2 328.95 2 052.33 1 748.04
Juni 2 384.48 2 140.07 1 775.50
Juli 2 437.83 2 051.45 1 931.48
HPP 2004 1 700.00 1 230.00
HPP 2005 1 740.00 1 330.00
HPP 2006 2 250.00 1 730.00Sumber/Source : Indikator Ekonomi/ Economic Indicators, BPS
Catatan/Note: GKG = Gabah Kering Giling/Dried Unhusked Rice
GKP = Gabah Kering Panen/Dried Harvested Rice
HPP= Harga Pembelian Pemerintah/ Guideline Purchasing Price
(4)
Harga Produsen/ Producer priceTahun, Bulan/
Year, Month Gabah Kualitas Rendah/ Bad Quality
$����$����
�%($����$����
�%�
�� ��
����� 7��� $�����������&���������/�� ������������������0����.������������������� �����(
'�������������$��������������� ����������������� ������"� � ����("���#
No. Rincian/ Description
(1) (2)
1. Pertanian/ Farm Household 24,868,675
2. Padi/ Rice Cultivation 13,770,100
3. Palawija/ Secondary Food Crops Cultivation 10,858,258
4.Padi-Palawija/ Rice Cultivation and Secondary Food Crops Cultivation
18,258,858
5. Hortikultura/ Horticulture Cultivation 8,457,228
6. Perkebunan/ Estates Cultivation 6,943,163
7. Budidaya Tanaman Kehutanan/ Forest Plant 3,427,491
8. Peternakan, Perunggasan/ Livestock, Poultry 5,627,939
9.Budidaya Ikan di Kolam Air Tawar/ Fish Cultivation in Fresh Waterponds
665,712
10.Budidaya Ikan di Sawah/ Fish Cultivation in rice field
106,533
11.Budidaya Ikan di kolam Air Tawar/Sawah/ Fish Cultivation in fresh Waterponds/ Rice field
761,458
12.Budidaya Ikan di Tambak Air Payau/ Fish Cultivation in brackish Waterponds
133,604
13. Penangkaran Satwa Liar/ Wild Animal Breeding 7,213
14.Budidaya Ikan di Laut/ Fish Cultivation in Marine Water
45,734
15.Budidaya Ikan di perairan Umum/ Fish Cultivation in Inland Water
31,341
16.Penangkapan Ikan di Laut/ Fish Catching in Marine Water
897,285
17.Penangkapan Ikan di Perairan Umum/ Fish Catching in Inland Water
708,121
18.Pemungutan Hsl Hutan/Penangkaran Satwa Liar/ Collect Forest Products Wild Animal Breeding
831,100
19. Jasa Usaha Pertanian/ Agricultural Services 1,780,174
Sumber: Sensus Pertanian 2003, BPS
Source: Census of Agriculture 2003, BPS
Jumlah/ Total
(3)2003 2004* 2005**
(1) (2) (3) (4)
Luas/ Area (000 Ha)
Karet/ Rubber 2,772.5 2,747.9 2,767.0
Kelapa/ Coconut 3,785.3 3,759.7 3,786.1
Kelapa Sawit/ Palm Oil 1,854.4 1,904.9 1,917.0
Kopi/ Coffee 1,243.2 1,248.3 1,250.0
Kakao/ Cocoa 898.9 888.9 887.7
Teh/ Tea 64.7 63.3 63.4
Kapok/ Kapok 226.7 217.5 217.5
Jambu Mete/Cashew Nut 565.4 546.4 575.0
Tembakau/ Tobacco 244.3 195.9 196.2
Karet/ Rubber 1,396.2 1,662.0 1,723.3
Kelapa/ Coconut 3,136.4 3,191.1 3,176.1
Kelapa Sawit/ Palm Oil 3,517.3 3,745.3 3,873.7
Kopi/ Coffee 645.0 646.7 647.1
Kakao/ Cocoa 657.2 586.0 586.7
Teh/ Tea 47.1 47.1 47.6
Kapok/ Kapok 88.5 89.0 89.0
Jambu Mete/Cashew Nut 106.7 118.0 129.8
Tembakau/ Tobacco 191.5 156.2 191.1
Sumber/ Source : Statistik Indonesia/ Statistical Yearbook of Indonesia
Jumlah/ TotalJenis Tanaman/ Crops
*) Angka Sementara/ Preliminary Figures
**) Angka Estimasi/ Estimated Figures
Produksi/ Production (000 Ton)
$����$����
�%#$����$����
�%-
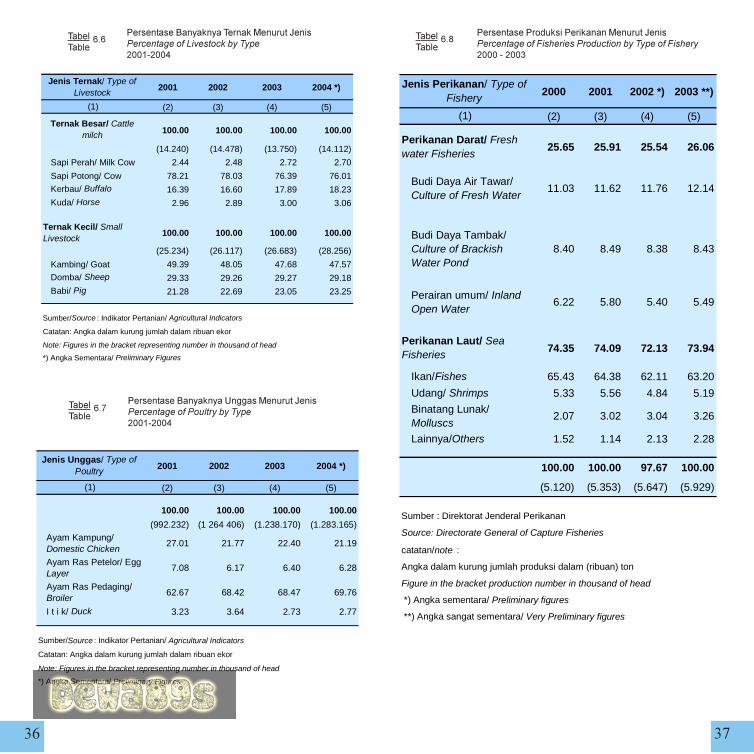
�� ��
�����������4��4�$����&�������������� �������-���� ��*������������"���-
�����������4��4�/����&�������������� ����������� ��������������"���-
������������������������&�������������� �������0��������������� ��������������0����������"���(
2001 2002 2003 2004 *)
(2) (3) (4) (5)
100.00 100.00 100.00 100.00
(14.240) (14.478) (13.750) (14.112)
Sapi Perah/ Milk Cow 2.44 2.48 2.72 2.70
Sapi Potong/ Cow 78.21 78.03 76.39 76.01
Kerbau/ Buffalo 16.39 16.60 17.89 18.23
Kuda/ Horse 2.96 2.89 3.00 3.06
100.00 100.00 100.00 100.00
(25.234) (26.117) (26.683) (28.256)
Kambing/ Goat 49.39 48.05 47.68 47.57
Domba/ Sheep 29.33 29.26 29.27 29.18
Babi/ Pig 21.28 22.69 23.05 23.25
*) Angka Sementara/ Preliminary Figures
(1)
Jenis Ternak/ Type of Livestock
Ternak Kecil/ Small Livestock
Ternak Besar/ Cattle milch
Sumber/Source : Indikator Pertanian/ Agricultural Indicators
Catatan: Angka dalam kurung jumlah dalam ribuan ekor
Note: Figures in the bracket representing number in thousand of head
2001 2002 2003 2004 *)
(2) (3) (4) (5)
100.00 100.00 100.00 100.00
(992.232) (1 264 406) (1.238.170) (1.283.165)
Ayam Kampung/ Domestic Chicken
27.01 21.77 22.40 21.19
Ayam Ras Petelor/ Egg Layer
7.08 6.17 6.40 6.28
Ayam Ras Pedaging/ Broiler
62.67 68.42 68.47 69.76
I t i k/ Duck 3.23 3.64 2.73 2.77
*) Angka Sementara/ Preliminary Figures
Note: Figures in the bracket representing number in thousand of head
Catatan: Angka dalam kurung jumlah dalam ribuan ekor
Sumber/Source : Indikator Pertanian/ Agricultural Indicators
(1)
Jenis Unggas/ Type of Poultry
$����$����
�%!$����$����
�%�
$����$����
�%.
2000 2001 2002 *) 2003 **)
(2) (3) (4) (5)
25.65 25.91 25.54 26.06
Budi Daya Air Tawar/ Culture of Fresh Water
11.03 11.62 11.76 12.14
Budi Daya Tambak/ Culture of Brackish Water Pond
8.40 8.49 8.38 8.43
Perairan umum/ Inland Open Water
6.22 5.80 5.40 5.49
74.35 74.09 72.13 73.94
Ikan/Fishes 65.43 64.38 62.11 63.20
Udang/ Shrimps 5.33 5.56 4.84 5.19
Binatang Lunak/ Molluscs
2.07 3.02 3.04 3.26
Lainnya/Others 1.52 1.14 2.13 2.28
100.00 100.00 97.67 100.00
(5.120) (5.353) (5.647) (5.929)
(1)
Jenis Perikanan/ Type of Fishery
Perikanan Darat/ Fresh water Fisheries
Figure in the bracket production number in thousand of head
*) Angka sementara/ Preliminary figures
**) Angka sangat sementara/ Very Preliminary figures
Perikanan Laut/ Sea Fisheries
Sumber : Direktorat Jenderal Perikanan
Source: Directorate General of Capture Fisheries
catatan/note :
Angka dalam kurung jumlah produksi dalam (ribuan) ton
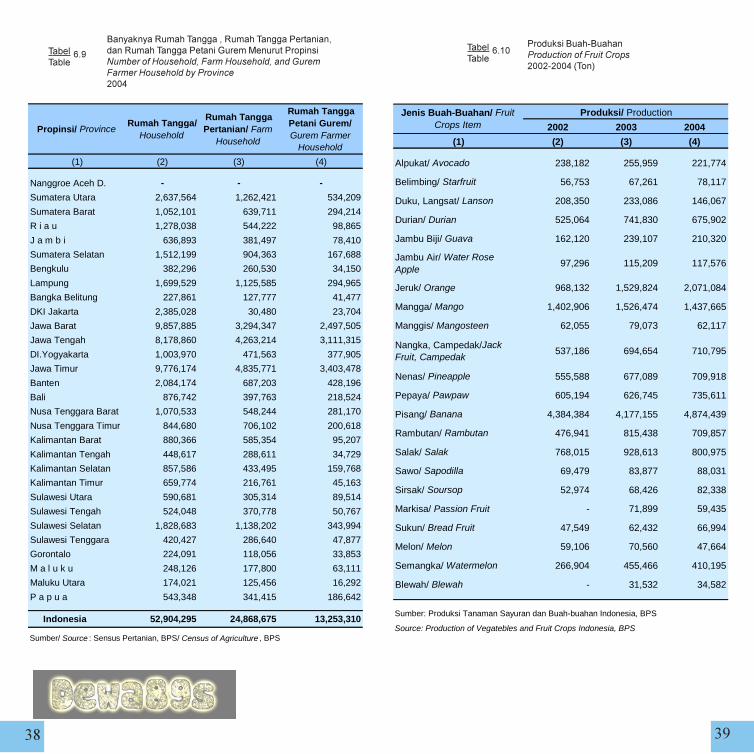
�� �
��4��4�7��� $�����7��� $��������������7��� $���������3����&����������������������.��������+�0����.��������+���������0������.����������������������-
����������� "��� ������� ������0��� �$��������"���-)$�+
Propinsi/ ProvinceRumah Tangga/
Household
Rumah Tangga Pertanian/ Farm
Household
Rumah Tangga Petani Gurem/ Gurem Farmer
Household
(1) (2) (3) (4)
Nanggroe Aceh D. - - -
Sumatera Utara 2,637,564 1,262,421 534,209
Sumatera Barat 1,052,101 639,711 294,214
R i a u 1,278,038 544,222 98,865
J a m b i 636,893 381,497 78,410
Sumatera Selatan 1,512,199 904,363 167,688
Bengkulu 382,296 260,530 34,150
Lampung 1,699,529 1,125,585 294,965
Bangka Belitung 227,861 127,777 41,477
DKI Jakarta 2,385,028 30,480 23,704
Jawa Barat 9,857,885 3,294,347 2,497,505
Jawa Tengah 8,178,860 4,263,214 3,111,315
DI.Yogyakarta 1,003,970 471,563 377,905
Jawa Timur 9,776,174 4,835,771 3,403,478
Banten 2,084,174 687,203 428,196
Bali 876,742 397,763 218,524
Nusa Tenggara Barat 1,070,533 548,244 281,170
Nusa Tenggara Timur 844,680 706,102 200,618
Kalimantan Barat 880,366 585,354 95,207
Kalimantan Tengah 448,617 288,611 34,729
Kalimantan Selatan 857,586 433,495 159,768
Kalimantan Timur 659,774 216,761 45,163
Sulawesi Utara 590,681 305,314 89,514
Sulawesi Tengah 524,048 370,778 50,767
Sulawesi Selatan 1,828,683 1,138,202 343,994
Sulawesi Tenggara 420,427 286,640 47,877
Gorontalo 224,091 118,056 33,853
M a l u k u 248,126 177,800 63,111
Maluku Utara 174,021 125,456 16,292
P a p u a 543,348 341,415 186,642
Indonesia 52,904,295 24,868,675 13,253,310
Sumber/ Source : Sensus Pertanian, BPS/ Census of Agriculture , BPS
2002 2003 2004
(1) (2) (3) (4)
Alpukat/ Avocado 238,182 255,959 221,774
Belimbing/ Starfruit 56,753 67,261 78,117
Duku, Langsat/ Lanson 208,350 233,086 146,067
Durian/ Durian 525,064 741,830 675,902
Jambu Biji/ Guava 162,120 239,107 210,320
Jambu Air/ Water Rose Apple
97,296 115,209 117,576
Jeruk/ Orange 968,132 1,529,824 2,071,084
Mangga/ Mango 1,402,906 1,526,474 1,437,665
Manggis/ Mangosteen 62,055 79,073 62,117
Nangka, Campedak/Jack Fruit, Campedak
537,186 694,654 710,795
Nenas/ Pineapple 555,588 677,089 709,918
Pepaya/ Pawpaw 605,194 626,745 735,611
Pisang/ Banana 4,384,384 4,177,155 4,874,439
Rambutan/ Rambutan 476,941 815,438 709,857
Salak/ Salak 768,015 928,613 800,975
Sawo/ Sapodilla 69,479 83,877 88,031
Sirsak/ Soursop 52,974 68,426 82,338
Markisa/ Passion Fruit - 71,899 59,435
Sukun/ Bread Fruit 47,549 62,432 66,994
Melon/ Melon 59,106 70,560 47,664
Semangka/ Watermelon 266,904 455,466 410,195
Blewah/ Blewah - 31,532 34,582
Sumber: Produksi Tanaman Sayuran dan Buah-buahan Indonesia, BPS
Source: Production of Vegatebles and Fruit Crops Indonesia, BPS
Produksi/ ProductionJenis Buah-Buahan/ Fruit Crops Item
$����$����
�%��$����$����
�%
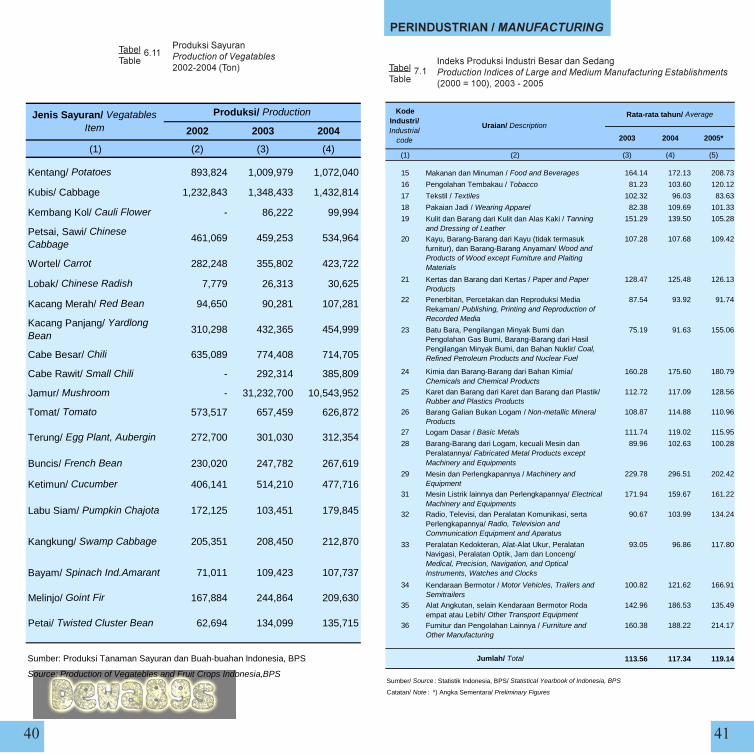
� ��
����������4��������� ������,��� ���������"���-)$�+
������������ ������������
�������������������������������������� ������������-��������������������� �����"� �������� �)����<���+����("���#
2002 2003 2004
(1) (2) (3) (4)
Kentang/ Potatoes 893,824 1,009,979 1,072,040
Kubis/ Cabbage 1,232,843 1,348,433 1,432,814
Kembang Kol/ Cauli Flower - 86,222 99,994
Petsai, Sawi/ Chinese Cabbage
461,069 459,253 534,964
Wortel/ Carrot 282,248 355,802 423,722
Lobak/ Chinese Radish 7,779 26,313 30,625
Kacang Merah/ Red Bean 94,650 90,281 107,281
Kacang Panjang/ Yardlong Bean
310,298 432,365 454,999
Cabe Besar/ Chili 635,089 774,408 714,705
Cabe Rawit/ Small Chili - 292,314 385,809
Jamur/ Mushroom - 31,232,700 10,543,952
Tomat/ Tomato 573,517 657,459 626,872
Terung/ Egg Plant, Aubergin 272,700 301,030 312,354
Buncis/ French Bean 230,020 247,782 267,619
Ketimun/ Cucumber 406,141 514,210 477,716
Labu Siam/ Pumpkin Chajota 172,125 103,451 179,845
Kangkung/ Swamp Cabbage 205,351 208,450 212,870
Bayam/ Spinach Ind.Amarant 71,011 109,423 107,737
Melinjo/ Goint Fir 167,884 244,864 209,630
Petai/ Twisted Cluster Bean 62,694 134,099 135,715
Sumber: Produksi Tanaman Sayuran dan Buah-buahan Indonesia, BPS
Source: Production of Vegatebles and Fruit Crops Indonesia,BPS
Produksi/ ProductionJenis Sayuran/ Vegatables Item
$����$����
.%�
$����$����
�%��
2003 2004 2005*
(1) (2) (3) (4) (5)
15 Makanan dan Minuman / Food and Beverages 164.14 172.13 208.73
16 Pengolahan Tembakau / Tobacco 81.23 103.60 120.12
17 Tekstil / Textiles 102.32 96.03 83.63
18 Pakaian Jadi / Wearing Apparel 82.38 109.69 101.33
19 Kulit dan Barang dari Kulit dan Alas Kaki / Tanning and Dressing of Leather
151.29 139.50 105.28
20 Kayu, Barang-Barang dari Kayu (tidak termasuk furnitur), dan Barang-Barang Anyaman/ Wood and Products of Wood except Furniture and Plaiting Materials
107.28 107.68 109.42
21 Kertas dan Barang dari Kertas / Paper and Paper Products
128.47 125.48 126.13
22 Penerbitan, Percetakan dan Reproduksi Media Rekaman/ Publishing, Printing and Reproduction of Recorded Media
87.54 93.92 91.74
23 Batu Bara, Pengilangan Minyak Bumi dan Pengolahan Gas Bumi, Barang-Barang dari Hasil Pengilangan Minyak Bumi, dan Bahan Nuklir/ Coal, Refined Petroleum Products and Nuclear Fuel
75.19 91.63 155.06
24 Kimia dan Barang-Barang dari Bahan Kimia/ Chemicals and Chemical Products
160.28 175.60 180.79
25 Karet dan Barang dari Karet dan Barang dari Plastik/ Rubber and Plastics Products
112.72 117.09 128.56
26 Barang Galian Bukan Logam / Non-metallic Mineral Products
108.87 114.88 110.96
27 Logam Dasar / Basic Metals 111.74 119.02 115.95
28 Barang-Barang dari Logam, kecuali Mesin dan Peralatannya/ Fabricated Metal Products except Machinery and Equipments
89.96 102.63 100.28
29 Mesin dan Perlengkapannya / Machinery and Equipment
229.78 296.51 202.42
31 Mesin Listrik lainnya dan Perlengkapannya/ Electrical Machinery and Equipments
171.94 159.67 161.22
32 Radio, Televisi, dan Peralatan Komunikasi, serta Perlengkapannya/ Radio, Television and Communication Equipment and Aparatus
90.67 103.99 134.24
33 Peralatan Kedokteran, Alat-Alat Ukur, Peralatan Navigasi, Peralatan Optik, Jam dan Lonceng/ Medical, Precision, Navigation, and Optical Instruments, Watches and Clocks
93.05 96.86 117.80
34 Kendaraan Bermotor / Motor Vehicles, Trailers and Semitrailers
100.82 121.62 166.91
35 Alat Angkutan, selain Kendaraan Bermotor Roda empat atau Lebih/ Other Transport Equipment
142.96 186.53 135.49
36 Furnitur dan Pengolahan Lainnya / Furniture and Other Manufacturing
160.38 188.22 214.17
113.56 117.34 119.14
Rata-rata tahun/ Average
Jumlah/ Total
Catatan/ Note : *) Angka Sementara/ Preliminary Figures
Kode Industri/ Industrial
code
Sumber/ Source : Statistik Indonesia, BPS/ Statistical Yearbook of Indonesia, BPS
Uraian/ Description
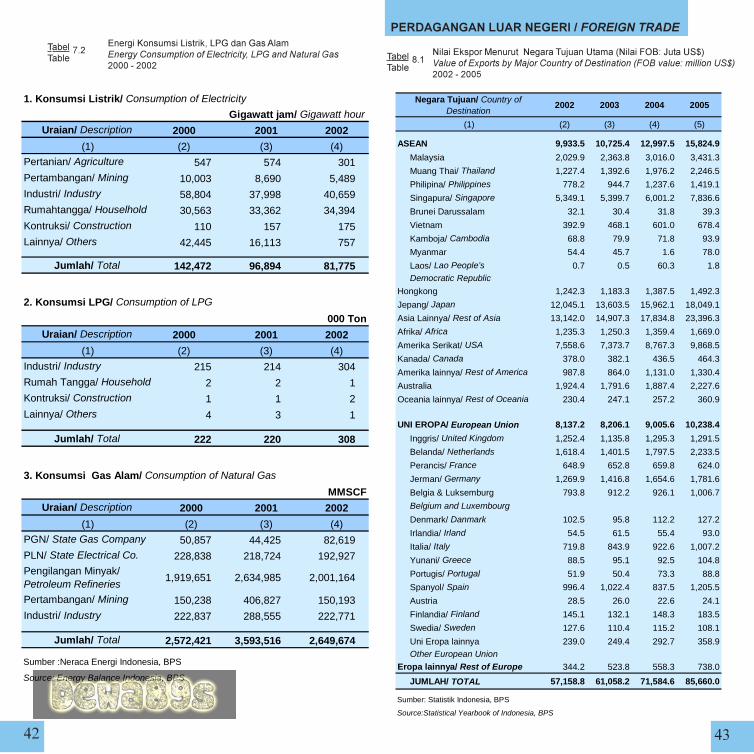
�� ��
=����,������'�������'�3��3������"�����$����� ������"��� ���� �+�-�������� ������������"����
�������������������� ����������
2����=�����&�����2�����$�0��/����)2����:>������/�?+,��������"%��� �������9���$�� ��������� �� ���50(1������:����������;7����"���#
1. Konsumsi Listrik/ Consumption of Electricity
Uraian/ Description 2000
(1) (2)
Pertanian/ Agriculture 547 574 301
Pertambangan/ Mining 10,003 8,690 5,489
Industri/ Industry 58,804 37,998 40,659
Rumahtangga/ Houselhold 30,563 33,362 34,394
Kontruksi/ Construction 110 157 175
Lainnya/ Others 42,445 16,113 757
Jumlah/ Total 142,472 96,894 81,775
2. Konsumsi LPG/ Consumption of LPG
Uraian/ Description 2000
(1) (2)
Industri/ Industry 215 214 304
Rumah Tangga/ Household 2 2 1
Kontruksi/ Construction 1 1 2
Lainnya/ Others 4 3 1
Jumlah/ Total 222 220 308
3. Konsumsi Gas Alam/ Consumption of Natural Gas
Uraian/ Description
(1)
PGN/ State Gas Company 50,857 44,425 82,619
PLN/ State Electrical Co. 228,838 218,724 192,927Pengilangan Minyak/ Petroleum Refineries
1,919,651 2,634,985 2,001,164
Pertambangan/ Mining 150,238 406,827 150,193
Industri/ Industry 222,837 288,555 222,771
Jumlah/ Total 2,572,421 3,593,516 2,649,674
Sumber :Neraca Energi Indonesia, BPS
Source: Energy Balance Indonesia, BPS
(2) (3) (4)
MMSCF
2000 2001 2002
2001 2002
Gigawatt jam/ Gigawatt hour
(3) (4)
(3) (4)
2001 2002
000 Ton
Negara Tujuan/ Country of Destination
2002 2003 2004 2005
(1) (2) (3) (4) (5)
ASEAN 9,933.5 10,725.4 12,997.5 15,824.9
Malaysia 2,029.9 2,363.8 3,016.0 3,431.3
Muang Thai/ Thailand 1,227.4 1,392.6 1,976.2 2,246.5
Philipina/ Philippines 778.2 944.7 1,237.6 1,419.1
Singapura/ Singapore 5,349.1 5,399.7 6,001.2 7,836.6
Brunei Darussalam 32.1 30.4 31.8 39.3
Vietnam 392.9 468.1 601.0 678.4
Kamboja/ Cambodia 68.8 79.9 71.8 93.9
Myanmar 54.4 45.7 1.6 78.0
Laos/ Lao People’s 0.7 0.5 60.3 1.8 Democratic Republic
Hongkong 1,242.3 1,183.3 1,387.5 1,492.3
Jepang/ Japan 12,045.1 13,603.5 15,962.1 18,049.1
Asia Lainnya/ Rest of Asia 13,142.0 14,907.3 17,834.8 23,396.3
Afrika/ Africa 1,235.3 1,250.3 1,359.4 1,669.0
Amerika Serikat/ USA 7,558.6 7,373.7 8,767.3 9,868.5
Kanada/ Canada 378.0 382.1 436.5 464.3
Amerika lainnya/ Rest of America 987.8 864.0 1,131.0 1,330.4
Australia 1,924.4 1,791.6 1,887.4 2,227.6
Oceania lainnya/ Rest of Oceania 230.4 247.1 257.2 360.9
UNI EROPA/ European Union 8,137.2 8,206.1 9,005.6 10,238.4
Inggris/ United Kingdom 1,252.4 1,135.8 1,295.3 1,291.5
Belanda/ Netherlands 1,618.4 1,401.5 1,797.5 2,233.5
Perancis/ France 648.9 652.8 659.8 624.0
Jerman/ Germany 1,269.9 1,416.8 1,654.6 1,781.6
Belgia & Luksemburg 793.8 912.2 926.1 1,006.7
Belgium and Luxembourg
Denmark/ Danmark 102.5 95.8 112.2 127.2
Irlandia/ Irland 54.5 61.5 55.4 93.0
Italia/ Italy 719.8 843.9 922.6 1,007.2
Yunani/ Greece 88.5 95.1 92.5 104.8
Portugis/ Portugal 51.9 50.4 73.3 88.8
Spanyol/ Spain 996.4 1,022.4 837.5 1,205.5
Austria 28.5 26.0 22.6 24.1
Finlandia/ Finland 145.1 132.1 148.3 183.5
Swedia/ Sweden 127.6 110.4 115.2 108.1
Uni Eropa lainnya 239.0 249.4 292.7 358.9 Other European Union
Eropa lainnya/ Rest of Europe 344.2 523.8 558.3 738.0
JUMLAH/ TOTAL 57,158.8 61,058.2 71,584.6 85,660.0
Source:Statistical Yearbook of Indonesia, BPS
Sumber: Statistik Indonesia, BPS
$����$����
!%�$����$����
.%�
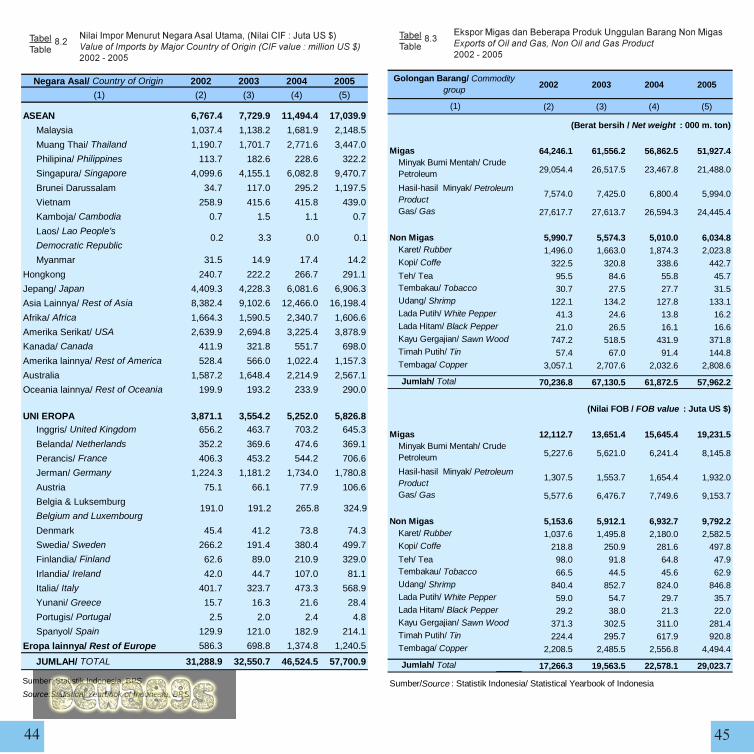
�� ��
2���������&�����2���������/�����)2����@�:�����/�?+,������������ �������9���$�� ������(�����5$0�������:�����������;7����"���#
2002 2003 2004 2005
(2) (3) (4) (5)
Migas 64,246.1 61,556.2 56,862.5 51,927.4
Minyak Bumi Mentah/ Crude Petroleum 29,054.4 26,517.5 23,467.8 21,488.0
Hasil-hasil Minyak/ Petroleum Product
7,574.0 7,425.0 6,800.4 5,994.0
Gas/ Gas 27,617.7 27,613.7 26,594.3 24,445.4
Non Migas 5,990.7 5,574.3 5,010.0 6,034.8Karet/ Rubber 1,496.0 1,663.0 1,874.3 2,023.8Kopi/ Coffe 322.5 320.8 338.6 442.7Teh/ Tea 95.5 84.6 55.8 45.7Tembakau/ Tobacco 30.7 27.5 27.7 31.5Udang/ Shrimp 122.1 134.2 127.8 133.1Lada Putih/ White Pepper 41.3 24.6 13.8 16.2Lada Hitam/ Black Pepper 21.0 26.5 16.1 16.6Kayu Gergajian/ Sawn Wood 747.2 518.5 431.9 371.8Timah Putih/ Tin 57.4 67.0 91.4 144.8Tembaga/ Copper 3,057.1 2,707.6 2,032.6 2,808.6
Jumlah/ Total 70,236.8 67,130.5 61,872.5 57,962.2
Migas 12,112.7 13,651.4 15,645.4 19,231.5
Minyak Bumi Mentah/ Crude Petroleum 5,227.6 5,621.0 6,241.4 8,145.8
Hasil-hasil Minyak/ Petroleum Product
1,307.5 1,553.7 1,654.4 1,932.0
Gas/ Gas 5,577.6 6,476.7 7,749.6 9,153.7
Non Migas 5,153.6 5,912.1 6,932.7 9,792.2Karet/ Rubber 1,037.6 1,495.8 2,180.0 2,582.5Kopi/ Coffe 218.8 250.9 281.6 497.8Teh/ Tea 98.0 91.8 64.8 47.9Tembakau/ Tobacco 66.5 44.5 45.6 62.9Udang/ Shrimp 840.4 852.7 824.0 846.8Lada Putih/ White Pepper 59.0 54.7 29.7 35.7Lada Hitam/ Black Pepper 29.2 38.0 21.3 22.0Kayu Gergajian/ Sawn Wood 371.3 302.5 311.0 281.4Timah Putih/ Tin 224.4 295.7 617.9 920.8Tembaga/ Copper 2,208.5 2,485.5 2,556.8 4,494.4
Jumlah/ Total 17,266.3 19,563.5 22,578.1 29,023.7
Sumber/Source : Statistik Indonesia/ Statistical Yearbook of Indonesia
(Berat bersih / Net weight : 000 m. ton)
(Nilai FOB / FOB value : Juta US $)
Golongan Barang/ Commodity group
(1)
=�����&��������������������/����������2�&����"%��� �����(���������+����(���������������� ����"���#
Negara Asal/ Country of Origin 2002 2003 2004 2005(1) (2) (3) (4) (5)
ASEAN 6,767.4 7,729.9 11,494.4 17,039.9
Malaysia 1,037.4 1,138.2 1,681.9 2,148.5
Muang Thai/ Thailand 1,190.7 1,701.7 2,771.6 3,447.0
Philipina/ Philippines 113.7 182.6 228.6 322.2
Singapura/ Singapore 4,099.6 4,155.1 6,082.8 9,470.7
Brunei Darussalam 34.7 117.0 295.2 1,197.5
Vietnam 258.9 415.6 415.8 439.0
Kamboja/ Cambodia 0.7 1.5 1.1 0.7
Laos/ Lao People’s
Democratic Republic
Myanmar 31.5 14.9 17.4 14.2
Hongkong 240.7 222.2 266.7 291.1
Jepang/ Japan 4,409.3 4,228.3 6,081.6 6,906.3
Asia Lainnya/ Rest of Asia 8,382.4 9,102.6 12,466.0 16,198.4
Afrika/ Africa 1,664.3 1,590.5 2,340.7 1,606.6
Amerika Serikat/ USA 2,639.9 2,694.8 3,225.4 3,878.9
Kanada/ Canada 411.9 321.8 551.7 698.0
Amerika lainnya/ Rest of America 528.4 566.0 1,022.4 1,157.3
Australia 1,587.2 1,648.4 2,214.9 2,567.1
Oceania lainnya/ Rest of Oceania 199.9 193.2 233.9 290.0
UNI EROPA 3,871.1 3,554.2 5,252.0 5,826.8 Inggris/ United Kingdom 656.2 463.7 703.2 645.3
Belanda/ Netherlands 352.2 369.6 474.6 369.1
Perancis/ France 406.3 453.2 544.2 706.6
Jerman/ Germany 1,224.3 1,181.2 1,734.0 1,780.8
Austria 75.1 66.1 77.9 106.6
Belgia & Luksemburg
Belgium and Luxembourg
Denmark 45.4 41.2 73.8 74.3
Swedia/ Sweden 266.2 191.4 380.4 499.7
Finlandia/ Finland 62.6 89.0 210.9 329.0
Irlandia/ Ireland 42.0 44.7 107.0 81.1
Italia/ Italy 401.7 323.7 473.3 568.9
Yunani/ Greece 15.7 16.3 21.6 28.4
Portugis/ Portugal 2.5 2.0 2.4 4.8
Spanyol/ Spain 129.9 121.0 182.9 214.1
Eropa lainnya/ Rest of Europe 586.3 698.8 1,374.8 1,240.5
JUMLAH/ TOTAL 31,288.9 32,550.7 46,524.5 57,700.9
Source:Statistical Yearbook of Indonesia, BPS
0.0 0.1
Sumber: Statistik Indonesia, BPS
191.0 191.2 265.8 324.9
0.2 3.3
$����$����
!%($����$����
!%�
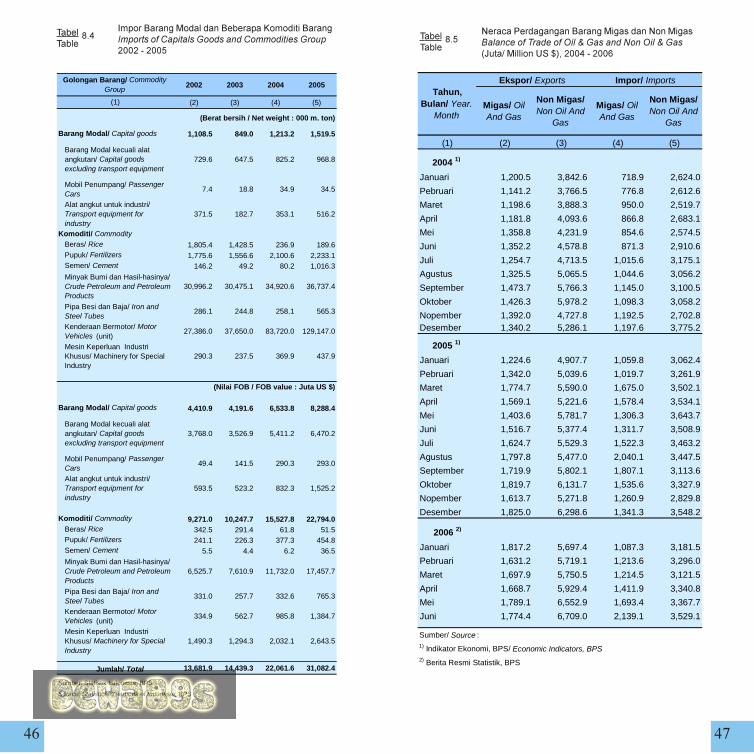
�� ��
����������&��������������,���������������� �����$��� �������������$������ �������������"���#
2���;���������������&������2�&����1������������������(���<�����������(���<����)����*&�����/�?+����-"����
2002 2003 2004 2005
(2) (3) (4) (5)
Barang Modal/ Capital goods 1,108.5 849.0 1,213.2 1,519.5
Barang Modal kecuali alat angkutan/ Capital goods excluding transport equipment
729.6 647.5 825.2 968.8
Mobil Penumpang/ Passenger Cars
7.4 18.8 34.9 34.5
Alat angkut untuk industri/ Transport equipment for industry
371.5 182.7 353.1 516.2
Komoditi/ CommodityBeras/ Rice 1,805.4 1,428.5 236.9 189.6Pupuk/ Fertilizers 1,775.6 1,556.6 2,100.6 2,233.1Semen/ Cement 146.2 49.2 80.2 1,016.3
Minyak Bumi dan Hasil-hasinya/ Crude Petroleum and Petroleum Products
30,996.2 30,475.1 34,920.6 36,737.4
Pipa Besi dan Baja/ Iron and Steel Tubes
286.1 244.8 258.1 565.3
Kenderaan Bermotor/ Motor Vehicles (unit)
27,386.0 37,650.0 83,720.0 129,147.0
Mesin Keperluan Industri Khusus/ Machinery for Special Industry
290.3 237.5 369.9 437.9
Barang Modal/ Capital goods 4,410.9 4,191.6 6,533.8 8,288.4
Barang Modal kecuali alat angkutan/ Capital goods excluding transport equipment
3,768.0 3,526.9 5,411.2 6,470.2
Mobil Penumpang/ Passenger Cars
49.4 141.5 290.3 293.0
Alat angkut untuk industri/ Transport equipment for industry
593.5 523.2 832.3 1,525.2
Komoditi/ Commodity 9,271.0 10,247.7 15,527.8 22,794.0Beras/ Rice 342.5 291.4 61.8 51.5Pupuk/ Fertilizers 241.1 226.3 377.3 454.8Semen/ Cement 5.5 4.4 6.2 36.5Minyak Bumi dan Hasil-hasinya/ Crude Petroleum and Petroleum Products
6,525.7 7,610.9 11,732.0 17,457.7
Pipa Besi dan Baja/ Iron and Steel Tubes
331.0 257.7 332.6 765.3
Kenderaan Bermotor/ Motor Vehicles (unit)
334.9 562.7 985.8 1,384.7
Mesin Keperluan Industri Khusus/ Machinery for Special Industry
1,490.3 1,294.3 2,032.1 2,643.5
13,681.9 14,439.3 22,061.6 31,082.4
Sumber: Statistik Indonesia, BPS
Source: Statistical Yearbook of Indonesia, BPS
Jumlah/ Total
(Berat bersih / Net weight : 000 m. ton)
(Nilai FOB / FOB value : Juta US $)
Golongan Barang/ Commodity Group
(1) Migas/ Oil And Gas
Non Migas/ Non Oil And
Gas
Migas/ Oil And Gas
Non Migas/ Non Oil And
Gas
(1) (2) (3) (4) (5)
2004 1)
Januari 1,200.5 3,842.6 718.9 2,624.0
Pebruari 1,141.2 3,766.5 776.8 2,612.6
Maret 1,198.6 3,888.3 950.0 2,519.7
April 1,181.8 4,093.6 866.8 2,683.1
Mei 1,358.8 4,231.9 854.6 2,574.5
Juni 1,352.2 4,578.8 871.3 2,910.6
Juli 1,254.7 4,713.5 1,015.6 3,175.1
Agustus 1,325.5 5,065.5 1,044.6 3,056.2
September 1,473.7 5,766.3 1,145.0 3,100.5
Oktober 1,426.3 5,978.2 1,098.3 3,058.2
Nopember 1,392.0 4,727.8 1,192.5 2,702.8Desember 1,340.2 5,286.1 1,197.6 3,775.2
2005 1)
Januari 1,224.6 4,907.7 1,059.8 3,062.4
Pebruari 1,342.0 5,039.6 1,019.7 3,261.9
Maret 1,774.7 5,590.0 1,675.0 3,502.1
April 1,569.1 5,221.6 1,578.4 3,534.1
Mei 1,403.6 5,781.7 1,306.3 3,643.7
Juni 1,516.7 5,377.4 1,311.7 3,508.9
Juli 1,624.7 5,529.3 1,522.3 3,463.2
Agustus 1,797.8 5,477.0 2,040.1 3,447.5
September 1,719.9 5,802.1 1,807.1 3,113.6
Oktober 1,819.7 6,131.7 1,535.6 3,327.9
Nopember 1,613.7 5,271.8 1,260.9 2,829.8
Desember 1,825.0 6,298.6 1,341.3 3,548.2
2006 2)
Januari 1,817.2 5,697.4 1,087.3 3,181.5
Pebruari 1,631.2 5,719.1 1,213.6 3,296.0
Maret 1,697.9 5,750.5 1,214.5 3,121.5
April 1,668.7 5,929.4 1,411.9 3,340.8
Mei 1,789.1 6,552.9 1,693.4 3,367.7
Juni 1,774.4 6,709.0 2,139.1 3,529.1
Sumber/ Source : 1) Indikator Ekonomi, BPS/ Economic Indicators, BPS2) Berita Resmi Statistik, BPS
Ekspor/ Exports Impor/ ImportsTahun,
Bulan/ Year. Month
$����$����
!%#$����$����
!%-
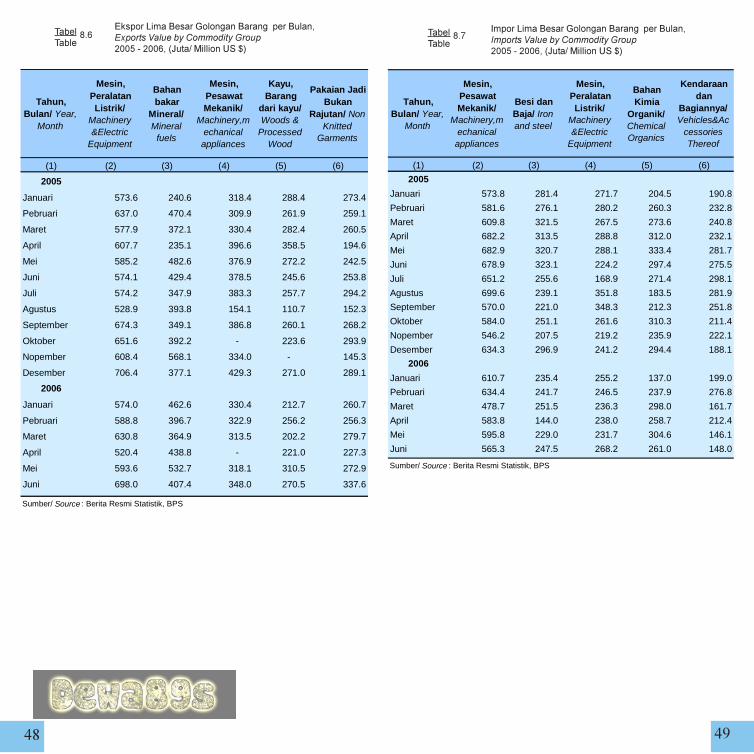
�� �
=�����'��������3������������������"%��� ��,��������$������ ����������#"�����)����*&�����/�?+
�����'��������3���������������������� ��,��������$������ ����������#"�����)����*&�����/�?+
Tahun, Bulan/ Year,
Month
Mesin, Peralatan Listrik/
Machinery &Electric
Equipment
Bahan bakar
Mineral/ Mineral
fuels
Mesin, Pesawat Mekanik/
Machinery,mechanical appliances
Kayu, Barang
dari kayu/ Woods &
Processed Wood
Pakaian Jadi Bukan
Rajutan/ Non Knitted
Garments
(1) (2) (3) (4) (5) (6)
2005
Januari 573.6 240.6 318.4 288.4 273.4
Pebruari 637.0 470.4 309.9 261.9 259.1
Maret 577.9 372.1 330.4 282.4 260.5
April 607.7 235.1 396.6 358.5 194.6
Mei 585.2 482.6 376.9 272.2 242.5
Juni 574.1 429.4 378.5 245.6 253.8
Juli 574.2 347.9 383.3 257.7 294.2
Agustus 528.9 393.8 154.1 110.7 152.3
September 674.3 349.1 386.8 260.1 268.2
Oktober 651.6 392.2 - 223.6 293.9
Nopember 608.4 568.1 334.0 - 145.3
Desember 706.4 377.1 429.3 271.0 289.1
2006
Januari 574.0 462.6 330.4 212.7 260.7
Pebruari 588.8 396.7 322.9 256.2 256.3
Maret 630.8 364.9 313.5 202.2 279.7
April 520.4 438.8 - 221.0 227.3
Mei 593.6 532.7 318.1 310.5 272.9
Juni 698.0 407.4 348.0 270.5 337.6
Sumber/ Source : Berita Resmi Statistik, BPS
Tahun, Bulan/ Year,
Month
Mesin, Pesawat Mekanik/
Machinery,mechanical appliances
Besi dan Baja/ Iron and steel
Mesin, Peralatan Listrik/
Machinery &Electric
Equipment
Bahan Kimia
Organik/ Chemical Organics
Kendaraan dan
Bagiannya/ Vehicles&Ac
cessories Thereof
(1) (2) (3) (4) (5) (6)
2005
Januari 573.8 281.4 271.7 204.5 190.8
Pebruari 581.6 276.1 280.2 260.3 232.8
Maret 609.8 321.5 267.5 273.6 240.8
April 682.2 313.5 288.8 312.0 232.1
Mei 682.9 320.7 288.1 333.4 281.7
Juni 678.9 323.1 224.2 297.4 275.5
Juli 651.2 255.6 168.9 271.4 298.1
Agustus 699.6 239.1 351.8 183.5 281.9
September 570.0 221.0 348.3 212.3 251.8
Oktober 584.0 251.1 261.6 310.3 211.4
Nopember 546.2 207.5 219.2 235.9 222.1
Desember 634.3 296.9 241.2 294.4 188.1
2006
Januari 610.7 235.4 255.2 137.0 199.0
Pebruari 634.4 241.7 246.5 237.9 276.8
Maret 478.7 251.5 236.3 298.0 161.7
April 583.8 144.0 238.0 258.7 212.4
Mei 595.8 229.0 231.7 304.6 146.1
Juni 565.3 247.5 268.2 261.0 148.0
Sumber/ Source : Berita Resmi Statistik, BPS
$����$����
!%.$����$����
!%�
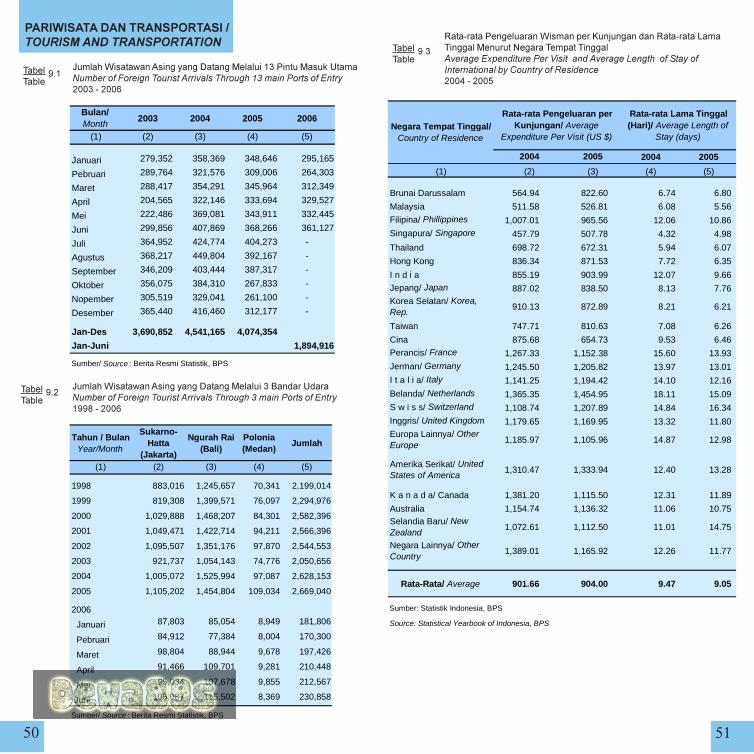
� ��
����������������������� �������������� �����
����� 8�����9�����4�������&�������(����&����/��������������0������������ ������������������&=�������� �����" �����("����
����� 8�����9�����4�������&������(�����/��������������0������������ ������������������=�������� �����" ��� !"����
7���"�������������8�������,�0�����7���"����'���$�����&�����2�����$�����$�������������"%���� ��������,��� �������������-�� ������� ����� ��� ��������$�� ������ ����������-"���#
Bulan/ Month
2003 2004 2005 2006
(1) (2) (3) (4) (5)
Januari 279,352 358,369 348,646 295,165
Pebruari 289,764 321,576 309,006 264,303
Maret 288,417 354,291 345,964 312,349
April 204,565 322,146 333,694 329,527
Mei 222,486 369,081 343,911 332,445
Juni 299,856 407,869 368,266 361,127
Juli 364,952 424,774 404,273 -
Agustus 368,217 449,804 392,167 -
September 346,209 403,444 387,317 -
Oktober 356,075 384,310 267,833 -
Nopember 305,519 329,041 261,100 -
Desember 365,440 416,460 312,177 -
Jan-Des 3,690,852 4,541,165 4,074,354
Jan-Juni 1,894,916
Sumber/ Source : Berita Resmi Statistik, BPS
Tahun / Bulan Year/Month
Sukarno-Hatta
(Jakarta)
Ngurah Rai (Bali)
Polonia (Medan)
Jumlah
(1) (2) (3) (4) (5)
1998 883,016 1,245,657 70,341 2,199,014
1999 819,308 1,399,571 76,097 2,294,976
2000 1,029,888 1,468,207 84,301 2,582,396
2001 1,049,471 1,422,714 94,211 2,566,396
2002 1,095,507 1,351,176 97,870 2,544,553
2003 921,737 1,054,143 74,776 2,050,656
2004 1,005,072 1,525,994 97,087 2,628,153
2005 1,105,202 1,454,804 109,034 2,669,040
2006
Januari 87,803 85,054 8,949 181,806
Pebruari 84,912 77,384 8,004 170,300
Maret 98,804 88,944 9,678 197,426
April 91,466 109,701 9,281 210,448
Mei 95,034 107,678 9,855 212,567
Juni 106,987 115,502 8,369 230,858
Sumber/ Source : Berita Resmi Statistik, BPS
2004 2005
(1) (4) (5)
Brunai Darussalam 564.94 822.60 6.74 6.80
Malaysia 511.58 526.81 6.08 5.56
Filipina/ Phillippines 1,007.01 965.56 12.06 10.86
Singapura/ Singapore 457.79 507.78 4.32 4.98
Thailand 698.72 672.31 5.94 6.07
Hong Kong 836.34 871.53 7.72 6.35
I n d i a 855.19 903.99 12.07 9.66
Jepang/ Japan 887.02 838.50 8.13 7.76Korea Selatan/ Korea, Rep.
910.13 872.89 8.21 6.21
Taiwan 747.71 810.63 7.08 6.26
Cina 875.68 654.73 9.53 6.46
Perancis/ France 1,267.33 1,152.38 15.60 13.93
Jerman/ Germany 1,245.50 1,205.82 13.97 13.01
I t a l i a/ Italy 1,141.25 1,194.42 14.10 12.16
Belanda/ Netherlands 1,365.35 1,454.95 18.11 15.09
S w i s s/ Switzerland 1,108.74 1,207.89 14.84 16.34
Inggris/ United Kingdom 1,179.65 1,169.95 13.32 11.80Europa Lainnya/ Other Europe
1,185.97 1,105.96 14.87 12.98
Amerika Serikat/ United States of America
1,310.47 1,333.94 12.40 13.28
K a n a d a/ Canada 1,381.20 1,115.50 12.31 11.89
Australia 1,154.74 1,136.32 11.06 10.75Selandia Baru/ New Zealand
1,072.61 1,112.50 11.01 14.75
Negara Lainnya/ Other Country
1,389.01 1,165.92 12.26 11.77
Rata-Rata/ Average 901.66 904.00 9.47 9.05
Source: Statistical Yearbook of Indonesia, BPS
2004 2005
Sumber: Statistik Indonesia, BPS
Negara Tempat Tinggal/ Country of Residence
Rata-rata Lama Tinggal (Hari)/ Average Length of
Stay (days)
Rata-rata Pengeluaran per Kunjungan/ Average
Expenditure Per Visit (US $)
(3)(2)
$����$����
%(
$����$����
%�
$����$����
%�
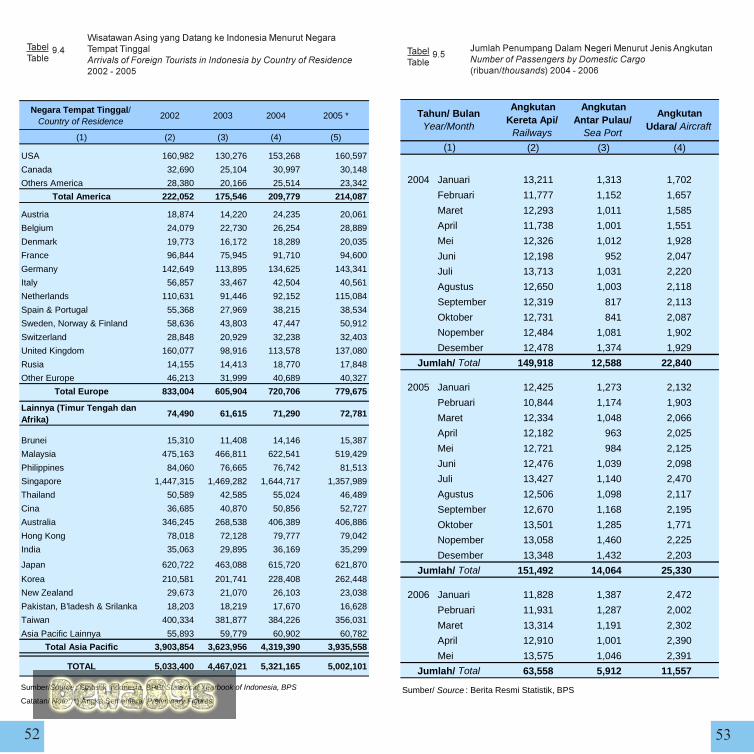
�� ��
8�����9�����4����������������&�����2�����$�����$�����������������0������������ ��������������$�� ������ �����������"���#
����� ������������2�����&������������������������������������������� ���$����)�����* �������+���-"����
Negara Tempat Tinggal/ Country of Residence
2002 2003 2004 2005 *
(1) (2) (3) (4) (5)
USA 160,982 130,276 153,268 160,597
Canada 32,690 25,104 30,997 30,148
Others America 28,380 20,166 25,514 23,342
Total America 222,052 175,546 209,779 214,087
Austria 18,874 14,220 24,235 20,061
Belgium 24,079 22,730 26,254 28,889
Denmark 19,773 16,172 18,289 20,035
France 96,844 75,945 91,710 94,600
Germany 142,649 113,895 134,625 143,341
Italy 56,857 33,467 42,504 40,561
Netherlands 110,631 91,446 92,152 115,084
Spain & Portugal 55,368 27,969 38,215 38,534
Sweden, Norway & Finland 58,636 43,803 47,447 50,912
Switzerland 28,848 20,929 32,238 32,403
United Kingdom 160,077 98,916 113,578 137,080
Rusia 14,155 14,413 18,770 17,848
Other Europe 46,213 31,999 40,689 40,327
Total Europe 833,004 605,904 720,706 779,675
Lainnya (Timur Tengah dan Afrika)
74,490 61,615 71,290 72,781
Brunei 15,310 11,408 14,146 15,387
Malaysia 475,163 466,811 622,541 519,429
Philippines 84,060 76,665 76,742 81,513
Singapore 1,447,315 1,469,282 1,644,717 1,357,989
Thailand 50,589 42,585 55,024 46,489
Cina 36,685 40,870 50,856 52,727
Australia 346,245 268,538 406,389 406,886
Hong Kong 78,018 72,128 79,777 79,042
India 35,063 29,895 36,169 35,299
Japan 620,722 463,088 615,720 621,870
Korea 210,581 201,741 228,408 262,448
New Zealand 29,673 21,070 26,103 23,038
Pakistan, B’ladesh & Srilanka 18,203 18,219 17,670 16,628
Taiwan 400,334 381,877 384,226 356,031
Asia Pacific Lainnya 55,893 59,779 60,902 60,782
Total Asia Pacific 3,903,854 3,623,956 4,319,390 3,935,558
TOTAL 5,033,400 4,467,021 5,321,165 5,002,101
Sumber/Source : Statistik Indonesia, BPS/ Statistical Yearbook of Indonesia, BPS
Catatan/ Note: *) Angka Sementara/ Preliminary Figures
$����$����
%#$����$����
%-
2004 Januari 13,211 1,313 1,702
Februari 11,777 1,152 1,657
Maret 12,293 1,011 1,585
April 11,738 1,001 1,551
Mei 12,326 1,012 1,928
Juni 12,198 952 2,047
Juli 13,713 1,031 2,220
Agustus 12,650 1,003 2,118
September 12,319 817 2,113
Oktober 12,731 841 2,087
Nopember 12,484 1,081 1,902
Desember 12,478 1,374 1,929
149,918 12,588 22,840
2005 Januari 12,425 1,273 2,132
Pebruari 10,844 1,174 1,903
Maret 12,334 1,048 2,066
April 12,182 963 2,025
Mei 12,721 984 2,125
Juni 12,476 1,039 2,098
Juli 13,427 1,140 2,470
Agustus 12,506 1,098 2,117
September 12,670 1,168 2,195
Oktober 13,501 1,285 1,771
Nopember 13,058 1,460 2,225
Desember 13,348 1,432 2,203
151,492 14,064 25,330
2006 Januari 11,828 1,387 2,472
Pebruari 11,931 1,287 2,002
Maret 13,314 1,191 2,302
April 12,910 1,001 2,390
Mei 13,575 1,046 2,391
63,558 5,912 11,557
Sumber/ Source : Berita Resmi Statistik, BPS
(2)
Angkutan Antar Pulau/
Sea Port
(3)
Angkutan Udara/ Aircraft
(4)
Tahun/ Bulan Year/Month
Angkutan Kereta Api/
Railways
Jumlah/ Total
Jumlah/ Total
Jumlah/ Total
(1)
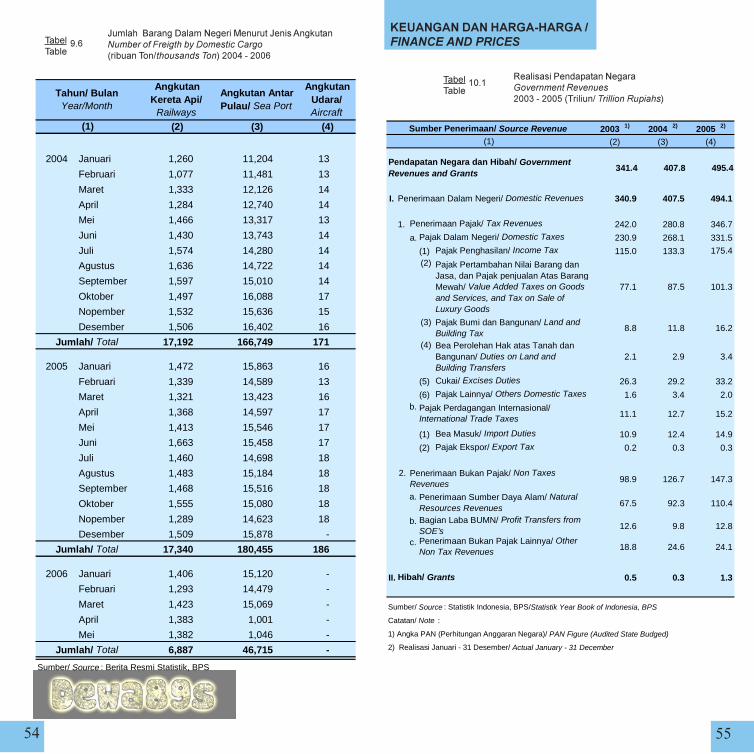
����
����� ����������2�����&�������������������������0���� ���������� ���$����)�����$�* ����������+���-"����
���������������������� ������������ ����
7����������������2������������ � ���������("���#)$�����*�������� ������+
2003 1) 2004 2) 2005 2)
(2) (3) (4)
341.4 407.8 495.4
I. 340.9 407.5 494.1
1. Penerimaan Pajak/ Tax Revenues 242.0 280.8 346.7
a. Pajak Dalam Negeri/ Domestic Taxes 230.9 268.1 331.5
(1) Pajak Penghasilan/ Income Tax 115.0 133.3 175.4(2) Pajak Pertambahan Nilai Barang dan
Jasa, dan Pajak penjualan Atas Barang Mewah/ Value Added Taxes on Goods and Services, and Tax on Sale of Luxury Goods
77.1 87.5 101.3
(3) Pajak Bumi dan Bangunan/ Land and Building Tax
8.8 11.8 16.2
(4) Bea Perolehan Hak atas Tanah dan Bangunan/ Duties on Land and Building Transfers
2.1 2.9 3.4
(5) Cukai/ Excises Duties 26.3 29.2 33.2
(6) Pajak Lainnya/ Others Domestic Taxes 1.6 3.4 2.0b.
11.1 12.7 15.2
(1) Bea Masuk/ Import Duties 10.9 12.4 14.9
(2) Pajak Ekspor/ Export Tax 0.2 0.3 0.3
2.98.9 126.7 147.3
a.67.5 92.3 110.4
b.12.6 9.8 12.8
c. 18.8 24.6 24.1
II. Hibah/ Grants 0.5 0.3 1.3
Sumber/ Source : Statistik Indonesia, BPS/Statistik Year Book of Indonesia, BPS
Catatan/ Note :
1) Angka PAN (Perhitungan Anggaran Negara)/ PAN Figure (Audited State Budged)
2) Realisasi Januari - 31 Desember/ Actual January - 31 December
Sumber Penerimaan/ Source Revenue(1)
Penerimaan Sumber Daya Alam/ Natural Resources RevenuesBagian Laba BUMN/ Profit Transfers from SOE’sPenerimaan Bukan Pajak Lainnya/ Other Non Tax Revenues
Pendapatan Negara dan Hibah/ Government Revenues and Grants
Penerimaan Dalam Negeri/ Domestic Revenues
Pajak Perdagangan Internasional/ International Trade Taxes
Penerimaan Bukan Pajak/ Non Taxes Revenues
$����$����
��%�
$����$����
%�
2004 Januari 1,260 11,204 13
Februari 1,077 11,481 13
Maret 1,333 12,126 14
April 1,284 12,740 14
Mei 1,466 13,317 13
Juni 1,430 13,743 14
Juli 1,574 14,280 14
Agustus 1,636 14,722 14
September 1,597 15,010 14
Oktober 1,497 16,088 17
Nopember 1,532 15,636 15
Desember 1,506 16,402 16
17,192 166,749 171
2005 Januari 1,472 15,863 16
Februari 1,339 14,589 13
Maret 1,321 13,423 16
April 1,368 14,597 17
Mei 1,413 15,546 17
Juni 1,663 15,458 17
Juli 1,460 14,698 18
Agustus 1,483 15,184 18
September 1,468 15,516 18
Oktober 1,555 15,080 18
Nopember 1,289 14,623 18
Desember 1,509 15,878 -
17,340 180,455 186
2006 Januari 1,406 15,120 -
Februari 1,293 14,479 -
Maret 1,423 15,069 -
April 1,383 1,001 -
Mei 1,382 1,046 -
6,887 46,715 -
Sumber/ Source : Berita Resmi Statistik, BPS
(2)
Angkutan Antar Pulau/ Sea Port
(3)
Angkutan Udara/ Aircraft
(4)
Tahun/ Bulan Year/Month
Angkutan Kereta Api/
Railways
Jumlah/ Total
Jumlah/ Total
Jumlah/ Total
(1)
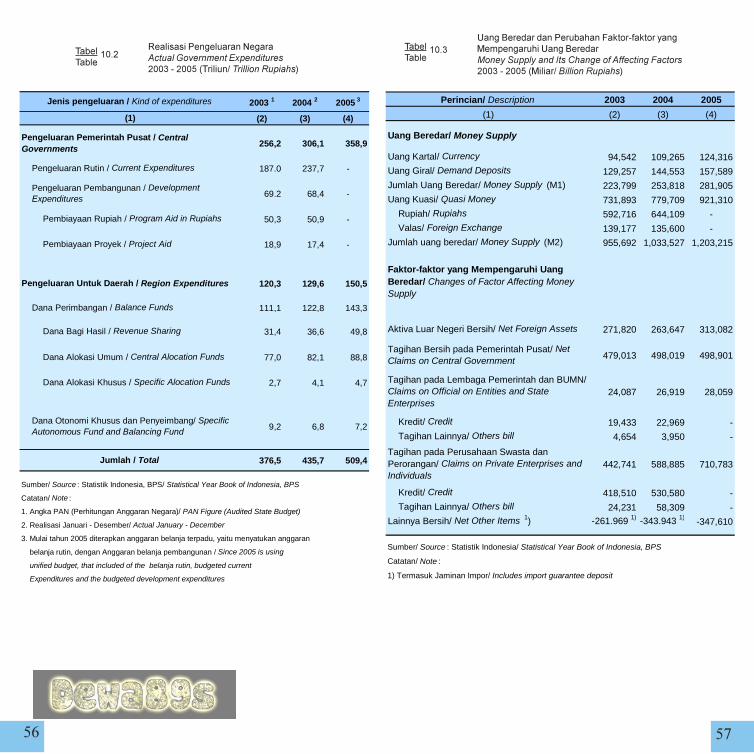
����
/����������������� �:�����"6�����4��&�������� �/������������������������ ��$������������� ���0�� ������("���#)&�����*1������ ������+
7�����������������2������� ����������� �"%���� �������("���#)$�����*�������� ������+
2003 1 2004 2 2005 3
(2) (3) (4)
256,2 306,1 358,9
187.0 237,7 -
69.2 68,4 -
50,3 50,9 -
18,9 17,4 -
120,3 129,6 150,5
111,1 122,8 143,3
31,4 36,6 49,8
77,0 82,1 88,8
2,7 4,1 4,7
9,2 6,8 7,2
376,5 435,7 509,4
Expenditures and the budgeted development expenditures
Sumber/ Source : Statistik Indonesia, BPS/ Statistical Year Book of Indonesia, BPS
Jenis pengeluaran / Kind of expenditures
(1)
Pengeluaran Pemerintah Pusat / Central Governments
Pengeluaran Rutin / Current Expenditures
Pengeluaran Pembangunan / Development Expenditures
Pembiayaan Rupiah / Program Aid in Rupiahs
Pembiayaan Proyek / Project Aid
Pengeluaran Untuk Daerah / Region Expenditures
Dana Perimbangan / Balance Funds
Jumlah / Total
Catatan/ Note :
Dana Bagi Hasil / Revenue Sharing
Dana Alokasi Umum / Central Alocation Funds
Dana Alokasi Khusus / Specific Alocation Funds
Dana Otonomi Khusus dan Penyeimbang/ Specific Autonomous Fund and Balancing Fund
unified budget, that included of the belanja rutin, budgeted current
belanja rutin, dengan Anggaran belanja pembangunan / Since 2005 is using
1. Angka PAN (Perhitungan Anggaran Negara)/ PAN Figure (Audited State Budget)
2. Realisasi Januari - Desember/ Actual January - December
3. Mulai tahun 2005 diterapkan anggaran belanja terpadu, yaitu menyatukan anggaran
2003 2004 2005
(2) (3) (4)
Uang Beredar/ Money Supply
Uang Kartal/ Currency 94,542 109,265 124,316
Uang Giral/ Demand Deposits 129,257 144,553 157,589
Jumlah Uang Beredar/ Money Supply (M1) 223,799 253,818 281,905
Uang Kuasi/ Quasi Money 731,893 779,709 921,310
Rupiah/ Rupiahs 592,716 644,109 -
Valas/ Foreign Exchange 139,177 135,600 -
Jumlah uang beredar/ Money Supply (M2) 955,692 1,033,527 1,203,215
271,820 263,647 313,082
479,013 498,019 498,901
24,087 26,919 28,059
Kredit/ Credit 19,433 22,969 -
Tagihan Lainnya/ Others bill 4,654 3,950 -
442,741 588,885 710,783
Kredit/ Credit 418,510 530,580 -
Tagihan Lainnya/ Others bill 24,231 58,309 -
Lainnya Bersih/ Net Other Items 1) -261.969 1) -343.943 1)-347,610
Sumber/ Source : Statistik Indonesia/ Statistical Year Book of Indonesia, BPS
Catatan/ Note :
1) Termasuk Jaminan Impor/ Includes import guarantee deposit
Perincian/ Description
Tagihan pada Lembaga Pemerintah dan BUMN/ Claims on Official on Entities and State Enterprises
Tagihan pada Perusahaan Swasta dan Perorangan/ Claims on Private Enterprises and Individuals
Faktor-faktor yang Mempengaruhi Uang Beredar/ Changes of Factor Affecting Money Supply
Aktiva Luar Negeri Bersih/ Net Foreign Assets
Tagihan Bersih pada Pemerintah Pusat/ Net Claims on Central Government
(1)
$����$����
��%($����$����
��%�
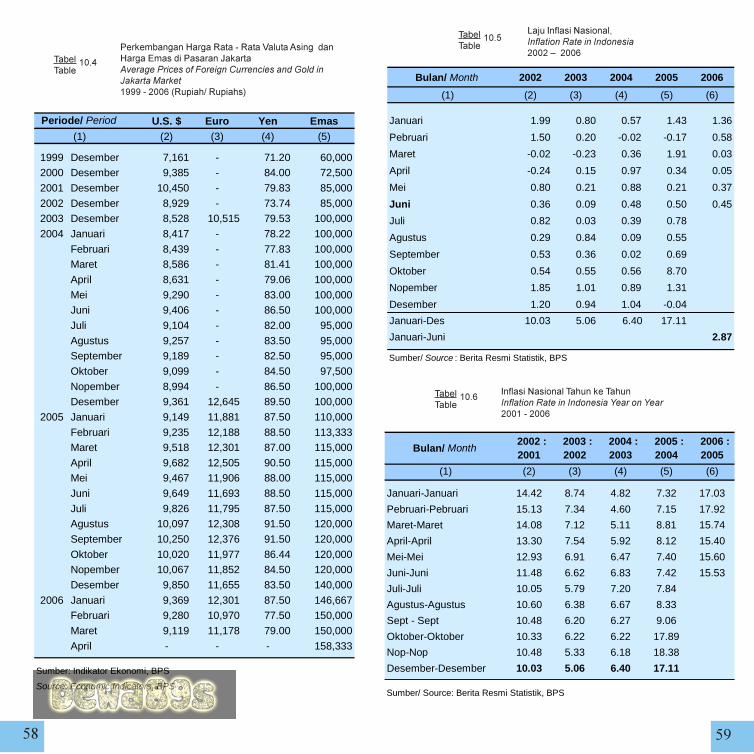
�� �
����������5����7���"7���A�����������5����=������������������������������������0������$������������������>�*�� �����*� � "����)7���� *7���� �+
'�0��6����2���������� ��� � ��������������B����
�6����2������$� ���$� ���� ��� � �����������#������#�������"����
U.S. $ Euro Yen Emas(2) (3) (4) (5)
1999 Desember 7,161 - 71.20 60,0002000 Desember 9,385 - 84.00 72,500
2001 Desember 10,450 - 79.83 85,000
2002 Desember 8,929 - 73.74 85,0002003 Desember 8,528 10,515 79.53 100,000
2004 Januari 8,417 - 78.22 100,000
Februari 8,439 - 77.83 100,000Maret 8,586 - 81.41 100,000
April 8,631 - 79.06 100,000
Mei 9,290 - 83.00 100,000Juni 9,406 - 86.50 100,000
Juli 9,104 - 82.00 95,000
Agustus 9,257 - 83.50 95,000September 9,189 - 82.50 95,000
Oktober 9,099 - 84.50 97,500
Nopember 8,994 - 86.50 100,000Desember 9,361 12,645 89.50 100,000
2005 Januari 9,149 11,881 87.50 110,000
Februari 9,235 12,188 88.50 113,333Maret 9,518 12,301 87.00 115,000
April 9,682 12,505 90.50 115,000Mei 9,467 11,906 88.00 115,000
Juni 9,649 11,693 88.50 115,000
Juli 9,826 11,795 87.50 115,000Agustus 10,097 12,308 91.50 120,000
September 10,250 12,376 91.50 120,000
Oktober 10,020 11,977 86.44 120,000Nopember 10,067 11,852 84.50 120,000
Desember 9,850 11,655 83.50 140,000
2006 Januari 9,369 12,301 87.50 146,667Februari 9,280 10,970 77.50 150,000
Maret 9,119 11,178 79.00 150,000
April - - - 158,333
Sumber: Indikator Ekonomi, BPS
Source: Economic Indicators, BPS
Periode/ Period
(1)
Bulan/ Month 2002 2003 2004 2005 2006
(1) (2) (3) (4) (5) (6)
Januari 1.99 0.80 0.57 1.43 1.36
Pebruari 1.50 0.20 -0.02 -0.17 0.58
Maret -0.02 -0.23 0.36 1.91 0.03
April -0.24 0.15 0.97 0.34 0.05
Mei 0.80 0.21 0.88 0.21 0.37
Juni 0.36 0.09 0.48 0.50 0.45
Juli 0.82 0.03 0.39 0.78
Agustus 0.29 0.84 0.09 0.55
September 0.53 0.36 0.02 0.69
Oktober 0.54 0.55 0.56 8.70
Nopember 1.85 1.01 0.89 1.31
Desember 1.20 0.94 1.04 -0.04
Januari-Des 10.03 5.06 6.40 17.11
Januari-Juni 2.87
Sumber/ Source : Berita Resmi Statistik, BPS
(1) (2) (3) (4) (5) (6)
Januari-Januari 14.42 8.74 4.82 7.32 17.03
Pebruari-Pebruari 15.13 7.34 4.60 7.15 17.92
Maret-Maret 14.08 7.12 5.11 8.81 15.74
April-April 13.30 7.54 5.92 8.12 15.40
Mei-Mei 12.93 6.91 6.47 7.40 15.60
Juni-Juni 11.48 6.62 6.83 7.42 15.53
Juli-Juli 10.05 5.79 7.20 7.84
Agustus-Agustus 10.60 6.38 6.67 8.33
Sept - Sept 10.48 6.20 6.27 9.06
Oktober-Oktober 10.33 6.22 6.22 17.89
Nop-Nop 10.48 5.33 6.18 18.38
Desember-Desember 10.03 5.06 6.40 17.11
2005 : 2004
Sumber/ Source: Berita Resmi Statistik, BPS
2006 : 2005
Bulan/ Month 2002 :
2001 2003 :
2002 2004 :
2003
$����$����
��%#
$����$����
��%�
$����$����
��%-
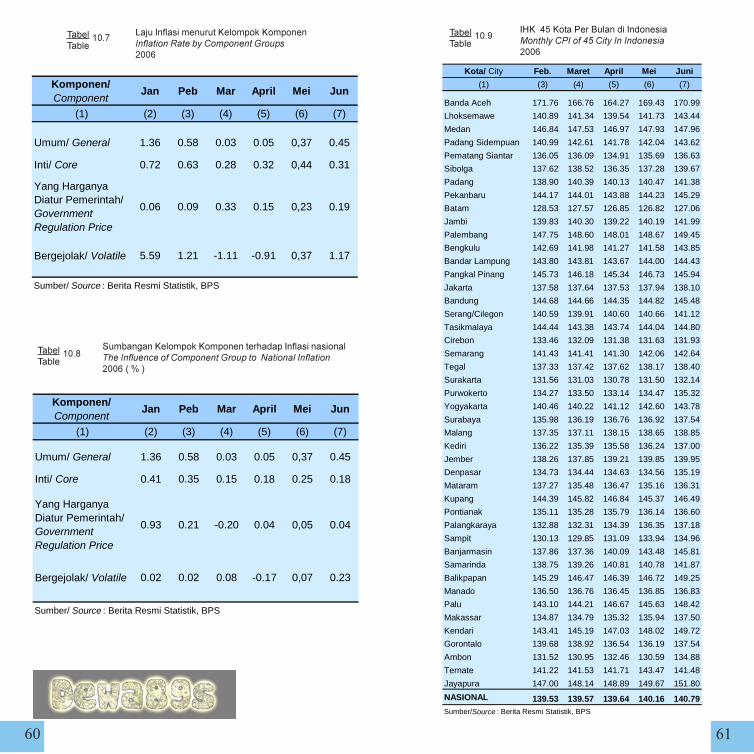
���
'�0��6����������,�������,�������� ��� � �����$����� �����������
�������,�������,�������� �����6������������������������$����� ������� ����� �������� ������)1+
�5,-#,��������������������� ����$�����3'�$� �������������
Komponen/ Component
Jan Peb Mar April Mei Jun
(1) (2) (3) (4) (5) (6) (7)
Umum/ General 1.36 0.58 0.03 0.05 0,37 0.45
Inti/ Core 0.72 0.63 0.28 0.32 0,44 0.31
Bergejolak/ Volatile 5.59 1.21 -1.11 -0.91 0,37 1.17
Sumber/ Source : Berita Resmi Statistik, BPS
0.06 0.09 0.33 0.15 0,23 0.19
Yang Harganya Diatur Pemerintah/ Government Regulation Price
Komponen/ Component
Jan Peb Mar April Mei Jun
(1) (2) (3) (4) (5) (6) (7)
Umum/ General 1.36 0.58 0.03 0.05 0,37 0.45
Inti/ Core 0.41 0.35 0.15 0.18 0.25 0.18
Bergejolak/ Volatile 0.02 0.02 0.08 -0.17 0,07 0.23
Sumber/ Source : Berita Resmi Statistik, BPS
0,05 0.040.93 0.21 -0.20 0.04
Yang Harganya Diatur Pemerintah/ Government Regulation Price
Kota/ City Feb. Maret April Mei Juni
(1) (3) (4) (5) (6) (7)
Banda Aceh 171.76 166.76 164.27 169.43 170.99
Lhoksemawe 140.89 141.34 139.54 141.73 143.44
Medan 146.84 147.53 146.97 147.93 147.96
Padang Sidempuan 140.99 142.61 141.78 142.04 143.62
Pematang Siantar 136.05 136.09 134.91 135.69 136.63
Sibolga 137.62 138.52 136.35 137.28 139.67
Padang 138.90 140.39 140.13 140.47 141.38
Pekanbaru 144.17 144.01 143.88 144.23 145.29
Batam 128.53 127.57 126.85 126.82 127.06
Jambi 139.83 140.30 139.22 140.19 141.99
Palembang 147.75 148.60 148.01 148.67 149.45
Bengkulu 142.69 141.98 141.27 141.58 143.85
Bandar Lampung 143.80 143.81 143.67 144.00 144.43
Pangkal Pinang 145.73 146.18 145.34 146.73 145.94
Jakarta 137.58 137.64 137.53 137.94 138.10
Bandung 144.68 144.66 144.35 144.82 145.48
Serang/Cilegon 140.59 139.91 140.60 140.66 141.12
Tasikmalaya 144.44 143.38 143.74 144.04 144.80
Cirebon 133.46 132.09 131.38 131.63 131.93
Semarang 141.43 141.41 141.30 142.06 142.64
Tegal 137.33 137.42 137.62 138.17 138.40
Surakarta 131.56 131.03 130.78 131.50 132.14
Purwokerto 134.27 133.50 133.14 134.47 135.32
Yogyakarta 140.46 140.22 141.12 142.60 143.78
Surabaya 135.98 136.19 136.76 136.92 137.54
Malang 137.35 137.11 138.15 138.65 138.85
Kediri 136.22 135.39 135.58 136.24 137.00
Jember 138.26 137.85 139.21 139.85 139.95
Denpasar 134.73 134.44 134.63 134.56 135.19
Mataram 137.27 135.48 136.47 135.16 136.31
Kupang 144.39 145.82 146.84 145.37 146.49
Pontianak 135.11 135.28 135.79 136.14 136.60
Palangkaraya 132.88 132.31 134.39 136.35 137.18
Sampit 130.13 129.85 131.09 133.94 134.96
Banjarmasin 137.86 137.36 140.09 143.48 145.81
Samarinda 138.75 139.26 140.81 140.78 141.87
Balikpapan 145.29 146.47 146.39 146.72 149.25
Manado 136.50 136.76 136.45 136.85 136.83
Palu 143.10 144.21 146.67 145.63 148.42
Makassar 134.87 134.79 135.32 135.94 137.50
Kendari 143.41 145.19 147.03 148.02 149.72
Gorontalo 139.68 138.92 136.54 136.19 137.54
Ambon 131.52 130.95 132.46 130.59 134.88
Ternate 141.22 141.53 141.71 143.47 141.48
Jayapura 147.00 148.14 148.89 149.67 151.80
NASIONAL 139.53 139.57 139.64 140.16 140.79Sumber/Source : Berita Resmi Statistik, BPS
$����$����
��% $����$����
��%.
$����$����
��%!
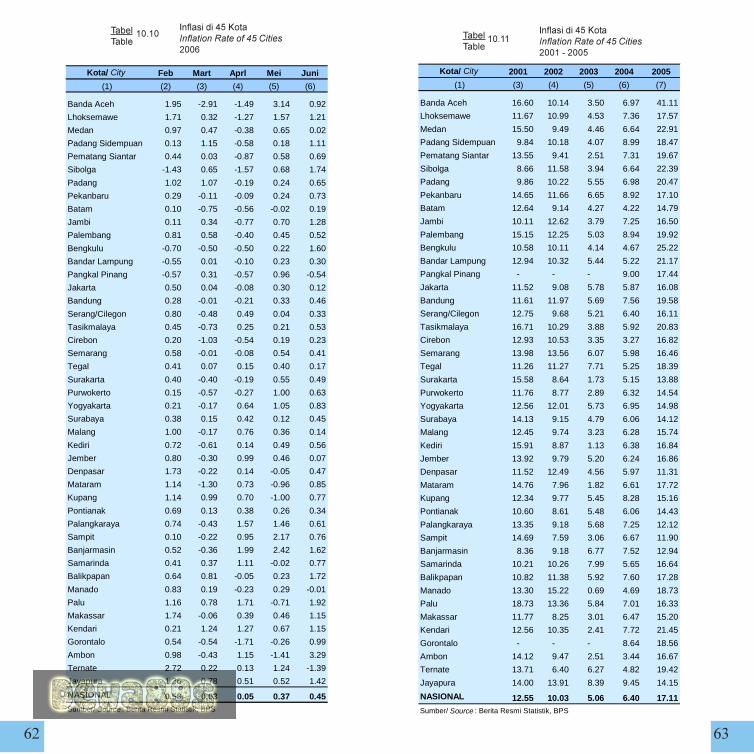
�� ��
�6������-#,������ ��� � �����3'�$� �������
�6������-#,������ ��� � �����3'�$� �������"���#
Kota/ City Feb Mart Aprl Mei Juni
(1) (2) (3) (4) (5) (6)
Banda Aceh 1.95 -2.91 -1.49 3.14 0.92
Lhoksemawe 1.71 0.32 -1.27 1.57 1.21
Medan 0.97 0.47 -0.38 0.65 0.02
Padang Sidempuan 0.13 1.15 -0.58 0.18 1.11
Pematang Siantar 0.44 0.03 -0.87 0.58 0.69
Sibolga -1.43 0.65 -1.57 0.68 1.74
Padang 1.02 1.07 -0.19 0.24 0.65
Pekanbaru 0.29 -0.11 -0.09 0.24 0.73
Batam 0.10 -0.75 -0.56 -0.02 0.19
Jambi 0.11 0.34 -0.77 0.70 1.28
Palembang 0.81 0.58 -0.40 0.45 0.52
Bengkulu -0.70 -0.50 -0.50 0.22 1.60
Bandar Lampung -0.55 0.01 -0.10 0.23 0.30
Pangkal Pinang -0.57 0.31 -0.57 0.96 -0.54
Jakarta 0.50 0.04 -0.08 0.30 0.12
Bandung 0.28 -0.01 -0.21 0.33 0.46
Serang/Cilegon 0.80 -0.48 0.49 0.04 0.33
Tasikmalaya 0.45 -0.73 0.25 0.21 0.53
Cirebon 0.20 -1.03 -0.54 0.19 0.23
Semarang 0.58 -0.01 -0.08 0.54 0.41
Tegal 0.41 0.07 0.15 0.40 0.17
Surakarta 0.40 -0.40 -0.19 0.55 0.49
Purwokerto 0.15 -0.57 -0.27 1.00 0.63
Yogyakarta 0.21 -0.17 0.64 1.05 0.83
Surabaya 0.38 0.15 0.42 0.12 0.45
Malang 1.00 -0.17 0.76 0.36 0.14
Kediri 0.72 -0.61 0.14 0.49 0.56
Jember 0.80 -0.30 0.99 0.46 0.07
Denpasar 1.73 -0.22 0.14 -0.05 0.47
Mataram 1.14 -1.30 0.73 -0.96 0.85
Kupang 1.14 0.99 0.70 -1.00 0.77
Pontianak 0.69 0.13 0.38 0.26 0.34
Palangkaraya 0.74 -0.43 1.57 1.46 0.61
Sampit 0.10 -0.22 0.95 2.17 0.76
Banjarmasin 0.52 -0.36 1.99 2.42 1.62
Samarinda 0.41 0.37 1.11 -0.02 0.77
Balikpapan 0.64 0.81 -0.05 0.23 1.72
Manado 0.83 0.19 -0.23 0.29 -0.01
Palu 1.16 0.78 1.71 -0.71 1.92
Makassar 1.74 -0.06 0.39 0.46 1.15
Kendari 0.21 1.24 1.27 0.67 1.15
Gorontalo 0.54 -0.54 -1.71 -0.26 0.99
Ambon 0.98 -0.43 1.15 -1.41 3.29
Ternate 2.72 0.22 0.13 1.24 -1.39
Jayapura 1.36 0.78 0.51 0.52 1.42
NASIONAL 0.58 0.03 0.05 0.37 0.45Sumber/ Source : Berita Resmi Statistik, BPS
Kota/ City 2001 2002 2003 2004 2005
(1) (3) (4) (5) (6) (7)
Banda Aceh 16.60 10.14 3.50 6.97 41.11
Lhoksemawe 11.67 10.99 4.53 7.36 17.57
Medan 15.50 9.49 4.46 6.64 22.91
Padang Sidempuan 9.84 10.18 4.07 8.99 18.47
Pematang Siantar 13.55 9.41 2.51 7.31 19.67
Sibolga 8.66 11.58 3.94 6.64 22.39
Padang 9.86 10.22 5.55 6.98 20.47
Pekanbaru 14.65 11.66 6.65 8.92 17.10
Batam 12.64 9.14 4.27 4.22 14.79
Jambi 10.11 12.62 3.79 7.25 16.50
Palembang 15.15 12.25 5.03 8.94 19.92
Bengkulu 10.58 10.11 4.14 4.67 25.22
Bandar Lampung 12.94 10.32 5.44 5.22 21.17
Pangkal Pinang - - - 9.00 17.44
Jakarta 11.52 9.08 5.78 5.87 16.08
Bandung 11.61 11.97 5.69 7.56 19.58
Serang/Cilegon 12.75 9.68 5.21 6.40 16.11
Tasikmalaya 16.71 10.29 3.88 5.92 20.83
Cirebon 12.93 10.53 3.35 3.27 16.82
Semarang 13.98 13.56 6.07 5.98 16.46
Tegal 11.26 11.27 7.71 5.25 18.39
Surakarta 15.58 8.64 1.73 5.15 13.88
Purwokerto 11.76 8.77 2.89 6.32 14.54
Yogyakarta 12.56 12.01 5.73 6.95 14.98
Surabaya 14.13 9.15 4.79 6.06 14.12
Malang 12.45 9.74 3.23 6.28 15.74
Kediri 15.91 8.87 1.13 6.38 16.84
Jember 13.92 9.79 5.20 6.24 16.86
Denpasar 11.52 12.49 4.56 5.97 11.31
Mataram 14.76 7.96 1.82 6.61 17.72
Kupang 12.34 9.77 5.45 8.28 15.16
Pontianak 10.60 8.61 5.48 6.06 14.43
Palangkaraya 13.35 9.18 5.68 7.25 12.12
Sampit 14.69 7.59 3.06 6.67 11.90
Banjarmasin 8.36 9.18 6.77 7.52 12.94
Samarinda 10.21 10.26 7.99 5.65 16.64
Balikpapan 10.82 11.38 5.92 7.60 17.28
Manado 13.30 15.22 0.69 4.69 18.73
Palu 18.73 13.36 5.84 7.01 16.33
Makassar 11.77 8.25 3.01 6.47 15.20
Kendari 12.56 10.35 2.41 7.72 21.45
Gorontalo - - - 8.64 18.56
Ambon 14.12 9.47 2.51 3.44 16.67
Ternate 13.71 6.40 6.27 4.82 19.42
Jayapura 14.00 13.91 8.39 9.45 14.15
NASIONAL 12.55 10.03 5.06 6.40 17.11Sumber/ Source : Berita Resmi Statistik, BPS
$����$����
��%��$����$����
��%��
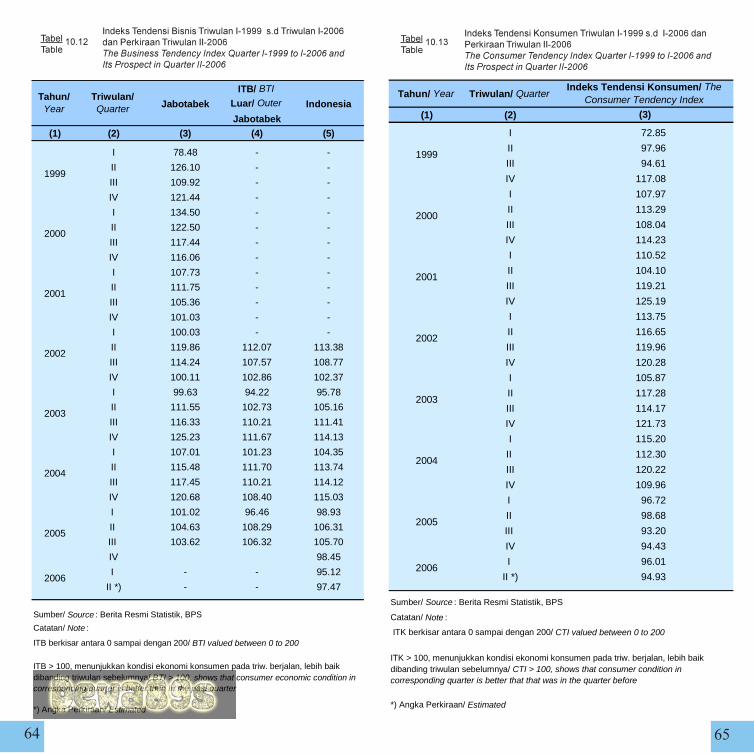
�� ��
�����$����������$��9����"� �%�$��9����"��������������$��9�����"��������1����������������%�8��� ���2&444� ��2?66@��� ��������� ���8��� ���2?66@
�����$�����,�����$��9����"� �%��"��������������$��9�����"��������$����������������%�8��� ���2&444� ��2?66@��� ��������� ���8��� ���2?66@
$����$����
Jabotabek Luar/ Outer Indonesia
Jabotabek(1) (2) (3) (4) (5)
I 78.48 - -
II 126.10 - -
III 109.92 - -
IV 121.44 - -
I 134.50 - -
II 122.50 - -
III 117.44 - -
IV 116.06 - -
I 107.73 - -
II 111.75 - -
III 105.36 - -
IV 101.03 - -
I 100.03 - -
II 119.86 112.07 113.38
III 114.24 107.57 108.77
IV 100.11 102.86 102.37
I 99.63 94.22 95.78
II 111.55 102.73 105.16
III 116.33 110.21 111.41
IV 125.23 111.67 114.13
I 107.01 101.23 104.35
II 115.48 111.70 113.74
III 117.45 110.21 114.12
IV 120.68 108.40 115.03
I 101.02 96.46 98.93
II 104.63 108.29 106.31
III 103.62 106.32 105.70
IV 98.45
I - - 95.12
II *) - - 97.47
2004
2005
2006
2000
2001
2002
2003
ITB/ BTI
1999
Triwulan/ Quarter
Tahun/ Year
*) Angka Perkiraan/ Estimated
Sumber/ Source : Berita Resmi Statistik, BPS
Catatan/ Note :
ITB > 100, menunjukkan kondisi ekonomi konsumen pada triw. berjalan, lebih baik dibanding triwulan sebelumnya/ BTI > 100, shows that consumer economic condition in corresponding quarter is better than In the past quarter
ITB berkisar antara 0 sampai dengan 200/ BTI valued between 0 to 200
Tahun/ Year Triwulan/ Quarter
(1) (2)
I 72.85
II 97.96
III 94.61
IV 117.08
I 107.97
II 113.29
III 108.04
IV 114.23
I 110.52
II 104.10
III 119.21
IV 125.19
I 113.75
II 116.65
III 119.96
IV 120.28
I 105.87
II 117.28
III 114.17
IV 121.73
I 115.20
II 112.30
III 120.22
IV 109.96
I 96.72
II 98.68
III 93.20
IV 94.43
I 96.01
II *) 94.93
Sumber/ Source : Berita Resmi Statistik, BPS
Catatan/ Note :
*) Angka Perkiraan/ Estimated
ITK berkisar antara 0 sampai dengan 200/ CTI valued between 0 to 200
ITK > 100, menunjukkan kondisi ekonomi konsumen pada triw. berjalan, lebih baik dibanding triwulan sebelumnya/ CTI > 100, shows that consumer condition in corresponding quarter is better that that was in the quarter before
(3)
Indeks Tendensi Konsumen/ The Consumer Tendency Index
2006
1999
2004
2005
2000
2001
2002
2003
��%�($����$����
��%��
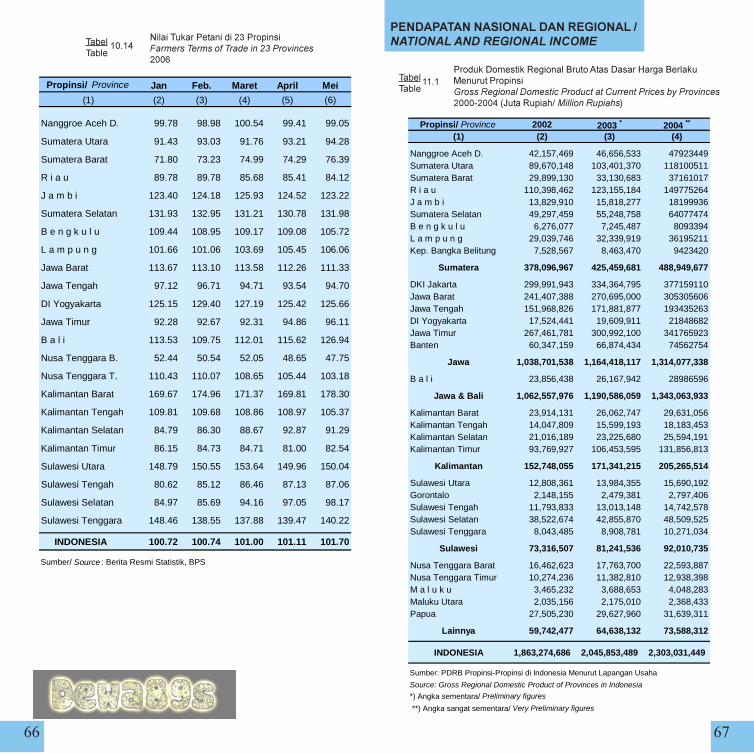
2����$������������(�������0������������������������?=�������������
$����$����
��������������������������� ������������������������
��������������7��������������������5�����������&������������������ ������������ ��������� �� �$���� �����������������������"���-)����7���� *������� ������+
$����$����
�� ��
Propinsi/ Province Jan Feb. Maret April Mei
(1) (2) (3) (4) (5) (6)
Nanggroe Aceh D. 99.78 98.98 100.54 99.41 99.05
Sumatera Utara 91.43 93.03 91.76 93.21 94.28
Sumatera Barat 71.80 73.23 74.99 74.29 76.39
R i a u 89.78 89.78 85.68 85.41 84.12
J a m b i 123.40 124.18 125.93 124.52 123.22
Sumatera Selatan 131.93 132.95 131.21 130.78 131.98
B e n g k u l u 109.44 108.95 109.17 109.08 105.72
L a m p u n g 101.66 101.06 103.69 105.45 106.06
Jawa Barat 113.67 113.10 113.58 112.26 111.33
Jawa Tengah 97.12 96.71 94.71 93.54 94.70
DI Yogyakarta 125.15 129.40 127.19 125.42 125.66
Jawa Timur 92.28 92.67 92.31 94.86 96.11
B a l i 113.53 109.75 112.01 115.62 126.94
Nusa Tenggara B. 52.44 50.54 52.05 48.65 47.75
Nusa Tenggara T. 110.43 110.07 108.65 105.44 103.18
Kalimantan Barat 169.67 174.96 171.37 169.81 178.30
Kalimantan Tengah 109.81 109.68 108.86 108.97 105.37
Kalimantan Selatan 84.79 86.30 88.67 92.87 91.29
Kalimantan Timur 86.15 84.73 84.71 81.00 82.54
Sulawesi Utara 148.79 150.55 153.64 149.96 150.04
Sulawesi Tengah 80.62 85.12 86.46 87.13 87.06
Sulawesi Selatan 84.97 85.69 94.16 97.05 98.17
Sulawesi Tenggara 148.46 138.55 137.88 139.47 140.22
INDONESIA 100.72 100.74 101.00 101.11 101.70
Sumber/ Source : Berita Resmi Statistik, BPS
Propinsi/ Province 2002 2003 * 2004 **
(1) (2) (3) (4)
Nanggroe Aceh D. 42,157,469 46,656,533 47923449Sumatera Utara 89,670,148 103,401,370 118100511Sumatera Barat 29,899,130 33,130,683 37161017R i a u 110,398,462 123,155,184 149775264J a m b i 13,829,910 15,818,277 18199936Sumatera Selatan 49,297,459 55,248,758 64077474B e n g k u l u 6,276,077 7,245,487 8093394L a m p u n g 29,039,746 32,339,919 36195211Kep. Bangka Belitung 7,528,567 8,463,470 9423420
Sumatera 378,096,967 425,459,681 488,949,677
DKI Jakarta 299,991,943 334,364,795 377159110Jawa Barat 241,407,388 270,695,000 305305606Jawa Tengah 151,968,826 171,881,877 193435263DI Yogyakarta 17,524,441 19,609,911 21848682Jawa Timur 267,461,781 300,992,100 341765923Banten 60,347,159 66,874,434 74562754
Jawa 1,038,701,538 1,164,418,117 1,314,077,338
B a l i 23,856,438 26,167,942 28986596
Jawa & Bali 1,062,557,976 1,190,586,059 1,343,063,933
Kalimantan Barat 23,914,131 26,062,747 29,631,056Kalimantan Tengah 14,047,809 15,599,193 18,183,453Kalimantan Selatan 21,016,189 23,225,680 25,594,191Kalimantan Timur 93,769,927 106,453,595 131,856,813
Kalimantan 152,748,055 171,341,215 205,265,514
Sulawesi Utara 12,808,361 13,984,355 15,690,192Gorontalo 2,148,155 2,479,381 2,797,406Sulawesi Tengah 11,793,833 13,013,148 14,742,578Sulawesi Selatan 38,522,674 42,855,870 48,509,525Sulawesi Tenggara 8,043,485 8,908,781 10,271,034
Sulawesi 73,316,507 81,241,536 92,010,735
Nusa Tenggara Barat 16,462,623 17,763,700 22,593,887Nusa Tenggara Timur 10,274,236 11,382,810 12,938,398M a l u k u 3,465,232 3,688,653 4,048,283Maluku Utara 2,035,156 2,175,010 2,368,433Papua 27,505,230 29,627,960 31,639,311
Lainnya 59,742,477 64,638,132 73,588,312
INDONESIA 1,863,274,686 2,045,853,489 2,303,031,449
Sumber: PDRB Propinsi-Propinsi di Indonesia Menurut Lapangan Usaha
Source: Gross Regional Domestic Product of Provinces in Indonesia
*) Angka sementara/ Preliminary figures
**) Angka sangat sementara/ Very Preliminary figures
��%�
��%�-
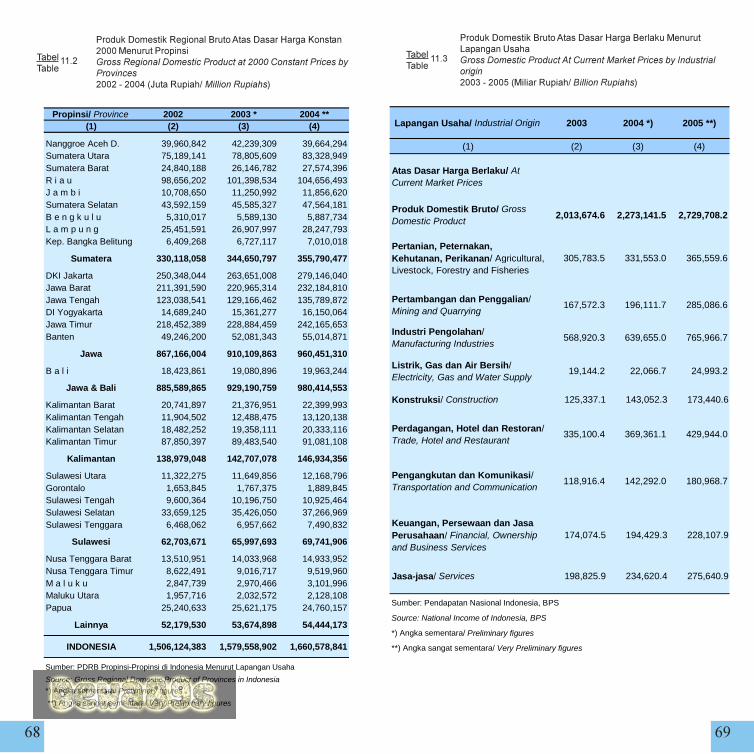
��������������7��������������������5����,��������&������������������ ������������ ��������� �� �?666�$�� � ����������������������"���-)����7���� *������� ������+
$����$����
����������������������������5�����������&�����'�����/�� ������������ ��������� �� �$���� ����*� �������������� ������������("���#)&�����7���� *1������ ������+
$����$����
�� �
Propinsi/ Province 2002 2003 * 2004 **(1) (2) (3) (4)
Nanggroe Aceh D. 39,960,842 42,239,309 39,664,294Sumatera Utara 75,189,141 78,805,609 83,328,949Sumatera Barat 24,840,188 26,146,782 27,574,396R i a u 98,656,202 101,398,534 104,656,493J a m b i 10,708,650 11,250,992 11,856,620Sumatera Selatan 43,592,159 45,585,327 47,564,181B e n g k u l u 5,310,017 5,589,130 5,887,734L a m p u n g 25,451,591 26,907,997 28,247,793Kep. Bangka Belitung 6,409,268 6,727,117 7,010,018
Sumatera 330,118,058 344,650,797 355,790,477
DKI Jakarta 250,348,044 263,651,008 279,146,040Jawa Barat 211,391,590 220,965,314 232,184,810Jawa Tengah 123,038,541 129,166,462 135,789,872DI Yogyakarta 14,689,240 15,361,277 16,150,064Jawa Timur 218,452,389 228,884,459 242,165,653Banten 49,246,200 52,081,343 55,014,871
Jawa 867,166,004 910,109,863 960,451,310
B a l i 18,423,861 19,080,896 19,963,244
Jawa & Bali 885,589,865 929,190,759 980,414,553
Kalimantan Barat 20,741,897 21,376,951 22,399,993Kalimantan Tengah 11,904,502 12,488,475 13,120,138Kalimantan Selatan 18,482,252 19,358,111 20,333,116Kalimantan Timur 87,850,397 89,483,540 91,081,108
Kalimantan 138,979,048 142,707,078 146,934,356
Sulawesi Utara 11,322,275 11,649,856 12,168,796Gorontalo 1,653,845 1,767,375 1,889,845Sulawesi Tengah 9,600,364 10,196,750 10,925,464Sulawesi Selatan 33,659,125 35,426,050 37,266,969Sulawesi Tenggara 6,468,062 6,957,662 7,490,832
Sulawesi 62,703,671 65,997,693 69,741,906
Nusa Tenggara Barat 13,510,951 14,033,968 14,933,952Nusa Tenggara Timur 8,622,491 9,016,717 9,519,960M a l u k u 2,847,739 2,970,466 3,101,996Maluku Utara 1,957,716 2,032,572 2,128,108Papua 25,240,633 25,621,175 24,760,157
Lainnya 52,179,530 53,674,898 54,444,173
INDONESIA 1,506,124,383 1,579,558,902 1,660,578,841
Sumber: PDRB Propinsi-Propinsi di Indonesia Menurut Lapangan Usaha
Source: Gross Regional Domestic Product of Provinces in Indonesia*) Angka sementara/ Preliminary figures
**) Angka sangat sementara/ Very Preliminary figures
Lapangan Usaha/ Industrial Origin 2003 2004 *) 2005 **)
(1) (2) (3) (4)
Atas Dasar Harga Berlaku/ At Current Market Prices
Produk Domestik Bruto/ Gross Domestic Product
2,013,674.6 2,273,141.5 2,729,708.2
Pertanian, Peternakan, Kehutanan, Perikanan/ Agricultural, Livestock, Forestry and Fisheries
305,783.5 331,553.0 365,559.6
Pertambangan dan Penggalian/ Mining and Quarrying
167,572.3 196,111.7 285,086.6
Industri Pengolahan/ Manufacturing Industries
568,920.3 639,655.0 765,966.7
Listrik, Gas dan Air Bersih/ Electricity, Gas and Water Supply
19,144.2 22,066.7 24,993.2
Konstruksi/ Construction 125,337.1 143,052.3 173,440.6
Perdagangan, Hotel dan Restoran/ Trade, Hotel and Restaurant
335,100.4 369,361.1 429,944.0
Pengangkutan dan Komunikasi/ Transportation and Communication
118,916.4 142,292.0 180,968.7
Keuangan, Persewaan dan Jasa Perusahaan/ Financial, Ownership and Business Services
174,074.5 194,429.3 228,107.9
Jasa-jasa/ Services 198,825.9 234,620.4 275,640.9
Sumber: Pendapatan Nasional Indonesia, BPS
Source: National Income of Indonesia, BPS
*) Angka sementara/ Preliminary figures
**) Angka sangat sementara/ Very Preliminary figures
��%(��%�
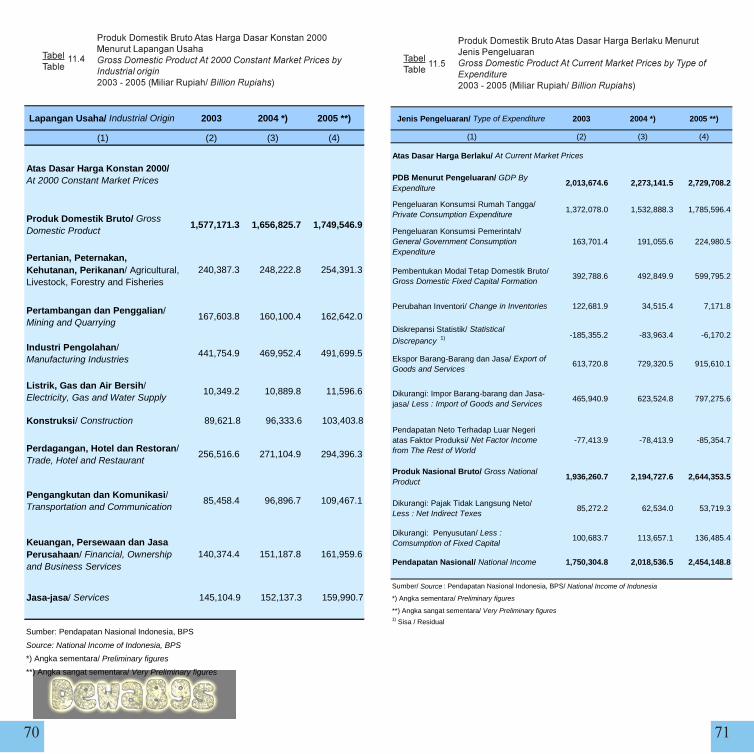
�����������������������5���������,��������&�����'�����/�� ������������ ��������� �� �?666�$�� � ����*� ������������� �������������("���#)&�����7���� *1������ ������+
$����$����
����������������������������5�����������&����������������������������� ��������� �� �$���� ����*� ������������������"%���� ������("���#)&�����7���� *1������ ������+
$����$����
� ��
Lapangan Usaha/ Industrial Origin 2003 2004 *) 2005 **)
(1) (2) (3) (4)
Atas Dasar Harga Konstan 2000/ At 2000 Constant Market Prices
Produk Domestik Bruto/ Gross Domestic Product
1,577,171.3 1,656,825.7 1,749,546.9
Pertanian, Peternakan, Kehutanan, Perikanan/ Agricultural, Livestock, Forestry and Fisheries
240,387.3 248,222.8 254,391.3
Pertambangan dan Penggalian/ Mining and Quarrying
167,603.8 160,100.4 162,642.0
Industri Pengolahan/ Manufacturing Industries
441,754.9 469,952.4 491,699.5
Listrik, Gas dan Air Bersih/ Electricity, Gas and Water Supply
10,349.2 10,889.8 11,596.6
Konstruksi/ Construction 89,621.8 96,333.6 103,403.8
Perdagangan, Hotel dan Restoran/ Trade, Hotel and Restaurant
256,516.6 271,104.9 294,396.3
Pengangkutan dan Komunikasi/ Transportation and Communication
85,458.4 96,896.7 109,467.1
Keuangan, Persewaan dan Jasa Perusahaan/ Financial, Ownership and Business Services
140,374.4 151,187.8 161,959.6
Jasa-jasa/ Services 145,104.9 152,137.3 159,990.7
Source: National Income of Indonesia, BPS
**) Angka sangat sementara/ Very Preliminary figures
*) Angka sementara/ Preliminary figures
Sumber: Pendapatan Nasional Indonesia, BPS
Jenis Pengeluaran/ Type of Expenditure 2003 2004 *) 2005 **)
(1) (2) (3) (4)
PDB Menurut Pengeluaran/ GDP By Expenditure
2,013,674.6 2,273,141.5 2,729,708.2
Pengeluaran Konsumsi Rumah Tangga/ Private Consumption Expenditure
1,372,078.0 1,532,888.3 1,785,596.4
Pengeluaran Konsumsi Pemerintah/ General Government Consumption Expenditure
163,701.4 191,055.6 224,980.5
Pembentukan Modal Tetap Domestik Bruto/ Gross Domestic Fixed Capital Formation
392,788.6 492,849.9 599,795.2
Perubahan Inventori/ Change in Inventories 122,681.9 34,515.4 7,171.8
Diskrepansi Statistik/ Statistical
Discrepancy 1) -185,355.2 -83,963.4 -6,170.2
Ekspor Barang-Barang dan Jasa/ Export of Goods and Services
613,720.8 729,320.5 915,610.1
Dikurangi: Impor Barang-barang dan Jasa-jasa/ Less : Import of Goods and Services
465,940.9 623,524.8 797,275.6
Pendapatan Neto Terhadap Luar Negeri atas Faktor Produksi/ Net Factor Income from The Rest of World
-77,413.9 -78,413.9 -85,354.7
Produk Nasional Bruto/ Gross National Product
1,936,260.7 2,194,727.6 2,644,353.5
Dikurangi: Pajak Tidak Langsung Neto/ Less : Net Indirect Texes
85,272.2 62,534.0 53,719.3
Dikurangi: Penyusutan/ Less : Comsumption of Fixed Capital
100,683.7 113,657.1 136,485.4
Pendapatan Nasional/ National Income 1,750,304.8 2,018,536.5 2,454,148.8
1) Sisa / Residual
Sumber/ Source : Pendapatan Nasional Indonesia, BPS/ National Income of Indonesia
*) Angka sementara/ Preliminary figures
**) Angka sangat sementara/ Very Preliminary figures
Atas Dasar Harga Berlaku/ At Current Market Prices
��%#��%-
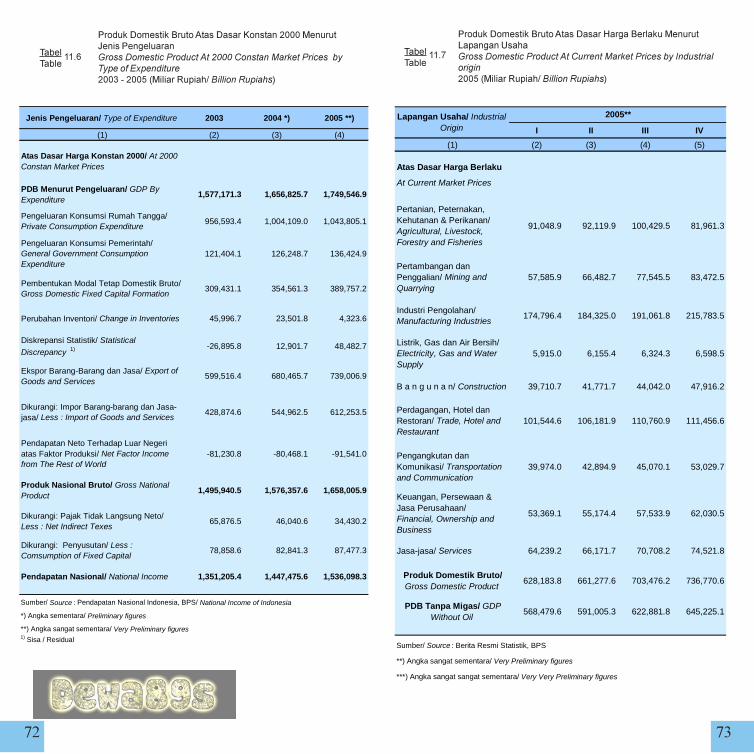
����������������������������,��������&����������������������������� ��������� �� �?666�$�� �����*� �������������������"%���� ������("���#)&�����7���� *1������ ������+
$����$����
����������������������������5�����������&�����'�����/�� ������������ ��������� �� �$���� ����*� �������������� ������������#)&�����7���� *1������ ������+
$����$����
�� ��
Jenis Pengeluaran/ Type of Expenditure 2003 2004 *) 2005 **)
(1) (2) (3) (4)
Atas Dasar Harga Konstan 2000/ At 2000 Constan Market Prices
PDB Menurut Pengeluaran/ GDP By Expenditure
1,577,171.3 1,656,825.7 1,749,546.9
Pengeluaran Konsumsi Rumah Tangga/ Private Consumption Expenditure
956,593.4 1,004,109.0 1,043,805.1
Pengeluaran Konsumsi Pemerintah/ General Government Consumption Expenditure
121,404.1 126,248.7 136,424.9
Pembentukan Modal Tetap Domestik Bruto/ Gross Domestic Fixed Capital Formation
309,431.1 354,561.3 389,757.2
Perubahan Inventori/ Change in Inventories 45,996.7 23,501.8 4,323.6
Diskrepansi Statistik/ Statistical
Discrepancy 1) -26,895.8 12,901.7 48,482.7
Ekspor Barang-Barang dan Jasa/ Export of Goods and Services
599,516.4 680,465.7 739,006.9
Dikurangi: Impor Barang-barang dan Jasa-jasa/ Less : Import of Goods and Services
428,874.6 544,962.5 612,253.5
Pendapatan Neto Terhadap Luar Negeri atas Faktor Produksi/ Net Factor Income from The Rest of World
-81,230.8 -80,468.1 -91,541.0
Produk Nasional Bruto/ Gross National Product
1,495,940.5 1,576,357.6 1,658,005.9
Dikurangi: Pajak Tidak Langsung Neto/ Less : Net Indirect Texes
65,876.5 46,040.6 34,430.2
Dikurangi: Penyusutan/ Less : Comsumption of Fixed Capital
78,858.6 82,841.3 87,477.3
Pendapatan Nasional/ National Income 1,351,205.4 1,447,475.6 1,536,098.3
1) Sisa / Residual
Sumber/ Source : Pendapatan Nasional Indonesia, BPS/ National Income of Indonesia
*) Angka sementara/ Preliminary figures
**) Angka sangat sementara/ Very Preliminary figures
I II III IV
(1) (2) (3) (4) (5)
Atas Dasar Harga Berlaku
At Current Market Prices
Pertanian, Peternakan, Kehutanan & Perikanan/ Agricultural, Livestock, Forestry and Fisheries
91,048.9 92,119.9 100,429.5 81,961.3
Pertambangan dan Penggalian/ Mining and Quarrying
57,585.9 66,482.7 77,545.5 83,472.5
Industri Pengolahan/ Manufacturing Industries
174,796.4 184,325.0 191,061.8 215,783.5
Listrik, Gas dan Air Bersih/ Electricity, Gas and Water Supply
5,915.0 6,155.4 6,324.3 6,598.5
B a n g u n a n/ Construction 39,710.7 41,771.7 44,042.0 47,916.2
Perdagangan, Hotel dan Restoran/ Trade, Hotel and Restaurant
101,544.6 106,181.9 110,760.9 111,456.6
Pengangkutan dan Komunikasi/ Transportation and Communication
39,974.0 42,894.9 45,070.1 53,029.7
Keuangan, Persewaan & Jasa Perusahaan/ Financial, Ownership and Business
53,369.1 55,174.4 57,533.9 62,030.5
Jasa-jasa/ Services 64,239.2 66,171.7 70,708.2 74,521.8
Produk Domestik Bruto/ Gross Domestic Product
628,183.8 661,277.6 703,476.2 736,770.6
PDB Tanpa Migas/ GDP Without Oil
568,479.6 591,005.3 622,881.8 645,225.1
Sumber/ Source : Berita Resmi Statistik, BPS
**) Angka sangat sementara/ Very Preliminary figures
***) Angka sangat sangat sementara/ Very Very Preliminary figures
Lapangan Usaha/ Industrial Origin
2005**
��%.��%�
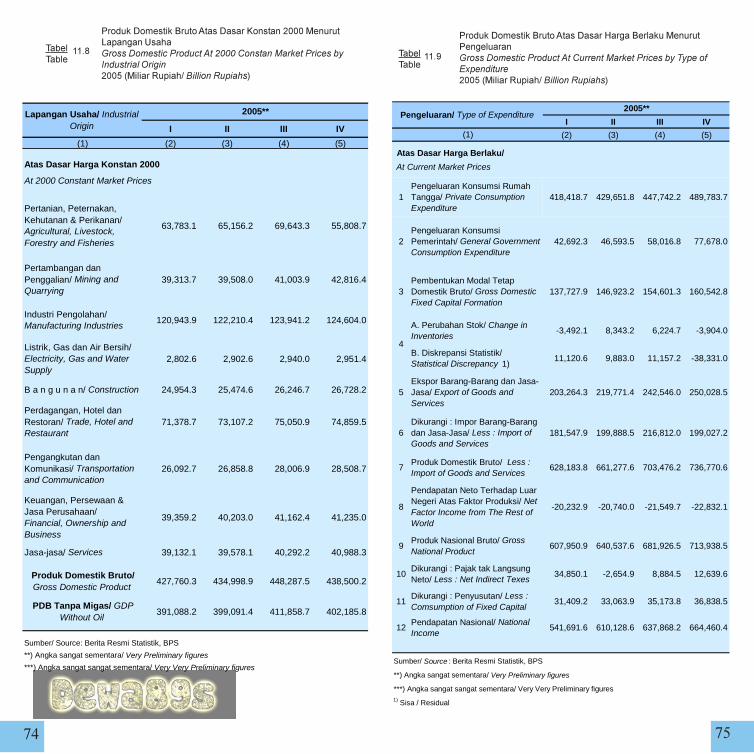
����������������������������,��������&�����'�����/�� ������������ ��������� �� �?666�$�� �����*� ������������� �����(�������#)&�����7���� *1������ ������+
$����$����
����������������������������5�����������&������������������������� ��������� �� �$���� ����*� ������������������"%���� ������#)&�����7���� *1������ ������+
$����$����
�� ��
I II III IV
(1) (2) (3) (4) (5)
Atas Dasar Harga Konstan 2000
At 2000 Constant Market Prices
Pertanian, Peternakan, Kehutanan & Perikanan/ Agricultural, Livestock, Forestry and Fisheries
63,783.1 65,156.2 69,643.3 55,808.7
Pertambangan dan Penggalian/ Mining and Quarrying
39,313.7 39,508.0 41,003.9 42,816.4
Industri Pengolahan/ Manufacturing Industries
120,943.9 122,210.4 123,941.2 124,604.0
Listrik, Gas dan Air Bersih/ Electricity, Gas and Water Supply
2,802.6 2,902.6 2,940.0 2,951.4
B a n g u n a n/ Construction 24,954.3 25,474.6 26,246.7 26,728.2
Perdagangan, Hotel dan Restoran/ Trade, Hotel and Restaurant
71,378.7 73,107.2 75,050.9 74,859.5
Pengangkutan dan Komunikasi/ Transportation and Communication
26,092.7 26,858.8 28,006.9 28,508.7
Keuangan, Persewaan & Jasa Perusahaan/ Financial, Ownership and Business
39,359.2 40,203.0 41,162.4 41,235.0
Jasa-jasa/ Services 39,132.1 39,578.1 40,292.2 40,988.3
Produk Domestik Bruto/ Gross Domestic Product
427,760.3 434,998.9 448,287.5 438,500.2
PDB Tanpa Migas/ GDP Without Oil
391,088.2 399,091.4 411,858.7 402,185.8
**) Angka sangat sementara/ Very Preliminary figures
***) Angka sangat sangat sementara/ Very Very Preliminary figures
Lapangan Usaha/ Industrial Origin
2005**
Sumber/ Source: Berita Resmi Statistik, BPS
I II III IV
(2) (3) (4) (5)
1Pengeluaran Konsumsi Rumah Tangga/ Private Consumption Expenditure
418,418.7 429,651.8 447,742.2 489,783.7
2Pengeluaran Konsumsi Pemerintah/ General Government Consumption Expenditure
42,692.3 46,593.5 58,016.8 77,678.0
3Pembentukan Modal Tetap Domestik Bruto/ Gross Domestic Fixed Capital Formation
137,727.9 146,923.2 154,601.3 160,542.8
A. Perubahan Stok/ Change in Inventories
-3,492.1 8,343.2 6,224.7 -3,904.0
B. Diskrepansi Statistik/ Statistical Discrepancy 1)
11,120.6 9,883.0 11,157.2 -38,331.0
5Ekspor Barang-Barang dan Jasa-Jasa/ Export of Goods and Services
203,264.3 219,771.4 242,546.0 250,028.5
6Dikurangi : Impor Barang-Barang dan Jasa-Jasa/ Less : Import of Goods and Services
181,547.9 199,888.5 216,812.0 199,027.2
7Produk Domestik Bruto/ Less : Import of Goods and Services
628,183.8 661,277.6 703,476.2 736,770.6
8
Pendapatan Neto Terhadap Luar Negeri Atas Faktor Produksi/ Net Factor Income from The Rest of World
-20,232.9 -20,740.0 -21,549.7 -22,832.1
9Produk Nasional Bruto/ Gross National Product
607,950.9 640,537.6 681,926.5 713,938.5
10Dikurangi : Pajak tak Langsung Neto/ Less : Net Indirect Texes
34,850.1 -2,654.9 8,884.5 12,639.6
11Dikurangi : Penyusutan/ Less : Comsumption of Fixed Capital
31,409.2 33,063.9 35,173.8 36,838.5
12Pendapatan Nasional/ National Income
541,691.6 610,128.6 637,868.2 664,460.4
4
Sumber/ Source : Berita Resmi Statistik, BPS
**) Angka sangat sementara/ Very Preliminary figures
Pengeluaran/ Type of Expenditure
(1)
Atas Dasar Harga Berlaku/
At Current Market Prices
2005**
***) Angka sangat sangat sementara/ Very Very Preliminary figures1) Sisa / Residual
��%!��%
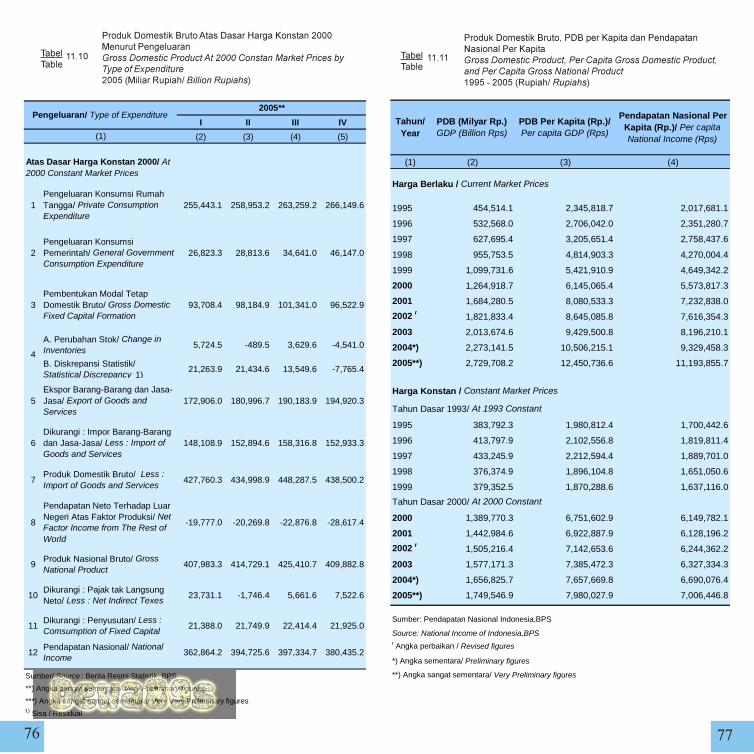
����������������������������5����,��������&������������������������� ��������� �� �?666�$�� �����*� ������������������"%���� ������#)&�����7���� *1������ ������+
$����$����
��������������������������,���������������2���������,���������������� ��������� +�����$��� ������������� ��������� +�������$��� ���������� ����������� � #"���#)7���� * ������+
$����$����
�� ��
I II III IV
(2) (3) (4) (5)
1Pengeluaran Konsumsi Rumah Tangga/ Private Consumption Expenditure
255,443.1 258,953.2 263,259.2 266,149.6
2Pengeluaran Konsumsi Pemerintah/ General Government Consumption Expenditure
26,823.3 28,813.6 34,641.0 46,147.0
3Pembentukan Modal Tetap Domestik Bruto/ Gross Domestic Fixed Capital Formation
93,708.4 98,184.9 101,341.0 96,522.9
A. Perubahan Stok/ Change in Inventories
5,724.5 -489.5 3,629.6 -4,541.0
B. Diskrepansi Statistik/ Statistical Discrepancy 1)
21,263.9 21,434.6 13,549.6 -7,765.4
5Ekspor Barang-Barang dan Jasa-Jasa/ Export of Goods and Services
172,906.0 180,996.7 190,183.9 194,920.3
6Dikurangi : Impor Barang-Barang dan Jasa-Jasa/ Less : Import of Goods and Services
148,108.9 152,894.6 158,316.8 152,933.3
7Produk Domestik Bruto/ Less : Import of Goods and Services
427,760.3 434,998.9 448,287.5 438,500.2
8
Pendapatan Neto Terhadap Luar Negeri Atas Faktor Produksi/ Net Factor Income from The Rest of World
-19,777.0 -20,269.8 -22,876.8 -28,617.4
9Produk Nasional Bruto/ Gross National Product
407,983.3 414,729.1 425,410.7 409,882.8
10Dikurangi : Pajak tak Langsung Neto/ Less : Net Indirect Texes
23,731.1 -1,746.4 5,661.6 7,522.6
11Dikurangi : Penyusutan/ Less : Comsumption of Fixed Capital
21,388.0 21,749.9 22,414.4 21,925.0
12Pendapatan Nasional/ National Income
362,864.2 394,725.6 397,334.7 380,435.2
4
Sumber/ Source : Berita Resmi Statistik, BPS
**) Angka sangat sementara/ Very Preliminary figures
Atas Dasar Harga Konstan 2000/ At 2000 Constant Market Prices
Pengeluaran/ Type of Expenditure2005**
(1)
***) Angka sangat sangat sementara/ Very Very Preliminary figures1) Sisa / Residual
(1) (2) (3) (4)
Harga Berlaku / Current Market Prices
1995 454,514.1 2,345,818.7 2,017,681.1
1996 532,568.0 2,706,042.0 2,351,280.7
1997 627,695.4 3,205,651.4 2,758,437.6
1998 955,753.5 4,814,903.3 4,270,004.4
1999 1,099,731.6 5,421,910.9 4,649,342.2
2000 1,264,918.7 6,145,065.4 5,573,817.3
2001 1,684,280.5 8,080,533.3 7,232,838.0
2002 r 1,821,833.4 8,645,085.8 7,616,354.3
2003 2,013,674.6 9,429,500.8 8,196,210.1
2004*) 2,273,141.5 10,506,215.1 9,329,458.3
2005**) 2,729,708.2 12,450,736.6 11,193,855.7
Harga Konstan / Constant Market Prices
Tahun Dasar 1993/ At 1993 Constant
1995 383,792.3 1,980,812.4 1,700,442.6
1996 413,797.9 2,102,556.8 1,819,811.4
1997 433,245.9 2,212,594.4 1,889,701.0
1998 376,374.9 1,896,104.8 1,651,050.6
1999 379,352.5 1,870,288.6 1,637,116.0
Tahun Dasar 2000/ At 2000 Constant
2000 1,389,770.3 6,751,602.9 6,149,782.1
2001 1,442,984.6 6,922,887.9 6,128,196.2
2002 r 1,505,216.4 7,142,653.6 6,244,362.2
2003 1,577,171.3 7,385,472.3 6,327,334.3
2004*) 1,656,825.7 7,657,669.8 6,690,076.4
2005**) 1,749,546.9 7,980,027.9 7,006,446.8
Source: National Income of Indonesia,BPSr Angka perbaikan / Revised figures
*) Angka sementara/ Preliminary figures
**) Angka sangat sementara/ Very Preliminary figures
Sumber: Pendapatan Nasional Indonesia,BPS
Tahun/ Year
PDB (Milyar Rp.) GDP (Billion Rps)
PDB Per Kapita (Rp.)/ Per capita GDP (Rps)
Pendapatan Nasional Per Kapita (Rp.)/ Per capita National Income (Rps)
��%�� ��%��
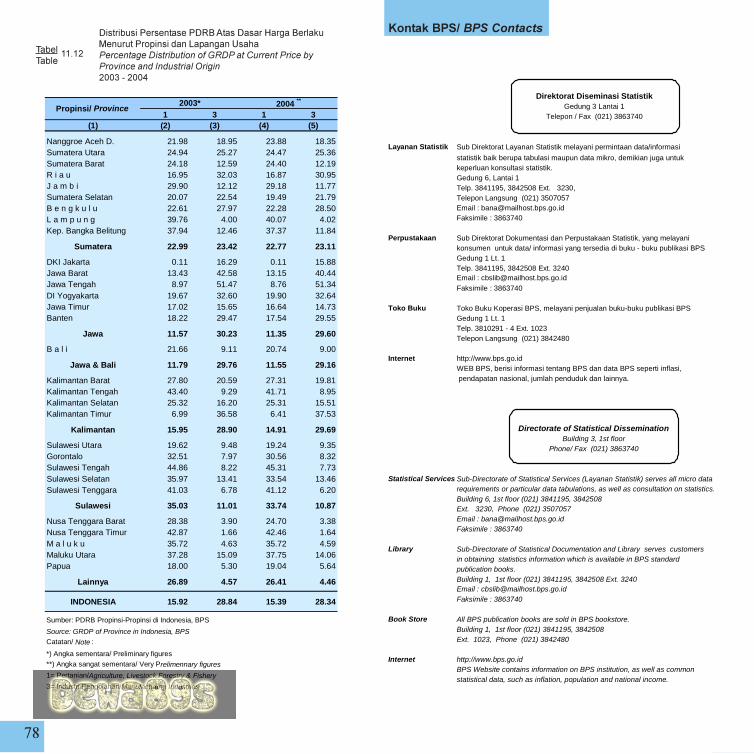
���������������������7����������5�����������&��������������'�����/�� ������ ������� ���� ������� ���� �$���� ����������������������� �����(�������("���-
$����$����
�������� � ����������
��
1 3 1 3(1) (2) (3) (4) (5)
Nanggroe Aceh D. 21.98 18.95 23.88 18.35Sumatera Utara 24.94 25.27 24.47 25.36Sumatera Barat 24.18 12.59 24.40 12.19R i a u 16.95 32.03 16.87 30.95J a m b i 29.90 12.12 29.18 11.77Sumatera Selatan 20.07 22.54 19.49 21.79B e n g k u l u 22.61 27.97 22.28 28.50L a m p u n g 39.76 4.00 40.07 4.02Kep. Bangka Belitung 37.94 12.46 37.37 11.84
Sumatera 22.99 23.42 22.77 23.11
DKI Jakarta 0.11 16.29 0.11 15.88Jawa Barat 13.43 42.58 13.15 40.44Jawa Tengah 8.97 51.47 8.76 51.34DI Yogyakarta 19.67 32.60 19.90 32.64Jawa Timur 17.02 15.65 16.64 14.73Banten 18.22 29.47 17.54 29.55
Jawa 11.57 30.23 11.35 29.60
B a l i 21.66 9.11 20.74 9.00
Jawa & Bali 11.79 29.76 11.55 29.16
Kalimantan Barat 27.80 20.59 27.31 19.81Kalimantan Tengah 43.40 9.29 41.71 8.95Kalimantan Selatan 25.32 16.20 25.31 15.51Kalimantan Timur 6.99 36.58 6.41 37.53
Kalimantan 15.95 28.90 14.91 29.69
Sulawesi Utara 19.62 9.48 19.24 9.35Gorontalo 32.51 7.97 30.56 8.32Sulawesi Tengah 44.86 8.22 45.31 7.73Sulawesi Selatan 35.97 13.41 33.54 13.46Sulawesi Tenggara 41.03 6.78 41.12 6.20
Sulawesi 35.03 11.01 33.74 10.87
Nusa Tenggara Barat 28.38 3.90 24.70 3.38Nusa Tenggara Timur 42.87 1.66 42.46 1.64M a l u k u 35.72 4.63 35.72 4.59Maluku Utara 37.28 15.09 37.75 14.06Papua 18.00 5.30 19.04 5.64
Lainnya 26.89 4.57 26.41 4.46
INDONESIA 15.92 28.84 15.39 28.34
Sumber: PDRB Propinsi-Propinsi di Indonesia, BPS
Source: GRDP of Province in Indonesia, BPSCatatan/ Note :
*) Angka sementara/ Preliminary figures
**) Angka sangat sementara/ Very Prelimennary figures
1= Pertanian/Agriculture, Livestock,Forestry & Fishery
3= Industri Pengolahan/Manufacturing Industries
2003* 2004 **Propinsi/ Province
��%��
Direktorat Diseminasi StatistikGedung 3 Lantai 1
Telepon / Fax (021) 3863740
Layanan Statistik Sub Direktorat Layanan Statistik melayani permintaan data/informasi
statistik baik berupa tabulasi maupun data mikro, demikian juga untuk keperluan konsultasi statistik.Gedung 6, Lantai 1Telp. 3841195, 3842508 Ext. 3230, Telepon Langsung (021) 3507057Email : [email protected] : 3863740
Perpustakaan Sub Direktorat Dokumentasi dan Perpustakaan Statistik, yang melayani konsumen untuk data/ informasi yang tersedia di buku - buku publikasi BPSGedung 1 Lt. 1Telp. 3841195, 3842508 Ext. 3240 Email : [email protected] : 3863740
Toko Buku Toko Buku Koperasi BPS, melayani penjualan buku-buku publikasi BPSGedung 1 Lt. 1Telp. 3810291 - 4 Ext. 1023Telepon Langsung (021) 3842480
Internet http://www.bps.go.idWEB BPS, berisi informasi tentang BPS dan data BPS seperti inflasi, pendapatan nasional, jumlah penduduk dan lainnya.
Directorate of Statistical DisseminationBuilding 3, 1st floor
Phone/ Fax (021) 3863740
Statistical Services Sub-Directorate of Statistical Services (Layanan Statistik) serves all micro data requirements or particular data tabulations, as well as consultation on statistics.Building 6, 1st floor (021) 3841195, 3842508Ext. 3230, Phone (021) 3507057Email : [email protected] : 3863740
Library Sub-Directorate of Statistical Documentation and Library serves customers in obtaining statistics information which is available in BPS standardpublication books.Building 1, 1st floor (021) 3841195, 3842508 Ext. 3240Email : [email protected] : 3863740
Book Store All BPS publication books are sold in BPS bookstore.Building 1, 1st floor (021) 3841195, 3842508Ext. 1023, Phone (021) 3842480
Internet http://www.bps.go.idBPS Website contains information on BPS institution, as well as common statistical data, such as inflation, population and national income.
Sadar untuk menggunakan teknik statistik yangtepat guna dan menyajikan data statistik yang diperlukan konsumen secara tepat waktu, akurat dan mudah dipahami
Sadar untuk memberikan jawaban apa adanya sesuai dengan kenyataan tanpa ragu-ragu
Sadar untuk memahami metode, konsep dandefenisi serta memanfaatkan data statistiksecara optimal
SADAR STATISTIK
PENYELENGGARA
RESPONDEN
PENGGUNA
BPS Penyedia Statistik Berkualitas
BPS is the provided of qualified statistics
a. Menyediakan informasi statistik yang berkualitas
lengkap, akurat, relevan, mutakhir dan
berkesinambungan;
To provide quality statistical information which is
complete, accurate, relevant, timely, and sustainable
b. Mewujudkan upaya koordinasi, integrasi,
sinkronisasi, dan standardisasi kegiatan statistik
dalam kerangka Sistem Statistik Nasional yang
andal, efektif, dan efisien;
Within the NSS framework of being accountable,
effective, and efficient ensure that BPS makes an
effort towards coordination, integration,
synchronization and standardization of statistical
activities;
c. Meningkatkan kapasitas sumber daya secara
optimal sesuai dengan perkembangan ilmu
pengetahuan dan teknologi informasi mutakhir.
accordance with the latest science and information
technology
Visi dan Misi BPS/
Visi/ Vision
To optimally increase the resource capacity in
Misi/ Mission
BPS Vision and Mission