Embed Size (px)
Citation preview
6M17 Company Updates
PT MitraBahtera Segara Sejati
August 2017
1
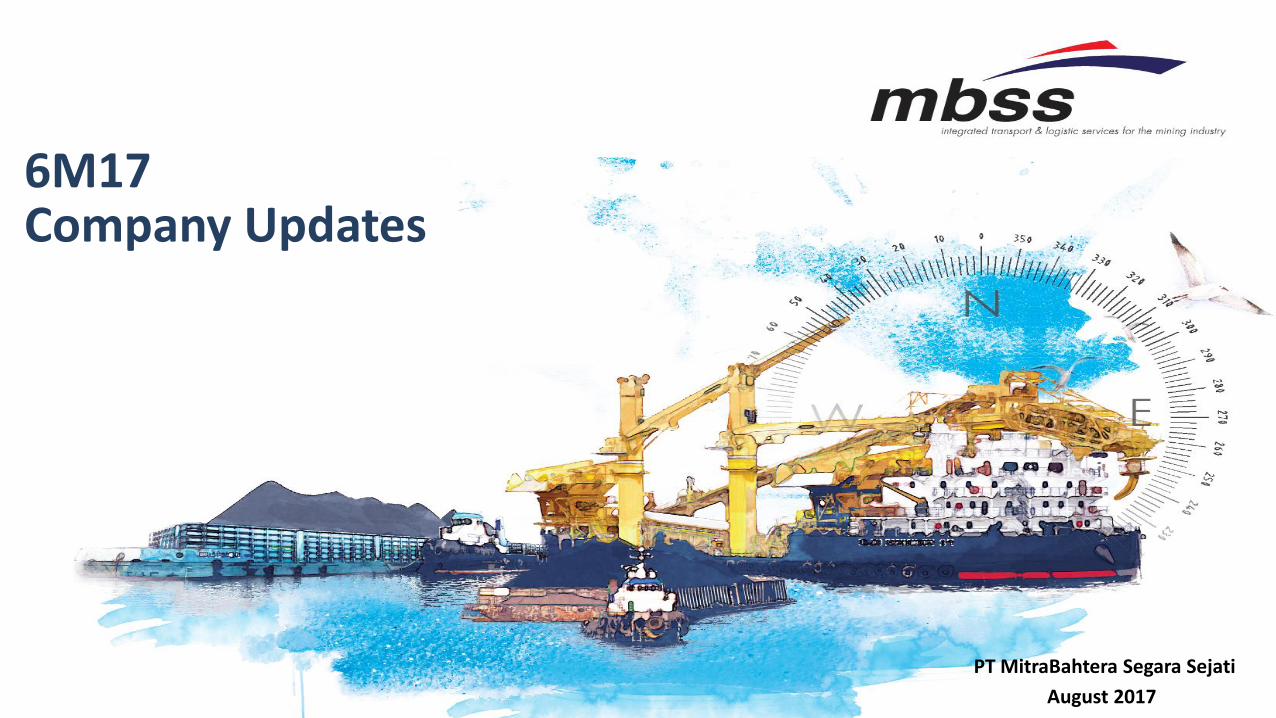
Table of Content
1
2
3
Disclaimer:
These materials have been prepared by PT Mitrabahtera Segara Sejati Tbk (the “Company”)
solely for information purposes and are not an offer to sell or an invitation to buy any
securities. Neither these materials nor anything herein forms the basis for any contract or
commitment whatsoever. These do not purport to be all-inclusive or to contain all of the
information a prospective or existing investor may desire. By retaining these materials, you
acknowledge and represent to the Company that you have read, understood and accepted the
terms of this notice.
These materials have not been independently verified. No representation or warranty,
expressed or implied, is made and no reliance should be placed on the fairness or
completeness of the information presented or contained in these materials. The opinion that is
expressed in these materials are subject to change without notice. To the extent maximum
limitation permitted by law, the Company or the Directors, employees, advisors, affiliates or
agents of the Company do not assume any responsibility, whatsoever for any loss arising from
or in connection with the use of this presentation or arising from anything expressly or
implicitly contained or referred to in these materials.
These materials may contain statements that constitute forward-looking statements and that
forward-looking statements are subject to various risks and uncertainties, many of which are
difficult to predict and generally beyond the control of the Company. Such statements,
estimates and projections reflect various assumptions by management concerning possible
anticipated results, which assumptions may or may not be correct. Neither the Company, its
affiliates nor any other person assumes responsibility for the accuracy and completeness of
the forward-looking statements in these materials. The materials are property of the Company
and any use and dissemination of the information is prohibited without the express written
consent from the Company.
Company’s Profile
03 About MBSS
04 The Management
05 Our Fleets
06 Operational Area
07 Our Clients
08 Financial Summary
Company’s Performance
10 Indonesia Coal Market Forecast
11 Macroeconomics Forecast
12 6M17 Performance Highlights
13 Barging Highlights
14 FC Highlights
15 Direct Cost Overview
Appendix
17 Summary Financial Statement
18 Shareholding Structure
19 Shares Performance and Dividend
2
PART 1. COMPANY’S PROFILE
3
About MBSS
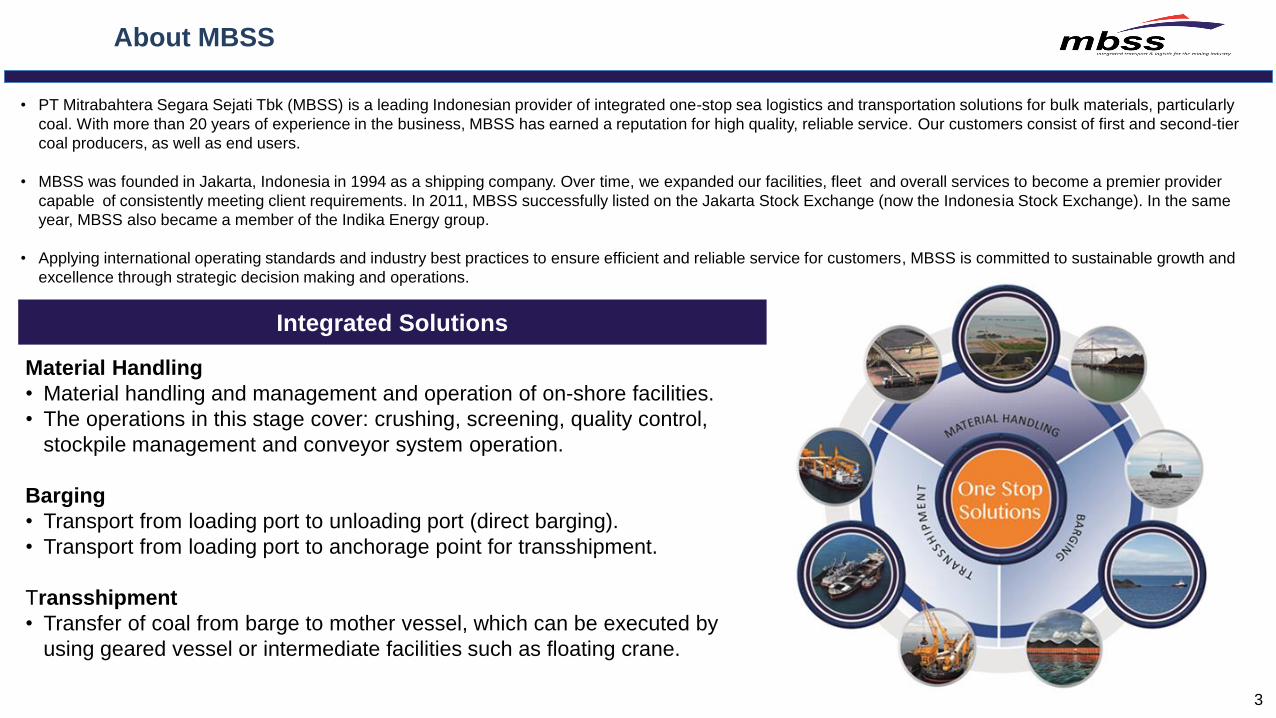
• PT Mitrabahtera Segara Sejati Tbk (MBSS) is a leading Indonesian provider of integrated one-stop sea logistics and transportation solutions for bulk materials, particularly
coal. With more than 20 years of experience in the business, MBSS has earned a reputation for high quality, reliable service. Our customers consist of first and second-tier
coal producers, as well as end users.
• MBSS was founded in Jakarta, Indonesia in 1994 as a shipping company. Over time, we expanded our facilities, fleetand overall services to become a premier provider
capableof consistently meeting client requirements. In 2011, MBSS successfully listed on the Jakarta Stock Exchange (now the Indonesia Stock Exchange). In the same
year, MBSS also became a member of the Indika Energy group.
• Applying international operating standards and industry best practices to ensure efficient and reliable service for customers, MBSS is committed to sustainable growth and
excellence through strategic decision making and operations.
Material Handling
• Material handling and management and operation of on-shore facilities.
• The operations in this stage cover: crushing, screening, quality control,
stockpile management and conveyor system operation.
Barging
• Transport from loading port to unloading port (direct barging).
• Transport from loading port to anchorage point for transshipment.
Transshipment
• Transfer of coal from barge to mother vessel, which can be executed by
using geared vessel or intermediate facilities such as floating crane.
Integrated Solutions
4
The Management
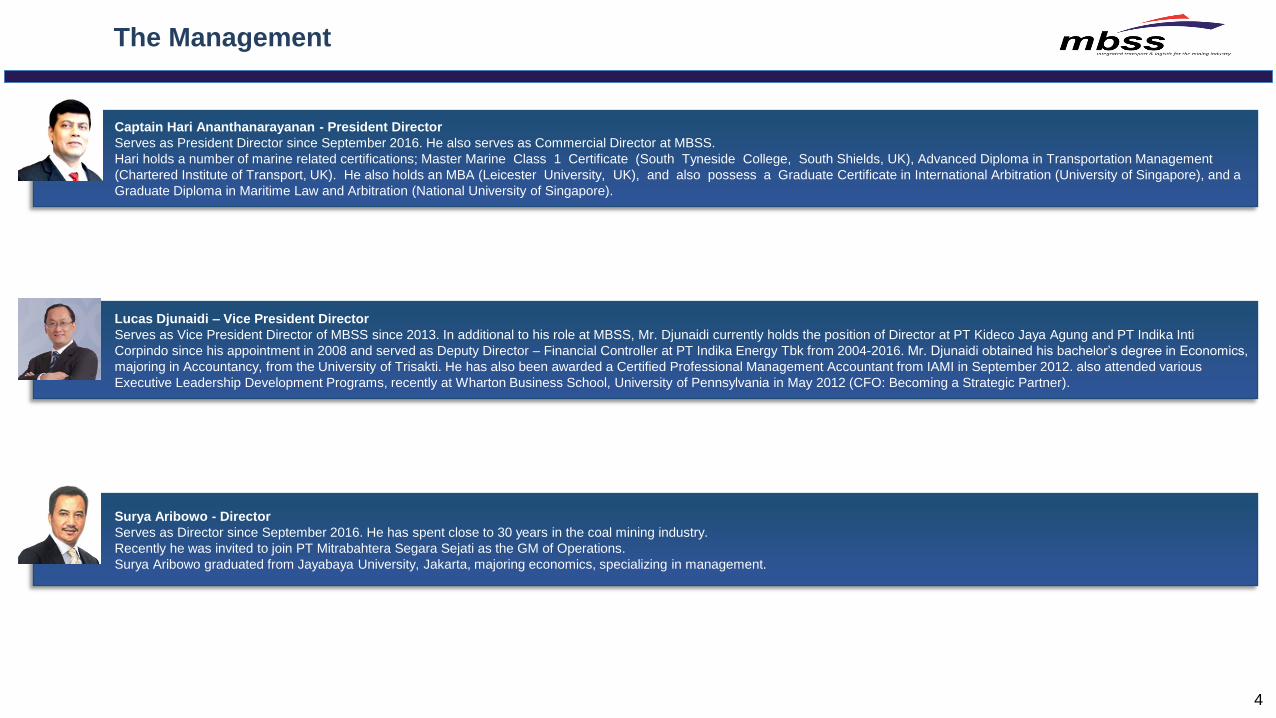
Captain Hari Ananthanarayanan - President Director
Serves as President Director since September 2016. He also serves as Commercial Director at MBSS.
Hari holds a number of marine related certifications; Master Marine Class 1 Certificate (South Tyneside College, South Shields, UK), Advanced Diploma in Transportation Management
(Chartered Institute of Transport, UK). He also holds an MBA (Leicester University, UK), and also possess a Graduate Certificate in International Arbitration (University of Singapore), and a
Graduate Diploma in Maritime Law and Arbitration (National University of Singapore).
Lucas Djunaidi – Vice President Director
Serves as Vice President Director of MBSS since 2013. In additional to his role at MBSS, Mr. Djunaidi currently holds the position of Director at PT Kideco Jaya Agung and PT Indika Inti
Corpindo since his appointment in 2008 and served as Deputy Director – Financial Controller at PT Indika Energy Tbk from 2004-2016. Mr. Djunaidi obtained his bachelor’s degree in Economics,
majoring in Accountancy, from the University of Trisakti. He has also been awarded a Certified Professional Management Accountant from IAMI in September 2012. also attended various
Executive Leadership Development Programs, recently at Wharton Business School, University of Pennsylvania in May 2012 (CFO: Becoming a Strategic Partner).
Surya Aribowo - Director
Serves as Director since September 2016. He has spent close to 30 years in the coal mining industry.
Recently he was invited to join PT Mitrabahtera Segara Sejati as the GM of Operations.
Surya Aribowo graduated from Jayabaya University, Jakarta, majoring economics, specializing in management.
5
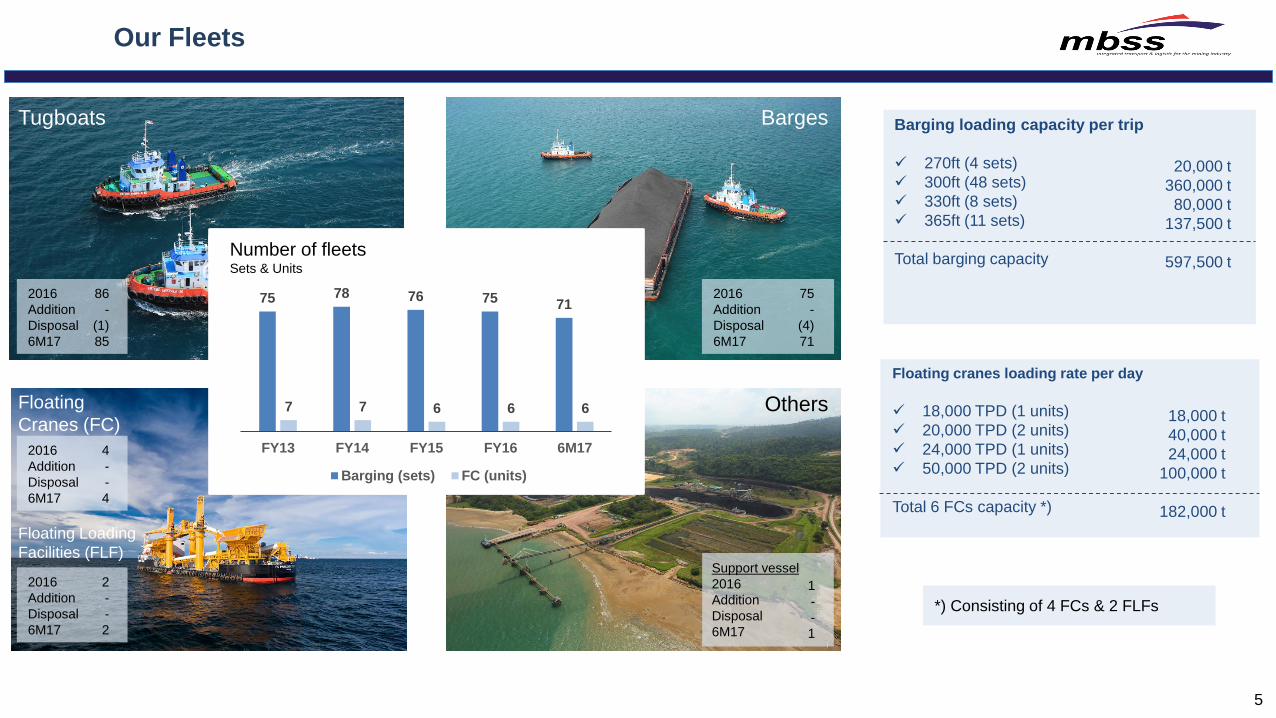
Our Fleets
2016
Addition
Disposal
6M17
86
-
(1)
85
2016
Addition
Disposal
6M17
75
-
(4)
71
2016
Addition
Disposal
6M17
4
-
-
4
Support vessel
2016
Addition
Disposal
6M17
1
-
-
1
Tugboats Barges
Floating
Cranes (FC) Others
Number of fleets Sets & Units
2016
Addition
Disposal
6M17
2
-
-
2
Floating Loading
Facilities (FLF)
Barging loading capacity per trip
270ft (4 sets)
300ft (48 sets)
330ft (8 sets)
365ft (11 sets)
Total barging capacity
20,000 t
360,000 t
80,000 t
137,500 t
597,500 t
Floating cranes loading rate per day
18,000 TPD (1 units)
20,000 TPD (2 units)
24,000 TPD (1 units)
50,000 TPD (2 units)
Total 6 FCs capacity *)
18,000 t
40,000 t
24,000 t
100,000 t
182,000 t
*) Consisting of 4 FCs & 2 FLFs
75 78 76 75 71
7 7 6 6 6
FY13 FY14 FY15 FY16 6M17
Barging (sets) FC (units)
6
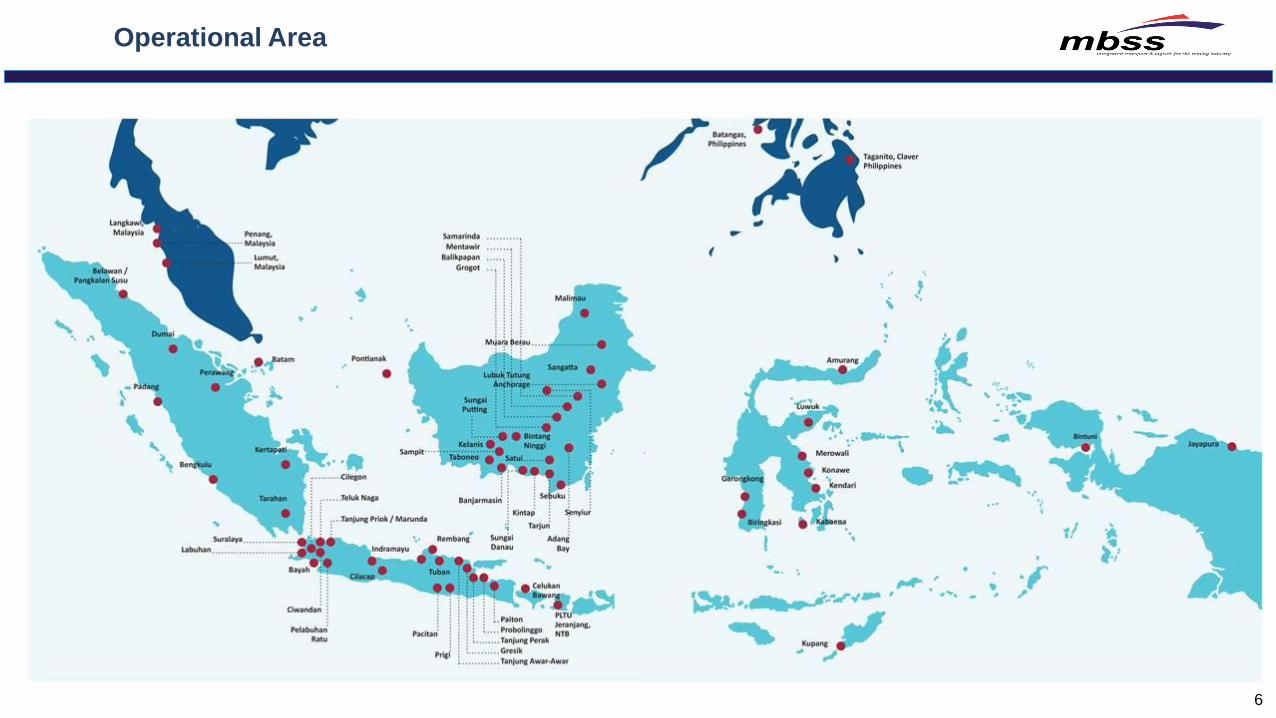
Operational Area
7
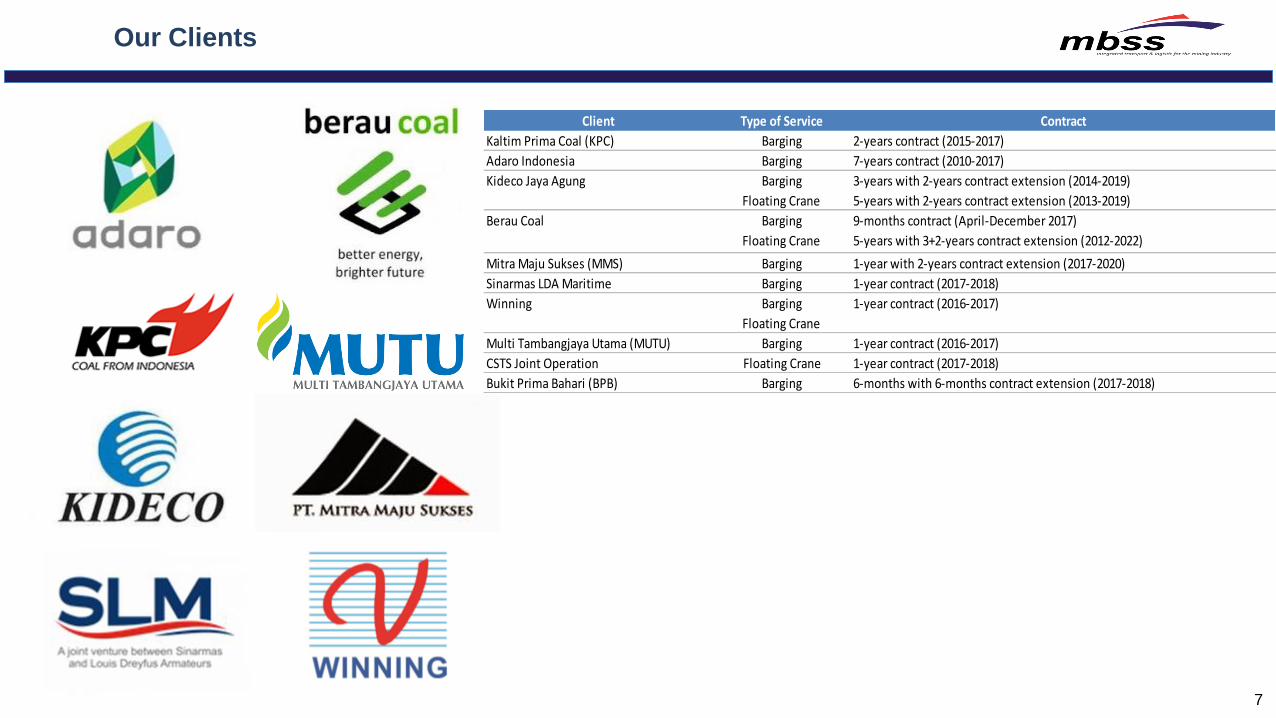
Our Clients
Client Type of Service Contract
Kaltim Prima Coal (KPC) Barging 2-years contract (2015-2017)
Adaro Indonesia Barging 7-years contract (2010-2017)
Kideco Jaya Agung Barging
Floating Crane
3-years with 2-years contract extension (2014-2019)
5-years with 2-years contract extension (2013-2019)
Berau Coal Barging
Floating Crane
9-months contract (April-December 2017)
5-years with 3+2-years contract extension (2012-2022)
Mitra Maju Sukses (MMS) Barging 1-year with 2-years contract extension (2017-2020)
Sinarmas LDA Maritime Barging 1-year contract (2017-2018)
Winning Barging
Floating Crane
1-year contract (2016-2017)
Multi Tambangjaya Utama (MUTU) Barging 1-year contract (2016-2017)
CSTS Joint Operation Floating Crane 1-year contract (2017-2018)
Bukit Prima Bahari (BPB) Barging 6-months with 6-months contract extension (2017-2018)
8
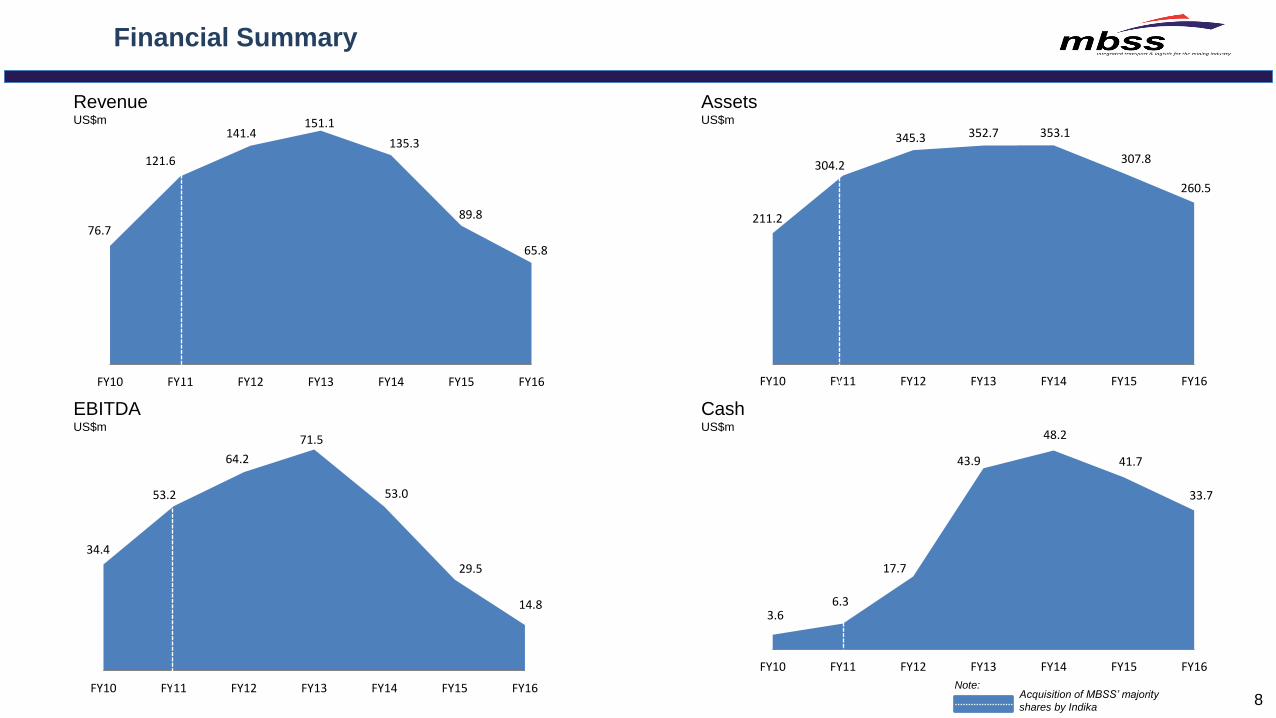
Financial Summary
Note: Acquisition of MBSS’ majority
shares by Indika
Revenue US$m
EBITDA US$m
Assets US$m
Cash US$m
76.7
121.6
141.4 151.1
135.3
89.8
65.8
FY10 FY11 FY12 FY13 FY14 FY15 FY16
211.2
304.2
345.3 352.7 353.1
307.8
260.5
FY10 FY11 FY12 FY13 FY14 FY15 FY16
34.4
53.2
64.2
71.5
53.0
29.5
14.8
FY10 FY11 FY12 FY13 FY14 FY15 FY16
3.6 6.3
17.7
43.9
48.2
41.7
33.7
FY10 FY11 FY12 FY13 FY14 FY15 FY16
9
PART 2. COMPANY’S PERFORMANCE
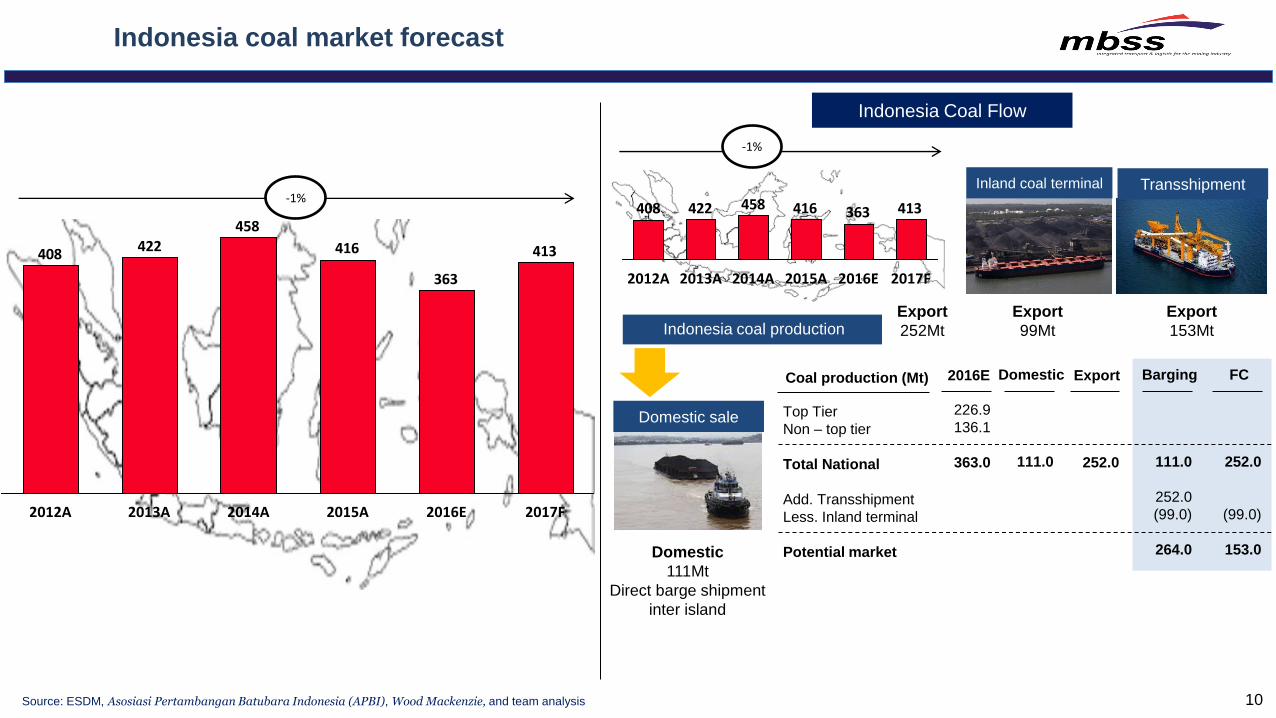
10 Source: ESDM, Asosiasi Pertambangan Batubara Indonesia (APBI), Wood Mackenzie, and team analysis
Indonesia coal market forecast
413363416458422408
2012A 2013A 2017F 2014A 2016E 2015A
Indonesia coal production Export
252Mt
Transshipment Inland coal terminal
Export
99Mt
Export
153Mt
Domestic sale
Domestic
111Mt
Direct barge shipment
inter island
Indonesia Coal Flow
Top Tier
Non – top tier
Total National
Add. Transshipment
Less. Inland terminal
Potential market
Coal production (Mt)
226.9
136.1
363.0
2016E
111.0
Domestic
252.0
Export
111.0
252.0
(99.0)
264.0
Barging
252.0
(99.0)
153.0
FC
413
363
416
458422
408
2012A 2015A 2016E 2017F 2014A 2013A
-1%
-1%
11
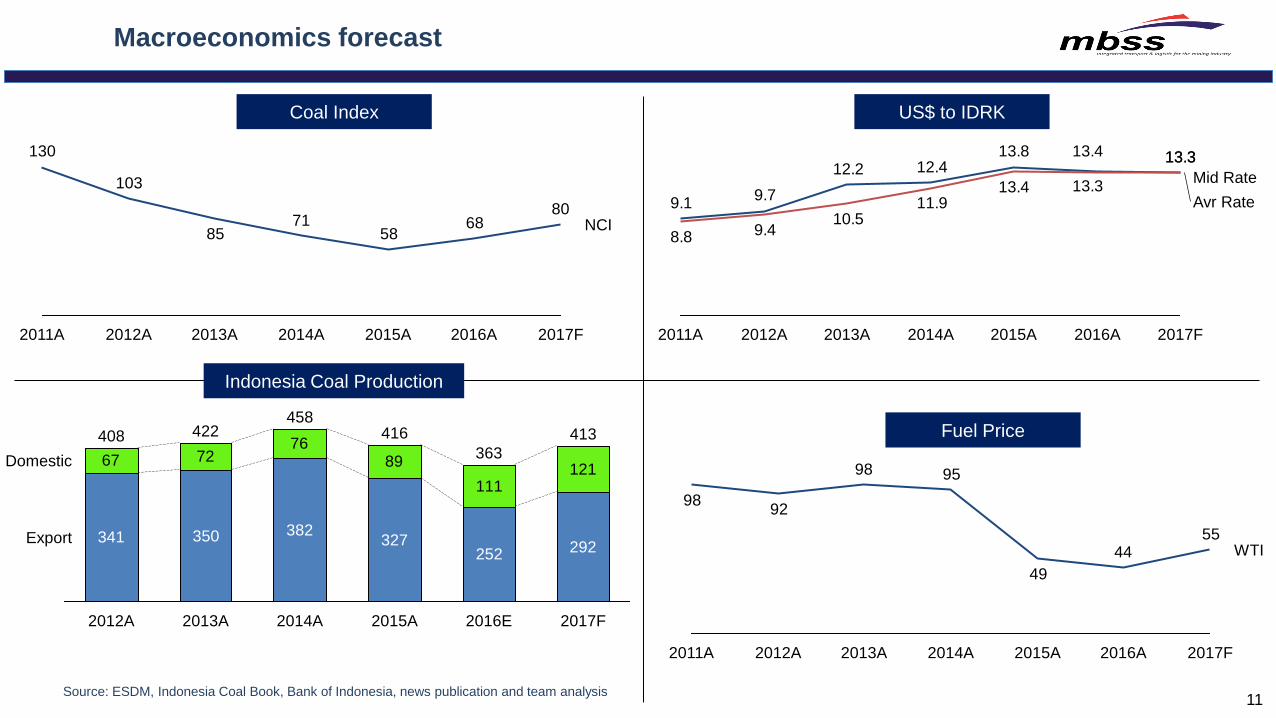
Macroeconomics forecast
8068
5885
103
130
NCI
2016A 2015A 2017F 2011A
71
2014A 2013A 2012A
341 350 382327
252 292
67 7276
89
111121
Export
Domestic
413
2016E
363
2017F 2014A
408 416
2012A
422 458
2015A 2013A
US$ to IDRK Coal Index
Indonesia Coal Production
13.313.413.812.412.2
9.79.1
13.3
13.313.411.9
10.59.48.8
2016A
Mid Rate
Avr Rate
2015A 2017F 2014A 2012A 2011A 2013A
Source: ESDM, Indonesia Coal Book, Bank of Indonesia, news publication and team analysis
5544
49
9598
9298
2014A 2015A 2013A 2017F 2016A
WTI
2012A 2011A
Fuel Price
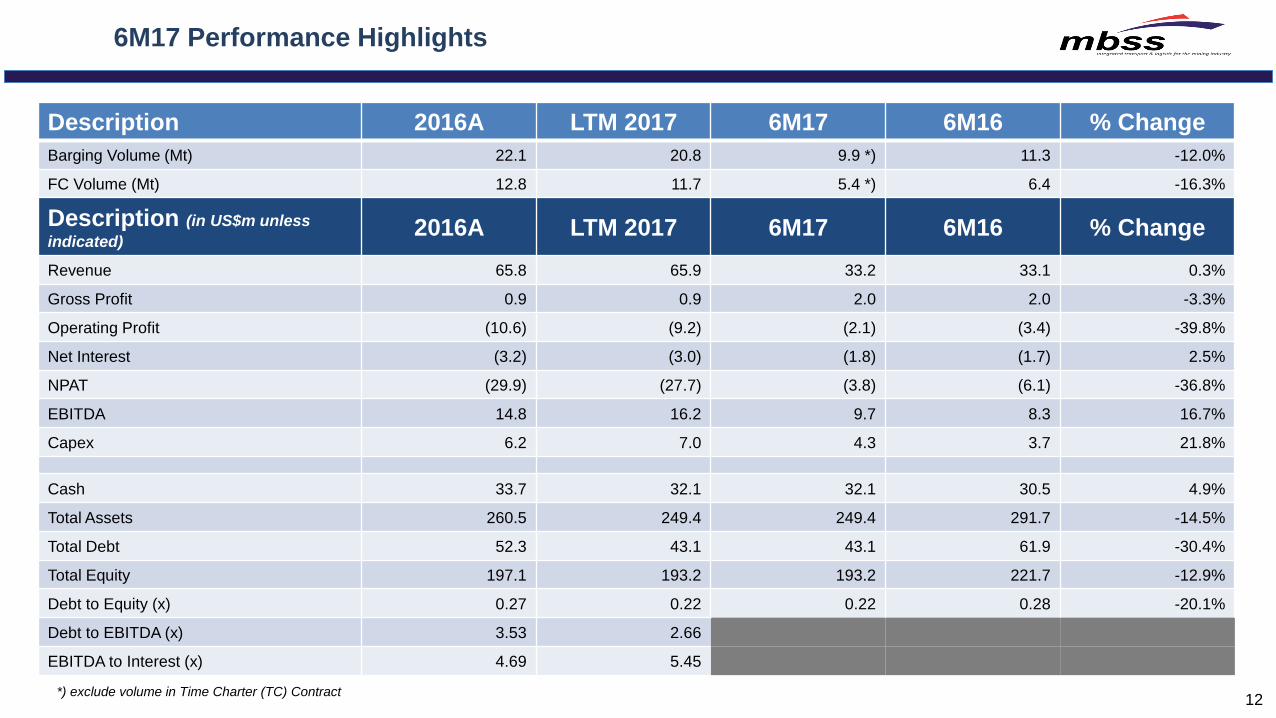
12
Description 2016A LTM 2017 6M17 6M16 % Change
Barging Volume (Mt) 22.1 20.8 9.9 *) 11.3 -12.0%
FC Volume (Mt) 12.8 11.7 5.4 *) 6.4 -16.3%
Description (in US$m unless
indicated) 2016A LTM 2017 6M17 6M16 % Change
Revenue 65.8 65.9 33.2 33.1 0.3%
Gross Profit 0.9 0.9 2.0 2.0 -3.3%
Operating Profit (10.6) (9.2) (2.1) (3.4) -39.8%
Net Interest (3.2) (3.0) (1.8) (1.7) 2.5%
NPAT (29.9) (27.7) (3.8) (6.1) -36.8%
EBITDA 14.8 16.2 9.7 8.3 16.7%
Capex 6.2 7.0 4.3 3.7 21.8%
Cash 33.7 32.1 32.1 30.5 4.9%
Total Assets 260.5 249.4 249.4 291.7 -14.5%
Total Debt 52.3 43.1 43.1 61.9 -30.4%
Total Equity 197.1 193.2 193.2 221.7 -12.9%
Debt to Equity (x) 0.27 0.22 0.22 0.28 -20.1%
Debt to EBITDA (x) 3.53 2.66
EBITDA to Interest (x) 4.69 5.45
6M17 Performance Highlights
*) exclude volume in Time Charter (TC) Contract
13
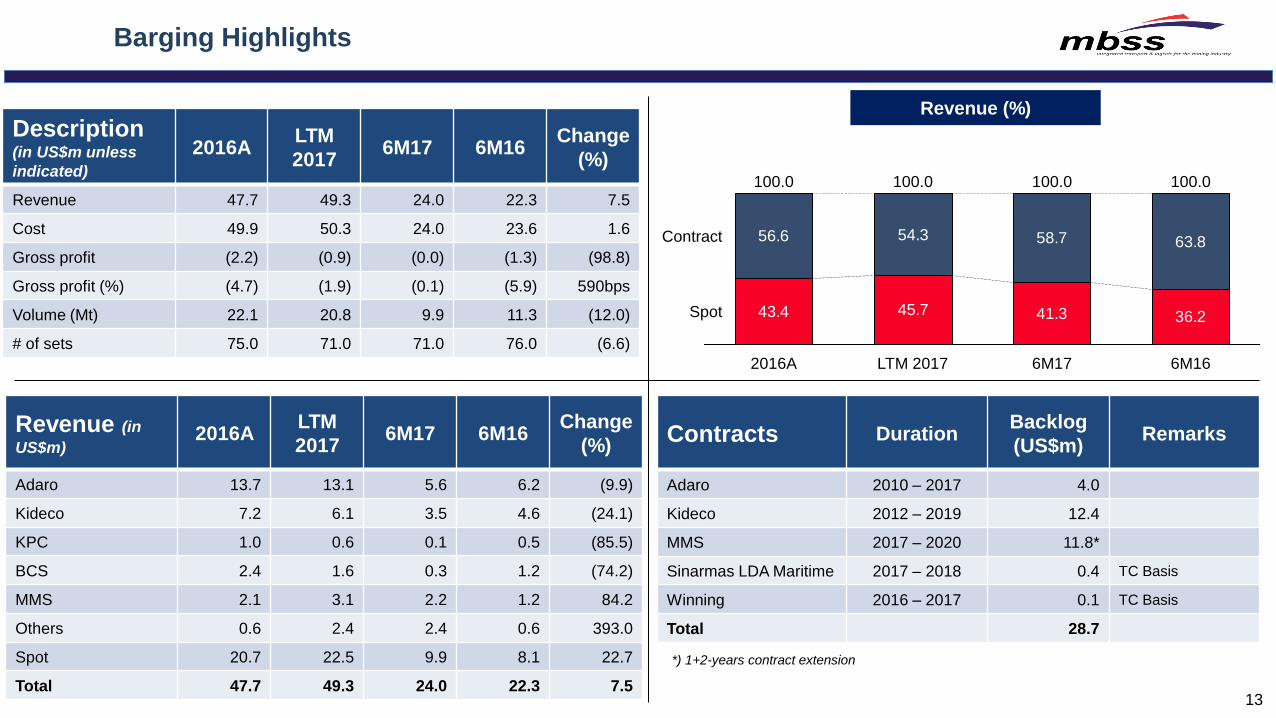
Barging Highlights
Revenue (in
US$m) 2016A
LTM
2017 6M17 6M16
Change
(%)
Adaro 13.7 13.1 5.6 6.2 (9.9)
Kideco 7.2 6.1 3.5 4.6 (24.1)
KPC 1.0 0.6 0.1 0.5 (85.5)
BCS 2.4 1.6 0.3 1.2 (74.2)
MMS 2.1 3.1 2.2 1.2 84.2
Others 0.6 2.4 2.4 0.6 393.0
Spot 20.7 22.5 9.9 8.1 22.7
Total 47.7 49.3 24.0 22.3 7.5
Description (in US$m unless
indicated)
2016A LTM
2017 6M17 6M16
Change
(%)
Revenue 47.7 49.3 24.0 22.3 7.5
Cost 49.9 50.3 24.0 23.6 1.6
Gross profit (2.2) (0.9) (0.0) (1.3) (98.8)
Gross profit (%) (4.7) (1.9) (0.1) (5.9) 590bps
Volume (Mt) 22.1 20.8 9.9 11.3 (12.0)
# of sets 75.0 71.0 71.0 76.0 (6.6)
Revenue (%)
43.4 45.7 41.3 36.2
56.6 54.3 58.7 63.8
100.0 100.0
LTM 2017
100.0
6M17
100.0
6M16
Contract
Spot
2016A
Contracts Duration Backlog
(US$m) Remarks
Adaro 2010 – 2017 4.0
Kideco 2012 – 2019 12.4
MMS 2017 – 2020 11.8*
Sinarmas LDA Maritime 2017 – 2018 0.4 TC Basis
Winning 2016 – 2017 0.1 TC Basis
Total 28.7
*) 1+2-years contract extension
14
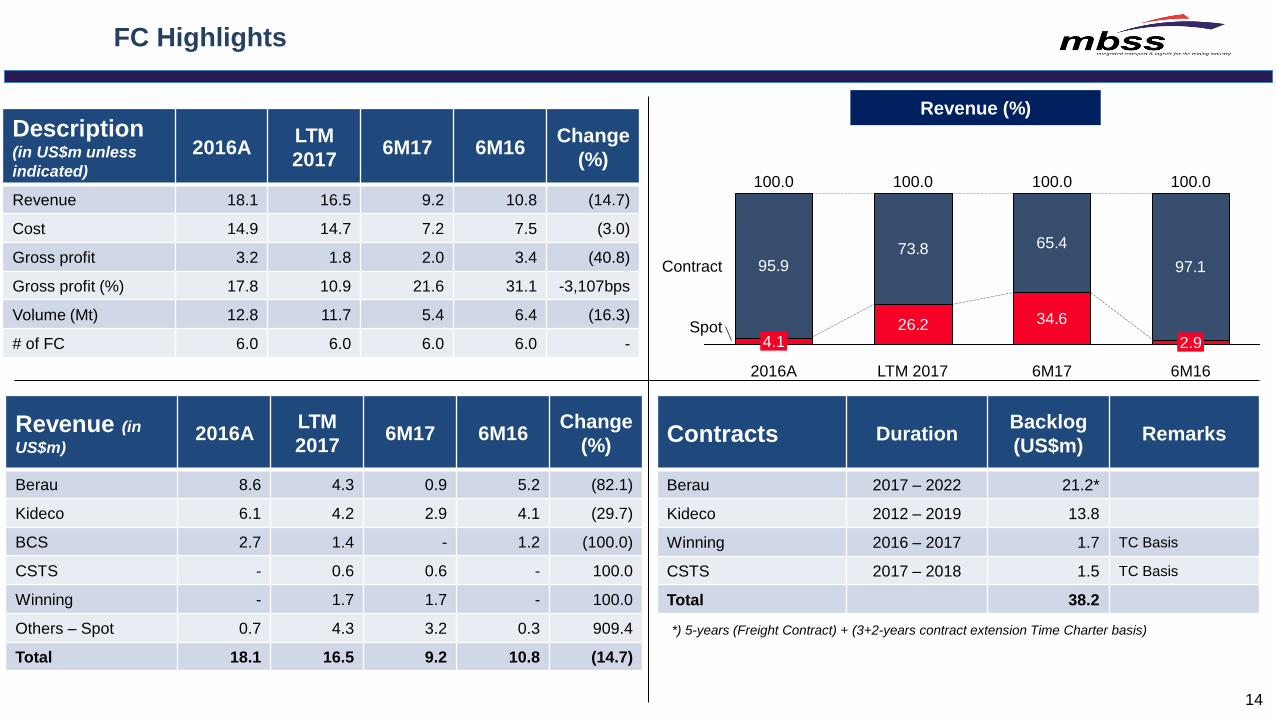
FC Highlights
Revenue (in
US$m) 2016A
LTM
2017 6M17 6M16
Change
(%)
Berau 8.6 4.3 0.9 5.2 (82.1)
Kideco 6.1 4.2 2.9 4.1 (29.7)
BCS 2.7 1.4 - 1.2 (100.0)
CSTS - 0.6 0.6 - 100.0
Winning - 1.7 1.7 - 100.0
Others – Spot 0.7 4.3 3.2 0.3 909.4
Total 18.1 16.5 9.2 10.8 (14.7)
Description (in US$m unless
indicated)
2016A LTM
2017 6M17 6M16
Change
(%)
Revenue 18.1 16.5 9.2 10.8 (14.7)
Cost 14.9 14.7 7.2 7.5 (3.0)
Gross profit 3.2 1.8 2.0 3.4 (40.8)
Gross profit (%) 17.8 10.9 21.6 31.1 -3,107bps
Volume (Mt) 12.8 11.7 5.4 6.4 (16.3)
# of FC 6.0 6.0 6.0 6.0 -
Revenue (%)
95.973.8 65.4
97.1
26.2 34.6
Contract
Spot
100.0
6M16 6M17 2016A
100.0
4.1
100.0
2.9
100.0
LTM 2017
Contracts Duration Backlog
(US$m) Remarks
Berau 2017 – 2022 21.2*
Kideco 2012 – 2019 13.8
Winning 2016 – 2017 1.7 TC Basis
CSTS 2017 – 2018 1.5 TC Basis
Total 38.2
*) 5-years (Freight Contract) + (3+2-years contract extension Time Charter basis)
15
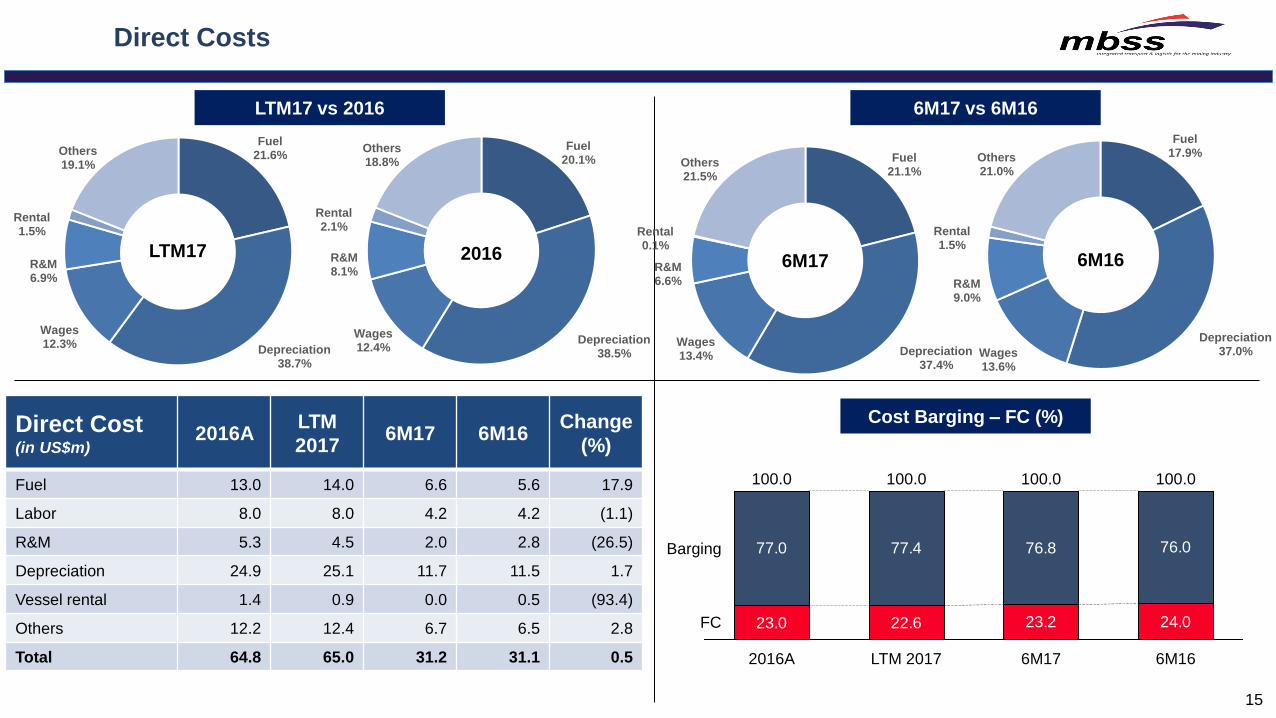
Direct Costs
Direct Cost (in US$m)
2016A LTM
2017 6M17 6M16
Change
(%)
Fuel 13.0 14.0 6.6 5.6 17.9
Labor 8.0 8.0 4.2 4.2 (1.1)
R&M 5.3 4.5 2.0 2.8 (26.5)
Depreciation 24.9 25.1 11.7 11.5 1.7
Vessel rental 1.4 0.9 0.0 0.5 (93.4)
Others 12.2 12.4 6.7 6.5 2.8
Total 64.8 65.0 31.2 31.1 0.5
6M17 vs 6M16 LTM17 vs 2016
LTM17 2016 6M17 6M16
24.023.222.623.0
76.076.877.477.0
LTM 2017 6M17
100.0 100.0
2016A
FC
6M16
Barging
100.0 100.0
Cost Barging – FC (%)
Fuel 20.1%
Depreciation 38.5%
Wages 12.4%
R&M 8.1%
Rental 2.1%
Others 18.8%
Fuel 21.6%
Depreciation 38.7%
Wages 12.3%
R&M 6.9%
Rental 1.5%
Others 19.1%
Fuel 17.9%
Depreciation 37.0% Wages
13.6%
R&M 9.0%
Rental 1.5%
Others 21.0%
Fuel 21.1%
Depreciation 37.4%
Wages 13.4%
R&M 6.6%
Rental 0.1%
Others 21.5%
16
PART 3. APPENDIX
17
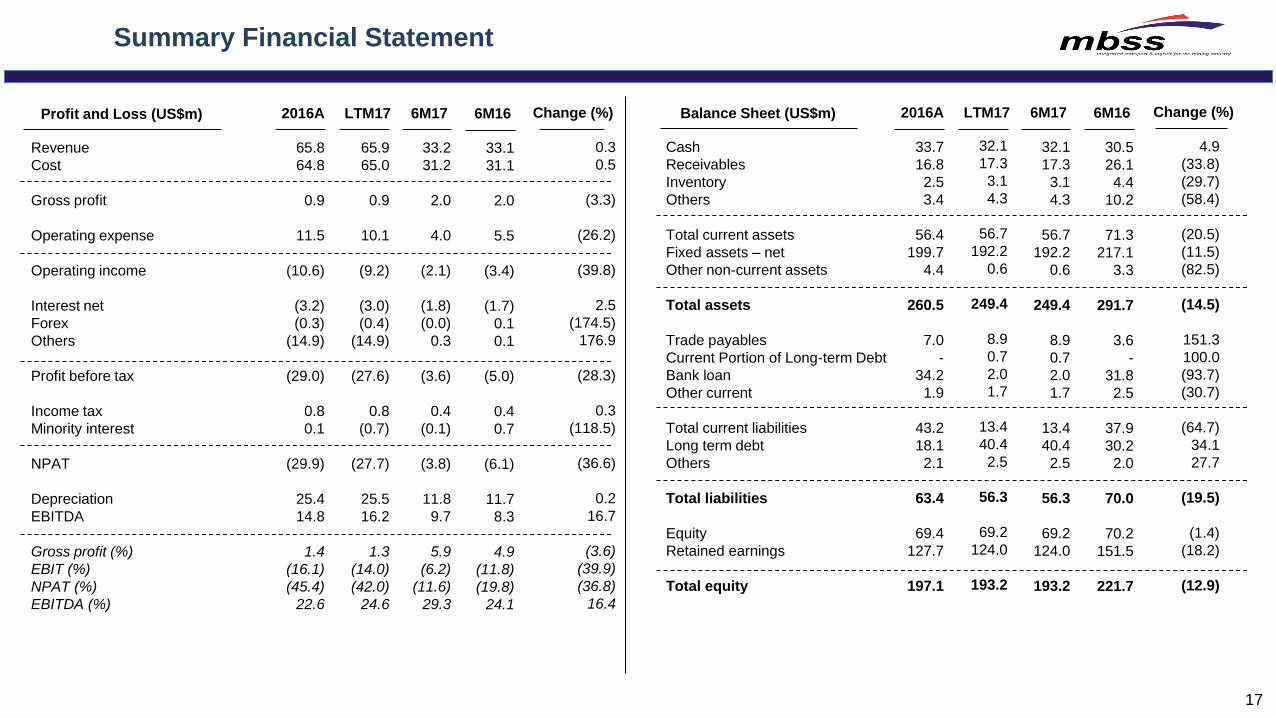
Summary Financial Statement
Revenue
Cost
Gross profit
Operating expense
Operating income
Interest net
Forex
Others
Profit before tax
Income tax
Minority interest
NPAT
Depreciation
EBITDA
Gross profit (%)
EBIT (%)
NPAT (%)
EBITDA (%)
2016A LTM17 Profit and Loss (US$m) 6M17 6M16 Change (%)
Cash
Receivables
Inventory
Others
Total current assets
Fixed assets – net
Other non-current assets
Total assets
Trade payables
Current Portion of Long-term Debt
Bank loan
Other current
Total current liabilities
Long term debt
Others
Total liabilities
Equity
Retained earnings
Total equity
2016A LTM17 Balance Sheet (US$m) 6M17 6M16 Change (%)
65.8
64.8
0.9
11.5
(10.6)
(3.2)
(0.3)
(14.9)
(29.0)
0.8
0.1
(29.9)
25.4
14.8
1.4
(16.1)
(45.4)
22.6
65.9
65.0
0.9
10.1
(9.2)
(3.0)
(0.4)
(14.9)
(27.6)
0.8
(0.7)
(27.7)
25.5
16.2
1.3
(14.0)
(42.0)
24.6
33.2
31.2
2.0
4.0
(2.1)
(1.8)
(0.0)
0.3
(3.6)
0.4
(0.1)
(3.8)
11.8
9.7
5.9
(6.2)
(11.6)
29.3
33.1
31.1
2.0
5.5
(3.4)
(1.7)
0.1
0.1
(5.0)
0.4
0.7
(6.1)
11.7
8.3
4.9
(11.8)
(19.8)
24.1
0.3
0.5
(3.3)
(26.2)
(39.8)
2.5
(174.5)
176.9
(28.3)
0.3
(118.5)
(36.6)
0.2
16.7
(3.6)
(39.9)
(36.8)
16.4
33.7
16.8
2.5
3.4
56.4
199.7
4.4
260.5
7.0
-
34.2
1.9
43.2
18.1
2.1
63.4
69.4
127.7
197.1
32.1
17.3
3.1
4.3
56.7
192.2
0.6
249.4
8.9
0.7
2.0
1.7
13.4
40.4
2.5
56.3
69.2
124.0
193.2
30.5
26.1
4.4
10.2
71.3
217.1
3.3
291.7
3.6
-
31.8
2.5
37.9
30.2
2.0
70.0
70.2
151.5
221.7
4.9
(33.8)
(29.7)
(58.4)
(20.5)
(11.5)
(82.5)
(14.5)
151.3
100.0
(93.7)
(30.7)
(64.7)
34.1
27.7
(19.5)
(1.4)
(18.2)
(12.9)
32.1
17.3
3.1
4.3
56.7
192.2
0.6
249.4
8.9
0.7
2.0
1.7
13.4
40.4
2.5
56.3
69.2
124.0
193.2
18
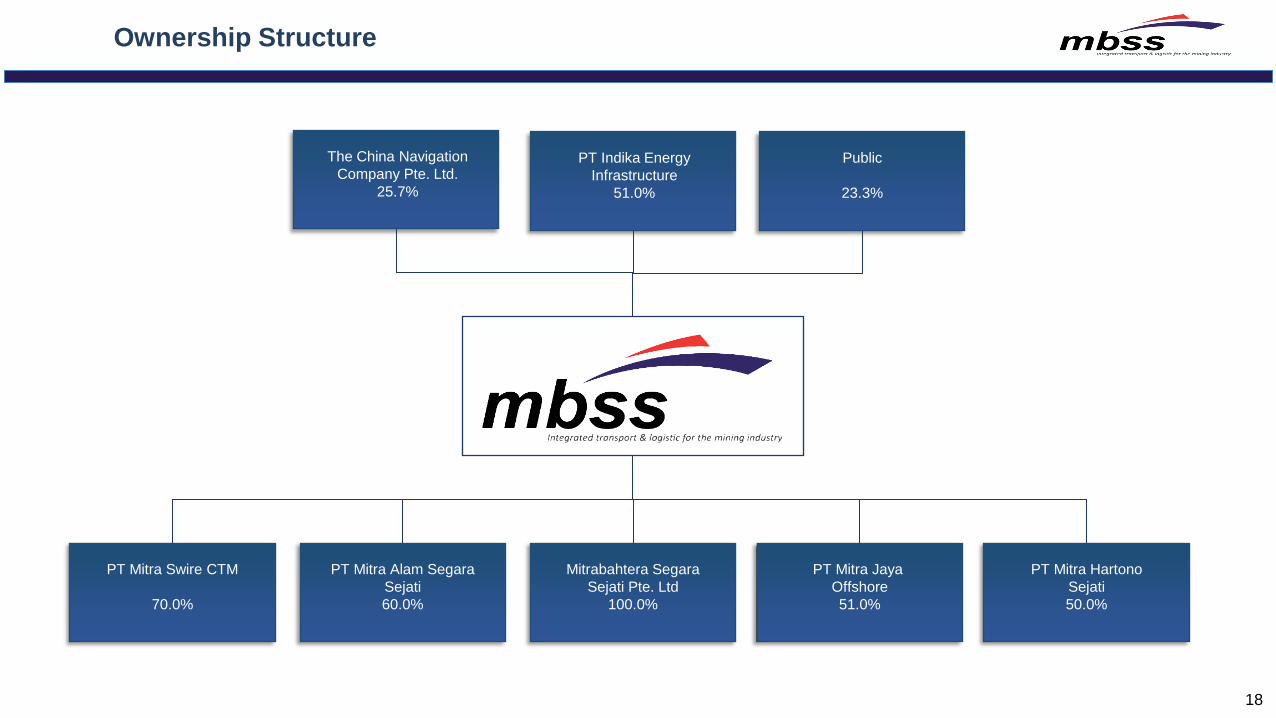
Ownership Structure
PT Mitra Swire CTM
70.0%
PT Mitra Alam Segara
Sejati
60.0%
Mitrabahtera Segara
Sejati Pte. Ltd
100.0%
PT Mitra Jaya
Offshore
51.0%
PT Mitra Hartono
Sejati
50.0%
The China Navigation
Company Pte. Ltd.
25.7%
Public
23.3%
PT Indika Energy
Infrastructure
51.0%
19
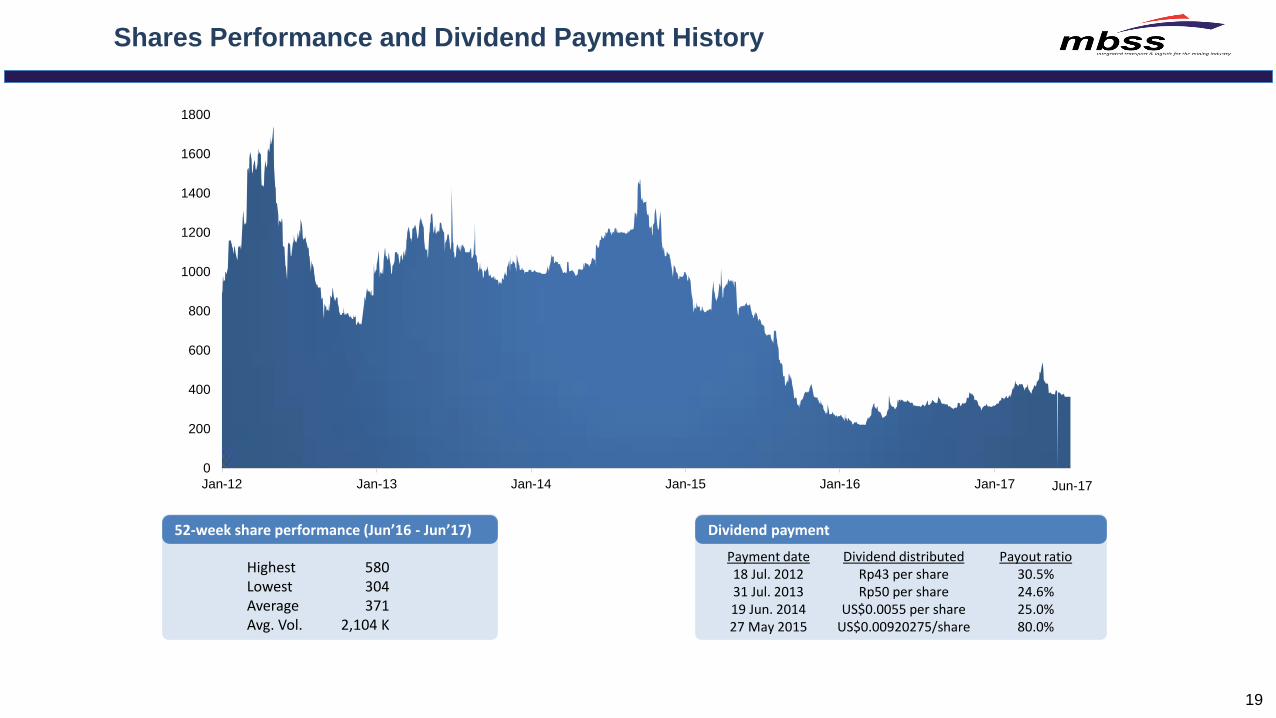
Shares Performance and Dividend Payment History
52-week share performance (Jun’16 - Jun’17)
Highest Lowest Average Avg. Vol.
580 304 371
2,104 K
Dividend payment
Payment date 18 Jul. 2012 31 Jul. 2013 19 Jun. 2014 27 May 2015
Dividend distributed Rp43 per share Rp50 per share
US$0.0055 per share US$0.00920275/share
Payout ratio 30.5% 24.6% 25.0% 80.0%
0
200
400
600
800
1000
1200
1400
1600
1800
Jan-12 Jan-13 Jan-14 Jan-15 Jan-16 Jan-17 Jun-17
PT Mitrabahtera Segara Sejati Tbk Menara Karya, 12th Floor
Jl. H.R. Rasuna Said Block X-5 Kav. 1 - 2, Kuningan
Jakarta 12950, Indonesia
Tel.: (62-21) 57944755, 57944766 Fax.: (62-21) 57944767, 57944768
www.mbss.co.id