Embed Size (px)
Citation preview

8

Network operation planning Network design problems Network design and operations models:
extension Data for network design Strategic role of units in the network Locations of service systems
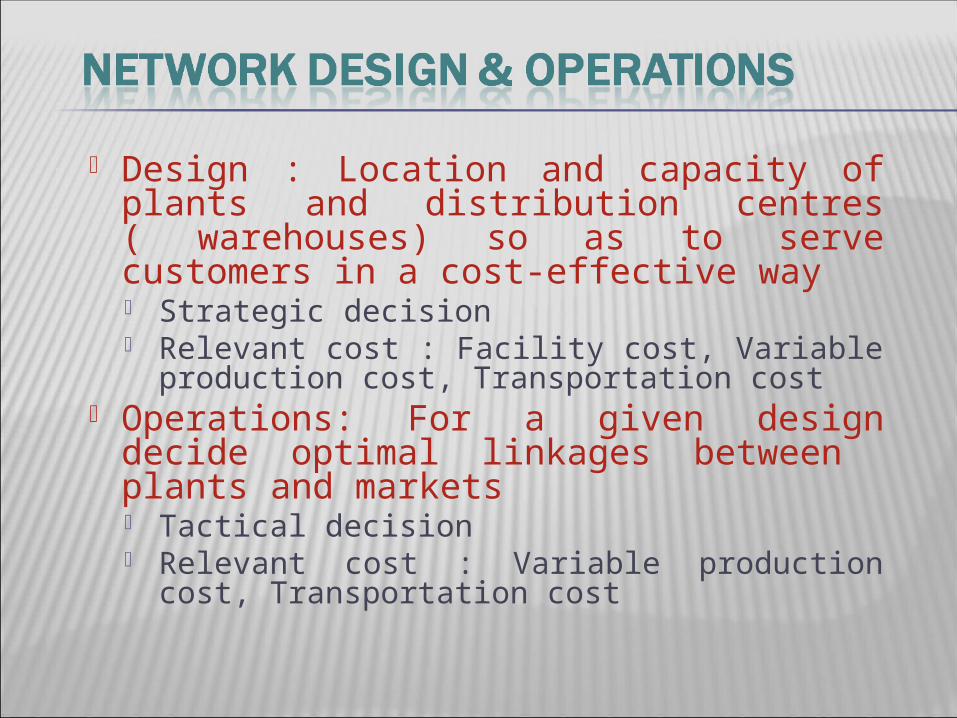
Design : Location and capacity of plants and distribution centres ( warehouses) so as to serve customers in a cost-effective way Strategic decision Relevant cost : Facility cost, Variable
production cost, Transportation cost Operations: For a given design decide
optimal linkages between plants and markets Tactical decision Relevant cost : Variable production cost,
Transportation cost

Indian Paints: Five Plants and Six Markets

Indian Paints: Production Plus Transportation Cost*
*per unit

M= Number of plants. Let i= 1..m describe m respective manufacturing plants.
N= Number of markets. Let j= 1..n describe n respective markets Demj , Pricej , = demand & Price at market j
Capi = production capacity at plant i
Costij = Cost of producing and transporting one unit from plant i to market j
F costi = Fixed cost of facility i
Decision Variables:
Quantij = Quantity shipped from plant i to market j
Fac open i = 0 or 1 binary variable for facility i - If binary value is 1
:facility is open and If binary value is 0 :facility is close* Parameters in italic type and blue are used in design decisions. Capacity and demand are for unit time period. Unit time period
could be month, quarter or a year

m
i
n
j
ijij QuantCost1 1
*
jm
iij DemQuant
1
in
jij CapQuant
1
0ijQuant
Subject to following constraints:
for j=1..n for i=1…m
for i=1..m , j=1..n
Network Operations Planning: Cost Minimization Model
Minimize
Number of variables= m *n & number of constraints= m+n

Objective function value= Total Variable costs=773,770Revenue= 1,017,450 , Gross Profit = 243,680 , Net Profit= 15,680
Network Operations Planning: Cost Minimization Model

m
i
n
jijijij
m
ij
n
jQuantCostQuantice
1 1*
1 1*Pr
j
m
i
ij DemQuant 1
i
n
j
ij CapQuant 1
0ijQuant
Maximise
for i=1…m
for j=1..n
for i=1..m , j=1..n
Network Operations Planning: Profit Maximization Model
Number of variables= m *n & number of constraints= m+n

Objective Function = Maximize Total Gross Profit = 245230 Revenue= 885700 Variable cost = 640470, Net Profit= 17,230
Network Operations Planning: Profit Maximization Model

Decision problem
Type of decision
Objective Revenue Net Profit % Net profit/Sales
I Network Operations
Cost Minimisation
1017450 15680 1.54
II Network Operations
Profit Maximisation
885700 17230 1.95
Why is Kolkata market not served in model II ?

Change in market structure Change in market demand Changes in wage rate Changes in utilities and cost of
transportation
m
i
n
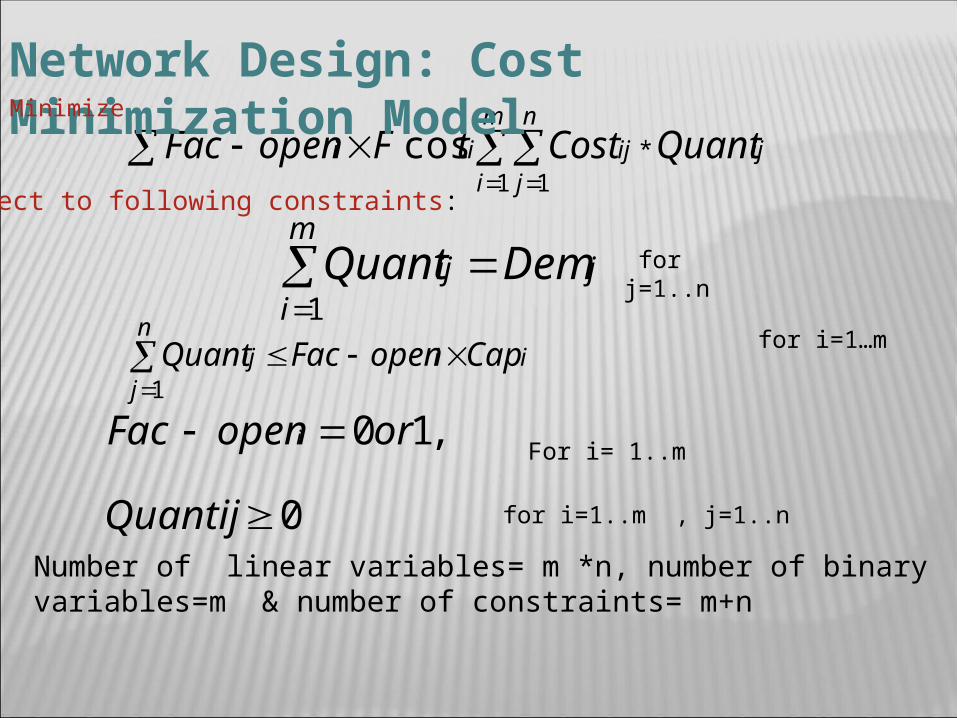
jijijii QuantCosttFopenFac
1 1*cos
jm
iij DemQuant
1
iin
jij CapopenFacQuant
1
0
,10
Quantij
oropenFac i
Subject to following constraints:
for j=1..n for i=1…m
for i=1..m , j=1..n
Network Design: Cost Minimization ModelMinimize
Number of linear variables= m *n, number of binary variables=m & number of constraints= m+n
For i= 1..m

Bangalore Chennai Delhi Mumbai Lucknow Kolkata
Supply Plant
(open/close)
Ahmedabad 0 0 0 0 0 0 0 No
Baddi 0 0 280 0 120 0 400 Yes
Hubli 165 135 0 60 0 0 360 Yes
Nagpur 0 0 0 140 5 155 300 Yes
Vishakapatna
m 0 0 0 0 0 0 0
No
Supply 165 135 280 200 125 155 0
Network Design: Cost Minimization Model
Objective function = Total Costs ( Fixed + Variable) = 891760Revenue= 1,017,450 , Gross Profit = 241,690 , Net Profit= 125,690

m
i
n
jQuantCostOpenFacQuant
m
iice
n
jijijiijj
1 1**
1Pr
1
Maximise
for i=1…m
for j=1..n
for i=1..m , j=1..n
Network Operations Planning: Profit Maximization Model
0
,10
Quantij
oropenFac i
iin
jij CapopenFacQuant
1
j
m
i
ij DemQuant 1
for i=1…m
Number of linear variables= m *n, number of binary variables=m & number of constraints= m+n

Bangalore Chennai Delhi Mumbai Lucknow Kolkata
Supply Plant
(open/close)
Ahmedabad 0 0 0 0 0 0 0 No
Baddi 0 0 280 0 120 0 400 Yes
Hubli 165 85 0 200 0 0 450 Yes
Nagpur 0 0 0 0 0 0 0 No
Vishakapatn
am 0 0 0 0 0 0
0 No
Supply 165 85 280 200 120 0
Objective function = Total Net Profit = 154,685Revenue= 833,700 , Variable Cost = 601,015 Gross Profit= 232, 685
Network Design: Profit Maximization Model
Fixed Cost= 78,000

A Performance Comparison of the Four Models
-Under what circumstances Indian paints choose not to use model IV ?- How do choice of organisation structure affect selection of model ?
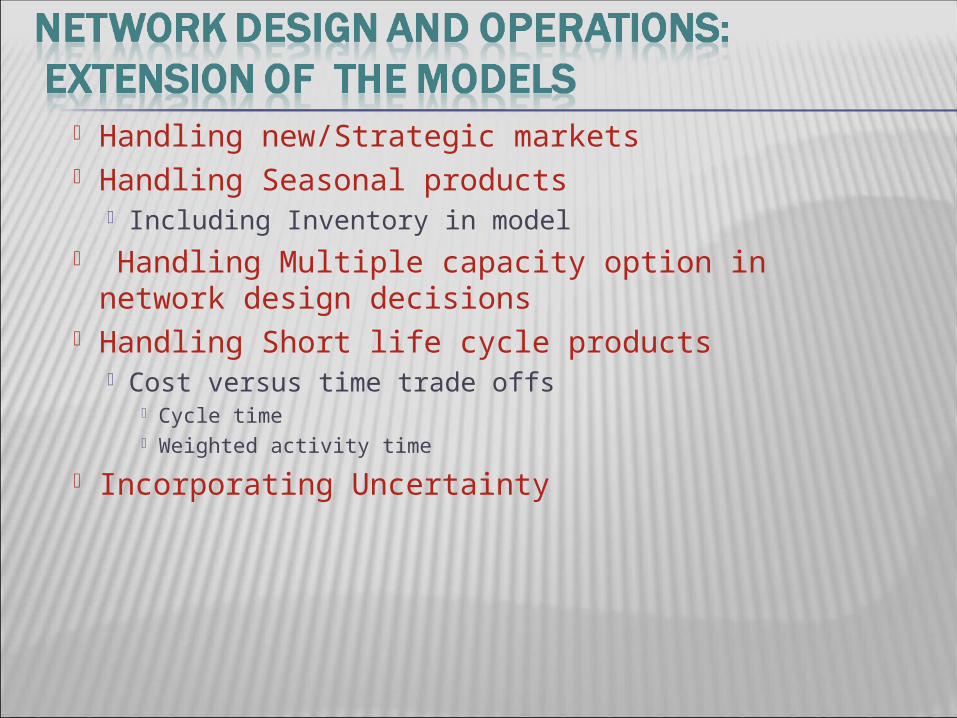
Handling new/Strategic markets Handling Seasonal products
Including Inventory in model Handling Multiple capacity option in network
design decisions Handling Short life cycle products
Cost versus time trade offs Cycle time Weighted activity time
Incorporating Uncertainty
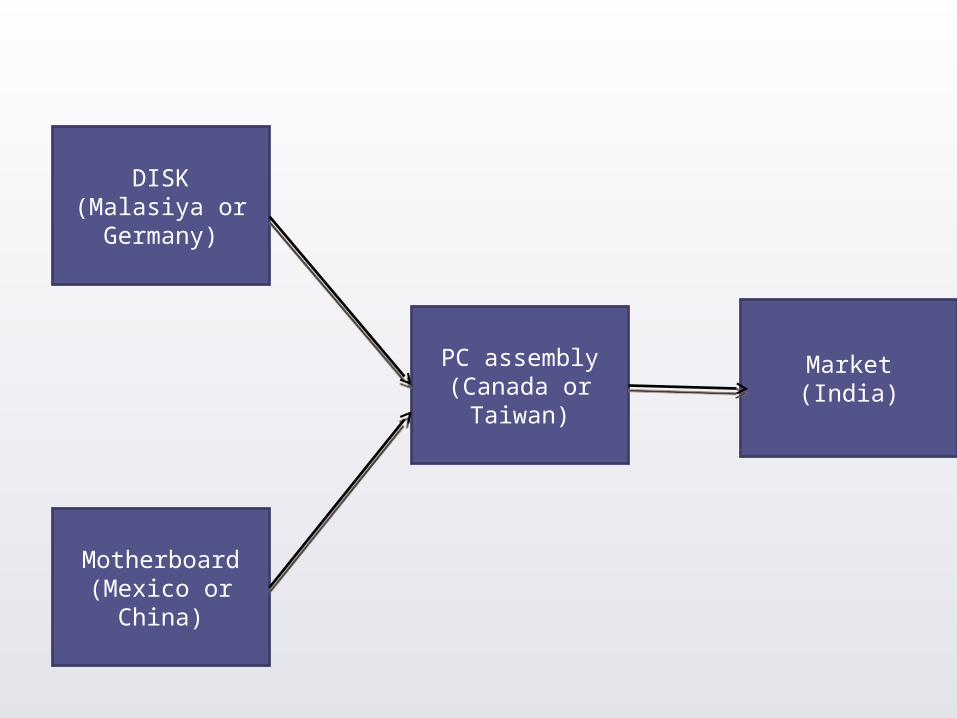
DISK(Malasiya or Germany)
Motherboard(Mexico or
China)
PC assembly(Canada or
Taiwan)
Market(India)

Demand Aggregate products and customers
Production Cost Comparable costs across facilities
Transportation costs Time horizon

SOURCE
OUTPOSTOFFSHORE
LEADCONTRIBUT
OR
SERVER
SRATEGIC REASON FOR PLANT
STR
ATE
GIC
R
OLE
Access to low cost
resources
HIGH
LOWAccess to
skillsAccess to markets
STRETEGIC ROLE OF UNIT IN THE NETWORK

Offshore facility – labour, RM Server facility- market Outpost facility- Skills , knowledge Source: Serving global market Contributor- contributes to product and
process innovations Lead: leader in product and process
innovationsSource: Ferdow – HBR(1997)

Offshore –To gain access to low wages or other factors integral to low-cost production
Server- Serves specific national or regional markets
Outpost – To gain access to the knowledge or skills
Source: Ferdows (HBR 1997)

Source- Strategic Role Broader than offshore unit. Has a global responsibility for a part or a product
Contributor- Serves local market but also assumes responsibility for product customization , process improvements.
Lead- Ability and knowledge to create new products, processes, and technologies for the company
Source: Ferdows (HBR 1997)

Market coverage gets affected by location decision Retail outlets Impact of ownership structure
Emergency systems CTC at Bangalore ( Operation Sanjeevani)
Guaranteed delivery time After-market service
Public systems Equity issues


![RF Circuit Design - [Ch3-1] Microwave Network](https://img.pdfslide.tips/doc/110x75/55d03525bb61ebc6768b45ac/rf-circuit-design-ch3-1-microwave-network.jpg)