Embed Size (px)
Citation preview
8/6/2019 8. Sampa(1)
http://slidepdf.com/reader/full/8-sampa1 1/18
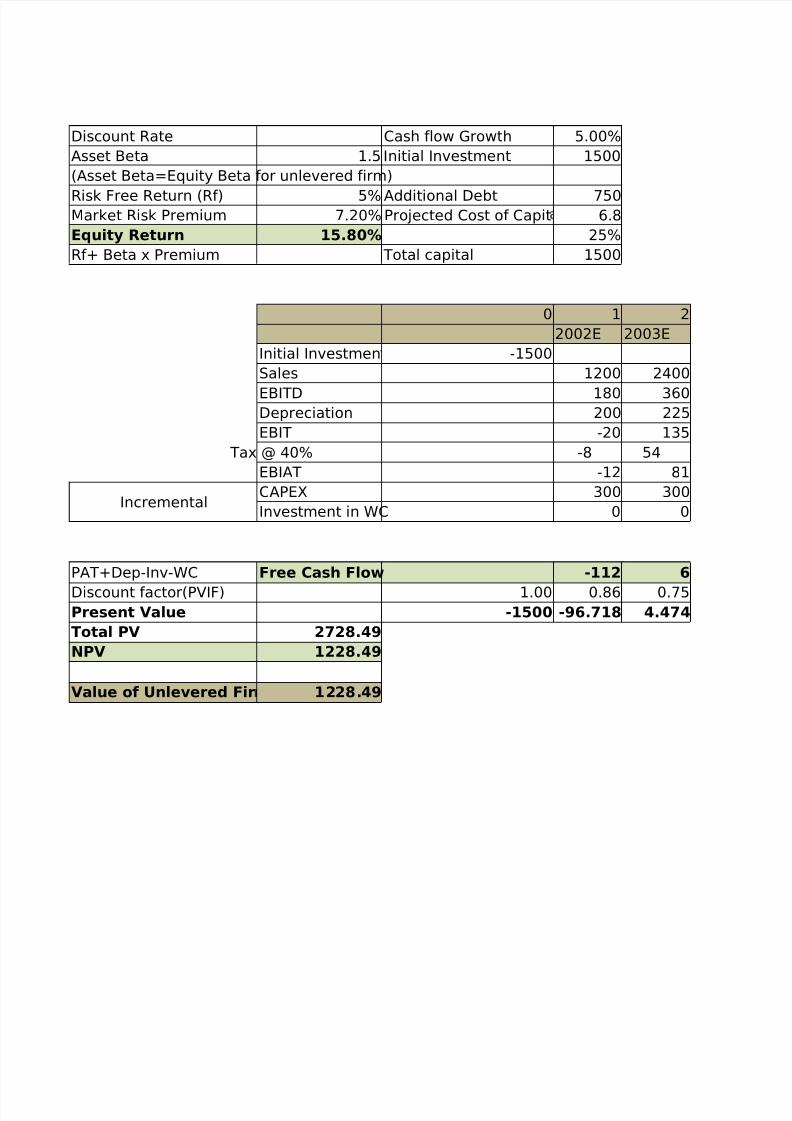
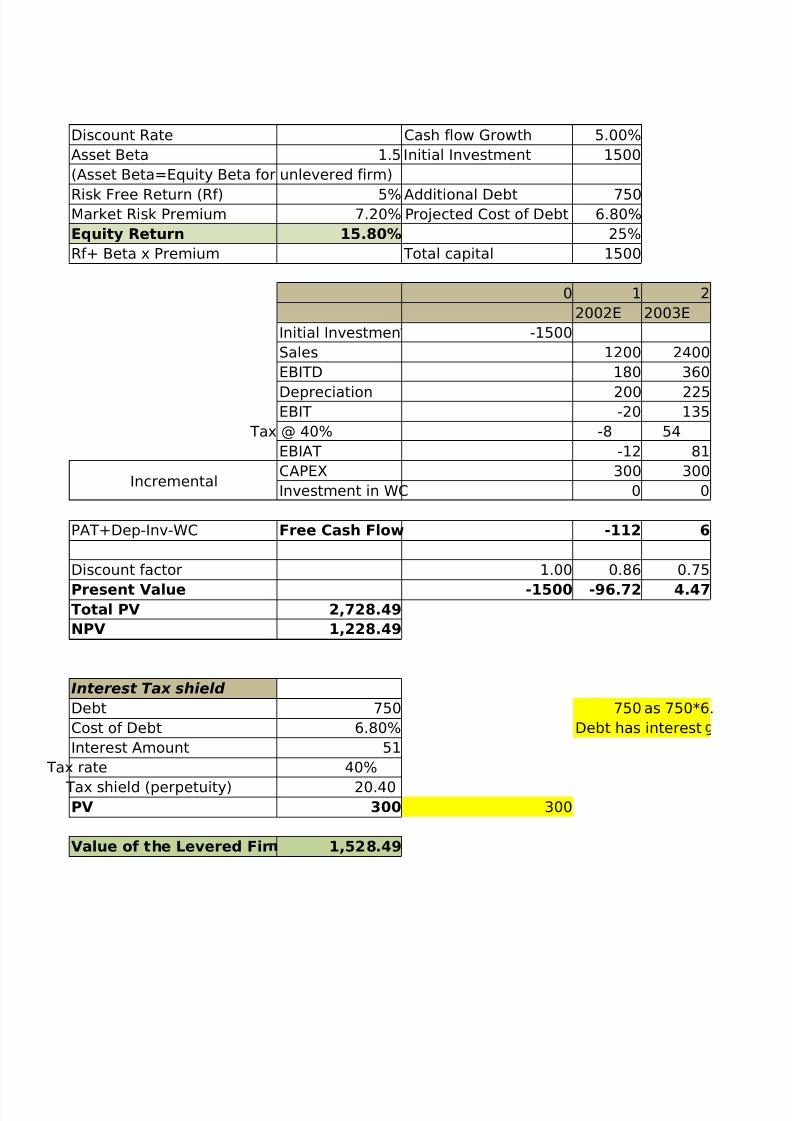
Discount Rate Cash flow Growth 5.00%Asset Beta 1.5 Initial Investment 1500(Asset Beta=Equity Beta for unlevered firm)
Risk Free Return (Rf) 5% Additional Debt 750Market Risk Premium 7.20% Projected Cost of Capit 6.8Equity Return 15.80% 25%Rf+ Beta x Premium Total capital 1500
0 1 22002E 2003E
Initial Investmen -1500Sales 1200 2400
EBITD 180 360Depreciation 200 225EBIT -20 135
Tax @ 40% -8 54EBIAT -12 81
IncrementalCAPEX 300 300Investment in WC 0 0
PAT+Dep-Inv-WC Free Cash Flow -112 6
Discount factor(PVIF) 1.00 0.86 0.75Present Value -1500 -96.718 4.474Total PV 2728.49NPV 1228.49
Value of Unlevered Fir 1228.49
8/6/2019 8. Sampa(1)
http://slidepdf.com/reader/full/8-sampa1 2/18
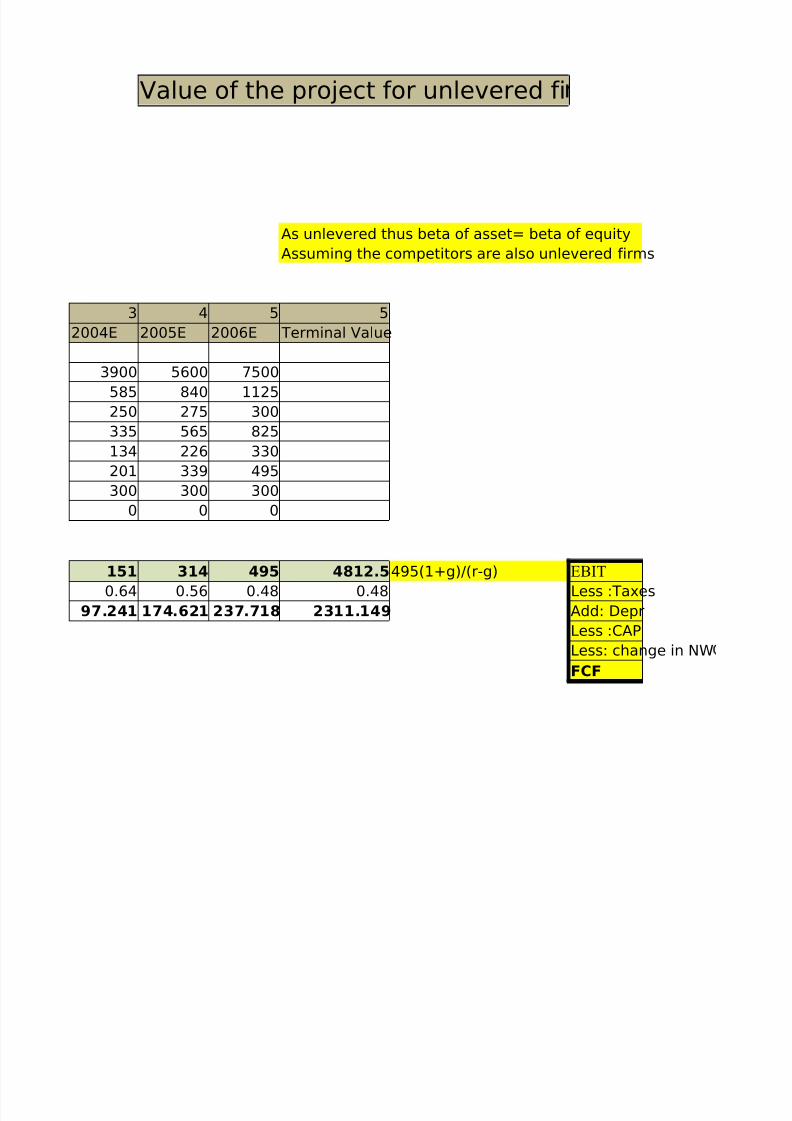
Value of the project for unlevered fi
As unlevered thus beta of asset= beta of equityAssuming the competitors are also unlevered firms
3 4 5 52004E 2005E 2006E Terminal Value
3900 5600 7500
585 840 1125250 275 300335 565 825134 226 330201 339 495300 300 300
0 0 0
151 314 495 4812.5 495(1+g)/(r-g) EBIT
0.64 0.56 0.48 0.48 Less :Taxes97.241 174.621 237.718 2311.149 Add: Depr
Less :CAPLess: change in NWFCF

8/6/2019 8. Sampa(1)
http://slidepdf.com/reader/full/8-sampa1 3/18
8/6/2019 8. Sampa(1)
http://slidepdf.com/reader/full/8-sampa1 4/18
Discount Rate Cash flow Growth 5.00%Asset Beta 1.5 Initial Investment 1500(Asset Beta=Equity Beta for unlevered firm)
Risk Free Return (Rf) 5% Additional Debt 750Market Risk Premium 7.20% Projected Cost of Debt 6.80%Equity Return 15.80% 25%Rf+ Beta x Premium Total capital 1500
0 1 22002E 2003E
Initial Investmen -1500Sales 1200 2400EBITD 180 360
Depreciation 200 225EBIT -20 135
Tax @ 40% -8 54EBIAT -12 81
IncrementalCAPEX 300 300Investment in WC 0 0
PAT+Dep-Inv-WC Free Cash Flow -112 6
Discount factor 1.00 0.86 0.75
Present Value -1500 -96.72 4.47Total PV 2,728.49NPV 1,228.49
Interest Tax shield
Debt 750 750 as 750*6.Cost of Debt 6.80% Debt has interestInterest Amount 51
Tax rate 40%
Tax shield (perpetuity) 20.40PV 300 300
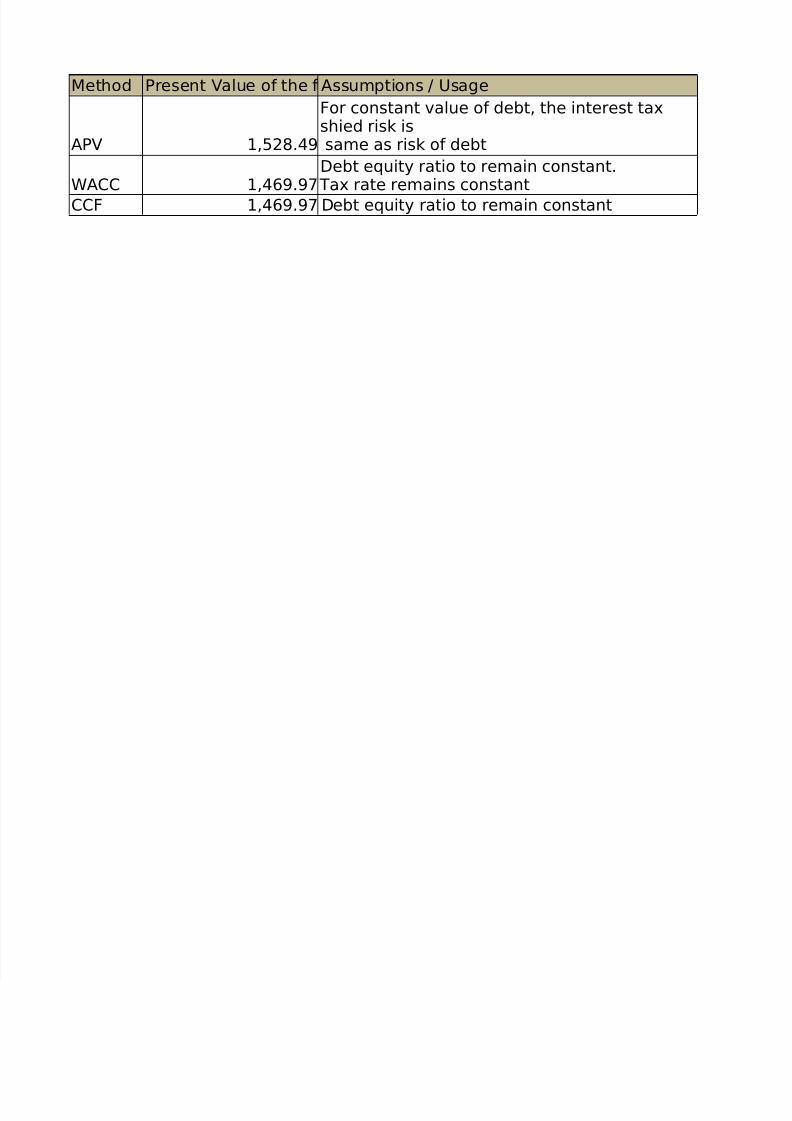
Value of the Levered Fir 1,528.49
8/6/2019 8. Sampa(1)
http://slidepdf.com/reader/full/8-sampa1 5/18
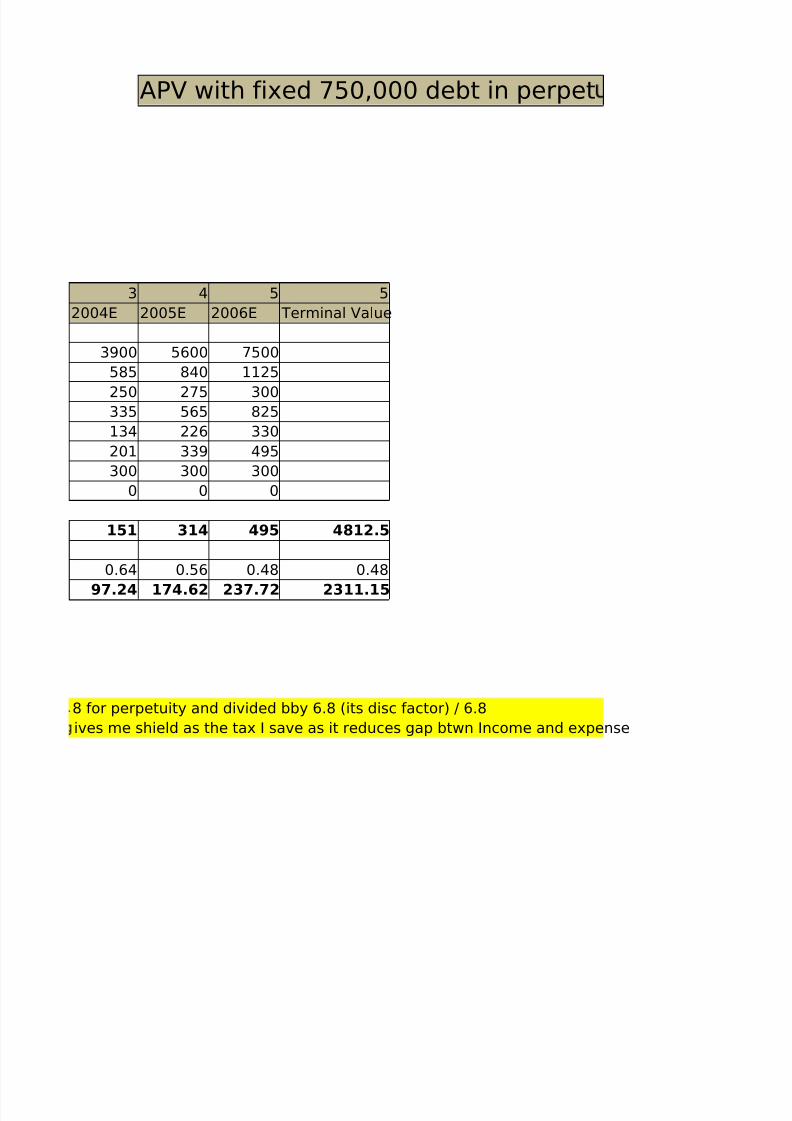
APV with fixed 750,000 debt in perpet
3 4 5 52004E 2005E 2006E Terminal Value
3900 5600 7500585 840 1125
250 275 300335 565 825134 226 330201 339 495300 300 300
0 0 0
151 314 495 4812.5
0.64 0.56 0.48 0.48
97.24 174.62 237.72 2311.15
8 for perpetuity and divided bby 6.8 (its disc factor) / 6.8ives me shield as the tax I save as it reduces gap btwn Income and expense
8/6/2019 8. Sampa(1)
http://slidepdf.com/reader/full/8-sampa1 6/18
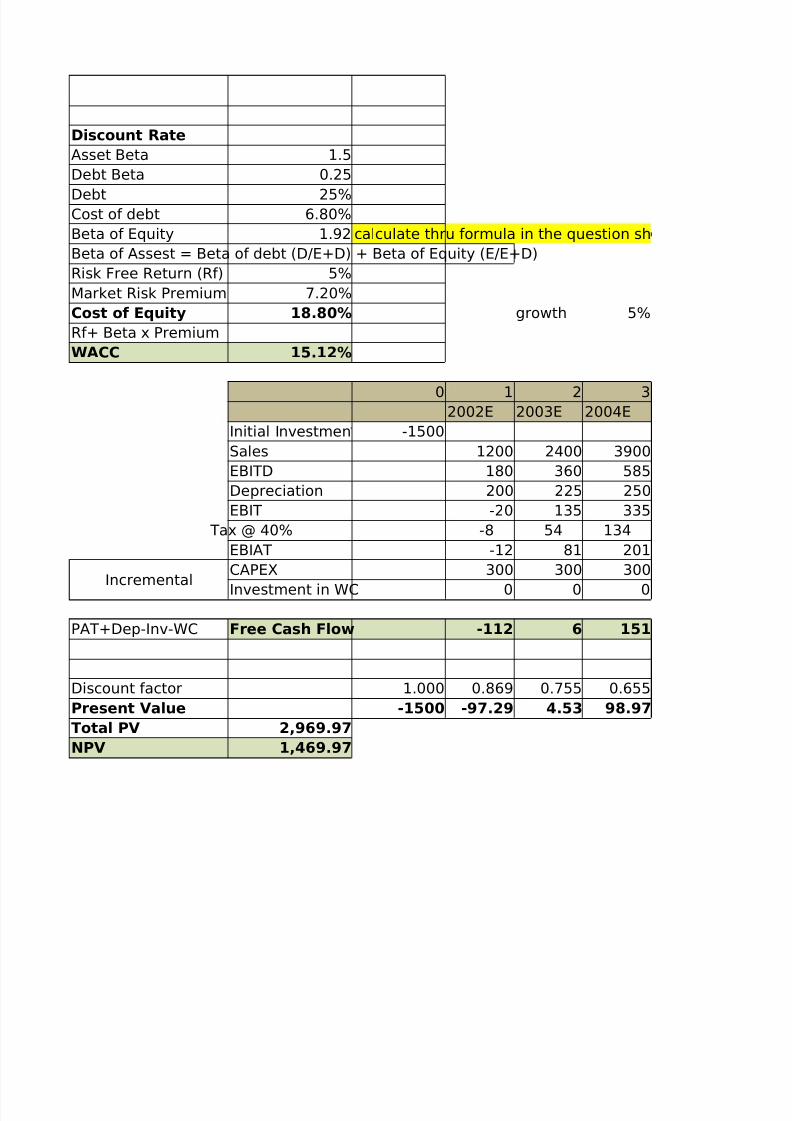
Discount RateAsset Beta 1.5Debt Beta 0.25
Debt 25%Cost of debt 6.80%Beta of Equity 1.92 calculate thru formula in the question shBeta of Assest = Beta of debt (D/E+D) + Beta of Equity (E/E+D)Risk Free Return (Rf) 5%Market Risk Premium 7.20%Cost of Equity 18.80% growth 5%Rf+ Beta x PremiumWACC 15.12%
0 1 2 32002E 2003E 2004E
Initial Investmen -1500Sales 1200 2400 3900EBITD 180 360 585Depreciation 200 225 250EBIT -20 135 335
Tax @ 40% -8 54 134EBIAT -12 81 201
IncrementalCAPEX 300 300 300
Investment in WC 0 0 0
PAT+Dep-Inv-WC Free Cash Flow -112 6 151
Discount factor 1.000 0.869 0.755 0.655Present Value -1500 -97.29 4.53 98.97Total PV 2,969.97NPV 1,469.97
8/6/2019 8. Sampa(1)
http://slidepdf.com/reader/full/8-sampa1 7/18
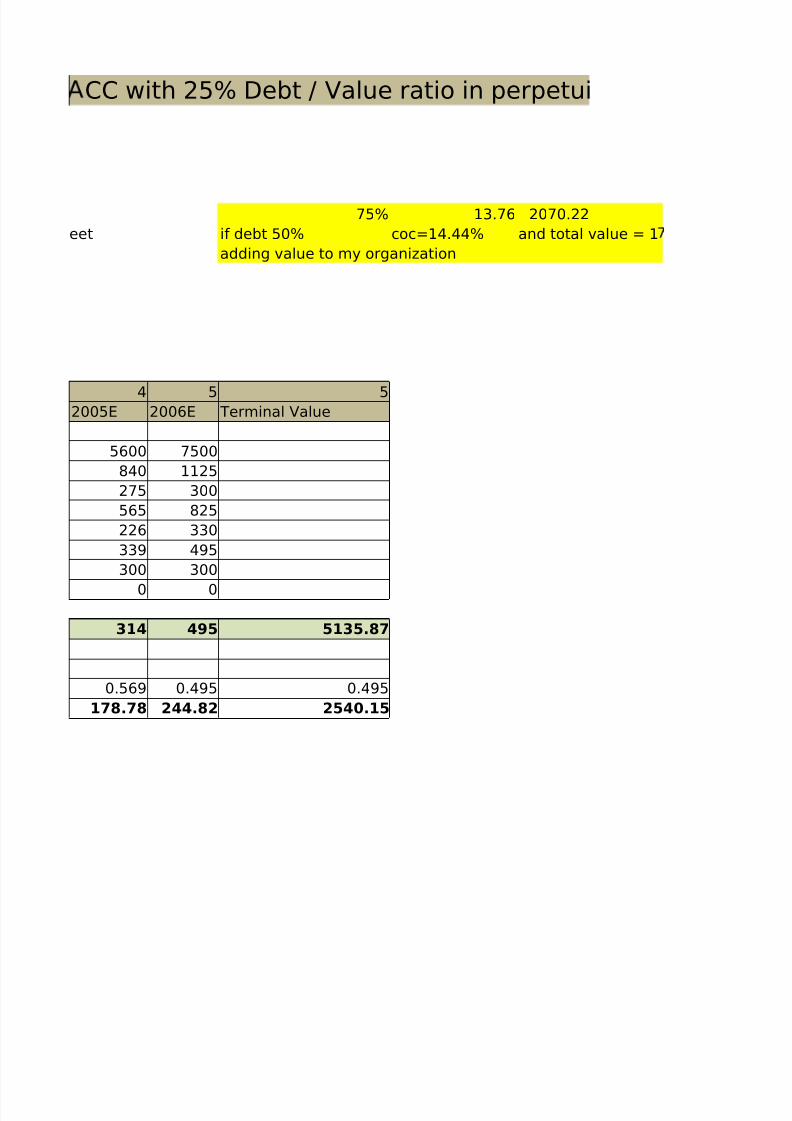
CC with 25% Debt / Value ratio in perpetui
75% 13.76 2070.22eet if debt 50% coc=14.44% and total value = 1
adding value to my organization
4 5 52005E 2006E Terminal Value
5600 7500840 1125275 300565 825226 330339 495300 300
0 0
314 495 5135.87
0.569 0.495 0.495178.78 244.82 2540.15

8/6/2019 8. Sampa(1)
http://slidepdf.com/reader/full/8-sampa1 8/18
47.72
8/6/2019 8. Sampa(1)
http://slidepdf.com/reader/full/8-sampa1 9/18
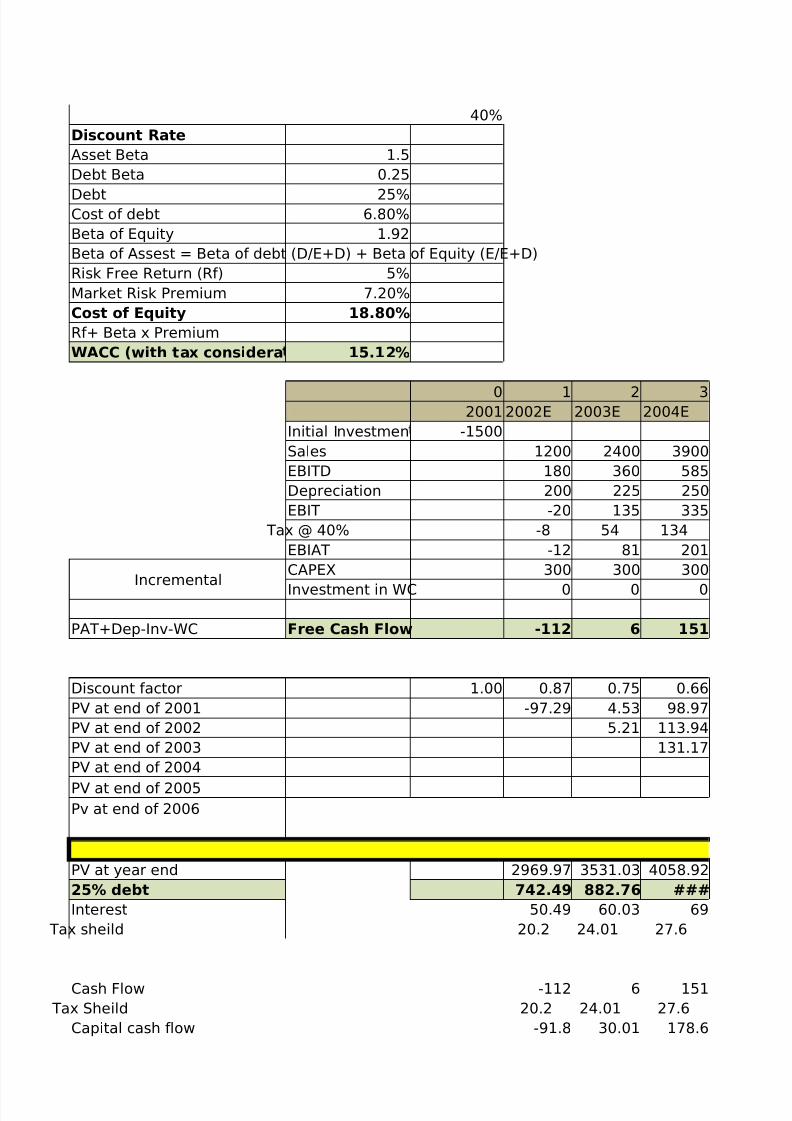
40%Discount RateAsset Beta 1.5Debt Beta 0.25
Debt 25%Cost of debt 6.80%Beta of Equity 1.92Beta of Assest = Beta of debt (D/E+D) + Beta of Equity (E/E+D)Risk Free Return (Rf) 5%Market Risk Premium 7.20%Cost of Equity 18.80%Rf+ Beta x PremiumWACC (with tax considera 15.12%
0 1 2 32001 2002E 2003E 2004E
Initial Investmen -1500Sales 1200 2400 3900EBITD 180 360 585Depreciation 200 225 250EBIT -20 135 335
Tax @ 40% -8 54 134EBIAT -12 81 201
IncrementalCAPEX 300 300 300
Investment in WC 0 0 0
PAT+Dep-Inv-WC Free Cash Flow -112 6 151
Discount factor 1.00 0.87 0.75 0.66PV at end of 2001 -97.29 4.53 98.97PV at end of 2002 5.21 113.94PV at end of 2003 131.17PV at end of 2004
PV at end of 2005Pv at end of 2006
PV at year end 2969.97 3531.03 4058.9225% debt 742.49 882.76 ###Interest 50.49 60.03 69
Tax sheild 20.2 24.01 27.6
Cash Flow -112 6 151 Tax Sheild 20.2 24.01 27.6Capital cash flow -91.8 30.01 178.6

8/6/2019 8. Sampa(1)
http://slidepdf.com/reader/full/8-sampa1 10/18
PVIF 1 0.8636 0.7457 0.6440PVIF 2969.97 -79.28 22.38 115.02NPV 1469.97
8/6/2019 8. Sampa(1)
http://slidepdf.com/reader/full/8-sampa1 11/18
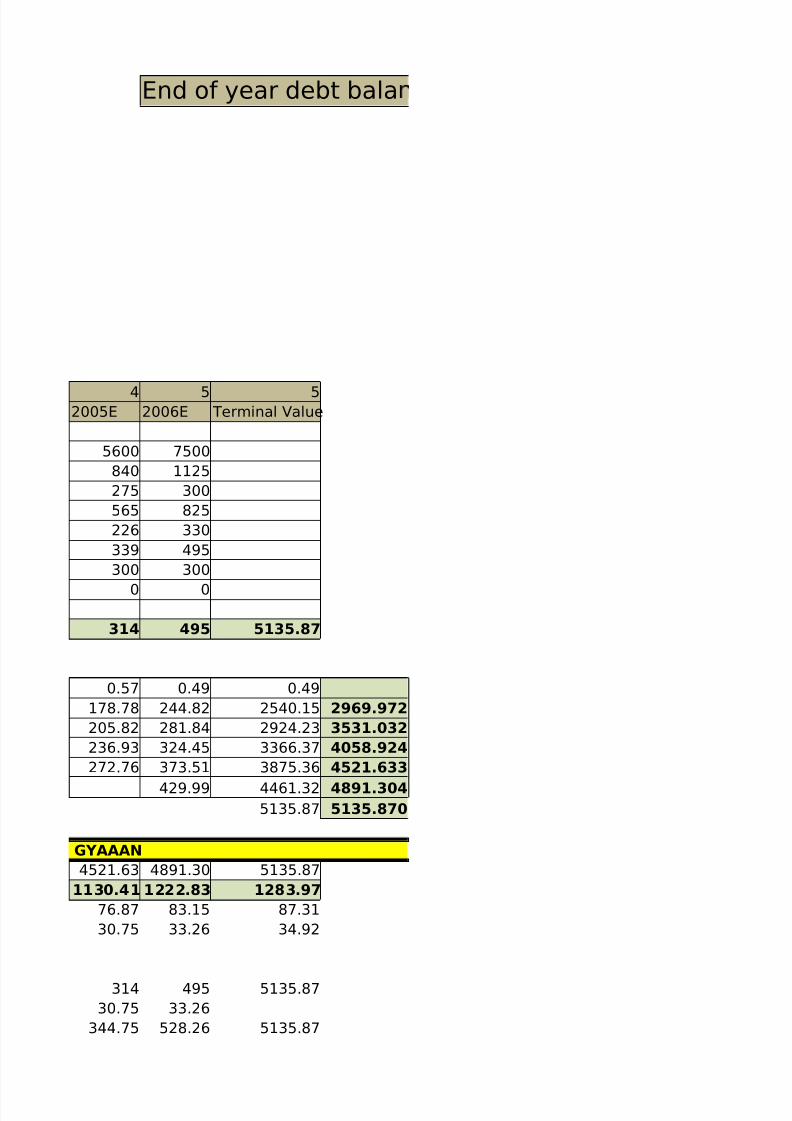
End of year debt bala
4 5 52005E 2006E Terminal Value
5600 7500840 1125275 300565 825226 330339 495300 300
0 0
314 495 5135.87
0.57 0.49 0.49178.78 244.82 2540.15 2969.972205.82 281.84 2924.23 3531.032236.93 324.45 3366.37 4058.924272.76 373.51 3875.36 4521.633
429.99 4461.32 4891.3045135.87 5135.870
GYAAAN4521.63 4891.30 5135.87
1130.41 1222.83 1283.9776.87 83.15 87.3130.75 33.26 34.92
314 495 5135.8730.75 33.26
344.75 528.26 5135.87

8/6/2019 8. Sampa(1)
http://slidepdf.com/reader/full/8-sampa1 12/18
0.5561 0.4802 0.4802191.72 253.69 2466.44

8/6/2019 8. Sampa(1)
http://slidepdf.com/reader/full/8-sampa1 13/18
ces with 25% Debt to value rati
ans ends here

8/6/2019 8. Sampa(1)
http://slidepdf.com/reader/full/8-sampa1 14/18
rate is unlevered 15.8%
8/6/2019 8. Sampa(1)
http://slidepdf.com/reader/full/8-sampa1 15/18
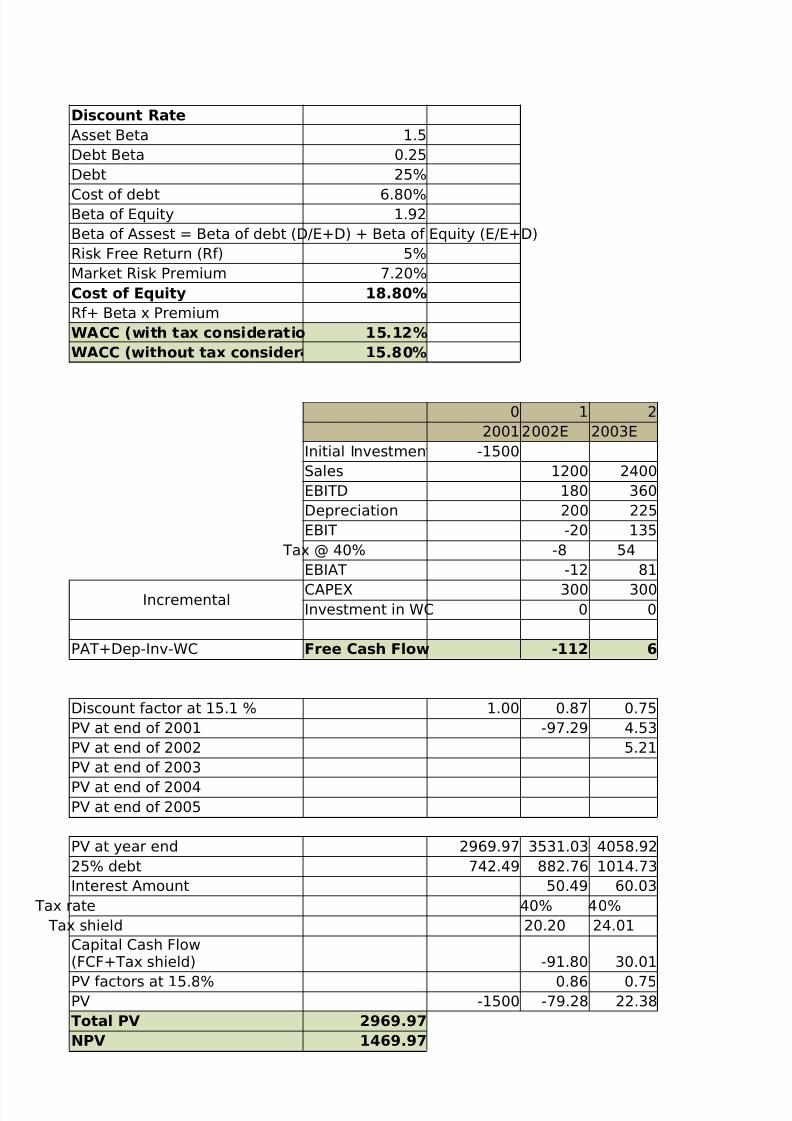
Discount RateAsset Beta 1.5Debt Beta 0.25Debt 25%
Cost of debt 6.80%Beta of Equity 1.92Beta of Assest = Beta of debt (D/E+D) + Beta of Equity (E/E+D)Risk Free Return (Rf) 5%Market Risk Premium 7.20%Cost of Equity 18.80%Rf+ Beta x PremiumWACC (with tax consideratio 15.12%WACC (without tax consider 15.80%
0 1 22001 2002E 2003E
Initial Investmen -1500Sales 1200 2400EBITD 180 360Depreciation 200 225EBIT -20 135
Tax @ 40% -8 54EBIAT -12 81
Incremental CAPEX 300 300Investment in WC 0 0
PAT+Dep-Inv-WC Free Cash Flow -112 6
Discount factor at 15.1 % 1.00 0.87 0.75PV at end of 2001 -97.29 4.53PV at end of 2002 5.21PV at end of 2003
PV at end of 2004PV at end of 2005
PV at year end 2969.97 3531.03 4058.9225% debt 742.49 882.76 1014.73Interest Amount 50.49 60.03
Tax rate 40% 40% Tax shield 20.20 24.01
-91.80 30.01
PV factors at 15.8% 0.86 0.75PV -1500 -79.28 22.38Total PV 2969.97NPV 1469.97
Capital Cash Flow(FCF+Tax shield)
8/6/2019 8. Sampa(1)
http://slidepdf.com/reader/full/8-sampa1 16/18
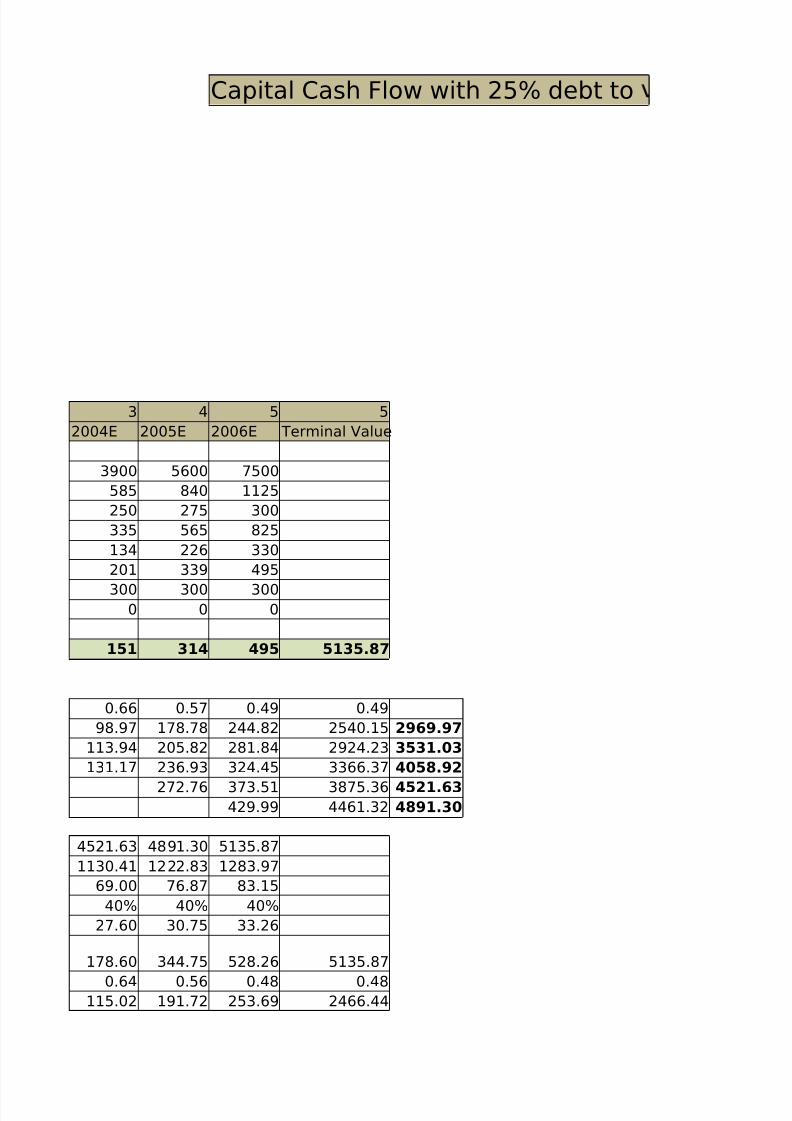
Capital Cash Flow with 25% debt to
3 4 5 52004E 2005E 2006E Terminal Value
3900 5600 7500585 840 1125250 275 300335 565 825134 226 330201 339 495
300 300 3000 0 0
151 314 495 5135.87
0.66 0.57 0.49 0.4998.97 178.78 244.82 2540.15 2969.97
113.94 205.82 281.84 2924.23 3531.03131.17 236.93 324.45 3366.37 4058.92
272.76 373.51 3875.36 4521.63429.99 4461.32 4891.30
4521.63 4891.30 5135.871130.41 1222.83 1283.97
69.00 76.87 83.1540% 40% 40%
27.60 30.75 33.26
178.60 344.75 528.26 5135.87
0.64 0.56 0.48 0.48115.02 191.72 253.69 2466.44

8/6/2019 8. Sampa(1)
http://slidepdf.com/reader/full/8-sampa1 17/18
8/6/2019 8. Sampa(1)
http://slidepdf.com/reader/full/8-sampa1 18/18