Embed Size (px)
Citation preview
83
BAB 5
SIMPULAN
5.1. Simpulan
Berdasarkan data penelitian yang telah diinterpretasikan, dapat
ditarik kesimpulan :
- Pembuatan tablet lepas lambat klorfeniramin maleat dengan teknik
likuisolid menggunakan polimer hidrofilik Xanthan Gum – Locust Bean
Gum dan tween 80 sebagai pelarut non volatile dapat menurunkan laju
disolusi klorfeniramin maleat.
- Jumlah tween 80 dan konsentrasi Xanthan Gum – Locust Bean Gum
berpengaruh signifikan terhadap kekerasan tablet, namun tidak
berpengaruh signifikan terhadap Hausner Ratio, Carr’s Index,
kerapuhan tablet dan konstanta laju disolusi.
- Formula optimum tablet klorfeniramin maleat dapat diperoleh dengan
jumlah pelarut non volatile Tween 80 sejumlah 27,68 mg dan
konsentrasi polimer Xanthan Gum – Locust Bean Gum sejumlah 11%
dan perbandingan masing-masing 50:50. Pemilihan formula optimum
tersebut akan memberikan prediksi hasil respon Hausner Ratio 1,23;
Carr’s Index 19,0572%; kekerasan tablet 11,3884 Kp; kerapuhan tablet
0,12312%; dan konstanta laju disolusi 0,01001 mg/menit.
5.2. Alur Penelitian Selanjutnya
Dapat dilakukan penelitian lebih lanjut mengenai tablet lepas lambat
likuisolid dengan mencari dan membuktikan formula optimum terpilih,
kemudian dibandingkan dengan hasil yang secara teoritis.
84
DAFTAR PUSTAKA
Anonim, 1979,Farmakope Indonesia, ed. III, DepartemenKesehatan RI, Jakarta, 6-8, 153-154, 504.
Anonim, 1995, Farmakope Indonesia, ed. IV, DepartemenKesehatan RI, Jakarta, 4, 999-1000.
Anonim,2012. http://en.wikipedia.org/wiki/Xanthan_gum.
Anonim,2012. http://en.wikipedia.org/wiki/Chlorpheniramine_maleate.
Anonim,2012. http://en.wikipedia.org/wiki/Locust_bean_gum.
Ansel, H. C., 1989, Introduction to Pharmaceutical Dosage Form, 4th edition, Lea &Febiger, Philadelpia, 259-272.
Aulton, M.E., 2002, Pharmaceutics The Science of Dosage Form Design, 2th edition, Churchill Livingstone, pp. 299-302.
Banakar, U.V., 1992, Pharmaceutical Disolution Testing, Marcel Dekker, Inc., New York, 322.
Banker, G.S. and N.R. Anderson, 1986, Tablet, in: The Theory and Practice of Industrial Pharmacy: Tablet, L. Lachman, H.A. Lieberman, and J.L. Kanig (Eds.), 3rd ed., Lea and Febiger, Philadelphia, 259, 295, 299, 316 – 329.
Bolton, S., 1990.Pharmaceutical Statistics Practical and Clinical Applications.2ndEdition, Marcel Dekker, Inc., New York, 324 – 327.
Cartensen, J.T. and C.C. Ping, 1977, Flow Rate and Repose Angles of WetProcessed Granulation, Journal of Pharmaceutical Sciences, 66,1235 – 1238. Collet, J. and C. Moreton, 2002, Modified-release peroral dosage form.Pharmaceutical The Science of Dosage form design, 2nd edition, De Montfort University, Leicester, 299-302.
85
Costa, P. and Sousa Lobo, J.M., 2000, Modelling and Comparison of Dissolution Profiles, Journal of Pharmaceutical Science, European, 123-133.
Fonner, D.T., T.W. Rosanske, R.E. Gordon, G.S. Banker, and N.R. Anderson, 1990, Granulation and Tablet Characteristic, In: Pharmaceutical Dosage Form, L. Lachman, H.A. Lieberman, and J.B. Schwartz (Eds.), vol. 2, 2nd ed., Marcel Dekker Inc., New York, 248-338.
Green, J.M., 1996, A Practical Guide to Analytical Method Validition, Analytical Chemistry, 68, 305-309.
Hadisoewignyo, L., 2005, Studi Pelepasan In Vitro Ibuprofen dari Sistem Matriks Kombinasi Xanthan gum – Locust bean gum dan Xanthan gum – Kalium sulfat Dalam Bentuk Tablet, Tesis, Universitas Gadjah Mada, Yogyakarta, 27-33.
Hentzschel, C.M., 2011, Optimization of the Liquisolid Technology – Identification of Highly Effective Tableting Excipients for Liquid Adsorption, University of Hamburg, 4-5, 18.
Javadzadeh, Y., M.R. Siahi, M.B. Jalali,and A. Nokhodchi, 2005, Enhancement of Dissolution Rate of Piroxicam Using Liquisolid Compacts, International Journal of Pharmaceutics, FarmacoSocietaChimiaItaliana, 60, 361-365.
Javadzadech,Y., Musaalrezaei, L., and A. Nokhodchi, 2008, Liquisolid Technique as a New Aproach to Sustain Propanolol Hydrochloride Release from Tablet Matrices , International Journal of Pharmaceutics, 102-108.
Kang, K. S. And D.J. Pettitt, 1993, Xanthan Gum. In: industrial Gums: Polysaccharides and Their Derivativer, R. L. Whistler, J. N. Bemiller (Eds.), 3rd ed., Academic Press, Inc., Sand Diego, 341-371.
Karmarkar, A.B., I.D.Gonjari, A.H. Hosmani, P.N. Dhabale, and S.B.Bhise, 2009, Liquisolid Tablets: A Novel Approach for Drug Delivery, International Journal of Health Research, 2(1), 45-50.
Khan, K.A., 1975,The Concept of Dissolution Efficiency, J. Pharmac, 27, 48-49.
86
Kibbe, A.H., 2000, Handbook of Pharmaceutical Excipients, 3rd Ed. The Pharmaceutical Press, London, 103-106, 143-145, 305-307, 416-419, 433-439, 501-504.
Lachman L., Lieberman H.A., Kauig J.L (Eds.), Teori&PraktekFarmasiIndustri II, (Suyatmi S, penerjemah), edisi 3, PenerbitUniversitas Indonesia, Jakarta, 643-731.
Maier, H., M. Anderson, C. Karl, and K. Majauson, 1993, Guar, locust bean, tara and fenugreek gums In: Industrial Gums : Polysaccharides and Their Derivaties, R. L. Whistler, and J. N. Bemiller (Eds.), 3rd ed., Academic Press, Inc., San Diego, 145-175.
Martin, A., J. Swarbrick, dan A. Cammarata, 1993, FarmasiFisik: Dasar-dasar Kimia FisikadalamIlmuFarmasetik, vol. 2, ed. 3, terjemahanYoshita, Universitas Indonesia, Jakarta, 1135.
Miller R.H., 1966, Husa’s Pharmaceutical Dispending, MackPublishingCompany, EastonPensylvania, 104-106.
Parrot, E.L., 1971, Pharmaceutical Technology Fundamental Pharmaceutics, 3rd ed., Burgess Publishing Company, Minneapolis, 17-19, 82.
Shargel, L. and A. B. C. Yu, 1999, Applied Biopharmaceutics and Pharmacokinetics, 4th ed. McGraw – Hill. New York, 8, 132, 169-200.
Siregar, Ch. J. P., 1992, Proses ValidasidanManufakturSediaan Tablet, In : Asyarie S., U. Mar’u, and S. Badruzzaman (Eds), Prosiding Seminar Validasi di IndustriFarmasi, JurusanFarmasi FMIPA ITB, Bandung, 26 – 41.
Spireas, S., 2002, Liquisolid System and Methods of Preparation Same, Pharmaceutical Research, vol 9, 1-6.
Siswandono, Soekarjo, B., 2008, Kimia Medisinal, Airlangga, edisi 2, University Press, Surabaya, 186-193.
87
Venkataraju, M. P., D. V. Gowda, K.S. Rajesh, and H. G. Shivakumar, 2007, Xanthan and Locust Bean Gum (from Ceratonia siliqua) Matrix Tablets For Oral Controlled Delivery of Propanolol Hydrochloride, Asian Journal of Pharmaceutical Sciences., 2(6), 239-248.
Voigt, R., 1995, BukuPelajaranTeknologiFarmasi.Terjemahan S. Noeronodan M. S. Reksohardiprojo, GadjahMada University Press, Yogyakarta, 163-210.
Wells, J.T., 1988, Pharmaceutical Formulation: The Physicochemical Properties of Drug Substance, Ellis Howard, Ltd., Chester, 209-211.
Yadav, V.B. and A.V. Yadav, 2009, Liquisolid Granulation Technique for Tablet Manufacturing: an Overview, Journal of Pharmacy Research 2009, 2(4), 670-674.
Zainuddin M., 2000, Validasi Metode Analisis Kuantitatif Secara Spektrofotometris Ultra Ungu – Sinar Tampak (UV-VIS), Universitas Airlangga, Surabaya.
Zhang, Y., Y. Law, and S. Chakrabarti, 2003, Physical Properties and Compact Analysis of Commonly Used Direct Compression Binders, AAPS PharmSciTech, 4(4), article 62.
88
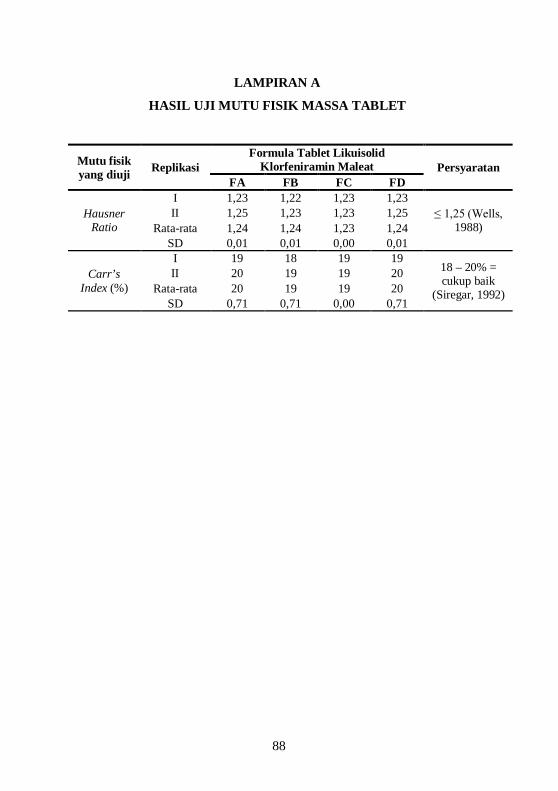
LAMPIRAN A
HASIL UJI MUTU FISIK MASSA TABLET
Mutu fisik yang diuji Replikasi
Formula Tablet Likuisolid Klorfeniramin Maleat Persyaratan
FA FB FC FD
Hausner Ratio
I 1,23 1,22 1,23 1,23 ≤ 1,25 (Wells,
1988) II 1,25 1,23 1,23 1,25
Rata-rata 1,24 1,24 1,23 1,24 SD 0,01 0,01 0,00 0,01
Carr’s Index (%)
I 19 18 19 19 18 – 20% = cukup baik
(Siregar, 1992)
II 20 19 19 20 Rata-rata 20 19 19 20
SD 0,71 0,71 0,00 0,71
89
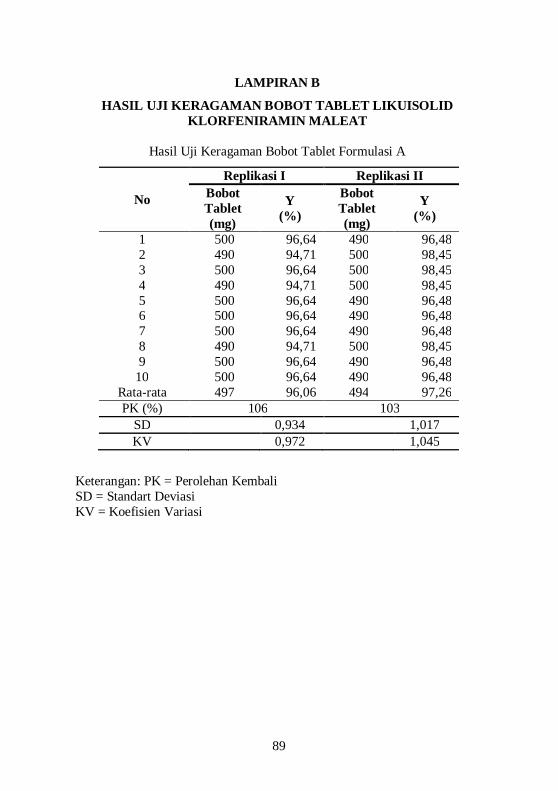
LAMPIRAN B
HASIL UJI KERAGAMAN BOBOT TABLET LIKUISOLID KLORFENIRAMIN MALEAT
Hasil Uji Keragaman Bobot Tablet Formulasi A
No
Replikasi I Replikasi II Bobot Tablet (mg)
Y (%)
Bobot Tablet (mg)
Y (%)
1 500 96,64 490 96,48 2 490 94,71 500 98,45 3 500 96,64 500 98,45 4 490 94,71 500 98,45 5 500 96,64 490 96,48 6 500 96,64 490 96,48 7 500 96,64 490 96,48 8 490 94,71 500 98,45 9 500 96,64 490 96,48
10 500 96,64 490 96,48 Rata-rata 497 96,06 494 97,26 PK (%) 106 103
SD 0,934 1,017 KV 0,972 1,045
Keterangan: PK = Perolehan Kembali SD = Standart Deviasi KV = Koefisien Variasi
90
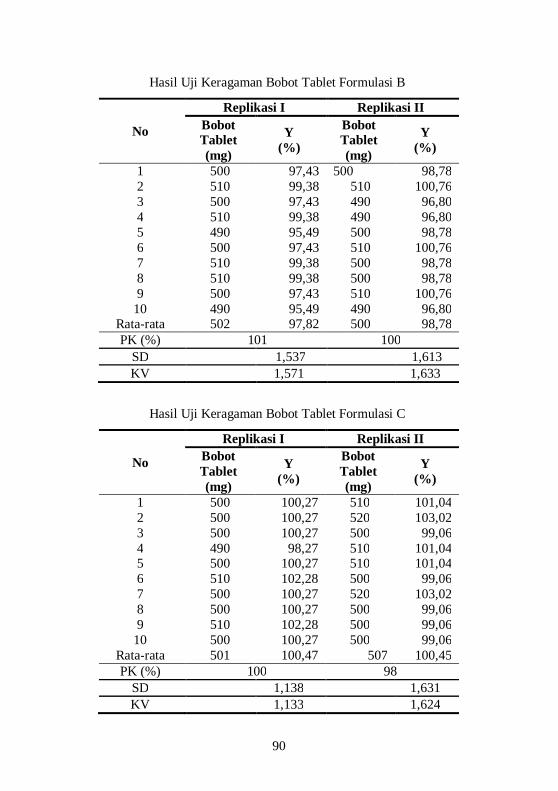
Hasil Uji Keragaman Bobot Tablet Formulasi B
No
Replikasi I Replikasi II Bobot Tablet (mg)
Y (%)
Bobot Tablet (mg)
Y (%)
1 500 97,43 500 98,78 2 510 99,38 510 100,76 3 500 97,43 490 96,80 4 510 99,38 490 96,80 5 490 95,49 500 98,78 6 500 97,43 510 100,76 7 510 99,38 500 98,78 8 510 99,38 500 98,78 9 500 97,43 510 100,76
10 490 95,49 490 96,80 Rata-rata 502 97,82 500 98,78 PK (%) 101 100
SD 1,537 1,613 KV 1,571 1,633
Hasil Uji Keragaman Bobot Tablet Formulasi C
No
Replikasi I Replikasi II Bobot Tablet (mg)
Y (%)
Bobot Tablet (mg)
Y (%)
1 500 100,27 510 101,04 2 500 100,27 520 103,02 3 500 100,27 500 99,06 4 490 98,27 510 101,04 5 500 100,27 510 101,04 6 510 102,28 500 99,06 7 500 100,27 520 103,02 8 500 100,27 500 99,06 9 510 102,28 500 99,06
10 500 100,27 500 99,06 Rata-rata 501 100,47 507 100,45 PK (%) 100 98
SD 1,138 1,631 KV 1,133 1,624
91
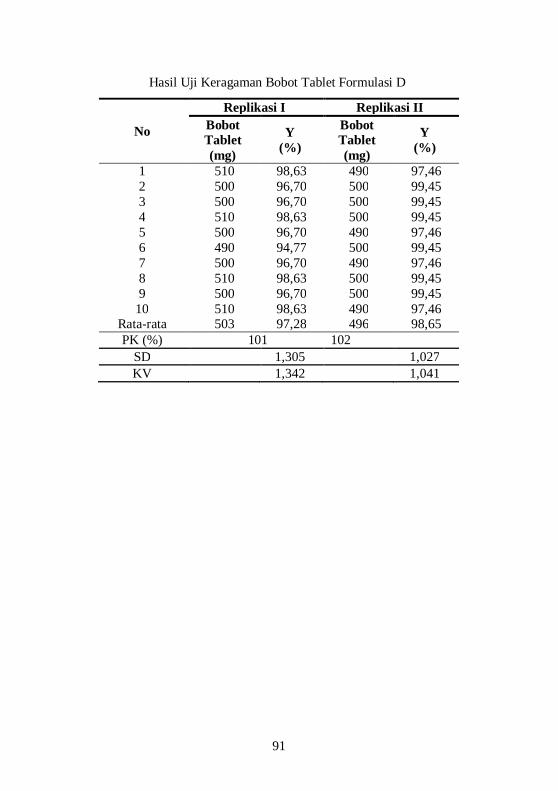
Hasil Uji Keragaman Bobot Tablet Formulasi D
No
Replikasi I Replikasi II Bobot Tablet (mg)
Y (%)
Bobot Tablet (mg)
Y (%)
1 510 98,63 490 97,46 2 500 96,70 500 99,45 3 500 96,70 500 99,45 4 510 98,63 500 99,45 5 500 96,70 490 97,46 6 490 94,77 500 99,45 7 500 96,70 490 97,46 8 510 98,63 500 99,45 9 500 96,70 500 99,45
10 510 98,63 490 97,46 Rata-rata 503 97,28 496 98,65 PK (%) 101 102
SD 1,305 1,027 KV 1,342 1,041
92
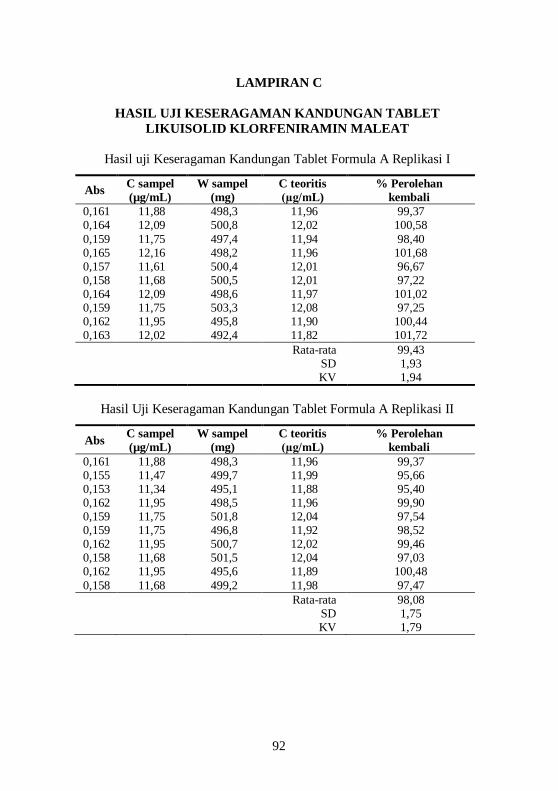
LAMPIRAN C
HASIL UJI KESERAGAMAN KANDUNGAN TABLET LIKUISOLID KLORFENIRAMIN MALEAT
Hasil uji Keseragaman Kandungan Tablet Formula A Replikasi I
Abs C sampel (µg/mL)
W sampel (mg)
C teoritis (µg/mL)
% Perolehan kembali
0,161 11,88 498,3 11,96 99,37 0,164 12,09 500,8 12,02 100,58 0,159 11,75 497,4 11,94 98,40 0,165 12,16 498,2 11,96 101,68 0,157 11,61 500,4 12,01 96,67 0,158 11,68 500,5 12,01 97,22 0,164 12,09 498,6 11,97 101,02 0,159 11,75 503,3 12,08 97,25 0,162 11,95 495,8 11,90 100,44 0,163 12,02 492,4 11,82 101,72
Rata-rata 99,43 SD 1,93 KV 1,94
Hasil Uji Keseragaman Kandungan Tablet Formula A Replikasi II
Abs C sampel (µg/mL)
W sampel (mg)
C teoritis (µg/mL)
% Perolehan kembali
0,161 11,88 498,3 11,96 99,37 0,155 11,47 499,7 11,99 95,66 0,153 11,34 495,1 11,88 95,40 0,162 11,95 498,5 11,96 99,90 0,159 11,75 501,8 12,04 97,54 0,159 11,75 496,8 11,92 98,52 0,162 11,95 500,7 12,02 99,46 0,158 11,68 501,5 12,04 97,03 0,162 11,95 495,6 11,89 100,48 0,158 11,68 499,2 11,98 97,47
Rata-rata 98,08 SD 1,75 KV 1,79
93
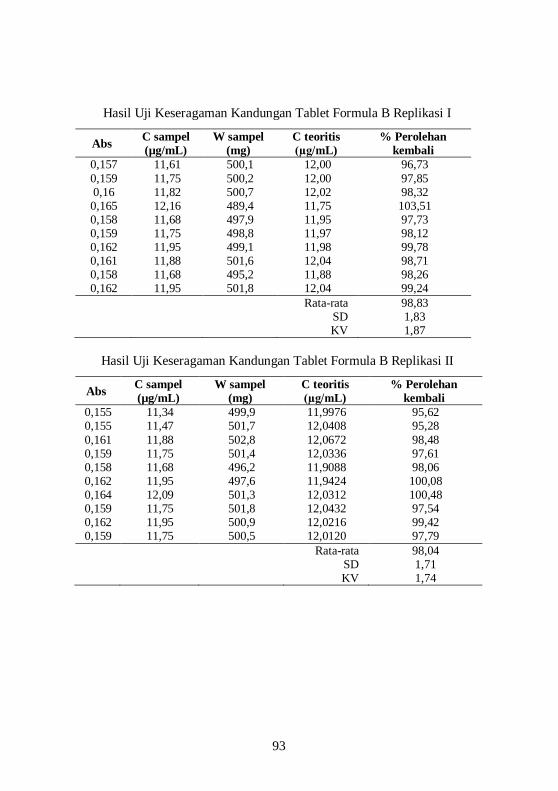
Hasil Uji Keseragaman Kandungan Tablet Formula B Replikasi I
Abs C sampel (µg/mL)
W sampel (mg)
C teoritis (µg/mL)
% Perolehan kembali
0,157 11,61 500,1 12,00 96,73 0,159 11,75 500,2 12,00 97,85 0,16 11,82 500,7 12,02 98,32 0,165 12,16 489,4 11,75 103,51 0,158 11,68 497,9 11,95 97,73 0,159 11,75 498,8 11,97 98,12 0,162 11,95 499,1 11,98 99,78 0,161 11,88 501,6 12,04 98,71 0,158 11,68 495,2 11,88 98,26 0,162 11,95 501,8 12,04 99,24
Rata-rata 98,83 SD 1,83 KV 1,87
Hasil Uji Keseragaman Kandungan Tablet Formula B Replikasi II
Abs C sampel (µg/mL)
W sampel (mg)
C teoritis (µg/mL)
% Perolehan kembali
0,155 11,34 499,9 11,9976 95,62 0,155 11,47 501,7 12,0408 95,28 0,161 11,88 502,8 12,0672 98,48 0,159 11,75 501,4 12,0336 97,61 0,158 11,68 496,2 11,9088 98,06 0,162 11,95 497,6 11,9424 100,08 0,164 12,09 501,3 12,0312 100,48 0,159 11,75 501,8 12,0432 97,54 0,162 11,95 500,9 12,0216 99,42 0,159 11,75 500,5 12,0120 97,79
Rata-rata 98,04 SD 1,71 KV 1,74
94
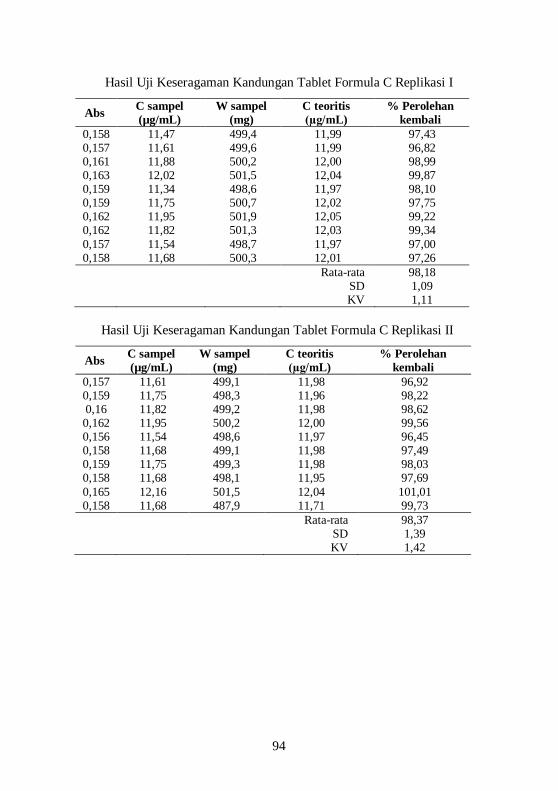
Hasil Uji Keseragaman Kandungan Tablet Formula C Replikasi I
Abs C sampel (µg/mL)
W sampel (mg)
C teoritis (µg/mL)
% Perolehan kembali
0,158 11,47 499,4 11,99 97,43 0,157 11,61 499,6 11,99 96,82 0,161 11,88 500,2 12,00 98,99 0,163 12,02 501,5 12,04 99,87 0,159 11,34 498,6 11,97 98,10 0,159 11,75 500,7 12,02 97,75 0,162 11,95 501,9 12,05 99,22 0,162 11,82 501,3 12,03 99,34 0,157 11,54 498,7 11,97 97,00 0,158 11,68 500,3 12,01 97,26
Rata-rata 98,18 SD 1,09 KV 1,11
Hasil Uji Keseragaman Kandungan Tablet Formula C Replikasi II
Abs C sampel (µg/mL)
W sampel (mg)
C teoritis (µg/mL)
% Perolehan kembali
0,157 11,61 499,1 11,98 96,92 0,159 11,75 498,3 11,96 98,22 0,16 11,82 499,2 11,98 98,62 0,162 11,95 500,2 12,00 99,56 0,156 11,54 498,6 11,97 96,45 0,158 11,68 499,1 11,98 97,49 0,159 11,75 499,3 11,98 98,03 0,158 11,68 498,1 11,95 97,69 0,165 12,16 501,5 12,04 101,01 0,158 11,68 487,9 11,71 99,73
Rata-rata 98,37 SD 1,39 KV 1,42
95
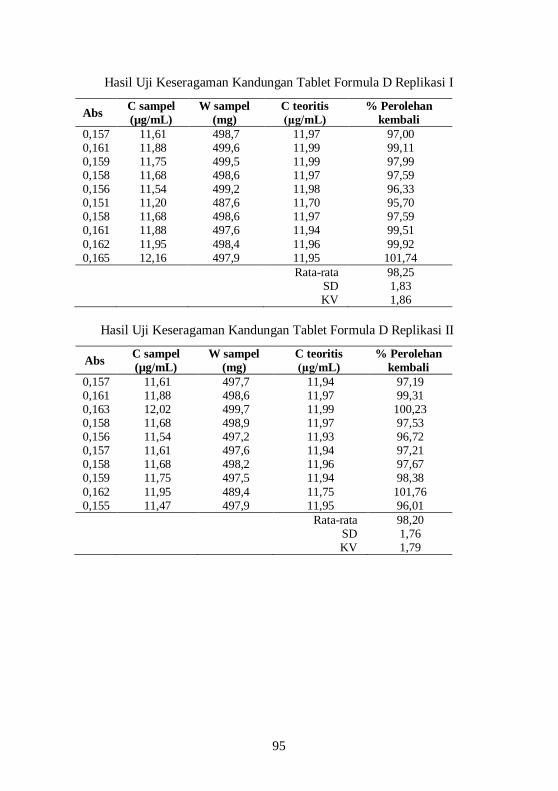
Hasil Uji Keseragaman Kandungan Tablet Formula D Replikasi I
Abs C sampel (µg/mL)
W sampel (mg)
C teoritis (µg/mL)
% Perolehan kembali
0,157 11,61 498,7 11,97 97,00 0,161 11,88 499,6 11,99 99,11 0,159 11,75 499,5 11,99 97,99 0,158 11,68 498,6 11,97 97,59 0,156 11,54 499,2 11,98 96,33 0,151 11,20 487,6 11,70 95,70 0,158 11,68 498,6 11,97 97,59 0,161 11,88 497,6 11,94 99,51 0,162 11,95 498,4 11,96 99,92 0,165 12,16 497,9 11,95 101,74
Rata-rata 98,25 SD 1,83 KV 1,86
Hasil Uji Keseragaman Kandungan Tablet Formula D Replikasi II
Abs C sampel (µg/mL)
W sampel (mg)
C teoritis (µg/mL)
% Perolehan kembali
0,157 11,61 497,7 11,94 97,19 0,161 11,88 498,6 11,97 99,31 0,163 12,02 499,7 11,99 100,23 0,158 11,68 498,9 11,97 97,53 0,156 11,54 497,2 11,93 96,72 0,157 11,61 497,6 11,94 97,21 0,158 11,68 498,2 11,96 97,67 0,159 11,75 497,5 11,94 98,38 0,162 11,95 489,4 11,75 101,76 0,155 11,47 497,9 11,95 96,01
Rata-rata 98,20 SD 1,76 KV 1,79
96
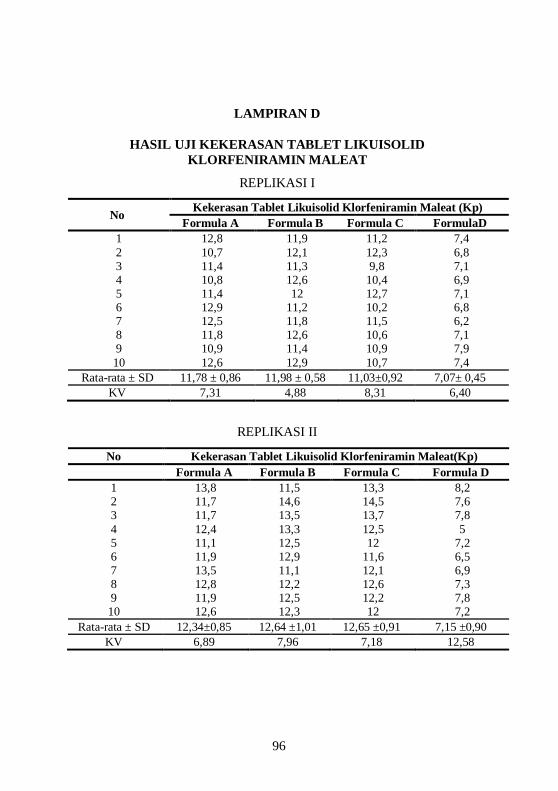
LAMPIRAN D
HASIL UJI KEKERASAN TABLET LIKUISOLID KLORFENIRAMIN MALEAT
REPLIKASI I
No Kekerasan Tablet Likuisolid Klorfeniramin Maleat (Kp) Formula A Formula B Formula C FormulaD
1 12,8 11,9 11,2 7,4 2 10,7 12,1 12,3 6,8 3 11,4 11,3 9,8 7,1 4 10,8 12,6 10,4 6,9 5 11,4 12 12,7 7,1 6 12,9 11,2 10,2 6,8 7 12,5 11,8 11,5 6,2 8 11,8 12,6 10,6 7,1 9 10,9 11,4 10,9 7,9 10 12,6 12,9 10,7 7,4
Rata-rata ± SD 11,78 ± 0,86 11,98 ± 0,58 11,03±0,92 7,07± 0,45 KV 7,31 4,88 8,31 6,40
REPLIKASI II
No Kekerasan Tablet Likuisolid Klorfeniramin Maleat(Kp)
Formula A Formula B Formula C Formula D 1 13,8 11,5 13,3 8,2 2 11,7 14,6 14,5 7,6 3 11,7 13,5 13,7 7,8 4 12,4 13,3 12,5 5 5 11,1 12,5 12 7,2 6 11,9 12,9 11,6 6,5 7 13,5 11,1 12,1 6,9 8 12,8 12,2 12,6 7,3 9 11,9 12,5 12,2 7,8 10 12,6 12,3 12 7,2
Rata-rata ± SD 12,34±0,85 12,64 ±1,01 12,65 ±0,91 7,15 ±0,90 KV 6,89 7,96 7,18 12,58
97
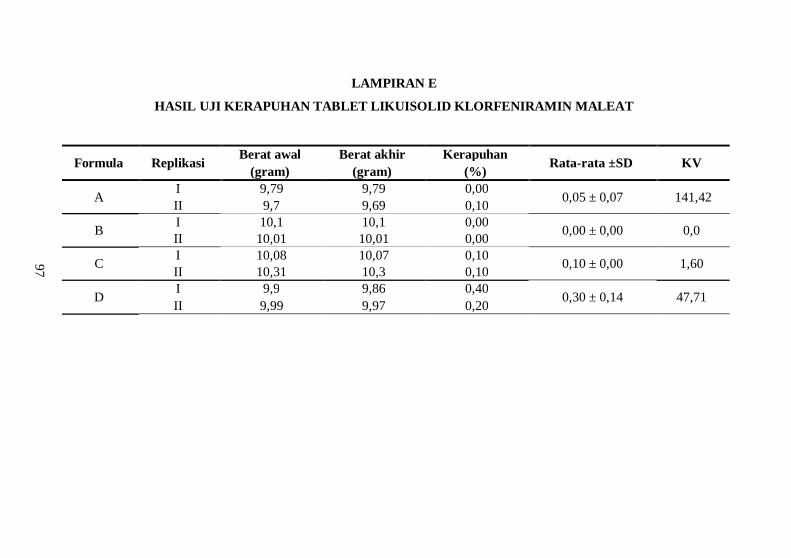
LAMPIRAN E
HASIL UJI KERAPUHAN TABLET LIKUISOLID KLORFENIRAMIN MALEAT
Formula Replikasi Berat awal Berat akhir Kerapuhan Rata-rata ±SD KV (gram) (gram) (%)
A I 9,79 9,79 0,00 0,05 ± 0,07 141,42 II 9,7 9,69 0,10
B I 10,1 10,1 0,00 0,00 ± 0,00 0,0 II 10,01 10,01 0,00
C I 10,08 10,07 0,10 0,10 ± 0,00 1,60 II 10,31 10,3 0,10
D I 9,9 9,86 0,40 0,30 ± 0,14 47,71 II 9,99 9,97 0,20
98
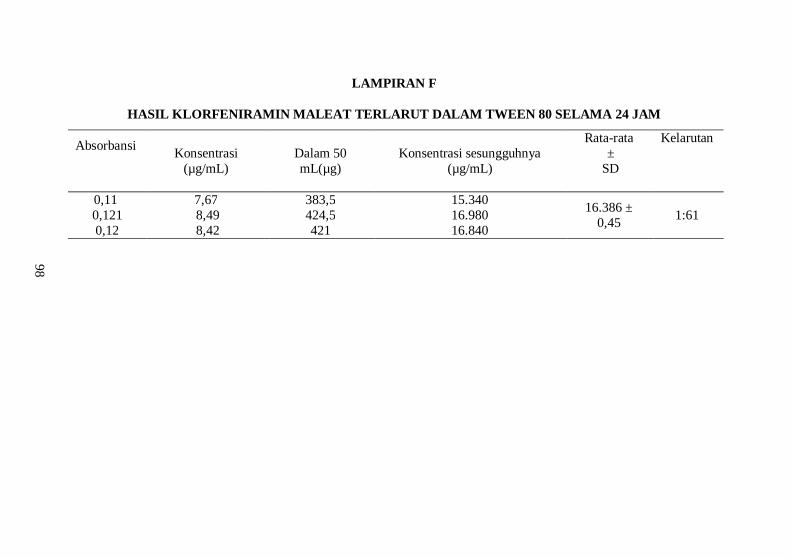
LAMPIRAN F
HASIL KLORFENIRAMIN MALEAT TERLARUT DALAM TWEEN 80 SELAMA 24 JAM
Absorbansi
Konsentrasi (µg/mL)
Dalam 50 mL(µg)
Konsentrasi sesungguhnya (µg/mL)
Rata-rata ±
SD
Kelarutan
0,11 7,67 383,5 15.340 16.386 ± 0,45 1:61 0,121 8,49 424,5 16.980
0,12 8,42 421 16.840
99
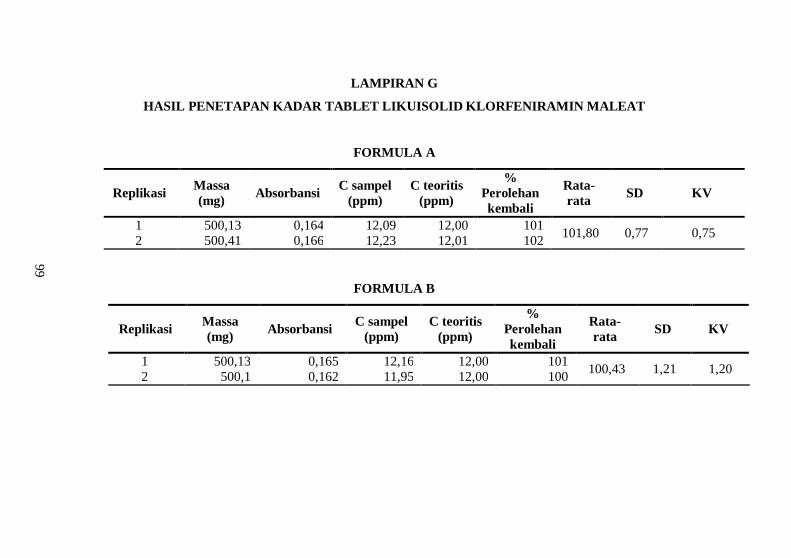
LAMPIRAN G
HASIL PENETAPAN KADAR TABLET LIKUISOLID KLORFENIRAMIN MALEAT
FORMULA A
Replikasi Massa (mg) Absorbansi C sampel
(ppm) C teoritis
(ppm)
% Perolehan kembali
Rata-rata SD KV
1 500,13 0,164 12,09 12,00 101 101,80 0,77 0,75 2 500,41 0,166 12,23 12,01 102
FORMULA B
Replikasi Massa (mg) Absorbansi C sampel
(ppm) C teoritis
(ppm)
% Perolehan kembali
Rata-rata SD KV
1 500,13 0,165 12,16 12,00 101 100,43 1,21 1,20 2 500,1 0,162 11,95 12,00 100
100
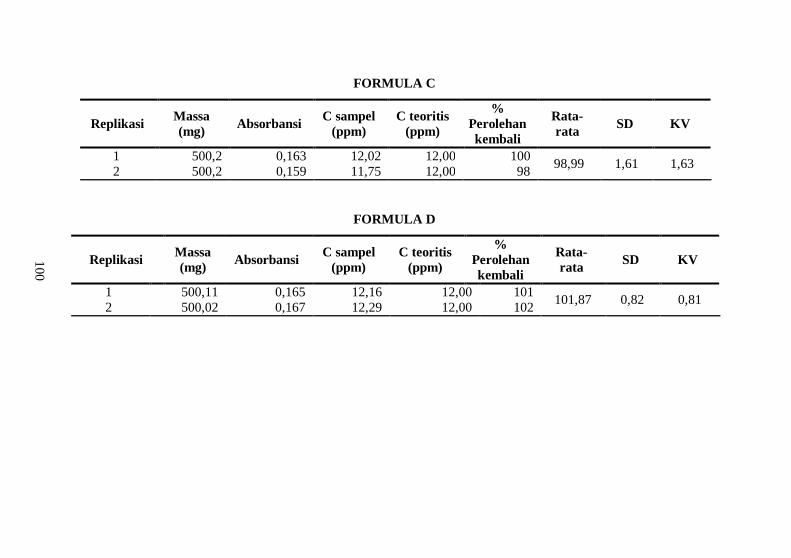
FORMULA C
Replikasi Massa (mg) Absorbansi C sampel
(ppm) C teoritis
(ppm)
% Perolehan kembali
Rata-rata SD KV
1 500,2 0,163 12,02 12,00 100 98,99 1,61 1,63 2 500,2 0,159 11,75 12,00 98
FORMULA D
Replikasi Massa (mg) Absorbansi C sampel
(ppm) C teoritis
(ppm)
% Perolehan kembali
Rata-rata SD KV
1 500,11 0,165 12,16 12,00 101 101,87 0,82 0,81 2 500,02 0,167 12,29 12,00 102
101
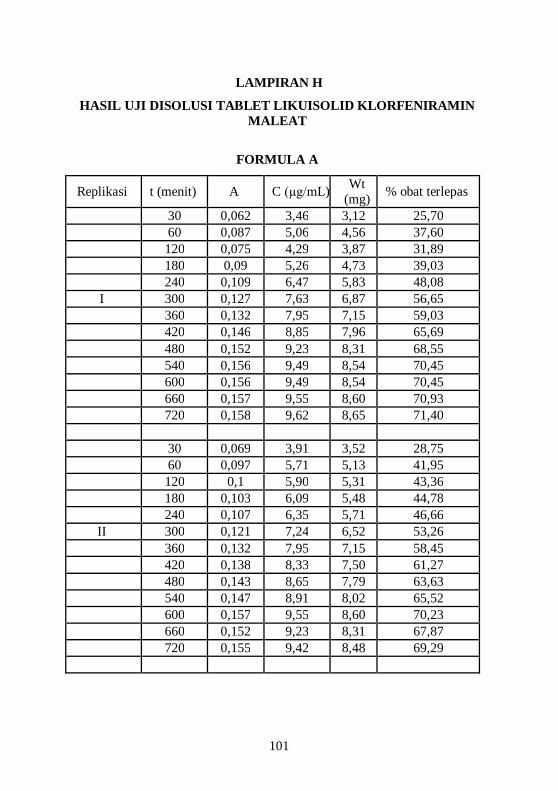
LAMPIRAN H
HASIL UJI DISOLUSI TABLET LIKUISOLID KLORFENIRAMIN MALEAT
FORMULA A
Replikasi t (menit) A C (µg/mL) Wt (mg) % obat terlepas
30 0,062 3,46 3,12 25,70 60 0,087 5,06 4,56 37,60 120 0,075 4,29 3,87 31,89 180 0,09 5,26 4,73 39,03 240 0,109 6,47 5,83 48,08 I 300 0,127 7,63 6,87 56,65 360 0,132 7,95 7,15 59,03 420 0,146 8,85 7,96 65,69 480 0,152 9,23 8,31 68,55 540 0,156 9,49 8,54 70,45 600 0,156 9,49 8,54 70,45 660 0,157 9,55 8,60 70,93 720 0,158 9,62 8,65 71,40 30 0,069 3,91 3,52 28,75 60 0,097 5,71 5,13 41,95 120 0,1 5,90 5,31 43,36 180 0,103 6,09 5,48 44,78 240 0,107 6,35 5,71 46,66
II 300 0,121 7,24 6,52 53,26 360 0,132 7,95 7,15 58,45 420 0,138 8,33 7,50 61,27 480 0,143 8,65 7,79 63,63 540 0,147 8,91 8,02 65,52 600 0,157 9,55 8,60 70,23 660 0,152 9,23 8,31 67,87 720 0,155 9,42 8,48 69,29
102
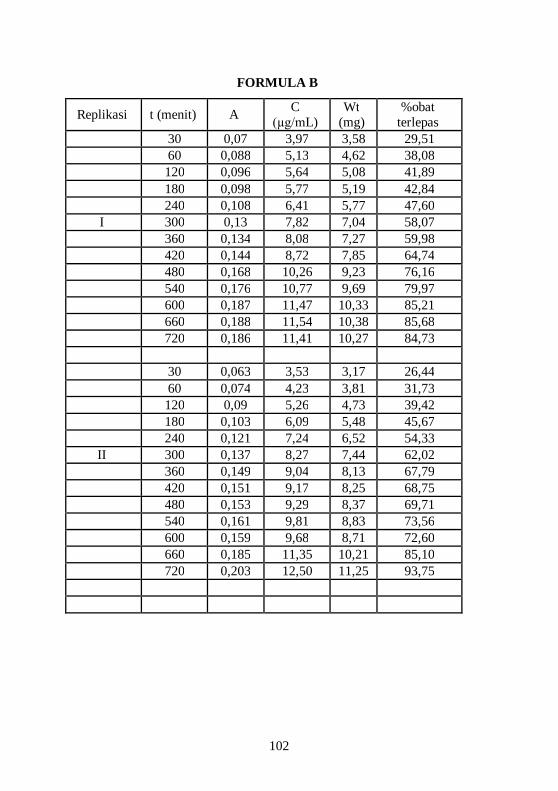
FORMULA B
Replikasi t (menit) A C (µg/mL)
Wt (mg)
%obat terlepas
30 0,07 3,97 3,58 29,51 60 0,088 5,13 4,62 38,08 120 0,096 5,64 5,08 41,89 180 0,098 5,77 5,19 42,84 240 0,108 6,41 5,77 47,60 I 300 0,13 7,82 7,04 58,07 360 0,134 8,08 7,27 59,98 420 0,144 8,72 7,85 64,74 480 0,168 10,26 9,23 76,16 540 0,176 10,77 9,69 79,97 600 0,187 11,47 10,33 85,21 660 0,188 11,54 10,38 85,68 720 0,186 11,41 10,27 84,73 30 0,063 3,53 3,17 26,44 60 0,074 4,23 3,81 31,73 120 0,09 5,26 4,73 39,42 180 0,103 6,09 5,48 45,67 240 0,121 7,24 6,52 54,33
II 300 0,137 8,27 7,44 62,02 360 0,149 9,04 8,13 67,79 420 0,151 9,17 8,25 68,75 480 0,153 9,29 8,37 69,71 540 0,161 9,81 8,83 73,56 600 0,159 9,68 8,71 72,60 660 0,185 11,35 10,21 85,10 720 0,203 12,50 11,25 93,75
103
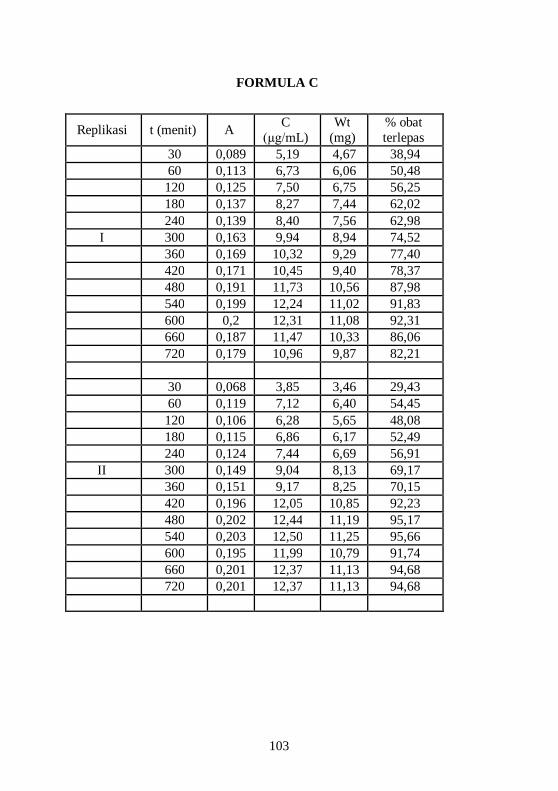
FORMULA C
Replikasi t (menit) A C (µg/mL)
Wt (mg)
% obat terlepas
30 0,089 5,19 4,67 38,94 60 0,113 6,73 6,06 50,48 120 0,125 7,50 6,75 56,25 180 0,137 8,27 7,44 62,02 240 0,139 8,40 7,56 62,98 I 300 0,163 9,94 8,94 74,52 360 0,169 10,32 9,29 77,40 420 0,171 10,45 9,40 78,37 480 0,191 11,73 10,56 87,98 540 0,199 12,24 11,02 91,83 600 0,2 12,31 11,08 92,31 660 0,187 11,47 10,33 86,06 720 0,179 10,96 9,87 82,21 30 0,068 3,85 3,46 29,43 60 0,119 7,12 6,40 54,45 120 0,106 6,28 5,65 48,08 180 0,115 6,86 6,17 52,49 240 0,124 7,44 6,69 56,91
II 300 0,149 9,04 8,13 69,17 360 0,151 9,17 8,25 70,15 420 0,196 12,05 10,85 92,23 480 0,202 12,44 11,19 95,17 540 0,203 12,50 11,25 95,66 600 0,195 11,99 10,79 91,74 660 0,201 12,37 11,13 94,68 720 0,201 12,37 11,13 94,68
104
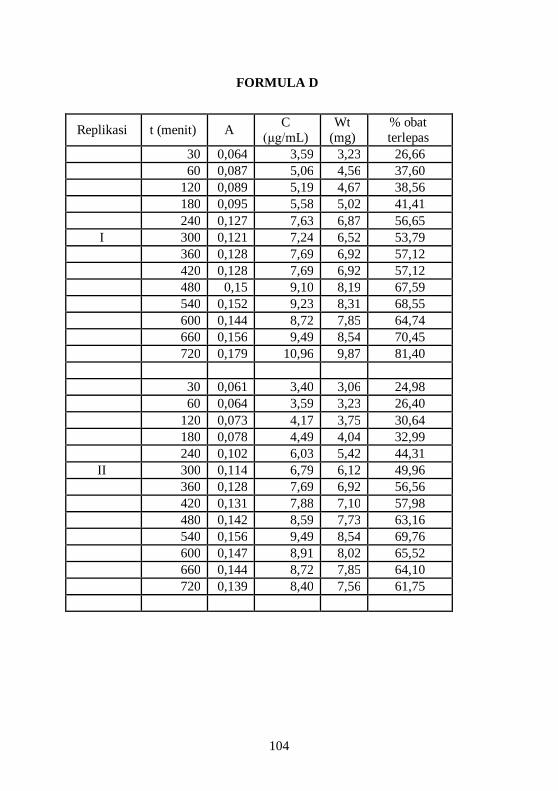
FORMULA D
Replikasi t (menit) A C (µg/mL)
Wt (mg)
% obat terlepas
30 0,064 3,59 3,23 26,66 60 0,087 5,06 4,56 37,60 120 0,089 5,19 4,67 38,56 180 0,095 5,58 5,02 41,41 240 0,127 7,63 6,87 56,65 I 300 0,121 7,24 6,52 53,79 360 0,128 7,69 6,92 57,12 420 0,128 7,69 6,92 57,12 480 0,15 9,10 8,19 67,59 540 0,152 9,23 8,31 68,55 600 0,144 8,72 7,85 64,74 660 0,156 9,49 8,54 70,45 720 0,179 10,96 9,87 81,40 30 0,061 3,40 3,06 24,98 60 0,064 3,59 3,23 26,40 120 0,073 4,17 3,75 30,64 180 0,078 4,49 4,04 32,99 240 0,102 6,03 5,42 44,31
II 300 0,114 6,79 6,12 49,96 360 0,128 7,69 6,92 56,56 420 0,131 7,88 7,10 57,98 480 0,142 8,59 7,73 63,16 540 0,156 9,49 8,54 69,76 600 0,147 8,91 8,02 65,52 660 0,144 8,72 7,85 64,10 720 0,139 8,40 7,56 61,75
105
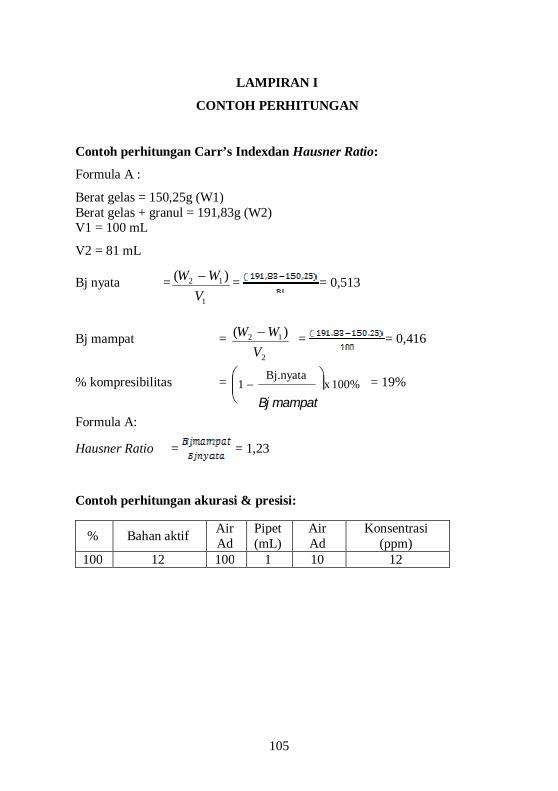
LAMPIRAN I
CONTOH PERHITUNGAN
Contoh perhitungan Carr’s Indexdan Hausner Ratio:
Formula A :
Berat gelas = 150,25g (W1) Berat gelas + granul = 191,83g (W2) V1 = 100 mL
V2 = 81 mL
Bj nyata =1
12 )(V
WW = = 0,513
Bj mampat = 2
12 )(V
WW = = 0,416
% kompresibilitas = 100%xBj.mampat
Bj.nyata1
= 19%
Formula A:
Hausner Ratio = = 1,23
Contoh perhitungan akurasi & presisi:
% Bahan aktif Air Ad
Pipet (mL)
Air Ad
Konsentrasi (ppm)
100 12 100 1 10 12
Bj mampat
106
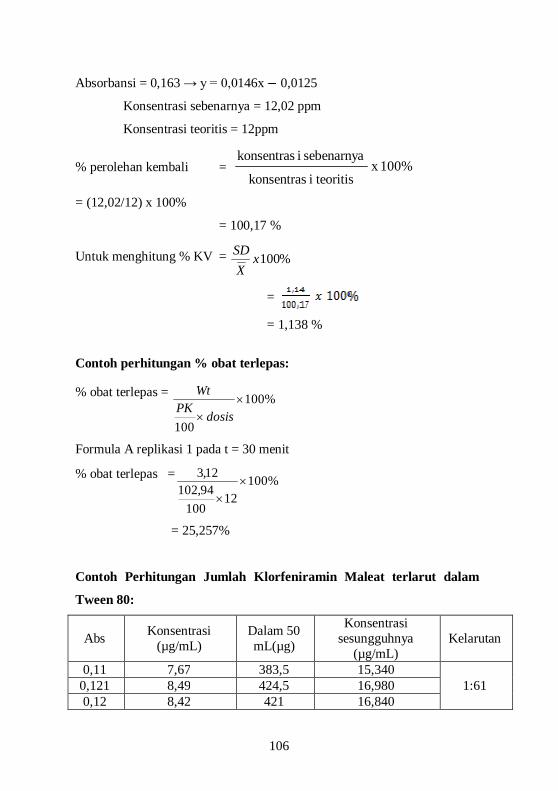
Absorbansi = 0,163 → y = 0,0146x 0,0125
Konsentrasi sebenarnya = 12,02 ppm
Konsentrasi teoritis = 12ppm
% perolehan kembali = 100%x teoritisikonsentras
sebenarnya ikonsentras
= (12,02/12) x 100%
= 100,17 %
Untuk menghitung % KV = %100xX
SD
=
= 1,138 %
Contoh perhitungan % obat terlepas:
% obat terlepas = %100
100
dosis
PKWt
Formula A replikasi 1 pada t = 30 menit
% obat terlepas = %10012
10094,10212,3
= 25,257%
Contoh Perhitungan Jumlah Klorfeniramin Maleat terlarut dalam
Tween 80:
Abs Konsentrasi (µg/mL)
Dalam 50 mL(µg)
Konsentrasi sesungguhnya
(µg/mL) Kelarutan
0,11 7,67 383,5 15,340 1:61 0,121 8,49 424,5 16,980
0,12 8,42 421 16,840
107
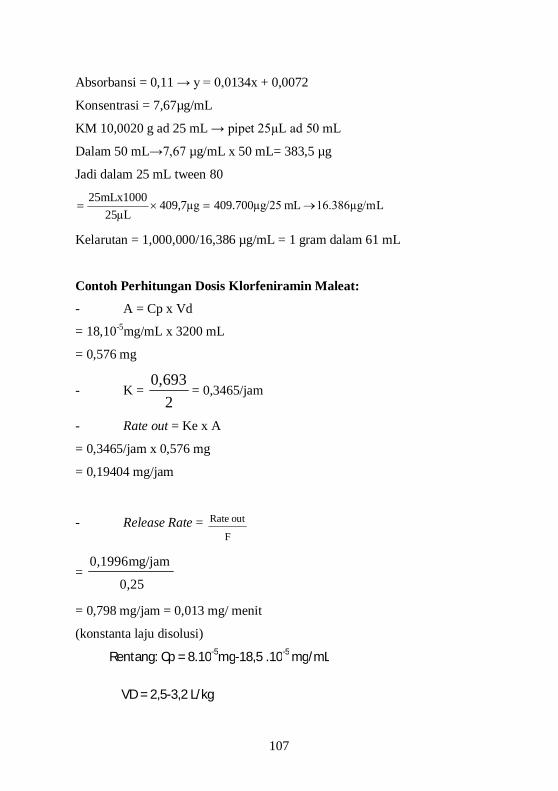
Absorbansi = 0,11 → y = 0,0134x + 0,0072
Konsentrasi = 7,67µg/mL
KM 10,0020 g ad 25 mL → pipet 25µL ad 50 mL
Dalam 50 mL→7,67 µg/mL x 50 mL= 383,5 µg
Jadi dalam 25 mL tween 80
L16.386µg/m mL µg/25700.409µg7,409µL25
25mLx1000
Kelarutan = 1,000,000/16,386 µg/mL = 1 gram dalam 61 mL
Contoh Perhitungan Dosis Klorfeniramin Maleat:
- A = Cp x Vd
= 18,10-5mg/mL x 3200 mL
= 0,576 mg
- K = 2693,0
= 0,3465/jam
- Rate out = Ke x A
= 0,3465/jam x 0,576 mg
= 0,19404 mg/jam
- Release Rate = F
out Rate
= 0,25
mg/jam 0,1996
= 0,798 mg/jam = 0,013 mg/ menit
(konstanta laju disolusi)
Rentang: Cp = 8.10-5mg-18,5 .10-5 mg/mL
VD = 2,5-3,2 L/kg
108
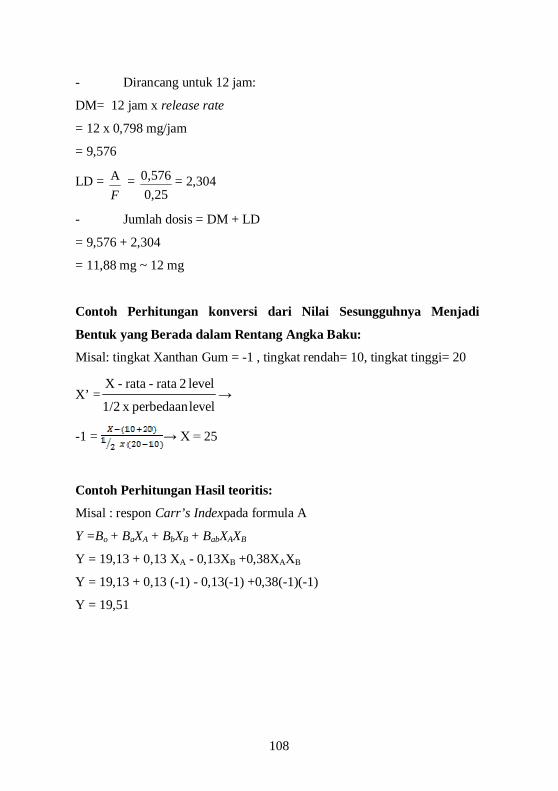
- Dirancang untuk 12 jam:
DM= 12 jam x release rate
= 12 x 0,798 mg/jam
= 9,576
LD = FA =
25,00,576 = 2,304
- Jumlah dosis = DM + LD
= 9,576 + 2,304
= 11,88 mg ~ 12 mg
Contoh Perhitungan konversi dari Nilai Sesungguhnya Menjadi
Bentuk yang Berada dalam Rentang Angka Baku:
Misal: tingkat Xanthan Gum = -1 , tingkat rendah= 10, tingkat tinggi= 20
X’ =levelperbedaan x 1/2
level 2 rata-rata-X→
-1 = → X = 25
Contoh Perhitungan Hasil teoritis:
Misal : respon Carr’s Indexpada formula A
Y =Bo + BaXA + BbXB + BabXAXB
Y = 19,13 + 0,13 XA - 0,13XB +0,38XAXB
Y = 19,13 + 0,13 (-1) - 0,13(-1) +0,38(-1)(-1)
Y = 19,51
109
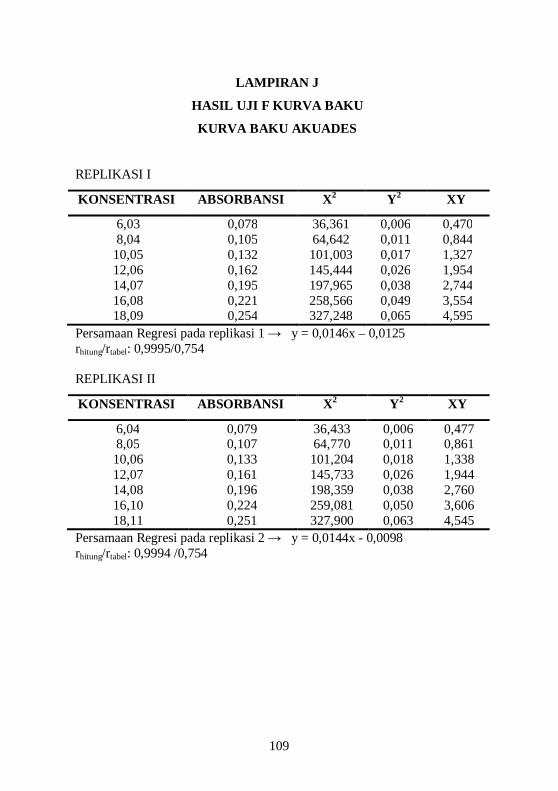
LAMPIRAN J
HASIL UJI F KURVA BAKU
KURVA BAKU AKUADES
REPLIKASI I
KONSENTRASI ABSORBANSI X2 Y2 XY
6,03 0,078 36,361 0,006 0,470 8,04 0,105 64,642 0,011 0,844
10,05 0,132 101,003 0,017 1,327 12,06 0,162 145,444 0,026 1,954 14,07 0,195 197,965 0,038 2,744 16,08 0,221 258,566 0,049 3,554 18,09 0,254 327,248 0,065 4,595
Persamaan Regresi pada replikasi 1 → y = 0,0146x – 0,0125 rhitung/rtabel: 0,9995/0,754 REPLIKASI II
KONSENTRASI ABSORBANSI X2 Y2 XY
6,04 0,079 36,433 0,006 0,477 8,05 0,107 64,770 0,011 0,861 10,06 0,133 101,204 0,018 1,338 12,07 0,161 145,733 0,026 1,944 14,08 0,196 198,359 0,038 2,760 16,10 0,224 259,081 0,050 3,606 18,11 0,251 327,900 0,063 4,545
Persamaan Regresi pada replikasi 2 → y = 0,0144x - 0,0098 rhitung/rtabel: 0,9994 /0,754
110
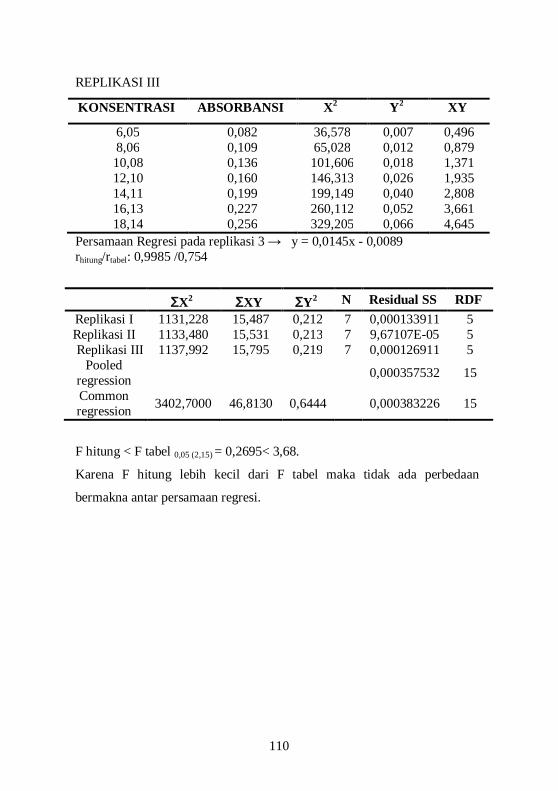
REPLIKASI III
KONSENTRASI ABSORBANSI X2 Y2 XY
6,05 0,082 36,578 0,007 0,496 8,06 0,109 65,028 0,012 0,879 10,08 0,136 101,606 0,018 1,371 12,10 0,160 146,313 0,026 1,935 14,11 0,199 199,149 0,040 2,808 16,13 0,227 260,112 0,052 3,661 18,14 0,256 329,205 0,066 4,645
Persamaan Regresi pada replikasi 3 → y = 0,0145x - 0,0089 rhitung/rtabel: 0,9985 /0,754
ƩX2 ƩXY ƩY2 N Residual SS RDF Replikasi I 1131,228 15,487 0,212 7 0,000133911 5 Replikasi II 1133,480 15,531 0,213 7 9,67107E-05 5 Replikasi III 1137,992 15,795 0,219 7 0,000126911 5
Pooled regression 0,000357532 15
Common regression 3402,7000 46,8130 0,6444 0,000383226 15
F hitung < F tabel 0,05 (2,15) = 0,2695< 3,68.
Karena F hitung lebih kecil dari F tabel maka tidak ada perbedaan
bermakna antar persamaan regresi.
111
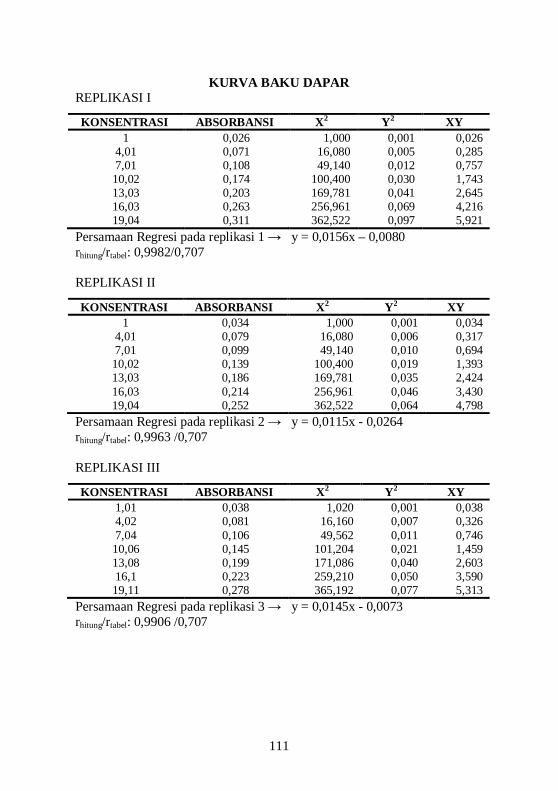
KURVA BAKU DAPAR REPLIKASI I
KONSENTRASI ABSORBANSI X2 Y2 XY 1 0,026 1,000 0,001 0,026
4,01 0,071 16,080 0,005 0,285 7,01 0,108 49,140 0,012 0,757 10,02 0,174 100,400 0,030 1,743 13,03 0,203 169,781 0,041 2,645 16,03 0,263 256,961 0,069 4,216 19,04 0,311 362,522 0,097 5,921
Persamaan Regresi pada replikasi 1 → y = 0,0156x – 0,0080 rhitung/rtabel: 0,9982/0,707 REPLIKASI II
KONSENTRASI ABSORBANSI X2 Y2 XY 1 0,034 1,000 0,001 0,034
4,01 0,079 16,080 0,006 0,317 7,01 0,099 49,140 0,010 0,694 10,02 0,139 100,400 0,019 1,393 13,03 0,186 169,781 0,035 2,424 16,03 0,214 256,961 0,046 3,430 19,04 0,252 362,522 0,064 4,798
Persamaan Regresi pada replikasi 2 → y = 0,0115x - 0,0264 rhitung/rtabel: 0,9963 /0,707 REPLIKASI III
KONSENTRASI ABSORBANSI X2 Y2 XY 1,01 0,038 1,020 0,001 0,038 4,02 0,081 16,160 0,007 0,326 7,04 0,106 49,562 0,011 0,746 10,06 0,145 101,204 0,021 1,459 13,08 0,199 171,086 0,040 2,603 16,1 0,223 259,210 0,050 3,590 19,11 0,278 365,192 0,077 5,313
Persamaan Regresi pada replikasi 3 → y = 0,0145x - 0,0073 rhitung/rtabel: 0,9906 /0,707
112
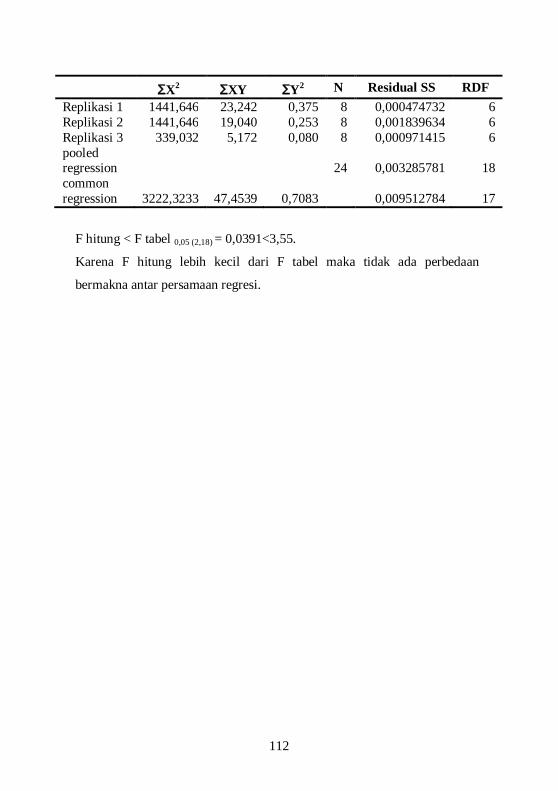
ƩX2 ƩXY ƩY2 N Residual SS RDF Replikasi 1 1441,646 23,242 0,375 8 0,000474732 6 Replikasi 2 1441,646 19,040 0,253 8 0,001839634 6 Replikasi 3 339,032 5,172 0,080 8 0,000971415 6 pooled regression 24 0,003285781 18 common regression 3222,3233 47,4539 0,7083 0,009512784 17
F hitung < F tabel 0,05 (2,18) = 0,0391<3,55.
Karena F hitung lebih kecil dari F tabel maka tidak ada perbedaan
bermakna antar persamaan regresi.
113
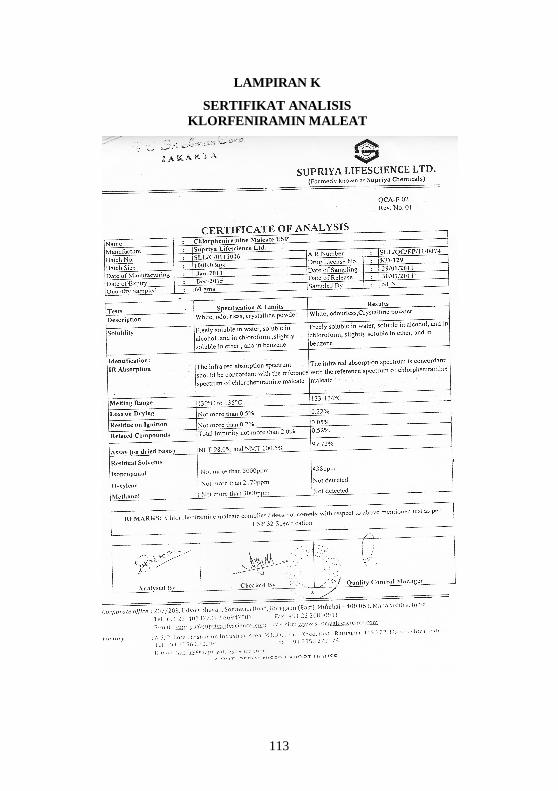
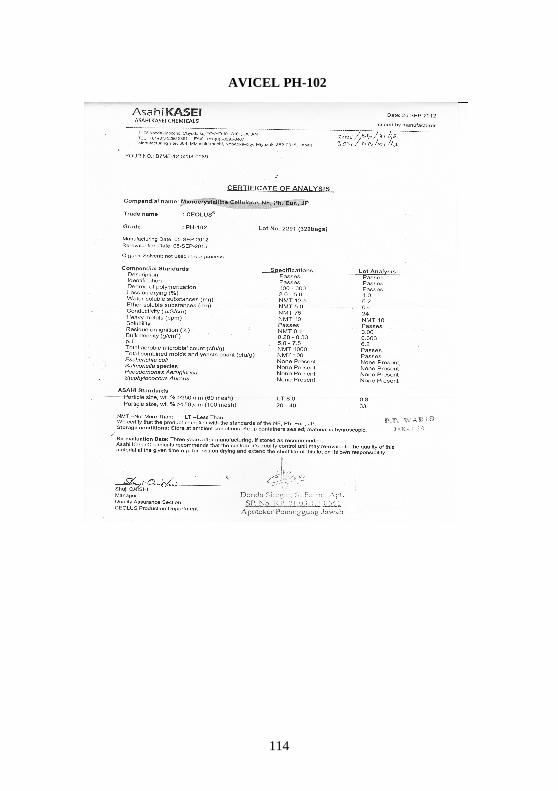
LAMPIRAN K
SERTIFIKAT ANALISIS KLORFENIRAMIN MALEAT
114
AVICEL PH-102
115
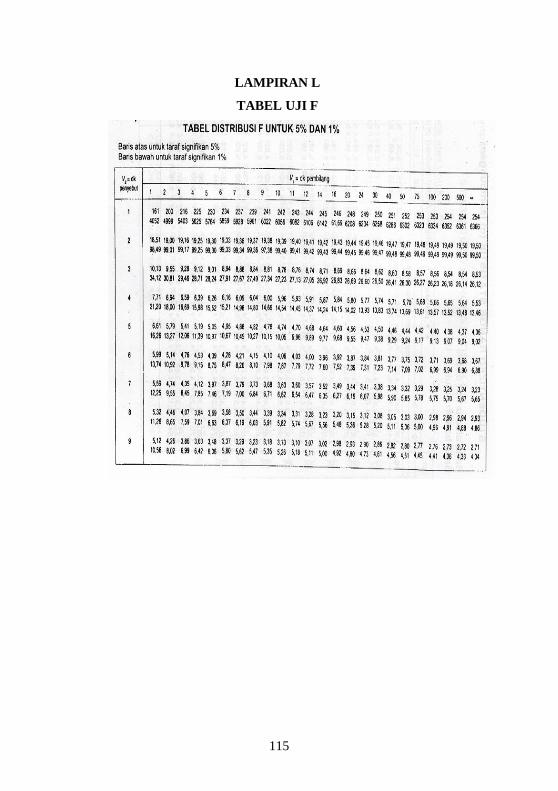
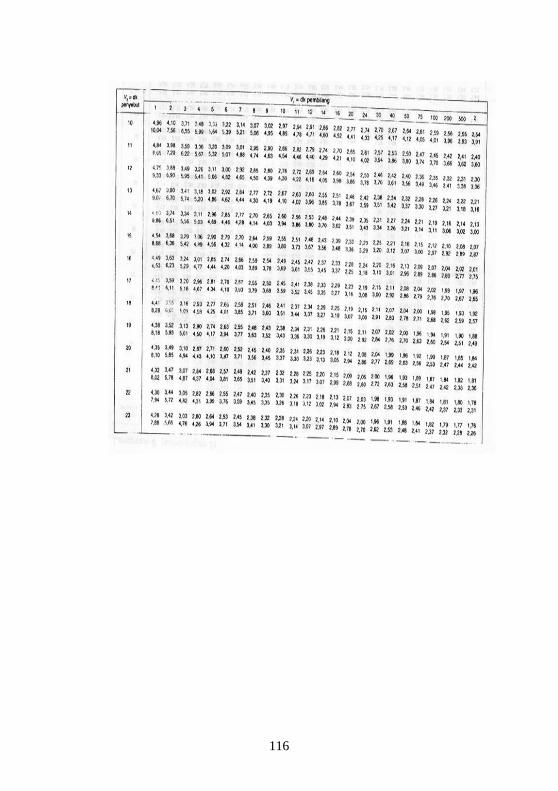
LAMPIRAN L
TABEL UJI F
116
117
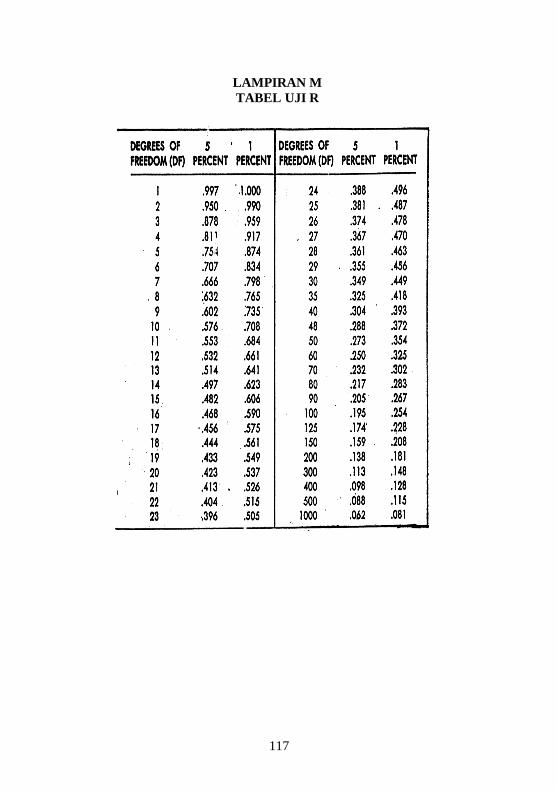
LAMPIRAN M TABEL UJI R
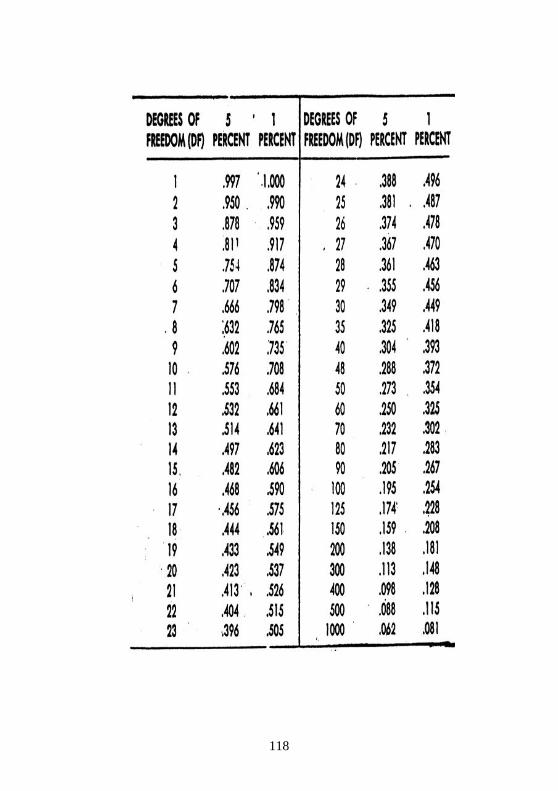
118
119
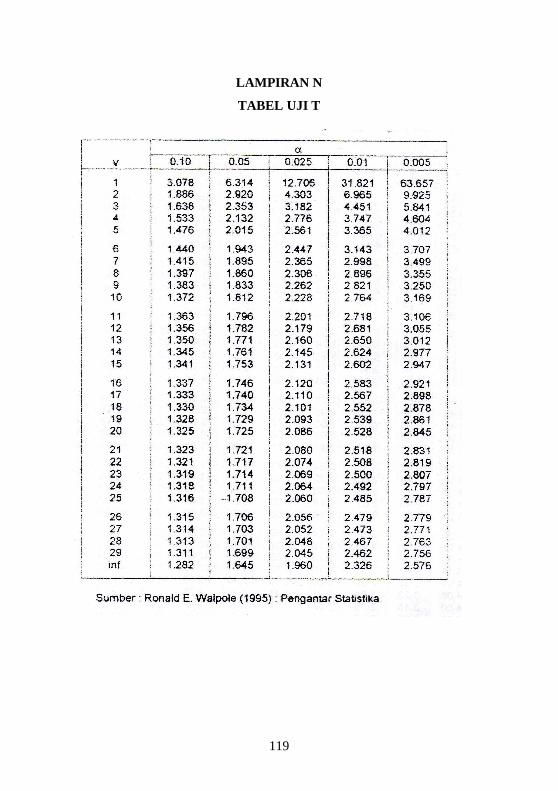
LAMPIRAN N
TABEL UJI T
120
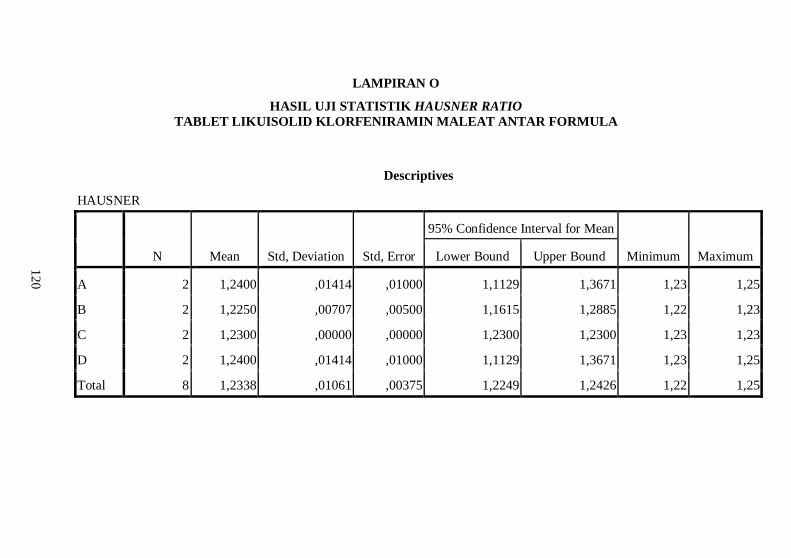
LAMPIRAN O
HASIL UJI STATISTIK HAUSNER RATIO TABLET LIKUISOLID KLORFENIRAMIN MALEAT ANTAR FORMULA
Descriptives
HAUSNER
N Mean Std, Deviation Std, Error
95% Confidence Interval for Mean
Minimum Maximum Lower Bound Upper Bound
A 2 1,2400 ,01414 ,01000 1,1129 1,3671 1,23 1,25
B 2 1,2250 ,00707 ,00500 1,1615 1,2885 1,22 1,23
C 2 1,2300 ,00000 ,00000 1,2300 1,2300 1,23 1,23
D 2 1,2400 ,01414 ,01000 1,1129 1,3671 1,23 1,25
Total 8 1,2338 ,01061 ,00375 1,2249 1,2426 1,22 1,25
121
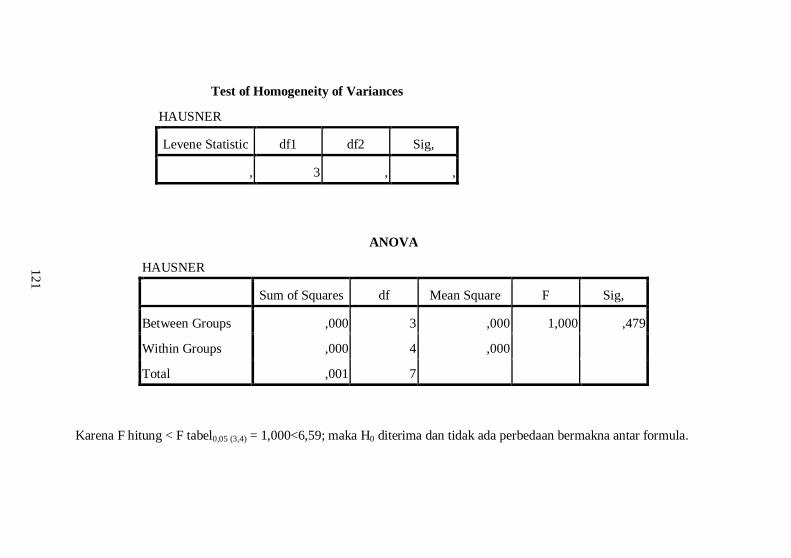
Test of Homogeneity of Variances
HAUSNER
Levene Statistic df1 df2 Sig,
, 3 , ,
ANOVA
HAUSNER Sum of Squares df Mean Square F Sig,
Between Groups ,000 3 ,000 1,000 ,479
Within Groups ,000 4 ,000
Total ,001 7
Karena F hitung < F tabel0,05 (3,4) = 1,000<6,59; maka H0 diterima dan tidak ada perbedaan bermakna antar formula.
122
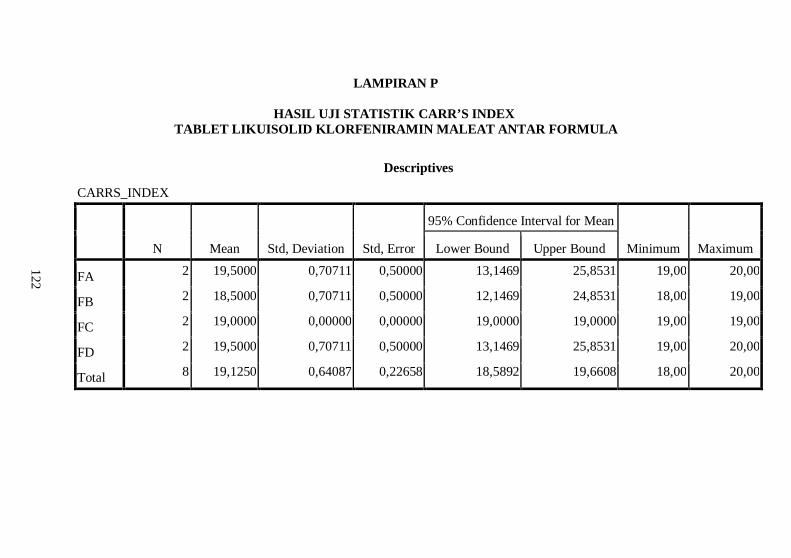
LAMPIRAN P
HASIL UJI STATISTIK CARR’S INDEX TABLET LIKUISOLID KLORFENIRAMIN MALEAT ANTAR FORMULA
Descriptives
CARRS_INDEX
N Mean Std, Deviation Std, Error
95% Confidence Interval for Mean
Minimum Maximum Lower Bound Upper Bound
FA 2 19,5000 0,70711 0,50000 13,1469 25,8531 19,00 20,00
FB 2 18,5000 0,70711 0,50000 12,1469 24,8531 18,00 19,00
FC 2 19,0000 0,00000 0,00000 19,0000 19,0000 19,00 19,00
FD 2 19,5000 0,70711 0,50000 13,1469 25,8531 19,00 20,00
Total 8 19,1250 0,64087 0,22658 18,5892 19,6608 18,00 20,00
123
Test of Homogeneity of Variances
CARRS_INDEX
Levene Statistic df1 df2 Sig,
, 3 , ,
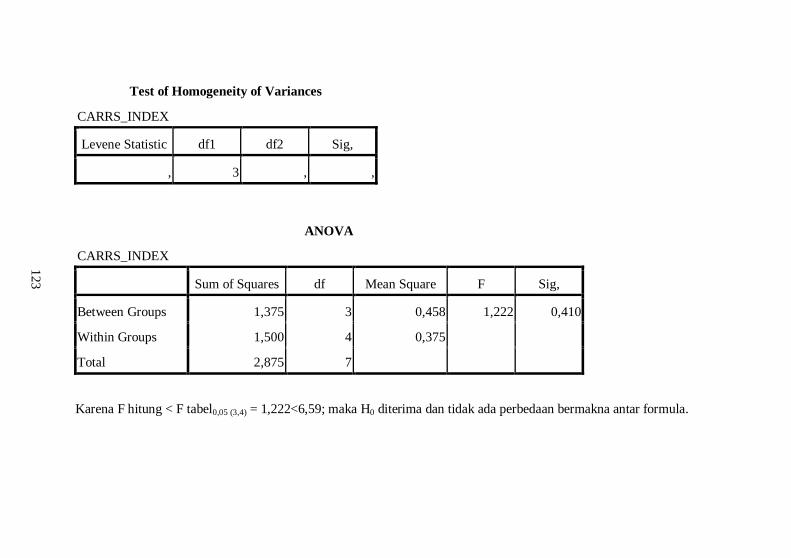
ANOVA
CARRS_INDEX
Sum of Squares df Mean Square F Sig,
Between Groups 1,375 3 0,458 1,222 0,410
Within Groups 1,500 4 0,375
Total 2,875 7
Karena F hitung < F tabel0,05 (3,4) = 1,222<6,59; maka H0 diterima dan tidak ada perbedaan bermakna antar formula.
124
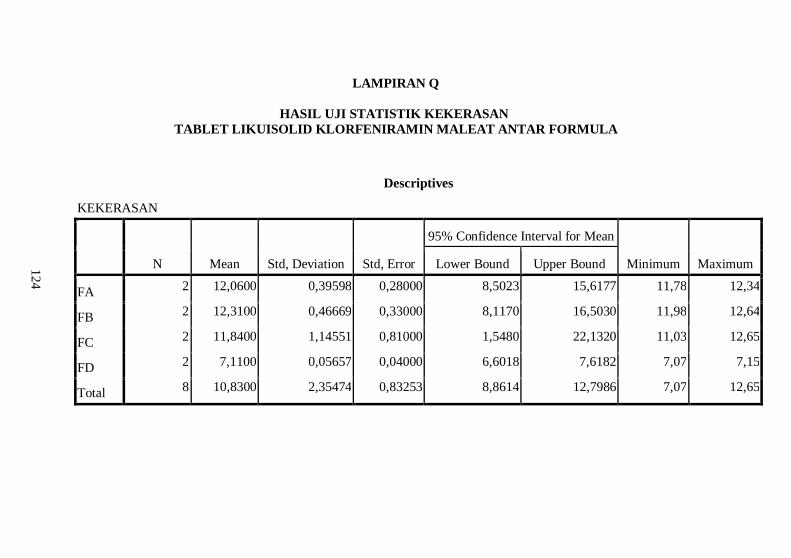
LAMPIRAN Q
HASIL UJI STATISTIK KEKERASAN TABLET LIKUISOLID KLORFENIRAMIN MALEAT ANTAR FORMULA
Descriptives
KEKERASAN
N Mean Std, Deviation Std, Error
95% Confidence Interval for Mean
Minimum Maximum Lower Bound Upper Bound
FA 2 12,0600 0,39598 0,28000 8,5023 15,6177 11,78 12,34
FB 2 12,3100 0,46669 0,33000 8,1170 16,5030 11,98 12,64
FC 2 11,8400 1,14551 0,81000 1,5480 22,1320 11,03 12,65
FD 2 7,1100 0,05657 0,04000 6,6018 7,6182 7,07 7,15
Total 8 10,8300 2,35474 0,83253 8,8614 12,7986 7,07 12,65
125
Test of Homogeneity of Variances
KEKERASAN
Levene Statistic df1 df2 Sig,
, 3 , ,
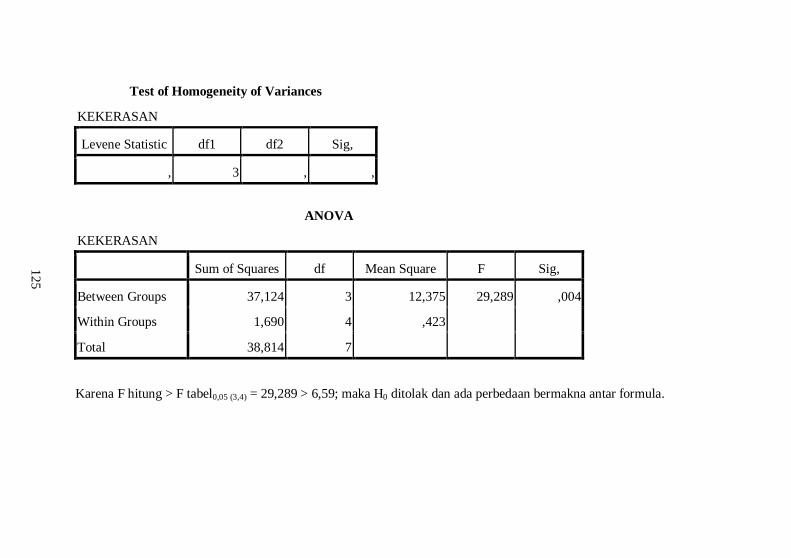
ANOVA
KEKERASAN
Sum of Squares df Mean Square F Sig,
Between Groups 37,124 3 12,375 29,289 ,004
Within Groups 1,690 4 ,423
Total 38,814 7
Karena F hitung > F tabel0,05 (3,4) = 29,289 > 6,59; maka H0 ditolak dan ada perbedaan bermakna antar formula.
126
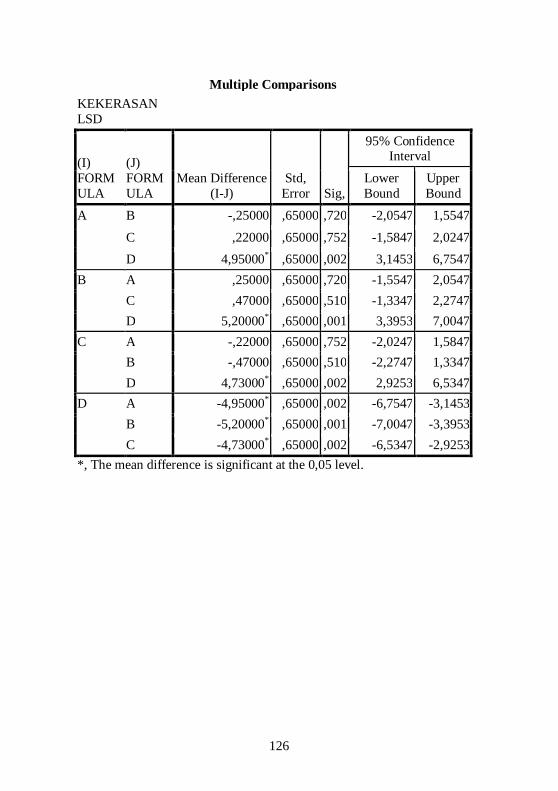
Multiple Comparisons KEKERASAN LSD
(I) FORMULA
(J) FORMULA
Mean Difference (I-J)
Std, Error Sig,
95% Confidence Interval
Lower Bound
Upper Bound
A B -,25000 ,65000 ,720 -2,0547 1,5547
C ,22000 ,65000 ,752 -1,5847 2,0247 D 4,95000* ,65000 ,002 3,1453 6,7547
B A ,25000 ,65000 ,720 -1,5547 2,0547 C ,47000 ,65000 ,510 -1,3347 2,2747 D 5,20000* ,65000 ,001 3,3953 7,0047
C A -,22000 ,65000 ,752 -2,0247 1,5847 B -,47000 ,65000 ,510 -2,2747 1,3347 D 4,73000* ,65000 ,002 2,9253 6,5347
D A -4,95000* ,65000 ,002 -6,7547 -3,1453 B -5,20000* ,65000 ,001 -7,0047 -3,3953 C -4,73000* ,65000 ,002 -6,5347 -2,9253
*, The mean difference is significant at the 0,05 level.
127
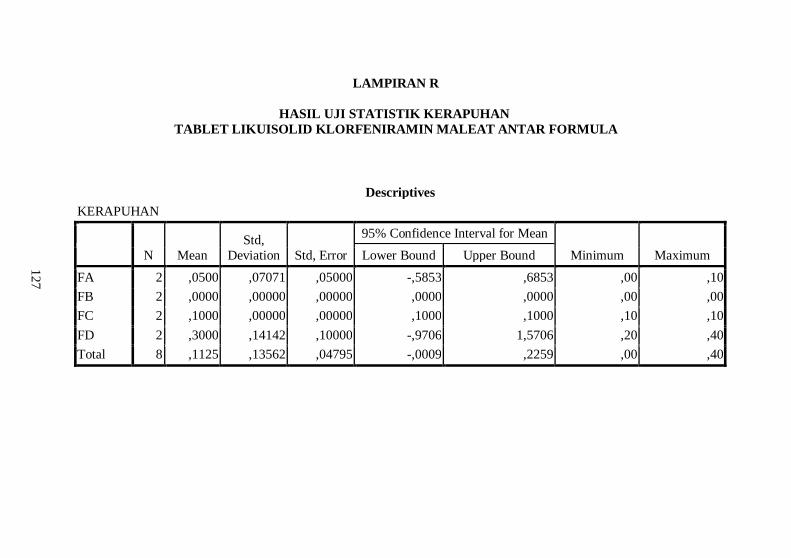
LAMPIRAN R
HASIL UJI STATISTIK KERAPUHAN TABLET LIKUISOLID KLORFENIRAMIN MALEAT ANTAR FORMULA
Descriptives KERAPUHAN
N Mean Std,
Deviation Std, Error
95% Confidence Interval for Mean
Minimum Maximum Lower Bound Upper Bound
FA 2 ,0500 ,07071 ,05000 -,5853 ,6853 ,00 ,10 FB 2 ,0000 ,00000 ,00000 ,0000 ,0000 ,00 ,00 FC 2 ,1000 ,00000 ,00000 ,1000 ,1000 ,10 ,10 FD 2 ,3000 ,14142 ,10000 -,9706 1,5706 ,20 ,40 Total 8 ,1125 ,13562 ,04795 -,0009 ,2259 ,00 ,40
128
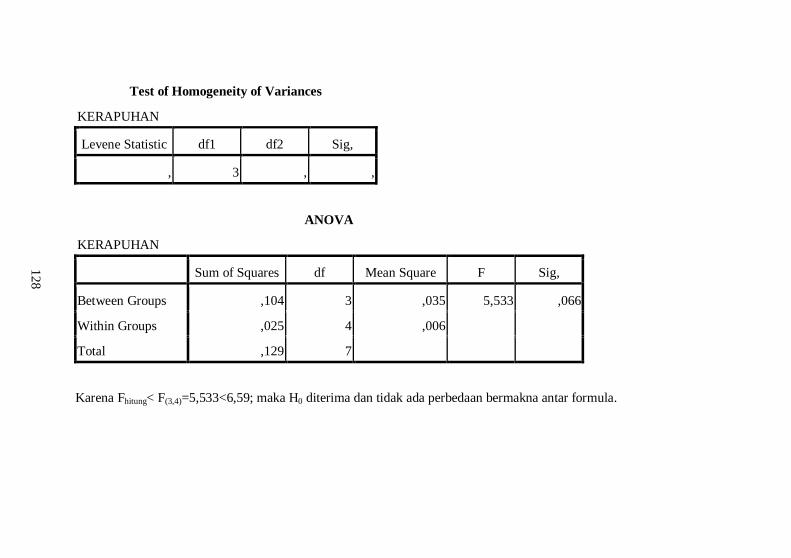
Test of Homogeneity of Variances
KERAPUHAN
Levene Statistic df1 df2 Sig,
, 3 , ,
ANOVA
KERAPUHAN Sum of Squares df Mean Square F Sig,
Between Groups ,104 3 ,035 5,533 ,066
Within Groups ,025 4 ,006
Total ,129 7
Karena Fhitung< F(3,4)=5,533<6,59; maka H0 diterima dan tidak ada perbedaan bermakna antar formula.
129
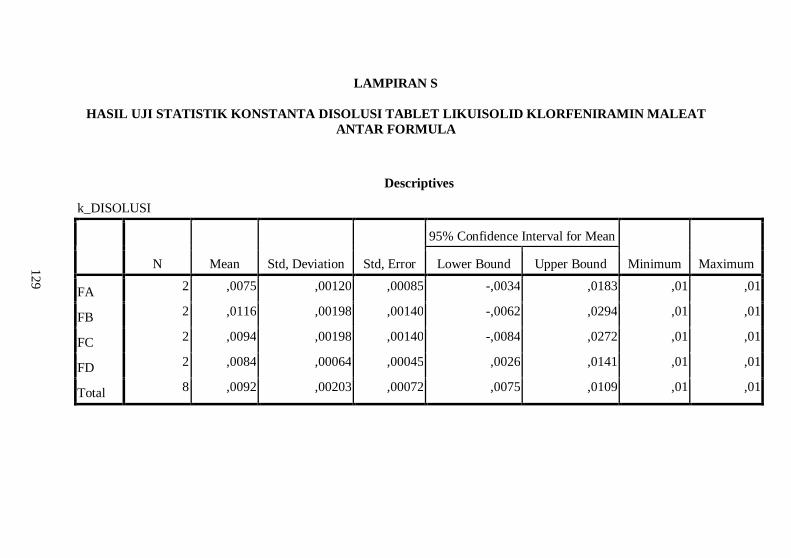
LAMPIRAN S
HASIL UJI STATISTIK KONSTANTA DISOLUSI TABLET LIKUISOLID KLORFENIRAMIN MALEAT ANTAR FORMULA
Descriptives
k_DISOLUSI
N Mean Std, Deviation Std, Error
95% Confidence Interval for Mean
Minimum Maximum Lower Bound Upper Bound
FA 2 ,0075 ,00120 ,00085 -,0034 ,0183 ,01 ,01
FB 2 ,0116 ,00198 ,00140 -,0062 ,0294 ,01 ,01
FC 2 ,0094 ,00198 ,00140 -,0084 ,0272 ,01 ,01
FD 2 ,0084 ,00064 ,00045 ,0026 ,0141 ,01 ,01
Total 8 ,0092 ,00203 ,00072 ,0075 ,0109 ,01 ,01
130
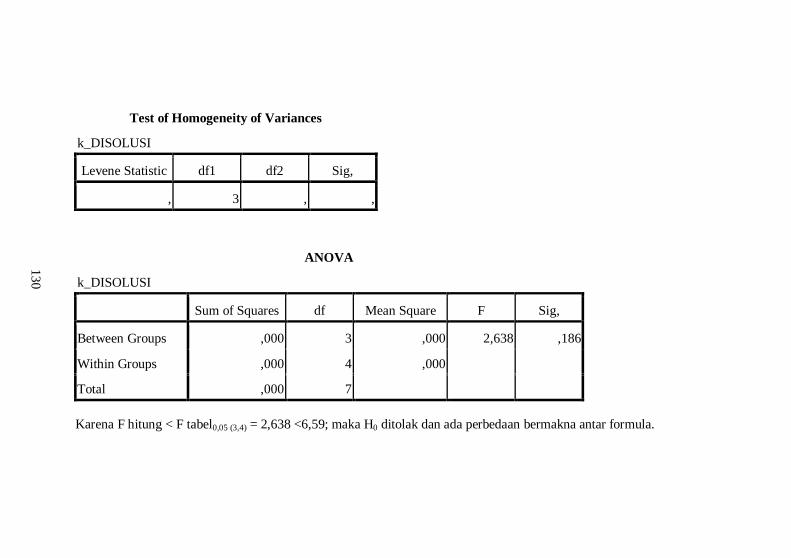
Test of Homogeneity of Variances
k_DISOLUSI
Levene Statistic df1 df2 Sig,
, 3 , ,
ANOVA
k_DISOLUSI
Sum of Squares df Mean Square F Sig,
Between Groups ,000 3 ,000 2,638 ,186
Within Groups ,000 4 ,000
Total ,000 7
Karena F hitung < F tabel0,05 (3,4) = 2,638 <6,59; maka H0 ditolak dan ada perbedaan bermakna antar formula.
131
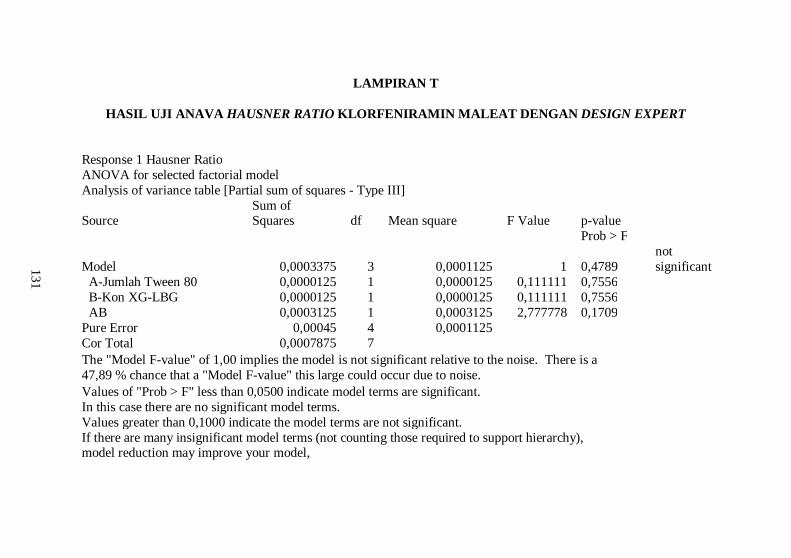
LAMPIRAN T
HASIL UJI ANAVA HAUSNER RATIO KLORFENIRAMIN MALEAT DENGAN DESIGN EXPERT Response 1 Hausner Ratio
ANOVA for selected factorial model Analysis of variance table [Partial sum of squares - Type III]
Source
Sum of Squares df Mean square F Value p-value
Prob > F
Model 0,0003375 3 0,0001125 1 0,4789 not significant
A-Jumlah Tween 80 0,0000125 1 0,0000125 0,111111 0,7556 B-Kon XG-LBG 0,0000125 1 0,0000125 0,111111 0,7556 AB 0,0003125 1 0,0003125 2,777778 0,1709 Pure Error 0,00045 4 0,0001125
Cor Total 0,0007875 7 The "Model F-value" of 1,00 implies the model is not significant relative to the noise. There is a
47,89 % chance that a "Model F-value" this large could occur due to noise. Values of "Prob > F" less than 0,0500 indicate model terms are significant. In this case there are no significant model terms.
Values greater than 0,1000 indicate the model terms are not significant. If there are many insignificant model terms (not counting those required to support hierarchy), model reduction may improve your model,
132
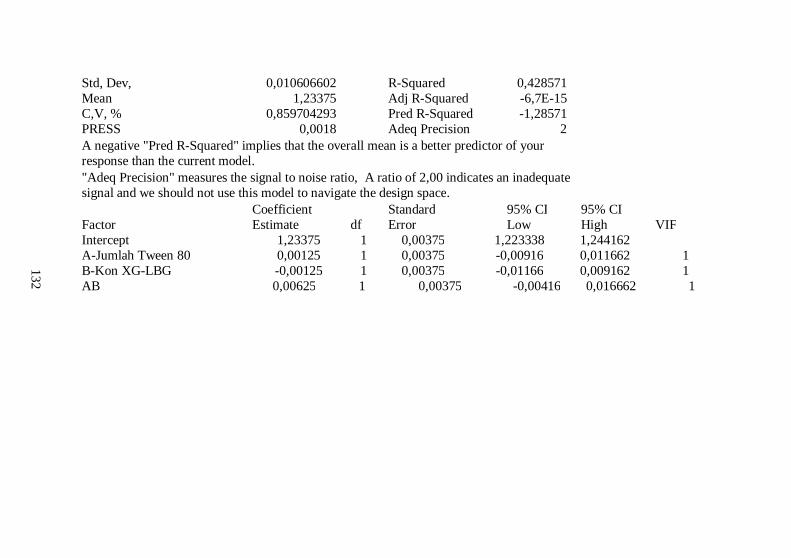
Std, Dev, 0,010606602
R-Squared 0,428571 Mean 1,23375
Adj R-Squared -6,7E-15
C,V, % 0,859704293
Pred R-Squared -1,28571 PRESS 0,0018
Adeq Precision 2
A negative "Pred R-Squared" implies that the overall mean is a better predictor of your response than the current model.
"Adeq Precision" measures the signal to noise ratio, A ratio of 2,00 indicates an inadequate signal and we should not use this model to navigate the design space.
Coefficient
Standard 95% CI 95% CI Factor Estimate df Error Low High VIF
Intercept 1,23375 1 0,00375 1,223338 1,244162 A-Jumlah Tween 80 0,00125 1 0,00375 -0,00916 0,011662 1
B-Kon XG-LBG -0,00125 1 0,00375 -0,01166 0,009162 1 AB 0,00625 1 0,00375 -0,00416 0,016662 1
133
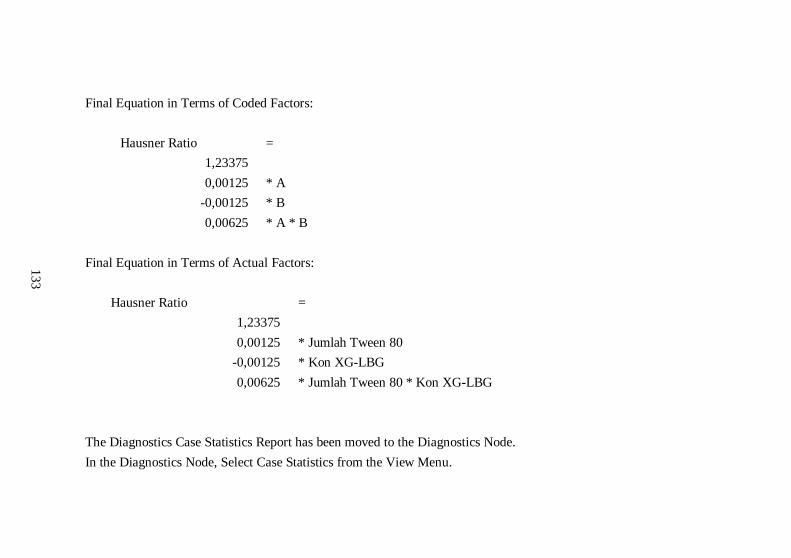
Final Equation in Terms of Coded Factors:
Hausner Ratio =
1,23375
0,00125 * A
-0,00125 * B
0,00625 * A * B
Final Equation in Terms of Actual Factors:
Hausner Ratio =
1,23375
0,00125 * Jumlah Tween 80
-0,00125 * Kon XG-LBG
0,00625 * Jumlah Tween 80 * Kon XG-LBG
The Diagnostics Case Statistics Report has been moved to the Diagnostics Node. In the Diagnostics Node, Select Case Statistics from the View Menu.
134
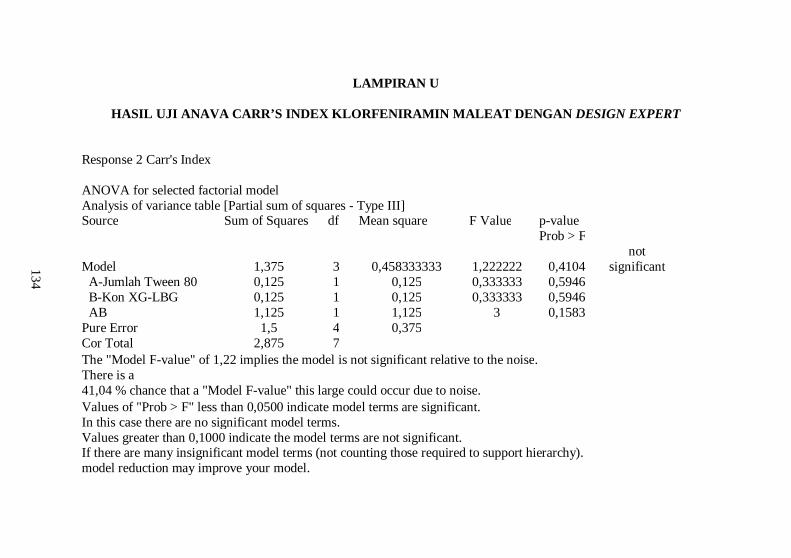
LAMPIRAN U
HASIL UJI ANAVA CARR’S INDEX KLORFENIRAMIN MALEAT DENGAN DESIGN EXPERT Response 2 Carr's Index
ANOVA for selected factorial model Analysis of variance table [Partial sum of squares - Type III]
Source Sum of Squares df Mean square F Value p-value
Prob > F
Model 1,375 3 0,458333333 1,222222 0,4104
not significant
A-Jumlah Tween 80 0,125 1 0,125 0,333333 0,5946 B-Kon XG-LBG 0,125 1 0,125 0,333333 0,5946 AB 1,125 1 1,125 3 0,1583 Pure Error 1,5 4 0,375
Cor Total 2,875 7 The "Model F-value" of 1,22 implies the model is not significant relative to the noise.
There is a 41,04 % chance that a "Model F-value" this large could occur due to noise. Values of "Prob > F" less than 0,0500 indicate model terms are significant. In this case there are no significant model terms.
Values greater than 0,1000 indicate the model terms are not significant. If there are many insignificant model terms (not counting those required to support hierarchy). model reduction may improve your model.
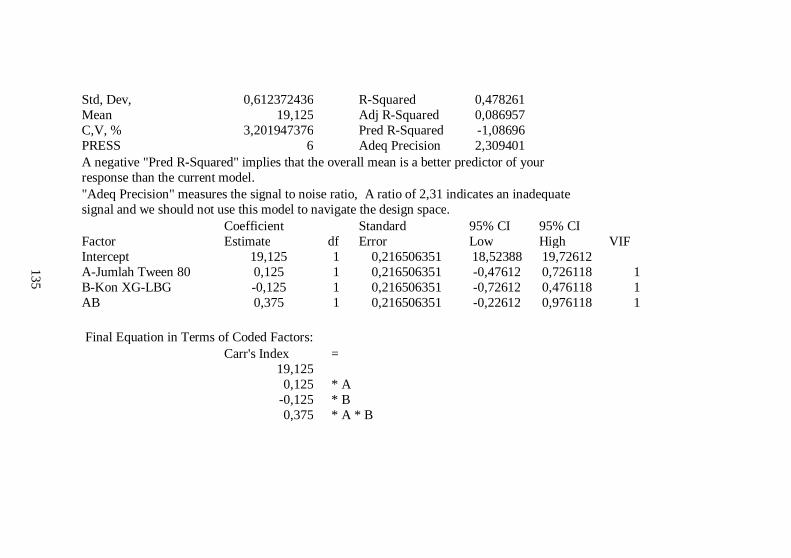
135
Std, Dev, 0,612372436
R-Squared 0,478261
Mean 19,125
Adj R-Squared 0,086957 C,V, % 3,201947376
Pred R-Squared -1,08696
PRESS 6
Adeq Precision 2,309401 A negative "Pred R-Squared" implies that the overall mean is a better predictor of your
response than the current model. "Adeq Precision" measures the signal to noise ratio, A ratio of 2,31 indicates an inadequate
signal and we should not use this model to navigate the design space.
Coefficient
Standard 95% CI 95% CI Factor Estimate df Error Low High VIF
Intercept 19,125 1 0,216506351 18,52388 19,72612 A-Jumlah Tween 80 0,125 1 0,216506351 -0,47612 0,726118 1
B-Kon XG-LBG -0,125 1 0,216506351 -0,72612 0,476118 1 AB 0,375 1 0,216506351 -0,22612 0,976118 1 Final Equation in Terms of Coded Factors:
Carr's Index =
19,125
0,125 * A
-0,125 * B
0,375 * A * B
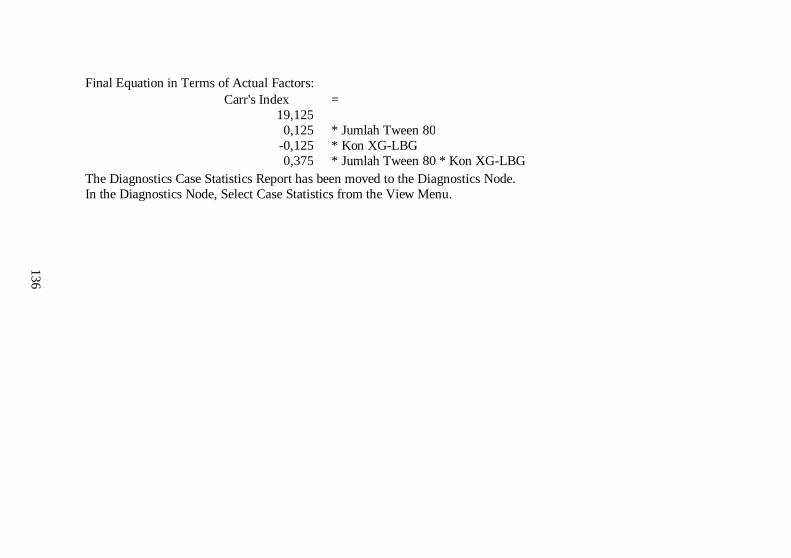
136
Final Equation in Terms of Actual Factors:
Carr's Index =
19,125
0,125 * Jumlah Tween 80
-0,125 * Kon XG-LBG
0,375 * Jumlah Tween 80 * Kon XG-LBG The Diagnostics Case Statistics Report has been moved to the Diagnostics Node.
In the Diagnostics Node, Select Case Statistics from the View Menu.
137
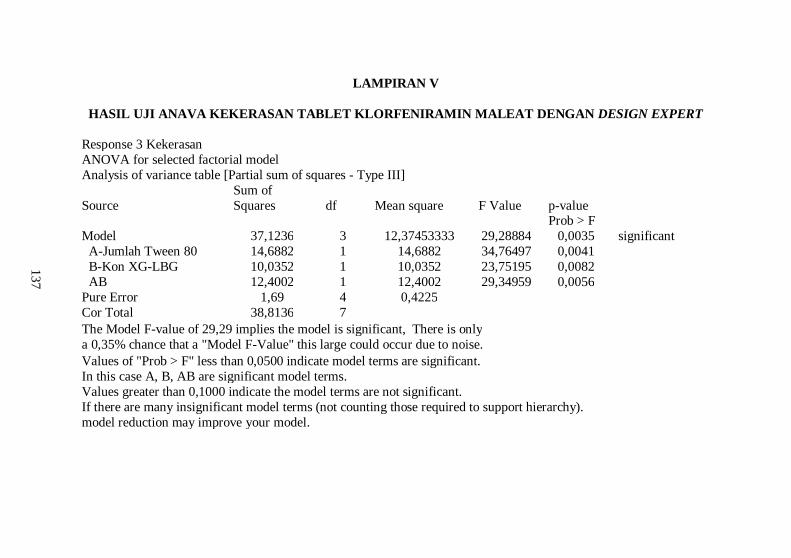
LAMPIRAN V
HASIL UJI ANAVA KEKERASAN TABLET KLORFENIRAMIN MALEAT DENGAN DESIGN EXPERT
Response 3 Kekerasan ANOVA for selected factorial model
Analysis of variance table [Partial sum of squares - Type III]
Source Sum of Squares df Mean square F Value p-value
Prob > F Model 37,1236 3 12,37453333 29,28884 0,0035 significant
A-Jumlah Tween 80 14,6882 1 14,6882 34,76497 0,0041 B-Kon XG-LBG 10,0352 1 10,0352 23,75195 0,0082 AB 12,4002 1 12,4002 29,34959 0,0056 Pure Error 1,69 4 0,4225
Cor Total 38,8136 7 The Model F-value of 29,29 implies the model is significant, There is only
a 0,35% chance that a "Model F-Value" this large could occur due to noise. Values of "Prob > F" less than 0,0500 indicate model terms are significant. In this case A, B, AB are significant model terms.
Values greater than 0,1000 indicate the model terms are not significant. If there are many insignificant model terms (not counting those required to support hierarchy). model reduction may improve your model.
138
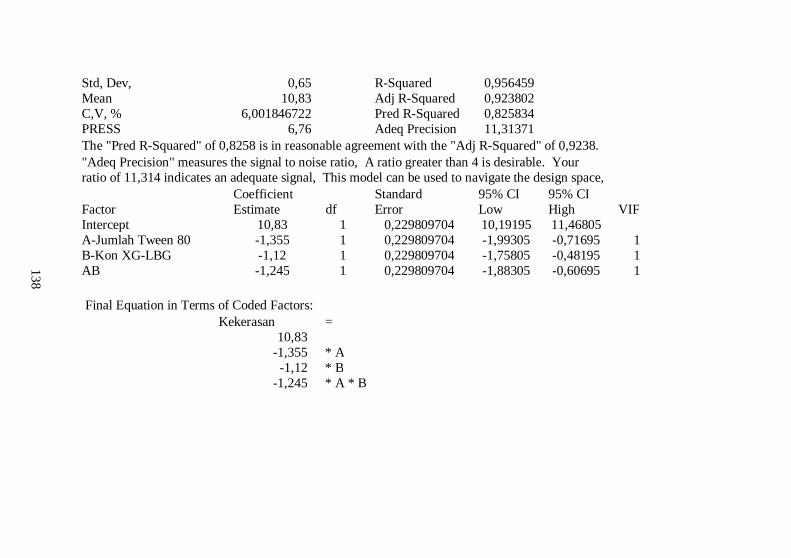
Std, Dev, 0,65
R-Squared 0,956459 Mean 10,83
Adj R-Squared 0,923802
C,V, % 6,001846722
Pred R-Squared 0,825834 PRESS 6,76
Adeq Precision 11,31371
The "Pred R-Squared" of 0,8258 is in reasonable agreement with the "Adj R-Squared" of 0,9238. "Adeq Precision" measures the signal to noise ratio, A ratio greater than 4 is desirable. Your ratio of 11,314 indicates an adequate signal, This model can be used to navigate the design space,
Coefficient
Standard 95% CI 95% CI Factor Estimate df Error Low High VIF
Intercept 10,83 1 0,229809704 10,19195 11,46805 A-Jumlah Tween 80 -1,355 1 0,229809704 -1,99305 -0,71695 1
B-Kon XG-LBG -1,12 1 0,229809704 -1,75805 -0,48195 1 AB -1,245 1 0,229809704 -1,88305 -0,60695 1 Final Equation in Terms of Coded Factors:
Kekerasan =
10,83
-1,355 * A
-1,12 * B
-1,245 * A * B
139
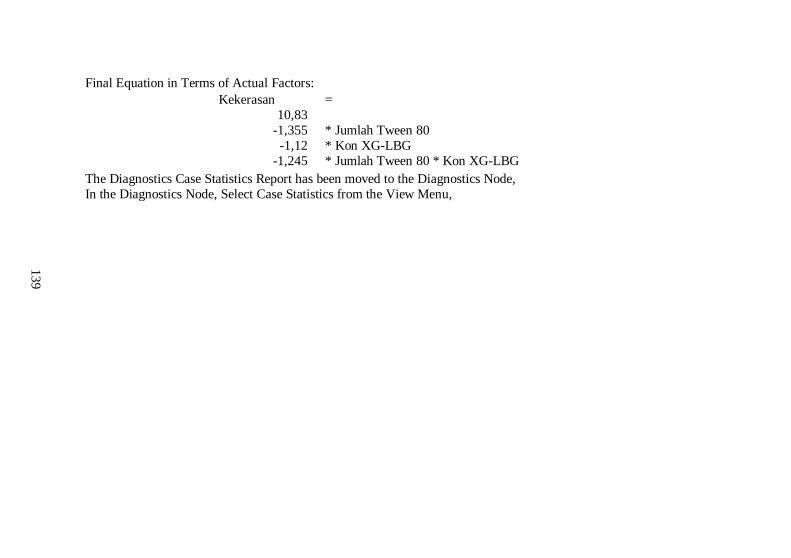
Final Equation in Terms of Actual Factors:
Kekerasan =
10,83
-1,355 * Jumlah Tween 80
-1,12 * Kon XG-LBG
-1,245 * Jumlah Tween 80 * Kon XG-LBG The Diagnostics Case Statistics Report has been moved to the Diagnostics Node,
In the Diagnostics Node, Select Case Statistics from the View Menu,
140
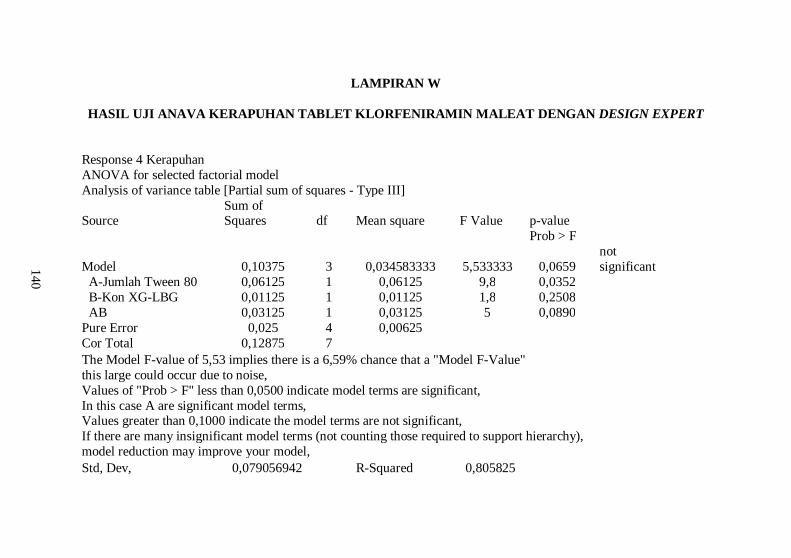
LAMPIRAN W
HASIL UJI ANAVA KERAPUHAN TABLET KLORFENIRAMIN MALEAT DENGAN DESIGN EXPERT Response 4 Kerapuhan
ANOVA for selected factorial model Analysis of variance table [Partial sum of squares - Type III]
Source
Sum of Squares df Mean square F Value p-value
Prob > F
Model 0,10375 3 0,034583333 5,533333 0,0659 not significant
A-Jumlah Tween 80 0,06125 1 0,06125 9,8 0,0352 B-Kon XG-LBG 0,01125 1 0,01125 1,8 0,2508 AB 0,03125 1 0,03125 5 0,0890 Pure Error 0,025 4 0,00625
Cor Total 0,12875 7 The Model F-value of 5,53 implies there is a 6,59% chance that a "Model F-Value"
this large could occur due to noise, Values of "Prob > F" less than 0,0500 indicate model terms are significant,
In this case A are significant model terms, Values greater than 0,1000 indicate the model terms are not significant,
If there are many insignificant model terms (not counting those required to support hierarchy), model reduction may improve your model,
Std, Dev, 0,079056942
R-Squared 0,805825
141
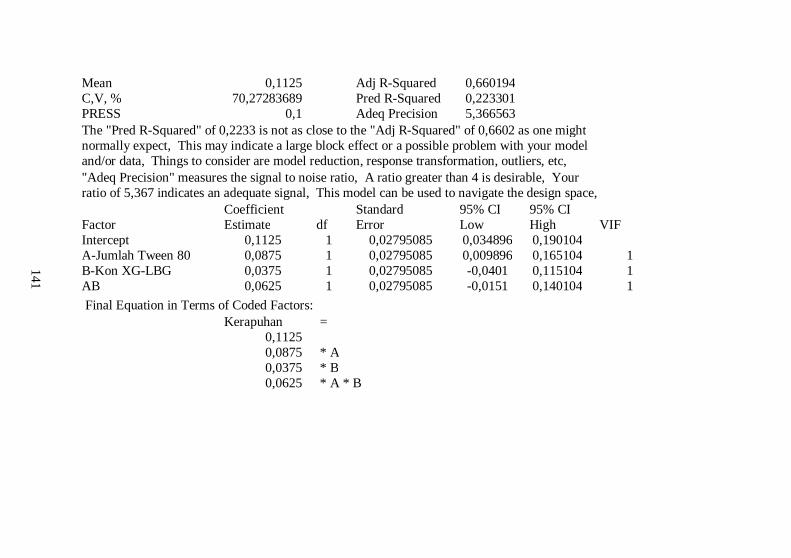
Mean 0,1125
Adj R-Squared 0,660194 C,V, % 70,27283689
Pred R-Squared 0,223301
PRESS 0,1
Adeq Precision 5,366563 The "Pred R-Squared" of 0,2233 is not as close to the "Adj R-Squared" of 0,6602 as one might
normally expect, This may indicate a large block effect or a possible problem with your model and/or data, Things to consider are model reduction, response transformation, outliers, etc, "Adeq Precision" measures the signal to noise ratio, A ratio greater than 4 is desirable, Your ratio of 5,367 indicates an adequate signal, This model can be used to navigate the design space,
Coefficient
Standard 95% CI 95% CI Factor Estimate df Error Low High VIF
Intercept 0,1125 1 0,02795085 0,034896 0,190104 A-Jumlah Tween 80 0,0875 1 0,02795085 0,009896 0,165104 1
B-Kon XG-LBG 0,0375 1 0,02795085 -0,0401 0,115104 1 AB 0,0625 1 0,02795085 -0,0151 0,140104 1 Final Equation in Terms of Coded Factors:
Kerapuhan =
0,1125
0,0875 * A
0,0375 * B
0,0625 * A * B
142
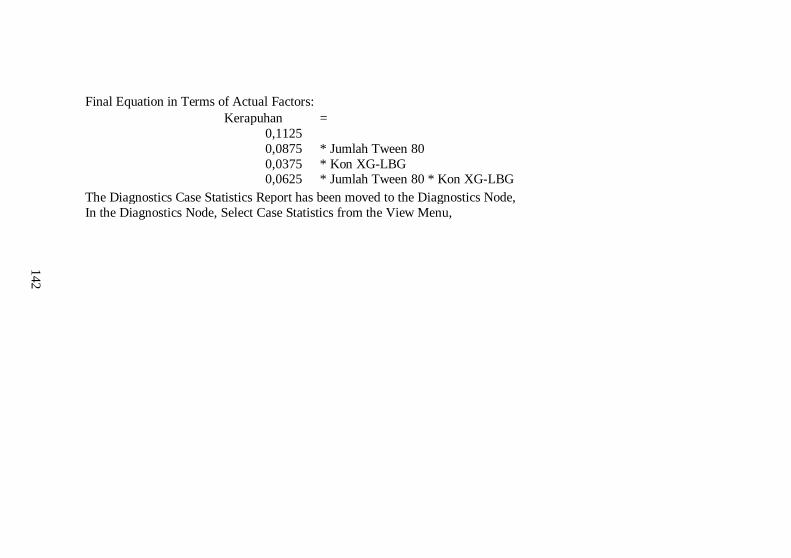
Final Equation in Terms of Actual Factors:
Kerapuhan =
0,1125
0,0875 * Jumlah Tween 80
0,0375 * Kon XG-LBG
0,0625 * Jumlah Tween 80 * Kon XG-LBG The Diagnostics Case Statistics Report has been moved to the Diagnostics Node,
In the Diagnostics Node, Select Case Statistics from the View Menu,
143
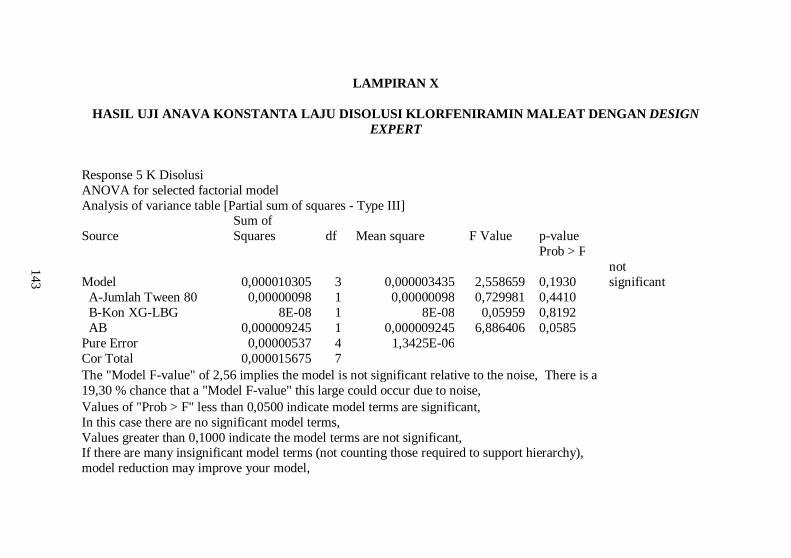
LAMPIRAN X
HASIL UJI ANAVA KONSTANTA LAJU DISOLUSI KLORFENIRAMIN MALEAT DENGAN DESIGN EXPERT
Response 5 K Disolusi
ANOVA for selected factorial model Analysis of variance table [Partial sum of squares - Type III]
Source
Sum of Squares df Mean square F Value p-value
Prob > F
Model 0,000010305 3 0,000003435 2,558659 0,1930 not significant
A-Jumlah Tween 80 0,00000098 1 0,00000098 0,729981 0,4410 B-Kon XG-LBG 8E-08 1 8E-08 0,05959 0,8192 AB 0,000009245 1 0,000009245 6,886406 0,0585 Pure Error 0,00000537 4 1,3425E-06
Cor Total 0,000015675 7 The "Model F-value" of 2,56 implies the model is not significant relative to the noise, There is a
19,30 % chance that a "Model F-value" this large could occur due to noise, Values of "Prob > F" less than 0,0500 indicate model terms are significant, In this case there are no significant model terms,
Values greater than 0,1000 indicate the model terms are not significant, If there are many insignificant model terms (not counting those required to support hierarchy), model reduction may improve your model,
144
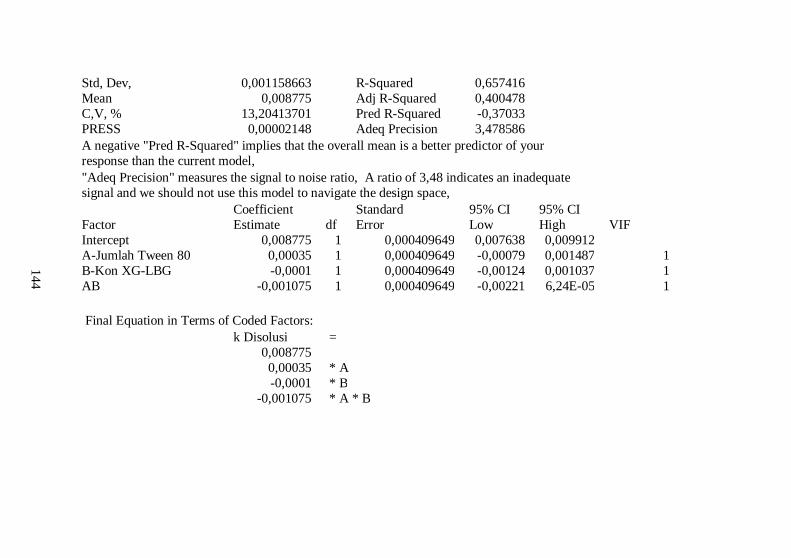
Std, Dev, 0,001158663
R-Squared 0,657416 Mean 0,008775
Adj R-Squared 0,400478
C,V, % 13,20413701
Pred R-Squared -0,37033 PRESS 0,00002148
Adeq Precision 3,478586
A negative "Pred R-Squared" implies that the overall mean is a better predictor of your response than the current model,
"Adeq Precision" measures the signal to noise ratio, A ratio of 3,48 indicates an inadequate signal and we should not use this model to navigate the design space,
Coefficient
Standard 95% CI 95% CI Factor Estimate df Error Low High VIF
Intercept 0,008775 1 0,000409649 0,007638 0,009912 A-Jumlah Tween 80 0,00035 1 0,000409649 -0,00079 0,001487 1
B-Kon XG-LBG -0,0001 1 0,000409649 -0,00124 0,001037 1 AB -0,001075 1 0,000409649 -0,00221 6,24E-05 1 Final Equation in Terms of Coded Factors:
k Disolusi =
0,008775
0,00035 * A
-0,0001 * B
-0,001075 * A * B
145
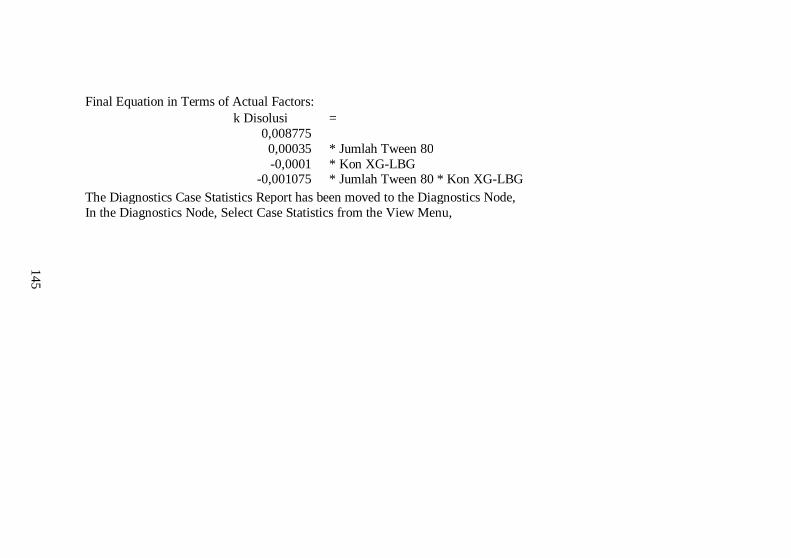
Final Equation in Terms of Actual Factors:
k Disolusi =
0,008775
0,00035 * Jumlah Tween 80
-0,0001 * Kon XG-LBG
-0,001075 * Jumlah Tween 80 * Kon XG-LBG The Diagnostics Case Statistics Report has been moved to the Diagnostics Node,
In the Diagnostics Node, Select Case Statistics from the View Menu,
146
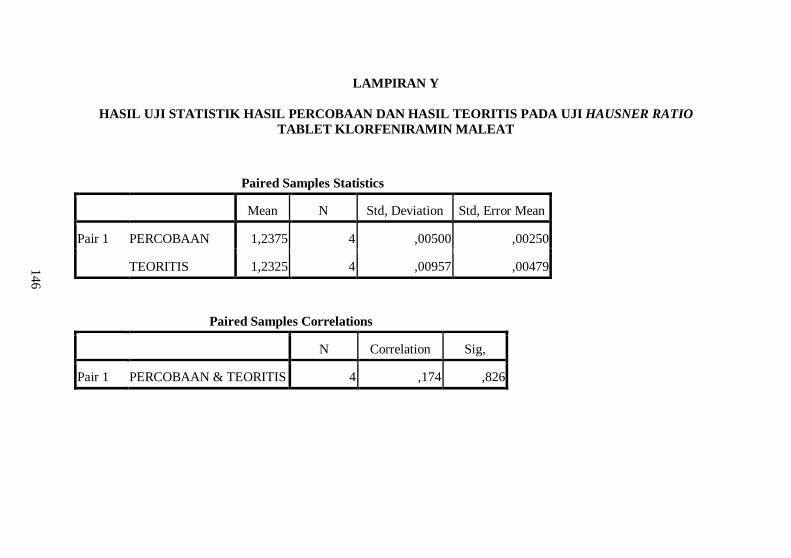
LAMPIRAN Y
HASIL UJI STATISTIK HASIL PERCOBAAN DAN HASIL TEORITIS PADA UJI HAUSNER RATIO TABLET KLORFENIRAMIN MALEAT
Paired Samples Statistics Mean N Std, Deviation Std, Error Mean
Pair 1 PERCOBAAN 1,2375 4 ,00500 ,00250
TEORITIS 1,2325 4 ,00957 ,00479
Paired Samples Correlations N Correlation Sig,
Pair 1 PERCOBAAN & TEORITIS 4 ,174 ,826
147
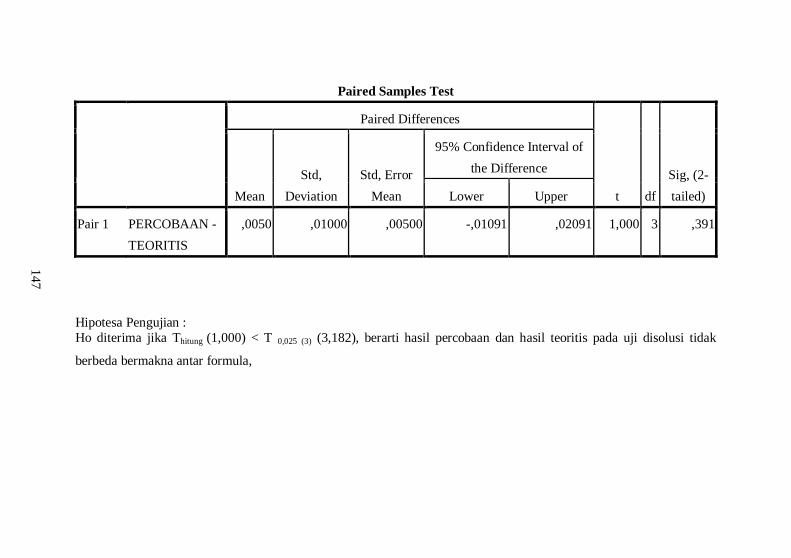
Paired Samples Test Paired Differences
t df Sig, (2-tailed)
Mean Std,
Deviation Std, Error
Mean
95% Confidence Interval of the Difference
Lower Upper
Pair 1 PERCOBAAN - TEORITIS
,0050 ,01000 ,00500 -,01091 ,02091 1,000 3 ,391
Hipotesa Pengujian : Ho diterima jika Thitung (1,000) < T 0,025 (3) (3,182), berarti hasil percobaan dan hasil teoritis pada uji disolusi tidak
berbeda bermakna antar formula,
148
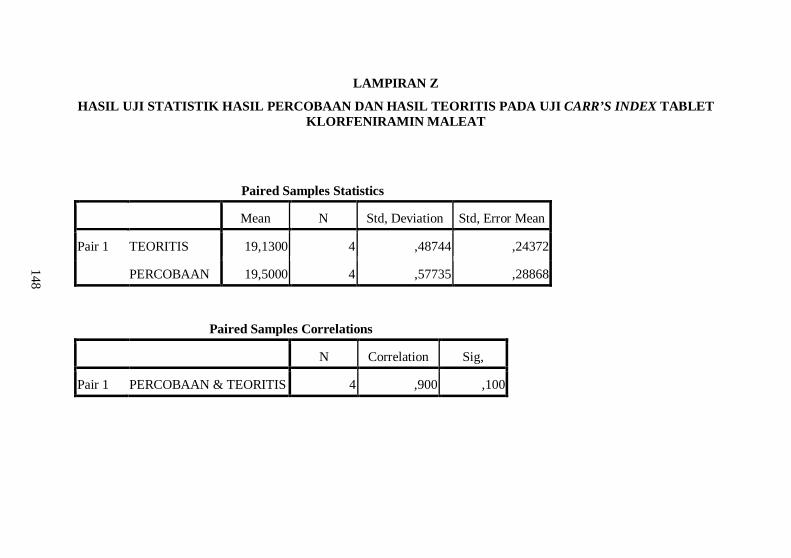
LAMPIRAN Z
HASIL UJI STATISTIK HASIL PERCOBAAN DAN HASIL TEORITIS PADA UJI CARR’S INDEX TABLET KLORFENIRAMIN MALEAT
Paired Samples Statistics Mean N Std, Deviation Std, Error Mean
Pair 1 TEORITIS 19,1300 4 ,48744 ,24372
PERCOBAAN 19,5000 4 ,57735 ,28868
Paired Samples Correlations N Correlation Sig,
Pair 1 PERCOBAAN & TEORITIS 4 ,900 ,100
149
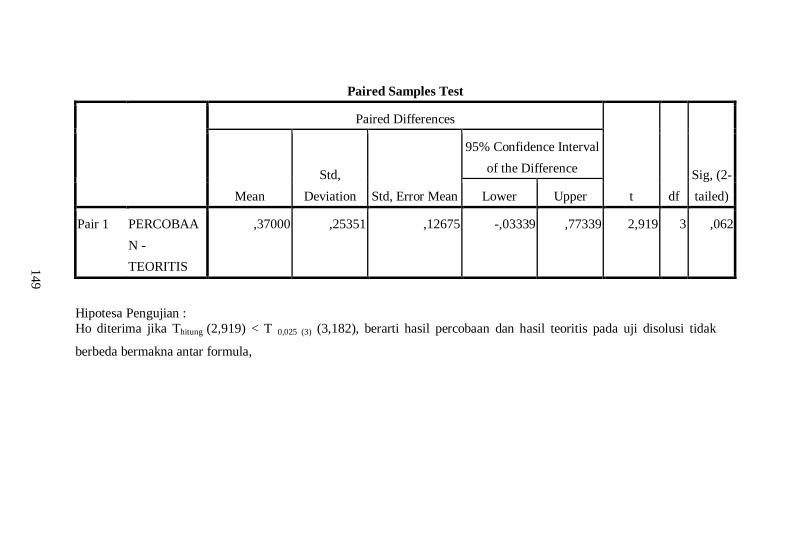
Paired Samples Test Paired Differences
t df Sig, (2-tailed)
Mean Std,
Deviation Std, Error Mean
95% Confidence Interval of the Difference
Lower Upper
Pair 1 PERCOBAAN - TEORITIS
,37000 ,25351 ,12675 -,03339 ,77339 2,919 3 ,062
Hipotesa Pengujian : Ho diterima jika Thitung (2,919) < T 0,025 (3) (3,182), berarti hasil percobaan dan hasil teoritis pada uji disolusi tidak
berbeda bermakna antar formula,
150
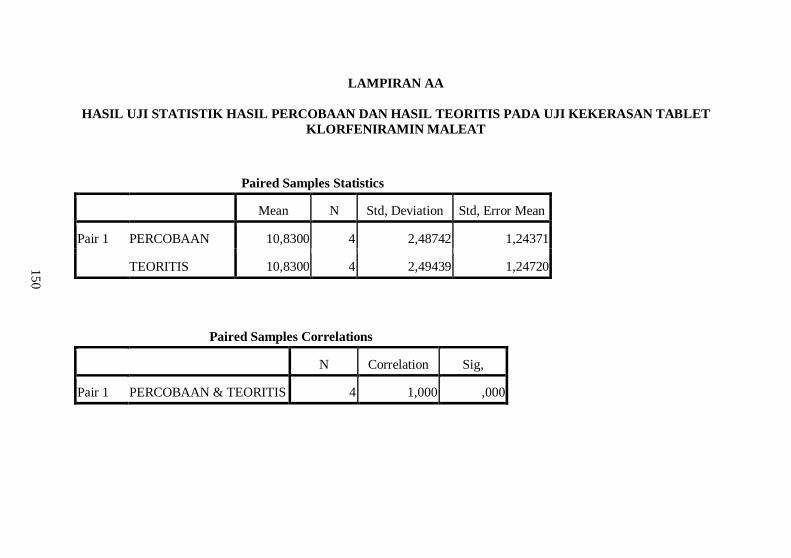
LAMPIRAN AA
HASIL UJI STATISTIK HASIL PERCOBAAN DAN HASIL TEORITIS PADA UJI KEKERASAN TABLET KLORFENIRAMIN MALEAT
Paired Samples Statistics Mean N Std, Deviation Std, Error Mean
Pair 1 PERCOBAAN 10,8300 4 2,48742 1,24371
TEORITIS 10,8300 4 2,49439 1,24720
Paired Samples Correlations N Correlation Sig,
Pair 1 PERCOBAAN & TEORITIS 4 1,000 ,000
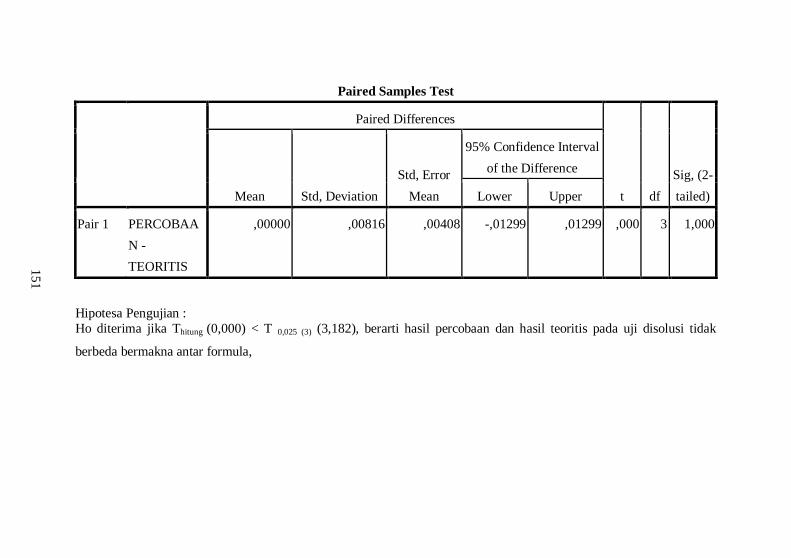
151
Paired Samples Test Paired Differences
t df Sig, (2-tailed)
Mean Std, Deviation Std, Error
Mean
95% Confidence Interval of the Difference
Lower Upper
Pair 1 PERCOBAAN - TEORITIS
,00000 ,00816 ,00408 -,01299 ,01299 ,000 3 1,000
Hipotesa Pengujian : Ho diterima jika Thitung (0,000) < T 0,025 (3) (3,182), berarti hasil percobaan dan hasil teoritis pada uji disolusi tidak
berbeda bermakna antar formula,
152
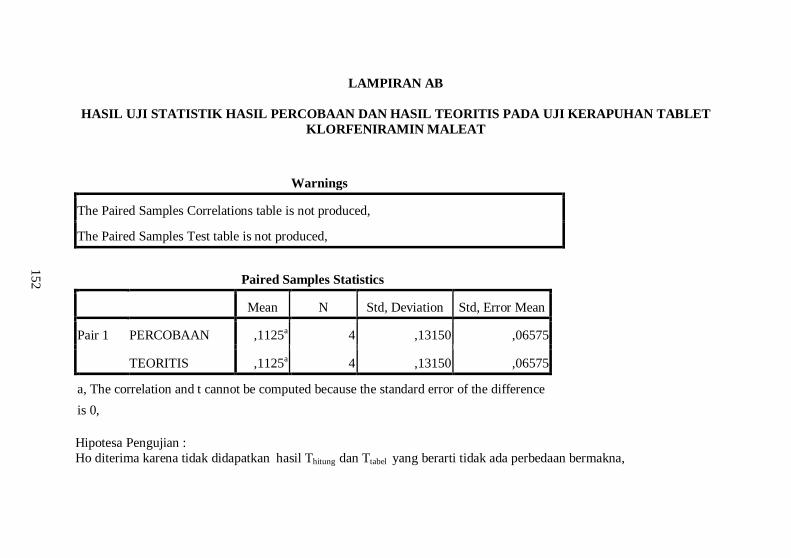
LAMPIRAN AB
HASIL UJI STATISTIK HASIL PERCOBAAN DAN HASIL TEORITIS PADA UJI KERAPUHAN TABLET KLORFENIRAMIN MALEAT
Warnings
The Paired Samples Correlations table is not produced,
The Paired Samples Test table is not produced,
Paired Samples Statistics Mean N Std, Deviation Std, Error Mean
Pair 1 PERCOBAAN ,1125a 4 ,13150 ,06575
TEORITIS ,1125a 4 ,13150 ,06575
a, The correlation and t cannot be computed because the standard error of the difference is 0, Hipotesa Pengujian : Ho diterima karena tidak didapatkan hasil Thitung dan Ttabel yang berarti tidak ada perbedaan bermakna,
153
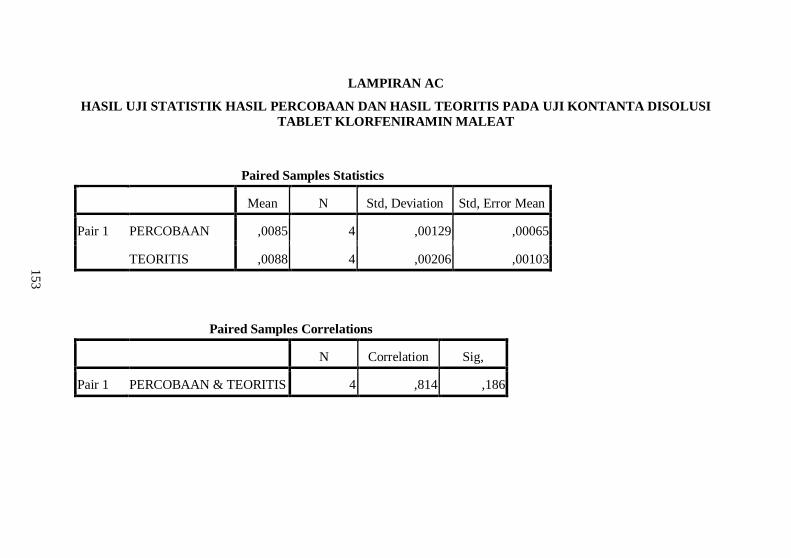
LAMPIRAN AC
HASIL UJI STATISTIK HASIL PERCOBAAN DAN HASIL TEORITIS PADA UJI KONTANTA DISOLUSI TABLET KLORFENIRAMIN MALEAT
Paired Samples Statistics Mean N Std, Deviation Std, Error Mean
Pair 1 PERCOBAAN ,0085 4 ,00129 ,00065
TEORITIS ,0088 4 ,00206 ,00103
Paired Samples Correlations N Correlation Sig,
Pair 1 PERCOBAAN & TEORITIS 4 ,814 ,186
154
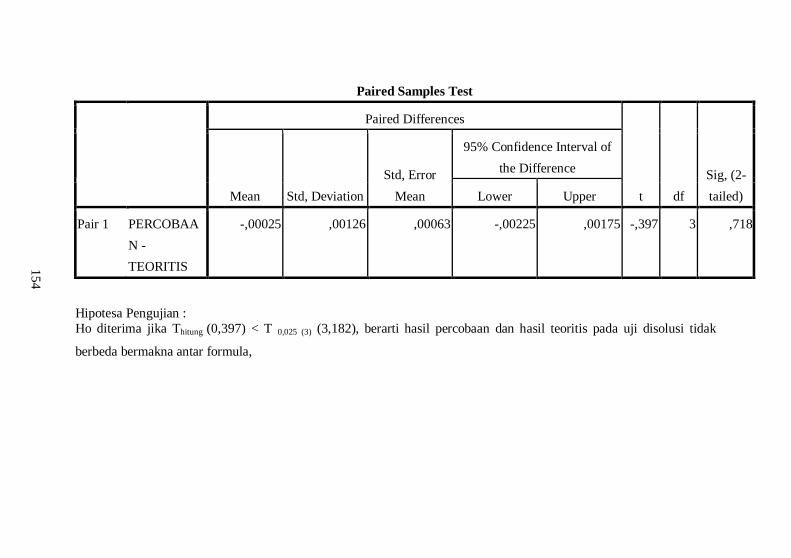
Paired Samples Test Paired Differences
t df Sig, (2-tailed)
Mean Std, Deviation Std, Error
Mean
95% Confidence Interval of the Difference
Lower Upper
Pair 1 PERCOBAAN - TEORITIS
-,00025 ,00126 ,00063 -,00225 ,00175 -,397 3 ,718
Hipotesa Pengujian : Ho diterima jika Thitung (0,397) < T 0,025 (3) (3,182), berarti hasil percobaan dan hasil teoritis pada uji disolusi tidak
berbeda bermakna antar formula,