Embed Size (px)
Citation preview

A-1
A-1.Member List of the Study Team Member List for Phase-1 Field Survey
Name Position Organization Mr. Noriaki NISHIMIYA Leader Executive Advisor to
the Director General, Economic Infrastructure Department, JICA
Mr. Shinichi MATSUURA Procurement Management Planning JICS1) Mr. Ryuji OGATA Planning Management Water Resources
Management Division 1, Global Environment Department, JICA
Mr. Hirofumi SANO Chief Consultant/Water Supply Planning Mr. Tetsuo IZAWA Facility Plan and Design (Plant) 1 Mr. Yoshihiro AKIYAMA Facility Plan and Design (Plant) 2 Mr. Takeo YAMAGUCHI Facility Plan and Design (Construction) Mr. Ronald J. PETERSON Operation and Maintenance Plan/Financial Analysis Mr. Ravi PEREIRA Environment and Social Considerations Mr. Yoshihiro KIRISHIMA Construction Schedule/Cost Estimation/Tender Document
NJS Consultants Co., Ltd
1) JICS: JAPAN INTERNATIONAL COOPERATION SYSTEM
A-2
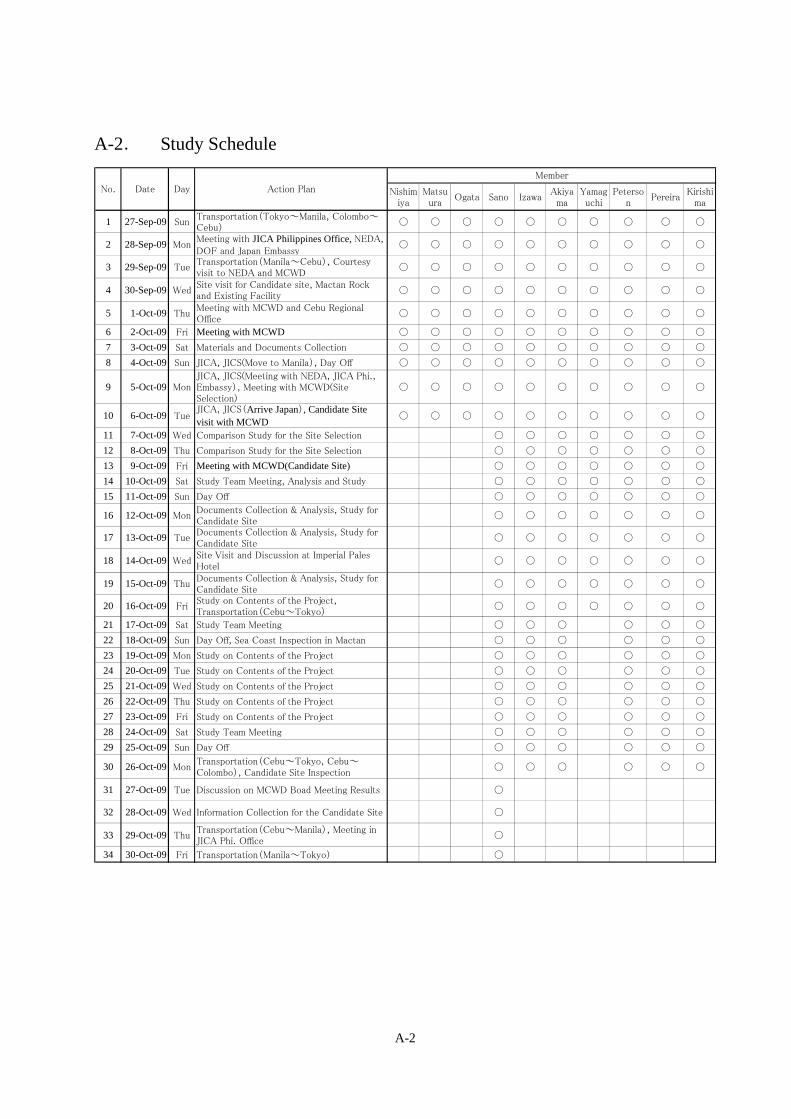
A-2. Study Schedule
Nishimiya
Matsuura
Ogata Sano IzawaAkiyama
Yamaguchi
Peterson
PereiraKirishi
ma
1 27-Sep-09 SunTransportation(Tokyo~Manila, Colombo~Cebu)
○ ○ ○ ○ ○ ○ ○ ○ ○ ○
2 28-Sep-09 MonMeeting with JICA Philippines Office, NEDA,DOF and Japan Embassy
○ ○ ○ ○ ○ ○ ○ ○ ○ ○
3 29-Sep-09 TueTransportation(Manila~Cebu), Courtesyvisit to NEDA and MCWD
○ ○ ○ ○ ○ ○ ○ ○ ○ ○
4 30-Sep-09 WedSite visit for Candidate site, Mactan Rockand Existing Facility
○ ○ ○ ○ ○ ○ ○ ○ ○ ○
5 1-Oct-09 ThuMeeting with MCWD and Cebu RegionalOffice
○ ○ ○ ○ ○ ○ ○ ○ ○ ○
6 2-Oct-09 Fri Meeting with MCWD ○ ○ ○ ○ ○ ○ ○ ○ ○ ○
7 3-Oct-09 Sat Materials and Documents Collection ○ ○ ○ ○ ○ ○ ○ ○ ○ ○
8 4-Oct-09 Sun JICA, JICS(Move to Manila), Day Off ○ ○ ○ ○ ○ ○ ○ ○ ○ ○
9 5-Oct-09 MonJICA, JICS(Meeting with NEDA, JICA Phi.,Embassy), Meeting with MCWD(SiteSelection)
○ ○ ○ ○ ○ ○ ○ ○ ○ ○
10 6-Oct-09 TueJICA, JICS(Arrive Japan), Candidate Sitevisit with MCWD ○ ○ ○ ○ ○ ○ ○ ○ ○ ○
11 7-Oct-09 Wed Comparison Study for the Site Selection ○ ○ ○ ○ ○ ○ ○
12 8-Oct-09 Thu Comparison Study for the Site Selection ○ ○ ○ ○ ○ ○ ○
13 9-Oct-09 Fri Meeting with MCWD(Candidate Site) ○ ○ ○ ○ ○ ○ ○
14 10-Oct-09 Sat Study Team Meeting, Analysis and Study ○ ○ ○ ○ ○ ○ ○
15 11-Oct-09 Sun Day Off ○ ○ ○ ○ ○ ○ ○
16 12-Oct-09 MonDocuments Collection & Analysis, Study forCandidate Site
○ ○ ○ ○ ○ ○ ○
17 13-Oct-09 TueDocuments Collection & Analysis, Study forCandidate Site
○ ○ ○ ○ ○ ○ ○
18 14-Oct-09 WedSite Visit and Discussion at Imperial PalesHotel
○ ○ ○ ○ ○ ○ ○
19 15-Oct-09 ThuDocuments Collection & Analysis, Study forCandidate Site
○ ○ ○ ○ ○ ○ ○
20 16-Oct-09 FriStudy on Contents of the Project,Transportation(Cebu~Tokyo)
○ ○ ○ ○ ○ ○ ○
21 17-Oct-09 Sat Study Team Meeting ○ ○ ○ ○ ○ ○
22 18-Oct-09 Sun Day Off, Sea Coast Inspection in Mactan ○ ○ ○ ○ ○ ○
23 19-Oct-09 Mon Study on Contents of the Project ○ ○ ○ ○ ○ ○
24 20-Oct-09 Tue Study on Contents of the Project ○ ○ ○ ○ ○ ○
25 21-Oct-09 Wed Study on Contents of the Project ○ ○ ○ ○ ○ ○
26 22-Oct-09 Thu Study on Contents of the Project ○ ○ ○ ○ ○ ○
27 23-Oct-09 Fri Study on Contents of the Project ○ ○ ○ ○ ○ ○
28 24-Oct-09 Sat Study Team Meeting ○ ○ ○ ○ ○ ○
29 25-Oct-09 Sun Day Off ○ ○ ○ ○ ○ ○
30 26-Oct-09 MonTransportation(Cebu~Tokyo, Cebu~Colombo), Candidate Site Inspection
○ ○ ○ ○ ○ ○
31 27-Oct-09 Tue Discussion on MCWD Boad Meeting Results ○
32 28-Oct-09 Wed Information Collection for the Candidate Site ○
33 29-Oct-09 ThuTransportation(Cebu~Manila), Meeting inJICA Phi. Office
○
34 30-Oct-09 Fri Transportation(Manila~Tokyo) ○
No.
Member
Action PlanDayDate
A-3
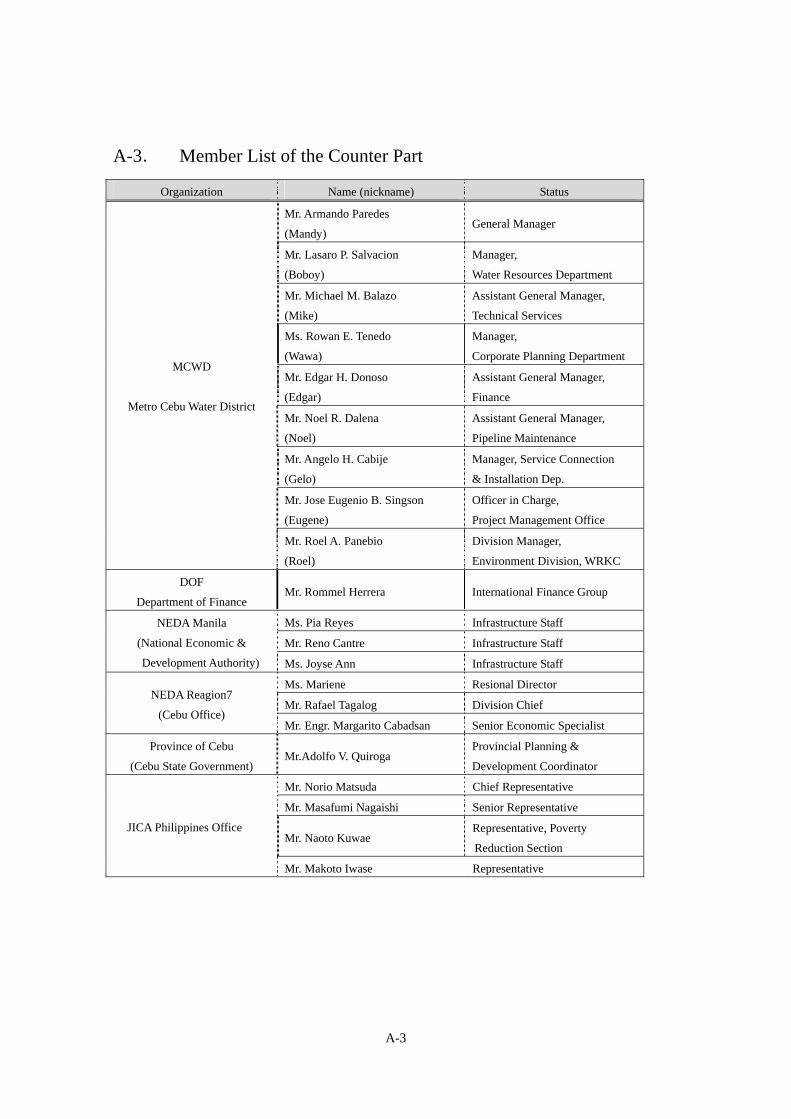
A-3. Member List of the Counter Part
Organization Name (nickname) Status
Mr. Armando Paredes
(Mandy) General Manager
Mr. Lasaro P. Salvacion
(Boboy)
Manager,
Water Resources Department
Mr. Michael M. Balazo
(Mike)
Assistant General Manager,
Technical Services
Ms. Rowan E. Tenedo
(Wawa)
Manager,
Corporate Planning Department
Mr. Edgar H. Donoso
(Edgar)
Assistant General Manager,
Finance
Mr. Noel R. Dalena
(Noel)
Assistant General Manager,
Pipeline Maintenance
Mr. Angelo H. Cabije
(Gelo)
Manager, Service Connection
& Installation Dep.
Mr. Jose Eugenio B. Singson
(Eugene)
Officer in Charge,
Project Management Office
MCWD
Metro Cebu Water District
Mr. Roel A. Panebio
(Roel)
Division Manager,
Environment Division, WRKC
DOF
Department of Finance Mr. Rommel Herrera International Finance Group
Ms. Pia Reyes Infrastructure Staff
Mr. Reno Cantre Infrastructure Staff
NEDA Manila
(National Economic &
Development Authority) Ms. Joyse Ann Infrastructure Staff
Ms. Mariene Resional Director
Mr. Rafael Tagalog Division Chief NEDA Reagion7
(Cebu Office) Mr. Engr. Margarito Cabadsan Senior Economic Specialist
Province of Cebu
(Cebu State Government) Mr.Adolfo V. Quiroga
Provincial Planning &
Development Coordinator
Mr. Norio Matsuda Chief Representative
Mr. Masafumi Nagaishi Senior Representative
Mr. Naoto Kuwae Representative, Poverty
Reduction Section
JICA Philippines Office
Mr. Makoto Iwase Representative

A-4. Minutes of Discussions(M/D)
Following Minutes of Discussions (M/D) was signed on 13th of October 2009 between JICA study
team and Philippine Side (MCWD) under mutual agreement.
A-4


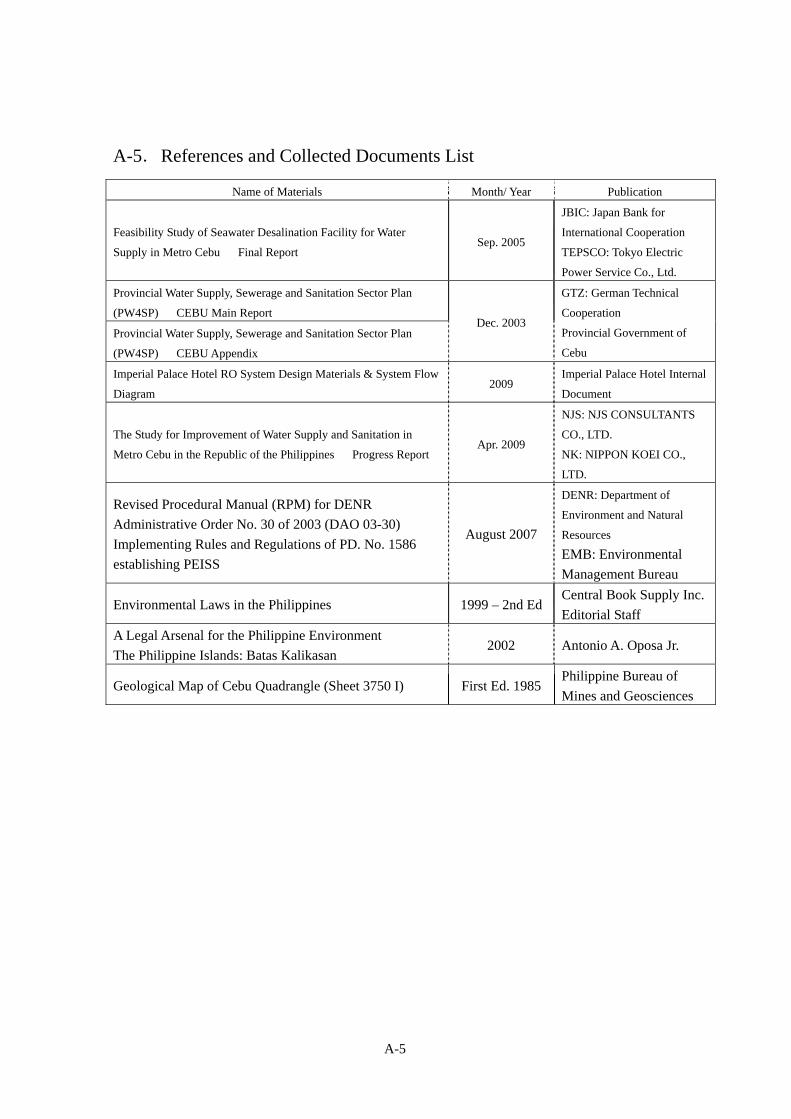
A-5.References and Collected Documents List
Name of Materials Month/ Year Publication
Feasibility Study of Seawater Desalination Facility for Water
Supply in Metro Cebu Final Report Sep. 2005
JBIC: Japan Bank for
International Cooperation
TEPSCO: Tokyo Electric
Power Service Co., Ltd.
Provincial Water Supply, Sewerage and Sanitation Sector Plan
(PW4SP) CEBU Main Report
Provincial Water Supply, Sewerage and Sanitation Sector Plan
(PW4SP) CEBU Appendix
Dec. 2003
GTZ: German Technical
Cooperation
Provincial Government of
Cebu
Imperial Palace Hotel RO System Design Materials & System Flow
Diagram 2009
Imperial Palace Hotel Internal
Document
The Study for Improvement of Water Supply and Sanitation in
Metro Cebu in the Republic of the Philippines Progress Report Apr. 2009
NJS: NJS CONSULTANTS
CO., LTD.
NK: NIPPON KOEI CO.,
LTD.
Revised Procedural Manual (RPM) for DENR Administrative Order No. 30 of 2003 (DAO 03-30) Implementing Rules and Regulations of PD. No. 1586 establishing PEISS
August 2007
DENR: Department of
Environment and Natural
Resources EMB: Environmental Management Bureau
Environmental Laws in the Philippines 1999 – 2nd EdCentral Book Supply Inc. Editorial Staff
A Legal Arsenal for the Philippine Environment The Philippine Islands: Batas Kalikasan
2002 Antonio A. Oposa Jr.
Geological Map of Cebu Quadrangle (Sheet 3750 I) First Ed. 1985 Philippine Bureau of Mines and Geosciences
A-5

A-6
A-6. Other Information and Specifications
A6-1 Specifications of Desalination Plant
Materials of Seawater Desalination
Public Health and the Environment World Health Organization Geneva 2007, Desalination
for Safe Water Supply Guidance for the Health and Environmental Aspects Applicable to
Desalination
RO Desalination Plant for Imperial Palace Hotel by Asian Industry Inc.
Technical Evaluation Committee, Study on Development of Seawater Desalination
Technology, Interim Report, October 1998
A6-2 Breakdown of Project Components
A6-3 Photographs of Site Investigation

A6-1-1
Materials of Seawater Desalination
【1】 Seawater Desalination Q & A Editorial Committee of Okinawa Prefectural Enterprise
Bureau, November 1994
• O/M cost of seawater desalination plant in Okinawa is approximately 170 Yen/m3; among
which the costs of power consumption, depression of invest cost, chemicals and membrane
replacement are 33, 28, 12, 11 %, respectively.
• pH of water produced by seawater desalination plant is low. Scaling does not occur because
its langelier index shows a big negative figure; which shows it corrosive and has the tendency
of generation of red water supply and distribution system including pipes and equipment. For
this reason, caustic soda is added to the production for pH adjustment. Furthermore, calcium
is also added because calcium hardness level in the production water is low.
• However, special post treatment is not necessary because the water treated in the next water
purification plant is hard water. Blending the production water with it makes the water with
good taste with appropriate hardness and alkalinity.
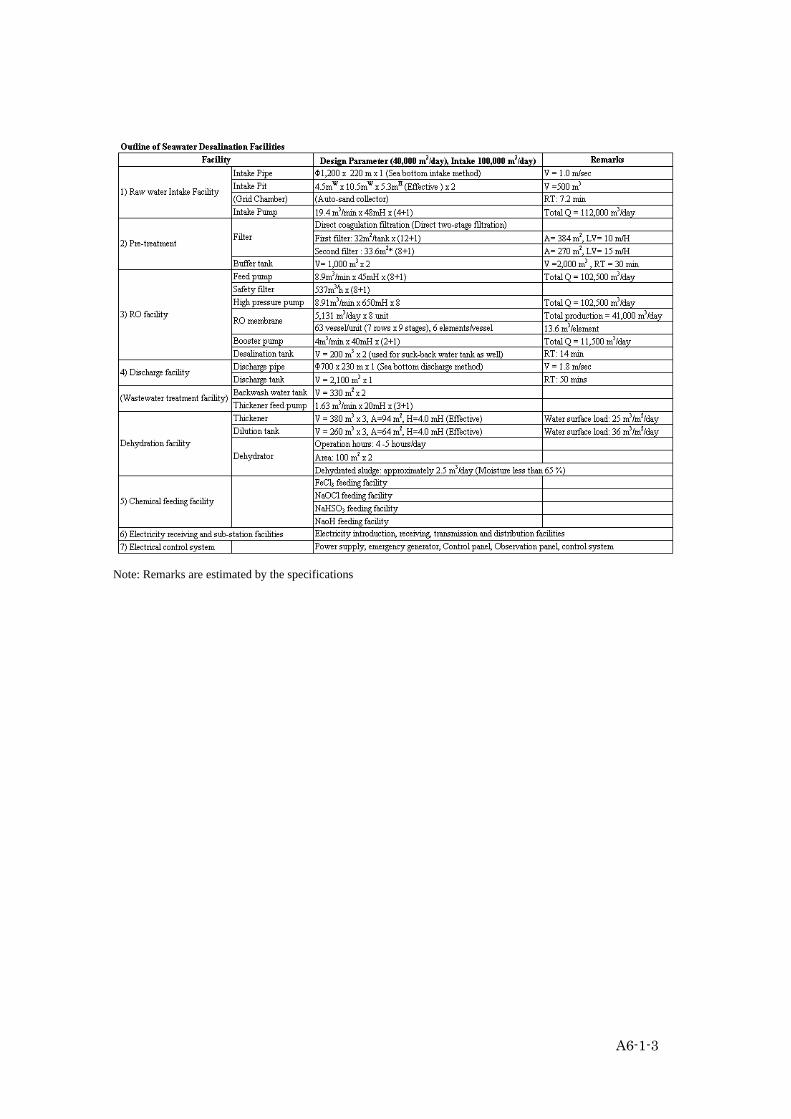
Outline of Seawater Desalination Plant
• Location Miyagi, Kutancho, Okinawa Prefecture
• Space Approx. 12,000 m2 (0.3m2/m3-capacity)
• Building space Approx. 9,900 m2 (Total floor space approx. 17,600 m2)
• Building RC and PC (Basement with four ground floors)
• Capacity of production water 40,000 m3/day
• Desalination process RO process
• Recover Approx. 40 %
• Membranes Spiral type aromatic polyamide composite (RO membrane)
• Receiving electricity Approx. 8,000 kW, special high voltage electricity receiving
(66 kV) according to supply regulations by Okinawa
Electric Power Company
• Seawater intake method Intake from sea bottom method
• Brine discharge method Diffusion to seawater method
• Total invest cost Approx. 34.7 billion Yen (Japanese Government subsidiary
rate 85 %) 86,750 Yen/m3/day

A6-1-2
2005 Water quality
Raw Seawater (RO Supply) Product water Removal Rate (%) TDS (mg/L) 34,800 278 99.20 Cl- (mg/L) 19,800 119 99.40 SO4
2- (mg/L) 2,490 5.9 99.76 Na (mg/L) 11,400 96.1 99.16 T-hardness (mg/L) 6,360 10 99.84 Conductivity (μS/cm) 50,800 456 99.10
RO membrane unit
• Approximately 5,000m3-product/day/unit
• 1 unit 63 RO module
• 1 module 6 elements below
A6-1-3
Note: Remarks are estimated by the specifications
A6-1-4
A6-1-5
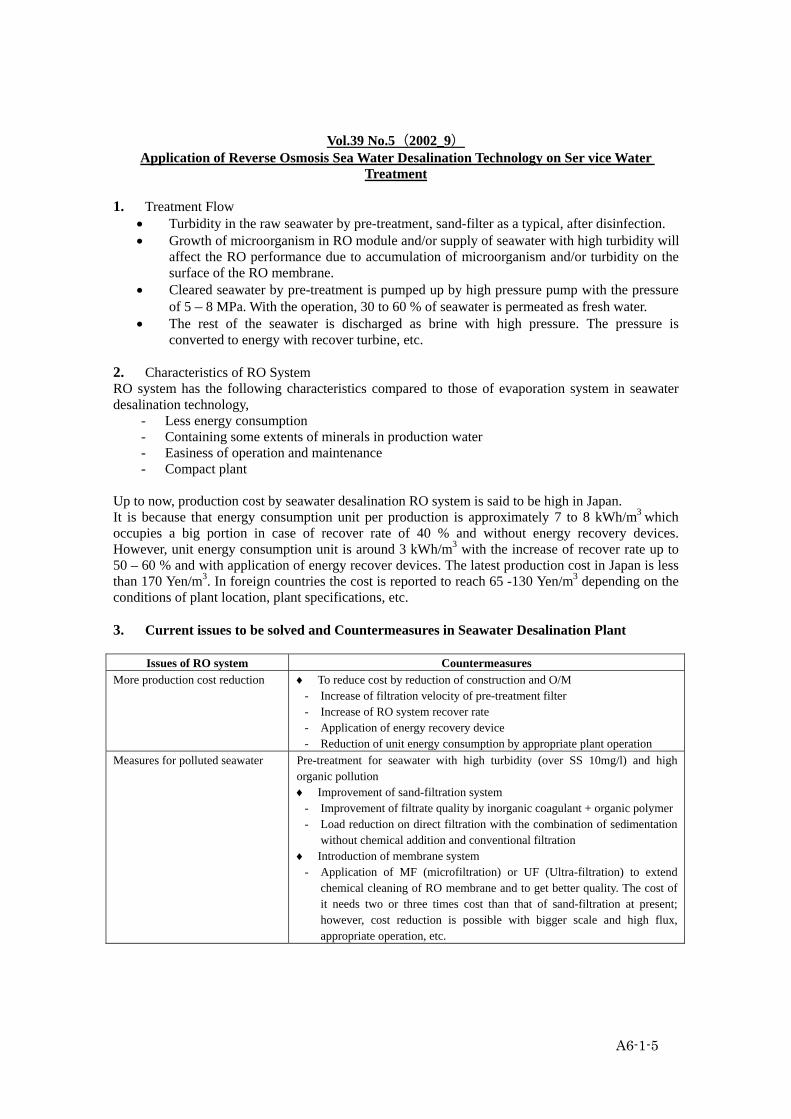
Vol.39 No.5(2002_9) Application of Reverse Osmosis Sea Water Desalination Technology on Ser vice Water
Treatment 1. Treatment Flow
• Turbidity in the raw seawater by pre-treatment, sand-filter as a typical, after disinfection. • Growth of microorganism in RO module and/or supply of seawater with high turbidity will
affect the RO performance due to accumulation of microorganism and/or turbidity on the surface of the RO membrane.
• Cleared seawater by pre-treatment is pumped up by high pressure pump with the pressure of 5 – 8 MPa. With the operation, 30 to 60 % of seawater is permeated as fresh water.
• The rest of the seawater is discharged as brine with high pressure. The pressure is converted to energy with recover turbine, etc.
2. Characteristics of RO System RO system has the following characteristics compared to those of evaporation system in seawater desalination technology,
- Less energy consumption - Containing some extents of minerals in production water - Easiness of operation and maintenance - Compact plant
Up to now, production cost by seawater desalination RO system is said to be high in Japan. It is because that energy consumption unit per production is approximately 7 to 8 kWh/m3 which occupies a big portion in case of recover rate of 40 % and without energy recovery devices. However, unit energy consumption unit is around 3 kWh/m3 with the increase of recover rate up to 50 – 60 % and with application of energy recover devices. The latest production cost in Japan is less than 170 Yen/m3. In foreign countries the cost is reported to reach 65 -130 Yen/m3 depending on the conditions of plant location, plant specifications, etc. 3. Current issues to be solved and Countermeasures in Seawater Desalination Plant
Issues of RO system Countermeasures More production cost reduction ♦ To reduce cost by reduction of construction and O/M
- Increase of filtration velocity of pre-treatment filter - Increase of RO system recover rate - Application of energy recovery device - Reduction of unit energy consumption by appropriate plant operation
Measures for polluted seawater Pre-treatment for seawater with high turbidity (over SS 10mg/l) and high organic pollution ♦ Improvement of sand-filtration system
- Improvement of filtrate quality by inorganic coagulant + organic polymer - Load reduction on direct filtration with the combination of sedimentation
without chemical addition and conventional filtration ♦ Introduction of membrane system
- Application of MF (microfiltration) or UF (Ultra-filtration) to extend chemical cleaning of RO membrane and to get better quality. The cost of it needs two or three times cost than that of sand-filtration at present; however, cost reduction is possible with bigger scale and high flux, appropriate operation, etc.
A6-1-6
Issues of RO system Countermeasures
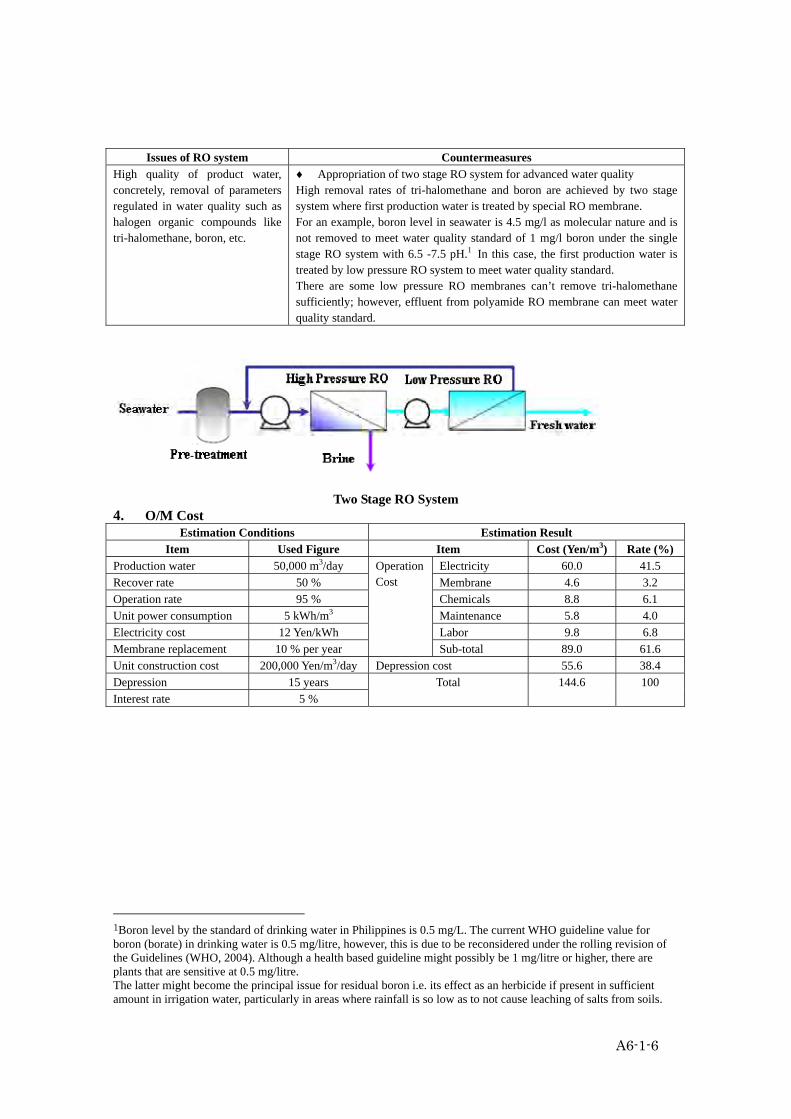
High quality of product water, concretely, removal of parameters regulated in water quality such as halogen organic compounds like tri-halomethane, boron, etc.
♦ Appropriation of two stage RO system for advanced water quality High removal rates of tri-halomethane and boron are achieved by two stage system where first production water is treated by special RO membrane. For an example, boron level in seawater is 4.5 mg/l as molecular nature and is not removed to meet water quality standard of 1 mg/l boron under the single stage RO system with 6.5 -7.5 pH.1 In this case, the first production water is treated by low pressure RO system to meet water quality standard. There are some low pressure RO membranes can’t remove tri-halomethane sufficiently; however, effluent from polyamide RO membrane can meet water quality standard.
Two Stage RO System 4. O/M Cost
Estimation Conditions Estimation Result Item Used Figure Item Cost (Yen/m3) Rate (%)
Production water 50,000 m3/day Electricity 60.0 41.5 Recover rate 50 % Membrane 4.6 3.2 Operation rate 95 % Chemicals 8.8 6.1 Unit power consumption 5 kWh/m3 Maintenance 5.8 4.0 Electricity cost 12 Yen/kWh Labor 9.8 6.8 Membrane replacement 10 % per year
Operation Cost
Sub-total 89.0 61.6 Unit construction cost 200,000 Yen/m3/day Depression cost 55.6 38.4 Depression 15 years Interest rate 5 %
Total 144.6 100
1Boron level by the standard of drinking water in Philippines is 0.5 mg/L. The current WHO guideline value for boron (borate) in drinking water is 0.5 mg/litre, however, this is due to be reconsidered under the rolling revision of the Guidelines (WHO, 2004). Although a health based guideline might possibly be 1 mg/litre or higher, there are plants that are sensitive at 0.5 mg/litre. The latter might become the principal issue for residual boron i.e. its effect as an herbicide if present in sufficient amount in irrigation water, particularly in areas where rainfall is so low as to not cause leaching of salts from soils.

A6-1-7
Fukuoka Area Water Supply Business Group, Outline of Project of Seawater Desalination Plant (50,000 m3/day)
1. Project Schedule
• Construction Period:Water Piping 5.5 years, Seawater Desalination Plant 4.5 years 2. Outline of the Project
• Space: Approximately 46,000 m2 (0.92 m2/m3/day), Building space approximately 16,000 m2 (Total floor space 21,000 m2), Seawater desalination unit: 0.42 m2/m3/day
• Production water: Max. 50,000 m3/day • Water intake method: Permeate intake method • Desalination process: RO system (Production recover rate 60 %) • Discharge method: Mixture with effluent from wastewater treatment
plant and discharge into Hakata Bay • Water Piping: Conduct pipeφ800 x approximately 20 km
Plant to water treatment plant, length approximately 12 km Water purification plant to distribution tank length approximately 8 km
• Project cost: Approximately 440 billion Yen (88,000 Yen/m3/day) 3. Objectives of the Project
• Permeate intake method:to intake clear seawater with stability • Pre-treatment:To remove microorganism and supper fine particles by UF membrane
(Polysulfone, spiral type) • RO system:Two stage RO system (High pressure RO Unit (Tri-acetyl cellulose Hollow
Fiber Type) + Low Pressure RO Unit (Polyamide, spiral type) for better production water quality
• Low cost:Approx. recover rate 60 %
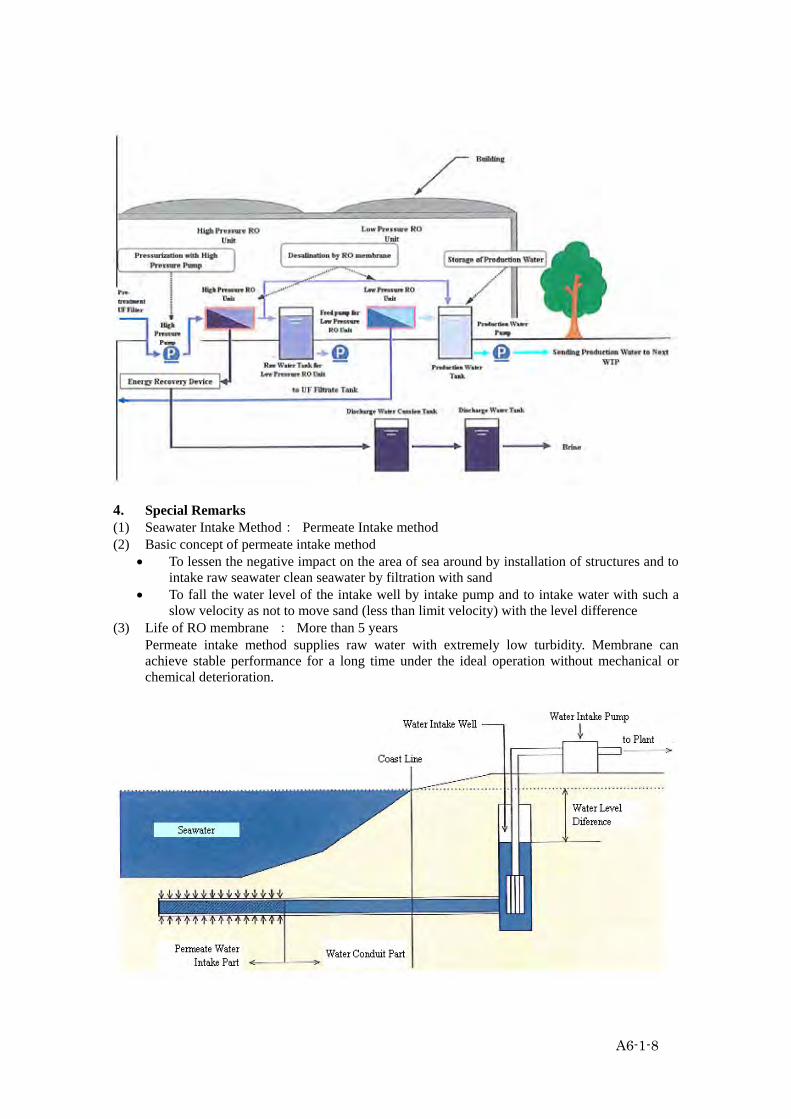
A6-1-8
4. Special Remarks (1) Seawater Intake Method: Permeate Intake method (2) Basic concept of permeate intake method
• To lessen the negative impact on the area of sea around by installation of structures and to intake raw seawater clean seawater by filtration with sand
• To fall the water level of the intake well by intake pump and to intake water with such a slow velocity as not to move sand (less than limit velocity) with the level difference
(3) Life of RO membrane : More than 5 years Permeate intake method supplies raw water with extremely low turbidity. Membrane can achieve stable performance for a long time under the ideal operation without mechanical or chemical deterioration.

A6-1-9
Structure
Permeate Velocity 6 m/day
Water collction main pipe φ1,800 mm, L = appr. 314 m
φ600 mm, L = appr. 30 m Permeate collection Facility
Water collction brance pipe 5 m pitch (Total length 3,500 m)
Water conduit facility φ1,580 mm, L = 1,178 m
Water conduit box 5.0 mW x 8.0 mL x 4.9 mH (Inner size)
Water Intake Well 5.0 mW x 13.0 mL x 10.2 mH (Inner size) x 2
Outline of Raw Seawater Intake Facility

A6-1-10
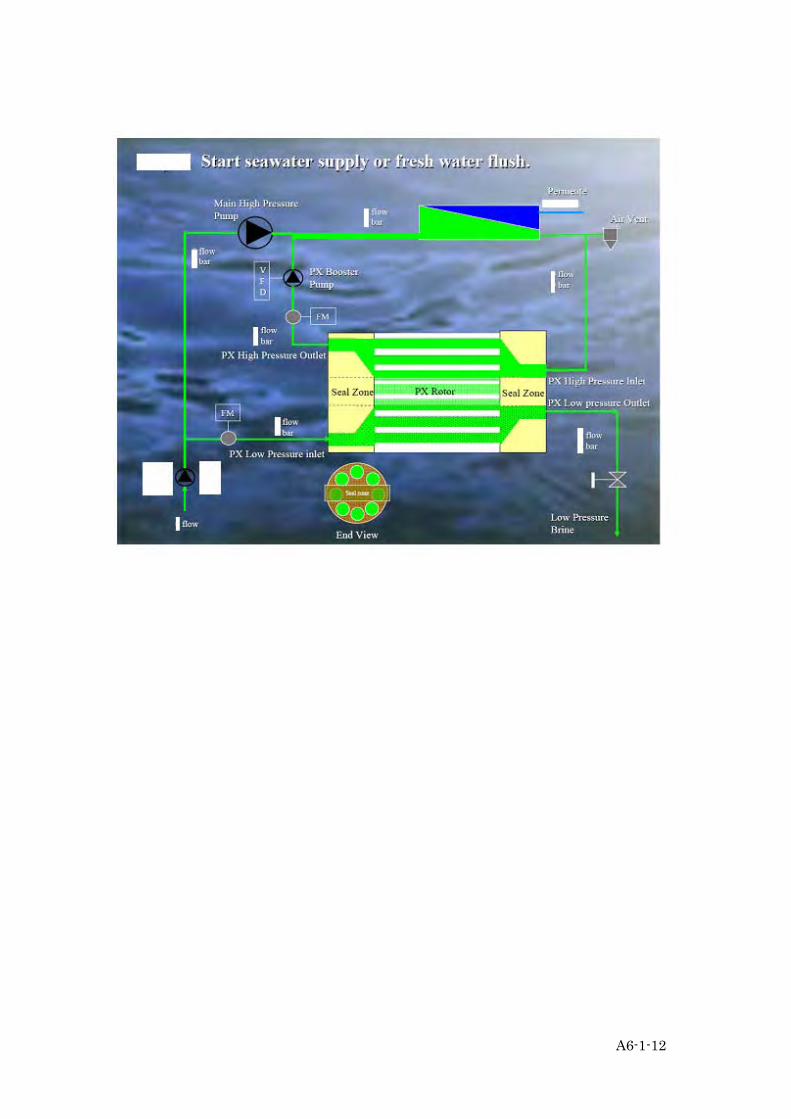
(4) Energy Recovery Device
Energy recovery device is the device which concerts pressure energy which discharge brine has to revolving energy by recovery turbine and uses it as a supplementary energy for a drive for high pressure pump. It can recover approximately 20 % of energy. (Reference) The PX Pressure Exchanger® (PX®) is a rotary-type energy recovery device (ERD) with only one moving part that recovers energy from the waste stream of seawater reverse osmosis (SWRO) systems at up to 98% efficiency.(At the core of the device is a ceramic rotor which resists corrosion and has low vibration, providing maintenance-free and fail-safe operation. PX

A6-1-11
technology dramatically reduces costs associated with the energy intensive SWRO desalination process by up to 60% as compared to desalination plants without any energy recovery devices. It is also the most widely used ERD today with installations in over 30 countries world-wide. Energy Recovery, Inc. invented, patented, and commercialized the most efficient, energy saving, energy recovery solution available today: The PX energy recovery device uses the principle of positive displacement and isobaric chambers to achieve extremely efficient transfer of energy from a high-pressure waste stream, such as the brine stream from a reverse osmosis desalination unit, to a low-pressure incoming feed stream. Because the PX is highly efficient — up to 98% virtually no energy is lost in the transfer.
A6-1-12

A6-1-13
Seawater Desalination Q & A Editorial Committee of Okinawa Prefectural Enterprise Bureau, November 1994
1. Reference: Principal and Features of Seawater Desalination by Pervaroration
Process Principal Features PERVAPORATION Method for the separation of
mixtures of liquids by partial vaporization through a non-porous or porous membrane. The name of this membrane-based process is derived from the two basic steps of the process, firstly the permeation through the membrane by the permeate, then its evaporation into the vapor phase. The membrane acts as a selective barrier between the two phases, the liquid phase feed and the vapor phase permeate. Typically, the upstream side of the membrane is at ambient pressure and the downstream side is under vacuum to allow the evaporation of the selective component after permeation through the membrane. Driving force for the separation is the difference in the partial pressures of the components on the two sides and not the volatility difference of the components in the feed.
Most appropriate in energy saving where sufficient exhausted heat to be used such as solar energy exists.
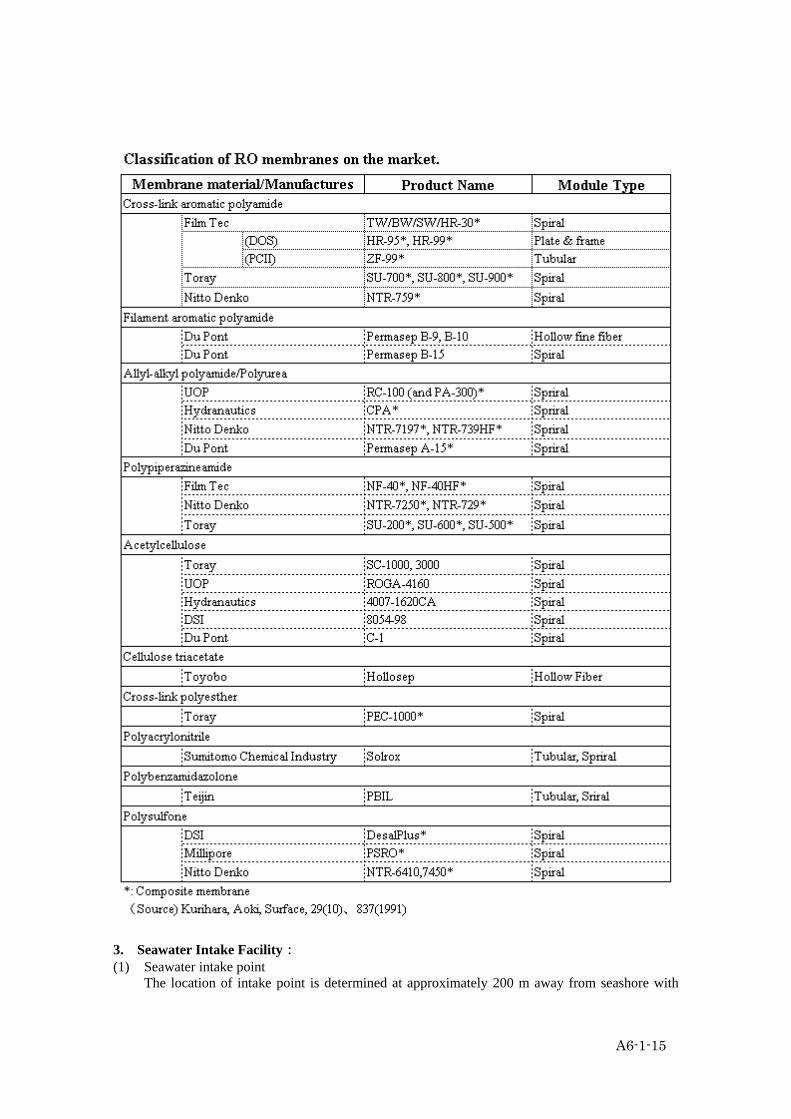
2. Kinds of RO membranes and characteristics
RO membrane being used is roughly categorized acetyl cellulose membrane and polyamide membrane from material aspect and spiral wound and hollow fiber type from structural aspect. Acetyl cellulose and polyamide membrane are used for hollow fiber type membrane and polyamide composite membrane is used for spiral wound type membrane. There are two types of spiral wound polyamide composite membranes; cross-link and filament aromatic polyamide membranes. The factors to give negative effects on RO performance are scale generation on the surface of RO
A6-1-14
membrane and biological fouling due to growth of bacteria. Accordingly, disinfectant like chlorine to prevent from bacteria growth and H2SO4 to low pH or anti-scalant to prevent from scaling are added before RO module inlet. Acetyl cellulose membrane is relatively tolerant to chlorine; therefore, chlorine dosing is effective for prevention of bacteria growth. The features of spiral wound type polyamide composite membrane are widely being used due to the features;
• Possible to remove tri-halomethanes which can not be removed by acetyl cellulose membrane.
• In general, spiral type wound RO membrane is superior to hollow fiber type membrane in clogging. Mesh spacer with acceptable openings of approximately 30 μm is used in spiral wounded type RO element in order to increase inlet flow velocity and to improve turbulence effect at inlet.
• Spiral wound type membranes are produced by many companies and have the common dimensions, although their appearances are different. It means those membranes can be accommodated in the same pressure vessels.
• Others However, de-chlorination by SBS before RO module for polyamide membranes. (Notes)
• Asymmetric membrane: Material of desalination function layer and supporting layer is the same as asymmetric acetyl cellulose membrane.
• Composite membrane : Materials of desalination function layer (cross-link aromatic polyamide membrane, etc) and supporting layer (Polysulfone, etc.) are different. Most functionally suitable materials of them can be selected. Polyamide composite membrane is a typical one.
A6-1-15
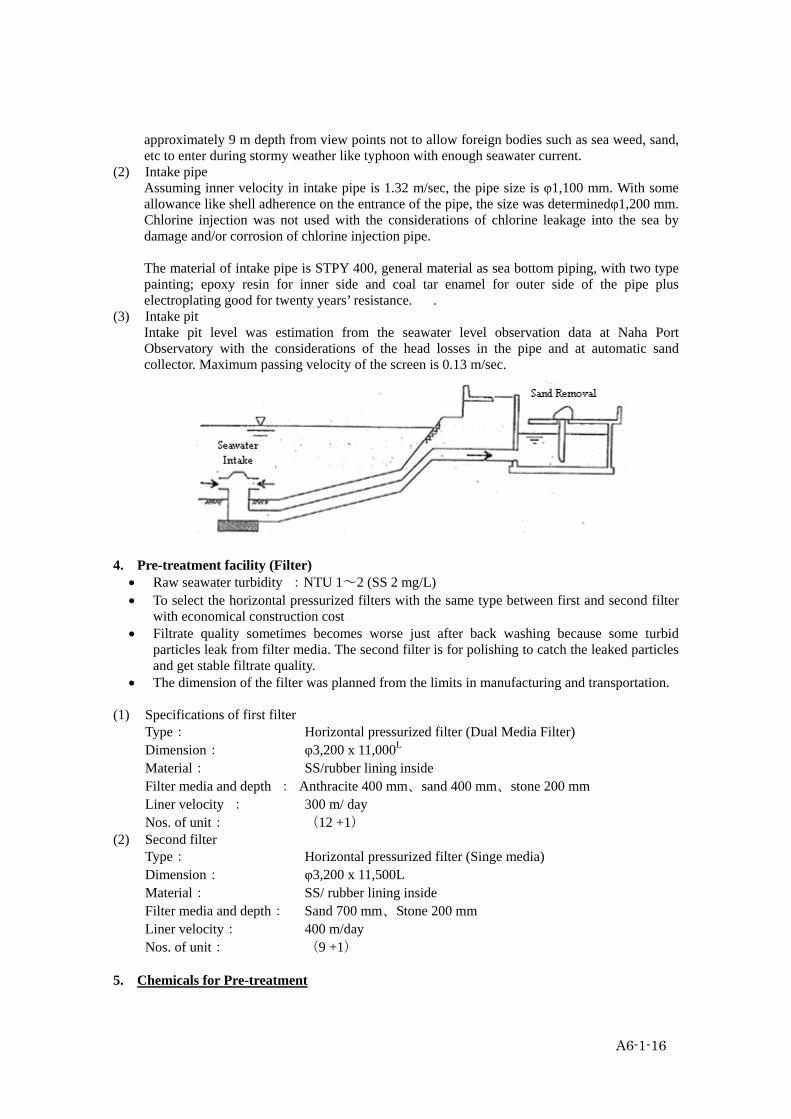
3. Seawater Intake Facility: (1) Seawater intake point
The location of intake point is determined at approximately 200 m away from seashore with
A6-1-16
approximately 9 m depth from view points not to allow foreign bodies such as sea weed, sand, etc to enter during stormy weather like typhoon with enough seawater current.
(2) Intake pipe Assuming inner velocity in intake pipe is 1.32 m/sec, the pipe size is φ1,100 mm. With some allowance like shell adherence on the entrance of the pipe, the size was determinedφ1,200 mm. Chlorine injection was not used with the considerations of chlorine leakage into the sea by damage and/or corrosion of chlorine injection pipe. The material of intake pipe is STPY 400, general material as sea bottom piping, with two type painting; epoxy resin for inner side and coal tar enamel for outer side of the pipe plus electroplating good for twenty years’ resistance. .
(3) Intake pit Intake pit level was estimation from the seawater level observation data at Naha Port Observatory with the considerations of the head losses in the pipe and at automatic sand collector. Maximum passing velocity of the screen is 0.13 m/sec.
4. Pre-treatment facility (Filter)
• Raw seawater turbidity :NTU 1~2 (SS 2 mg/L) • To select the horizontal pressurized filters with the same type between first and second filter
with economical construction cost • Filtrate quality sometimes becomes worse just after back washing because some turbid
particles leak from filter media. The second filter is for polishing to catch the leaked particles and get stable filtrate quality.
• The dimension of the filter was planned from the limits in manufacturing and transportation. (1) Specifications of first filter
Type: Horizontal pressurized filter (Dual Media Filter) Dimension: φ3,200 x 11,000L Material: SS/rubber lining inside Filter media and depth : Anthracite 400 mm、sand 400 mm、stone 200 mm Liner velocity : 300 m/ day Nos. of unit: (12 +1)
(2) Second filter Type: Horizontal pressurized filter (Singe media) Dimension: φ3,200 x 11,500L Material: SS/ rubber lining inside Filter media and depth: Sand 700 mm、Stone 200 mm Liner velocity: 400 m/day
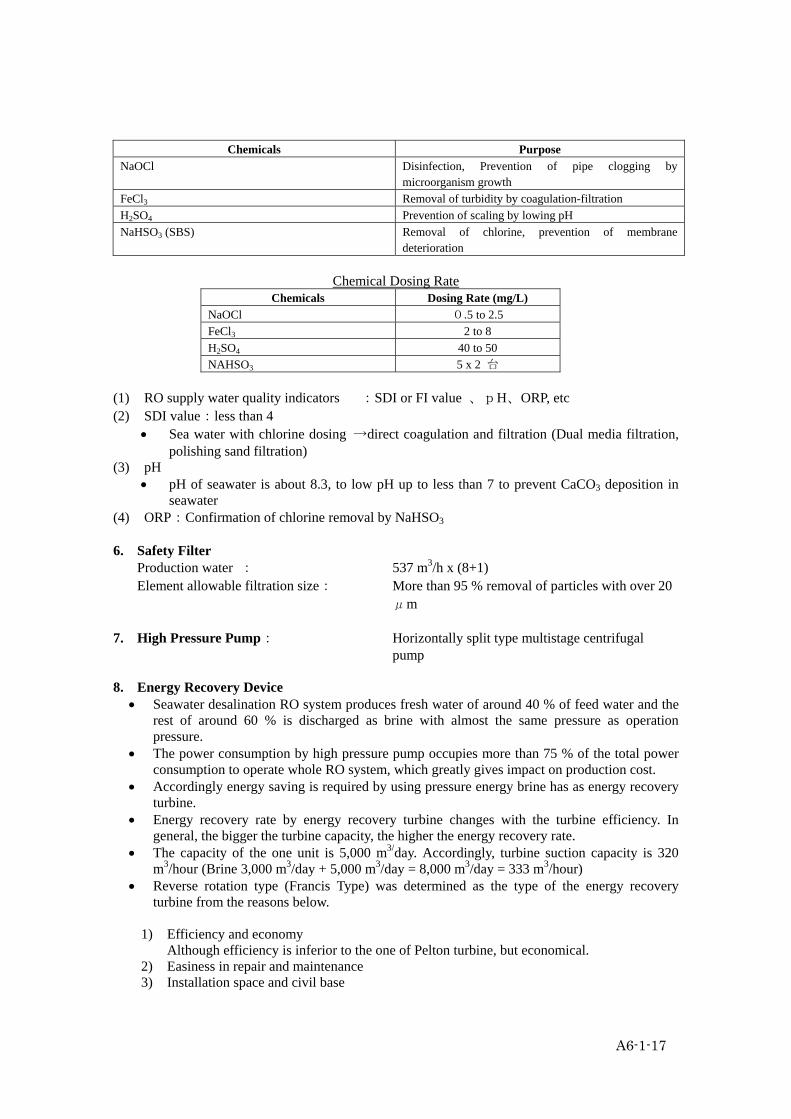
Nos. of unit: (9 +1) 5. Chemicals for Pre-treatment
A6-1-17
Chemical Dosing Rate
Chemicals Dosing Rate (mg/L) NaOCl 0.5 to 2.5 FeCl3 2 to 8 H2SO4 40 to 50 NAHSO3 5 x 2 台
(1) RO supply water quality indicators :SDI or FI value 、pH、ORP, etc (2) SDI value:less than 4
• Sea water with chlorine dosing →direct coagulation and filtration (Dual media filtration, polishing sand filtration)
(3) pH • pH of seawater is about 8.3, to low pH up to less than 7 to prevent CaCO3 deposition in
seawater (4) ORP:Confirmation of chlorine removal by NaHSO3 6. Safety Filter Production water : 537 m3/h x (8+1) Element allowable filtration size: More than 95 % removal of particles with over 20 μm 7. High Pressure Pump: Horizontally split type multistage centrifugal pump 8. Energy Recovery Device
• Seawater desalination RO system produces fresh water of around 40 % of feed water and the rest of around 60 % is discharged as brine with almost the same pressure as operation pressure.
• The power consumption by high pressure pump occupies more than 75 % of the total power consumption to operate whole RO system, which greatly gives impact on production cost.
• Accordingly energy saving is required by using pressure energy brine has as energy recovery turbine.
• Energy recovery rate by energy recovery turbine changes with the turbine efficiency. In general, the bigger the turbine capacity, the higher the energy recovery rate.
• The capacity of the one unit is 5,000 m3/day. Accordingly, turbine suction capacity is 320 m3/hour (Brine 3,000 m3/day + 5,000 m3/day = 8,000 m3/day = 333 m3/hour)
• Reverse rotation type (Francis Type) was determined as the type of the energy recovery turbine from the reasons below.
1) Efficiency and economy
Although efficiency is inferior to the one of Pelton turbine, but economical. 2) Easiness in repair and maintenance 3) Installation space and civil base
Chemicals Purpose NaOCl Disinfection, Prevention of pipe clogging by
microorganism growth FeCl3 Removal of turbidity by coagulation-filtration H2SO4 Prevention of scaling by lowing pH NaHSO3 (SBS) Removal of chlorine, prevention of membrane
deterioration

A6-1-18
Suitable for ground installation because civil base for installation is relatively easy in case of limitations of land space and weak supporting ground.
4) Achievements 9. Specifications of membrane element and vessel (1) Membrane element
Type: Spiral type Material: Aromatic polyamide composite membrane Size: φ201 x 1,016L Performance : Permeate average more than 15 m3/day Salt rejection rate: Average more than 99.75%(35,000 mg/L seawater) More than 99.60%(35,000 mg/L NaCl 溶液) Nos. of element: Approx. 5,000 m3/day/unit, 378 elements, 13 m3/element Total Nos. of element: 3,024/8 units (Approx. 40,000 m3/day)
(2) Membrane Vessel Type: Cylindrical, horizontal. (for six membrane elements) Nos. of vessels: 63 per unit, 7 rows x 9 beds Design pressure : 7.5 MPa Material: FRP 10. Operation Pressure
• Seawater permeate pressure: Approx. 2.5 MPa • RO operation pressure:5.6 ~ 6.5 MPa, More than two times pressure to seawater permeate
is necessary for RO operation
Energy for RO membrane operation (theory) Separation process (recovery rate or voltage charge to unit cell) Theoretical unit power (kWh/m3)
RO process (Recovery rate 40 %) 3.5 With 80 % energy recovery 1.8 RO process (Recovery rate 30 %) 4.7 With 80 % energy recovery 2.0 Electrolysis dialysis process (Voltage charge: 0.15 V) 2.4 Electrolysis dialysis process (Voltage charge: 5 V) 8.0 Multi-stage flush process 10.9* Pervaporation (5 %) 14.9
*:100℃、35℃、Production ratio 10 exergy value (Source) Haruhiko OTANI, Membrane separation, JIS
11. RO membrane cleaning agent
• Microorganism fouling: NaHSO3 (SBS) or chloramine • Inorganic fouling such as Fe, CACO3:クエン酸 Citric acid (pH2~4) • Organic fouling: Anion surfactant like DSS 0.1~1%
12. Slime generation prevention
• Seawater intake, Pre-treatment : Chlorine • RO membrane : Chlorine gives a negative impact on for polyamide membrane
Intermittent injection of SBS or chloramine (500 mg/L of SBS: 60 minutes’ injection or 1mg/L chloromine: about 60 minutes)
• Contact chlorine with polyamide membrane brings improvement of water quality with

A6-1-19
decrease of production water in a short time at the first stage. Chlorine leakage for a while results in deterioration of water quality with increase of production water due to membrane damage by oxidation and decomposition of the membrane.
13. Attentions in Operation With the operation time, decrease of production water and deterioration of water quality occur. The countermeasures are; • Operation in compliance with membrane performance
- Avoid excess operation pressure in constant quantity operation - Appropriation of feed water supply
• Asymmetric membrane like acetyl cellulose hollow fiber membrane has the tendency of compaction. Constant pressure operation will bring about decrease of production water. Aromatic polyamide membrane has less chance of the tendency.
14. Preservation of RO membrane:in SBS 0.05~0.1% 15. Parameters to give impacts on membrane performance Main operation parameters;
• Pressure • Temperature • TDS concentration • Feed flow • Recovery rate
Conditions Acetyl cellulose membrane
Composite membrane
High temperature • Production water :Big • TDS in production water: Big Increase of salt permeate rate is bigger than that of water production
High pressure • Production water:Small • Compaction
• Production water: Big • TDS in production water:Small Increase of water production rate is bigger than that of salt permeate
Low pressure • Production water:Small • TDS in production water:Big
Chemical reaction (Chlorine)
• Decrease of chlorine resistance in high temperature
• Deterioration
Condition Impact
Constant recovery rate, high temperature
• Feed seawater :Big • Both water production and TDS in it increase
Constant feed supply, high temperature
• Recovery rate: Increase Water production increases
Increase of recover rate means increase of TDS in brine and TDS in average feeding seawater, i.e permeate pressure in other words. 16. Wastewater Treatment

A6-1-20
(1) Brine • Adjust low pH brine because H2SO4 is injected to feed water due to anti-scaling. Reduce
COD which comes from SBS to remove residual chorine by aeration in case of using polyamide membrane module.
. (2) Waste water from membrane preservation
• Membrane modules are reserved in SBS solution. The volume of wastewater generated is estimated approximately 180 m3/cycle (60 L/element x 3,204 elements) for spiral type module.
• The wastewater is stored in a storage tank. It will be treated by aeration to reduce COD and discharged after pH adjustment with NaOH.
(3) Membrane cleaning wastewater
• 1 % citric acid is used for cleaning membrane module. COD in the wastewater will be equivalent to approximately 5,200 mg/L, SS 100 -500 mg/L with pH 4.
• Cleaning membranes are conducted several times per year. About 40 m3/unit (about 5,000 m3/cycle)
• pH adjustment by NaOH for membrane cleaning wastewater is necessary.
(4) Filter backwashing wastewater • About one time/day/unit (in case of SSinlet= 2mg/L, too much) • Total backwashing wastewater : About 5,900 m3/day(3.8 times/total V-media) • Wastewater is of high color and turbidity. • Coagulation-sedimentation treatment is necessary.
17. Discharge Facility • Adoption of discharge method in water; installation of discharge pipe to off-shore
discharge point (multi nozzle type)
(1) Discharge point
Discharge point is about 200 m from off-shore, at 13 m water depth (Discharge nozzles about at 10 m water depth with the same conditions of intake point.
(2) Discharge pipe • The material of discharge pipe is STPY 400, general material as sea bottom piping, with
two type painting; epoxy resin for inner side and coal tar enamel for outer side of the pipe plus electroplating good for twenty years’ resistance. .
(3) Discharge tank :V=210 m3 x 1 (4) Discharge nozzle
16 nozzles (φ100 mm)at the opposite side of the land, maximum flow velocity 6.4 m/sec Considerations of seawater intake and discharge point
• To avoid corals which are exposed in ebb tide
A6-1-21
• The location to avoid not to allow foreign bodies such as sea weed, sand, etc to enter during stormy weather like typhoon.
• The location with enough seawater current to change clean seawater . • Location of discharge point: not to give impact on water intake point by discharge brine
with heavy specific gravity
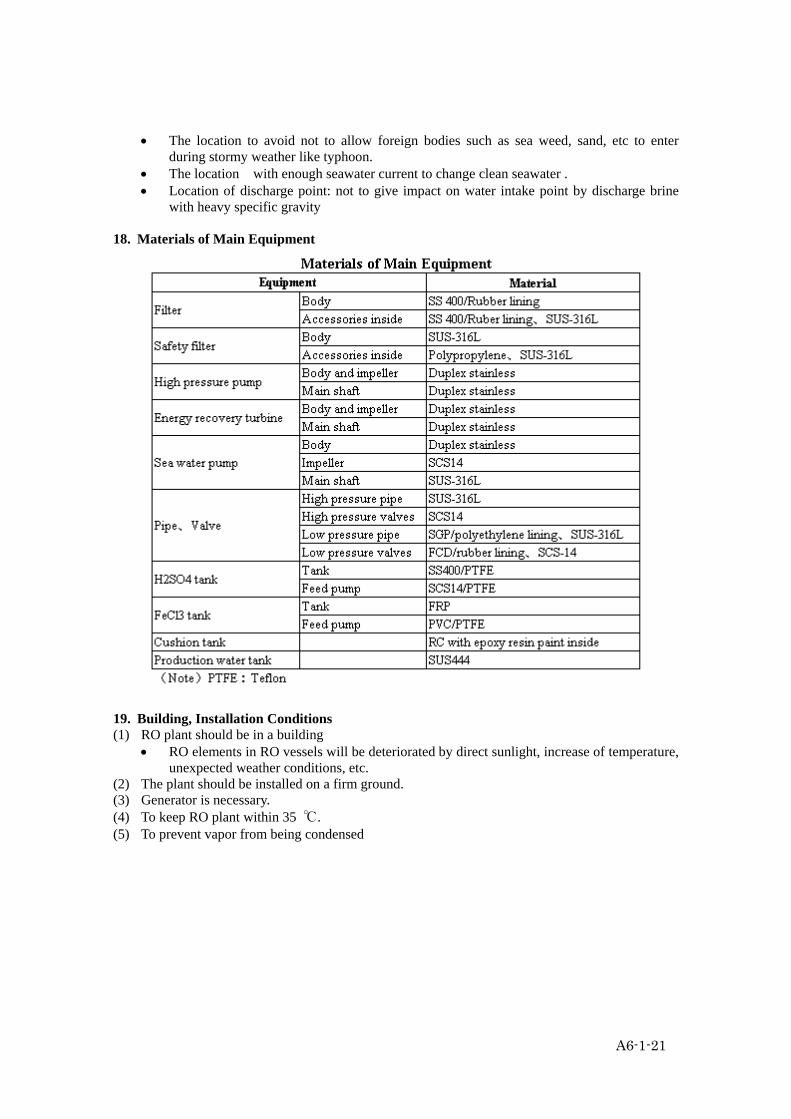
18. Materials of Main Equipment
19. Building, Installation Conditions (1) RO plant should be in a building
• RO elements in RO vessels will be deteriorated by direct sunlight, increase of temperature, unexpected weather conditions, etc.
(2) The plant should be installed on a firm ground. (3) Generator is necessary. (4) To keep RO plant within 35 ℃. (5) To prevent vapor from being condensed
A6-1-22
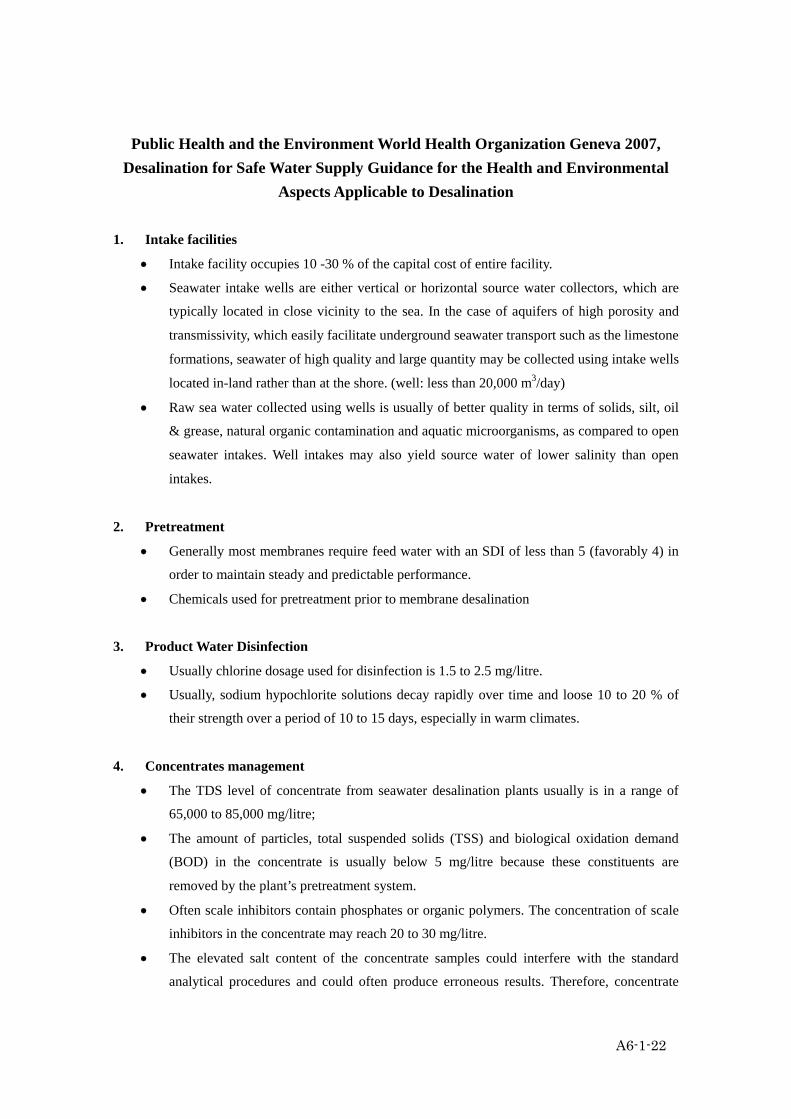
Public Health and the Environment World Health Organization Geneva 2007, Desalination for Safe Water Supply Guidance for the Health and Environmental
Aspects Applicable to Desalination
1. Intake facilities
• Intake facility occupies 10 -30 % of the capital cost of entire facility.
• Seawater intake wells are either vertical or horizontal source water collectors, which are
typically located in close vicinity to the sea. In the case of aquifers of high porosity and
transmissivity, which easily facilitate underground seawater transport such as the limestone
formations, seawater of high quality and large quantity may be collected using intake wells
located in-land rather than at the shore. (well: less than 20,000 m3/day)
• Raw sea water collected using wells is usually of better quality in terms of solids, silt, oil
& grease, natural organic contamination and aquatic microorganisms, as compared to open
seawater intakes. Well intakes may also yield source water of lower salinity than open
intakes.
2. Pretreatment
• Generally most membranes require feed water with an SDI of less than 5 (favorably 4) in
order to maintain steady and predictable performance.
• Chemicals used for pretreatment prior to membrane desalination
3. Product Water Disinfection
• Usually chlorine dosage used for disinfection is 1.5 to 2.5 mg/litre.
• Usually, sodium hypochlorite solutions decay rapidly over time and loose 10 to 20 % of
their strength over a period of 10 to 15 days, especially in warm climates.
4. Concentrates management
• The TDS level of concentrate from seawater desalination plants usually is in a range of
65,000 to 85,000 mg/litre;
• The amount of particles, total suspended solids (TSS) and biological oxidation demand
(BOD) in the concentrate is usually below 5 mg/litre because these constituents are
removed by the plant’s pretreatment system.
• Often scale inhibitors contain phosphates or organic polymers. The concentration of scale
inhibitors in the concentrate may reach 20 to 30 mg/litre.
• The elevated salt content of the concentrate samples could interfere with the standard
analytical procedures and could often produce erroneous results. Therefore, concentrate

A6-1-23
analysis has to be completed by an analytical laboratory experienced with and properly
equipped for seawater analysis.
• Many crops and plants cannot tolerate irrigation water that contains over 1000 mg/litre of
TDS. However, TDS is not the only parameter of concern in terms of irrigation water
quality.
• Boron/borate levels in the effluent could also limit agricultural reuse because borates are
herbicides. Chlorides and sodium may also have measurable effects on the irrigated plants.
Most plants cannot tolerate chloride levels above 250 mg/litre.
Pretreatment chemicals used in membrane desalination systems
• Chemicals used for pretreatment should be of high-quality (“food-grade”)

A6-1-24
Residuals from membrane desalination processes Residual Source or cause Application
Backwash Solids/Sludge Suspended solids in the feed water Open intake seawater, brackish surface water
Backwash water
From removal of suspended Open intake seawater, brackish solids in the feed water surface water
Cleaning Solutions
Cleaning of filtration membranes (MF/UF) and process membranes
(RO, NF)
Open intake seawater, brackish surface water
Concentrate or blow down (if cross flow)
Filtration membranes operating in a cross flow mode
Open intake seawater, brackish surface water
Spent media (sand, anthracite and/or garnet)
From the removal of suspended solids in the feed water
Open intake seawater, brackish surface water
Cartridge Filters – polypropylene
Final fine filtration prior to RO, periodic replacement
Most membrane desalination processes, except those using MF/UF filtration membranes
MF/UF membranes – polymeric material
(polypropylene, polysulphone, polyvinylidene-fluroide
(PVDF), cellulose acetate
Membrane replacement for MF/UF systems
Open intake seawater, brackish surface water
RO membranes (polyamide thin film composite, cellulose
acetate)
Membrane replacements. Open intake seawater, brackish surface water
• In general, the membrane pretreatment systems produce 1.5 to 2 times larger volume of
spent filter backwash water than the granular media filters. However, contrary to the MF
or UF membrane pretreatment filters, the granular media filters require their feed water to
be preconditioned with coagulant (usually iron salt) prior to filtration. This typically adds
60 to 80 percent of additional solids load to the spent filter discharge, and therefore its
disposal typically results in higher solids handling costs.
• Filter backwash sedimentation tanks are often designed for a retention time of 3 to 4 hours
and allow removing more than 90 percent of the backwash solids.
5. Small desalination systems
• Less than 4.000 m3/day
• Sea based mobile applications that are configured in one skid and often referred to as
package plants.
• For small skid mounted systems, it is common to have the pretreatment chemical injection
points, cartridge filter, feed pump, and membranes and pressure vessels on the skid.
• Small membrane desalination units may be deigned to operate with smaller size (2-inch ~5
cm or 4-inch ~10 cm) membranes.

A6-1-25
6. Chemical Aspects of Desalinated Water
(1) Boron and bromide
In terms of key contaminants of direct interest for health and environment, the most important is
probably boron, which can be of significance in reverse osmosis plants since the rejection ratio of
boron (probably mostly as borate) is less than that for most other inorganics.
The current WHO guideline value for boron (borate) in drinking water is 0.5 mg/litre, however, this
is due to be reconsidered under the rolling revision of the Guidelines (WHO, 2004). Although a
health based guideline might possibly be 1 mg/litre or higher, there are plants that are sensitive at 0.5
mg/litre.
The latter might become the principal issue for residual boron i.e. its effect as an herbicide if present
in sufficient amount in irrigation water, particularly in areas where rainfall is so low as to not cause
leaching of salts from soils.
7. Quality control
Quality control of chemicals, maintenance of monitoring equipment, review of laboratory
performance and selection of test methods are important components of monitoring programs.
(1) Additives and chemicals
• to use only chemicals certified for use in the production of drinking water.
• Documented procedures for the control of chemicals, including purchasing, certification,
delivery, handling, storage and maintenance should be established and adherence to these
procedures should be monitored.
(2) Monitoring equipment, sampling, laboratories and methods of analysis
Monitoring can be undertaken using on-line instruments, field kits and laboratory-based analyses
depending upon the application of the data and the precision and accuracy requirements.
• Maintenance and regular calibration of on-line instruments and field kits. Chemicals used
in these instruments and kits should be stored under appropriate conditions and results
obtained should be periodically checked by comparison with laboratory based analyses.
• Assurance of the accuracy and representative nature of water samples. Guidance on
sample collection is provided in International Organization for Standardization (ISO)
Standard 5667.
• Regular assessment of the competence and accuracy of testing laboratories. General
guidance on quality assurance for analytical laboratories is provided in Water Quality
Monitoring (Bartram, 1996).
• An important issue for desalination facilities is the selection of appropriate testing
• Equipment and testing methods. Equipment and methods used to monitor freshwater

A6-1-26
sources of drinking water may not be suitable or provide accurate results when used with
high salinity water
• Suggested monitoring parameters and frequencies for desalination plants (Small plant) Component
Control measures
Control measures Operational Parameters Monitoring frequency
Detect and prevent contamination by sewage (Pathogenic protozoa, viruses, bacteria) (Likelihood of presence based on sanitary inspection)
Enterococci and/or E.coli Weekly
Detect and prevent impacts of storm events Turbidity (used as on-line measurement for process control)
Preferably on-line
Detect and prevent impacts of microalgae/cyanobacteria
Algal species, including cyanobacteria, dinoflagellates, or chlorophyll as a surrogate
Monthly
TOC (if concentrations change investigate sources)
Monthly
Petroleum oil hydrocarbons/grease including volatile compounds
Yearly
Industrial chemicals Monthly
Detect and prevent impacts by industrial discharges (based on an assessment of local conditions)
Radioactivity Yearly Salinity Daily Chloride Daily Sodium Weekly Boron Yearly Bromide Yearly Silica Daily Iron Weekly Manganese Yearly Turbidity On-line Alkalinity Daily
pH On-line Temperature On-line Heavy metals Monthly Low solubility chemicals e.g. Ca, , F, Ba, Sr, Mg, ,fluoride, sulfate
Monthly
Hydrogen sulphide and metal sulphides Monthly
Ammonia Monthly
Source
Monitoring associated with downstream control measures (pre-treatment and treatment)
Total dissolved solids (TDS) Daily SDI On-line Flow rates On-line Conductivity On-line Conductivity/TDS ratios Daily Turbidity after pre-treatment, particle counts
Daily
Detection and prevention of biofouling/scaling/precipitation
pH (if acidification or alkalinisation) On-line Use of additives e.g. antiscalant Flow and dose rate monitoring On-line Quality control on additives and materials Test additives and materials; check records Daily
Pre- treatment
Prevention of microbial fouling Disinfectant residual or ORP On-line Process Management
Membranes Recovery ratio (calculated from flow rates) Daily
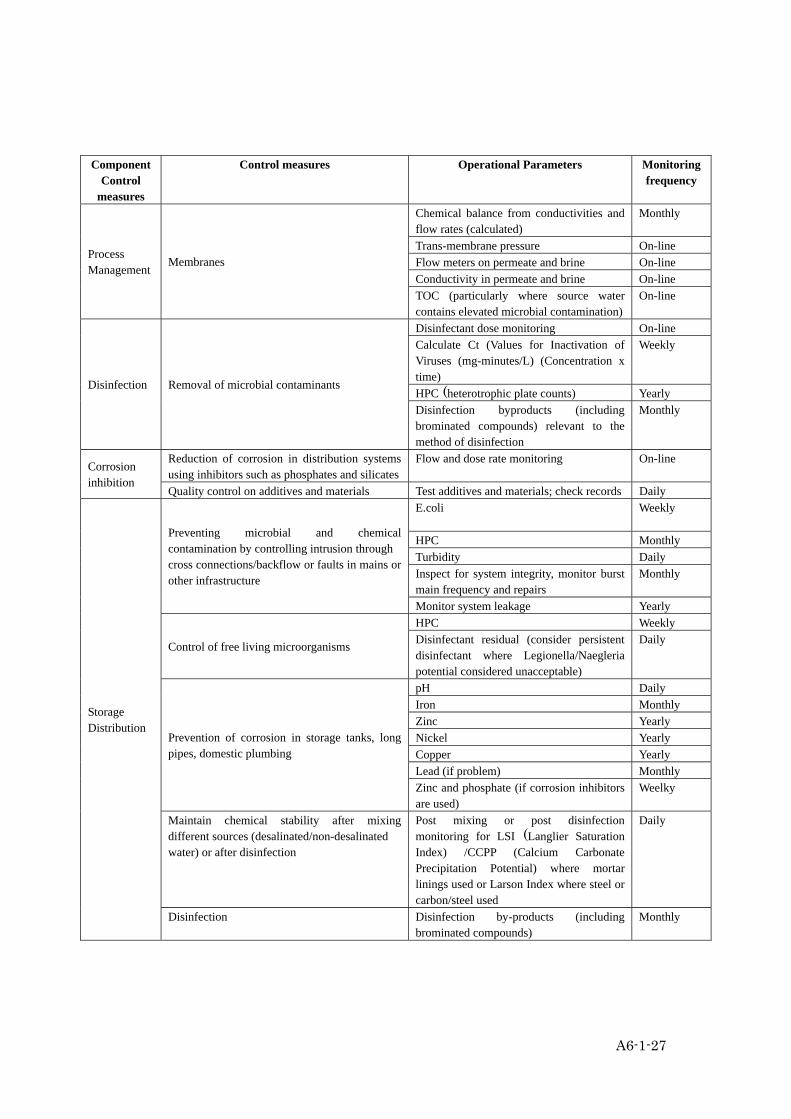
A6-1-27
Component
Control measures
Control measures Operational Parameters Monitoring frequency
Chemical balance from conductivities and flow rates (calculated)
Monthly
Trans-membrane pressure On-line Flow meters on permeate and brine On-line Conductivity in permeate and brine On-line
Process Management
Membranes
TOC (particularly where source water contains elevated microbial contamination)
On-line
Disinfectant dose monitoring On-line Calculate Ct (Values for Inactivation of Viruses (mg-minutes/L) (Concentration x time)
Weekly
HPC (heterotrophic plate counts) Yearly Disinfection Removal of microbial contaminants
Disinfection byproducts (including brominated compounds) relevant to the method of disinfection
Monthly
Reduction of corrosion in distribution systems using inhibitors such as phosphates and silicates
Flow and dose rate monitoring On-line Corrosion inhibition
Quality control on additives and materials Test additives and materials; check records Daily E.coli
Weekly
HPC Monthly Turbidity Daily Inspect for system integrity, monitor burst main frequency and repairs
Monthly
Preventing microbial and chemical contamination by controlling intrusion through cross connections/backflow or faults in mains or other infrastructure
Monitor system leakage Yearly HPC Weekly
Control of free living microorganisms Disinfectant residual (consider persistent disinfectant where Legionella/Naegleria potential considered unacceptable)
Daily
pH Daily Iron Monthly Zinc Yearly Nickel Yearly Copper Yearly Lead (if problem) Monthly
Prevention of corrosion in storage tanks, long pipes, domestic plumbing
Zinc and phosphate (if corrosion inhibitors are used)
Weelky
Maintain chemical stability after mixing different sources (desalinated/non-desalinated water) or after disinfection
Post mixing or post disinfection monitoring for LSI (Langlier Saturation Index) /CCPP (Calcium Carbonate Precipitation Potential) where mortar linings used or Larson Index where steel or carbon/steel used
Daily
Storage Distribution
Disinfection Disinfection by-products (including brominated compounds)
Monthly

A6-1-28
Component
Control measures
Control measures Operational Parameters Monitoring frequency
Temperature and DO (thermal processes) On-line pH On-line
Salinity On-line
Heavy metals/salts Quarterly Additives Quarterly
Concentrate discharges
In marine or brackish lake environments select discharge points to minimise impacts. Discharge into areas with high levels of mixing or use diffusers to promote mixing
Phosphates and nitrates Quarterly pH On-line Turbidity On-line Suspended solids(SS) Daily Residual disinfectants Daily Iron or aluminum – based on the type of coagulant used
Monthly
Wastewater effluents from pre-treatment facilities or from membrane cleaning
Collect discharges and treat or discharge in accord with requirements set by environment protection agencies
Membrane cleaning agents On discharge
8. EIA (Standard Approach)
• “Mandatory’ or ‘positive’ lists which include projects always requiring EIA (e.g. major
projects, possibly large co-generation plants for electricity and water);
• Project lists which define thresholds and criteria above which EIA is required (e.g. a
desalination plant with more than 20,000 m3/day of production capacity);
• ‘Exclusion’ or ‘negative’ lists which specify thresholds and criteria below which EIA is
never required or below which a simplified EIA procedure applies (e.g. a desalination unit
with less than 4,000 m3/day of production capacity).
A6-1-29
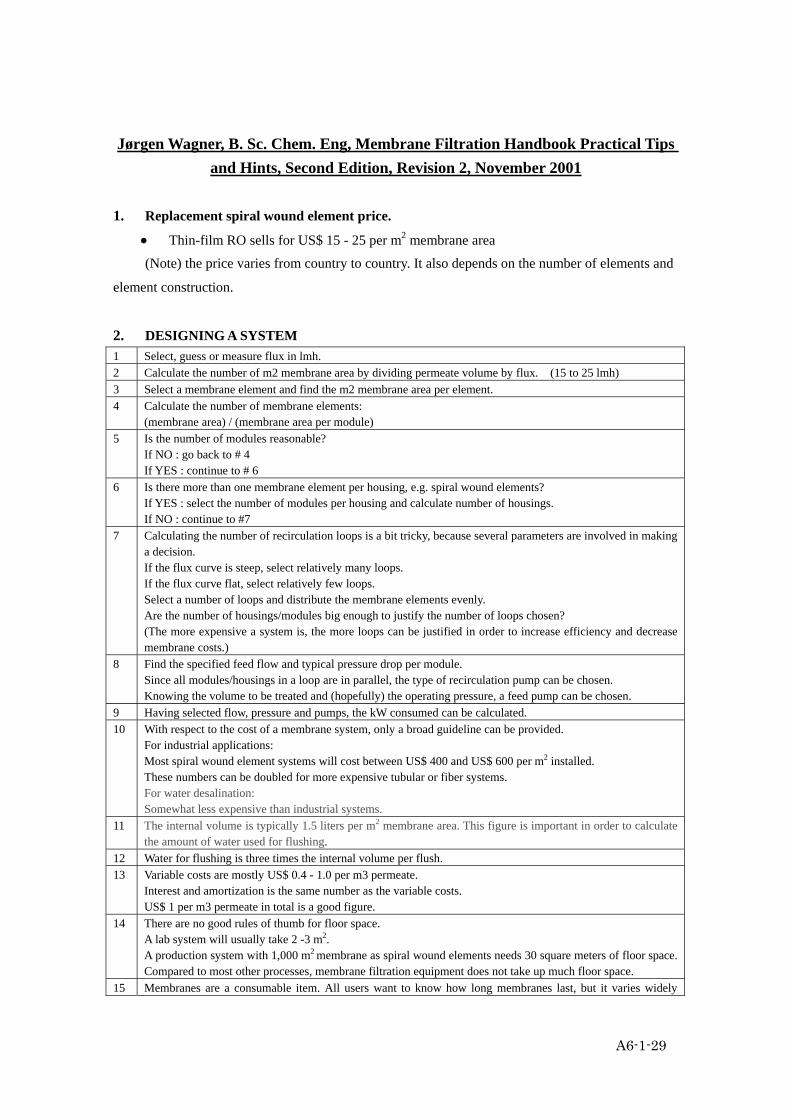
Jørgen Wagner, B. Sc. Chem. Eng, Membrane Filtration Handbook Practical Tips and Hints, Second Edition, Revision 2, November 2001
1. Replacement spiral wound element price.
• Thin-film RO sells for US$ 15 - 25 per m2 membrane area
(Note) the price varies from country to country. It also depends on the number of elements and
element construction.
2. DESIGNING A SYSTEM 1 Select, guess or measure flux in lmh. 2 Calculate the number of m2 membrane area by dividing permeate volume by flux. (15 to 25 lmh) 3 Select a membrane element and find the m2 membrane area per element. 4 Calculate the number of membrane elements:
(membrane area) / (membrane area per module) 5 Is the number of modules reasonable?
If NO : go back to # 4 If YES : continue to # 6
6 Is there more than one membrane element per housing, e.g. spiral wound elements? If YES : select the number of modules per housing and calculate number of housings. If NO : continue to #7
7 Calculating the number of recirculation loops is a bit tricky, because several parameters are involved in making a decision. If the flux curve is steep, select relatively many loops. If the flux curve flat, select relatively few loops. Select a number of loops and distribute the membrane elements evenly. Are the number of housings/modules big enough to justify the number of loops chosen? (The more expensive a system is, the more loops can be justified in order to increase efficiency and decrease membrane costs.)
8 Find the specified feed flow and typical pressure drop per module. Since all modules/housings in a loop are in parallel, the type of recirculation pump can be chosen. Knowing the volume to be treated and (hopefully) the operating pressure, a feed pump can be chosen.
9 Having selected flow, pressure and pumps, the kW consumed can be calculated. 10 With respect to the cost of a membrane system, only a broad guideline can be provided.
For industrial applications: Most spiral wound element systems will cost between US$ 400 and US$ 600 per m2 installed. These numbers can be doubled for more expensive tubular or fiber systems. For water desalination: Somewhat less expensive than industrial systems.
11 The internal volume is typically 1.5 liters per m2 membrane area. This figure is important in order to calculate the amount of water used for flushing.
12 Water for flushing is three times the internal volume per flush. 13 Variable costs are mostly US$ 0.4 - 1.0 per m3 permeate.
Interest and amortization is the same number as the variable costs. US$ 1 per m3 permeate in total is a good figure.
14 There are no good rules of thumb for floor space. A lab system will usually take 2 -3 m2. A production system with 1,000 m2 membrane as spiral wound elements needs 30 square meters of floor space. Compared to most other processes, membrane filtration equipment does not take up much floor space.
15 Membranes are a consumable item. All users want to know how long membranes last, but it varies widely
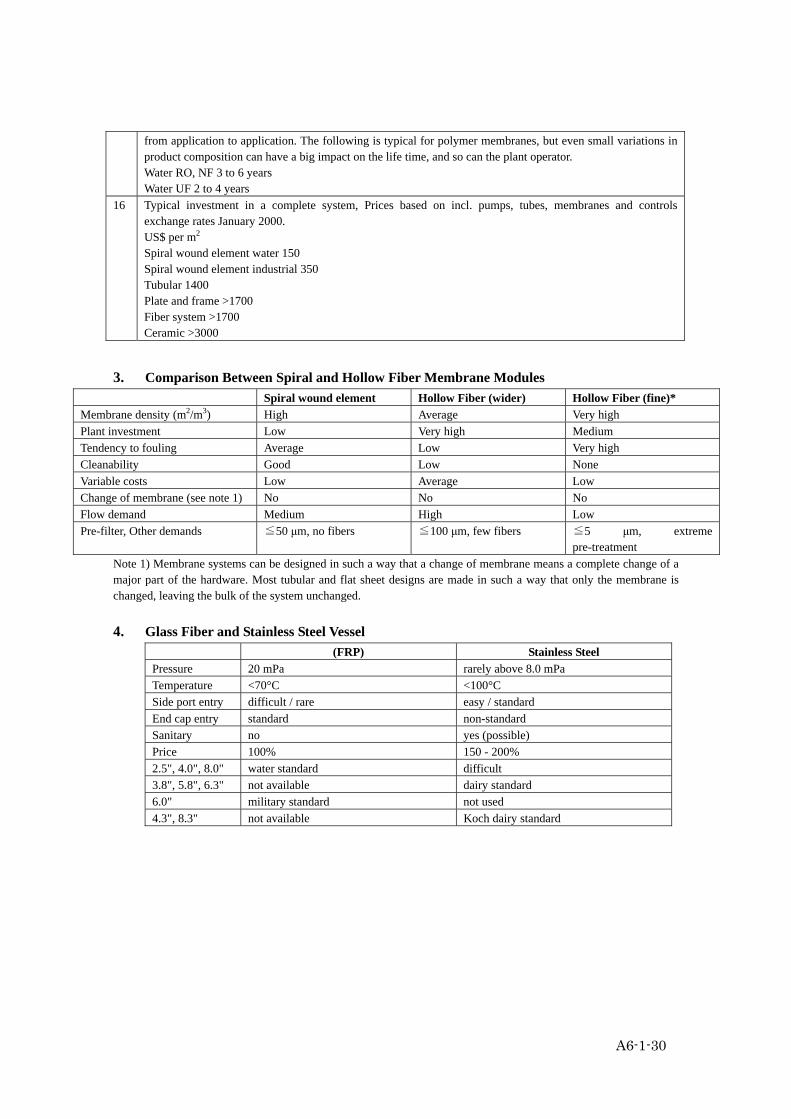
A6-1-30
from application to application. The following is typical for polymer membranes, but even small variations in product composition can have a big impact on the life time, and so can the plant operator. Water RO, NF 3 to 6 years Water UF 2 to 4 years
16 Typical investment in a complete system, Prices based on incl. pumps, tubes, membranes and controls exchange rates January 2000. US$ per m2 Spiral wound element water 150 Spiral wound element industrial 350 Tubular 1400 Plate and frame >1700 Fiber system >1700 Ceramic >3000
3. Comparison Between Spiral and Hollow Fiber Membrane Modules Spiral wound element Hollow Fiber (wider) Hollow Fiber (fine)* Membrane density (m2/m3) High Average Very high Plant investment Low Very high Medium Tendency to fouling Average Low Very high Cleanability Good Low None Variable costs Low Average Low Change of membrane (see note 1) No No No Flow demand Medium High Low Pre-filter, Other demands ≦50 μm, no fibers ≦100 μm, few fibers ≦5 μm, extreme
pre-treatment Note 1) Membrane systems can be designed in such a way that a change of membrane means a complete change of a major part of the hardware. Most tubular and flat sheet designs are made in such a way that only the membrane is changed, leaving the bulk of the system unchanged.
4. Glass Fiber and Stainless Steel Vessel (FRP) Stainless Steel Pressure 20 mPa rarely above 8.0 mPa Temperature <70°C <100°C Side port entry difficult / rare easy / standard End cap entry standard non-standard Sanitary no yes (possible) Price 100% 150 - 200% 2.5", 4.0", 8.0" water standard difficult 3.8", 5.8", 6.3" not available dairy standard 6.0" military standard not used 4.3", 8.3" not available Koch dairy standard
A6-1-31
Desalination: A National Perspective Committee on Advancing Desalination Technology, National Research Council ISBN: 0-309-11924-3, 316 pages, 6 x 9,
(2008)
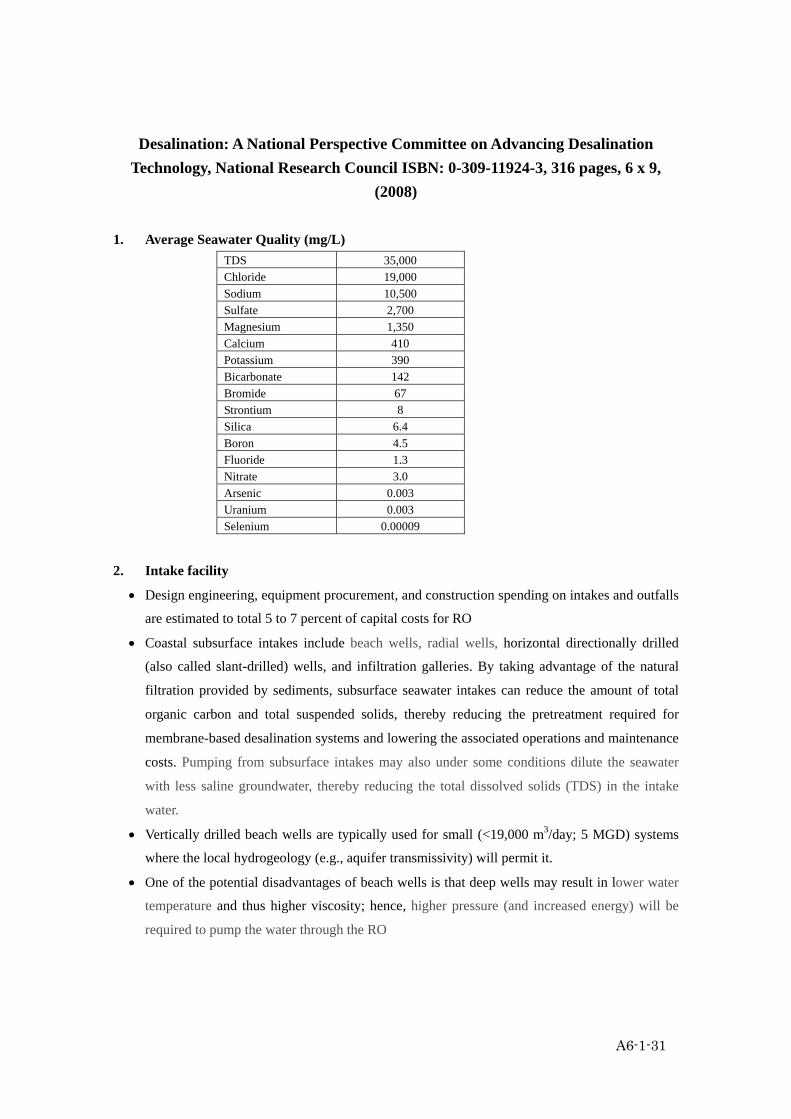
1. Average Seawater Quality (mg/L) TDS 35,000 Chloride 19,000 Sodium 10,500 Sulfate 2,700 Magnesium 1,350 Calcium 410 Potassium 390 Bicarbonate 142 Bromide 67 Strontium 8 Silica 6.4 Boron 4.5 Fluoride 1.3 Nitrate 3.0 Arsenic 0.003 Uranium 0.003 Selenium 0.00009
2. Intake facility
• Design engineering, equipment procurement, and construction spending on intakes and outfalls
are estimated to total 5 to 7 percent of capital costs for RO
• Coastal subsurface intakes include beach wells, radial wells, horizontal directionally drilled
(also called slant-drilled) wells, and infiltration galleries. By taking advantage of the natural
filtration provided by sediments, subsurface seawater intakes can reduce the amount of total
organic carbon and total suspended solids, thereby reducing the pretreatment required for
membrane-based desalination systems and lowering the associated operations and maintenance
costs. Pumping from subsurface intakes may also under some conditions dilute the seawater
with less saline groundwater, thereby reducing the total dissolved solids (TDS) in the intake
water.
• Vertically drilled beach wells are typically used for small (<19,000 m3/day; 5 MGD) systems
where the local hydrogeology (e.g., aquifer transmissivity) will permit it.
• One of the potential disadvantages of beach wells is that deep wells may result in lower water
temperature and thus higher viscosity; hence, higher pressure (and increased energy) will be
required to pump the water through the RO

A6-1-32
Seabed filtration system.
3. Pre-treatment
• Proper pretreatment of feed water is the most important factor in the successful operation of an
RO plant, and pilot testing of the pretreatment process is a critical part of plant design.
• Subsurface seawater intakes, aquatic filter barriers, and deep ocean water intakes can greatly
reduce the need for pretreatment.
4. RO membrane
• For seawater RO, the specific energy usage is typically about 3-7 kwh/m3 with energy recovery
devices
• For brackish water RO, energy usage is comparatively lower, about 0.5-3 kwh/m3
• Predominant Seawater RO Processes Operating temperature (°C) <45 Pretreatment requirement d) High Electrical energy use (kWh/m3) 2.5-7 Current, typical single train capacity (m3/d) a) < 20,000 Product water quality (TDS mg/L) 200-500 b)

A6-1-33
Typical water recovery 35-50% Reliability c) Moderate
a) For the purpose of this table, a train is considered a process subsystem which includes the
high pressure pump, the membrane array(s), energy recovery devices, and associated
instrumentation/control.
However, larger facilities may group pumps, membranes, and energy recovery into process
or pressure centers to lower capital costs and improve operating costs.
b) Product water quality for RO is a design variable. Each pass through an RO plant typically
removes 99 to 99.5 percent of dissolves salts in the feed water. Successive passes using
additional membranes can be added along with other design optimizations to achieve
permeate with the TDS required for a target water use. Potable water requirements can
readily be met with 200-500 mg/L TDS water, which can be achieved from seawater with
a single RO pass.
c) and d) : Compared to electro-dialysis or vapor process
5. Energy Recovery Devices.
• Typically 40 to 60 percent of the applied energy in the process can be lost if the concentrate is
discharged to atmosphere without any attempt to recover that energy.
• In general, energy recovery devices can recover from 75 to 96 percent of the input energy in
the concentrate stream of a seawater RO plant
• Existing energy recovery systems can be divided into two categories.
• The first are devices that transfer the concentrate pressure directly to the feed-stream (e.g.,
pressure exchanger, work exchanger), which have energy recovery efficiencies of about 95
percent.
• The second category includes devices that transfer concentrate pressure to mechanical power,
which is then converted back to feed pressure (e.g., Pelton turbine, Francis turbine,
reverse-running pumps). The overall efficiency of energy recovery here is about 74 percent
(assuming a Pelton turbine efficiency of around 87 percent coupled with a pump efficiency of
85 percent).
6. Typical NF and RO cleaning formulations. Foulant Type Cleaning Solutions
0.2% HCl 0.5% H3PO4 Inorganic saltsa 2% citric acid 2% citric acid
Metal oxides 1% Na2S2O4
Inorganic colloids (silt) 0.1% NaOH, 0.05% Na dodecyl benzene sulfonate, pH 12 Silica (and metal silicates) Ammonium bifluoride

A6-1-34
0.1% NaOH, 0.05% Na dodecyl bezene sulfonate, pH 12 Hypochlorite, hydrogen peroxide, 0.1% NaOH, 0.05% Na dodecyl bezene sulfonate, pH 12 Biofilms and organics 1% sodium tripolyphosphate, 1% trisodium phosphate, 1% sodium EDTA
Source: Dow Chemical
7. Climate Change and Desalination
There seems to be no question that climate change will significantly impact the water resources
sector and, as such, will indirectly impact desalinization. A rise in sea level over tens of years may
have adverse impacts on coastal aquifers from increased seawater intrusion. Direct impacts of rising
ocean levels may over the lifetime of the project have some minor effect on desalination structures
built adjacent to coastlines because current sea-level rise is approximately 2 mm/year (United
Nations Intergovernmental Panel on Climate Change, 2007). Furthermore, storms associated with
climate warming may be of either higher frequency or higher intensity.
Depending on the location of the intake, the temperature of the water may increase slightly, requiring
small changes to the desalination process. Although these direct impacts to desalination structures
and processes appear to be small, they should be clearly understood prior to the design of a major
desalination facility.
8. The Costs and Benefits of Desalination
• The costs for the seawater desalination process by RO to be $0.61/m3. The cost is based on a
system of 100,000 m3/day; a normal interest rate of 6 percent; $450 element cost; $0.05/kWh
energy cost; assumed electricity use of 4.5 kWh/m3; and 20-year capital invest period. Annualized capital costs 0.15
Parts/maintenance 0.03 Chemicals 0.07 Labor 0.10 Membranes (life not specified) 0.03 Electrical energy ($0.05 k/Wh) 0.23
Total ($/m3) 0.61
• Bid construction cost for a 3,000 m3/day (0.8 million gallons per day [MGD]) RO facility was
about $26 million, of which approximately $7 million was accounted for by the costs of a brine
concentrator
• Impact of Water Source, Scale, and Process Design on Capital Costs (38,000 to 380,000
m3/day)
• Membrane Life. Membrane costs are now quite modest, ranging from only 3 to 5 percent of
annual costs. Extending membrane life is likely to have a very small impact on desalination
costs.

A6-1-35
Relative capital costs per cubic meter for seawater and brackish water RO desalination according to facility size. Brackish water is 1,000 mg/L TDS(38,000 to 380,000 m3/day). below 38,000 m3/day
where the costs rise even more dramatically (USBR, 2003)
Effect of facility size, water source, and pretreatment process on relative annual costs per cubic meter for RO plants. The baseline assumptions for this scenario are as follows: energy costs are constant at $0.07/kWh;
membrane life is assumed to be 5 years; nominal interest rate is 5 percent; depreciation period is 25 years.
9. Research to Lower the Costs of Desalination
(1) Improve pretreatment for membrane desalination

A6-1-36
Pretreatment is necessary to remove potential foulants from the source water, thereby ensuring
sustainable operation of the RO membranes at high product water flux and salt rejection. Research to
improve the pretreatment process is needed that would develop alternative, cost-effective
approaches.
• Develop more robust, cost-effective pretreatment processes.
Membrane fouling is one of the most problematic issues facing seawater desalination. Forms
of fouling common with RO membranes are organic fouling, scaling, colloidal fouling, and
bio-fouling. All forms of fouling are caused by interactions between the foulant and the
membrane surface. Improved pretreatment that minimizes these interactions will reduce
irreversible membrane fouling.
Alteration of solution characteristics can improve the solubility of the foulants, preventing their
precipitation or interaction with the membrane surface. Such alteration could be chemical,
electrochemical, or physical in nature.
Membranes such as microfiltration (MF) and ultrafiltration (UF) have several advantages over
traditional pretreatment (e.g., conventional sand filtration) because they have a smaller footprint,
are more efficient in removing smaller foulants, and provide a more stable influent to the RO
membranes. Additional potential benefits of MF or UF pretreatment are increased flux,
increased recovery, longer membrane life, and decreased cleaning frequency. More research is
necessary in order to optimize the pretreatment membranes for more effective removal of
foulants to the RO system, to reduce the fouling of the pretreatment membranes, and to improve
configuration of the pretreatment membranes to maximize cost reduction.
• Reduce chemical requirements for pretreatment.
Antiscalants, coagulants, and oxidants (such as chlorine) are common chemicals applied in the
pretreatment steps for RO membranes. Although these chemicals are added to reduce fouling,
they add to the operational costs, can reduce the operating life of membranes, and have to be
disposed of properly or they can adversely impact aquatic life. Antiscalants may also enhance
bio-fouling, so alternative formulations or approaches should be examined. Research is needed
on alternative formulations or approaches (including membrane pretreatment) to reduce the
chemical requirements of the pretreatment process, both to reduce overall cost and to decrease
the environmental impacts of desalination.
(2) Improve membrane system performance
A6-1-37
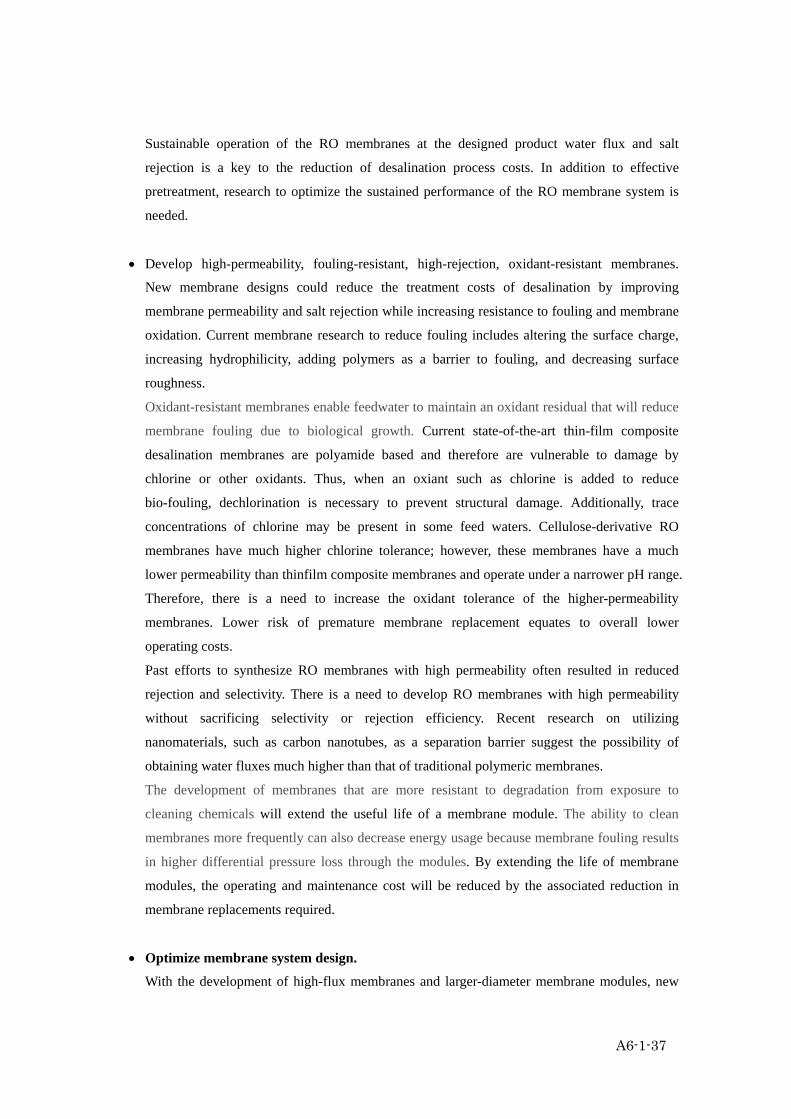
Sustainable operation of the RO membranes at the designed product water flux and salt
rejection is a key to the reduction of desalination process costs. In addition to effective
pretreatment, research to optimize the sustained performance of the RO membrane system is
needed.
• Develop high-permeability, fouling-resistant, high-rejection, oxidant-resistant membranes.
New membrane designs could reduce the treatment costs of desalination by improving
membrane permeability and salt rejection while increasing resistance to fouling and membrane
oxidation. Current membrane research to reduce fouling includes altering the surface charge,
increasing hydrophilicity, adding polymers as a barrier to fouling, and decreasing surface
roughness.
Oxidant-resistant membranes enable feedwater to maintain an oxidant residual that will reduce
membrane fouling due to biological growth. Current state-of-the-art thin-film composite
desalination membranes are polyamide based and therefore are vulnerable to damage by
chlorine or other oxidants. Thus, when an oxiant such as chlorine is added to reduce
bio-fouling, dechlorination is necessary to prevent structural damage. Additionally, trace
concentrations of chlorine may be present in some feed waters. Cellulose-derivative RO
membranes have much higher chlorine tolerance; however, these membranes have a much
lower permeability than thinfilm composite membranes and operate under a narrower pH range.
Therefore, there is a need to increase the oxidant tolerance of the higher-permeability
membranes. Lower risk of premature membrane replacement equates to overall lower
operating costs.
Past efforts to synthesize RO membranes with high permeability often resulted in reduced
rejection and selectivity. There is a need to develop RO membranes with high permeability
without sacrificing selectivity or rejection efficiency. Recent research on utilizing
nanomaterials, such as carbon nanotubes, as a separation barrier suggest the possibility of
obtaining water fluxes much higher than that of traditional polymeric membranes.
The development of membranes that are more resistant to degradation from exposure to
cleaning chemicals will extend the useful life of a membrane module. The ability to clean
membranes more frequently can also decrease energy usage because membrane fouling results
in higher differential pressure loss through the modules. By extending the life of membrane
modules, the operating and maintenance cost will be reduced by the associated reduction in
membrane replacements required.
• Optimize membrane system design.
With the development of high-flux membranes and larger-diameter membrane modules, new

A6-1-38
approaches for optimal RO system design are needed to avoid operation under thermodynamic
restriction and to ensure equal distribution of flux between the leading and tail elements of the RO
system. The key variables for the system design will involve the choice of optimal pressure, the
number of stages, and number and size of membrane elements at each stage. An optimal system
configuration may also involve hybrid designs where one type of membrane (e.g., intermediate
flux, highly foulingresistant) is used in the leading elements followed by high-flux membranes in
the subsequent elements. Fouling can be mitigated by maintaining high crossflow velocity; thus,
foulingresistant membranes may be better served in the downstream positions where lower
crossflow velocity is incurred. Thus, additional engineering research on membrane system design
is needed to optimize performance with the objective of reducing costs.
• Develop lower-cost, corrosion-resistant materials of construction.
The duration of equipment life in a desalination plant directly relates to the total costs of the
project. Saline and brackish water plants are considered to be a corrosive environment due to
the high levels of salts in the raw water. The development and utilization of corrosion-resistant
materials will minimize the frequency of equipment or appurtenance replacement, which can
significantly reduce the total project costs.
• Develop ion-selective processes for brackish water.
Some slightly brackish waters could be made potable simply though specific removal of
certain contaminants, such as nitrate or arsenite, while removing other ions such as sodium,
chloride, and bicarbonate at a lower rate.
High removal rates of all salts are not necessary for such waters. Ion-specific separation
processes, such as an ion-selective membrane or a selective ion-exchange resin, should be able
to produce potable water at much lower energy costs than those processes that fully desalinate
the source water. Ion-selective removal would also create fewer waste materials requiring
disposal.
Ion-selective processes would be useful for mildly brackish groundwater sources with high
levels of nitrate, uranium, radium, or arsenic. Such an ion-selective process could also be used
to optimize boron removal following RO desalination of seawater.
• Develop hybrid desalination processes to increase recovery.
Overall product water recovery in a desalination plant can be increased through the serial
application of more than one desalination process. For example, an RO process could be
preceded by a “tight” nanofiltration process, allowing the RO to operate at a higher recovery
than it could with less aggressive pretreatment. Other options could be devised, including

A6-1-39
hybrid thermal and membrane processes to increase the overall recovery of the process.
The possible hybrid combinations of desalination processes are limited only by ingenuity and
identification of economically viable applications. Hybridization also offers opportunities for
reducing desalination production costs and expanding the flexibility of operations, especially
when collocated with power plants, but hybridization also increases plant complexity and
raises challenges in operation and automation.
(3) Improve existing desalination approaches to reduce primary energy use
Energy is one of the largest annual costs in the desalination process. Thus, research to improve the
energy efficiency of desalination technologies could make a significant contribution to reducing
costs.
• Develop improved energy recovery technologies and techniques for desalination.
Membrane desalination is an energy-intensive process compared to treatment of freshwater
sources. Modern energy recovery devices operate at up to 96 percent energy recovery, although
these efficiencies are lower at average operating conditions. The energy recovery method in
most common use today is the energy recovery (or Pelton) turbine, which achieves about 87
percent efficiency. Many modern plants still use Pelton wheels because of the higher capital
cost of isobaric devices. Thus, opportunities exist to improve recovery of energy from the
desalination concentrate over a wide operating range and reduce overall energy costs.
• Research configurations and applications for desalination to utilize low-grade or waste
heat.
Industrial processes that produce waste or low-grade heat may offer opportunities to lower the
operating cost of the desalination process if these heat sources are co-located with desalination
facilities. Low-grade heat can be used as an energy source for desalination via commercially
available thermal desalination processes. Hybrid membrane-thermal desalination approaches
offer additional operational flexibility and opportunities for water production cost savings.
Research is needed to examine configurations and applications of current technologies to
utilize low-grade or waste heat for desalination.
• Understand the impact of energy pricing on existing desalination technology over time.
Energy is one of the largest components of cost for desalination, and future changes in energy
pricing could significantly affect the affordability of desalination. Research is needed to
examine to what extent the economic and financial feasibility of desalination may be
threatened by the uncertain prospect of energy price increases in the future for typical
A6-1-40
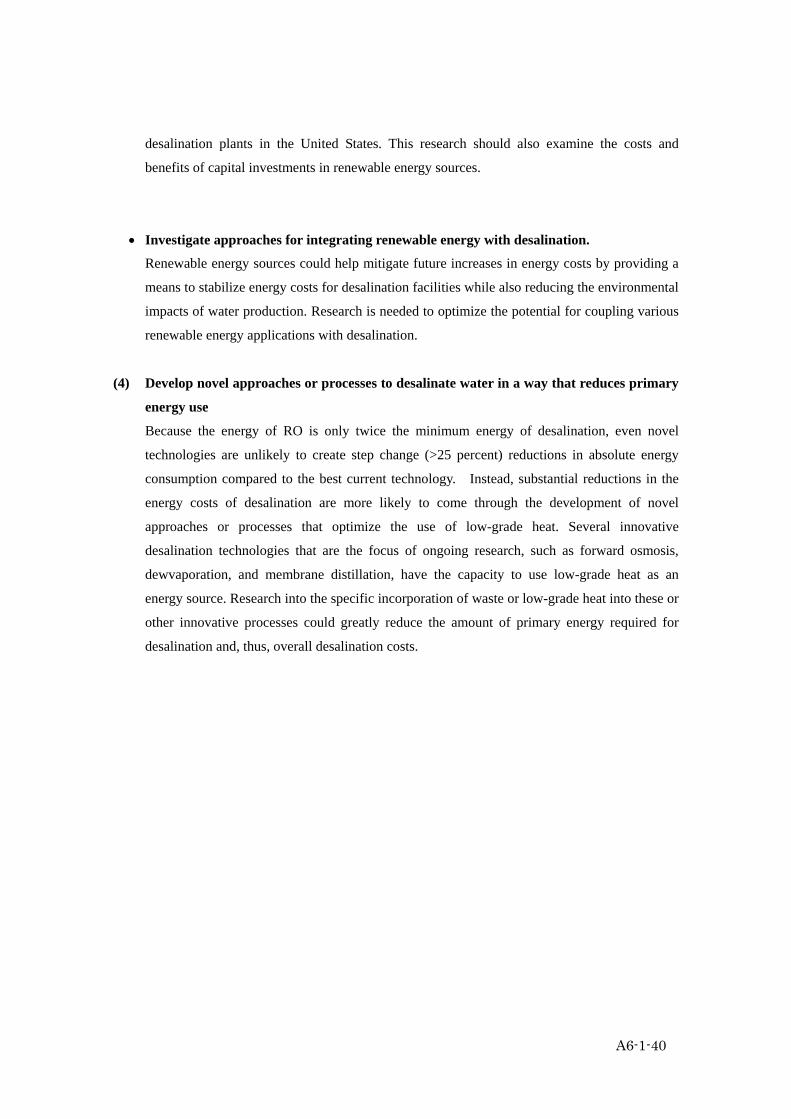
desalination plants in the United States. This research should also examine the costs and
benefits of capital investments in renewable energy sources.
• Investigate approaches for integrating renewable energy with desalination.
Renewable energy sources could help mitigate future increases in energy costs by providing a
means to stabilize energy costs for desalination facilities while also reducing the environmental
impacts of water production. Research is needed to optimize the potential for coupling various
renewable energy applications with desalination.
(4) Develop novel approaches or processes to desalinate water in a way that reduces primary
energy use
Because the energy of RO is only twice the minimum energy of desalination, even novel
technologies are unlikely to create step change (>25 percent) reductions in absolute energy
consumption compared to the best current technology. Instead, substantial reductions in the
energy costs of desalination are more likely to come through the development of novel
approaches or processes that optimize the use of low-grade heat. Several innovative
desalination technologies that are the focus of ongoing research, such as forward osmosis,
dewvaporation, and membrane distillation, have the capacity to use low-grade heat as an
energy source. Research into the specific incorporation of waste or low-grade heat into these or
other innovative processes could greatly reduce the amount of primary energy required for
desalination and, thus, overall desalination costs.

A6-1-41

A6-1-42
A6-1-43
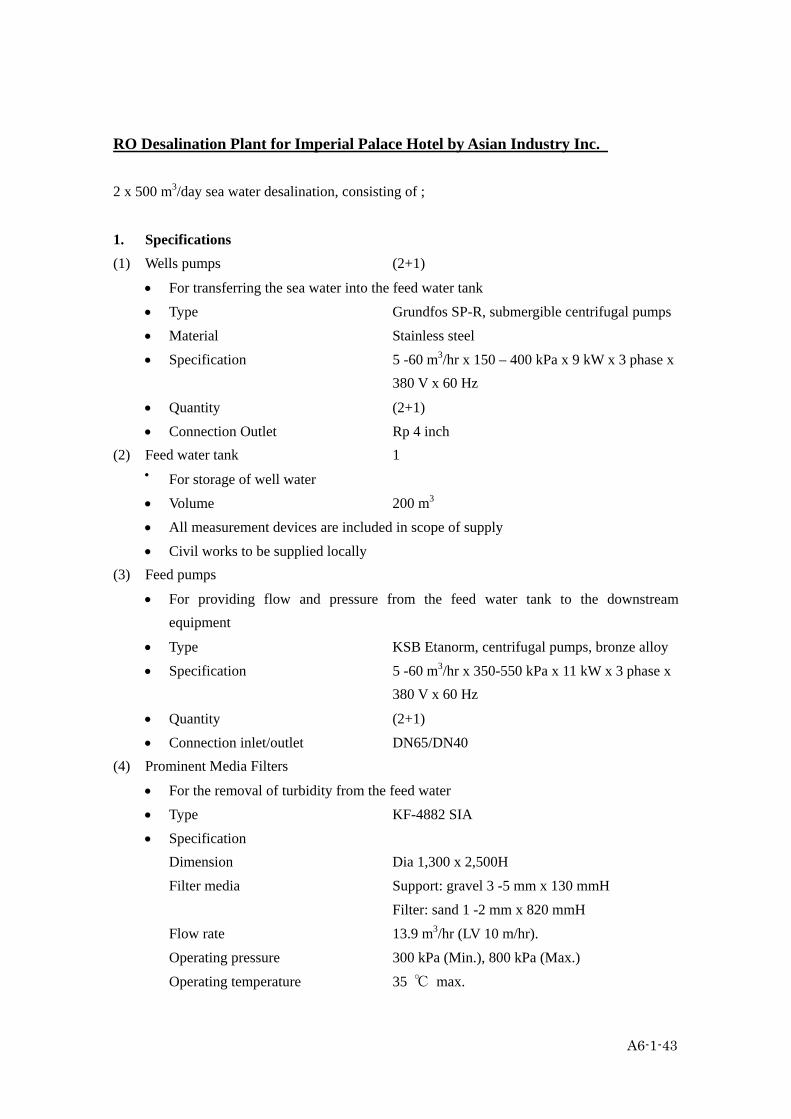
RO Desalination Plant for Imperial Palace Hotel by Asian Industry Inc. 2 x 500 m3/day sea water desalination, consisting of ;
1. Specifications (1) Wells pumps (2+1)
• For transferring the sea water into the feed water tank • Type Grundfos SP-R, submergible centrifugal pumps • Material Stainless steel • Specification 5 -60 m3/hr x 150 – 400 kPa x 9 kW x 3 phase x 380 V x 60 Hz
• Quantity (2+1) • Connection Outlet Rp 4 inch
(2) Feed water tank 1 • For storage of well water
• Volume 200 m3 • All measurement devices are included in scope of supply • Civil works to be supplied locally
(3) Feed pumps
• For providing flow and pressure from the feed water tank to the downstream equipment
• Type KSB Etanorm, centrifugal pumps, bronze alloy • Specification 5 -60 m3/hr x 350-550 kPa x 11 kW x 3 phase x 380 V x 60 Hz
• Quantity (2+1) • Connection inlet/outlet DN65/DN40
(4) Prominent Media Filters
• For the removal of turbidity from the feed water • Type KF-4882 SIA • Specification
Dimension Dia 1,300 x 2,500H Filter media Support: gravel 3 -5 mm x 130 mmH Filter: sand 1 -2 mm x 820 mmH Flow rate 13.9 m3/hr (LV 10 m/hr). Operating pressure 300 kPa (Min.), 800 kPa (Max.)
Operating temperature 35 ℃ max.

A6-1-44
Air temperature 40 ℃ max. Backwash 19 m3/hr (LV 14 m/hr) Backwash pressure loss 80 kPa Backwash period 5- 20 minuets Backwash volume 1.6 – 6.4 m3
• Materials Pressure vessel x 1 Fiber glass Control valves x 1 ABS + fiber glass type SIATA Pressure gauges x 2 Stainless steel (316 or similar)
• Quantity 2 (parallel) • Notes
- Including distributer for raw water, ascending pipe and sieve for filtered water, support gravel and filter sand (both to be filled into pressure vessel at site
- Electronic controller for programming of backwash cycles as well as backwash periods
- Limit switch for switching off the RO-unit during backwashing - Unit pre assembled and ready for connection - Space for installation for one filter is 2,500H x 1,600x 1,600 - Gross weight on filter 1,700 kg
(5) Prominent dosing system
• For injection of AntiScalant to prevent membrane scaling • Type Bt4a • Specifications
Capacity 0.74 l/hr Back pressure max.1 MPa Volume of dosing tank 60 l Suction lance 6 x 4 mm Dosing hose 6 x 4 mm Motor 0.02 kW x 230 V x 60 Hz
• Materials Dosing tank x 1 PE Suction launce x 1 PP with 2 stages float switch fault indicator Injection valve x 1 PVC Meter dosing hose x 5 PE
• Quantity 1 (6) Prominent Inline mixer

A6-1-45
• For optimizing of chemical reactions in the feed water • Type PE-DN 100 • Specifications
Total capacity mixture 50 m3/hr Pressure loss 10 kPa Connection DN 100
Dimension φ110 x 500 mm Material construction PVC
• Quantity 1 (7) Prominent ORP-controlling “OPR”-measurement of raw water”
• For control and monitoring of the final ORP value of the raw water • Type D1Ca OPR
Redox controller Type D1CA x 1 DGM in –line probe housing x 1 Redox recorder x 1
• Specifications Power supply 230 v x 60Hz Measure range 1,000 to + 1,000 (mV) Relay control alarm relay
Ambient temperature 0.5 -50 ℃ Dimensions 125W x 75D x 135H
• Quantity 1 (8) Prominent pH-controlling “pH”-measurement of raw water”
• For control and monitoring of the pH value of the raw water • Type D1Ca pH
pH controller Type D1CA x 1 DGM in line probe hosing x 1 pH sensor x 1
• Specifications Power supply 230 v x 60Hz Measure range 1 to 12 Relay control alarm relay
Ambient temperature 0.5 -50 ℃ Dimensions 125W x 75D x 135H
• Quantity 1

A6-1-46
• Quantity 1 (9) Prominent conductivity-controller ”Cond-measurement of raw water”
• For control and monitoring of the conductivity of the raw water • Type D1Ca Cond
Conductivity controller Type D1CA DGM in –line probe housing x 1 Inductive conductivity sensor x 1
• Specifications Power supply 230 v x 60Hz Measure range 0.2 to 1,000 mS/cm Relay control alarm relay
Ambient temperature 0.5 -50 ℃ Dimensions 125W x 75D x 135H
• Quantity 1 (10) Prominent RO unit (20 m3/hr/unit) incl. AC for control cabinet
• For desalination of sea water • Type Pro 1700SW ERI • Quantity 1
(11) Prominent Dosing Station
• For injection of NaOCl • Type Bt4a • Specifications
Capacity approx. 0.74 l/hr Back pressure max. 1 MPa Volume of dosing tank 60 l Suction lance 6 x 4 mm Dosing hose 6 x 4 mm Motor 0.02 kW x 230 V x 60 Hz
• Materials Dosing tank x 1 PE Suction launce x 1 PP with 2 stages float switch fault indicator Injection valve x 1 PVC
Meter dosing hose x 5 PE
• Quantity 1 (12) Prominent Dosing Station
• For injection of Na2CO3

A6-1-47
• Type Bt4a • Specifications
Capacity approx. 12.3 l/hr Back pressure max. 0.4 MPa Volume of dosing tank 1,000 l Suction lance 8 x 5 mm Dosing hose 8 x 5 mm Motor 0.02 kW x 230 V x 60 Hz
• Materials Dosing tank x 1 PE Suction launce x 1 PP with 2 stages float switch fault indicator Injection valve x 1 PVC
Meter dosing hose x 5 PE
• Quantity 1 (13) Prominent Dosing Station
• For injection of CaCl2 • Type Bt4a • Specifications
Capacity approx. 12.3 l/hr Back pressure max. 0.4 MPa Volume of dosing tank 1,000 l Suction lance 8 x 5 mm Dosing hose 8 x 5 mm Motor 0.02 kW x 230 V x 60 Hz
• Materials Dosing tank x 1 PE Suction launce x 1 PP with 2 stages float switch fault indicator Injection valve x 1 PVC
Meter dosing hose x 5 PE
• Quantity 1 (14) Prominent Inline mixer
• For optimizing of chemical reactions in the permeate line • Type PE-DN 65 • Specifications
Total capacity mixture 20 m3/hr Pressure loss 11 kPa

A6-1-48
Connection DN 65
Dimension φ75 x 500 mm
• Material construction PVC • Quantity 1
(15) Prominent pH- controller
• For control and monitoring of the pH values of the permeate • Type D1Ca pH incl. Accessories
pH controller Type D1CA x 1 DGM in line probe hosing x 1 pH sensor x 1
• Specifications Power supply 230 v x 60Hz Measure range 1 to 12 Relay control alarm relay
Ambient temperature 0.5 -50 ℃
• Dimensions 125W x 75D x 135H • Quantity 1
(16) Prominent conductivity -controller
• For control and monitoring of the conductivity value of the permeate • Type D1Ca cond. incl. Accessories
Conductivity controller Type D1CA x 1 DGM in line probe hosing x 1 Conductive conductivity sensor x 1
• Specifications Power supply 230 v x 60Hz Measure range 0.01 to 20 (mS/cm) Relay control alarm relay
Ambient temperature 0.5 -50 ℃
• Dimensions 125W x 75D x 135H • Quantity 1
(17) Permeate storage tank
• For storage of product water • Volume (min.) 800 m3 • Quantity 1 • Civil works construction to be supplied locally • All necessary level measurements, scope of supply

A6-1-49
(18) Prominent central control panel (each line independent)
• For control and monitoring of the positions 1-18 • Type PM CCP17 • Quantity 1
(19) Product pumps
• For transferring the product water into the hotel distribution • Type Grundfos CR • Specifications Flow 5-15 m3/hr Pressure 320-570 kPa Power supply 5.5 kW x 380 V x 3 phases x 60 Hz Connection (Inlet/Outlet) DN 65/DN65
• Material Stainless steel DIN 1.4401 • Quantity (3+1)
2. Price 780,000 US $
• Deliver on site, CIF Cebu • Including transport, installation and start up service • Exclusions;
- Raw water tank - Product water storage tank - Building permits, DENR license - Main power supply to the plant room - Construction of civil works and drainage
3. Delivery time Approx. 12- 14 weeks after clarification of all technical and commercial issues

A6-1-50
Notes: 1. The sea water RO design is based on a theoretically feed water analysis with a TDS of
35,000 mg/l and a temperature of 25 ℃. The feed water entering the RO-unit s beach well sea water or sea water coming from an open intake which is suitably pre-treated. In general the feed water entering the Ro-unit should be filtered, chemically conditioned,
have a COD<5 mg/l, fouling index≦3.0, max turbidity 0.5 NTU, and it is to be free of oil, chlorine, H2S and colloidal SiO2. Further parameters such as Ba, Sr, Fe, Mn Al are to be in acceptance non-scaling concentrations.
2. If the sea water comes from a good maintained well, the following pre- and post treatment are recommended;
• Homogenous distribution of the injected chemicals via inline mixer • Filtration over 25 μm or a sand filter for removal of SS (in addition to 5μm filter on
RO)
• Injection of anti-scalant (e.g. Permatreat) to prevent precipitation of sparingly soluble salt in the sea water
• Monitoring of the redox potential, pH and conductivity of the sea water via suitable controllers
• Injection of NaOCl or Ca(OCl)2 to disinfect the permeate of RO • Injection of (Na2CO3 + CaCl2) to adjust the pH and hardness of the permeate
according to WHO
• Monitoring of the pH and conductivity of the final drinking water via suitable controllers
3. The daily consumption of anto-scalant (e.g. Permatreat 100 for sea water) can be calculated after provision of a detailed feed water analysis.
4. The salt rejection of the proposed RO is approximately 99 % for the sea water desalination unit, perfect drinking water quality will be produced having salinities well under 500 mg/l. However, due to the low permeate pH and low hardness it is necessary and recommended to adjust the pH and the hardness of the final drinking water, eg. by injection of Na2CO3
and CaCl2, or by filtration over dolomite. Finally, a disinfection e.g. by NaOCl or chlorine dioxide should be done before it is distributed into the hotel.

A6-1-51
5. Proposed RO units are supposed to run at a recovery of 40 % (sea water desalination unit). This might be able to be optimized after provision of a detailed feed water nalysis.
6. The estimated energy consumption of the above sea water desalination RO-Unit is to be expected around 2.6 to 3 kWh/m3 of permeate only, because the state of the energy recovery by pressure exchanger is applied.
7. Control cabinet for the power distribution and control of the complete for each version as offered above.
8. At least 300 kPa is required directly before the RO plants.
9. Prominent Sea Water Desalination RO-Unit Type PRO SW ERI For desalination of filtered and chemically conditioned sea water according to theoretically created sea water analysis with a max. feed water salinity (TDS) of 35,000 mg/l at a temperature
of 25 ℃ (to be free of residual Chlorine, colloidal SiO2, and H2S, COD < 5 mg/l, fouling index ≦3.0 and max. turbidity 0.5 NTU. Further parameters such as Ba, Sr, Fe, Mn, Al are to be in accordance to WHO guidelines), consiting of;
• Compact frame made of stainless steel x 1 • Front table for control instruments mad of PP x 1 • Pre-filter made of PP incl. filter bag 5 μm x 1
• Set of glycerol filled pressure gauges made of stainless steel x 1 • Motor valve for raw water made of PES x 1 • Set of check valves made of PVC + stainless steel x 1 • Pressure switch for raw water x 1 • Thermometer made of stainless steel x 1 • High pressure axial piston pumps in parallel operation brand new Danfoss made of duplex
and super duplex stainless steel x1
• Set (5 pieces) of pressure vessels mad of glass fiber • Set (30 pieces) of membrane elements made of composite membrane (PE, PS, PA*)
x 1
• Pressure exchanger incl. booster pump and incl. variable frequency drive for energy recovery from brine stream x 1
• Magnetic inductive flow meters made of neoprene coated mild steel for flow on pressure exchanger low and high pressure side x 2

A6-1-52
• Variable area type flow meter for permeate and concentrate flow made of polyamide x 2
• Set of sampling valves made of PVC and stainless steel x 1 • CIP system for chemical cleaning, disinfecting or stand still conservation of modules and
piping incl. pump made of stainless steel, cartridge filters made of PP, tank made of PE, 2 –way valves and drain valve x 1
• System for automatic filling of cleaning tank and rinsing of membranes by permeate at every unit shut off x 1
• Interconnecting piping made of PVC, stainless steel DIN 1.4539 or equal at high-pressure side x 1
• Air conditioned micro-processor control panel according to EN 60204, DIN VDE 0113 standard-protection class IP 54 incl. - backlit graphical display with real text messages, digital conductivity meter, adjustable
limit values, - operation and malfunction real text messages and LEDs,
main switch, menue for activation of automatic operation and cleaning or disinfecting, 1 potential-free contact for remote alarm, terminals for pre-treatment units as softner, dosing pumps, hardness control as well
as level control for permeate tank Note: * PE = Polyester, PS=Polysulfon, PA=Polyamide; PP=Polypropylene
10. Technical Data of Prominent Sea Water Desalination RO-Unit Pro SW ERI per unit • Permeate flow rate at 25 ℃ Approx. 20.8 m3/hr
(16.7 m3/day/element)
• Operating pressure Approx. 6.3 MPa • Recovery* Max. 40 (%) • Raw water consumption Approx. 50 (m3/hr) • Required raw water pressure (min./max.) 0.3/0.6 MPa • Rejection rate 99 % • Main supply 380 v x 60 Hz • Power installed 55 + 7.5 kW • R.O power/m3 2.2 kWh • Connections: Raw water, permeate, concentrate DN 100, 65, 80

A6-1-53
• Dimensions of RO frame 7,000W x 1,400D x 2,200H • Dimensions filter frame 2,500W x 2,500D x 1,800H • Dimensions cleaning tank φ1,100 x 1,720H
Note:
- Prominent RO units are produced according to EC (European Community) standards and will be delivered incl. EC conformity declaration as well as CE (Certificate European) plate.
- The max. recovery can only be adjusted in case of best water quality, fouling index ≦3.0 problem free operation, and according to the needed permeate quality.
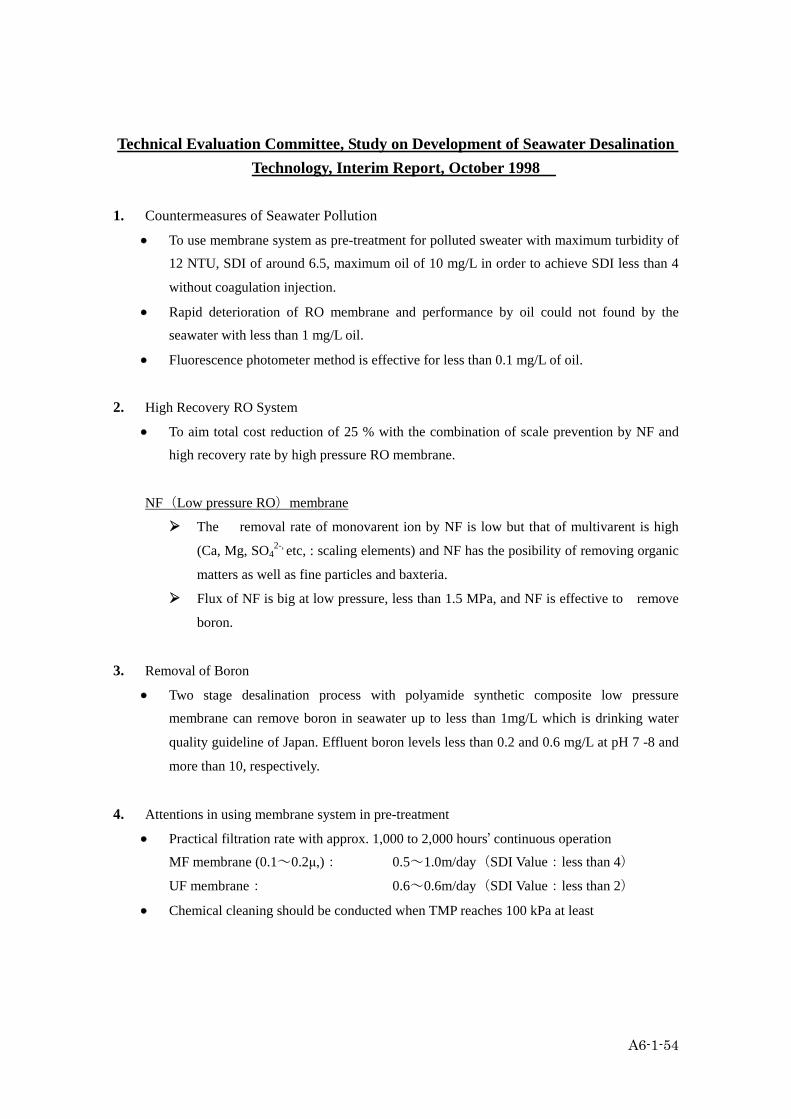
A6-1-54
Technical Evaluation Committee, Study on Development of Seawater Desalination Technology, Interim Report, October 1998
1. Countermeasures of Seawater Pollution
• To use membrane system as pre-treatment for polluted sweater with maximum turbidity of
12 NTU, SDI of around 6.5, maximum oil of 10 mg/L in order to achieve SDI less than 4
without coagulation injection.
• Rapid deterioration of RO membrane and performance by oil could not found by the
seawater with less than 1 mg/L oil.
• Fluorescence photometer method is effective for less than 0.1 mg/L of oil.
2. High Recovery RO System
• To aim total cost reduction of 25 % with the combination of scale prevention by NF and
high recovery rate by high pressure RO membrane.
NF(Low pressure RO)membrane
The removal rate of monovarent ion by NF is low but that of multivarent is high
(Ca, Mg, SO42-, etc, : scaling elements) and NF has the posibility of removing organic
matters as well as fine particles and baxteria.
Flux of NF is big at low pressure, less than 1.5 MPa, and NF is effective to remove
boron.
3. Removal of Boron
• Two stage desalination process with polyamide synthetic composite low pressure
membrane can remove boron in seawater up to less than 1mg/L which is drinking water
quality guideline of Japan. Effluent boron levels less than 0.2 and 0.6 mg/L at pH 7 -8 and
more than 10, respectively.
4. Attentions in using membrane system in pre-treatment
• Practical filtration rate with approx. 1,000 to 2,000 hours’ continuous operation
MF membrane (0.1~0.2μ,): 0.5~1.0m/day(SDI Value:less than 4)
UF membrane: 0.6~0.6m/day(SDI Value:less than 2)
• Chemical cleaning should be conducted when TMP reaches 100 kPa at least

A6-2. Breakdown of Project Components
1 Well φ3,000 to 4,000 diameter wellSeawater Pump φ200 x 3Porus concrete pipe
2 Intake Pipe Intake: PVC φ200 x 3, L=30m x3Overflow: PVC φ200 x 1, L=30mFlexible connecter, Air valve, Butterfly valve
3 Raw SeawaterTank
L4.0m x B5.0m x H5.3mWaterproofing paintingButterfly valve, Flexible Connecter,Drain pipeφ200,L=20m
4 RODesalinationFacility
3,000m3/day RO unitPre-treatment unitChemical dosing unitHigh pressure pumpCIP system
5 Electricity andGeneratorFacility
Electricity panels (No.1 LV, No.2 LV, Static capacitor,Intake pump, Distribution pump, Chemical dosing)Backup generator
6 Building RO desalination plant buildingElectricity and generator roomControl room or adminstration room
See plan for details
7 Treated WaterTank andPump Room
L12.0m x B10.5m x H5.3mWaterproofing paintingPump room L8.0m x B10.5m x H5.3mFlexible connecter,Drain pipeφ200,L=100mOverflow pipeφ200,L=80m
8 DistributionPipe and Pump
PVC pipe φ250, L=200mDistribution pump, 1.83~0.85m3/min, h=27~48mFlow meter for φ250
9 Waste watertank
L4.0m x B5.0m x H5.3mWaterproofing paintingButterfly valve, Flexible connecter,Drain pipeφ200,L=20m
Almost same as 3. Influent tank
10 Discharge Pipe PVC pipe φ300, L=700mDistribution outlet, Butterfly valve, Flexible connecter
See plan for details
11 Pavement etc. Administration roadGravel and asphalt pavement
See plan for details
Chemicals andAnalysisMachinery
FI (SDI), pH, Turbidity, Residual chlorine, Electricconductivity, ORP meter, Anthracite, Sand, NaClO, etc.
-
Design andmanagement
Construction management, Operation test and training, Softcomponet
-
MCWD responsibility
Including RO exchange, Chemicals, Electricity, Manning,Sand and Anthracite exchange, Cartridge filter exchange andRepair cost 5% Initial
MCWD responsiblity,Unit cost 50Php/m3
Note: RO excnage will be every 5 years (20% per year)
O&M Cost(per year)
Contingency 8%
No. Image
See plan for details
SpecificationsFacilities
Grand Total
Others
Total
VAT 12%
Step and cover
Raw
Cinder
Overflow
Drain
Level meter
Generator
Over flow φ200
Intake φ200
Drain φ200
Feeding to Desolination plant
Pump room
Treated water strage As reservoir
A6-2-1
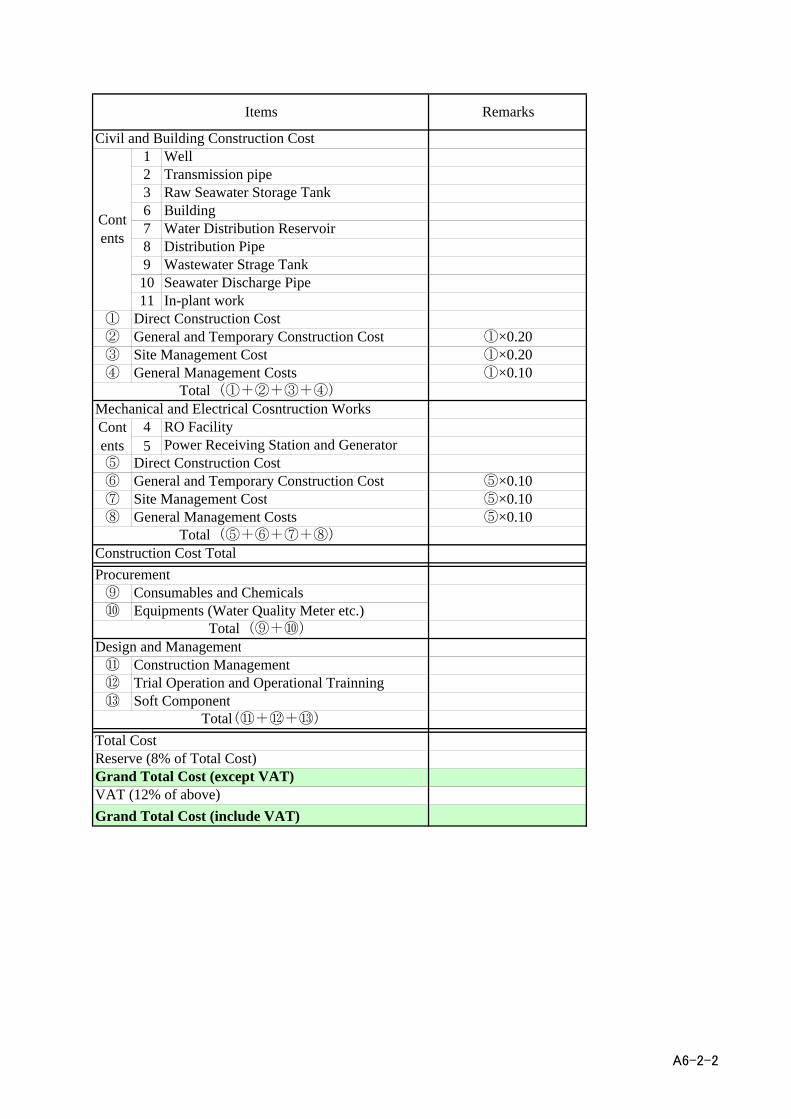
1 Well2 Transmission pipe3 Raw Seawater Storage Tank6 Building7 Water Distribution Reservoir8 Distribution Pipe9 Wastewater Strage Tank
10 Seawater Discharge Pipe11 In-plant work
① Direct Construction Cost② General and Temporary Construction Cost ①×0.20③ Site Management Cost ①×0.20④ General Management Costs ①×0.10
4 RO Facility5 Power Receiving Station and Generator
⑤ Direct Construction Cost⑥ General and Temporary Construction Cost ⑤×0.10⑦ Site Management Cost ⑤×0.10⑧ General Management Costs ⑤×0.10
Construction Cost Total
⑨ Consumables and Chemicals⑩ Equipments (Water Quality Meter etc.)
Design and Management⑪ Construction Management⑫ Trial Operation and Operational Trainning⑬ Soft Component
Reserve (8% of Total Cost)Grand Total Cost (except VAT)VAT (12% of above)Grand Total Cost (include VAT)
Contents
Total(⑨+⑩)
Remarks
Total(⑪+⑫+⑬)
Total Cost
Items
Civil and Building Construction Cost
Procurement
Mechanical and Electrical Cosntruction Works
Contents
Total(①+②+③+④)
Total(⑤+⑥+⑦+⑧)
A6-2-2

Well
No. Item Q-ty1 Drilling Works
φ3,000-4,00015m x 1 15 m
2 Well Logging & Casing Installation
1 set3 Gravel Packing & Seal 1 set4 Surface Sealing with cement 1 set
Sub-total5 Sea water Pump (submarged type)
3 set6 Pump Installation
Footstool, etc.3 set
7 Well Development & Pumping Test
1 set8 Transportation (to and return)
1 set9 Porous concrete pipe
φ300mm x 10m x 2 pipes 20 mSubtotal 1 set
10 Others (Water Level Meter, Cover, Step, etc., 10% of above)
Total
A6-2-3
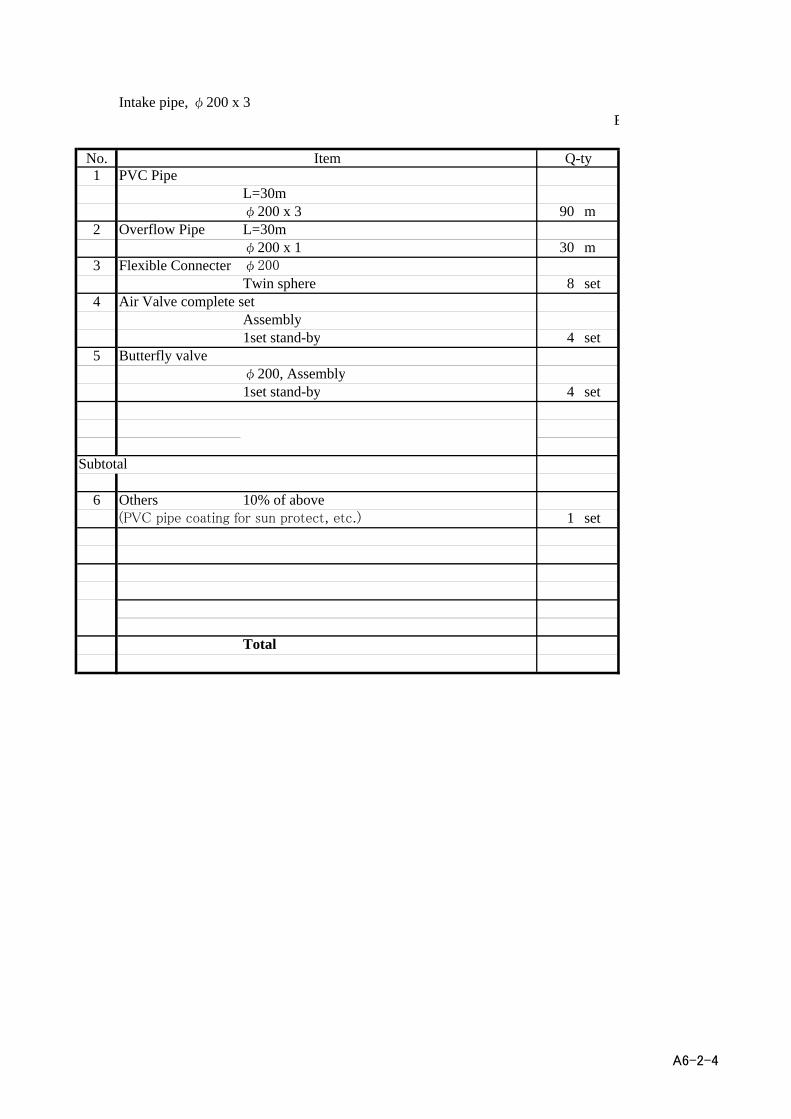
Intake pipe, φ200 x 3E
No. Item Q-ty1 PVC Pipe
L=30mφ200 x 3 90 m
2 Overflow Pipe L=30mφ200 x 1 30 m
3 Flexible Connecter φ200Twin sphere 8 set
4 Air Valve complete setAssembly1set stand-by 4 set
5 Butterfly valveφ200, Assembly1set stand-by 4 set
Subtotal
6 Others 10% of above(PVC pipe coating for sun protect, etc.) 1 set
Total
A6-2-4

Raw Seawater Tank
No. Item Q-ty1 Earthwork
Back-hoe 50 m3
Backfilling Manpower 20 m3
2 Gravel Base 9 m3
Mortar 5 m3
1 set3 Rainforced Concrete
4.0m x 5.0m x 5.3m50 m3
4 Form workAssembly 200 m2
5 Waterproofing painting
100 m2
6 Pipe workEnveded pipe φ200 x 5set
φ300 x 1 set 6 set7 Butterfly valve
Assemblyφ300 x 1 set 1 set
8 Flexible Connecter φ200Twin sphere 3 set
9 Pipe work Drain pipeL=20mφ300 x 2 set 40 m
Subtotal
10 Others (Manhole, Water level meter, etc.)10% of Above 1 set
Total
A6-2-5

RO desalination plant
No. Item Q-ty1
1000m3/day x 3 unit 3 unit
Total
A6-2-6

Electricity, Generation facility
No. Item Q-ty1 Backup Generator
1,000kVA, Mafler 1 set2 Electricity Panels
No.1 LV, No.2 LV, Static Capacitor, Intake Pump,Distribution Pump, Chemical dosing 1 set
Subtotal
3 The establishment costs35% of above subtotal
Total
A6-2-7

RO, Electricity and Generator Building
No. Item Q-ty1 Earthwork
Back-hoe 3,000 m3
Backfilling Manpower 500 m3
2 RO desalination plant
750 m2
3 Electricity and Generator Room
50 m2
4 Control room or Adminstration room
50 m2
5 Administration room etc.
100 m2
Total
A6-2-8

Treated Water Tank
No. Item Q-ty1 Earthwork
Back-hoe 170 m3
Backfilling Manpower 60 m3
2 Rainforced ConcreteTank 12 x 10.5 x 5.3mPump room 8 x 10.5 x 5.3m 290 m3
3 Form workAssembly 550 m2
4 Flexible Connecter φ250 1φ200 2Assembly
5 Pipe workEnveded pipe φ150
φ200Assembly 6 set
6 Waterproofing painting
400 m2
7 Drain from Resovoir tankφ200
100 m8 Overflow from Resovoir tank
φ20080 m
Subtotal
9 Others (Manhole, Water level meter, etc.)10% of Above 1 set
Total
A6-2-9

Distribution pipe φ250 x 1, Distribution Pump
No. Item Q-ty1 PVC Pipe
L=200mφ250 x 1 200 m
2 Flexible Pipe φ250Assembly 1 set
3 Air valve for φ250Assembly 2 set
4 Butterfly valve φ100 x 3 3 setφ150 x 3 3 setφ250 x 1 1 setAssembly
5 Distribution pump 1.83~0.85m3/minh=27~48m
3 set6 Flow Meter
for φ250Assembly 1 set
Subtotal
7 Others10% of Above 1 set
Total
A6-2-10

Waste Water Tank
No. Item Q-ty1 Earthwork
Back-hoe 50 m3
Backfilling Manpower 20 m3
2 Gravel Base 8 m3
Mortar 4 m3
1 set3 Rainforced Concrete
4.0m x 5.0m x 5.3m50 m3
4 Form workAssembly 200 m2
5 Pipe workL=10mφ200 x 3 set 30 m
6 Waterproofing painting
600 m2
Gravity flow
Subtotal
7 Others (Manhole, Water level meter, etc.)10% of Above 1 set
Total
A6-2-11
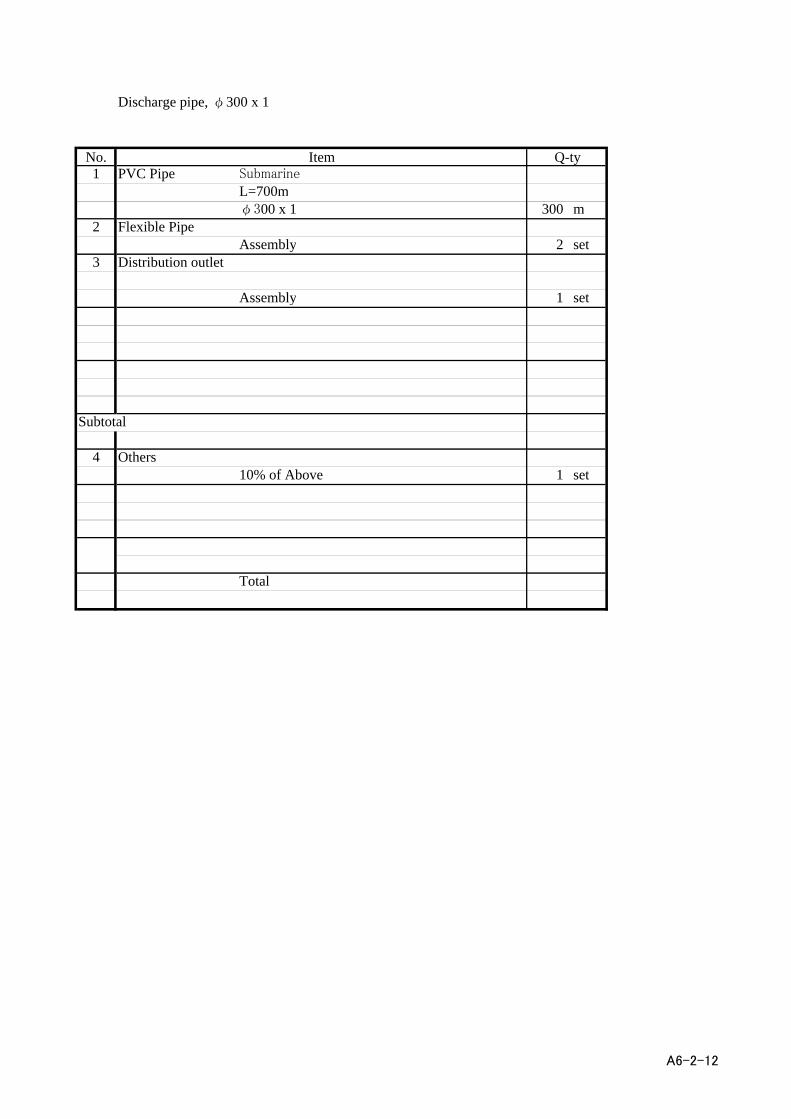
Discharge pipe, φ300 x 1
No. Item Q-ty1 PVC Pipe Submarine
L=700mφ300 x 1 300 m
2 Flexible PipeAssembly 2 set
3 Distribution outlet
Assembly 1 set
Subtotal
4 Others10% of Above 1 set
Total
A6-2-12

Pavement etc.
No. Item Q-ty1 Gravel Pavement 550 m2
Asphalt Pavement 550 m2
Subtotal2 Excavation
180 m3
3 Back filling with compaction
180 m3
Total
A6-2-13

Consumablles, Chemicals
No. Item Q-ty1 Anthracite
13 ton2 Sand for water purification
20 ton3 NaClO 10% liquid
Dose: 0.5 to 2.5 mg/L1 ton
5 Anti-scalant 63% or 75% liquidDose: 40 to 50 mg/L
1.35 m36 SBS (NaHSO3)
3.8 m37 NaOH 20% liquid
Post treatment for pH control0.54 m3
8 RO unit stock for one(1) year
Total
A6-2-14

Instruments
No. Item Q-ty1 FI (SDI) measurement tools
1 set2 pH meter with temperature meter
1 set3 Turbidity meter
1 set4 Residual chlorine analyzer
1 set5 Electric conductivity meter
1 set6 ORP meter
1 set
Total
A6-2-15
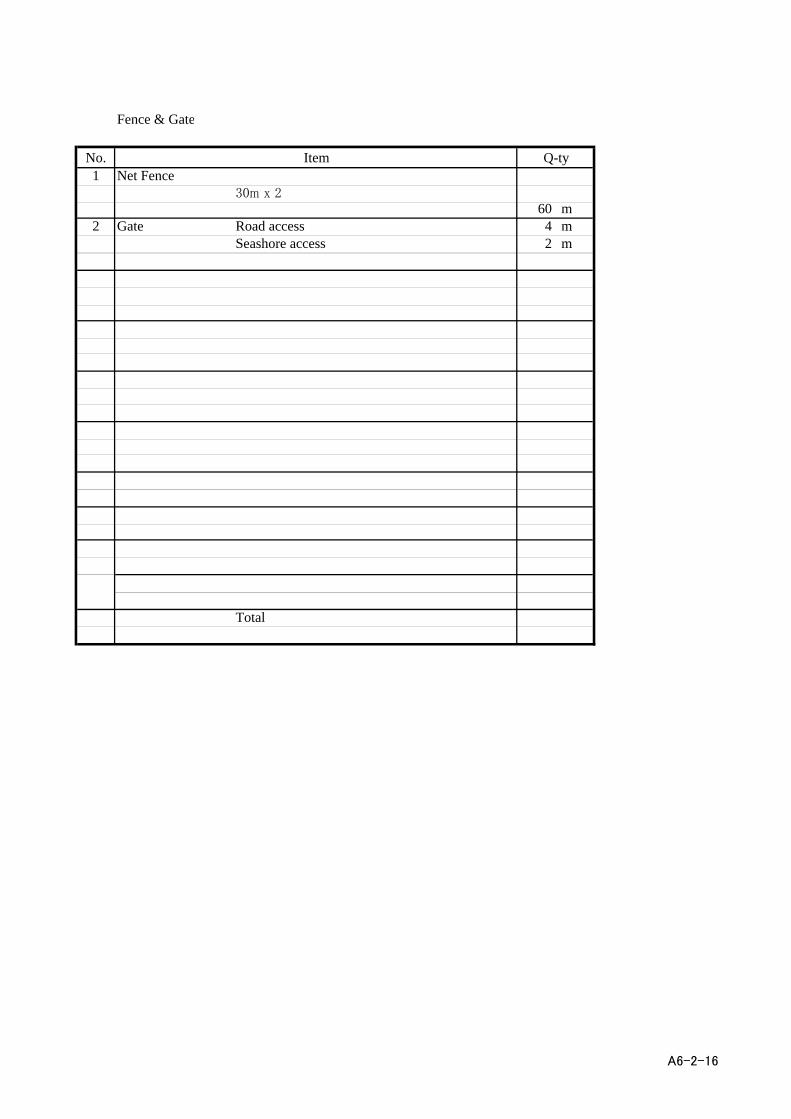
Fence & Gate
No. Item Q-ty1 Net Fence
30m x 260 m
2 Gate Road access 4 mSeashore access 2 m
Total
A6-2-16
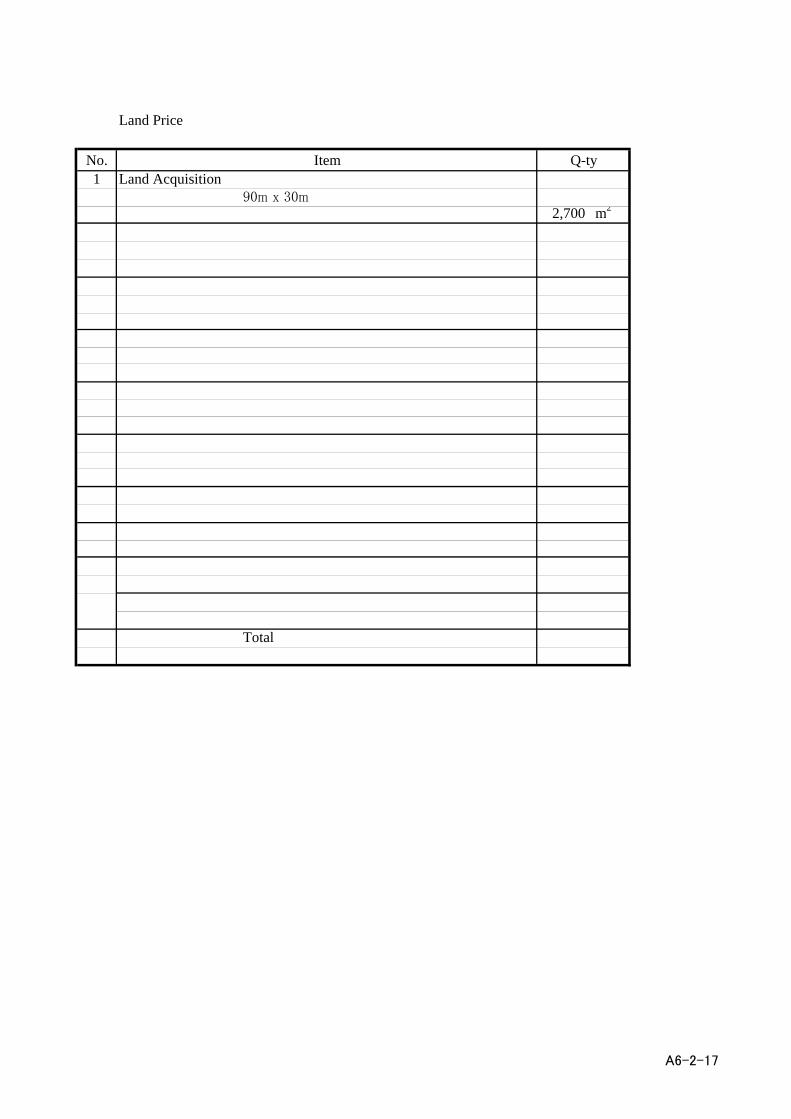
Land Price
No. Item Q-ty1 Land Acquisition
90m x 30m2,700 m2
Total
A6-2-17

Breakdown for Electrical EquipmentName Parts Q'ty Remarks
N0.1 LV Feeder Panel panel 1 1000W MCCB3P 1000A 2 motor operatedMCCB3P 150A 1 with ZCTtie transformer 50kVA 1 440V/220-110VMCCB3P 100A 2MCCB3P 50A 1PT 6CT 6V meter 2A meter 2F meter 1Power Factor meter 1WHM 1AS, VS 4Total JS base
N0.2 LV Feeder Panel panel 1 1000W MCCB3P 300A 3 with ZCTMCCB3P 100A 3 with ZCTMCCB3P 100A 2Total JS base
Static Capacitor Panel panel 1MCCB3P 50A 5Static Capacitor 3 20kVA with SRTotal JS base
Intake Pump Panel panel 1PT 1CT 1V meter 1A meter 1MCCB 100A 1MCCB 50A 7MCCB 30A 1 with ZCTDirect on-line stater 3 15kWReverse starter 3 0.4kWtie transformer 5kVA 1MCCB 10A 3COS 2p 3CS 2p 3CS 3p 3Lamp 15Total JS base
Distribution Pump Panel panel 1PT 1CT 1V meter 1A meter 1MCCB 100A 1MCCB 50A 7MCCB 30A 1 with ZCTDirect on-line stater 3 30kWReverse starter 3 0.4kWtie transformer 5kVA 1MCCB 10A 3COS 2p 3CS 2p 3CS 3p 3Lamp 15Indicating Controller 1 pH controll
A6-2-18
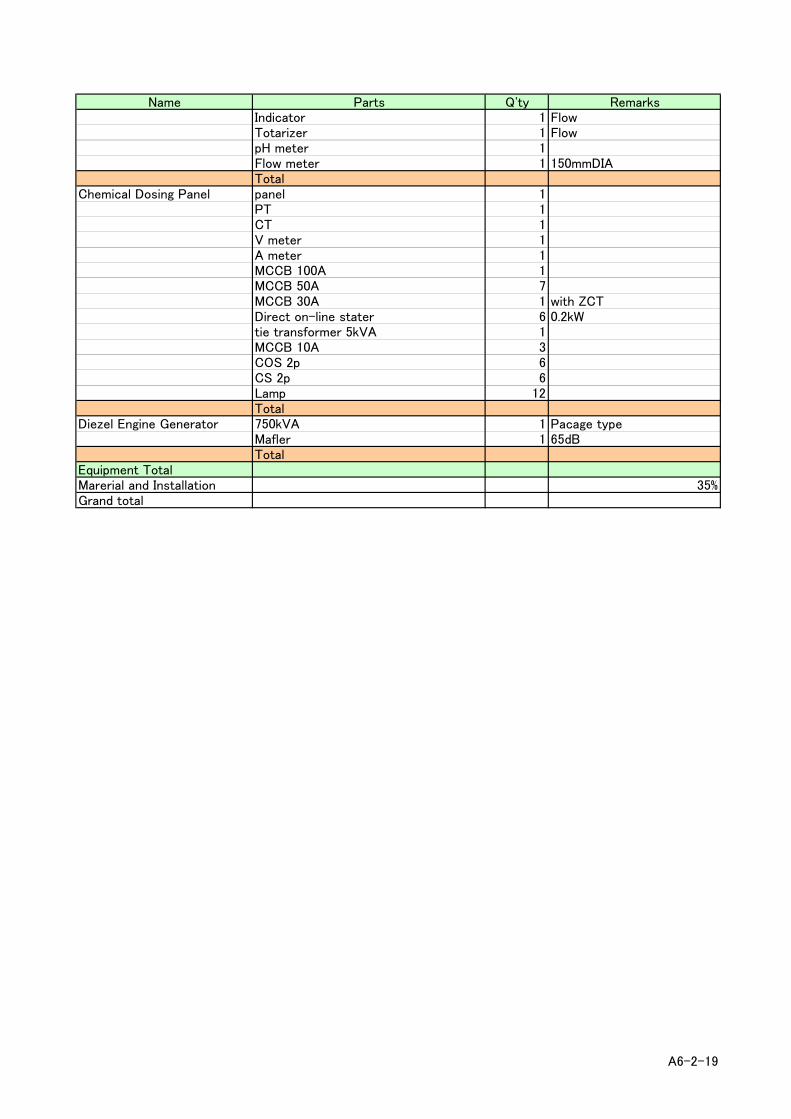
Name Parts Q'ty RemarksIndicator 1 FlowTotarizer 1 FlowpH meter 1Flow meter 1 150mmDIATotal JS base
Chemical Dosing Panel panel 1PT 1CT 1V meter 1A meter 1MCCB 100A 1MCCB 50A 7MCCB 30A 1 with ZCTDirect on-line stater 6 0.2kWtie transformer 5kVA 1MCCB 10A 3COS 2p 6CS 2p 6Lamp 12Total JS base
Diezel Engine Generator 750kVA 1 Pacage typeMafler 1 65dBTotal
Equipment TotalMarerial and Installation 35%Grand total
A6-2-19
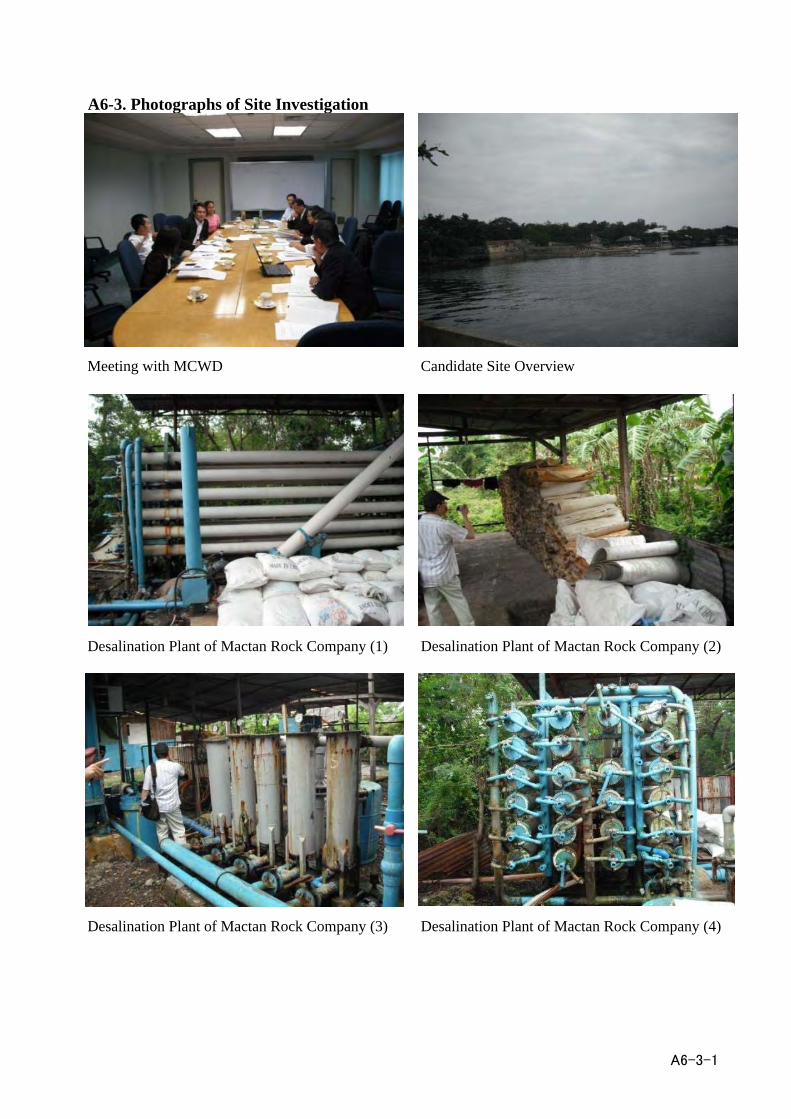
A6-3. Photographs of Site Investigation
Meeting with MCWD Candidate Site Overview
Desalination Plant of Mactan Rock Company (1) Desalination Plant of Mactan Rock Company (2)
Desalination Plant of Mactan Rock Company (3) Desalination Plant of Mactan Rock Company (4)
A6-3-1

Tisa Water Treatment Plant (1) Tisa Water Treatment Plant (2)
Tisa Water Treatment Plant (3) Tisa Water Treatment Plant (4)
Dam Site for Tisa Water Treatment Plant Dam Site for Tisa Water Treatment Plant
A6-3-2
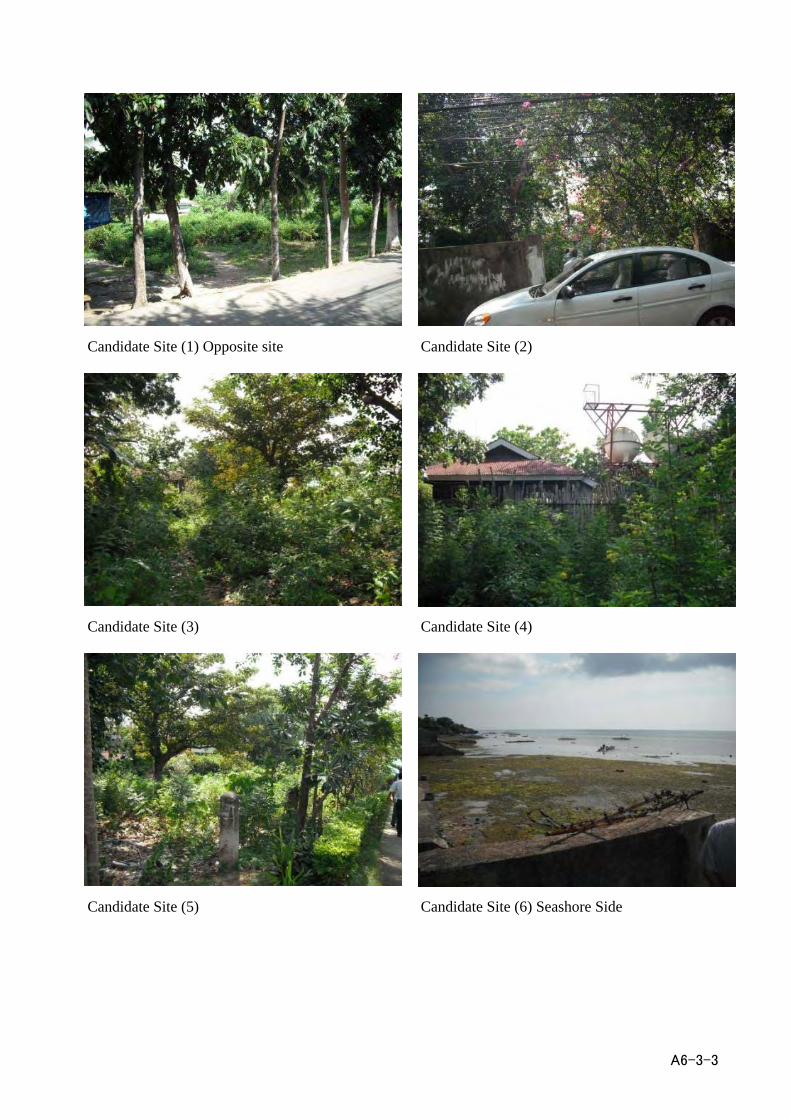
Candidate Site (1) Opposite site Candidate Site (2)
Candidate Site (3) Candidate Site (4)
Candidate Site (5) Candidate Site (6) Seashore Side
A6-3-3

Candidate Site (7) Seashore Side Candidate Site (8) Seashore Side
Candidate Site (9) Seashore Side Candidate Site (10) Seawater Condition
Electricity Receiving Facility Image Meeting with NEDA Reagion7 (Cebu)
A6-3-4

A-7.Official Letters
A-7