Embed Size (px)
DESCRIPTION
A Comparative Study on Biodegradation of selected Monomers: Effect of Molecular Structure. Jongtai Jung (Professor/Ph. D). Major of Environmental Engineering College of Urban Science , University of Incheon. Introduction. The biological breakdown and degradation of both - PowerPoint PPT Presentation
Citation preview

A Comparative Study on Biodegrada-tion of selected Monomers:
Effect of Molecular Structure
Jongtai Jung (Professor/Ph. D)
Major of Environmental EngineeringCollege of Urban Science, University of
Incheon

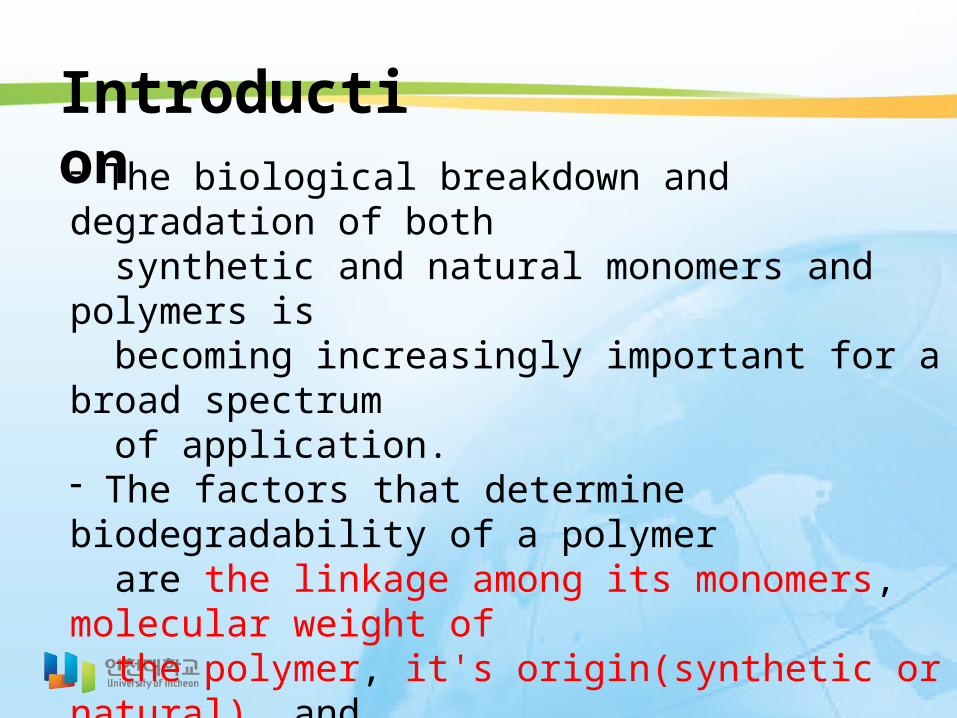
- The biological breakdown and degradation of both synthetic and natural monomers and polymers is becoming increasingly important for a broad spectrum of application.- The factors that determine biodegradability of a polymer are the linkage among its monomers, molecular weight of the polymer, it's origin(synthetic or natural), and molecular structure of the monomer. - A systematic study of the degradation of monomers may be helpful in understanding of the degradability of polymers
Introduction
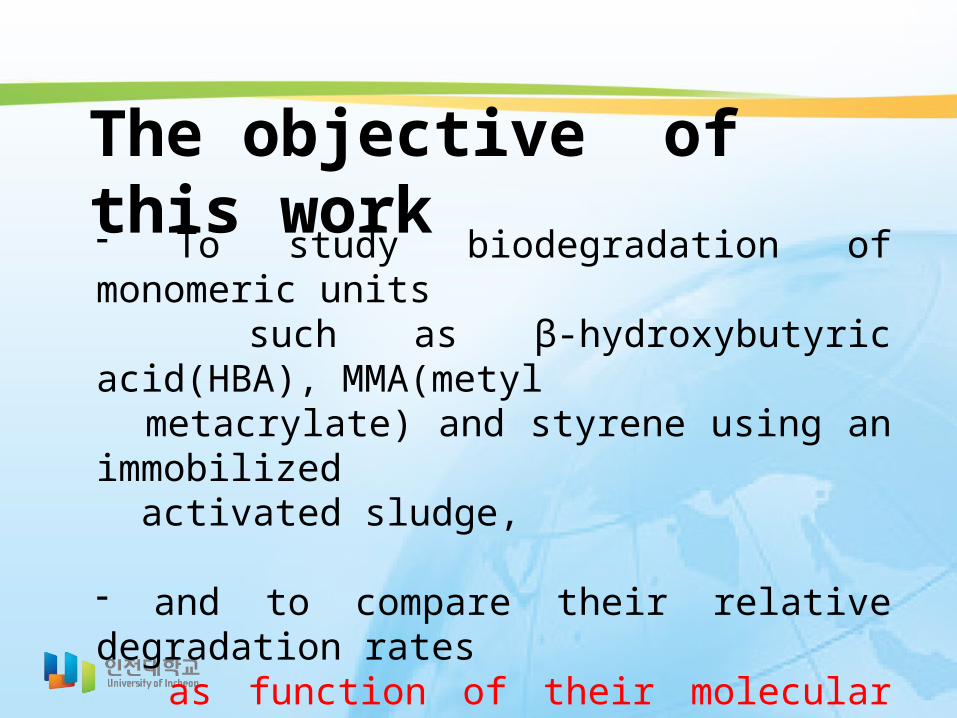
- To study biodegradation of monomeric units such as β-hydroxybutyric acid(HBA), MMA(metyl metacrylate) and styrene using an immobilized activated sludge,
- and to compare their relative degradation rates as function of their molecular structure.
The objective of this work
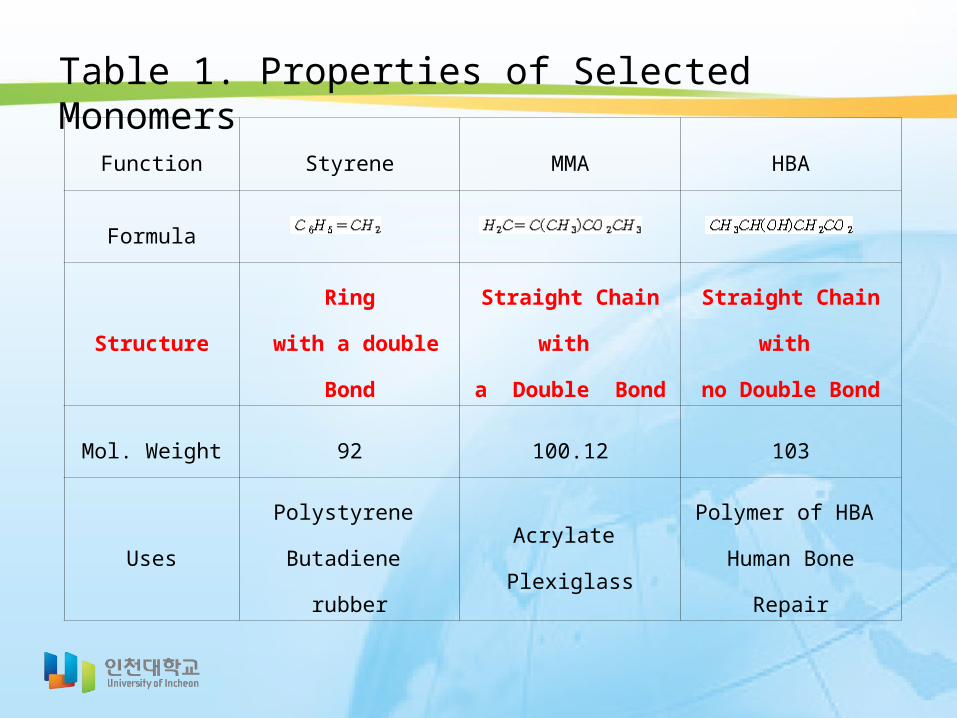
Function Styrene MMA HBA
Formula
StructureRing
with a double Bond
Straight Chain with
a Double Bond
Straight Chain with
no Double Bond
Mol. Weight 92 100.12 103
UsesPolystyrene
Butadiene rubberAcrylate Plexiglass
Polymer of HBA
Human Bone Repair
Table 1. Properties of Selected Monomers
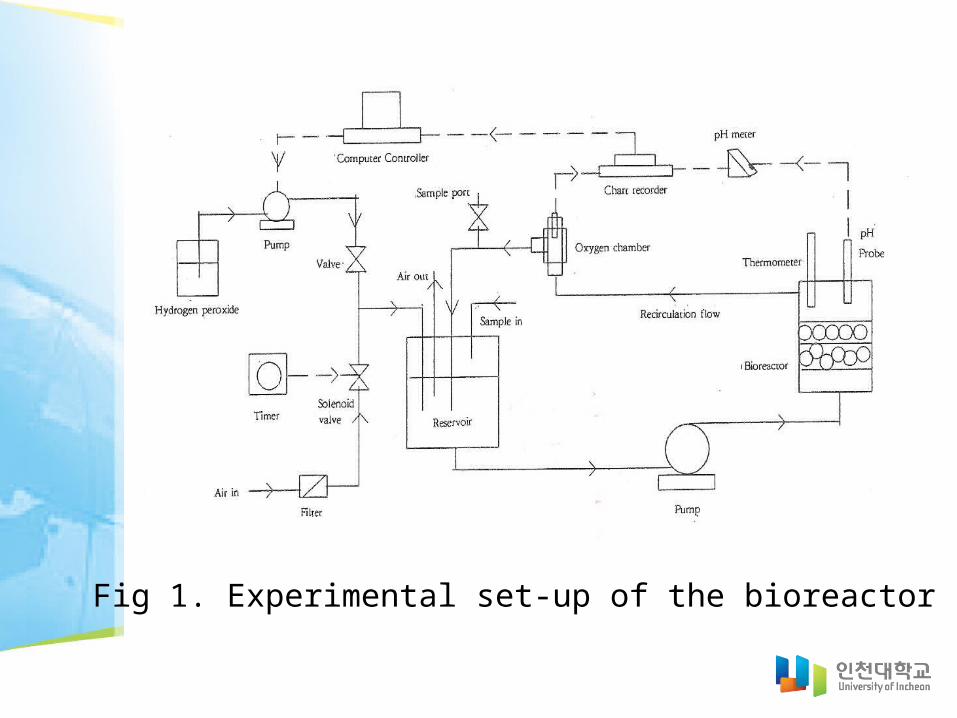
Fig 1. Experimental set-up of the bioreactor
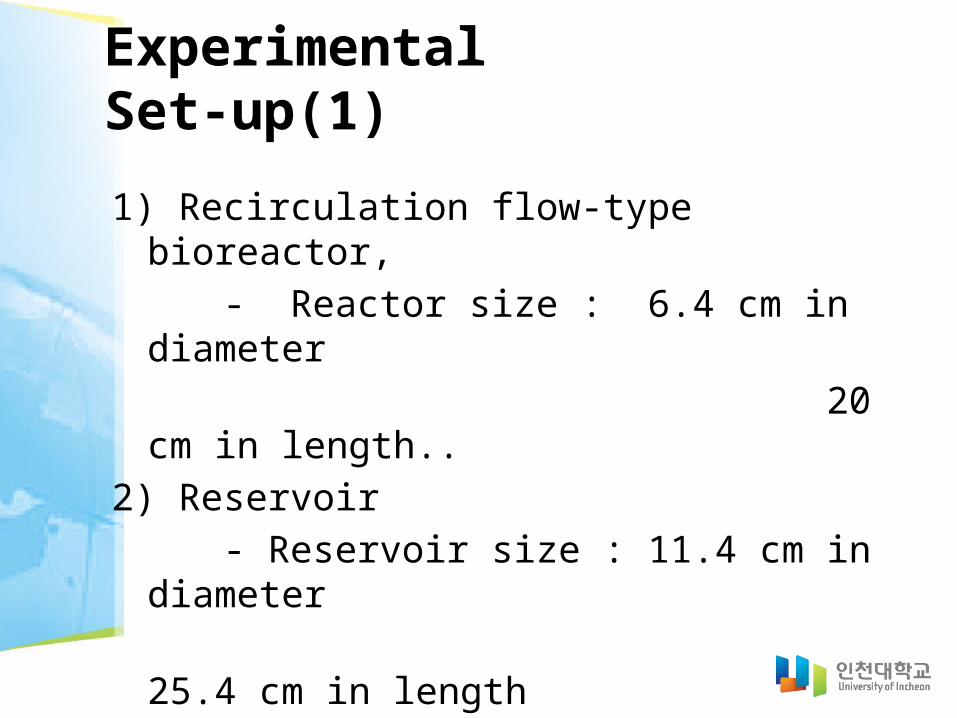
Experimental Set-up(1)
1) Recirculation flow-type bioreactor, - Reactor size : 6.4 cm in diameter 20 cm in length.. 2) Reservoir - Reservoir size : 11.4 cm in diameter 25.4 cm in length3) Total reaction volume - 2 liters including the reservoir.
Experimental Set-up(2)1) Culture medium - 100 ppm MgCl2, - 0.5 ppm FeCl3
- 10 ppm MgSO4, - 10 ppm K2PO4
2) Oxygen supply - Air (1.5 liter/min for HBA,) - H2O2 (3% v/v for Styrene, MMA)3) Recirculation flow rate : 325ml/min.4) Chosen Substrate - MMA(Methyl methacylate), Styrene - β-hydroxybutyric acid(HBA),
• Activated sludge(Mixed microbial population) from Waste water treatment plant• 100 g alginate-immobilized activated sludge• How to immobilize - Distilled water - Concentrated sludge(50 mg dry biomass/ g of pallet) - 0.5% sodium chloride - 1% sodium alginate - 0.1 mol/liter CaCl2
- Distilled water and Conc. Pellets in a ratio 5:2 mixed with NaCl and Sodium Alginate in a blender - The homogeneous cell suspension was then extruded using a syringe pump into CaCl2 solution to obtain the immobilized bacterial beads
Microorganism
1) Dissolved Oxygen concentration : - Clark-type dissolved oxygen probe - Chart recorder.2) MMA, Styrene Concentration : - Perkin Elmer 8500 Gas Chromatograph, - Detector : FID3) HBA Concentration - Perkin Elmer HPLC - Diode array detector at a wavelength of 215 nm3) pH : - pH probe (Orion Cat. No. 91-04) - pH meter (Corning Model 250, NY)
Analytical Methods
- Experiments were conducted by spiking the reservoir with the compound of interest to a predetermined concentration - Samples from the reservoir were then analyzed periodically to determine the rate of biodegradation after accounting for abiotic losses
- Control experiment were performed with only alginate beads(without the microbes) under identical experimental conditions to determine abiotic losses due to adsorption, volatilization, and chemical reactions
Experimental Methods
1) Rate of oxygen consumption (nmol/min∙ml)
2) pH
3) Rate of phenol biodegradation(ppm/hr)
Parameters to be monitored

Results and discussions
- Figure 2 shows biodegradation of styrene, as well as abiotic removal of styrene from the reactor. - The data indicate that initially the concentration of styrene drops rapidly due to its adsorption on the alginate beads. -This is shown by the line AB and AD. Later, the drop in concentration is gradual in both cases, but relatively higher when biomass is present (see line BC and DE). - Line BC indicates losses due to volatilization while line DE indicates removal of styrene by both biotic and abiotic losses.
1) Biodegradation of styrene(1)
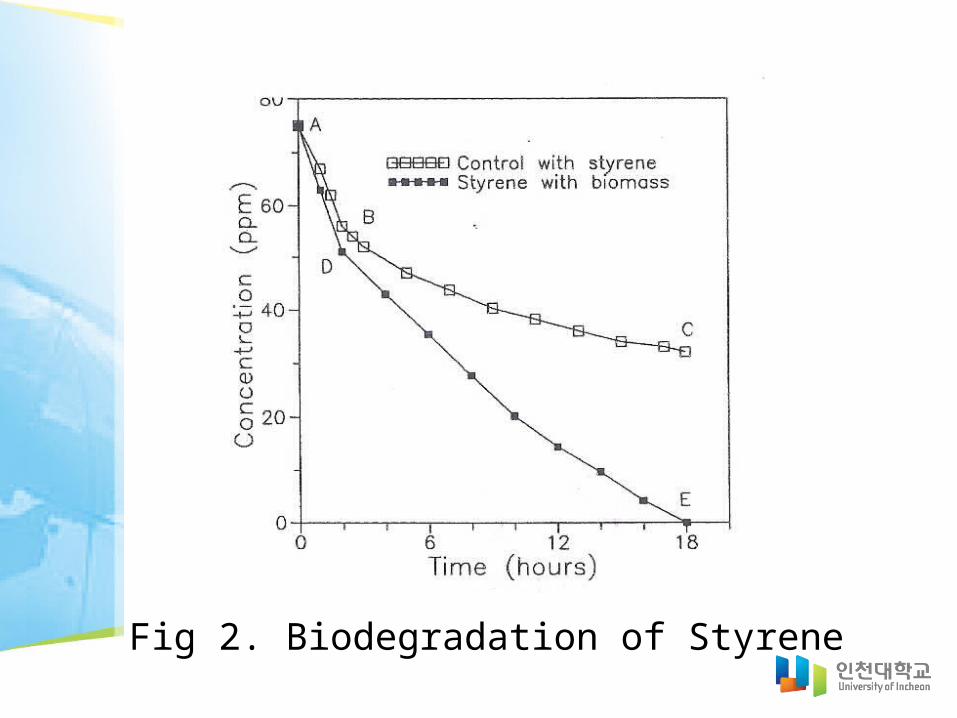
Fig 2. Biodegradation of Styrene
- A similar trend is observed in successive spikes of styrene to the reactor, which suggests that the absorbed styrene from the beads slowly desorbed back into the solution and was subsequently degraded.- As seen in Figure 2, starting from a concentration of 75 ppm, 27% of styrene is very quickly adsorbed on the alginate beads within 2 hours in both cases (see curves AB and AD). - After equilibrium is reached, a comparison of the two removal rates (see curves BC and DE) shows that about 20% of styrene is lost by abiotic means and the rest 80% is degraded biologically.
1) Biodegradation of styrene(2)
- The biodegradation rate is 3.3 ppm/hr. Here, it is assumed that the initially adsorbed styrene is eventually desorbed, and degraded.
- It needs to be addressed that hydrogen peroxide has a short half-life in presence of the enzyme catalase. The possibility of a chemical reaction between hydrogen and the monomers(styrene or MMA) is less likely due to the very low H2O2 concentrations in the presence of catalase.
1) Biodegradation of styrene(3)
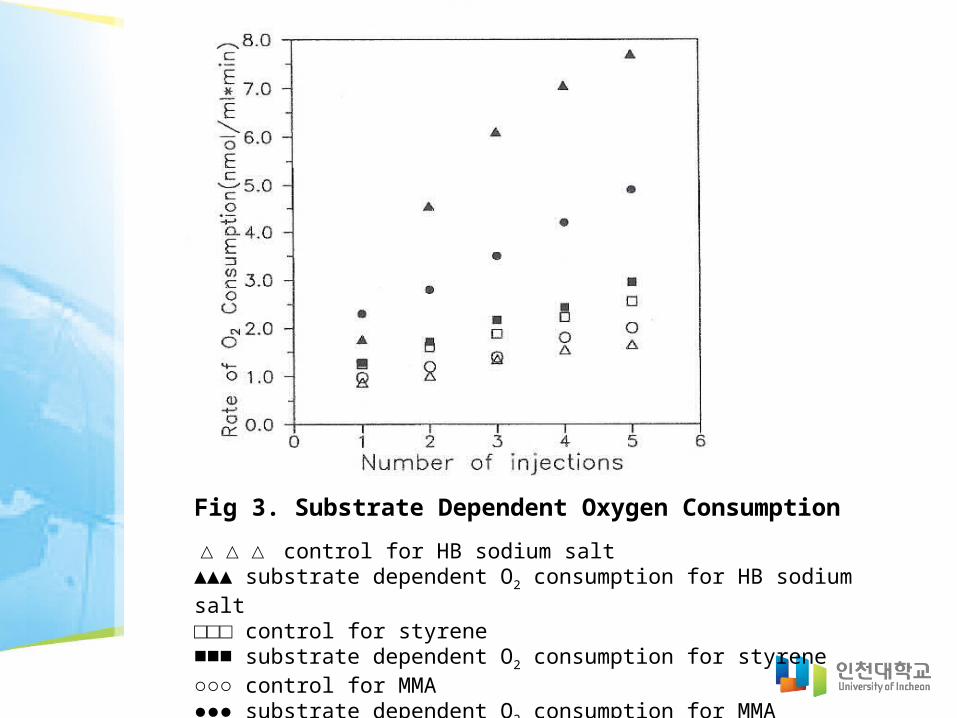
△△△ control for HB sodium salt▲▲▲ substrate dependent O2 consumption for HB sodium salt□□□ control for styrene ■■■ substrate dependent O2 consumption for styrene ○○○ control for MMA ●●● substrate dependent O2 consumption for MMA
Fig 3. Substrate Dependent Oxygen Consumption
- Figure 3 shows oxygen uptake rates in the presence and absence of substrates.- During every batch experiment, the oxygen uptake rate is measured before and after the injection of the substrate. - As shown by the two sets of intersecting lines representing two styrene injections, bio-oxidation rates in the presence of styrene are higher than that without styrene. - This is defined as substrate dependent oxygen uptake, and is a tool used to determine biodegradability based on response to oxygen uptake.
1) Biodegradation of styrene(4)
- Figure 4 also shows the variation in pH during biodegradation of MMA. Starting from 6.95, the pH drops to 6.01.
- Again a drop in pH suggests mineralization of MMA to acids, and eventually to carbon dioxide.
1) Biodegradation of styrene(5)
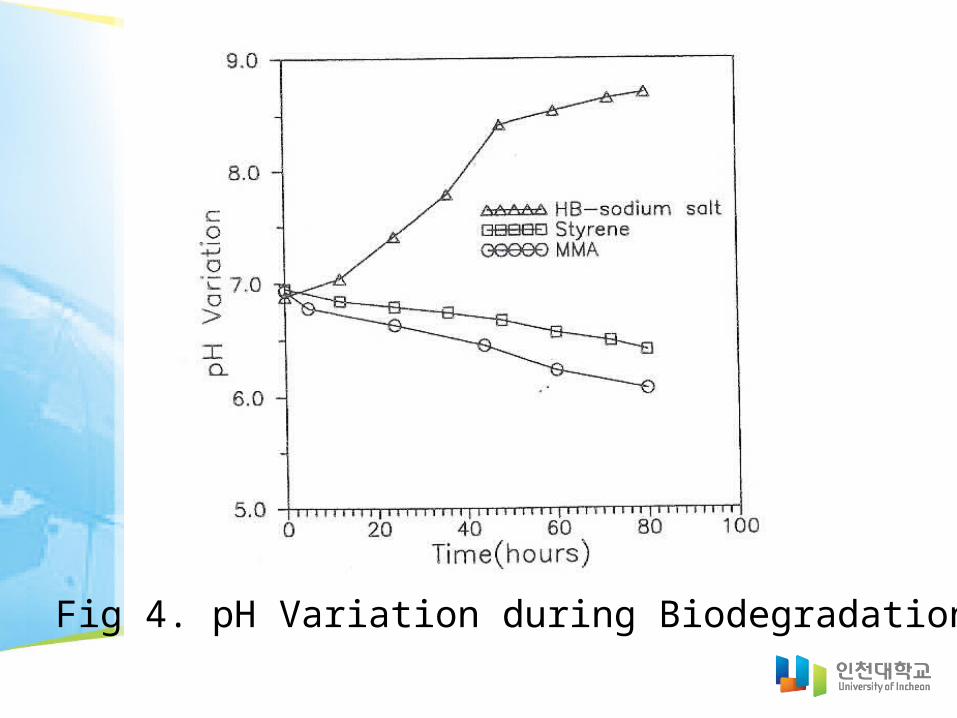
Fig 4. pH Variation during Biodegradation
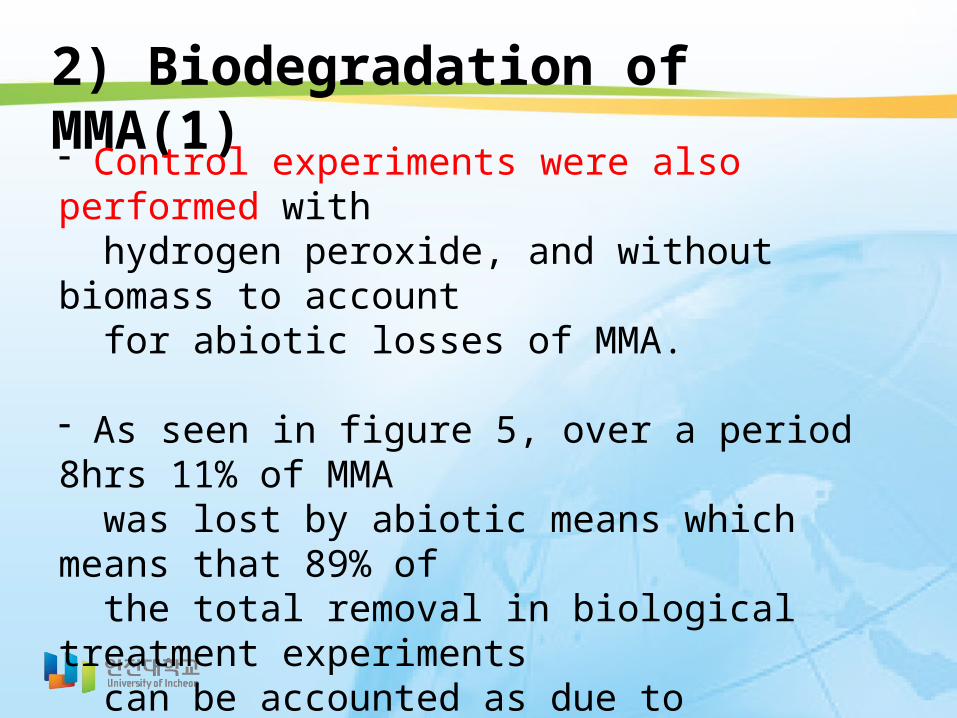
2) Biodegradation of MMA(1)- Control experiments were also performed with hydrogen peroxide, and without biomass to account for abiotic losses of MMA.
- As seen in figure 5, over a period 8hrs 11% of MMA was lost by abiotic means which means that 89% of the total removal in biological treatment experiments can be accounted as due to biodegradation
- The abiotic losses are primarily due to removal of MMA by volatilization from the reservoir.
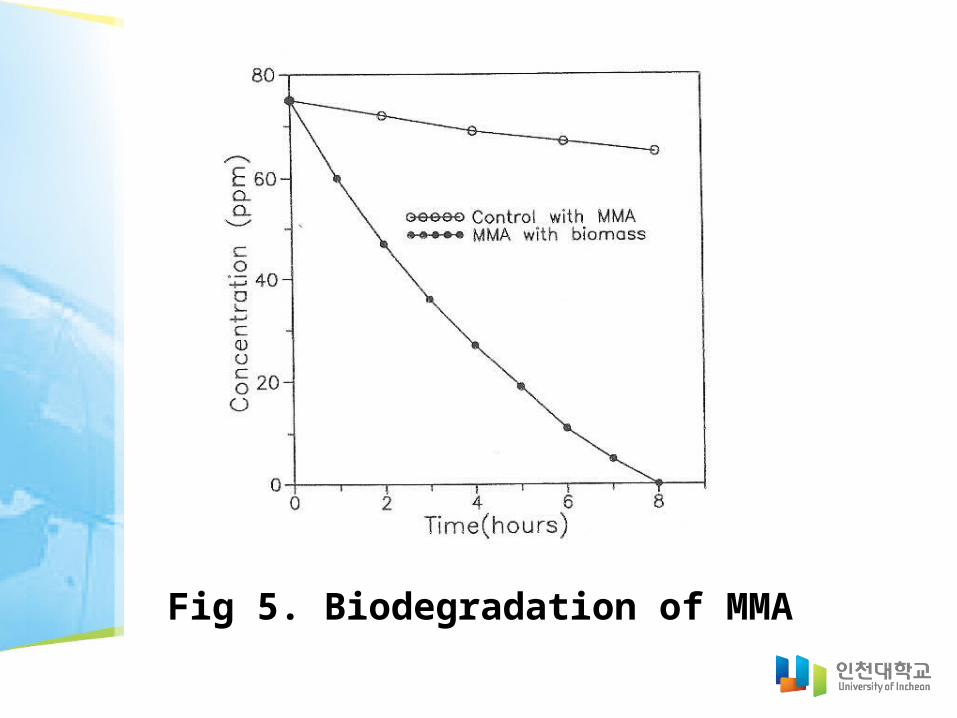
Fig 5. Biodegradation of MMA
- Once again it may be assumed that losses due to chemical reaction with hydrogen peroxide are negligi-ble.- Unlike styrene, MMA was neither significantly adsorbed on alginate beads nor volatilized.- The biodegradation rate for MMA at 75 ppm starting concentration is 9.3 ppm/hr. - Figure 6 shows performance of the bioreactor when challenged with multiple injection of MMA on a continuous basis. - Concentrations as high as 550ppm MMA are treated, and the biodegradation ability of the microbes remains consistent.
2) Biodegradation of MMA(2)
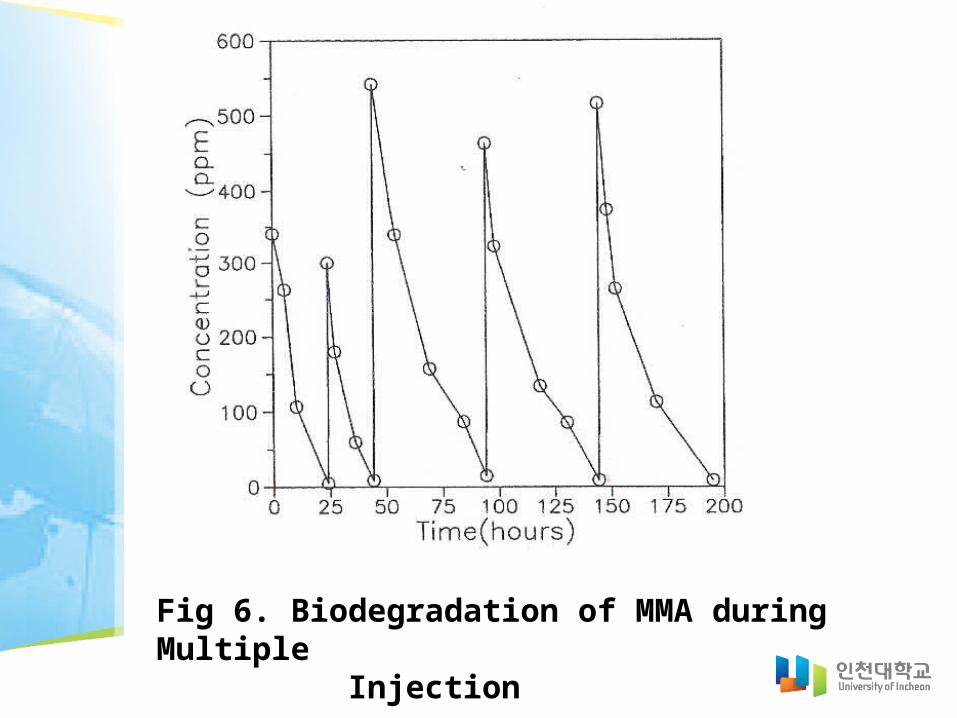
Fig 6. Biodegradation of MMA during Multiple Injection
- Figure 3 also shows oxygen uptake rate for MMA. - Once again the oxygen uptake rates are higher in a presence of MMA than that in the absence of MMA, indicating substrate dependent oxygen uptake.
- Figure 4 also shows the variation in pH during biodegradation of MMA. Starting from 6.95, the pH drops to 6.01. - Again a drop in pH suggests mineralization of MMA to acid, and eventually to carbon dioxide
2) Biodegradation of MMA(3)
- Biodegradation of hydroxybutyric acid was studied by injecting its sodium salt in the reactor. - Control experiments were done without biomass to account for any abiotic losses of HBA as before.- Over a period of 5 hours essentially no HBA was either adsorbed to the alginate beads or stripped from the system.- Biodegradation experiments were conducted at 75 ppm starting concentrations of HBA. As seen in Figure 7, the biodegradation rate is 15ppm/hr.
3) Biodegradation of HBA(1)
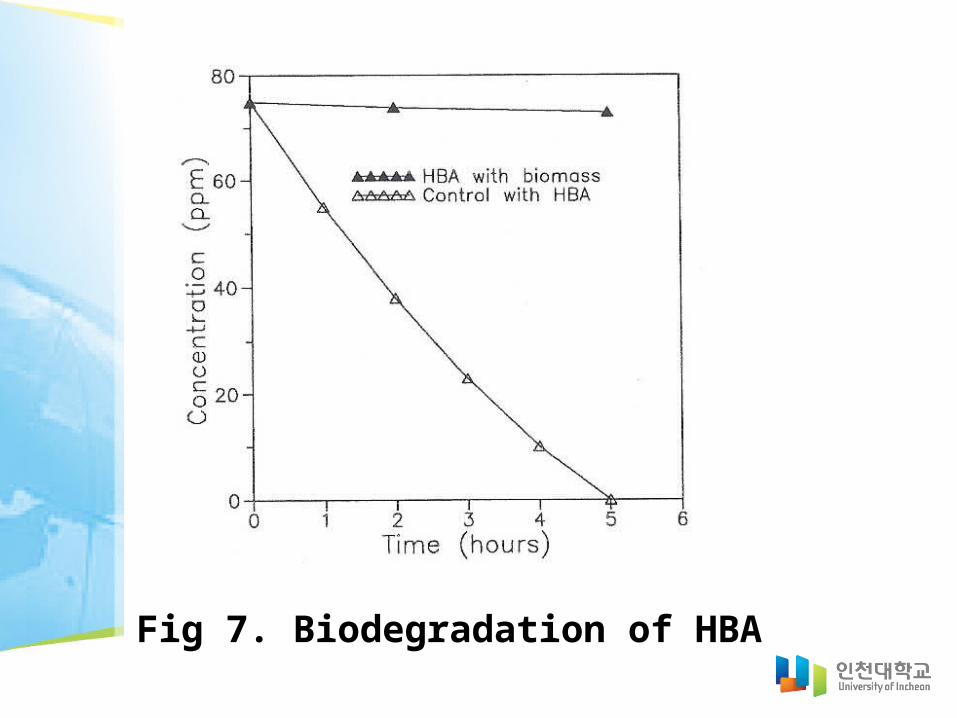
Fig 7. Biodegradation of HBA
- Figure 4 shows the variation in pH during the course of HBA biodegradation. - Unlike that observed for both styrene and MMA, the pH in this case shows an increasing trend.- Starting from 6.85, the pH increased to 8.5. Since the substrate is the sodium salt of HBA, its mineralization would result in the formation of either NaHCO3 or Na2CO3, and consequently cause a rise in pH. - We have subsequently confirmed this phenomenon with other acids and their salts.
3) Biodegradation of HBA(2)
- Results from these experiments indicate that styrene, MMA, and HBA can all be biodegraded using activated sludge. - A comparison of maximum biodegradation rates (3.3,9.3 and 15 ppm/hr for styrene, MMA, and HBA respectively) indicates the scale of difficulty in biodegrading the above monomers. - The biodegradation trend reflected by these rates is analogous to the observed trend in oxygen consumption rates and pH during their respective biodegradation experiments( see Figure 3,4).
4) Comparison of Parameters(1)
-Table 2 below summarizes the response as measured in terms of oxygen uptake when the microbes are challenged with monomers during five different tests.
- It is observed that the response from baseline oxygen uptake is higher for HBA followed by MMA and styrene.
- The results indicate the natural relative degradability of these monomers in the environment.
4) Comparison of Parameters(2)
- It is clearly seen that styrene which is a benzene derivative is relatively difficult to degrade because the degradation mechanism comprises of a formidable ring opening step.
- Both MMA and HBA are straight chain compounds, and they can be biodegraded relatively easily.
- A comparatively high biodegradation rate for HBA is understandable because the monomer does not have double bond in its chemical structure.
4) Comparison of Parameters(3)
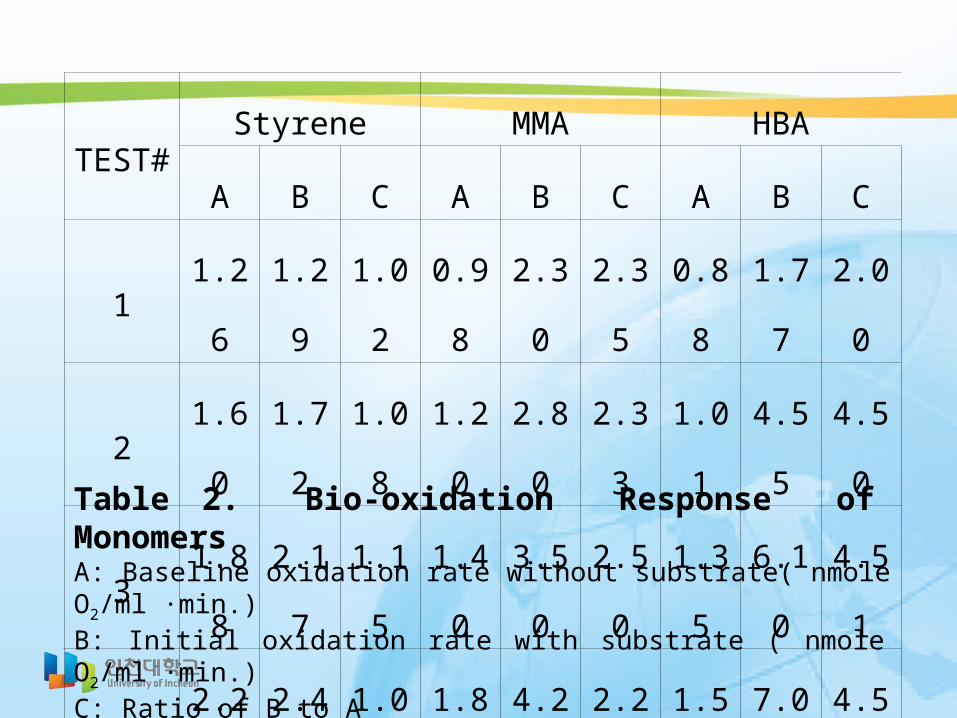
TEST#Styrene MMA HBA
A B C A B C A B C
1 1.26 1.29 1.02 0.98 2.30 2.35 0.88 1.77 2.00
2 1.60 1.72 1.08 1.20 2.80 2.33 1.01 4.55 4.50
3 1.88 2.17 1.15 1.40 3.50 2.50 1.35 6.10 4.51
4 2.22 2.43 1.09 1.80 4.20 2.28 1.55 7.06 4.55
5 2.55 2.95 1.15 2.00 4.90 2.45 1.65 7.70 4.66
Table 2. Bio-oxidation Response of MonomersA: Baseline oxidation rate without substrate( nmole O2/ml ∙min.)B: Initial oxidation rate with substrate ( nmole O2/ml ∙min.)C: Ratio of B to A
- Many factors determine the biodegradability of any monomer as mentioned earlier. In this study only one factor (monomer structure) has been investigated. Although final conclusions can only be drawn after all the factors have been studied, this study in monomer biodegradation.
- If other factors were not limiting, then based on these results we can say that HBA may be more easily degraded than MMA, which is comparatively easy to degrade than styrene.
Conclusions(1)
- HBA which has straight chain without double bond can be used as a reference to assess relative degradability of other monomers.
- On a scale of 1 to 100, it can be said that HBA has a degradability number of 100, styrene of 22, and MMA of 62. - The higher the number, The higher is the chance to degrade the monomer naturally.
Conclusions(2)

Thank you very muchfor listening