Embed Size (px)
Citation preview
A Cost Benefit Analysis of Preschool Education in Turkey
Mehmet Kaytaz Bo�aziçi University
Draft – Not for Circulation Please send comments to author at [email protected]
September 2004
2
Table of Contents
Executive Summary……………………………………………………………………….3 Introduction…………………………………………………………………….………….4
1. Early Child Education Services in Turkey………………………………………..6 1.1 Institutional Structure of Service 1.2 Enrollment in ECE Programs 1.3 Targeting Services
2. Benefits and Costs of ECE Services…………………………………….……….11
2.1 Potential Benefits and Costs 2.2 Benefit_Cost Analysis 2.3 Estimation of Costs 2.4 Estimation of Benefits 2.5 Benefit-Cost Ratios
3. Financing ECE……………………………………………………………….…..21 3.1 Government 3.2 User Fees 3.3 Private Sources 3.4 Alternative Models of ECE and Financing Options 3.5 Types of Financial Instruments
Conclusions………………………………………………………………………….26 References
3
Executive Summary Early child development (ECD) and early child education (ECE) are interventions for the physical and intellectual growth of children in their early years. These services include day care, preschool, home visits by trained professionals, health and nutrition services, and parental education. The international research evidence shows that quality interventions in early childhood are small investments that yield very high returns to child, family, society and economy. This investment brings particularly high returns if children at risk are targeted.
Turkey has one of the lowest levels of preschool education coverage of any lower-middle income country. There has been an improvement during the last ten years. Still Turkey has a long way to go. The government’s priorities in investing between different levels of education are not very clear.
The report underlines the importance of expanding ECE services using a benefit-cost analysis of preschool education. The benefits expected from ECE services are restricted only to an increase in level of schooling and hence an increase in productivity and earnings. Simulations are based on modest increases in enrollment rates. Even with this limited benefits the calculated benefit-cost ratios range 1.12-3.43. These ratios should be considered as an initial approximation and at their minimum values.
The report suggests that government should continue with the expansion of preschool education, provide support to targeted and flexible ECE services provided by private sector and NGOs, develop special programs, and try to recover costs where possible.
4
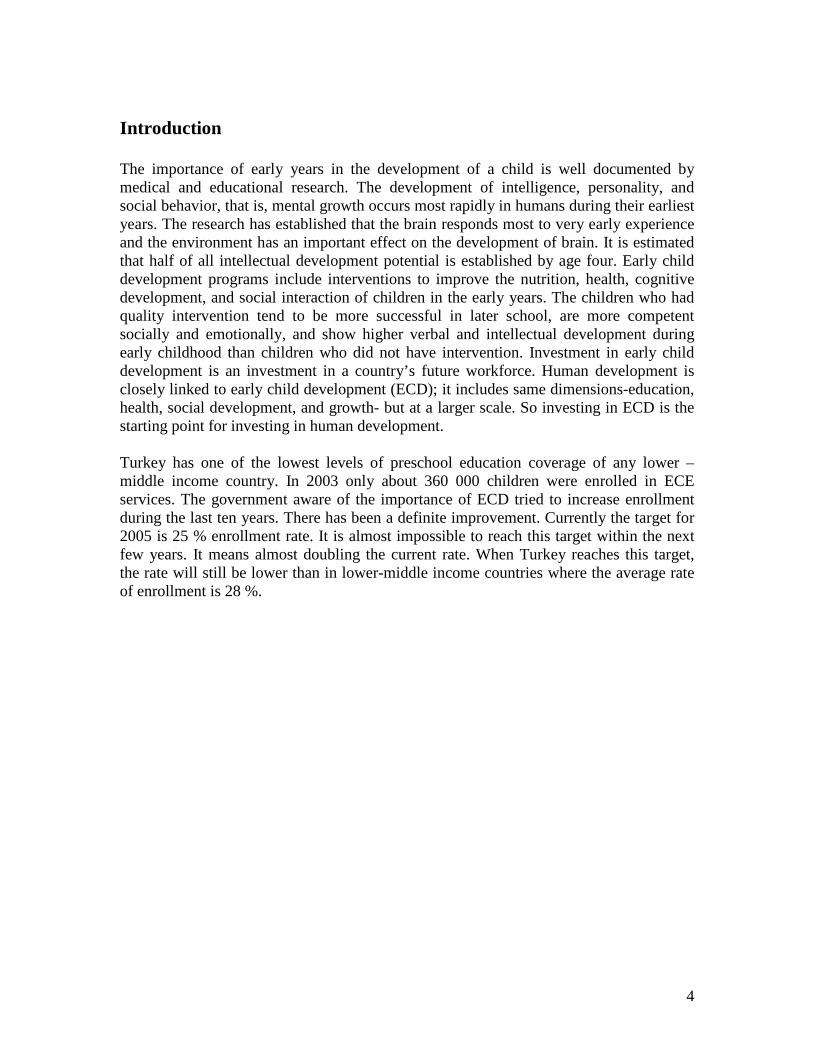
Introduction The importance of early years in the development of a child is well documented by medical and educational research. The development of intelligence, personality, and social behavior, that is, mental growth occurs most rapidly in humans during their earliest years. The research has established that the brain responds most to very early experience and the environment has an important effect on the development of brain. It is estimated that half of all intellectual development potential is established by age four. Early child development programs include interventions to improve the nutrition, health, cognitive development, and social interaction of children in the early years. The children who had quality intervention tend to be more successful in later school, are more competent socially and emotionally, and show higher verbal and intellectual development during early childhood than children who did not have intervention. Investment in early child development is an investment in a country’s future workforce. Human development is closely linked to early child development (ECD); it includes same dimensions-education, health, social development, and growth- but at a larger scale. So investing in ECD is the starting point for investing in human development. Turkey has one of the lowest levels of preschool education coverage of any lower –middle income country. In 2003 only about 360 000 children were enrolled in ECE services. The government aware of the importance of ECD tried to increase enrollment during the last ten years. There has been a definite improvement. Currently the target for 2005 is 25 % enrollment rate. It is almost impossible to reach this target within the next few years. It means almost doubling the current rate. When Turkey reaches this target, the rate will still be lower than in lower-middle income countries where the average rate of enrollment is 28 %.
5
Gross Preschool Enrollment
24%
36%
40%
63%
90%
40%
0% 10% 20% 30% 40% 50% 60% 70% 80% 90% 100%
Low income
Lower middle income
Middle income
Upper middle income
High income
World
Turkey is a developing country with a per capita income of about USD 3383. For almost two decades the economy was crippled with high levels of budget deficits. Until the Basic Education Reform of 1997, the budget for education was very limited. The allocation of education funds favored other levels of education. The scarcity of funds can be one of the reasons for not enough public investment in early child education (ECE) services. Inevitably investment in ECE services competes with any other investment, including investment in other educational levels. This report deals with the economic analysis of preschool education in Turkey. Specifically the benefits and costs of preschool education are estimated and a benefit-cost ratio is calculated. The benefits which are included in the analysis are only those which can be converted to money. Consequently the results obtained should be considered as first approximation and a minimum. Chapter 1 reviews the ECE services in Turkey. Chapter 2 gives a short summary of the benefits of ECE and calculates benefit-cost for preschool education and Chapter 3 reviews and discusses some financing options.

6
1 Early Child Education Services in Turkey 1.1 Institutional Structure of ECE Services
The provision of ECE services in Turkey go back to the early 19th century. However the first set of regulations was decreed in 1915 which set the rules for starting an independent preschool. Only in 1961 with the new education act the importance of ECE was stressed and ECE was considered explicitly in policy discussions and programs of the Ministry of National Education (MONE). In 1992 the General Directorate of Pre-primary Education was established within MONE. This directorate has the main responsibility of regulating, supervising and/ or running ECE services in Turkey. The other major institution delivering ECE services is the General Directorate of Social Welfare and Child Protection Agency (SWCPA) which is attached to the Prime Minister’s office. ECE services are also provided by the private sector.
The existing ECE services are categorized according to the age of the child and the institution in which the services are delivered. Creches provide care of and education for children aged between 0-3. According to MONE ‘preschool education’ covers children aged 4-6; this service is delivered in preschools (anaokulu). What is called ‘application classes’ which are run by the technical education departments of MONE also covers this age group. There are nursery classes attached to the primary schools, public or private; these cover children aged 6. The number of nursery classes attached to a school depends on the size of the school.
SWCPA aims to serve children who are in need of protection. The childcare centers or children homes belonging to SWCPA cater for age groups of 0-6, 7-12 or 0-12. Furthermore SWCPA runs a very small number of creches and daycare centers for the children of working fathers and mothers who can not afford private creches.
MONE is responsible for regulating and supervising all the public and private preschools and nursery classes. For creches and daycare centers MONE and SWCPA share responsibilities; MONE is responsible for educational aspects and SWCPA is for the rest.
ECE services directed toward nutrition and health of children is the responsibility of General Directorate of Mother-Child Health of the Ministry of Health.
NGO’s and International Organizations play an important role in the provision and development of ECE services in Turkey. The leading NGO is the Mother-Child Education Foundation (MOCEF). Its services are directed at not only the child but his immediate environment. Now MONE runs part of this program with the support of MOCEF.
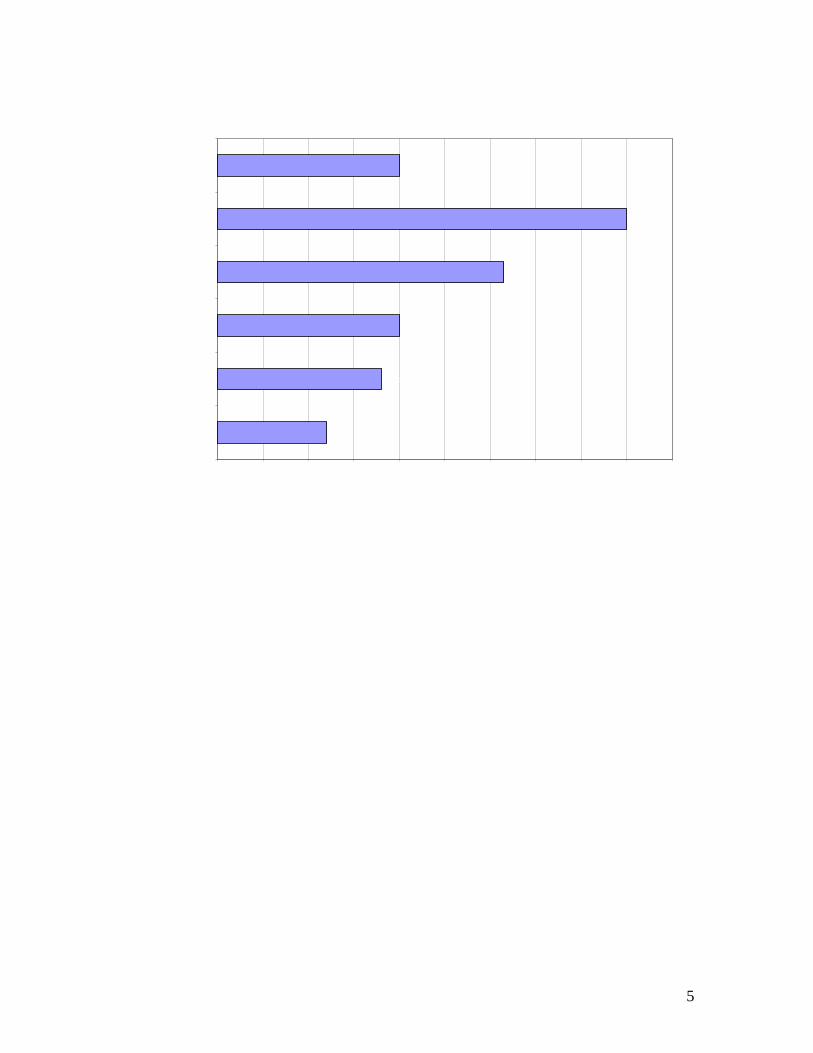
1.2 Enrollment in ECE Programs Table 3.1 presents the current situation in ECE services. MONE delivers directly about 90 % of the existing services. Most of the ECE activities are conducted in nursery classes. For the private sector it is the other way around. The private sector has about 7 % share in preschool education. The capacity of private schools is generally smaller.
7
However number of children per teacher is significantly smaller in private than MONE schools. A great majority of creche and daycare centers are run by the private sector. This is also due the Labor Act requiring a certain types of businesses of a certain size to provide daycare facilities for employees.
MONE Nursery Classes 10.922 267.958 10.518 Preschools 483 42.664 2.020 Application Schools 308 7.767 597 Public Institutions 397 13.758 1.544
Private/MONE Nursery Classes 199 5.004 741 Preschools 300 9.059 620
SSCPA Creche and Daycare Centers 48 850 Private/SSCPA Creche and Daycare Centers 1.083 12.289 3.082
Total 13.740 359.349 19.122
TeachersNo. of Schools/Classrooms
Table 1.1 Number and Types of Early Childhood Services (2003-2004)
Source Services Children
Source: MONE and SWCPA
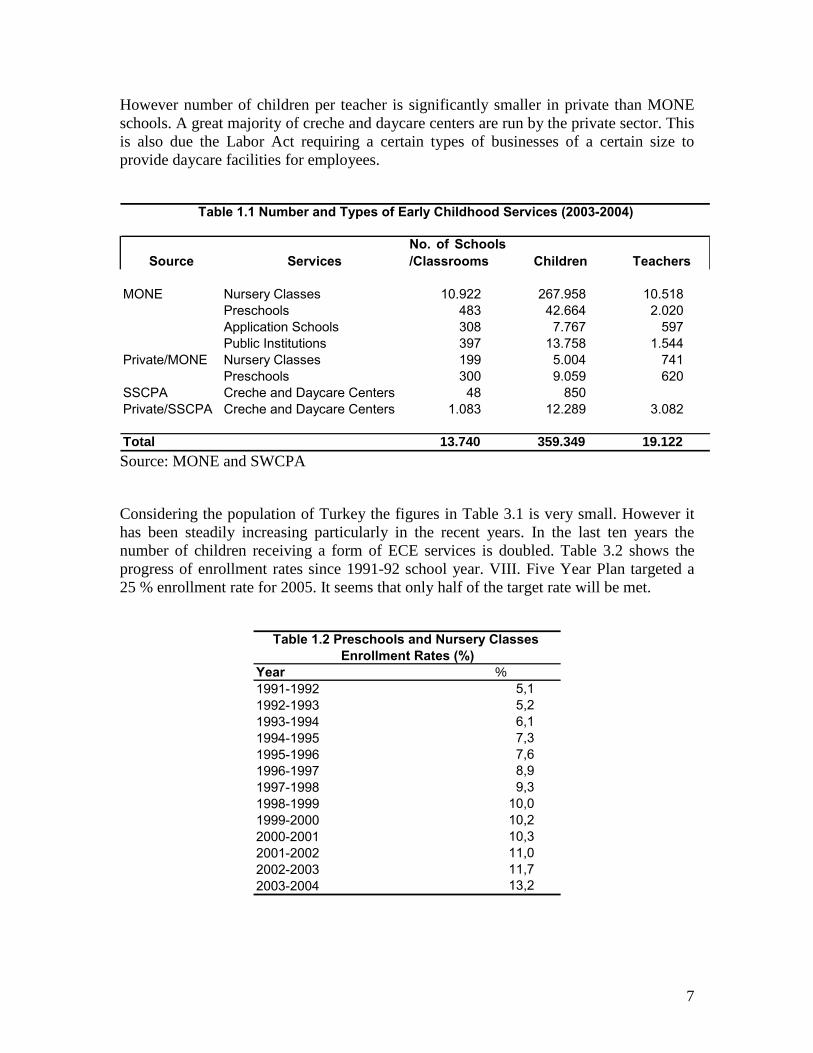
Considering the population of Turkey the figures in Table 3.1 is very small. However it has been steadily increasing particularly in the recent years. In the last ten years the number of children receiving a form of ECE services is doubled. Table 3.2 shows the progress of enrollment rates since 1991-92 school year. VIII. Five Year Plan targeted a 25 % enrollment rate for 2005. It seems that only half of the target rate will be met.
Year %1991-1992 5,1 1992-1993 5,2 1993-1994 6,1 1994-1995 7,3 1995-1996 7,6 1996-1997 8,9 1997-1998 9,3 1998-1999 10,0 1999-2000 10,2 2000-2001 10,3 2001-2002 11,0 2002-2003 11,7 2003-2004 13,2
Table 1.2 Preschools and Nursery Classes Enrollment Rates (%)
8
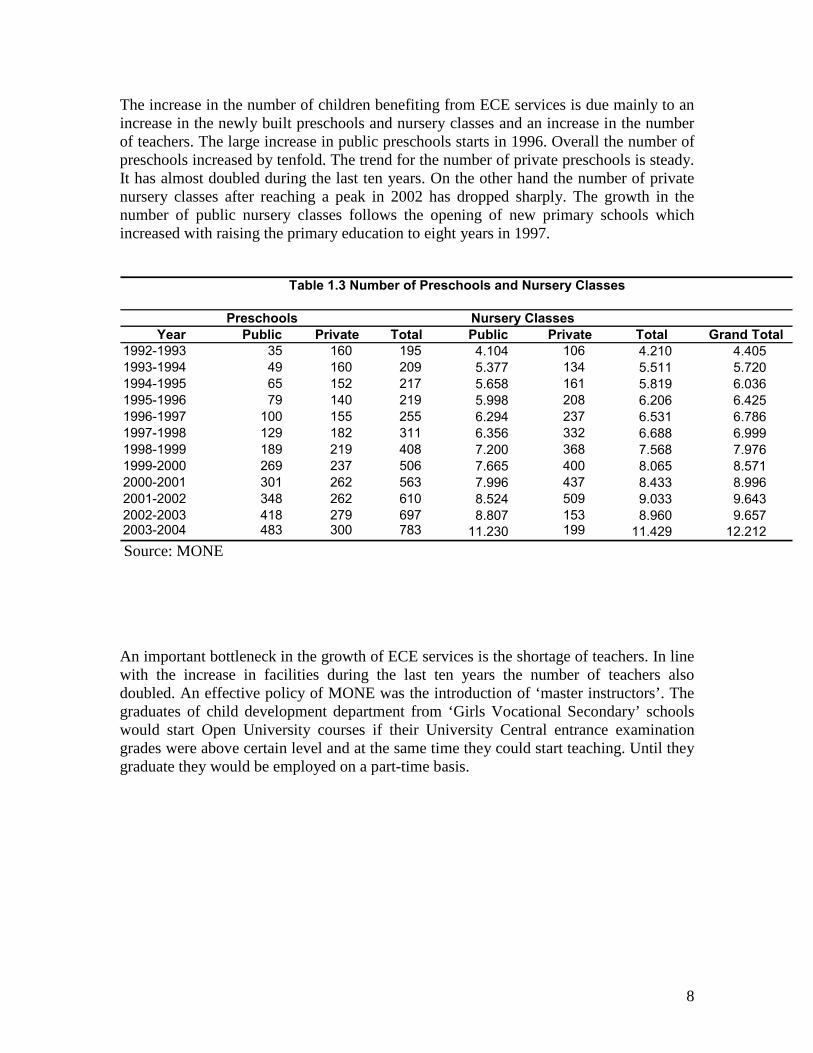
The increase in the number of children benefiting from ECE services is due mainly to an increase in the newly built preschools and nursery classes and an increase in the number of teachers. The large increase in public preschools starts in 1996. Overall the number of preschools increased by tenfold. The trend for the number of private preschools is steady. It has almost doubled during the last ten years. On the other hand the number of private nursery classes after reaching a peak in 2002 has dropped sharply. The growth in the number of public nursery classes follows the opening of new primary schools which increased with raising the primary education to eight years in 1997.
Table 1.3 Number of Preschools and Nursery Classes
PreschoolsYear Public Private Total Public Private Total Grand Total
1992-1993 35 160 195 4.104 106 4.210 4.405 1993-1994 49 160 209 5.377 134 5.511 5.720 1994-1995 65 152 217 5.658 161 5.819 6.036 1995-1996 79 140 219 5.998 208 6.206 6.425 1996-1997 100 155 255 6.294 237 6.531 6.786 1997-1998 129 182 311 6.356 332 6.688 6.999 1998-1999 189 219 408 7.200 368 7.568 7.976 1999-2000 269 237 506 7.665 400 8.065 8.571 2000-2001 301 262 563 7.996 437 8.433 8.996 2001-2002 348 262 610 8.524 509 9.033 9.643 2002-2003 418 279 697 8.807 153 8.960 9.657 2003-2004 483 300 783 11.230 199 11.429 12.212
Nursery Classes
Source: MONE
An important bottleneck in the growth of ECE services is the shortage of teachers. In line with the increase in facilities during the last ten years the number of teachers also doubled. An effective policy of MONE was the introduction of ‘master instructors’. The graduates of child development department from ‘Girls Vocational Secondary’ schools would start Open University courses if their University Central entrance examination grades were above certain level and at the same time they could start teaching. Until they graduate they would be employed on a part-time basis.
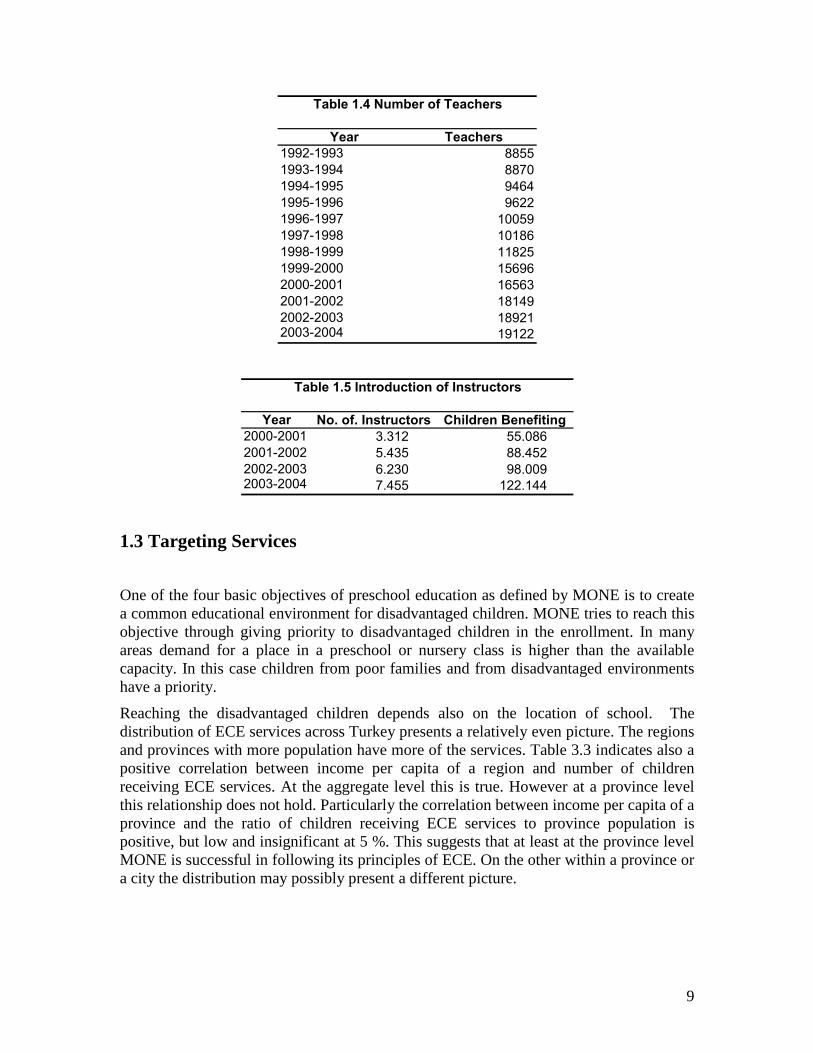
9
Year Teachers1992-1993 88551993-1994 88701994-1995 94641995-1996 96221996-1997 100591997-1998 101861998-1999 118251999-2000 156962000-2001 165632001-2002 181492002-2003 189212003-2004 19122
Table 1.4 Number of Teachers
Year No. of. Instructors Children Benefiting2000-2001 3.312 55.086 2001-2002 5.435 88.452 2002-2003 6.230 98.009 2003-2004 7.455 122.144
Table 1.5 Introduction of Instructors
1.3 Targeting Services
One of the four basic objectives of preschool education as defined by MONE is to create a common educational environment for disadvantaged children. MONE tries to reach this objective through giving priority to disadvantaged children in the enrollment. In many areas demand for a place in a preschool or nursery class is higher than the available capacity. In this case children from poor families and from disadvantaged environments have a priority.
Reaching the disadvantaged children depends also on the location of school. The distribution of ECE services across Turkey presents a relatively even picture. The regions and provinces with more population have more of the services. Table 3.3 indicates also a positive correlation between income per capita of a region and number of children receiving ECE services. At the aggregate level this is true. However at a province level this relationship does not hold. Particularly the correlation between income per capita of a province and the ratio of children receiving ECE services to province population is positive, but low and insignificant at 5 %. This suggests that at least at the province level MONE is successful in following its principles of ECE. On the other within a province or acity the distribution may possibly present a different picture.

10
Table 1.6 Regional Distribution of Enrolled Children
Population Per Capita Income No. of Students(1000s) (1000000 TLRs)
�stanbul 10.243 3.711 48.657 Western Marmara 2.917 2.907 19.135 Aegean 9.039 3.082 55.849 Eastern Marmara 5.782 3.959 39.030 Western Anatolia 6.557 2.802 36.760 Mediterranean 8.835 2.472 50.699 Central Anatolia 4.210 1.917 20.503 Western Blacksea 4.877 2.068 17.127 Eastern Blacksea 3.151 1.730 11.767 Northeastern Anatolia 2.520 1.114 7.449 Central Eastern Anatolia 3.770 1.297 15.348 Southeastern Anatolia 6.717 1.437 36.175
Source: MONE, SIS
MONE and SWPCA run special projects sometimes with the assitance of NGOs and international organization to cover children at risk. Currently MONE and MOCEF are implementing Preschool Parent-Child Education Program in selected provinces. Again MONE, SWCPA and UNICEF are running a project directed at the education of parents and children.
11
2 Benefits and Costs of ECE Services Benefits of early child intervention are well documented in the literature. These benefits can be classified as benefits to child, parents and to society in general. Or they can be analyzed as short term and long term benefits. It is also possible to classify them as direct and indirect benefits. The problem is to quantify the benefits. Some of them such as school performance can be measured; on the other hand to quantify social cohesion would be very difficult. A step further is expressing benefits in monetary terms. Very few of the benefits can be converted to monetary values. This chapter after presenting the benefits and costs of in a compact manner will estimate the benefit-cost ratio using only one quantifiable benefit, namely increased productivity and hence increased income during the work cycle of an adult.
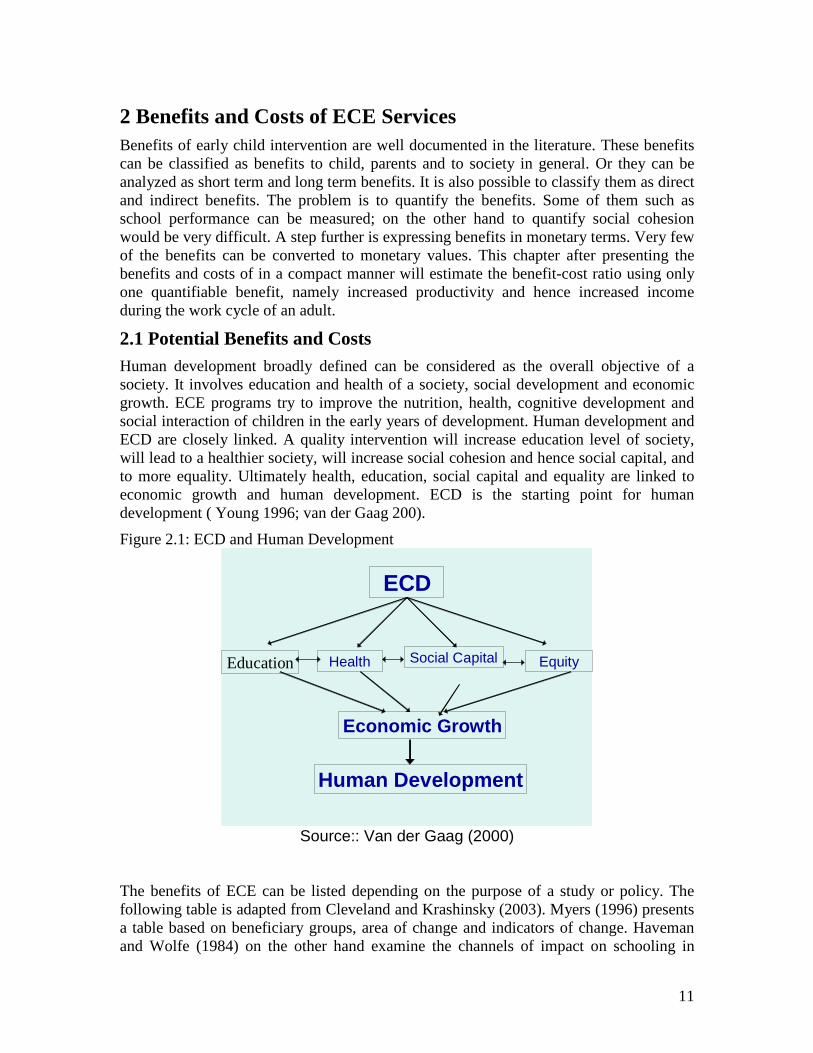
2.1 Potential Benefits and Costs Human development broadly defined can be considered as the overall objective of a society. It involves education and health of a society, social development and economic growth. ECE programs try to improve the nutrition, health, cognitive development and social interaction of children in the early years of development. Human development and ECD are closely linked. A quality intervention will increase education level of society, will lead to a healthier society, will increase social cohesion and hence social capital, and to more equality. Ultimately health, education, social capital and equality are linked to economic growth and human development. ECD is the starting point for human development ( Young 1996; van der Gaag 200).
Figure 2.1: ECD and Human Development
ECD
Health Social CapitalEducation
Economic Growth
Human Development
Equity
Source:: Van der Gaag (2000)
The benefits of ECE can be listed depending on the purpose of a study or policy. The following table is adapted from Cleveland and Krashinsky (2003). Myers (1996) presents a table based on beneficiary groups, area of change and indicators of change. Haveman and Wolfe (1984) on the other hand examine the channels of impact on schooling in
12
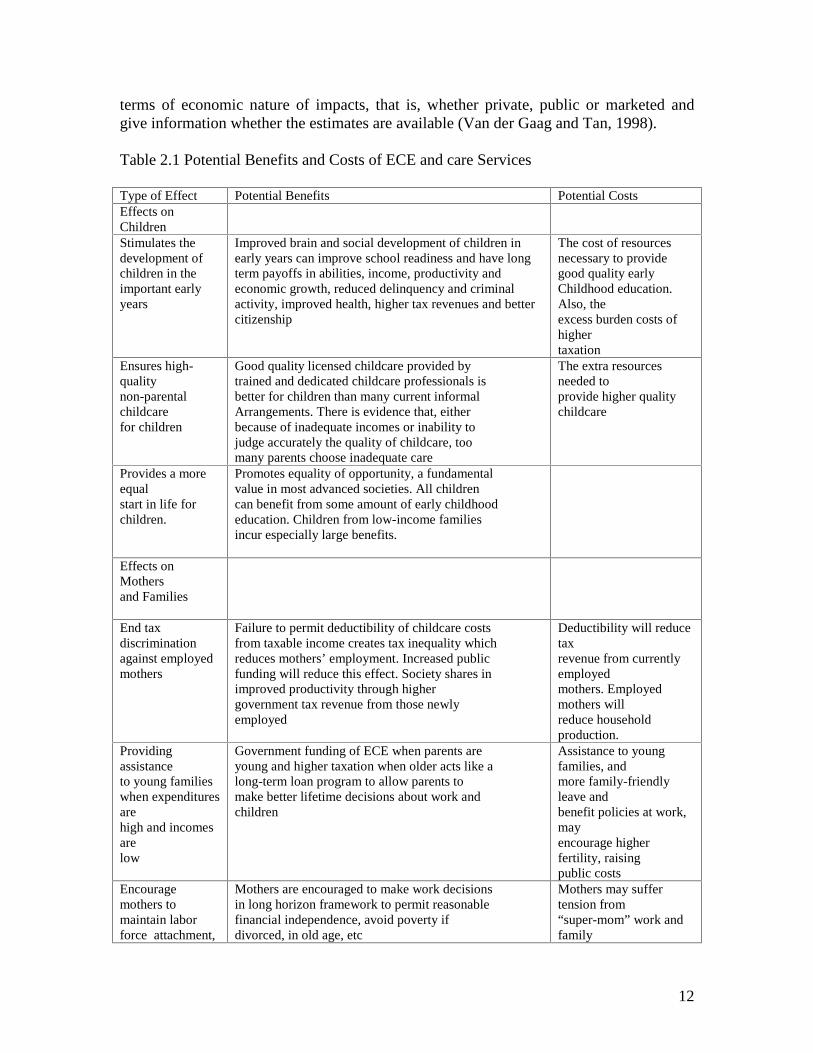
terms of economic nature of impacts, that is, whether private, public or marketed and give information whether the estimates are available (Van der Gaag and Tan, 1998). Table 2.1 Potential Benefits and Costs of ECE and care Services Type of Effect Potential Benefits Potential Costs Effects on Children
Stimulates the development of children in the important early years
Improved brain and social development of children in early years can improve school readiness and have long term payoffs in abilities, income, productivity and economic growth, reduced delinquency and criminal activity, improved health, higher tax revenues and better citizenship
The cost of resources necessary to provide good quality early Childhood education. Also, the excess burden costs of higher taxation
Ensures high-quality non-parental childcare for children
Good quality licensed childcare provided by trained and dedicated childcare professionals is better for children than many current informal Arrangements. There is evidence that, either because of inadequate incomes or inability to judge accurately the quality of childcare, too many parents choose inadequate care
The extra resources needed to provide higher quality childcare
Provides a more equal start in life for children.
Promotes equality of opportunity, a fundamental value in most advanced societies. All children can benefit from some amount of early childhood education. Children from low-income families incur especially large benefits.
Effects on Mothers and Families End tax discrimination against employed mothers
Failure to permit deductibility of childcare costs from taxable income creates tax inequality which reduces mothers’ employment. Increased public funding will reduce this effect. Society shares in improved productivity through higher government tax revenue from those newly employed
Deductibility will reduce tax revenue from currently employed mothers. Employed mothers will reduce household production.
Providing assistance to young families when expenditures are high and incomes are low
Government funding of ECE when parents are young and higher taxation when older acts like a long-term loan program to allow parents to make better lifetime decisions about work and children
Assistance to young families, and more family-friendly leave and benefit policies at work, may encourage higher fertility, raising public costs
Encourage mothers to maintain labor force attachment,
Mothers are encouraged to make work decisions in long horizon framework to permit reasonable financial independence, avoid poverty if divorced, in old age, etc
Mothers may suffer tension from “super-mom” work and family
13
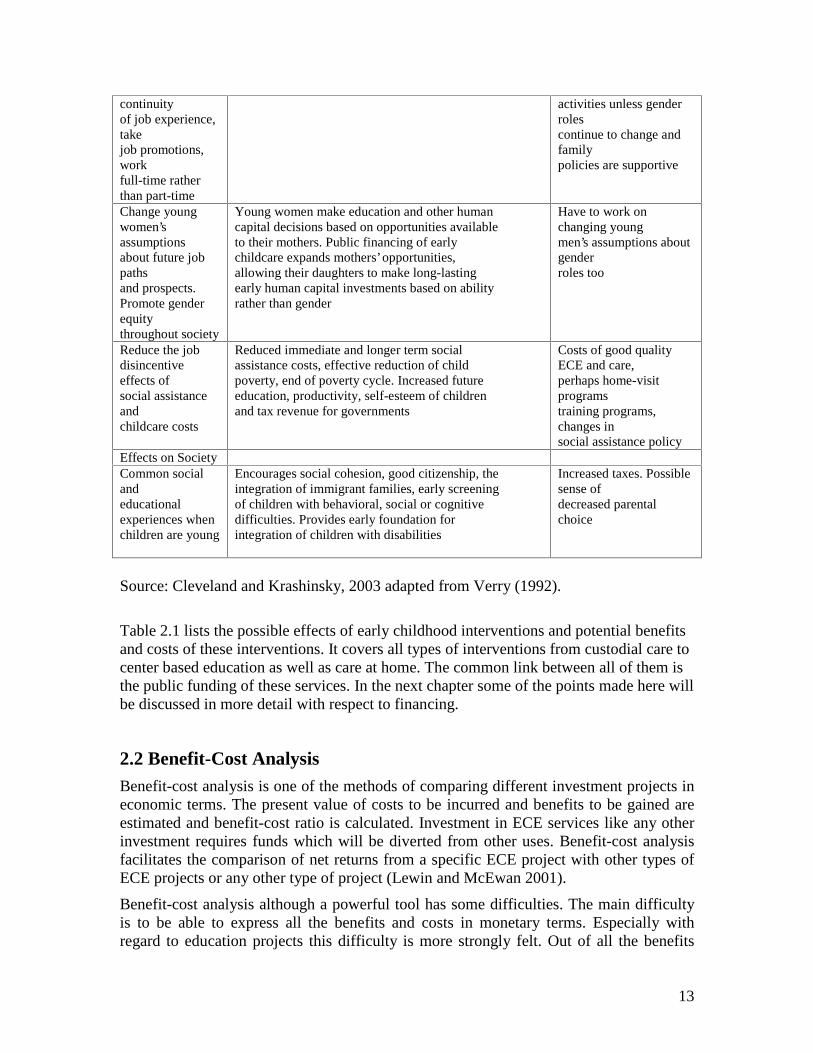
continuity of job experience, take job promotions, work full-time rather than part-time
activities unless gender roles continue to change and family policies are supportive
Change young women’s assumptions about future job paths and prospects. Promote gender equity throughout society
Young women make education and other human capital decisions based on opportunities available to their mothers. Public financing of early childcare expands mothers’ opportunities, allowing their daughters to make long-lasting early human capital investments based on ability rather than gender
Have to work on changing young men’s assumptions about gender roles too
Reduce the job disincentive effects of social assistance and childcare costs
Reduced immediate and longer term social assistance costs, effective reduction of child poverty, end of poverty cycle. Increased future education, productivity, self-esteem of children and tax revenue for governments
Costs of good quality ECE and care, perhaps home-visit programs training programs, changes in social assistance policy
Effects on Society Common social and educational experiences when children are young
Encourages social cohesion, good citizenship, the integration of immigrant families, early screening of children with behavioral, social or cognitive difficulties. Provides early foundation for integration of children with disabilities
Increased taxes. Possible sense of decreased parental choice
Source: Cleveland and Krashinsky, 2003 adapted from Verry (1992).
Table 2.1 lists the possible effects of early childhood interventions and potential benefits and costs of these interventions. It covers all types of interventions from custodial care to center based education as well as care at home. The common link between all of them is the public funding of these services. In the next chapter some of the points made here will be discussed in more detail with respect to financing.
2.2 Benefit-Cost Analysis Benefit-cost analysis is one of the methods of comparing different investment projects in economic terms. The present value of costs to be incurred and benefits to be gained are estimated and benefit-cost ratio is calculated. Investment in ECE services like any other investment requires funds which will be diverted from other uses. Benefit-cost analysis facilitates the comparison of net returns from a specific ECE project with other types of ECE projects or any other type of project (Lewin and McEwan 2001).
Benefit-cost analysis although a powerful tool has some difficulties. The main difficulty is to be able to express all the benefits and costs in monetary terms. Especially with regard to education projects this difficulty is more strongly felt. Out of all the benefits
14
listed in Table 2.1 only one of them can be converted to monetary terms in this report, namely ‘...have long term payoffs in … income, productivity...’. Many important benefits will be left out of the analysis due either to lack of data or not being able to express them in monetary units. Hence the benefit-cost ratio to be calculated in this study should be considered as an initial approximation and at its minimum. In real life we can rightly expect that the ratio is significantly higher.
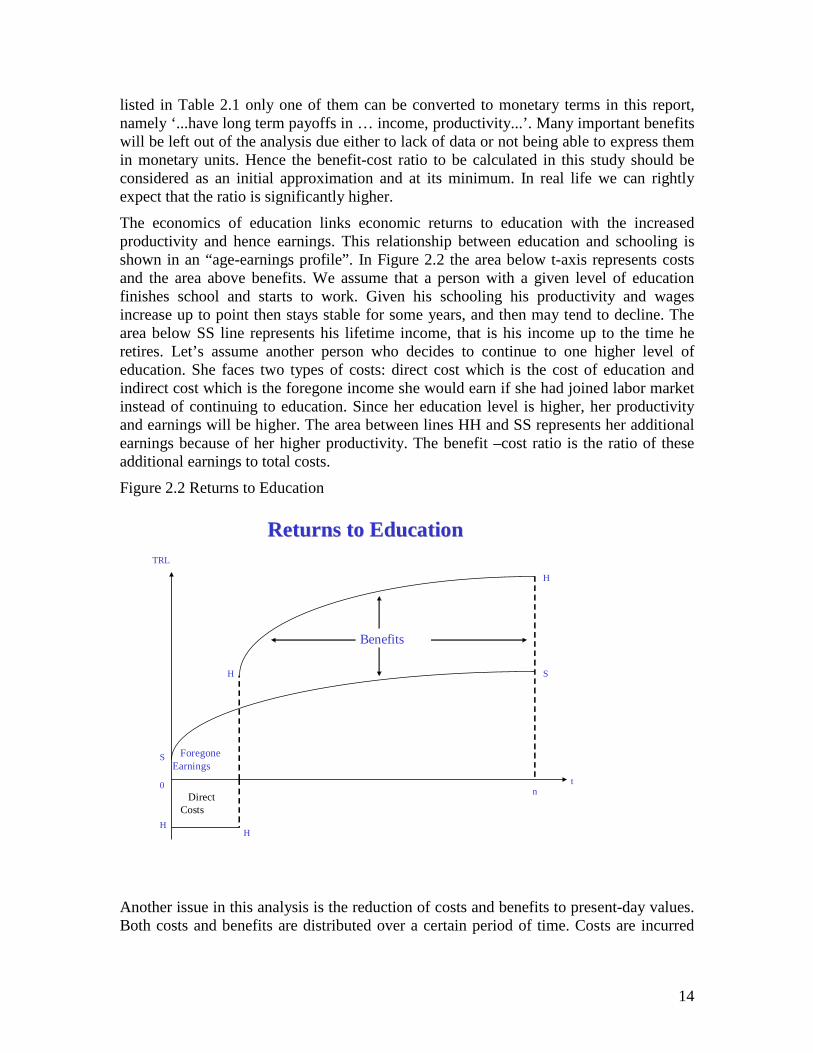
The economics of education links economic returns to education with the increased productivity and hence earnings. This relationship between education and schooling is shown in an “age-earnings profile”. In Figure 2.2 the area below t-axis represents costs and the area above benefits. We assume that a person with a given level of education finishes school and starts to work. Given his schooling his productivity and wages increase up to point then stays stable for some years, and then may tend to decline. The area below SS line represents his lifetime income, that is his income up to the time he retires. Let’s assume another person who decides to continue to one higher level of education. She faces two types of costs: direct cost which is the cost of education and indirect cost which is the foregone income she would earn if she had joined labor market instead of continuing to education. Since her education level is higher, her productivity and earnings will be higher. The area between lines HH and SS represents her additional earnings because of her higher productivity. The benefit –cost ratio is the ratio of these additional earnings to total costs.
Figure 2.2 Returns to Education
Returns to EducationReturns to Education
Benefits
0n
t
S
TRL
Direct Costs
S
H
H
Foregone Earnings
HH
Another issue in this analysis is the reduction of costs and benefits to present-day values. Both costs and benefits are distributed over a certain period of time. Costs are incurred
15
during time in school and benefits are received during working life. Converting these values into current values is done by discounting them using a suitable discount rate.
Estimation of Costs
The costs included in the analysis are the costs borne by MONE. For the time being reliable data are not available on private expenditures. Only in the case of higher education fees paid by students are included in the costs of higher education. The estimation process is given in the Appendix in more detail.
Two critical assumptions are made in calculating fixed investment costs. Returns to a fixed investment continue for the lifetime of facility or equipment. It assumed that lifetime of a building is 30 years, of big scale repairs 10, and of equipment and furnishing is 5 years. Assuming different lifetimes can be used in the sensitivity analysis. If the lifetimes are longer the costs would decline.
The second assumption is related to the annualization of the costs of buildings, facilities, and equipment. Depreciation costs are determined by the lifetime of the facility. However deprecation is not the only cost involved. The undepreciated portion of the facility represents an investment in resources that could have been used in some other way. It represents the resources which have been foregone by constructing the facility or buying the equipment. Again it is necessary to discount the foregone portion by a suitable discount rate. The issue is to find a suitable discount rate. The economic literature does not provide a specific rate to use. There are different conceptual approaches to determining the discount rate (Lewin and McEwan 2001). Furthermore the differences in financial markets between developing and developed economies introduce further difficulties in choosing a rate. For example the studies related to projects in USA suggest using rates of 3-5% and use rates going up to 10 % in the sensitivity analysis. Van der Gaag and Tan (1988) use a 7 % discount rate in the study of Bolivian PIDI program. In this report the discount rate is chosen as 6 % and for sensitivity analysis as 10 %.
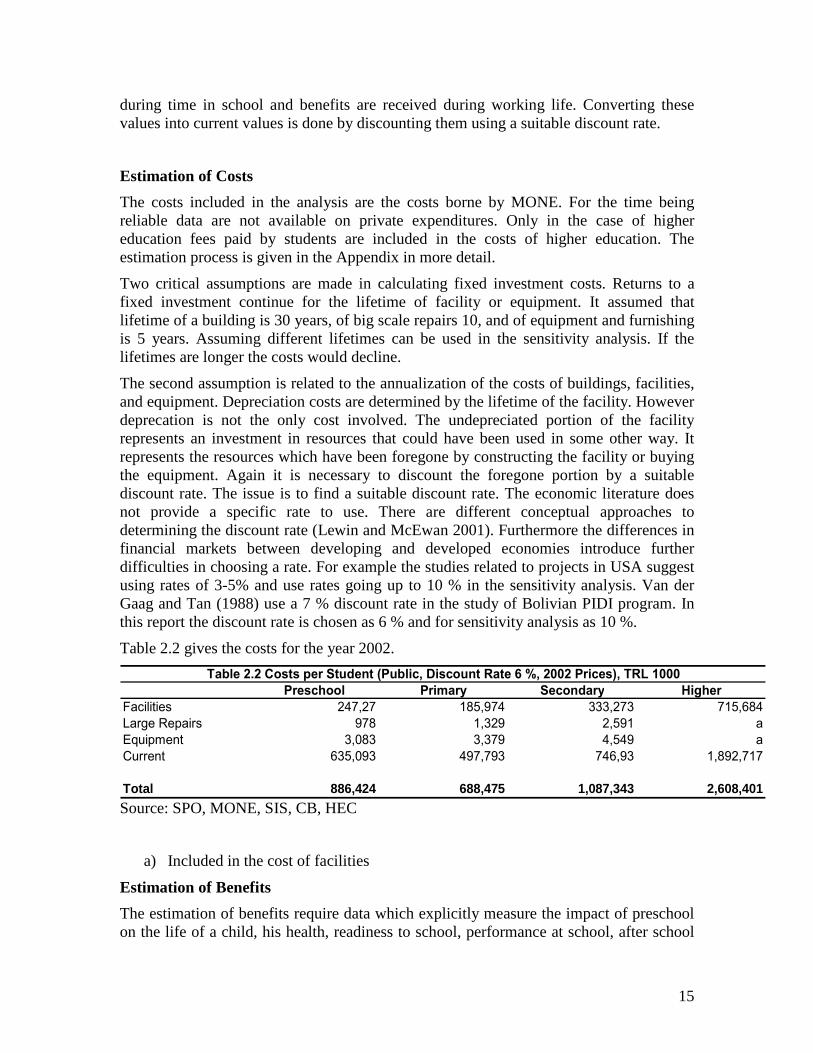
Table 2.2 gives the costs for the year 2002.
Table 2.2 Costs per Student (Public, Discount Rate 6 %, 2002 Prices), TRL 1000Preschool Primary Secondary Higher
Facilities 247,27 185,974 333,273 715,684Large Repairs 978 1,329 2,591 aEquipment 3,083 3,379 4,549 aCurrent 635,093 497,793 746,93 1,892,717
Total 886,424 688,475 1,087,343 2,608,401
Source: SPO, MONE, SIS, CB, HEC
a) Included in the cost of facilities
Estimation of Benefits
The estimation of benefits require data which explicitly measure the impact of preschool on the life of a child, his health, readiness to school, performance at school, after school

16
outcomes and the like. There are not many of this type of studies. For the developing countries there are two studies to author’s knowledge: Brazil study by de Barros and Mendonça (1999) and the study by Ka��tc�ba��, Sunar and Bekman (2001 and 2004) and Bekman (1998). Ka��tc�ba��, Sunar and Bekman set out to asses the effects of early childhood intervention models in Turkey. The study follows the original preschool sample into adulthood and measure the impact of ECE on their performance at school, education levels, jobs, incomes and health. The original sample is composed of mother-trained and mother-non-trained children. Mothers were trained within the framework of Mother-Child Education Program (MOCEP. Some of the children were at home, some of them at a custodial daycare center and some were at educational centers. The composition of the sample is suitable for measuring the impact of a type of early childhood intervention as well as comparing different ECE programs with respect to their impact.
An initial analysis of the findings by Ka��tc�ba��, Sunar and Bekman in the follow-up study strongly indicates that children who had ECE services have completed a higher level of education than those who did not have ECE services. This becomes more pronounced in the case of higher education. Children who had ECE intervention definitely have a higher chance of continuing to higher education.
Table 2.3 Average Years of EducationMother Trained 11,32 Mother Non-Trained 10,49
Mother Trained or Child at a center 10,99 Mother Non-Trained and Child at Home 10,23
Mother Trained and Child at a Center 11,41 The Rest 10,57
Primary Middle-School High School Higher Education
Mother Trained 17,1 19,5 29,3 34,1Mother Non-Trained 18,7 17,3 41,3 22,7
Mother Trained or Child at a center 17,6 21,2 29,4 31,8Mother Non-Trained and Child at Home 19,4 9,7 58,1 12,9
Mother Trained and Child at a Center 14,3 18,0 35,7 32,1The Rest 19,3 18,2 37,5 25,0
Table 2.4 Final Education Level (%)
Ka��tc�ba��, Sunar and Bekman also find that the probability of unemployment is lower for those children who were enrolled in an ECE program. Currently more of them are employed and the number of times they were unemployed were lower than those children who did not have ECE intervention.
17
Table 2.5 Employment Status
% of EmployedMother Trained 70Mother Non-Trained 66
Mother Trained or Child at a center 73Mother Non-Trained and Child at Home 51
Mother Trained and Child at a Center 70The Rest 66
Table 2.6 Number of Times Unemployed
Mother Trained 1,92Mother Non-Trained 2,14
Mother Trained or Child at a center 1,98Mother Non-Trained and Child at Home 2,30
Mother Trained and Child at a Center 1,78The Rest 2,15
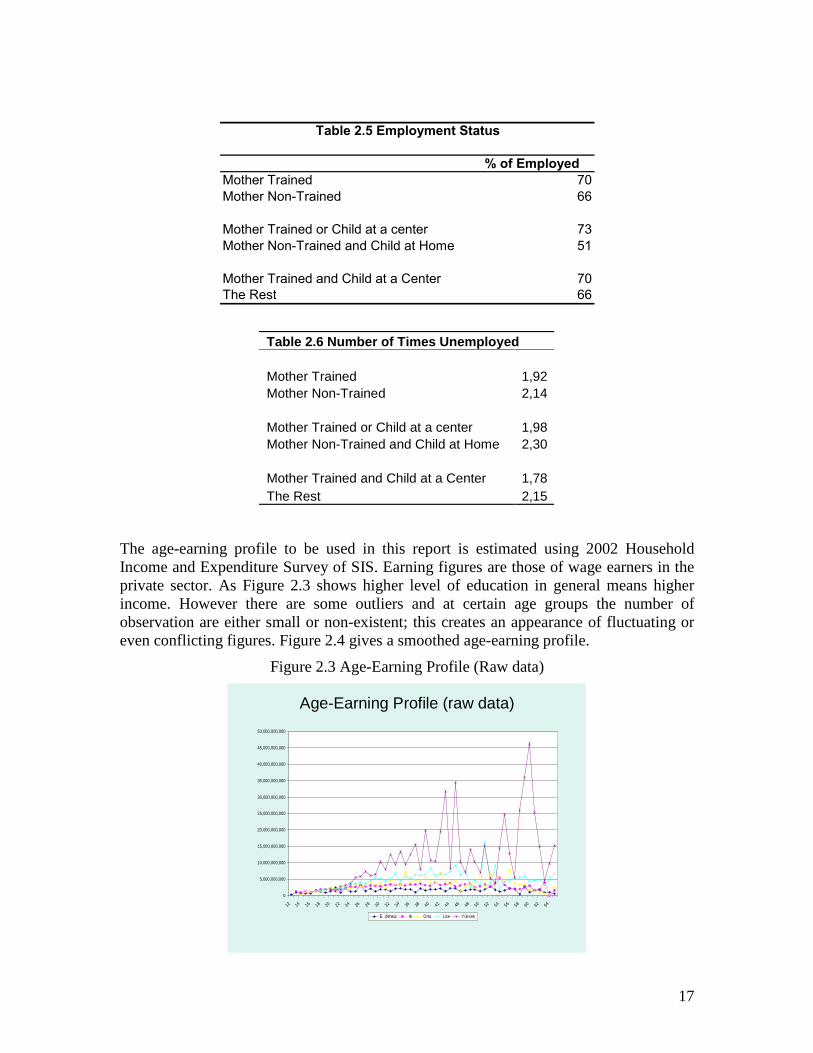
The age-earning profile to be used in this report is estimated using 2002 Household Income and Expenditure Survey of SIS. Earning figures are those of wage earners in the private sector. As Figure 2.3 shows higher level of education in general means higher income. However there are some outliers and at certain age groups the number of observation are either small or non-existent; this creates an appearance of fluctuating or even conflicting figures. Figure 2.4 gives a smoothed age-earning profile.
Figure 2.3 Age-Earning Profile (Raw data)
Age-Earning Profile (raw data)
0
5,000,000,000
10,000,000,000
15,000,000,000
20,000,000,000
25,000,000,000
30,000,000,000
35,000,000,000
40,000,000,000
45,000,000,000
50,000,000,000
12 14 16 18 20 22 24 26 28 30 32 34 36 38 40 42 44 46 48 50 52 54 56 58 60 62 64
E� itimsiz �lk Orta Lise Yüksek
18
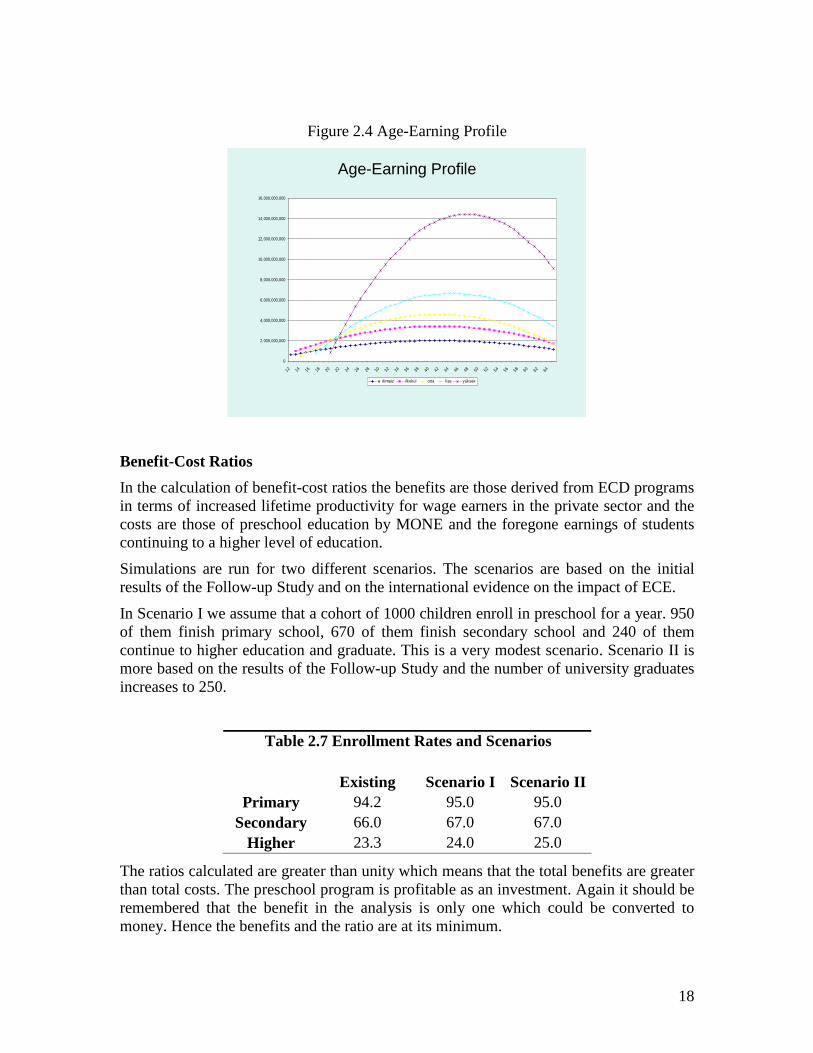
Figure 2.4 Age-Earning Profile
Age-Earning Profile
0
2,000,000,000
4,000,000,000
6,000,000,000
8,000,000,000
10,000,000,000
12,000,000,000
14,000,000,000
16,000,000,000
12 14 16 18 20 22 24 26 28 30 32 34 36 38 40 42 44 46 48 50 52 54 56 58 60 62 64
e� itimsiz ilkokul orta lise yüksek
Benefit-Cost Ratios
In the calculation of benefit-cost ratios the benefits are those derived from ECD programs in terms of increased lifetime productivity for wage earners in the private sector and the costs are those of preschool education by MONE and the foregone earnings of students continuing to a higher level of education.
Simulations are run for two different scenarios. The scenarios are based on the initial results of the Follow-up Study and on the international evidence on the impact of ECE.
In Scenario I we assume that a cohort of 1000 children enroll in preschool for a year. 950 of them finish primary school, 670 of them finish secondary school and 240 of them continue to higher education and graduate. This is a very modest scenario. Scenario II is more based on the results of the Follow-up Study and the number of university graduates increases to 250.
Existing Scenario I Scenario IIPrimary 94.2 95.0 95.0
Secondary 66.0 67.0 67.0Higher 23.3 24.0 25.0
Table 2.7 Enrollment Rates and Scenarios
The ratios calculated are greater than unity which means that the total benefits are greater than total costs. The preschool program is profitable as an investment. Again it should be remembered that the benefit in the analysis is only one which could be converted to money. Hence the benefits and the ratio are at its minimum.

19
Discount Rate
Scenario I Scenario II
6% 2.18 3.4310% 1.12 1.69
Table 2.8 Benefit-Cost Ratios
Abecedarian (Masse and Barnett 2002) and Perry Preschool (Scheweinhart, Barnes and Weikart 1993) are the leading studies in this field. Both projects traced personal and social development of a group of children and their interaction with family and society until they are 27 years old. The sample was composed of children who participated in the preschool project and those who did not. The quantifiable benefits and costs included health, employment status, and criminal activity as well as education. The benefit-cost ratio is estimated to be 7 in Perry Preschool study and 4 in Abecedarian project. The particularly high benefit-cost ratio is mainly due to the less involment of those who attended the project in criminal activities.
The few available studies on developing countries are based on scenarios because of the lack of longitudinal data on the impact of ECE programs. Van der Gaag and Tan (1998) calculated benefit-cost ratio for PIDI program in Bolivia. PIDI is a program targeting children living in the slums of big cities. These children are considered at risk because they are living in a environment where baby and child mortality rates, malnutrition and illness load levels are high and physical and social development levels are low. The enrollment rate in primary education is low, repetition and drop-out rates are high; almost none continue to secondary education. The children participating in the program receive nutrition, health and cognitive development services. Van der Gaag and Tan analyze two scenarios. They are based on a decrease in under-5 mortality rates, increase in primary school enrollment and a drop in repetition and drop-out rates. The benefit-cost ratio they calculate for children at risk is 2.26 and for a wider target is 1.38.
A study on Egypt (World Bank, 2001) deals with regional differences. The scenarios are based on an increase in enrollment rates and a decrease in repetition and drop-out rates. The ratios range 1.20-5.81.
The Jordan study of Young and Van der Gaag (2002) deals with scenarios of decreasing child mortality rates and increasing enrollment in primary and secondary education. The ratios range 1.49-3.06.
In all the three studies the discount rate is 7 %.
Table 2.9 gives the benefit-cost ratios for some non-ECD projects. The findings of this report and other studies mentioned clearly show that preschool education is profitable.
Table 2.9 Benefit-Cost Ratios for Selected non-ECD Projects

20
Project Ratio
Hill Forest Development Project, Nepal’ 1.18
Philippine Ilocos Irrigation Systems Improvement Project b 1.48
Large-Scale Alternative 1.32
Small-Scale Alternative 1.99
Livestock Development Project, Uruguay c 1.59
Livestock and Agricultural Development Project, Paraguay 1.62
Cotton Processing and Marketing Project, Kenya 1.80
Kunda Cement Factory, Estonia 2.27
21
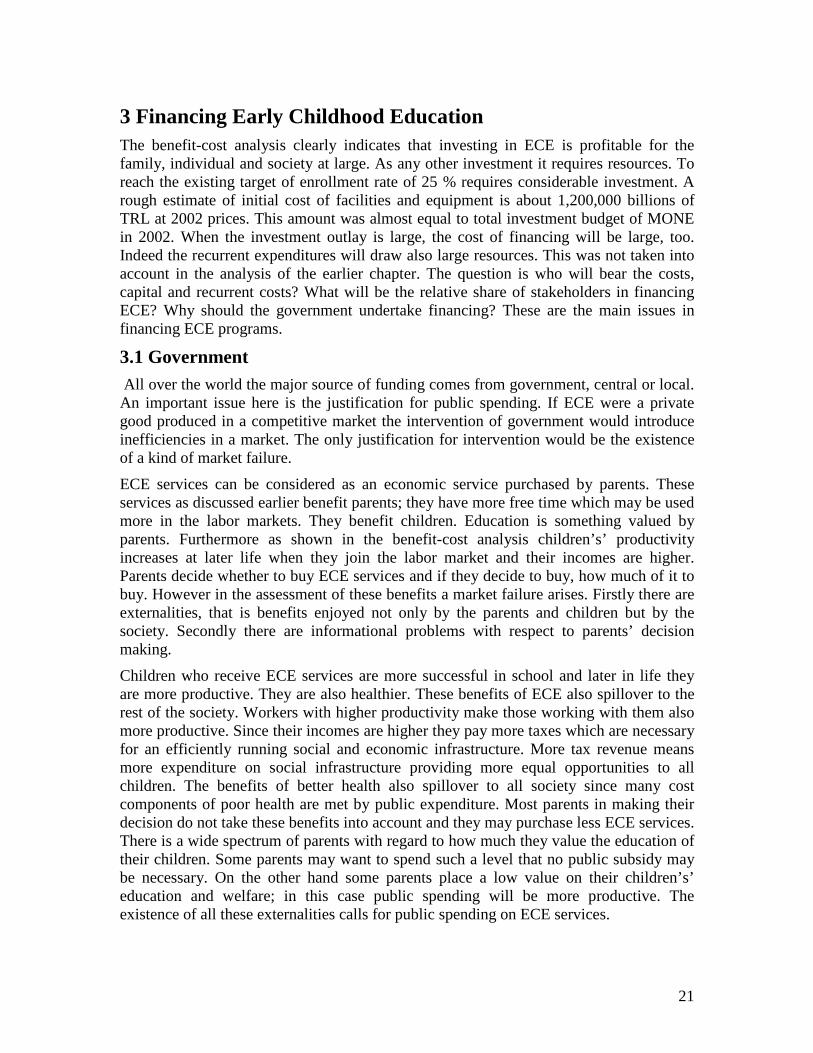
3 Financing Early Childhood Education The benefit-cost analysis clearly indicates that investing in ECE is profitable for the family, individual and society at large. As any other investment it requires resources. To reach the existing target of enrollment rate of 25 % requires considerable investment. A rough estimate of initial cost of facilities and equipment is about 1,200,000 billions of TRL at 2002 prices. This amount was almost equal to total investment budget of MONE in 2002. When the investment outlay is large, the cost of financing will be large, too. Indeed the recurrent expenditures will draw also large resources. This was not taken into account in the analysis of the earlier chapter. The question is who will bear the costs, capital and recurrent costs? What will be the relative share of stakeholders in financing ECE? Why should the government undertake financing? These are the main issues in financing ECE programs.
3.1 Government All over the world the major source of funding comes from government, central or local. An important issue here is the justification for public spending. If ECE were a private good produced in a competitive market the intervention of government would introduce inefficiencies in a market. The only justification for intervention would be the existence of a kind of market failure.
ECE services can be considered as an economic service purchased by parents. These services as discussed earlier benefit parents; they have more free time which may be used more in the labor markets. They benefit children. Education is something valued by parents. Furthermore as shown in the benefit-cost analysis children’s’ productivity increases at later life when they join the labor market and their incomes are higher. Parents decide whether to buy ECE services and if they decide to buy, how much of it to buy. However in the assessment of these benefits a market failure arises. Firstly there are externalities, that is benefits enjoyed not only by the parents and children but by the society. Secondly there are informational problems with respect to parents’ decision making.
Children who receive ECE services are more successful in school and later in life they are more productive. They are also healthier. These benefits of ECE also spillover to the rest of the society. Workers with higher productivity make those working with them also more productive. Since their incomes are higher they pay more taxes which are necessary for an efficiently running social and economic infrastructure. More tax revenue means more expenditure on social infrastructure providing more equal opportunities to all children. The benefits of better health also spillover to all society since many cost components of poor health are met by public expenditure. Most parents in making their decision do not take these benefits into account and they may purchase less ECE services. There is a wide spectrum of parents with regard to how much they value the education of their children. Some parents may want to spend such a level that no public subsidy may be necessary. On the other hand some parents place a low value on their children’s’ education and welfare; in this case public spending will be more productive. The existence of all these externalities calls for public spending on ECE services.
22
Even if we do not take the externalities into account parents may not buy enough of ECE services or they may buy but the quality may not be high enough. Firstly they may face a budget constraint; they may not have enough money to pay for the services. In a perfectly competitive situation parents may borrow against children’s’ future incomes. However this is not easy or not possible at all for many parents. Secondly they cannot easily measure the quality of ECE services they want to buy; that is they do not have enough information. Consequently the quality of ECE services they want to purchase does play enough important role in their decision process. These reasons are also widely accepted arguments for public spending.
Parents benefit directly from ECE services through their having more time and participating more in the labor market. This means an increase in their income. Although this a private benefit, it has externalities. An increase in tax levels because of the working mother brings significant benefits to other taxpayers. If a mother has to leave the labor force because she has to take care of her child then she will lose her wages and possibly her skills; the tax revenue will fall which will harm other taxpayers.
Again even if we do not take the externalities into account parents may not buy enough of ECE because they are not fully aware of the short and long term private and social losses they have to face when they leave the labor market for long periods of time in order to take care of their young children.
The externalities and incompleteness of information constitute the arguments for market failure and hence involvement of government in the provision of ECE services.
Even in the absence of market failures there may be a case for government intervention because education has a special role in the social and economic development of society. Firstly there is the consideration of equity. Not all parents can afford to invest in education of their children and meet all the direct and indirect costs. Under free market conditions only those children whose parents can afford to invest can get education. This situation creates an under-investment from the social point of view. Furthermore since education is one of the determinants of lifetime income, inequalities would continue from one generation to another. The government intervenes because it wants to promote equality.
Secondly education is considered to be a merit good. It is not easily quantifiable and left to the market forces it can be under-supplied. Education is necessary for economic and social development and hence government intervenes in the market so that it is not under supplied.
In Turkey almost % percent of the children receiving ECE services are in the public domain and government meets the almost all of the cost. The budget for MONE is allocated within the central budget like any other ministries and public institutions. For the government the problem is to allocate expenditures between different ministries. For MONE it is to allocate between different education levels and types of education. On the one hand there are the targets set by the government for enrollment in different education levels; on the other hand the resources are not enough. Although ECE is one of the priorities of MONE, since it is not compulsory inevitably it does not get the attention it deserves. To reach the target levels of enrollment MONE’s budget should increase as well as the budget for ECE services. ECE is more expensive per student than primary
23
education basically because the number of children in a classroom is restricted to 20 in preschools and 25 in nursery classes by regulations. In primary education class sizes can be very large.
3.2 User Fees Most countries charge user fees to recover some of the expenses. User fees show considerable variation across countries. Some countries charge fees to recover a large part of the costs and only forego these charges in the extreme cases of very poor families or of children at risk. Some countries try to recover a small part of the costs. In Turkey user fees cover only cost of food and some operating expenses. The fees are determined every year for each province and district locally. Since ECE is not compulsory there is no reduction in fees except for the children of martyrs, disabled and extremely poor people. Ten percent of the total capacity is reserved for these children and no fee is charged. Otherwise priority is given to those children whose parents are martyrs, disabled or single or those children who lost one of their parents or have special educational needs. Again children whose parents are working or one or both of them working abroad or are poor are taken into account during the acceptance process. However 90 percent of the students have to pay the full fee.
Schools also accept voluntary contributions from parents. This is a thorny issue because sometimes it is not clear whether it is voluntary or involuntary. Currently in Istanbul monthly fee for public preschools and nursery classes averages around 100 million TRL. This is a high figure for many parents. As a result the poorest families that need ECE services most will not be able pay these fees. It should be also noted there are also many parents who can pay this amount. MONE should try to recover costs, at least some of the current wherever possible.
3.3 Private sources In some countries subsidies are directed to public sector. In some countries where ECE services are largely provided by private sector these services are contracted to private non-profit or for-profit institutions. There have been arguments favoring both systems. The decision is whether to produce an input itself or contract for that input with an external supplier. Each mode has its own costs to ensure that the right product is delivered at the lowest cost. When state provides subsidies to private producers it has to regulate them so that the right kind of ECE services is delivered and the funds supplied by the state should be used effectively. This process has transaction costs. It involves lots of uncertainties about the nature and quality of the services; it requires monitoring which may be expensive. On the other hand it is well known that public bureaucracies have a rent-seeking nature. This way public provision of ECE services will be more expensive than private ones.
When governments start to give subsidies to private producers, the for-profit ECE service suppliers also want to become part of the system. These institutions argue that their innovative system will let them provide higher quality services at a lower cost. In a competitive market a for-profit institution strive to meet consumer demand and keep the costs down. Otherwise competition would drive a firm out of market. It can be argued that non-profit institutions do not have this drive for profits and may divert resources to uses other than the services required by government. On the other hand if the state cannot

24
monitor the performance of for-profit supplier and when there are public goods then contract will fail. Non-profit institutions do not have the same incentive.
In many OECD countries public subsidies are given to private institutions only when they enroll children targeted by government.
In Turkey only about 7 % of children receiving ECE services are enrolled in private institutions. Private preschools, nursery classes and day care centers which are run on a profit basis are located mainly in big cities. Out of about 26 000 children attending these institutions about 14 000 of them live in Istanbul, Izmir and Ankara. In 9 provinces there are no private institutions. The existence of parents in big cities who can afford to pay for the full cost of services and parents who have to have ECE services for their children either out of necessity or for educational purposes inevitably lead to a concentration of these services in large cities. Possibly the location of these centers will suggest something about the income distribution.
3.4 Alternative Models of ECE and Financing Options In the benefit-cost analysis of chapter 3 the costs which are included in the analysis are the costs of MONE ECE services. These services are center based. The center based model of ECE is one of the many models available (Bekman, 1998). Its both initial cost and operating costs are higher than other models of ECE. Furthermore it will be extremely costly to increase the capacity at a short-medium term. For example to reach the target of a 25 % enrollment rate would require at least 12 000 new classrooms and at least 12 000 new teachers. A single model is not sufficient to meet the varying needs of different groups of children. It would be less costly and more efficient to develop different models addressing different needs. These models would be developed along side the existing model. In a way they would complement the existing model. The overall objective should be to reach children from the point of view of poverty reduction and equity.
A good example of an alternative model is the MOCEP. It is a home based program. The program targets not only the child, but the child’s immediate environment and the mother. It tries to foster cognitive and psychosocial development in the home environment (Bekman, 1998). As referred in Chapter 2 it has been a successful program. It is cost effective, it can be implemented at a large scale and extremely flexible in targeting various segments of society and reaching children at risk. Furthermore it has been a good example of cooperation between government and a NGO. The program was developed and managed by Mother-Child Education Foundation and later it was transferred to MONE. Currently MONE, SWCPA and the Foundation are working together.
A relatively recent model particularly in some developing countries is the establishment of micro-enterprise projects. Usually subsidized loans are granted to women who want to start up a home-based day care center. In order to ensure the quality of services entrepreneurs are given training and support if they are qualified for a loan. This model also helps both children and women.

25
Types of Financial Instruments Depending on the policies of there is a wide variety of possible funding mechanisms to encourage and provide ECE services. The following list gives the instruments used in some OECD countries and taken from Cleveland and Krashinsky (2003).
¾ Maternity leave, parental leave, paternity leave, child-rearing leave, family leave, all with or without paid wage replacement benefits. This used in Turkey as regulated by the Labor Act.
¾ Public provision of universal services, or services with restricted clientele. Services provided by MONE and SWCPA are in this category.
¾ Childcare expense deduction or tax credit based on childcare expenses. Only wage and salary earners claim a small percentage of education expenses as part of tax rebate.
¾ Voucher conditional on purchase of childcare of certain types (for instance, conditional on non-profit provision, accreditation, or some indicators of quality)
¾ Income-conditioned childcare subsidies to low-income families, conditional on employment and use of certain types of childcare
¾ Wage grants, operating grants, maintenance grants to child care facilities with or without conditions about the use of the grants
¾ Childcare allowance as part of social assistance, with requirements for job training or employment
¾ Tax benefits or cash grants to subsidize stay-at-home care ¾ Capital grants to ECE facilities ¾ Tax treatment of fringe benefits, employer provision of services, employer capital
investment in services. When employers provide creche services, they considered as fringe benefits.
¾ Reduced taxation of net income of childcare centers, reduced sales taxes charged to childcare operators, reduced sales taxes charged to parents purchasing childcare.
There is no single best method of financing ECE services. It al depends on the social and economic objectives of a country, its approach to the relationship between state and family and the evaluation of the benefits-costs of different ECE policies. Also ECE needs show variation across a country. The nature of ECE activities may be different in a large city than in a small village. The most important element is the flexibility and efficiency in reaching the target groups. Flexible programs such as MOCEP are cost effective and can target children at risk who has priority for receving ECE services but not able to. These programs can complement the public preschool program.
26
4 Conclusion
The benefit-cost analysis indicates that expansion of ECE services in Turkey is highly desirable from an economic point of view. Although the assumptions about the impact of preschool education on schooling were very conservative the benefit-cost ratios are relatively high. If other benefits of ECE were included they would be still higher.
The high benefit-cost ratios are not the only reason for the expansion of ECE services. The existing state of children in Turkey, poverty and various inequities make education and particularly ECD important issues which government and society have to face and deal with.
The desired expansion of reaching 25 % enrollment rate require considerable extra resources. These resouces can be generated. Government should support targeted and flexible programs. The benefit-cost ratios for these programs will be much higher. It should try to recover costs wherever possible. However it is necessary for government to heavily subsidize or provide free of charge ECE services targeting the poor.
27
References Bekman, S. (1998), A Fair Chance: An Evaluation of the Mother-Child Education Program, �stanbul: MOCEF. Barros, R. P. de and R. Mendonça (1999), “Costs and Benefits of Pre-school Education in Brazil”, World Bank.
Çelenk, S. (2003), “The Effect of Selected Preschool Activitieson the Success of Reading Comprehension: A Turkish Experience”, Reading Improvement, 40(3): 117-125.
Haveman, R. andve B. Wolfe (1984), “The Determinants of Children’s Attainments: A View of Methods and Findings”, Journal of Economic Literature, 33(4).
Ka��tç�ba��, Ç., D. Sunar ve S. Bekman (2001), “Long-term effects of early intervention: Turkish low-income mothers and children”, Applied Developmental Psychology 22: 333-361.
Ka��tç�ba��, Ç., D. Sunar ve S. Bekman (2004), “MOCEP Follow-up Study”.
Krashinsky, M. ve G. Cleveland (2003),”Financing ECEC Services in OECD Countries”, OECD
Levin, H.M. ve P.J. McEwan (2001), Cost-Effectiveness Analysis: Methods and Applications, 2. ed., Thousand Oaks, CA: Sage Publications.
Masse, L.N ve W. S. Barnett (2002), “A Benefit-Cost Analysis of the Abecedarian Early Childhood Intervention”, American Journal of Orthopsychiatry, 63(4): 500-508.
Myers, R. (1996), The Twelve Who Survive: Strenghening Programs of Early Child Development in the Third World. 2nd ed., Ypsilanti, Mich.: High/Scope Press.
Van der Gaag, J. (2000), “From Child Development to Human Development”, From Early Child Development to Human Development, ed. M.E. Young, Washington, DC: World Bank.
Van der Gaag, J. Ve J.P. Tan (1998), The Benefits of Early Child Development Programs: An Economic Analysis, Washington, DC: World Bank
World Bank (2001), “Arab Republic of Egypt: An Economic Analysis of Early Childhood Education/ Development”
World Bank (2001a), “Brazil: Early Child Development: A Focus on the Impact of Preschools”
Young, M.E. (1996), “Early Child Development: Investing in the Future”, Direction in Development, Washington, DC: World Bank.
Young, M.E. ve J. van der Gaag (2002), “Ready to Learn? An Assessment of Needs and Programs for Children Ages 4-6 in Jordan” World Bank.