Embed Size (px)
Citation preview
March 2, 2012 British Columbia Utilities Commission 6th Floor, 900 Howe Street Vancouver, BC V6Z 2N3 Attention: Ms. Alanna Gillis, Acting Commission Secretary Dear Ms. Gillis: Re: Application for Approval of a Capital Expenditure Schedule, Rate Design and
Rates Established in an Operating and Maintenance Agreement between FortisBC Energy Inc. (“FEI” or the “Company”) and the Strata Corporation of Tsawwassen Springs Development to Provide Thermal Energy Services (“TES”) (the “Application”)
Tsawwassen Springs Development (the “Development”) is a four-phased residential development. FEI entered into an Operating and Maintenance Agreement (the “Service Agreement”) with the developer of the Development to own, operate, and maintain only four Loop Field Systems (“LFS”), each of which is a component of the ground heat pump geo-exchange energy system serving each phase of the Development. The contract has been assigned to the strata corporation (the “Strata Corporation”) which now owns the Development and the energy systems except the LFS. The LFS for the first phase of the Development is now operational.
In Order No. G-9-12 under paragraph 2, the Commission directed:
“A CPCN proceeding is not required for the following four AES projects: Tsawwassen Springs, Camden Green, Glen Valley and Gorman School”.
Further in the Reasons for Decision attached as Appendix A to Order No. G-9-12, on page 4 of 8, regarding the four identified projects the Commission Panel noted:
“where construction was started well in advance of the Order, and outside of the 30 day period that is described in section 45(5) of the Act, the Commission Panel agrees that no CPCN is required.”
With this Application, FEI is seeking, pursuant to section 44.2 of the Utilities Commission Act (the “Act”), for acceptance of a capital expenditure schedule. Although FEI has filed the “Loop Field System Purchase and Sale Agreement” entered into between FEI and the developer (the “Purchase and Sale Agreement), FEI does not request approval or acceptance from the Commission for this agreement. The Purchase and Sale Agreement is provided to demonstrate and support the calculation of capital expenditures requested.
FEI is also seeking pursuant to sections 59-61 of the Act, Commission approval of the rate design and rates established in the Service Agreement as “just and reasonable.” As
Diane Roy Director, Regulatory Affairs - Gas FortisBC Energy Inc.
16705 Fraser Highway Surrey, B.C. V4N 0E8 Tel: (604) 576-7349 Cell: (604) 908-2790 Fax: (604) 576-7074 Email: [email protected] www.fortisbc.com Regulatory Affairs Correspondence Email: [email protected]
B-1

March 2, 2012 British Columbia Utilities Commission Application for Approval of Operating and Maintenance Agreement for TES between FEI and the Strata Corporation of Tsawwassen Springs Development Page 2
demonstrated in the Application, the rate (termed “Monthly Fee” in the Service Agreement) designed for the Development accords with basic cost of service ratemaking principles that recover a “fair and reasonable charge” for the service to be provided to the Strata Corporation.
Regulatory Review Process
In Orders No. G-1-12 and G-9-12, the Commission has decided that a Certificate of Public Convenience and Necessity (“CPCN”) is not required for this Application. As FEI stated in the “Submissions of FEU Regarding Interim CPCN Threshold” in the AES Inquiry, the procedural process to review an application under a provision of the Act should be determined in a manner that is commensurate with the size and scope of the projects at issue. For this Application, FEI proposes that the regulatory review consists of the Commission and the registered interveners filing written comments on the Application. FEI will then address concerns raised in written comments through a written submission. FEI submits that this approach is appropriate and efficient for this Application for the following reasons.
First, the cost of service rates provided for in the Service Agreement and for which FEI seeks approval are based on the cost-of-service model and cost inputs set forth in section 12A of FEI’s General Terms and Conditions that were approved in FEI’s 2010-2011 Revenue Requirements Application. Although the Commission has made GT&C 12A interim by Order No. G-223-11, the interim nature of 12A should not affect the approval of the Application. The rates designed in this Application follow the cost-of-service rate design principles and allow FEI to recover costs for providing service to the Strata Corporation during the contract period.
Second, the size of the project subject to this Application is rather small. The capital expenditures for the Loop Field Systems to be owned and operated by FEI are approximately $1.2 million, reflecting the aggregate cost of all four Loop Field Systems to be installed at the Development.
Third, the energy systems that will be installed will be completely within the Development lands and will not have any direct impacts on others.
Fourth, FEI’s natural gas customers will not be adversely impacted by the thermal energy service provided to the Strata Corporation because all costs and revenues will be recorded in the TES Deferral Account and will not be recovered from the natural gas class of service customers.
Fifth, this service differs from the service that FEI proposes to provide to the Delta School District, where FEI will own and operate all of the thermal energy equipment, purchase all of the energy necessary to produce thermal energy, meter the thermal energy deliveries for billing purposes and set rates on an annual basis to reflect changes in the cost of service. Rather, the rates for this service are set according to a cost of service forecast for the term of the contract for FEI to own and operate only one component of the thermal energy equipment. As a result, the service and rates for this Application are inherently simpler and therefore, review may be abbreviated in comparison. Further, since this Application follows GT&C 12A, which is now interim, there is little or nothing of precedential value in this

March 2, 2012 British Columbia Utilities Commission Application for Approval of Operating and Maintenance Agreement for TES between FEI and the Strata Corporation of Tsawwassen Springs Development Page 3
Application other than as it relates to the other three projects FEI developed under GT&C12A and will be submitting shortly to the Commission.
Finally, an inquiry into FEI’s “alternative energy services” is underway. Some broader or policy-type issues relevant to FEI’s provision of thermal energy services have been canvassed thoroughly in that process. Although some of these issues may be relevant to the present Application, they should not be re-addressed here.
In light of these considerations, FEI submits that the process described above is appropriate for the review of this Application.
Confidentiality
FEI requests that the Commission keep the following appendices confidential in accordance with the Commission’s Practice Directive related to Confidential Filings:
(a) Appendix A – Operating & Maintenance Agreement
(b) Appendix B – Purchase and Sale Agreement
However, after the approval of the Application, Appendix A can become part of the public record for this Application.
The particular rationale for keeping each specific document confidential is as follows.
Service Agreement (Appendix A)
The general terms of the Service Agreement are described in Section 2.3.1 of the Application. FEI submits that this Service Agreement should be kept confidential until this Application is approved by the Commission. The terms and conditions of the Agreement reveal the parties’ agreed upon positions after negotiation. Should this Application not be approved, FEI will be in the situation where it may need to enter into re-negotiation with the Strata Corporation. In the event that the Strata Corporation may wish to consider other providers of thermal energy service (competitors of FEI) during the re-negotiation, FEI would be prejudiced by a competitor who has access to those contractual terms and gain an unfair advantage over FEI in future negotiations. This represents a substantial risk of harm to FEI.
Once the contracts are approved, the concern discussed above no longer exists. Thus, the contracts can then be made public.
Purchase and Sale Agreement (Appendix B)
The general terms of the Purchase and Sale Agreement are described in section 3 of the Application. FEI submits that the Purchase and Sale Agreement should be kept confidential on the basis that it contains commercially sensitive information, and there is a reasonable expectation of prejudice to FEI if this information is made public. The Purchase and Sale Agreement contains information relevant to the business model/arrangement that FEI has developed for owning and operating thermal energy systems employed in residential strata developments. FEI has spent time developing this business model that is unique to this Development but also may be used in similar projects. FEI believes that disclosure of such

March 2, 2012 British Columbia Utilities Commission Application for Approval of Operating and Maintenance Agreement for TES between FEI and the Strata Corporation of Tsawwassen Springs Development Page 4
commercially sensitive information can unduly harm FEI’s competitive and negotiations in future similar business negotiations and transactions.
Moreover, the public interest in the transparency of the regulatory process and FEI’s charged rates will not be impaired. As stated above, the Service Agreement will become public when this Application is approved. As mentioned above, the relevant portion of the Purchase and Sale Agreement is the purchase price for the Loop Field Systems, which has been disclosed in the Application.
FEI submits that the proper approach to considering confidentiality requests of this nature is to balance between the commercial interest being compromised, on the one hand, and the interests of those seeking disclosure of the document on the other hand. FEI does not object to customer group interveners such as the British Columbia Public Interest Advocacy Centre on behalf of the British Columbia Old Age Pensioners Organization et al (“BCOAPO”) and the Commercial Energy Consumers Association of British Columbia (“CEC”) and environmental interveners such as the BC Sustainable Energy Association (“BCSEA”), who are not competitors of FEI or currently negotiating with FEI for TES projects, being provided with these appendices upon executing standard form undertakings of confidentiality. However, for the reasons set out above, FEI does not believe that any of these documents should be provided to its competitors, such as Corix Utilities Inc. This ensures that those parties who represent the interests of ratepayers, and broader public interests, have access to the full record of the proceeding, and diminishes concerns regarding transparency in the regulatory process.
FEI therefore requests the Commission hold the information in the above identified Appendices confidential in accordance with the Commission’s Practice Directive related to Confidential Filings. FEI believes that there is more than adequate non-confidential information in the Application to permit a transparent review process for all concerned interveners. Furthermore, those parties with non-competitive, public interest concerns with the Application can have access to the full record upon executing standard undertakings of confidentiality, and as a result FEI’s requests for confidentiality should be granted.
If you require further information or have any questions regarding this submission, please contact Gareth Jones at (250) 380-5792.
Yours very truly, FORTISBC ENERGY INC. Original signed by: Shawn Hill
For: Diane Roy Attachments cc: Registered Parties to the FEU 2012-2013 RRA Proceeding Registered Parties to the AES Inquiry Proceeding

FortisBC Energy Inc.
Application for Approval of a Capital Expenditure Schedule and Rate
Design and Rates Established in an Operating and Maintenance Agreement
to Provide Thermal Energy Services for Tsawwassen Springs Development
March 2, 2012

FORTISBC ENERGY INC. APPLICATION TO PROVIDE THERMAL ENERGY SERVICES FOR TSAWWASSEN SPRINGS DEVELOPMENT
Page i
Table of Contents
1 Request for Approval ......................................................................................... 1
1.1 Thermal Energy Service ........................................................................................ 1
1.2 Capital Expenditures of $1.184 Million ................................................................... 1
1.3 Rates for Service ................................................................................................... 2
2 General Terms and Conditions Section 12A .................................................... 3
2.1 System Used at the Development .......................................................................... 3
2.1.1 Geo-Exchange System ............................................................................................ 3
2.1.2 Operating Characteristics ........................................................................................ 5
2.2 Ownership of LFS .................................................................................................. 5
2.2.1 Selection and construction of Geo-Exchange ......................................................... 5
2.2.2 Ownership of the Subsurface Loop fields ................................................................ 6
2.3 Cost of Service Model ............................................................................................ 7
2.3.1 Rate and Other Key Terms of Service Agreement .................................................. 7
2.3.2 Cost of Service Recovery ........................................................................................ 7
2.4 Projected Energy Consumption/Number of Customers .......................................... 9
2.5 Costs ....................................................................................................................10
2.5.1 Capital Cost, Rate Base & Depreciation Expense ................................................ 11
2.5.2 Return on Investment ............................................................................................ 13
2.5.3 Operating and Maintenance (O&M) Expenses ...................................................... 13
2.5.4 Applicable Taxes ................................................................................................... 14
3 Conclusion ........................................................................................................ 16

FORTISBC ENERGY INC. APPLICATION TO PROVIDE THERMAL ENERGY SERVICES FOR TSAWWASSEN SPRINGS DEVELOPMENT
Page ii
List of Appendices
A – Operating & Maintenance Agreement (Service Agreement) CONFIDENTIAL
B – Loop Field System Purchase and Sale Agreement (Purchase Agreement) CONFIDENTIAL
C – Financial Schedules
Schedule 1 - Rate Design & Thermal Energy Services Deferral Account
Schedule 2 - Revenue Requirement
Schedule 3 - Rate Base
Schedule 4 - Income Tax Expense
Schedule 5 - Discounted Cash Flow Analysis.
D – Evidence in Support of Equity Risk Premium
E – Draft Order

FORTISBC ENERGY INC. APPLICATION TO PROVIDE THERMAL ENERGY SERVICES FOR TSAWWASSEN SPRINGS DEVELOPMENT
Page 1
1 REQUEST FOR APPROVAL
1.1 Thermal Energy Service
Pursuant to section 12A of FortisBC Energy Inc. (“FEI”) General Terms and Conditions (“GT&C
12A”) and Order No. G-141-09 issued by the British Columbia Utilities Commission (“BCUC” or
the “Commission”), FEI intends to provide Thermal Energy Service (“TES”) to the Tsawwassen
Springs Development (the “Development”), by owning, operating and maintaining four geo-
exchange loop field systems (“LFS”), one for each phase of the Development, and charging a
rate for the service. The provision of thermal energy service for each of the four phases of the
Development is administered through one Operating and Maintenance Agreement (the “Service
Agreement”, attached confidentially as Appendix A) between FEI and the Strata Corporation
(owners of Strata Plan BCS41181, also being referred to as the “Strata”) (the “Application”).
Each LFS will provide thermal energy and deliver it to the Strata by connecting to equipment
that the Strata will own and operate. Further, the Strata will own the mechanical equipment that
causes the circulation of the water/glycol mixture in each LFS that FEI owns and operates and
will be responsible for purchasing any electricity or natural gas necessary to operate their
equipment. FEI will not be metering the thermal energy that FEI provides through each LFS
and delivers to the Strata.
This service differs from the service that FEI proposes to provide to the Delta School District,
where FEI will own and operate all of the thermal energy equipment, purchase all of the energy
necessary to produce thermal energy and meter the thermal energy deliveries for billing
purposes.
1.2 Capital Expenditures of $1.184 Million
FEI requests that the Commission accept capital expenditures of $1.184 million pursuant to
section 44.2 of the Utilities Commission Act (“UCA”). The amount reflects the cost to purchase
all four LFS’s, plus 10 percent capitalization of the purchase price for each LFS. Although FEI
does not require or request Commission acceptance of the Loop Field System Purchase and
Sale Agreement entered between FEI and the developer (the “Purchase and Sale Agreement”),
attached confidentially as Appendix B, it is filed in support of the calculation of capital
expenditure amounts requested. Further details regarding the capital expenditures are in
section 2.5.1.
1 The Service Agreement was originally executed between FEI and TGCC Management LLP, the developer, and
was subsequently assigned to the owners of Strata Plan BCS4118.

FORTISBC ENERGY INC. APPLICATION TO PROVIDE THERMAL ENERGY SERVICES FOR TSAWWASSEN SPRINGS DEVELOPMENT
Page 2
Section 44.2 of the Act requires the Commission to consider the applicable of British Columbia’s
energy objectives, which are defined in Section 2 of the Clean Energy Act. The requested
capital expenditures are for geo-exchange systems, which, in turn, advance British Columbia’s
energy objectives by:
• using innovative geothermal energy technology that supports energy conservation and
efficiency through the use of a renewable resource;
• reducing BC greenhouse gas emissions through the use of a renewable resource; and
• encouraging the switching from one kind of energy source or use to another that
decreases greenhouse gas emissions in British Columbia.
All of this will, in turn, benefit British Columbians in general, whether or not they currently
receive services from FEI.
Moreover, there is no risk to FEI’s natural gas customers as the services contemplated in the
Service Agreement are related to FEI’s thermal energy class of service. As approved in
Commission Order No. G-141-09, costs and revenues related to provision of thermal energy
services will be separately tracked and accounted for.
This Application is consistent with the 2010 Long Term Resource Plan (“LTRP”) filed by the
FortisBC Energy Utilities (comprised of FortisBC Energy Inc., FortisBC Energy (Vancouver
Island) Inc. and FortisBC Energy (Whistler) Inc.) as an application for a specific project that
supports British Columbia’s energy objectives as described above. This Application is also
consistent with the stated intention of FEI to initially apply for approval of rates on a project-by-
project basis.
1.3 Rates for Service
FEI also requests that the Commission approve the proposed rate design and rates as they are
set out in the Service Agreement (termed as “Monthly Fee” in the Agreement, being referred to
here as the “Rate” or “Rates”) pursuant to sections 59-61 of the UCA and in accordance with
Commission Order No. G-9-12. The Rates that FEI proposes to charge for this service are just
and reasonable as they will recover the cost of service relating to the ownership and operation
of each LFS only during the term of the Service Agreement. This is further explained in section
2.5.1 below.
Phase 1 LFS has been constructed and is owned and operated by FEI; however, FEI is not yet
collecting Rates as contemplated under the Service Agreement until FEI receives the requested
approval.
FORTISBC ENERGY INC. APPLICATION TO PROVIDE THERMAL ENERGY SERVICES FOR TSAWWASSEN SPRINGS DEVELOPMENT
PAGE 3
2 GENERAL TERMS AND CONDITIONS SECTION 12A
FEI submits that the terms of the Service Agreement satisfy the requirements of GT&C 12A.
The discussion below follows GT&C 12A.
2.1 System Used at the Development
2.1.1 GEO-EXCHANGE SYSTEM
The Development is using a geo-exchange system to provide each of the strata lots with the
majority of their thermal energy needs for space heating and cooling by utilizing heat pumps that
access thermal energy from the ground. The GT&C 12A.1 describes geo-exchange systems as
follows:
“Geo-exchange systems, also referred to as geo-thermal systems, earth exchange systems or ground and water source heat pumps, utilize the latent heat energy contained in near surface layers of the earth, ground water and surface water. A subsurface piping system contains a liquid that absorbs heat from the surrounding material and delivers it to a central heat exchanger. High efficiency heat pumps convert this latent energy into hot water or steam contained in a separate piping system that can then deliver the heat energy to where it is required for space heating and hot water uses. Centralized equipment is usually contained within specifically designed mechanical room that serves the entire development. The heat exchanger is reversed to provide space cooling, removing heat from the building(s) and returning it to the subsurface substrate.”
In this instance, there will be four geo-exchange systems in total, each providing the thermal
energy requirements for each of the four phases of the Development. Each geo-exchange
system will have a LFS and will also incorporate a natural gas boiler, which the Strata will own
as part of the mechanical equipment, to supplement the peak heating loads and to supplement
domestic hot water loads in order to minimize capital costs and rates.
Figure 1 below shows the system at the Development.

FORTISBC ENERGY INC. APPLICATION TO PROVIDE THERMAL ENERGY SERVICES FOR TSAWWASSEN SPRINGS DEVELOPMENT
PAGE 4
Figure 1: Ground Source Heat Pump System (“GSHP System”)
The subsurface piping or geo-exchange loop fields consist of high density polyethylene piping
that circulates a water/glycol mixture (“Agent”). This Agent either absorbs or rejects heat to or
from the earth as necessary depending on the operating mode of the heat pumps throughout
the Development.
LFS for phase 1 for the Development has already been successfully installed and FEI is
currently operating the LFS. This LFS consists of 54 boreholes at depths of approximately 75
meters each and a common header to connect to the heat pumps.
The remaining 3 phases of the Development will each require a similar LFS.
The mechanical room for each phase of the Development contains pumps for circulating the
flow of the Agent in the LFS, a centralized heat pump for the pre-heating of domestic hot water
and a natural gas boiler to supplement peak thermal energy demands.
The Agent, after circulating through the LFS, enters a header in the mechanical room and then
travels via a building loop to each of the suites where individual heat pumps then supply the

FORTISBC ENERGY INC. APPLICATION TO PROVIDE THERMAL ENERGY SERVICES FOR TSAWWASSEN SPRINGS DEVELOPMENT
PAGE 5
final thermal energy demands. In the heating season, the LFS extracts heat from the earth into
the Agent for use by the heat pumps and in the cooling season, the LFS rejects heat into the
earth from the building loop system. During peak demand conditions, the natural gas boiler
provides additional heat to the Agent prior to distribution through the building loop to the heat
pumps.
2.1.2 OPERATING CHARACTERISTICS
Ground source heat pump energy systems use electricity to run the pumps that circulate the
Agent through the piping in the earth where the transfer of energy occurs and to run the heat
pumps that either increase or decrease the temperature of the Agent in order to produce usable
thermal energy. At the depth of 100 meters, the ground in the Vancouver area is approximately
10°C regardless of the ambient temperature. This enables ground source heat pumps to
operate at high efficiency levels even during peak demand periods when the ambient air
temperature is low. The relative stability of the temperatures at these depths means that a
vertical borehole, closed loop field and ground source heat pump can provide high efficiency
space heating and cooling under all weather conditions. While it is possible to design these
systems to meet all of the peak day demands, use of a supplementary natural gas boiler helps
to minimize the overall capital costs, without adding significantly to the GHG emissions.
Nonetheless, since it is possible to extract or inject energy from or to the earth, this is free
renewable energy. This explains why heat pumps have efficiency ratings that can exceed
300%.
2.2 Ownership of LFS
2.2.1 SELECTION AND CONSTRUCTION OF GEO-EXCHANGE
The developer chose to meet the energy requirements of its Development with a geo-exchange
thermal energy system as a marketing initiative for the project and to meet their sustainability
commitments to the Corporation of Delta. The developer also sought a hybrid solution
comprised of geo-exchange and natural gas boilers to ensure a competitive rate to the final
customers of the system. By adding gas boilers to the energy system, the capacity of the LFS
could be optimized so that it operates at a higher utilization rates over the course of the year
thus reducing the unit costs of the thermal energy it provides. In this manner, the geo-exchange
thermal energy system will provide up to 90% of the overall energy required for space heating,
with the natural gas boilers providing the remaining 10%. FEI does not own the boilers and is
only providing the energy that comes from the LFS.
Given the advantages of having the developer’s general contractor oversee the work related to
the drilling of the boreholes and other construction activities, the developer and FEI decided to
have the developer construct each LFS as part of their overall Development, and that FEI will
purchase the LFS at a fixed price once it has been commissioned. In this manner, the capital
costs of the Development, including the geo-exchange thermal energy systems, were reduced,
FORTISBC ENERGY INC. APPLICATION TO PROVIDE THERMAL ENERGY SERVICES FOR TSAWWASSEN SPRINGS DEVELOPMENT
PAGE 6
and construction and cost risks have been assumed by the developer. This approach enhanced
the marketability of the Development and also ensured that the Rate that FEI will charge is
stable and predictable for the Strata Corporation.
The design of the first LFS was performed by certified personnel at the developer’s direction.
FEI reviewed the design and was satisfied that the LFS would be compatible with the other
components of the GSHP System.
After the successful commissioning of the LFS in phase 1 was completed in Q2, 2011 and an
occupancy permit was obtained for that phase, FEI purchased the LFS from the developer
under the Purchase and Sale Agreement.
FEI will purchase each LFS for each phase of the Development following a similar process.
The expected completion date for the remainder of the phases is as follows:
Phase 2: Projected Completion Q3, 2013 Phase 3: Projected Completion Q3, 2014 Phase 4: Projected Completion Q3, 2015
2.2.2 OWNERSHIP OF THE SUBSURFACE LOOP FIELDS
FEI will own, operate and maintain each LFS for each phase of the Development. FEI’s
ownership is up to the point at which each LFS enters the respective mechanical room. The
Strata will own all additional equipment related to the GSHP System in the mechanical rooms
and throughout the buildings. Each strata lot owner will then own the equipment located within
their suite, namely the heat pump.
FEI will charge the Strata Corporation a Rate for owning, operating and maintaining each of the
four LFS components of the energy systems. Details of services to be provided in terms of
operation and maintenance are outlined in Schedule C of the Service Agreement.
It is important to note that FEI is only responsible for providing thermal energy from the LFS,
and is not responsible for the ownership, operation and maintenance of the mechanical room
equipment, building loop or the in-suite heat pumps. Further, FEI is not responsible for
acquiring the natural gas or electricity necessary to operate the geo-exchange systems.2
Therefore, the Rate in the Service Agreement does not recover the costs of any of these
components; rather, the Rate relates to the ownership and operation of one component of each
thermal energy system and recovers only the cost of owning and operating the LFS.
2 FEI and the Strata are in negotiation for FEI to provide maintenance services for other components of
the energy system. This will be a separate agreement if one is reached.
FORTISBC ENERGY INC. APPLICATION TO PROVIDE THERMAL ENERGY SERVICES FOR TSAWWASSEN SPRINGS DEVELOPMENT
PAGE 7
2.3 Cost of Service Model
2.3.1 RATE AND OTHER KEY TERMS OF SERVICE AGREEMENT
The Rate for each LFS for each phase of the Development is on a monthly basis and is set out
in Schedule D of the Service Agreement as follows:
Phase 1: $1,800 ($21,600 per year) plus applicable taxes Phase 2: $2,800 ($33,600 per year) plus applicable taxes Phase 3: $2,800 ($33,600 per year) plus applicable taxes Phase 4: $1,800 ($21,600 per year) plus applicable taxes
The Rate above is cumulative based on the number of LFS owned and operated by FEI at the
time of billing. For example, once the LFS for phases 1 and 2 are operative, the Rate would be
$4,600 per month ($1,800 plus $2,800). The monthly Rate will also be increased annually by
the greater of the percentage change during the preceding twelve (12) months in Statistics
Canada All Items Consumer Price Index for Vancouver, and two (2%) percent. Further, the
Rate is fixed and cannot be changed without the consent of all parties.
For each of the four phases of the Development, the Service Agreement provides for a term of
25 years running from the date that the particular phase is placed in service, subject to renewal
or renegotiation. As a result, there is not one, but four “terms” of the contract, each running
from the in-service date of the LFS and lasting 25 years.
At the end of the 25 year contractual term with respect to each phase of the Development, the
Service Agreement states that FEI and the Strata Corporation can either renew or renegotiate
the term and other conditions to extend the Agreement. Failing such extension arrangement,
the Strata Corporation must purchase the LFS from FEI for a price equal to twenty percent
(20%) of the initial purchase price paid by FEI. As shown below in section 2.5.1 (Table 3), the
end of term purchase amount is reflected in the LFS cost of service.
2.3.2 COST OF SERVICE RECOVERY
FEI designed the Rate according to a cost of service forecast model that conforms to the
requirements of GT&C 12A and Order G-141-09. GT&C 12A states:
“All applications by Customers for service using an alternative energy extension will be
subject to review using a cost of service model. The cost of service model will determine
the rate that a customer will pay for the service associated with the alternative energy
extension. Service will be provided under the terms and conditions of the Service
Agreement between FortisBC Energy and the Customer.”
As mentioned above, the Rate for each phase is termed as a Monthly Fee. Each of the monthly
Rates is for owning and operating the LFS for each phase and is designed to fully recover the
FORTISBC ENERGY INC. APPLICATION TO PROVIDE THERMAL ENERGY SERVICES FOR TSAWWASSEN SPRINGS DEVELOPMENT
PAGE 8
cost of service for that phase. That is, the four monthly rates cumulatively recover the cost of
service for all the phases in aggregate. Accordingly, the present value of total revenue from
rates for each phase, and for all phases in total, over the term of the contract equals the present
value of the total cost of service over the same time period. In this manner, the discounted cash
flows for each LFS demonstrate that each LFS investment will generate sufficient revenues to
recover its cost of service over the term of the Service Agreement.
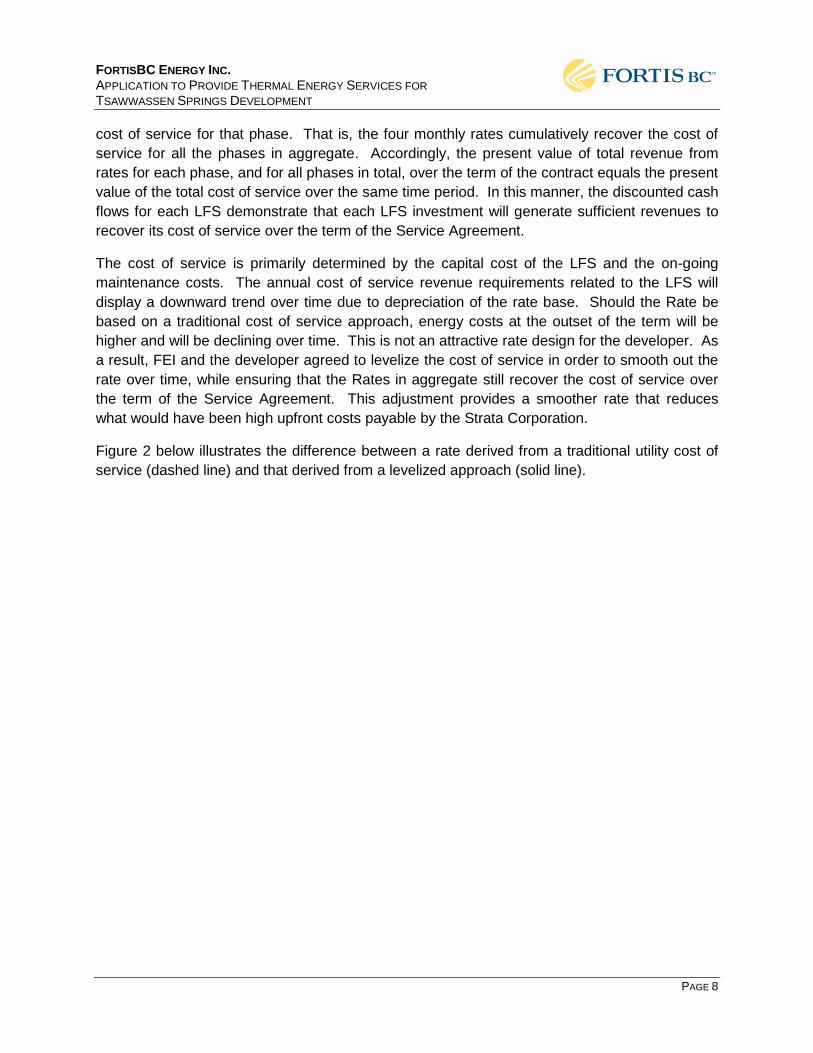
The cost of service is primarily determined by the capital cost of the LFS and the on-going
maintenance costs. The annual cost of service revenue requirements related to the LFS will
display a downward trend over time due to depreciation of the rate base. Should the Rate be
based on a traditional cost of service approach, energy costs at the outset of the term will be
higher and will be declining over time. This is not an attractive rate design for the developer. As
a result, FEI and the developer agreed to levelize the cost of service in order to smooth out the
rate over time, while ensuring that the Rates in aggregate still recover the cost of service over
the term of the Service Agreement. This adjustment provides a smoother rate that reduces
what would have been high upfront costs payable by the Strata Corporation.
Figure 2 below illustrates the difference between a rate derived from a traditional utility cost of
service (dashed line) and that derived from a levelized approach (solid line).

FORTISBC ENERGY INC. APPLICATION TO PROVIDE THERMAL ENERGY SERVICES FOR TSAWWASSEN SPRINGS DEVELOPMENT
PAGE 9
Figure 2: Cost of Service and Contract Revenue
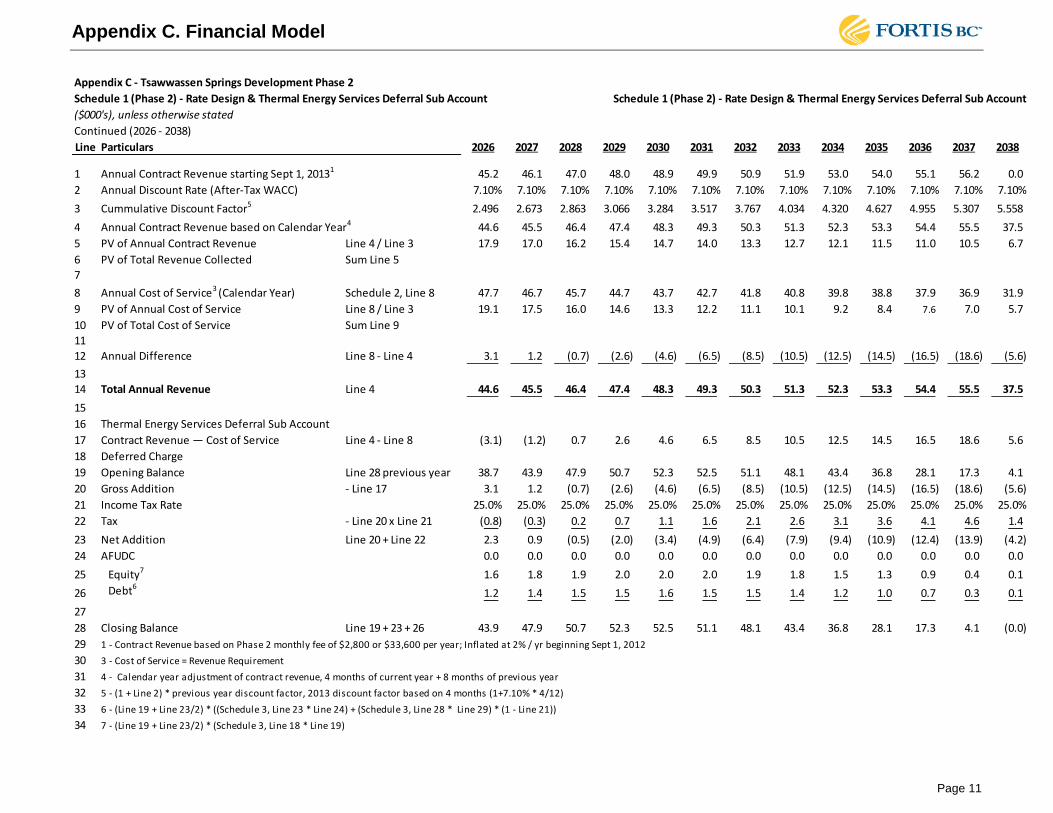
FEI will capture variances between the calculated cost of service and the actual revenues from
Rates in the Thermal Energy Services Deferral Account (the “TES Deferral Account”)
established pursuant to Commission Order No. G-141-09. FEI will also track revenues and
costs relating to this specific project and the Service Agreement via an Internal Order number
(the “IO number”) within the TES Deferral Account. In the initial years of service, the Rate is set
at a level lower than the cost of service; however, the relationship reverses starting
approximately in the year 2026 of the contract term (Appendix C, Schedule 1 - Phase 1), so that
the accumulated balance in the TES Deferral Account in respect of this Development is zero at
the end of the contract term.
2.4 Projected Energy Consumption/Number of Customers
Tsawwassen Springs Development is a residential strata development, consisting of four
phases, totalling 296 fee simple strata lots. However, there will be a single customer for FEI,
the Strata. The phasing plans for the development are as follows:
-
5
10
15
20
25
30
35
40
'00
0$
Year
Cost of Service & Contract Revenue - Contract Years
Cost of Service - Contract Year
Contract Revenue - Contract Year

FORTISBC ENERGY INC. APPLICATION TO PROVIDE THERMAL ENERGY SERVICES FOR TSAWWASSEN SPRINGS DEVELOPMENT
PAGE 10
Phase 1: 55 apartment style strata lots - four-storey wood framed building
Phase 2: 93 apartment style strata lots - six-storey concrete building
Phase 2: 93 apartment style strata lots - six-storey concrete building
Phase 4: 55 apartment style strata lots - four-storey wood framed building
The Rate that FEI is proposing to charge the Strata is based directly on the cost or purchase
price of the LFS and reflects the cost of service to the Strata over the term of the Service
Agreement. The Strata Corporation allocates the Rate to each of the strata lot (condo) owners
based on unit entitlement. Thus, the energy consumption estimate and the number and type of
thermal appliances do not have bearing on the Rate or its calculation and thus do not impact the
cost of service model, which is more fully explained below.
2.5 Costs
While only phase 1 of the Development is currently complete, FEI has provided separate
financial schedules for all four phases of the Development. Each of the phases includes costs
as set out in GT&C 12A.5:
(a) the full labour, material, and other costs necessary to serve the new Customers less
any contributions in aid of construction by the Customers or third parties, grants, tax
credits, or non-financial factors offsetting the full costs that are deemed to be acceptable
by the British Columbia Utilities Commission;
(b) the appropriate allocation of FortisBC Energy's overheads associated with the
construction of the alternative energy extension;
(c) depreciation expense related to the capital equipment associated with the alternative
energy extension; and
(d) the incremental operating and maintenance expenses necessary to serve the
Customers.
In addition to the costs identified, the cost of service model will include applicable taxes
and the appropriate return on investment as approved by the British Columbia Utilities
Commission.
Each above listed element will be explained further below. The financial schedules that support
the Rates in all four phases are contained in Appendix C. For each phase of the Development,
the schedules are organized as follows:
Schedule 1 - Rate Design & Thermal Energy Services Deferral Account
Schedule 2 - Revenue Requirement
Schedule 3 - Rate Base
Schedule 4 - Income Tax Expense
Schedule 5 - Discounted Cash Flow Analysis.

FORTISBC ENERGY INC. APPLICATION TO PROVIDE THERMAL ENERGY SERVICES FOR TSAWWASSEN SPRINGS DEVELOPMENT
PAGE 11
2.5.1 CAPITAL COST, RATE BASE & DEPRECIATION EXPENSE
FEI entered into the Purchase and Sale Agreement with the developer for the purchase of the
four LFS’s. The Purchase and Sale Agreement sets out the pre-determined purchase price for
each LFS in respect of each phase of the Development, as illustrated in Table 1:
Table 1: Purchase Price of LFS
Purchase Price of LFS
2011$ Phase 1 Phase 2 Phase 3 Phase 4 Total
LFS Purchase Price $200,000 $338,000 $338,000 $200,000 $1,076,000
The purchase price of the LFS for phase 1 was based on the installed cost of the system for that
phase and reflects the size of the LFS that has been engineered. The purchase price for the
LFS for phases 2 and 3 was calculated based on the LFS cost for phase 1 adjusted to reflect
the additional square footage of buildings 2 and 3. The LFS purchase price for building 4 is the
same as that of building 1 as the building size of both buildings is identical.
The purchase price to be paid for each LFS, other than for phase 1, will be escalated each year
by the greater of 2% or the rate of inflation. This annual price adjustment to the purchase prices
of the LFS for phases 2, 3 and 4 is the only adjustment that is applicable to the future purchase
prices of the LFS.
The total purchase price for the four loop field systems is $1.076 million. No contribution in aid
of construction has been provided by the developer.
FEI has capitalized 10 percent of the purchase price of each LFS, totalling $107,600. The 10%
is a fixed percentage that FEI has used to represent the project development costs that are to
be capitalized. The development costs related to this Development are for activities spanning
the period from early 2010 to completion of the fourth LFS expected in 2015.
Thus, the capital expenditure of $1.184 million for which FEI seeks acceptance of represents
the sum of the purchase price of $1.076 million, and 10 percent of the purchase price that is to
be capitalized in respect of development costs, as shown in Table 2 below.

FORTISBC ENERGY INC. APPLICATION TO PROVIDE THERMAL ENERGY SERVICES FOR TSAWWASSEN SPRINGS DEVELOPMENT
PAGE 12
Table 2: Capital Expenditures for which Acceptance is being Sought
Rate Base Summary
2011$ Phase 1 LFS Phase 2 LFS Phase 3 LSF Phase 4 LFS Total
Direct Capital (LFS Purchase Price)
$200,000 $338,000 $338,000 $200,000 $1,076,000
FEI Development Costs (capitalized)
$20,000 $33,800 $33,800 $20,000 $107,600
Total Addition to Rate Base
$220,000 $371,800 $371,800 $220,000 $1,183,600
There is no addition of AFUDC respecting the purchase price for each LFS as FEI will purchase
the LFS from the developer at approximately the same time as the equipment is put into service.
The total rate base addition for all four loop field systems will be $1,183,600, plus any inflation
adjustments. The capital to be depreciated for all four Loop Field Systems is $968,400, as
shown on the last line item in Table 3 below.
Table 3: Depreciable Rate Base Summary
Rate Base Summary and Depreciation
2011$ Phase 1
LFS Phase 2
LFS Phase 3
LFS Phase 4
LFS Total
Rate Base $220,000 $371,800 $371,800 $220,000 $1,183,600
End of Term Buy-Out $40,000 $67,600 $67,600 $40,000 $215,200
Capital to be Depreciated $ 180,000 $ 304,200 $ 304,200 $ 180,000 $968,400
At the end of the 25 year contractual term with respect to each phase of the Development, if the
Service Agreement is not extended, the Strata Corporation must purchase the LFS from FEI for
a price equal to twenty percent (20%) of the initial purchase price paid by FEI. The line item
“Capital to be Depreciated” in the above table represents the portion of the “Total Capital Cost
added to Rate Base” that will be depreciated over the term of the contract so that the remaining
un-depreciated capital at the end of contract matches the end of term buy-out amount.
For example, for phase 1 the amount of capital to be depreciated over the contract term is
$180,000; this amount is equal to the initial rate base capital ($220,000) less the end of term
buy-out amount ($40,000). This approach ensures that assets will not be stranded at the end of
FORTISBC ENERGY INC. APPLICATION TO PROVIDE THERMAL ENERGY SERVICES FOR TSAWWASSEN SPRINGS DEVELOPMENT
PAGE 13
the contract term. In the event that the Service Agreement is extended, FEI would design a rate
structure to ensure that all capital assets were fully depreciated over the renewal period.
2.5.2 RETURN ON INVESTMENT
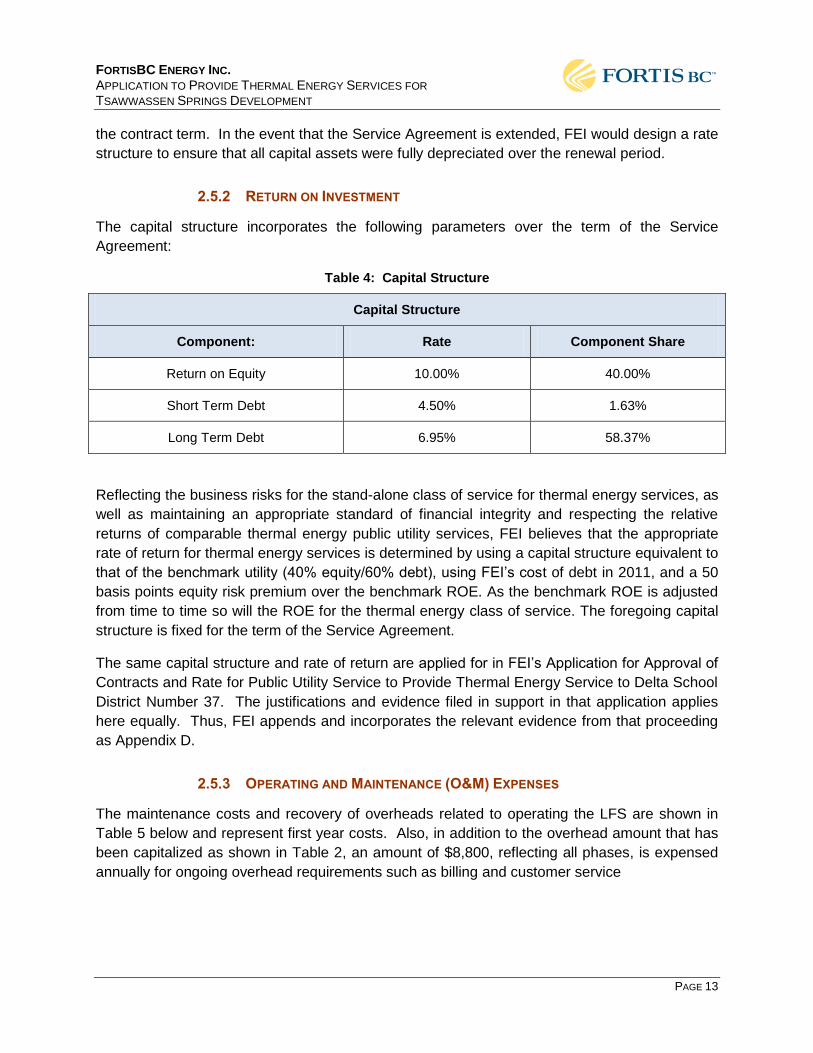
The capital structure incorporates the following parameters over the term of the Service
Agreement:
Table 4: Capital Structure
Capital Structure
Component: Rate Component Share
Return on Equity 10.00% 40.00%
Short Term Debt 4.50% 1.63%
Long Term Debt 6.95% 58.37%
Reflecting the business risks for the stand-alone class of service for thermal energy services, as
well as maintaining an appropriate standard of financial integrity and respecting the relative
returns of comparable thermal energy public utility services, FEI believes that the appropriate
rate of return for thermal energy services is determined by using a capital structure equivalent to
that of the benchmark utility (40% equity/60% debt), using FEI’s cost of debt in 2011, and a 50
basis points equity risk premium over the benchmark ROE. As the benchmark ROE is adjusted
from time to time so will the ROE for the thermal energy class of service. The foregoing capital
structure is fixed for the term of the Service Agreement.
The same capital structure and rate of return are applied for in FEI’s Application for Approval of
Contracts and Rate for Public Utility Service to Provide Thermal Energy Service to Delta School
District Number 37. The justifications and evidence filed in support in that application applies
here equally. Thus, FEI appends and incorporates the relevant evidence from that proceeding
as Appendix D.
2.5.3 OPERATING AND MAINTENANCE (O&M) EXPENSES
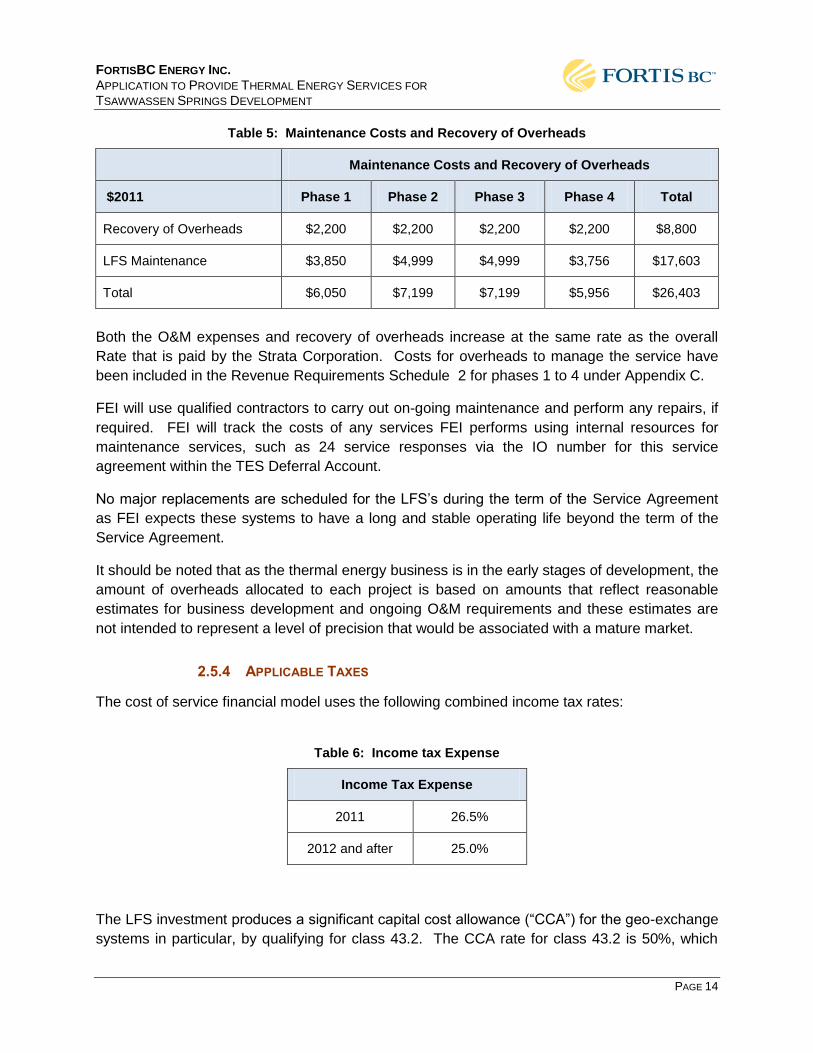
The maintenance costs and recovery of overheads related to operating the LFS are shown in
Table 5 below and represent first year costs. Also, in addition to the overhead amount that has
been capitalized as shown in Table 2, an amount of $8,800, reflecting all phases, is expensed
annually for ongoing overhead requirements such as billing and customer service
FORTISBC ENERGY INC. APPLICATION TO PROVIDE THERMAL ENERGY SERVICES FOR TSAWWASSEN SPRINGS DEVELOPMENT
PAGE 14
Table 5: Maintenance Costs and Recovery of Overheads
Maintenance Costs and Recovery of Overheads
$2011 Phase 1 Phase 2 Phase 3 Phase 4 Total
Recovery of Overheads $2,200 $2,200 $2,200 $2,200 $8,800
LFS Maintenance $3,850 $4,999 $4,999 $3,756 $17,603
Total $6,050 $7,199 $7,199 $5,956 $26,403
Both the O&M expenses and recovery of overheads increase at the same rate as the overall
Rate that is paid by the Strata Corporation. Costs for overheads to manage the service have
been included in the Revenue Requirements Schedule 2 for phases 1 to 4 under Appendix C.
FEI will use qualified contractors to carry out on-going maintenance and perform any repairs, if
required. FEI will track the costs of any services FEI performs using internal resources for
maintenance services, such as 24 service responses via the IO number for this service
agreement within the TES Deferral Account.
No major replacements are scheduled for the LFS’s during the term of the Service Agreement
as FEI expects these systems to have a long and stable operating life beyond the term of the
Service Agreement.
It should be noted that as the thermal energy business is in the early stages of development, the
amount of overheads allocated to each project is based on amounts that reflect reasonable
estimates for business development and ongoing O&M requirements and these estimates are
not intended to represent a level of precision that would be associated with a mature market.
2.5.4 APPLICABLE TAXES
The cost of service financial model uses the following combined income tax rates:
Table 6: Income tax Expense
Income Tax Expense
2011 26.5%
2012 and after 25.0%
The LFS investment produces a significant capital cost allowance (“CCA”) for the geo-exchange
systems in particular, by qualifying for class 43.2. The CCA rate for class 43.2 is 50%, which

FORTISBC ENERGY INC. APPLICATION TO PROVIDE THERMAL ENERGY SERVICES FOR TSAWWASSEN SPRINGS DEVELOPMENT
PAGE 15
produces a significant tax benefit in the early years of the project. Income tax costs have been
included in the Revenue Requirements Schedule 2 (phases 1-4) under Appendix C.
There is currently no property tax charge that FEI must pay related to the ownership and
operation of LFS and FEI does not expect property taxes to be levied on the LFS. Accordingly,
FEI has made no provision for the payment of property taxes.
FORTISBC ENERGY INC. APPLICATION TO PROVIDE THERMAL ENERGY SERVICES FOR TSAWWASSEN SPRINGS DEVELOPMENT
PAGE 16
3 CONCLUSION
The developer of the Development has determined to install a GSHP System to meet the
majority of the energy needs at the Development. FEI has reached an agreement to own,
operate, and maintain the LFS of the GSHP System. FEI is seeking acceptance of the capital
cost for $1.184 million, which includes the purchase prices of the four loop field systems and the
amount of capitalized development costs, before any inflationary adjustments.
FEI is also seeking approval of the Rates and rate design applicable to the Development. This
Rate will recover the LFS cost of service, including an appropriate amount for ongoing overhead
expenses, over the term of the Service Agreement.
FEI respectfully requests that the Commission grant the orders sought in this Application. A
draft order is attached as Appendix E.
Appendix A
OPERATING & MAINTENENACE AGREEMENT (SERVICE AGREEMENT)
FILED CONFIDENTIALLY
Appendix B
LOOP FIELD SYSTEM PURCHASE AND SALE AGREEMENT (PURCHASE AGREEMENT)
FILED CONFIDENTIALLY

Appendix C
FINANCIAL SCHEDULES

Appendix C. Financial Model
Page 1
Appendix C List of Schedules Phase 1 - Start Sept 1, 2011 Schedule 1 (Phase 1) - Rate Design & Thermal Energy Services Deferral Sub Account Schedule 2 (Phase 1) - Revenue Requirement Schedule 3 (Phase 1) - Rate Base Schedule 4 (Phase 1) - Income Tax Expense Schedule 5 (Phase 1) - Discounted Cash Flow Analysis Phase 2 – Start Sept 1, 2013 Schedule 1 (Phase 2) - Rate Design & Thermal Energy Services Deferral Sub Account Schedule 2 (Phase 2) - Revenue Requirement Schedule 3 (Phase 2) - Rate Base Schedule 4 (Phase 2) - Income Tax Expense Schedule 5 (Phase 2) - Discounted Cash Flow Analysis Phase 3 – Start Sept 1, 2014 Schedule 1 (Phase 3) - Rate Design & Thermal Energy Services Deferral Sub Account Schedule 2 (Phase 3) - Revenue Requirement Schedule 3 (Phase 3) - Rate Base Schedule 4 (Phase 3) - Income Tax Expense Schedule 5 (Phase 3) - Discounted Cash Flow Analysis Phase 4 – Start Sept 1, 2015 Schedule 1 (Phase 4) - Rate Design & Thermal Energy Services Deferral Sub Account Schedule 2 (Phase 4) - Revenue Requirement Schedule 3 (Phase 4) - Rate Base Schedule 4 (Phase 4) - Income Tax Expense Schedule 5 (Phase 4) - Discounted Cash Flow Analysis

Appendix C. Financial Model
Page 2
Appendix C - Tsawwassen Springs Development Phase 1
Schedule 1 (Phase 1) - Rate Design & Thermal Energy Services Deferral Sub Account Schedule 1 (Phase 1) - Rate Design & Thermal Energy Services Deferral Sub Account
($000's), unless otherwise stated
(2011 - 2023)
Line Particulars Reference 2011 2012 2013 2014 2015 2016 2017 2018 2019 2020 2021 2022 2023
1 Annual Contract Revenue starting Sept 1, 2011121.6 22.0 22.5 22.9 23.4 23.8 24.3 24.8 25.3 25.8 26.3 26.9 27.4
2 Annual Discount Rate (After-Tax WACC) 7.04% 7.10% 7.10% 7.10% 7.10% 7.10% 7.10% 7.10% 7.10% 7.10% 7.10% 7.10% 7.10%
3 Cummulative Discount Factor51.023 1.096 1.174 1.257 1.346 1.442 1.544 1.654 1.771 1.897 2.032 2.176 2.330
4 Annual Contract Revenue based on Calendar Year47.2 21.7 22.2 22.6 23.1 23.5 24.0 24.5 25.0 25.5 26.0 26.5 27.0
5 PV of Annual Contract Revenue Line 4 / Line 3 7.0 19.8 18.9 18.0 17.1 16.3 15.5 14.8 14.1 13.4 12.8 12.2 11.6
6 PV of Total Revenue Collected Sum Line 5 2997
8 Annual Cost of Service3 (Calendar Year) Schedule 2, Line 8 (7.6) 8.5 21.7 28.0 30.9 32.0 32.4 32.2 31.9 31.5 31.0 30.5 30.0
9 PV of Annual Cost of Service Line 8 / Line 3 (7.4) 7.7 18.5 22.3 22.9 22.2 21.0 19.5 18.0 16.6 15.3 14.0 12.9
10 PV of Total Cost of Service Sum Line 9 29911
12 Annual Difference Line 8 - Line 4 (14.8) (13.3) (0.5) 5.4 7.8 8.5 8.3 7.8 6.9 6.0 5.0 4.0 2.9 13
14 Total Annual Revenue Line 4 7.2 21.7 22.2 22.6 23.1 23.5 24.0 24.5 25.0 25.5 26.0 26.5 27.0
15
16 Thermal Energy Services Deferral Sub Account17 Contract Revenue — Cost of Service Line 4 - Line 8 14.8 13.3 0.5 (5.4) (7.8) (8.5) (8.3) (7.8) (6.9) (6.0) (5.0) (4.0) (2.9)
18 Deferred Charge
19 Opening Balance Line 28 previous year - (11.3) (22.2) (24.1) (21.8) (17.4) (12.1) (6.6) (1.2) 4.0 8.9 13.3 17.3
20 Gross Addition - Line 17 (14.8) (13.3) (0.5) 5.4 7.8 8.5 8.3 7.8 6.9 6.0 5.0 4.0 2.9
21 Income Tax Rate 26.5% 25.0% 25.0% 25.0% 25.0% 25.0% 25.0% 25.0% 25.0% 25.0% 25.0% 25.0% 25.0%
22 Tax - Line 20 x Line 21 3.9 3.5 0.1 (1.4) (2.1) (2.3) (2.2) (2.1) (1.8) (1.6) (1.3) (1.1) (0.8)
23 Net Addition Line 20 + Line 22 (10.9) (9.7) (0.4) 3.9 5.7 6.3 6.1 5.7 5.1 4.4 3.7 2.9 2.2
24 AFUDC
25 Equity7 (0.2) (0.6) (0.9) (0.9) (0.8) (0.6) (0.4) (0.2) 0.1 0.2 0.4 0.6 0.7
26 Debt6(0.2) (0.5) (0.7) (0.7) (0.6) (0.4) (0.3) (0.1) 0.0 0.2 0.3 0.5 0.6
27
28 Closing Balance Line 19 + 23 + 26 (11.3) (22.2) (24.1) (21.8) (17.4) (12.1) (6.6) (1.2) 4.0 8.9 13.3 17.3 20.7
29 1 - Contract Revenue based on Phase 1 monthly fee of $1,800 or $21,600 per year; Inflated at 2% / yr beginning Sept 1, 2012
30 3 - Cost of Service = Revenue Requirement
31 4 - Calendar year adjustment of contract revenue, 4 months of current year + 8 months of previous year
32 5 - (1 + Line 2) * previous year discount factor, 2011 discount factor based on 4 months (1+7.04% * 4/12)
33 6 - (Line 19 + Line 23/2) * ((Schedule 3, Line 23 * Line 24) + (Schedule 3, Line 28 * Line 29) * (1 - Line 21))
34 7 - (Line 19 + Line 23/2) * (Schedule 3, Line 18 * Line 19)

Appendix C. Financial Model
Page 3
Appendix C - Tsawwassen Springs Development Phase 1
Schedule 1 (Phase 1) - Rate Design & Thermal Energy Services Deferral Sub Account Schedule 1 (Phase 1) - Rate Design & Thermal Energy Services Deferral Sub Account
($000's), unless otherwise stated
Continued (2024 - 2036)
Line Particulars 2024 2025 2026 2027 2028 2029 2030 2031 2032 2033 2034 2035 2036
1 Annual Contract Revenue starting Sept 1, 20111 27.9 28.5 29.1 29.7 30.2 30.9 31.5 32.1 32.7 33.4 34.1 34.7 0.0
2 Annual Discount Rate (After-Tax WACC) 7.10% 7.10% 7.10% 7.10% 7.10% 7.10% 7.10% 7.10% 7.10% 7.10% 7.10% 7.10% 7.10%
3 Cummulative Discount Factor,5 2.496 2.673 2.863 3.066 3.283 3.516 3.766 4.033 4.320 4.626 4.954 5.306 5.557
4 Annual Contract Revenue based on Calendar Year4 27.6 28.1 28.7 29.3 29.8 30.4 31.1 31.7 32.3 33.0 33.6 34.3 23.2
5 PV of Annual Contract Revenue Line 4 / Line 3 11.0 10.5 10.0 9.5 9.1 8.7 8.2 7.9 7.5 7.1 6.8 6.5 4.2
6 PV of Total Revenue Collected Sum Line 57
8 Annual Cost of Service3 (Calendar Year) Schedule 2, Line 8 29.5 28.9 28.4 27.9 27.4 26.9 26.4 25.9 25.4 24.9 24.4 23.9 20.1
9 PV of Annual Cost of Service Line 8 / Line 3 11.8 10.8 9.9 9.1 8.3 7.6 7.0 6.4 5.9 5.4 4.9 4.5 3.6
10 PV of Total Cost of Service Sum Line 911
12 Annual Difference Line 8 - Line 4 1.9 0.8 (0.3) (1.4) (2.5) (3.6) (4.7) (5.8) (7.0) (8.1) (9.3) (10.4) (3.1) 13
14 Total Annual Revenue Line 4 27.6 28.1 28.7 29.3 29.8 30.4 31.1 31.7 32.3 33.0 33.6 34.3 23.2
15
16 Thermal Energy Services Deferral Sub Account
17 Contract Revenue — Cost of Service Line 4 - Line 8 (1.9) (0.8) 0.3 1.4 2.5 3.6 4.7 5.8 7.0 8.1 9.3 10.4 3.1
18 Deferred Charge
19 Opening Balance Line 28 previous year 20.7 23.6 25.9 27.6 28.5 28.6 27.9 26.3 23.8 20.1 15.4 9.5 2.2
20 Gross Addition - Line 17 1.9 0.8 (0.3) (1.4) (2.5) (3.6) (4.7) (5.8) (7.0) (8.1) (9.3) (10.4) (3.1)
21 Income Tax Rate 25.0% 25.0% 25.0% 25.0% 25.0% 25.0% 25.0% 25.0% 25.0% 25.0% 25.0% 25.0% 25.0%
22 Tax - Line 20 x Line 21 (0.5) (0.2) 0.1 0.4 0.7 0.9 1.2 1.5 1.8 2.1 2.5 2.8 0.8
23 Net Addition Line 20 + Line 22 1.4 0.6 (0.2) (1.0) (1.8) (2.6) (3.5) (4.3) (5.1) (6.0) (6.8) (7.7) (2.3)
24 AFUDC 0.0 0.0 0.0 0.0 0.0 0.0 0.0 0.0 0.0 0.0 0.0 0.0 0.0
25 Equity7 0.9 1.0 1.0 1.1 1.1 1.1 1.0 1.0 0.8 0.7 0.5 0.2 0.0
26 Debt60.7 0.7 0.8 0.8 0.9 0.8 0.8 0.7 0.7 0.5 0.4 0.2 0.0
27
28 Closing Balance Line 19 + 23 + 26 23.6 25.9 27.6 28.5 28.6 27.9 26.3 23.8 20.1 15.4 9.5 2.2 (0.0)
29 1 - Contract Revenue based on Phase 1 monthly fee of $1,800 or $21,600 per year; Inflated at 2% / yr beginning Sept 1, 2012
30 3 - Cost of Service = Revenue Requirement
31 4 - Calendar year adjustment of contract revenue, 4 months of current year + 8 months of previous year
32 5 - (1 + Line 2) * previous year discount factor, 2011 discount factor based on 4 months (1+7.04% * 4/12)
33 6 - (Line 19 + Line 23/2) * ((Schedule 3, Line 23 * Line 24) + (Schedule 3, Line 28 * Line 29) * (1 - Line 21))
34 7 - (Line 19 + Line 23/2) * (Schedule 3, Line 18 * Line 19)

Appendix C. Financial Model
Page 4
Appendix C - Tsawwassen Springs Development Phase 1
Schedule 2 (Phase 1) - Revenue Requirement Schedule 2 (Phase 1) - Revenue Requirement
($000's), unless otherwise stated(2011 - 2023)
Line Particulars Reference 2011 2012 2013 2014 2015 2016 2017 2018 2019 2020 2021 2022 2023
1 Revenue Requirement1
2 Operation and Maintenance 2.0 6.2 6.3 6.4 6.5 6.7 6.8 6.9 7.1 7.2 7.4 7.5 7.7
3 Property Taxes 0.0 0.0 0.0 0.0 0.0 0.0 0.0 0.0 0.0 0.0 0.0 0.0 0.0
4 Depreciation Expense Schedule 3, Line 6 2.4 7.2 7.2 7.2 7.2 7.2 7.2 7.2 7.2 7.2 7.2 7.2 7.2
5 Income Taxes Schedule 4, Line 14 (17.9) (22.3) (8.6) (1.8) 1.5 3.1 3.9 4.2 4.4 4.4 4.3 4.3 4.2
6 Earned Return Schedule 3, Line 36 5.9 17.4 16.8 16.2 15.6 15.0 14.4 13.8 13.3 12.7 12.1 11.5 10.97
8 Annual Revenue Requirement (7.6) 8.5 21.7 28.0 30.9 32.0 32.4 32.2 31.9 31.5 31.0 30.5 30.0
9 1-Revenue Requirement=Cost of Service
Appendix C - Tsawwassen Springs Development Phase 1
Schedule 2 (Phase 1) - Revenue Requirement
($000's), unless otherwise stated
Continued (2024 - 2036)
Line Particulars 2024 2025 2026 2027 2028 2029 2030 2031 2032 2033 2034 2035 2036
1 Revenue Requirement1
2 Operation and Maintenance 7.8 8.0 8.1 8.3 8.5 8.6 8.8 9.0 9.2 9.4 9.5 9.7 6.6
3 Property Taxes 0.0 0.0 0.0 0.0 0.0 0.0 0.0 0.0 0.0 0.0 0.0 0.0 0.0
4 Depreciation Expense Schedule 3, Line 6 7.2 7.2 7.2 7.2 7.2 7.2 7.2 7.2 7.2 7.2 7.2 7.2 7.2
5 Income Taxes Schedule 4, Line 14 4.1 4.0 3.9 3.8 3.7 3.6 3.5 3.4 3.3 3.2 3.1 3.0 2.9
6 Earned Return Schedule 3, Line 36 10.3 9.8 9.2 8.6 8.0 7.4 6.8 6.2 5.7 5.1 4.5 3.9 3.3
7
8 Annual Revenue Requirement 29.5 28.9 28.4 27.9 27.4 26.9 26.4 25.9 25.4 24.9 24.4 23.9 20.1
9 1-Revenue Requirement=Cost of Service

Appendix C. Financial Model
Page 5
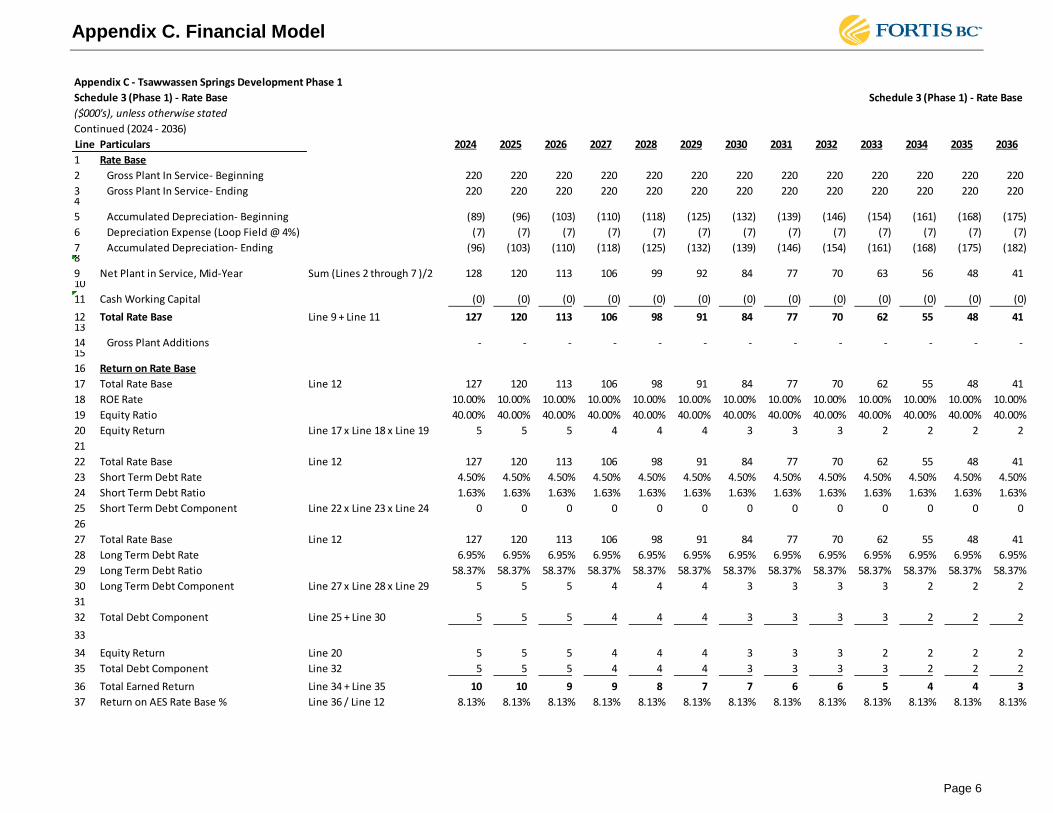
Appendix C - Tsawwassen Springs Development Phase 1
Schedule 3 (Phase 1) - Rate Base Schedule 3 (Phase 1) - Rate Base
($000's), unless otherwise stated
(2011 - 2023)
Line Particulars Reference 2011 2012 2013 2014 2015 2016 2017 2018 2019 2020 2021 2022 2023
1 Rate Base
2 Gross Plant In Service- Beginning - 220 220 220 220 220 220 220 220 220 220 220 220
3 Gross Plant In Service- Ending 220 220 220 220 220 220 220 220 220 220 220 220 220 4
5 Accumulated Depreciation- Beginning - (2) (10) (17) (24) (31) (38) (46) (53) (60) (67) (74) (82)
6 Depreciation Expense (Loop Field @ 4%) (2) (7) (7) (7) (7) (7) (7) (7) (7) (7) (7) (7) (7)
7 Accumulated Depreciation- Ending (2) (10) (17) (24) (31) (38) (46) (53) (60) (67) (74) (82) (89) 8
9 Net Plant in Service, Mid-Year Sum (Lines 2 through 7 )/2 109 214 207 200 192 185 178 171 164 156 149 142 135
10
11 Adjustment to 13-month average (36) - - - - - - - - - - - -
12 Total Rate Base Line 9 + Line 11 72 214 206 199 192 185 178 170 163 156 149 142 134
13
14 Gross Plant Additions 220 - - - - - - - - - - - -
15
16 Return on Rate Base
17 Total Rate Base Line 12 72 214 206 199 192 185 178 170 163 156 149 142 134
18 ROE Rate 10.00% 10.00% 10.00% 10.00% 10.00% 10.00% 10.00% 10.00% 10.00% 10.00% 10.00% 10.00% 10.00%
19 Equity Ratio 40.00% 40.00% 40.00% 40.00% 40.00% 40.00% 40.00% 40.00% 40.00% 40.00% 40.00% 40.00% 40.00%
20 Equity Return Line 17 x Line 18 x Line 19 3 9 8 8 8 7 7 7 7 6 6 6 5
21
22 Total Rate Base Line 12 72 214 206 199 192 185 178 170 163 156 149 142 134
23 Short Term Debt Rate 4.50% 4.50% 4.50% 4.50% 4.50% 4.50% 4.50% 4.50% 4.50% 4.50% 4.50% 4.50% 4.50%
24 Short Term Debt Ratio 1.63% 1.63% 1.63% 1.63% 1.63% 1.63% 1.63% 1.63% 1.63% 1.63% 1.63% 1.63% 1.63%
25 Short Term Debt Component Line 22 x Line 23 x Line 24 0 0 0 0 0 0 0 0 0 0 0 0 0
26
27 Total Rate Base Line 12 72 214 206 199 192 185 178 170 163 156 149 142 134
28 Long Term Debt Rate 6.95% 6.95% 6.95% 6.95% 6.95% 6.95% 6.95% 6.95% 6.95% 6.95% 6.95% 6.95% 6.95%
29 Long Term Debt Ratio 58.37% 58.37% 58.37% 58.37% 58.37% 58.37% 58.37% 58.37% 58.37% 58.37% 58.37% 58.37% 58.37%
30 Long Term Debt Component Line 27 x Line 28 x Line 29 3 9 8 8 8 7 7 7 7 6 6 6 5
31
32 Total Debt Component Line 25 + Line 30 3 9 9 8 8 8 7 7 7 6 6 6 6 33
34 Equity Return Line 20 3 9 8 8 8 7 7 7 7 6 6 6 5
35 Total Debt Component Line 32 3 9 9 8 8 8 7 7 7 6 6 6 6
36 Total Earned Return Line 34 + Line 35 6 17 17 16 16 15 14 14 13 13 12 12 11
37 Return on AES Rate Base % Line 36 / Line 12 8.13% 8.13% 8.13% 8.13% 8.13% 8.13% 8.13% 8.13% 8.13% 8.13% 8.13% 8.13% 8.13%
Appendix C. Financial Model
Page 6
Appendix C - Tsawwassen Springs Development Phase 1
Schedule 3 (Phase 1) - Rate Base Schedule 3 (Phase 1) - Rate Base
($000's), unless otherwise stated
Continued (2024 - 2036)
Line Particulars 2024 2025 2026 2027 2028 2029 2030 2031 2032 2033 2034 2035 2036
1 Rate Base
2 Gross Plant In Service- Beginning 220 220 220 220 220 220 220 220 220 220 220 220 220
3 Gross Plant In Service- Ending 220 220 220 220 220 220 220 220 220 220 220 220 220 4
5 Accumulated Depreciation- Beginning (89) (96) (103) (110) (118) (125) (132) (139) (146) (154) (161) (168) (175)
6 Depreciation Expense (Loop Field @ 4%) (7) (7) (7) (7) (7) (7) (7) (7) (7) (7) (7) (7) (7)
7 Accumulated Depreciation- Ending (96) (103) (110) (118) (125) (132) (139) (146) (154) (161) (168) (175) (182) 8
9 Net Plant in Service, Mid-Year Sum (Lines 2 through 7 )/2 128 120 113 106 99 92 84 77 70 63 56 48 41 10
11 Cash Working Capital (0) (0) (0) (0) (0) (0) (0) (0) (0) (0) (0) (0) (0)
12 Total Rate Base Line 9 + Line 11 127 120 113 106 98 91 84 77 70 62 55 48 41 13
14 Gross Plant Additions - - - - - - - - - - - - - 15
16 Return on Rate Base
17 Total Rate Base Line 12 127 120 113 106 98 91 84 77 70 62 55 48 41
18 ROE Rate 10.00% 10.00% 10.00% 10.00% 10.00% 10.00% 10.00% 10.00% 10.00% 10.00% 10.00% 10.00% 10.00%
19 Equity Ratio 40.00% 40.00% 40.00% 40.00% 40.00% 40.00% 40.00% 40.00% 40.00% 40.00% 40.00% 40.00% 40.00%
20 Equity Return Line 17 x Line 18 x Line 19 5 5 5 4 4 4 3 3 3 2 2 2 2
21
22 Total Rate Base Line 12 127 120 113 106 98 91 84 77 70 62 55 48 41
23 Short Term Debt Rate 4.50% 4.50% 4.50% 4.50% 4.50% 4.50% 4.50% 4.50% 4.50% 4.50% 4.50% 4.50% 4.50%
24 Short Term Debt Ratio 1.63% 1.63% 1.63% 1.63% 1.63% 1.63% 1.63% 1.63% 1.63% 1.63% 1.63% 1.63% 1.63%
25 Short Term Debt Component Line 22 x Line 23 x Line 24 0 0 0 0 0 0 0 0 0 0 0 0 0
26
27 Total Rate Base Line 12 127 120 113 106 98 91 84 77 70 62 55 48 41
28 Long Term Debt Rate 6.95% 6.95% 6.95% 6.95% 6.95% 6.95% 6.95% 6.95% 6.95% 6.95% 6.95% 6.95% 6.95%
29 Long Term Debt Ratio 58.37% 58.37% 58.37% 58.37% 58.37% 58.37% 58.37% 58.37% 58.37% 58.37% 58.37% 58.37% 58.37%
30 Long Term Debt Component Line 27 x Line 28 x Line 29 5 5 5 4 4 4 3 3 3 3 2 2 2
31
32 Total Debt Component Line 25 + Line 30 5 5 5 4 4 4 3 3 3 3 2 2 2
33
34 Equity Return Line 20 5 5 5 4 4 4 3 3 3 2 2 2 2
35 Total Debt Component Line 32 5 5 5 4 4 4 3 3 3 3 2 2 2
36 Total Earned Return Line 34 + Line 35 10 10 9 9 8 7 7 6 6 5 4 4 3
37 Return on AES Rate Base % Line 36 / Line 12 8.13% 8.13% 8.13% 8.13% 8.13% 8.13% 8.13% 8.13% 8.13% 8.13% 8.13% 8.13% 8.13%

Appendix C. Financial Model
Page 7
Appendix C - Tsawwassen Springs Development Phase 1
Schedule 4 (Phase 1) - Income Tax Expense Schedule 4 (Phase 1) - Income Tax Expense
($000's), unless otherwise stated
(2011 - 2023)
Line Particulars Reference 2011 2012 2013 2014 2015 2016 2017 2018 2019 2020 2021 2022 2023
1 Income Tax Expense
2
3 Earned Return Schedule 3, Line 36 5.9 17.4 16.8 16.2 15.6 15.0 14.4 13.8 13.3 12.7 12.1 11.5 10.9
4 Deduct: Interest on debt Schedule 3, Line 32 (3.0) (8.8) (8.5) (8.2) (7.9) (7.6) (7.3) (7.0) (6.7) (6.4) (6.1) (5.8) (5.5)
5 Add: Depreciation Expense Schedule 3, Line 6 2.4 7.2 7.2 7.2 7.2 7.2 7.2 7.2 7.2 7.2 7.2 7.2 7.2
6 Deduct: Capital Cost Allowance (55.0) (82.5) (41.3) (20.6) (10.3) (5.2) (2.6) (1.3) (0.6) (0.3) (0.2) (0.1) (0.0)
7 Taxable Income After Tax Sum of Lines 3 through 6 (49.7) (66.8) (25.8) (5.5) 4.6 9.4 11.7 12.7 13.1 13.1 13.0 12.8 12.5
8
9 Income Tax Rate 26.5% 25.0% 25.0% 25.0% 25.0% 25.0% 25.0% 25.0% 25.0% 25.0% 25.0% 25.0% 25.0%
10 1 - Current Income Tax Rate 1 - Line 9 73.5% 75.0% 75.0% 75.0% 75.0% 75.0% 75.0% 75.0% 75.0% 75.0% 75.0% 75.0% 75.0%
11
12 Taxable Income Line 7 / Line 10 (67.6) (89.0) (34.4) (7.3) 6.1 12.6 15.6 17.0 17.4 17.5 17.3 17.0 16.7
13
14 Total Income Tax Expense Line 12 x Line 9 (17.9) (22.3) (8.6) (1.8) 1.5 3.1 3.9 4.2 4.4 4.4 4.3 4.3 4.2
Appendix C - Tsawwassen Springs Development Phase 1
Schedule 4 (Phase 1) - Income Tax Expense Schedule 4 (Phase 1) - Income Tax Expense
($000's), unless otherwise stated
Continued (2024 - 2036)
Line Particulars 2024 2025 2026 2027 2028 2029 2030 2031 2032 2033 2034 2035 2036
1 Income Tax Expense
2
3 Earned Return Schedule 3, Line 36 10.3 9.8 9.2 8.6 8.0 7.4 6.8 6.2 5.7 5.1 4.5 3.9 3.3
4 Deduct: Interest on debt Schedule 3, Line 32 (5.3) (5.0) (4.7) (4.4) (4.1) (3.8) (3.5) (3.2) (2.9) (2.6) (2.3) (2.0) (1.7)
5 Add: Depreciation Expense Schedule 3, Line 6 7.2 7.2 7.2 7.2 7.2 7.2 7.2 7.2 7.2 7.2 7.2 7.2 7.2
6 Deduct: Capital Cost Allowance (0.0) (0.0) (0.0) (0.0) (0.0) (0.0) (0.0) (0.0) (0.0) (0.0) (0.0) (0.0) (0.0)
7 Taxable Income After Tax Sum of Lines 3 through 6 12.3 12.0 11.7 11.4 11.1 10.8 10.6 10.3 10.0 9.7 9.4 9.1 8.8
8
9 Income Tax Rate 0.3 0.3 0.3 0.3 0.3 0.3 0.3 0.3 0.3 0.3 0.3 0.3 0.3
10 1 - Current Income Tax Rate 1 - Line 9 0.8 0.8 0.8 0.8 0.8 0.8 0.8 0.8 0.8 0.8 0.8 0.8 0.8
11
12 Taxable Income Line 7 / Line 10 16.4 16.0 15.6 15.2 14.8 14.5 14.1 13.7 13.3 12.9 12.5 12.2 11.8
13
14 Total Income Tax Expense Line 12 x Line 9 4.1 4.0 3.9 3.8 3.7 3.6 3.5 3.4 3.3 3.2 3.1 3.0 2.9

Appendix C. Financial Model
Page 8
Appendix C - Tsawwassen Springs Development Phase 1
Schedule 5 (Phase 1) Discounted Cash Flow Analysis Schedule 5 (Phase 1) Discounted Cash Flow Analysis
($000's), unless otherwise stated
(2011 - 2023)
Line Particulars Reference 2011 2012 2013 2014 2015 2016 2017 2018 2019 2020 2021 2022 2023
1 Cash Flow
2 Add: Revenue Schedule 1, Line 14 7.2 21.7 22.2 22.6 23.1 23.5 24.0 24.5 25.0 25.5 26.0 26.5 27.0
3 Less: O&M Schedule 2, (Line 2) (2.0) (6.2) (6.3) (6.4) (6.5) (6.7) (6.8) (6.9) (7.1) (7.2) (7.4) (7.5) (7.7)
4 Revenue - Cash Expenses (EBITDA1) Line 2 + Line 3 5.2 15.6 15.9 16.2 16.5 16.9 17.2 17.5 17.9 18.2 18.6 19.0 19.4
5 Capital Expenditures2Schedule 3, Line 14 (220.0) - - - - - - - - - - - -
6 Pre-Tax Cash Flow Line 4 + Line 5 (214.8) 15.6 15.9 16.2 16.5 16.9 17.2 17.5 17.9 18.2 18.6 19.0 19.4
7 Income Tax Expense (before CCA) (Schedule 4, - Line 9) x Line 4 (1.4) (3.9) (4.0) (4.1) (4.1) (4.2) (4.3) (4.4) (4.5) (4.6) (4.7) (4.7) (4.8)
8 CCA Tax Shield Schedule 4 (Line 6 x Line 9) 14.6 20.6 10.3 5.2 2.6 1.3 0.6 0.3 0.2 0.1 0.0 0.0 0.0
9 Terminal Value of CCA Tax Shield - - - - - - - - - - - - -
10 Terminal Value - - - - - - - - - - - - -
11
12 Free Cash Flow Line 6 + 7 + 8 + 9 + 10 (201.6) 32.3 22.2 17.3 15.0 13.9 13.5 13.5 13.6 13.8 14.0 14.3 14.5
13
14 After Tax WACC % 7.04% 7.10% 7.10% 7.10% 7.10% 7.10% 7.10% 7.10% 7.10% 7.10% 7.10% 7.10% 7.10%
15 Present Value of Free Cash Flow 3 Line 12 / (Schedule 1, Line 3) (202.0) 29.5 18.9 13.8 11.1 9.7 8.8 8.1 7.7 7.3 6.9 6.6 6.2
16 Total Present Value of Free Cash Flow Sum of Line 15 (2.9)
17
18 1 - Earnings Before Interest, Taxes, Depreciation & Amortization (EBITDA)
19 2 - Net of CIAC and removal costs (if applicable) and excludes capitalized overhead
20 3 - 2011 present value calculates capital expenditure to occur at time zero Sept 1
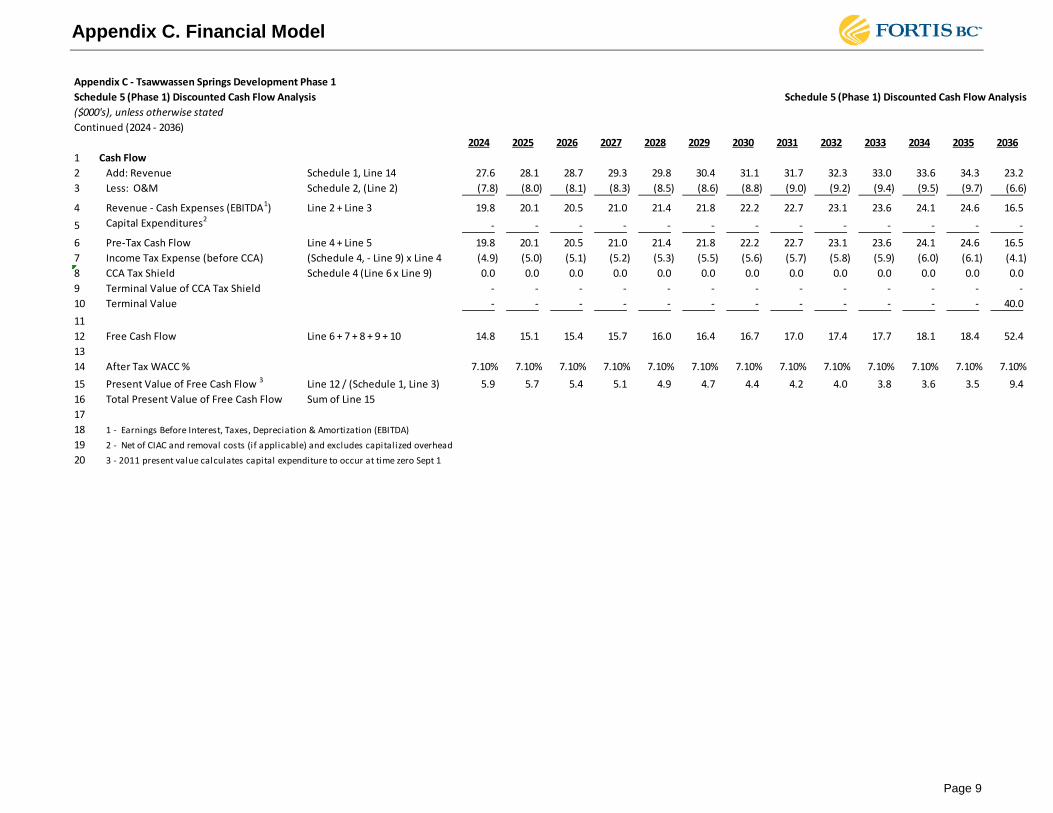
Appendix C. Financial Model
Page 9
Appendix C - Tsawwassen Springs Development Phase 1
Schedule 5 (Phase 1) Discounted Cash Flow Analysis Schedule 5 (Phase 1) Discounted Cash Flow Analysis
($000's), unless otherwise stated
Continued (2024 - 2036)
2024 2025 2026 2027 2028 2029 2030 2031 2032 2033 2034 2035 2036
1 Cash Flow
2 Add: Revenue Schedule 1, Line 14 27.6 28.1 28.7 29.3 29.8 30.4 31.1 31.7 32.3 33.0 33.6 34.3 23.2
3 Less: O&M Schedule 2, (Line 2) (7.8) (8.0) (8.1) (8.3) (8.5) (8.6) (8.8) (9.0) (9.2) (9.4) (9.5) (9.7) (6.6)
4 Revenue - Cash Expenses (EBITDA1) Line 2 + Line 3 19.8 20.1 20.5 21.0 21.4 21.8 22.2 22.7 23.1 23.6 24.1 24.6 16.5
5 Capital Expenditures2- - - - - - - - - - - - -
6 Pre-Tax Cash Flow Line 4 + Line 5 19.8 20.1 20.5 21.0 21.4 21.8 22.2 22.7 23.1 23.6 24.1 24.6 16.5
7 Income Tax Expense (before CCA) (Schedule 4, - Line 9) x Line 4 (4.9) (5.0) (5.1) (5.2) (5.3) (5.5) (5.6) (5.7) (5.8) (5.9) (6.0) (6.1) (4.1)
8 CCA Tax Shield Schedule 4 (Line 6 x Line 9) 0.0 0.0 0.0 0.0 0.0 0.0 0.0 0.0 0.0 0.0 0.0 0.0 0.0
9 Terminal Value of CCA Tax Shield - - - - - - - - - - - - -
10 Terminal Value - - - - - - - - - - - - 40.0
11
12 Free Cash Flow Line 6 + 7 + 8 + 9 + 10 14.8 15.1 15.4 15.7 16.0 16.4 16.7 17.0 17.4 17.7 18.1 18.4 52.4
13
14 After Tax WACC % 7.10% 7.10% 7.10% 7.10% 7.10% 7.10% 7.10% 7.10% 7.10% 7.10% 7.10% 7.10% 7.10%
15 Present Value of Free Cash Flow 3 Line 12 / (Schedule 1, Line 3) 5.9 5.7 5.4 5.1 4.9 4.7 4.4 4.2 4.0 3.8 3.6 3.5 9.4
16 Total Present Value of Free Cash Flow Sum of Line 15
17
18 1 - Earnings Before Interest, Taxes, Depreciation & Amortization (EBITDA)
19 2 - Net of CIAC and removal costs (if applicable) and excludes capitalized overhead
20 3 - 2011 present value calculates capital expenditure to occur at time zero Sept 1

Appendix C. Financial Model
Page 10
Appendix C - Tsawwassen Springs Development Phase 2
Schedule 1 (Phase 2) - Rate Design & Thermal Energy Services Deferral Sub Account Schedule 1 (Phase 2) - Rate Design & Thermal Energy Services Deferral Sub Account
($000's), unless otherwise stated
(2013 - 2025)
Line Particulars Reference 2013 2014 2015 2016 2017 2018 2019 2020 2021 2022 2023 2024 2025 2026
1 Annual Contract Revenue starting Sept 1, 2013135.0 35.7 36.4 37.1 37.8 38.6 39.4 40.2 41.0 41.8 42.6 43.5 44.3 45.2
2 Annual Discount Rate (After-Tax WACC) 7.10% 7.10% 7.10% 7.10% 7.10% 7.10% 7.10% 7.10% 7.10% 7.10% 7.10% 7.10% 7.10% 7.10%
3 Cummulative Discount Factor51.024 1.096 1.174 1.257 1.347 1.442 1.545 1.654 1.772 1.897 2.032 2.176 2.331 2.496
4 Annual Contract Revenue based on Calendar Year411.7 35.2 35.9 36.6 37.3 38.1 38.9 39.6 40.4 41.2 42.1 42.9 43.8 44.6
5 PV of Annual Contract Revenue Line 4 / Line 3 11.4 32.1 30.6 29.1 27.7 26.4 25.2 24.0 22.8 21.7 20.7 19.7 18.8 17.9
6 PV of Total Revenue Collected Sum Line 5 483
7
8 Annual Cost of Service3 (Calendar Year) Schedule 2, Line 8 (12.1) 11.7 34.8 45.9 50.9 52.9 53.3 53.1 52.4 51.6 50.7 49.7 48.7 47.7
9 PV of Annual Cost of Service Line 8 / Line 3 (11.8) 10.7 29.7 36.5 37.8 36.7 34.5 32.1 29.6 27.2 24.9 22.8 20.9 19.1
10 PV of Total Cost of Service Sum Line 9 483
11
12 Annual Difference Line 8 - Line 4 (23.7) (23.5) (1.1) 9.3 13.5 14.8 14.5 13.4 12.0 10.4 8.6 6.8 5.0 3.1
13
14 Total Annual Revenue Line 4 11.7 35.2 35.9 36.6 37.3 38.1 38.9 39.6 40.4 41.2 42.1 42.9 43.8 44.6 15
16 Thermal Energy Services Deferral Sub Account17 Contract Revenue — Cost of Service Line 4 - Line 8 23.7 23.5 1.1 (9.3) (13.5) (14.8) (14.5) (13.4) (12.0) (10.4) (8.6) (6.8) (5.0) (3.1)
18 Deferred Charge
19 Opening Balance Line 28 previous year - (18.4) (38.0) (41.5) (37.2) (29.4) (20.0) (10.1) (0.4) 8.9 17.5 25.5 32.6 38.7
20 Gross Addition - Line 17 (23.7) (23.5) (1.1) 9.3 13.5 14.8 14.5 13.4 12.0 10.4 8.6 6.8 5.0 3.1
21 Income Tax Rate 25.0% 25.0% 25.0% 25.0% 25.0% 25.0% 25.0% 25.0% 25.0% 25.0% 25.0% 25.0% 25.0% 25.0%
22 Tax - Line 20 x Line 21 5.9 5.9 0.3 (2.3) (3.4) (3.7) (3.6) (3.4) (3.0) (2.6) (2.2) (1.7) (1.2) (0.8)
23 Net Addition Line 20 + Line 22 (17.8) (17.6) (0.8) 6.9 10.2 11.1 10.9 10.1 9.0 7.8 6.5 5.1 3.7 2.3
24 AFUDC
25 Equity7 (0.4) (1.1) (1.5) (1.5) (1.3) (1.0) (0.6) (0.2) 0.2 0.5 0.8 1.1 1.4 1.6
26 Debt6(0.3) (0.8) (1.2) (1.2) (1.0) (0.7) (0.5) (0.2) 0.1 0.4 0.6 0.9 1.1 1.2
27
28 Closing Balance Line 19 + 23 + 26 (18.4) (38.0) (41.5) (37.2) (29.4) (20.0) (10.1) (0.4) 8.9 17.5 25.5 32.6 38.7 43.9
29 1 - Contract Revenue based on Phase 2 monthly fee of $2,800 or $33,600 per year; Inflated at 2% / yr beginning Sept 1, 2012
30 3 - Cost of Service = Revenue Requirement
31 4 - Calendar year adjustment of contract revenue, 4 months of current year + 8 months of previous year
32 5 - (1 + Line 2) * previous year discount factor, 2013 discount factor based on 4 months (1+7.10% * 4/12)
33 6 - (Line 19 + Line 23/2) * ((Schedule 3, Line 23 * Line 24) + (Schedule 3, Line 28 * Line 29) * (1 - Line 21))
34 7 - (Line 19 + Line 23/2) * (Schedule 3, Line 18 * Line 19)
Appendix C. Financial Model
Page 11
Appendix C - Tsawwassen Springs Development Phase 2
Schedule 1 (Phase 2) - Rate Design & Thermal Energy Services Deferral Sub Account Schedule 1 (Phase 2) - Rate Design & Thermal Energy Services Deferral Sub Account
($000's), unless otherwise stated
Continued (2026 - 2038)
Line Particulars 2026 2027 2028 2029 2030 2031 2032 2033 2034 2035 2036 2037 2038
1 Annual Contract Revenue starting Sept 1, 20131 45.2 46.1 47.0 48.0 48.9 49.9 50.9 51.9 53.0 54.0 55.1 56.2 0.0
2 Annual Discount Rate (After-Tax WACC) 7.10% 7.10% 7.10% 7.10% 7.10% 7.10% 7.10% 7.10% 7.10% 7.10% 7.10% 7.10% 7.10%
3 Cummulative Discount Factor5 2.496 2.673 2.863 3.066 3.284 3.517 3.767 4.034 4.320 4.627 4.955 5.307 5.558
4 Annual Contract Revenue based on Calendar Year4 44.6 45.5 46.4 47.4 48.3 49.3 50.3 51.3 52.3 53.3 54.4 55.5 37.5
5 PV of Annual Contract Revenue Line 4 / Line 3 17.9 17.0 16.2 15.4 14.7 14.0 13.3 12.7 12.1 11.5 11.0 10.5 6.7
6 PV of Total Revenue Collected Sum Line 5
7
8 Annual Cost of Service3 (Calendar Year) Schedule 2, Line 8 47.7 46.7 45.7 44.7 43.7 42.7 41.8 40.8 39.8 38.8 37.9 36.9 31.9
9 PV of Annual Cost of Service Line 8 / Line 3 19.1 17.5 16.0 14.6 13.3 12.2 11.1 10.1 9.2 8.4 7.6 7.0 5.7
10 PV of Total Cost of Service Sum Line 9
11
12 Annual Difference Line 8 - Line 4 3.1 1.2 (0.7) (2.6) (4.6) (6.5) (8.5) (10.5) (12.5) (14.5) (16.5) (18.6) (5.6)
13
14 Total Annual Revenue Line 4 44.6 45.5 46.4 47.4 48.3 49.3 50.3 51.3 52.3 53.3 54.4 55.5 37.5
15
16 Thermal Energy Services Deferral Sub Account
17 Contract Revenue — Cost of Service Line 4 - Line 8 (3.1) (1.2) 0.7 2.6 4.6 6.5 8.5 10.5 12.5 14.5 16.5 18.6 5.6
18 Deferred Charge
19 Opening Balance Line 28 previous year 38.7 43.9 47.9 50.7 52.3 52.5 51.1 48.1 43.4 36.8 28.1 17.3 4.1
20 Gross Addition - Line 17 3.1 1.2 (0.7) (2.6) (4.6) (6.5) (8.5) (10.5) (12.5) (14.5) (16.5) (18.6) (5.6)
21 Income Tax Rate 25.0% 25.0% 25.0% 25.0% 25.0% 25.0% 25.0% 25.0% 25.0% 25.0% 25.0% 25.0% 25.0%
22 Tax - Line 20 x Line 21 (0.8) (0.3) 0.2 0.7 1.1 1.6 2.1 2.6 3.1 3.6 4.1 4.6 1.4
23 Net Addition Line 20 + Line 22 2.3 0.9 (0.5) (2.0) (3.4) (4.9) (6.4) (7.9) (9.4) (10.9) (12.4) (13.9) (4.2)
24 AFUDC 0.0 0.0 0.0 0.0 0.0 0.0 0.0 0.0 0.0 0.0 0.0 0.0 0.0
25 Equity7 1.6 1.8 1.9 2.0 2.0 2.0 1.9 1.8 1.5 1.3 0.9 0.4 0.1
26 Debt61.2 1.4 1.5 1.5 1.6 1.5 1.5 1.4 1.2 1.0 0.7 0.3 0.1
27
28 Closing Balance Line 19 + 23 + 26 43.9 47.9 50.7 52.3 52.5 51.1 48.1 43.4 36.8 28.1 17.3 4.1 (0.0)
29 1 - Contract Revenue based on Phase 2 monthly fee of $2,800 or $33,600 per year; Inflated at 2% / yr beginning Sept 1, 2012
30 3 - Cost of Service = Revenue Requirement
31 4 - Calendar year adjustment of contract revenue, 4 months of current year + 8 months of previous year
32 5 - (1 + Line 2) * previous year discount factor, 2013 discount factor based on 4 months (1+7.10% * 4/12)
33 6 - (Line 19 + Line 23/2) * ((Schedule 3, Line 23 * Line 24) + (Schedule 3, Line 28 * Line 29) * (1 - Line 21))
34 7 - (Line 19 + Line 23/2) * (Schedule 3, Line 18 * Line 19)

Appendix C. Financial Model
Page 12
Appendix C - Tsawwassen Springs Development Phase 2
Schedule 2 (Phase 2) - Revenue Requirement Schedule 2 (Phase 2) - Revenue Requirement
($000's), unless otherwise stated(2013 - 2025)
Line Particulars Reference 2013 2014 2015 2016 2017 2018 2019 2020 2021 2022 2023 2024 2025
1 Revenue Requirement1
2 Operation and Maintenance 2.5 7.6 7.8 7.9 8.1 8.3 8.4 8.6 8.8 9.0 9.1 9.3 9.5
3 Property Taxes 0.0 0.0 0.0 0.0 0.0 0.0 0.0 0.0 0.0 0.0 0.0 0.0 0.0
4 Depreciation Expense Schedule 3, Line 6 4.2 12.7 12.7 12.7 12.7 12.7 12.7 12.7 12.7 12.7 12.7 12.7 12.7
5 Income Taxes Schedule 4, Line 14 (29.1) (39.1) (15.1) (3.2) 2.7 5.5 6.9 7.5 7.7 7.7 7.6 7.5 7.3
6 Earned Return Schedule 3, Line 36 10.3 30.5 29.5 28.5 27.4 26.4 25.4 24.4 23.3 22.3 21.3 20.2 19.27
8 Annual Revenue Requirement (12.1) 11.7 34.8 45.9 50.9 52.9 53.3 53.1 52.4 51.6 50.7 49.7 48.7
9 1-Revenue Requirement=Cost of Service
Appendix C - Tsawwassen Springs Development Phase 2
Schedule 2 (Phase 2) - Revenue Requirement
($000's), unless otherwise stated
Continued (2026 - 2038)
Line Particulars 2026 2027 2028 2029 2030 2031 2032 2033 2034 2035 2036 2037 2038
1 Revenue Requirement1
2 Operation and Maintenance 9.7 9.9 10.1 10.3 10.5 10.7 10.9 11.1 11.4 11.6 11.8 12.0 8.2
3 Property Taxes 0.0 0.0 0.0 0.0 0.0 0.0 0.0 0.0 0.0 0.0 0.0 0.0 0.0
4 Depreciation Expense Schedule 3, Line 6 12.7 12.7 12.7 12.7 12.7 12.7 12.7 12.7 12.7 12.7 12.7 12.7 12.7
5 Income Taxes Schedule 4, Line 14 7.2 7.0 6.9 6.7 6.5 6.4 6.2 6.0 5.9 5.7 5.5 5.3 5.2
6 Earned Return Schedule 3, Line 36 18.2 17.1 16.1 15.1 14.1 13.0 12.0 11.0 9.9 8.9 7.9 6.9 5.8
7
8 Annual Revenue Requirement 47.7 46.7 45.7 44.7 43.7 42.7 41.8 40.8 39.8 38.8 37.9 36.9 31.9
9 1-Revenue Requirement=Cost of Service

Appendix C. Financial Model
Page 13
Appendix C - Tsawwassen Springs Development Phase 2
Schedule 3 (Phase 2) - Rate Base Schedule 3 (Phase 2) - Rate Base
($000's), unless otherwise stated
(2013 - 2025)
Line Particulars Reference 2013 2014 2015 2016 2017 2018 2019 2020 2021 2022 2023 2024 2025
1 Rate Base
2 Gross Plant In Service- Beginning - 387 387 387 387 387 387 387 387 387 387 387 387
3 Gross Plant In Service- Ending 387 387 387 387 387 387 387 387 387 387 387 387 387 4
5 Accumulated Depreciation- Beginning - (4) (17) (30) (42) (55) (68) (80) (93) (106) (118) (131) (143)
6 Depreciation Expense (Loop Field @ 4%) (4) (13) (13) (13) (13) (13) (13) (13) (13) (13) (13) (13) (13)
7 Accumulated Depreciation- Ending (4) (17) (30) (42) (55) (68) (80) (93) (106) (118) (131) (143) (156) 8
9 Net Plant in Service, Mid-Year Sum (Lines 2 through 7 )/2 191 376 364 351 338 326 313 300 288 275 262 250 237
10
11 Adjustment to 13-month average (63) - - - - - - - - - - - -
12 Total Rate Base Line 9 + Line 11 127 375 363 350 338 325 312 300 287 274 262 249 236
13
14 Gross Plant Additions 387 - - - - - - - - - - - -
15
16 Return on Rate Base
17 Total Rate Base Line 12 127 375 363 350 338 325 312 300 287 274 262 249 236
18 ROE Rate 10.00% 10.00% 10.00% 10.00% 10.00% 10.00% 10.00% 10.00% 10.00% 10.00% 10.00% 10.00% 10.00%
19 Equity Ratio 40.00% 40.00% 40.00% 40.00% 40.00% 40.00% 40.00% 40.00% 40.00% 40.00% 40.00% 40.00% 40.00%
20 Equity Return Line 17 x Line 18 x Line 19 5 15 15 14 14 13 12 12 11 11 10 10 9
21
22 Total Rate Base Line 12 127 375 363 350 338 325 312 300 287 274 262 249 236
23 Short Term Debt Rate 4.50% 4.50% 4.50% 4.50% 4.50% 4.50% 4.50% 4.50% 4.50% 4.50% 4.50% 4.50% 4.50%
24 Short Term Debt Ratio 1.63% 1.63% 1.63% 1.63% 1.63% 1.63% 1.63% 1.63% 1.63% 1.63% 1.63% 1.63% 1.63%
25 Short Term Debt Component Line 22 x Line 23 x Line 24 0 0 0 0 0 0 0 0 0 0 0 0 0
26
27 Total Rate Base Line 12 127 375 363 350 338 325 312 300 287 274 262 249 236
28 Long Term Debt Rate 6.95% 6.95% 6.95% 6.95% 6.95% 6.95% 6.95% 6.95% 6.95% 6.95% 6.95% 6.95% 6.95%
29 Long Term Debt Ratio 58.37% 58.37% 58.37% 58.37% 58.37% 58.37% 58.37% 58.37% 58.37% 58.37% 58.37% 58.37% 58.37%
30 Long Term Debt Component Line 27 x Line 28 x Line 29 5 15 15 14 14 13 13 12 12 11 11 10 10
31
32 Total Debt Component Line 25 + Line 30 5 16 15 14 14 13 13 12 12 11 11 10 10 33
34 Equity Return Line 20 5 15 15 14 14 13 12 12 11 11 10 10 9
35 Total Debt Component Line 32 5 16 15 14 14 13 13 12 12 11 11 10 10
36 Total Earned Return Line 34 + Line 35 10 31 29 28 27 26 25 24 23 22 21 20 19
37 Return on AES Rate Base % Line 36 / Line 12 8.13% 8.13% 8.13% 8.13% 8.13% 8.13% 8.13% 8.13% 8.13% 8.13% 8.13% 8.13% 8.13%

Appendix C. Financial Model
Page 14
Appendix C - Tsawwassen Springs Development Phase 2
Schedule 3 (Phase 2) - Rate Base Schedule 3 (Phase 2) - Rate Base
($000's), unless otherwise stated
Continued (2026 - 2038)
Line Particulars 2026 2027 2028 2029 2030 2031 2032 2033 2034 2035 2036 2037 2038
1 Rate Base
2 Gross Plant In Service- Beginning 387 387 387 387 387 387 387 387 387 387 387 387 387
3 Gross Plant In Service- Ending 387 387 387 387 387 387 387 387 387 387 387 387 387 4
5 Accumulated Depreciation- Beginning (156) (169) (181) (194) (207) (219) (232) (245) (257) (270) (283) (295) (308)
6 Depreciation Expense (Loop Field @ 4%) (13) (13) (13) (13) (13) (13) (13) (13) (13) (13) (13) (13) (13)
7 Accumulated Depreciation- Ending (169) (181) (194) (207) (219) (232) (245) (257) (270) (283) (295) (308) (321) 8
9 Net Plant in Service, Mid-Year Sum (Lines 2 through 7 )/2 224 212 199 186 174 161 148 136 123 110 98 85 72 10
11 Cash Working Capital (1) (1) (1) (1) (1) (1) (1) (1) (1) (1) (1) (1) (1)
12 Total Rate Base Line 9 + Line 11 224 211 198 186 173 160 148 135 122 110 97 84 72 13
14 Gross Plant Additions - - - - - - - - - - - - - 15
16 Return on Rate Base
17 Total Rate Base Line 12 224 211 198 186 173 160 148 135 122 110 97 84 72
18 ROE Rate 10.00% 10.00% 10.00% 10.00% 10.00% 10.00% 10.00% 10.00% 10.00% 10.00% 10.00% 10.00% 10.00%
19 Equity Ratio 40.00% 40.00% 40.00% 40.00% 40.00% 40.00% 40.00% 40.00% 40.00% 40.00% 40.00% 40.00% 40.00%
20 Equity Return Line 17 x Line 18 x Line 19 9 8 8 7 7 6 6 5 5 4 4 3 3
21
22 Total Rate Base Line 12 224 211 198 186 173 160 148 135 122 110 97 84 72
23 Short Term Debt Rate 4.50% 4.50% 4.50% 4.50% 4.50% 4.50% 4.50% 4.50% 4.50% 4.50% 4.50% 4.50% 4.50%
24 Short Term Debt Ratio 1.63% 1.63% 1.63% 1.63% 1.63% 1.63% 1.63% 1.63% 1.63% 1.63% 1.63% 1.63% 1.63%
25 Short Term Debt Component Line 22 x Line 23 x Line 24 0 0 0 0 0 0 0 0 0 0 0 0 0
26
27 Total Rate Base Line 12 224 211 198 186 173 160 148 135 122 110 97 84 72
28 Long Term Debt Rate 6.95% 6.95% 6.95% 6.95% 6.95% 6.95% 6.95% 6.95% 6.95% 6.95% 6.95% 6.95% 6.95%
29 Long Term Debt Ratio 58.37% 58.37% 58.37% 58.37% 58.37% 58.37% 58.37% 58.37% 58.37% 58.37% 58.37% 58.37% 58.37%
30 Long Term Debt Component Line 27 x Line 28 x Line 29 9 9 8 8 7 7 6 5 5 4 4 3 3
31
32 Total Debt Component Line 25 + Line 30 9 9 8 8 7 7 6 6 5 5 4 3 3
33
34 Equity Return Line 20 9 8 8 7 7 6 6 5 5 4 4 3 3
35 Total Debt Component Line 32 9 9 8 8 7 7 6 6 5 5 4 3 3
36 Total Earned Return Line 34 + Line 35 18 17 16 15 14 13 12 11 10 9 8 7 6
37 Return on AES Rate Base % Line 36 / Line 12 8.13% 8.13% 8.13% 8.13% 8.13% 8.13% 8.13% 8.13% 8.13% 8.13% 8.13% 8.13% 8.13%

Appendix C. Financial Model
Page 15
Appendix C - Tsawwassen Springs Development Phase 2
Schedule 4 (Phase 2) - Income Tax Expense Schedule 4 (Phase 2) - Income Tax Expense
($000's), unless otherwise stated
(2013 - 2025)
Line Particulars Reference 2013 2014 2015 2016 2017 2018 2019 2020 2021 2022 2023 2024 2025
1 Income Tax Expense
2
3 Earned Return Schedule 3, Line 36 10.3 30.5 29.5 28.5 27.4 26.4 25.4 24.4 23.3 22.3 21.3 20.2 19.2
4 Deduct: Interest on debt Schedule 3, Line 32 (5.2) (15.5) (15.0) (14.5) (13.9) (13.4) (12.9) (12.4) (11.8) (11.3) (10.8) (10.3) (9.8)
5 Add: Depreciation Expense Schedule 3, Line 6 4.2 12.7 12.7 12.7 12.7 12.7 12.7 12.7 12.7 12.7 12.7 12.7 12.7
6 Deduct: Capital Cost Allowance (96.7) (145.1) (72.5) (36.3) (18.1) (9.1) (4.5) (2.3) (1.1) (0.6) (0.3) (0.1) (0.1)
7 Taxable Income After Tax Sum of Lines 3 through 6 (87.4) (117.4) (45.4) (9.6) 8.0 16.6 20.6 22.4 23.0 23.1 22.8 22.5 22.0
8
9 Income Tax Rate 25.0% 25.0% 25.0% 25.0% 25.0% 25.0% 25.0% 25.0% 25.0% 25.0% 25.0% 25.0% 25.0%
10 1 - Current Income Tax Rate 1 - Line 9 75.0% 75.0% 75.0% 75.0% 75.0% 75.0% 75.0% 75.0% 75.0% 75.0% 75.0% 75.0% 75.0%
11
12 Taxable Income Line 7 / Line 10 (116.5) (156.5) (60.5) (12.8) 10.7 22.1 27.5 29.8 30.7 30.7 30.5 30.0 29.4
13
14 Total Income Tax Expense Line 12 x Line 9 (29.1) (39.1) (15.1) (3.2) 2.7 5.5 6.9 7.5 7.7 7.7 7.6 7.5 7.3
Appendix C - Tsawwassen Springs Development Phase 2
Schedule 4 (Phase 2) - Income Tax Expense Schedule 4 (Phase 2) - Income Tax Expense
($000's), unless otherwise stated
Continued (2026 - 2038)
Line Particulars 2026 2027 2028 2029 2030 2031 2032 2033 2034 2035 2036 2037 2038
1 Income Tax Expense
2
3 Earned Return Schedule 3, Line 36 18.2 17.1 16.1 15.1 14.1 13.0 12.0 11.0 9.9 8.9 7.9 6.9 5.8
4 Deduct: Interest on debt Schedule 3, Line 32 (9.2) (8.7) (8.2) (7.7) (7.1) (6.6) (6.1) (5.6) (5.1) (4.5) (4.0) (3.5) (3.0)
5 Add: Depreciation Expense Schedule 3, Line 6 12.7 12.7 12.7 12.7 12.7 12.7 12.7 12.7 12.7 12.7 12.7 12.7 12.7
6 Deduct: Capital Cost Allowance (0.0) (0.0) (0.0) (0.0) (0.0) (0.0) (0.0) (0.0) (0.0) (0.0) (0.0) (0.0) (0.0)
7 Taxable Income After Tax Sum of Lines 3 through 6 21.6 21.1 20.6 20.1 19.6 19.1 18.6 18.1 17.6 17.0 16.5 16.0 15.5
8
9 Income Tax Rate 0.3 0.3 0.3 0.3 0.3 0.3 0.3 0.3 0.3 0.3 0.3 0.3 0.3
10 1 - Current Income Tax Rate 1 - Line 9 0.8 0.8 0.8 0.8 0.8 0.8 0.8 0.8 0.8 0.8 0.8 0.8 0.8
11
12 Taxable Income Line 7 / Line 10 28.8 28.1 27.4 26.8 26.1 25.4 24.8 24.1 23.4 22.7 22.1 21.4 20.7
13
14 Total Income Tax Expense Line 12 x Line 9 7.2 7.0 6.9 6.7 6.5 6.4 6.2 6.0 5.9 5.7 5.5 5.3 5.2

Appendix C. Financial Model
Page 16
Appendix C - Tsawwassen Springs Development Phase 2
Schedule 5 (Phase 2) Discounted Cash Flow Analysis Schedule 5 (Phase 2) Discounted Cash Flow Analysis
($000's), unless otherwise stated
(2013 - 2025)
Line Particulars Reference 2013 2014 2015 2016 2017 2018 2019 2020 2021 2022 2023 2024 2025
1 Cash Flow
2 Add: Revenue Schedule 1, Line 14 11.7 35.2 35.9 36.6 37.3 38.1 38.9 39.6 40.4 41.2 42.1 42.9 43.8
3 Less: O&M, Property Tax Expense Schedule 2, Line 2 (2.5) (7.6) (7.8) (7.9) (8.1) (8.3) (8.4) (8.6) (8.8) (9.0) (9.1) (9.3) (9.5)
4 Revenue - Cash Expenses (EBITDA1) Line 2 + Line 3 9.2 27.6 28.1 28.7 29.2 29.8 30.4 31.0 31.6 32.3 32.9 33.6 34.3
5 Capital Expenditures2Schedule 3, Line 14 (386.8) - - - - - - - - - - - -
6 Pre-Tax Cash Flow Line 4 + Line 5 (377.7) 27.6 28.1 28.7 29.2 29.8 30.4 31.0 31.6 32.3 32.9 33.6 34.3
7 Income Tax Expense (before CCA) (Schedule 4, - Line 9) x Line 4 (2.3) (6.9) (7.0) (7.2) (7.3) (7.5) (7.6) (7.8) (7.9) (8.1) (8.2) (8.4) (8.6)
8 CCA Tax Shield Schedule 4 (Line 6 x Line 9) 24.2 36.3 18.1 9.1 4.5 2.3 1.1 0.6 0.3 0.1 0.1 0.0 0.0
9 Terminal Value of CCA Tax Shield - - - - - - - - - - - - -
10 Terminal Value - - - - - - - - - - - - -
11
12 Free Cash Flow Line 6 + 7 + 8 + 9 + 10 (355.8) 56.9 39.2 30.6 26.5 24.6 23.9 23.8 24.0 24.4 24.8 25.2 25.7
13
14 After Tax WACC % 7.10% 7.10% 7.10% 7.10% 7.10% 7.10% 7.10% 7.10% 7.10% 7.10% 7.10% 7.10% 7.10%
15 Present Value of Free Cash Flow 3 Line 12 / (Schedule 1, Line 3) (356.5) 51.9 33.4 24.3 19.6 17.1 15.5 14.4 13.6 12.8 12.2 11.6 11.0
16 Total Present Value of Free Cash Flow Sum of Line 15 (4.7)
17
18 1 - Earnings Before Interest, Taxes, Depreciation & Amortization (EBITDA)
19 2 - Net of CIAC and removal costs (if applicable) and excludes capitalized overhead
20 3 - 2013 present value calculates capital expenditure to occur at time zero Sept 1

Appendix C. Financial Model
Page 17
Appendix C - Tsawwassen Springs Development Phase 2
Schedule 5 (Phase 2) Discounted Cash Flow Analysis Schedule 5 (Phase 2) Discounted Cash Flow Analysis
($000's), unless otherwise stated
Continued (2026 - 2038)
2026 2027 2028 2029 2030 2031 2032 2033 2034 2035 2036 2037 2038
1 Cash Flow
2 Add: Revenue Schedule 1, Line 14 44.6 45.5 46.4 47.4 48.3 49.3 50.3 51.3 52.3 53.3 54.4 55.5 37.5
3 Less: O&M, Property Tax Expense & Cost of EnergySchedule 2, Line 2 (9.7) (9.9) (10.1) (10.3) (10.5) (10.7) (10.9) (11.1) (11.4) (11.6) (11.8) (12.0) (8.2)
4 Revenue - Cash Expenses (EBITDA1) Line 2 + Line 3 34.9 35.6 36.4 37.1 37.8 38.6 39.3 40.1 40.9 41.8 42.6 43.4 29.3
5 Capital Expenditures2- - - - - - - - - - - - -
6 Pre-Tax Cash Flow Line 4 + Line 5 34.9 35.6 36.4 37.1 37.8 38.6 39.3 40.1 40.9 41.8 42.6 43.4 29.3
7 Income Tax Expense (before CCA) (Schedule 4, - Line 9) x Line 4 (8.7) (8.9) (9.1) (9.3) (9.5) (9.6) (9.8) (10.0) (10.2) (10.4) (10.6) (10.9) (7.3)
8 CCA Tax Shield Schedule 4 (Line 6 x Line 9) 0.0 0.0 0.0 0.0 0.0 0.0 0.0 0.0 0.0 0.0 0.0 0.0 0.0
9 Terminal Value of CCA Tax Shield - - - - - - - - - - - - -
10 Terminal Value - - - - - - - - - - - - 70.3
11
12 Free Cash Flow Line 6 + 7 + 8 + 9 + 10 26.2 26.7 27.3 27.8 28.4 28.9 29.5 30.1 30.7 31.3 31.9 32.6 92.3
13
14 After Tax WACC % 7.10% 7.10% 7.10% 7.10% 7.10% 7.10% 7.10% 7.10% 7.10% 7.10% 7.10% 7.10% 7.10%
15 Present Value of Free Cash Flow 3 Line 12 / (Schedule 1, Line 3) 10.5 10.0 9.5 9.1 8.6 8.2 7.8 7.5 7.1 6.8 6.4 6.1 16.6
16 Total Present Value of Free Cash Flow Sum of Line 15
17
18 1 - Earnings Before Interest, Taxes, Depreciation & Amortization (EBITDA)
19 2 - Net of CIAC and removal costs (if applicable) and excludes capitalized overhead
20 3 - 2013 present value calculates capital expenditure to occur at time zero Sept 1

Appendix C. Financial Model
Page 18
Appendix C - Tsawwassen Springs Development Phase 3
Schedule 1 (Phase 3) - Rate Design & Thermal Energy Services Deferral Sub Account Schedule 1 (Phase 3) - Rate Design & Thermal Energy Services Deferral Sub Account
($000's), unless otherwise stated
(2014 - 2026)
Line Particulars Reference 2014 2015 2016 2017 2018 2019 2020 2021 2022 2023 2024 2025 2026
1 Annual Contract Revenue starting Sept 1, 2014135.7 36.4 37.1 37.8 38.6 39.4 40.2 41.0 41.8 42.6 43.5 44.3 45.2
2 Annual Discount Rate (After-Tax WACC) 7.10% 7.10% 7.10% 7.10% 7.10% 7.10% 7.10% 7.10% 7.10% 7.10% 7.10% 7.10% 7.10%
3 Cummulative Discount Factor51.024 1.096 1.174 1.257 1.347 1.442 1.545 1.654 1.772 1.897 2.032 2.176 2.331
4 Annual Contract Revenue based on Calendar Year411.9 35.9 36.6 37.3 38.1 38.9 39.6 40.4 41.2 42.1 42.9 43.8 44.6
5 PV of Annual Contract Revenue Line 4 / Line 3 11.6 32.7 31.2 29.7 28.3 26.9 25.7 24.4 23.3 22.2 21.1 20.1 19.1
6 PV of Total Revenue Collected Sum Line 5 493
7
8 Annual Cost of Service3 (Calendar Year) Schedule 2, Line 8 (12.3) 11.9 35.5 46.8 51.9 53.9 54.4 54.1 53.5 52.6 51.7 50.7 49.7
9 PV of Annual Cost of Service Line 8 / Line 3 (12.0) 10.9 30.3 37.2 38.5 37.4 35.2 32.7 30.2 27.7 25.4 23.3 21.3
10 PV of Total Cost of Service Sum Line 9 493
11
12 Annual Difference Line 8 - Line 4 (24.2) (24.0) (1.1) 9.5 13.8 15.1 14.8 13.7 12.2 10.6 8.8 6.9 5.1 13
14 Total Annual Revenue Line 4 11.9 35.9 36.6 37.3 38.1 38.9 39.6 40.4 41.2 42.1 42.9 43.8 44.6 15
16 Thermal Energy Services Deferral Sub Account17 Contract Revenue — Cost of Service Line 4 - Line 8 24.2 24.0 1.1 (9.5) (13.8) (15.1) (14.8) (13.7) (12.2) (10.6) (8.8) (6.9) (5.1)
18 Deferred Charge
19 Opening Balance Line 28 previous year - (18.8) (38.7) (42.3) (38.0) (30.0) (20.4) (10.3) (0.4) 9.0 17.9 26.0 33.2
20 Gross Addition - Line 17 (24.2) (24.0) (1.1) 9.5 13.8 15.1 14.8 13.7 12.2 10.6 8.8 6.9 5.1
21 Income Tax Rate 25.0% 25.0% 25.0% 25.0% 25.0% 25.0% 25.0% 25.0% 25.0% 25.0% 25.0% 25.0% 25.0%
22 Tax - Line 20 x Line 21 6.0 6.0 0.3 (2.4) (3.5) (3.8) (3.7) (3.4) (3.1) (2.6) (2.2) (1.7) (1.3)
23 Net Addition Line 20 + Line 22 (18.1) (18.0) (0.8) 7.1 10.4 11.3 11.1 10.3 9.2 7.9 6.6 5.2 3.8
24 AFUDC
25 Equity7 (0.4) (1.1) (1.6) (1.6) (1.3) (1.0) (0.6) (0.2) 0.2 0.5 0.8 1.1 1.4
26 Debt6(0.3) (0.9) (1.2) (1.2) (1.0) (0.8) (0.5) (0.2) 0.1 0.4 0.7 0.9 1.1
27
28 Closing Balance Line 19 + 23 + 26 (18.8) (38.7) (42.3) (38.0) (30.0) (20.4) (10.3) (0.4) 9.0 17.9 26.0 33.2 39.5
29 1 - Contract Revenue based on Phase 3 monthly fee of $2,800 or $33,600 per year, quoted in 2011$; Inflated at 2% / yr beginning Sept 1, 2012
30 3 - Cost of Service = Revenue Requirement
31 4 - Calendar year adjustment of contract revenue, 4 months of current year + 8 months of previous year
32 5 - (1 + Line 2) * previous year discount factor, 2014 discount factor based on 4 months (1+7.10% * 4/12)
33 6 - (Line 19 + Line 23/2) * ((Schedule 3, Line 23 * Line 24) + (Schedule 3, Line 28 * Line 29) * (1 - Line 21))
34 7 - (Line 19 + Line 23/2) * (Schedule 3, Line 18 * Line 19)

Appendix C. Financial Model
Page 19
Appendix C - Tsawwassen Springs Development Phase 3
Schedule 1 (Phase 3) - Rate Design & Thermal Energy Services Deferral Sub Account Schedule 1 (Phase 3) - Rate Design & Thermal Energy Services Deferral Sub Account
($000's), unless otherwise stated
Continued (2027 - 2039)
Line Particulars 2027 2028 2029 2030 2031 2032 2033 2034 2035 2036 2037 2038 2039
1 Annual Contract Revenue starting Sept 1, 20141 46.1 47.0 48.0 48.9 49.9 50.9 51.9 53.0 54.0 55.1 56.2 57.4 0.0
2 Annual Discount Rate (After-Tax WACC) 7.10% 7.10% 7.10% 7.10% 7.10% 7.10% 7.10% 7.10% 7.10% 7.10% 7.10% 7.10% 7.10%
3 Cummulative Discount Factor5 2.496 2.673 2.863 3.066 3.284 3.517 3.767 4.034 4.320 4.627 4.955 5.307 5.558
4 Annual Contract Revenue based on Calendar Year4 45.5 46.4 47.4 48.3 49.3 50.3 51.3 52.3 53.3 54.4 55.5 56.6 38.2
5 PV of Annual Contract Revenue Line 4 / Line 3 18.2 17.4 16.5 15.8 15.0 14.3 13.6 13.0 12.3 11.8 11.2 10.7 6.9
6 PV of Total Revenue Collected Sum Line 5
7
8 Annual Cost of Service3 (Calendar Year) Schedule 2, Line 8 48.7 47.6 46.6 45.6 44.6 43.6 42.6 41.6 40.6 39.6 38.6 37.6 32.5
9 PV of Annual Cost of Service Line 8 / Line 3 19.5 17.8 16.3 14.9 13.6 12.4 11.3 10.3 9.4 8.6 7.8 7.1 5.8
10 PV of Total Cost of Service Sum Line 9
11
12 Annual Difference Line 8 - Line 4 3.1 1.2 (0.7) (2.7) (4.7) (6.7) (8.7) (10.7) (12.7) (14.8) (16.9) (19.0) (5.7)
13
14 Total Annual Revenue Line 4 45.5 46.4 47.4 48.3 49.3 50.3 51.3 52.3 53.3 54.4 55.5 56.6 38.2
15
16 Thermal Energy Services Deferral Sub Account
17 Contract Revenue — Cost of Service Line 4 - Line 8 (3.1) (1.2) 0.7 2.7 4.7 6.7 8.7 10.7 12.7 14.8 16.9 19.0 5.7
18 Deferred Charge
19 Opening Balance Line 28 previous year 39.5 44.7 48.9 51.8 53.3 53.5 52.1 49.1 44.3 37.5 28.7 17.6 4.2
20 Gross Addition - Line 17 3.1 1.2 (0.7) (2.7) (4.7) (6.7) (8.7) (10.7) (12.7) (14.8) (16.9) (19.0) (5.7)
21 Income Tax Rate 25.0% 25.0% 25.0% 25.0% 25.0% 25.0% 25.0% 25.0% 25.0% 25.0% 25.0% 25.0% 25.0%
22 Tax - Line 20 x Line 21 (0.8) (0.3) 0.2 0.7 1.2 1.7 2.2 2.7 3.2 3.7 4.2 4.7 1.4
23 Net Addition Line 20 + Line 22 2.4 0.9 (0.5) (2.0) (3.5) (5.0) (6.5) (8.0) (9.6) (11.1) (12.7) (14.2) (4.3)
24 AFUDC 0.0 0.0 0.0 0.0 0.0 0.0 0.0 0.0 0.0 0.0 0.0 0.0 0.0
25 Equity7 1.6 1.8 1.9 2.0 2.1 2.0 2.0 1.8 1.6 1.3 0.9 0.4 0.1
26 Debt61.3 1.4 1.5 1.6 1.6 1.6 1.5 1.4 1.2 1.0 0.7 0.3 0.1
27
28 Closing Balance Line 19 + 23 + 26 44.7 48.9 51.8 53.3 53.5 52.1 49.1 44.3 37.5 28.7 17.6 4.2 0.0
29 1 - Contract Revenue based on Phase 3 monthly fee of $2,800 or $33,600 per year, quoted in 2011$; Inflated at 2% / yr beginning Sept 1, 2012
30 3 - Cost of Service = Revenue Requirement
31 4 - Calendar year adjustment of contract revenue, 4 months of current year + 8 months of previous year
32 5 - (1 + Line 2) * previous year discount factor, 2014 discount factor based on 4 months (1+7.10% * 4/12)
33 6 - (Line 19 + Line 23/2) * ((Schedule 3, Line 23 * Line 24) + (Schedule 3, Line 28 * Line 29) * (1 - Line 21))
34 7 - (Line 19 + Line 23/2) * (Schedule 3, Line 18 * Line 19)

Appendix C. Financial Model
Page 20
Appendix C - Tsawwassen Springs Development Phase 3
Schedule 2 (Phase 3) - Revenue Requirement Schedule 2 (Phase 3) - Revenue Requirement
($000's), unless otherwise stated(2014 - 2026)
Line Particulars Reference 2014 2015 2016 2017 2018 2019 2020 2021 2022 2023 2024 2025 2026
1 Revenue Requirement1
2 Operation and Maintenance 2.5 7.8 7.9 8.1 8.3 8.4 8.6 8.8 9.0 9.1 9.3 9.5 9.7
3 Property Taxes 0.0 0.0 0.0 0.0 0.0 0.0 0.0 0.0 0.0 0.0 0.0 0.0 0.0
4 Depreciation Expense Schedule 3, Line 6 4.3 12.9 12.9 12.9 12.9 12.9 12.9 12.9 12.9 12.9 12.9 12.9 12.9
5 Income Taxes Schedule 4, Line 14 (29.7) (39.9) (15.4) (3.3) 2.7 5.6 7.0 7.6 7.8 7.8 7.8 7.6 7.5
6 Earned Return Schedule 3, Line 36 10.5 31.1 30.1 29.0 28.0 26.9 25.9 24.8 23.8 22.7 21.7 20.6 19.67
8 Annual Revenue Requirement (12.3) 11.9 35.5 46.8 51.9 53.9 54.4 54.1 53.5 52.6 51.7 50.7 49.7
9 1-Revenue Requirement=Cost of Service
Appendix C - Tsawwassen Springs Development Phase 3
Schedule 2 (Phase 3) - Revenue Requirement
($000's), unless otherwise stated
Continued (2027 - 2039)
Line Particulars 2027 2028 2029 2030 2031 2032 2033 2034 2035 2036 2037 2038 2039
1 Revenue Requirement1
2 Operation and Maintenance 9.9 10.1 10.3 10.5 10.7 10.9 11.1 11.4 11.6 11.8 12.0 12.3 8.4
3 Property Taxes 0.0 0.0 0.0 0.0 0.0 0.0 0.0 0.0 0.0 0.0 0.0 0.0 0.0
4 Depreciation Expense Schedule 3, Line 6 12.9 12.9 12.9 12.9 12.9 12.9 12.9 12.9 12.9 12.9 12.9 12.9 12.9
5 Income Taxes Schedule 4, Line 14 7.3 7.2 7.0 6.8 6.7 6.5 6.3 6.1 6.0 5.8 5.6 5.5 5.3
6 Earned Return Schedule 3, Line 36 18.5 17.5 16.4 15.4 14.3 13.3 12.2 11.2 10.1 9.1 8.0 7.0 5.9
7
8 Annual Revenue Requirement 48.7 47.6 46.6 45.6 44.6 43.6 42.6 41.6 40.6 39.6 38.6 37.6 32.5
9 1-Revenue Requirement=Cost of Service
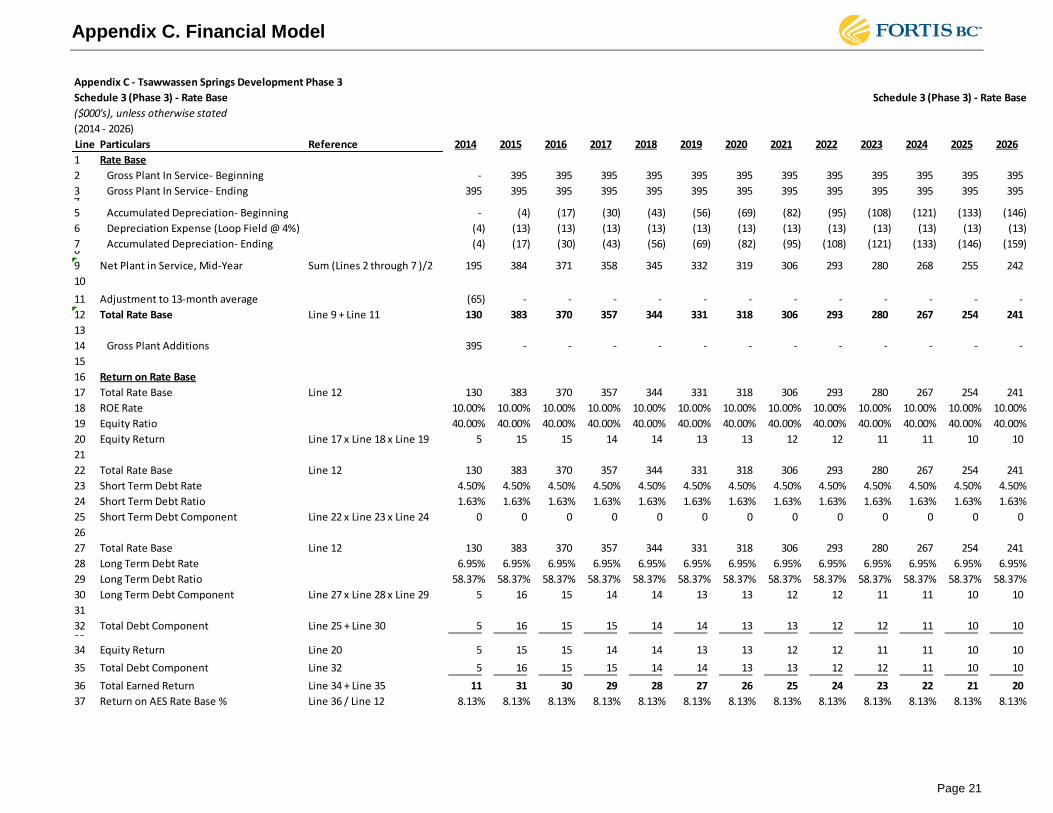
Appendix C. Financial Model
Page 21
Appendix C - Tsawwassen Springs Development Phase 3
Schedule 3 (Phase 3) - Rate Base Schedule 3 (Phase 3) - Rate Base
($000's), unless otherwise stated
(2014 - 2026)
Line Particulars Reference 2014 2015 2016 2017 2018 2019 2020 2021 2022 2023 2024 2025 2026
1 Rate Base
2 Gross Plant In Service- Beginning - 395 395 395 395 395 395 395 395 395 395 395 395
3 Gross Plant In Service- Ending 395 395 395 395 395 395 395 395 395 395 395 395 395 4
5 Accumulated Depreciation- Beginning - (4) (17) (30) (43) (56) (69) (82) (95) (108) (121) (133) (146)
6 Depreciation Expense (Loop Field @ 4%) (4) (13) (13) (13) (13) (13) (13) (13) (13) (13) (13) (13) (13)
7 Accumulated Depreciation- Ending (4) (17) (30) (43) (56) (69) (82) (95) (108) (121) (133) (146) (159) 8
9 Net Plant in Service, Mid-Year Sum (Lines 2 through 7 )/2 195 384 371 358 345 332 319 306 293 280 268 255 242
10
11 Adjustment to 13-month average (65) - - - - - - - - - - - -
12 Total Rate Base Line 9 + Line 11 130 383 370 357 344 331 318 306 293 280 267 254 241
13
14 Gross Plant Additions 395 - - - - - - - - - - - -
15
16 Return on Rate Base
17 Total Rate Base Line 12 130 383 370 357 344 331 318 306 293 280 267 254 241
18 ROE Rate 10.00% 10.00% 10.00% 10.00% 10.00% 10.00% 10.00% 10.00% 10.00% 10.00% 10.00% 10.00% 10.00%
19 Equity Ratio 40.00% 40.00% 40.00% 40.00% 40.00% 40.00% 40.00% 40.00% 40.00% 40.00% 40.00% 40.00% 40.00%
20 Equity Return Line 17 x Line 18 x Line 19 5 15 15 14 14 13 13 12 12 11 11 10 10
21
22 Total Rate Base Line 12 130 383 370 357 344 331 318 306 293 280 267 254 241
23 Short Term Debt Rate 4.50% 4.50% 4.50% 4.50% 4.50% 4.50% 4.50% 4.50% 4.50% 4.50% 4.50% 4.50% 4.50%
24 Short Term Debt Ratio 1.63% 1.63% 1.63% 1.63% 1.63% 1.63% 1.63% 1.63% 1.63% 1.63% 1.63% 1.63% 1.63%
25 Short Term Debt Component Line 22 x Line 23 x Line 24 0 0 0 0 0 0 0 0 0 0 0 0 0
26
27 Total Rate Base Line 12 130 383 370 357 344 331 318 306 293 280 267 254 241
28 Long Term Debt Rate 6.95% 6.95% 6.95% 6.95% 6.95% 6.95% 6.95% 6.95% 6.95% 6.95% 6.95% 6.95% 6.95%
29 Long Term Debt Ratio 58.37% 58.37% 58.37% 58.37% 58.37% 58.37% 58.37% 58.37% 58.37% 58.37% 58.37% 58.37% 58.37%
30 Long Term Debt Component Line 27 x Line 28 x Line 29 5 16 15 14 14 13 13 12 12 11 11 10 10
31
32 Total Debt Component Line 25 + Line 30 5 16 15 15 14 14 13 13 12 12 11 10 10 33
34 Equity Return Line 20 5 15 15 14 14 13 13 12 12 11 11 10 10
35 Total Debt Component Line 32 5 16 15 15 14 14 13 13 12 12 11 10 10
36 Total Earned Return Line 34 + Line 35 11 31 30 29 28 27 26 25 24 23 22 21 20
37 Return on AES Rate Base % Line 36 / Line 12 8.13% 8.13% 8.13% 8.13% 8.13% 8.13% 8.13% 8.13% 8.13% 8.13% 8.13% 8.13% 8.13%

Appendix C. Financial Model
Page 22
Appendix C - Tsawwassen Springs Development Phase 3
Schedule 3 (Phase 3) - Rate Base Schedule 3 (Phase 3) - Rate Base
($000's), unless otherwise stated
Continued (2027 - 2039)
Line Particulars 2027 2028 2029 2030 2031 2032 2033 2034 2035 2036 2037 2038 2039
1 Rate Base
2 Gross Plant In Service- Beginning 395 395 395 395 395 395 395 395 395 395 395 395 395
3 Gross Plant In Service- Ending 395 395 395 395 395 395 395 395 395 395 395 395 395 4
5 Accumulated Depreciation- Beginning (159) (172) (185) (198) (211) (224) (237) (250) (263) (275) (288) (301) (314)
6 Depreciation Expense (Loop Field @ 4%) (13) (13) (13) (13) (13) (13) (13) (13) (13) (13) (13) (13) (13)
7 Accumulated Depreciation- Ending (172) (185) (198) (211) (224) (237) (250) (263) (275) (288) (301) (314) (327) 8
9 Net Plant in Service, Mid-Year Sum (Lines 2 through 7 )/2 229 216 203 190 177 164 151 138 126 113 100 87 74 10
11 Cash Working Capital (1) (1) (1) (1) (1) (1) (1) (1) (1) (1) (1) (1) (1)
12 Total Rate Base Line 9 + Line 11 228 215 202 189 176 163 151 138 125 112 99 86 73 13
14 Gross Plant Additions - - - - - - - - - - - - - 15
16 Return on Rate Base
17 Total Rate Base Line 12 228 215 202 189 176 163 151 138 125 112 99 86 73
18 ROE Rate 10.00% 10.00% 10.00% 10.00% 10.00% 10.00% 10.00% 10.00% 10.00% 10.00% 10.00% 10.00% 10.00%
19 Equity Ratio 40.00% 40.00% 40.00% 40.00% 40.00% 40.00% 40.00% 40.00% 40.00% 40.00% 40.00% 40.00% 40.00%
20 Equity Return Line 17 x Line 18 x Line 19 9 9 8 8 7 7 6 6 5 4 4 3 3
21
22 Total Rate Base Line 12 228 215 202 189 176 163 151 138 125 112 99 86 73
23 Short Term Debt Rate 4.50% 4.50% 4.50% 4.50% 4.50% 4.50% 4.50% 4.50% 4.50% 4.50% 4.50% 4.50% 4.50%
24 Short Term Debt Ratio 1.63% 1.63% 1.63% 1.63% 1.63% 1.63% 1.63% 1.63% 1.63% 1.63% 1.63% 1.63% 1.63%
25 Short Term Debt Component Line 22 x Line 23 x Line 24 0 0 0 0 0 0 0 0 0 0 0 0 0
26
27 Total Rate Base Line 12 228 215 202 189 176 163 151 138 125 112 99 86 73
28 Long Term Debt Rate 6.95% 6.95% 6.95% 6.95% 6.95% 6.95% 6.95% 6.95% 6.95% 6.95% 6.95% 6.95% 6.95%
29 Long Term Debt Ratio 58.37% 58.37% 58.37% 58.37% 58.37% 58.37% 58.37% 58.37% 58.37% 58.37% 58.37% 58.37% 58.37%
30 Long Term Debt Component Line 27 x Line 28 x Line 29 9 9 8 8 7 7 6 6 5 5 4 3 3
31
32 Total Debt Component Line 25 + Line 30 9 9 8 8 7 7 6 6 5 5 4 4 3
33
34 Equity Return Line 20 9 9 8 8 7 7 6 6 5 4 4 3 3
35 Total Debt Component Line 32 9 9 8 8 7 7 6 6 5 5 4 4 3
36 Total Earned Return Line 34 + Line 35 19 17 16 15 14 13 12 11 10 9 8 7 6
37 Return on AES Rate Base % Line 36 / Line 12 8.13% 8.13% 8.13% 8.13% 8.13% 8.13% 8.13% 8.13% 8.13% 8.13% 8.13% 8.13% 8.13%

Appendix C. Financial Model
Page 23
Appendix C - Tsawwassen Springs Development Phase 3
Schedule 4 (Phase 3) - Income Tax Expense Schedule 4 (Phase 3) - Income Tax Expense
($000's), unless otherwise stated
(2014 - 2026)
Line Particulars Reference 2014 2015 2016 2017 2018 2019 2020 2021 2022 2023 2024 2025 2026
1 Income Tax Expense
2
3 Earned Return Schedule 3, Line 36 10.5 31.1 30.1 29.0 28.0 26.9 25.9 24.8 23.8 22.7 21.7 20.6 19.6
4 Deduct: Interest on debt Schedule 3, Line 32 (5.4) (15.8) (15.3) (14.8) (14.2) (13.7) (13.2) (12.6) (12.1) (11.6) (11.0) (10.5) (10.0)
5 Add: Depreciation Expense Schedule 3, Line 6 4.3 12.9 12.9 12.9 12.9 12.9 12.9 12.9 12.9 12.9 12.9 12.9 12.9
6 Deduct: Capital Cost Allowance (98.6) (148.0) (74.0) (37.0) (18.5) (9.2) (4.6) (2.3) (1.2) (0.6) (0.3) (0.1) (0.1)
7 Taxable Income After Tax Sum of Lines 3 through 6 (89.1) (119.7) (46.3) (9.8) 8.2 16.9 21.0 22.8 23.5 23.5 23.3 22.9 22.5
8
9 Income Tax Rate 25.0% 25.0% 25.0% 25.0% 25.0% 25.0% 25.0% 25.0% 25.0% 25.0% 25.0% 25.0% 25.0%
10 1 - Current Income Tax Rate 1 - Line 9 75.0% 75.0% 75.0% 75.0% 75.0% 75.0% 75.0% 75.0% 75.0% 75.0% 75.0% 75.0% 75.0%
11
12 Taxable Income Line 7 / Line 10 (118.8) (159.6) (61.7) (13.1) 10.9 22.6 28.0 30.4 31.3 31.4 31.1 30.6 30.0
13
14 Total Income Tax Expense Line 12 x Line 9 (29.7) (39.9) (15.4) (3.3) 2.7 5.6 7.0 7.6 7.8 7.8 7.8 7.6 7.5
Appendix C - Tsawwassen Springs Development Phase 3
Schedule 4 (Phase 3) - Income Tax Expense Schedule 4 (Phase 3) - Income Tax Expense
($000's), unless otherwise stated
Continued (2027 - 2039)
Line Particulars 2027 2028 2029 2030 2031 2032 2033 2034 2035 2036 2037 2038 2039
1 Income Tax Expense
2
3 Earned Return Schedule 3, Line 36 18.5 17.5 16.4 15.4 14.3 13.3 12.2 11.2 10.1 9.1 8.0 7.0 5.9
4 Deduct: Interest on debt Schedule 3, Line 32 (9.4) (8.9) (8.4) (7.8) (7.3) (6.8) (6.2) (5.7) (5.2) (4.6) (4.1) (3.6) (3.0)
5 Add: Depreciation Expense Schedule 3, Line 6 12.9 12.9 12.9 12.9 12.9 12.9 12.9 12.9 12.9 12.9 12.9 12.9 12.9
6 Deduct: Capital Cost Allowance (0.0) (0.0) (0.0) (0.0) (0.0) (0.0) (0.0) (0.0) (0.0) (0.0) (0.0) (0.0) (0.0)
7 Taxable Income After Tax Sum of Lines 3 through 6 22.0 21.5 21.0 20.5 20.0 19.5 18.9 18.4 17.9 17.4 16.9 16.4 15.8
8
9 Income Tax Rate 0.3 0.3 0.3 0.3 0.3 0.3 0.3 0.3 0.3 0.3 0.3 0.3 0.3
10 1 - Current Income Tax Rate 1 - Line 9 0.8 0.8 0.8 0.8 0.8 0.8 0.8 0.8 0.8 0.8 0.8 0.8 0.8
11
12 Taxable Income Line 7 / Line 10 29.3 28.7 28.0 27.3 26.6 25.9 25.2 24.6 23.9 23.2 22.5 21.8 21.1
13
14 Total Income Tax Expense Line 12 x Line 9 7.3 7.2 7.0 6.8 6.7 6.5 6.3 6.1 6.0 5.8 5.6 5.5 5.3

Appendix C. Financial Model
Page 24
Appendix C - Tsawwassen Springs Development Phase 3
Schedule 5 (Phase 3) Discounted Cash Flow Analysis Schedule 5 (Phase 3) Discounted Cash Flow Analysis
($000's), unless otherwise stated
(2014 - 2026)
Line Particulars Reference 2014 2015 2016 2017 2018 2019 2020 2021 2022 2023 2024 2025 2026
1 Cash Flow
2 Add: Revenue Schedule 3, Line 14 11.9 35.9 36.6 37.3 38.1 38.9 39.6 40.4 41.2 42.1 42.9 43.8 44.6
3 Less: O&M, Property Tax Expense Schedule 2, (Line 1 + Line 2) (2.5) (7.8) (7.9) (8.1) (8.3) (8.4) (8.6) (8.8) (9.0) (9.1) (9.3) (9.5) (9.7)
4 Revenue - Cash Expenses (EBITDA1) Line 2 + Line 3 9.3 28.1 28.7 29.2 29.8 30.4 31.0 31.6 32.3 32.9 33.6 34.3 34.9
5 Capital Expenditures2Schedule 3, Line 14 (394.6) - - - - - - - - - - - -
6 Pre-Tax Cash Flow Line 4 + Line 5 (385.2) 28.1 28.7 29.2 29.8 30.4 31.0 31.6 32.3 32.9 33.6 34.3 34.9
7 Income Tax Expense (before CCA) (Schedule 4, - Line 9) x Line 6 (2.3) (7.0) (7.2) (7.3) (7.5) (7.6) (7.8) (7.9) (8.1) (8.2) (8.4) (8.6) (8.7)
8 CCA Tax Shield Schedule 4 (Line 6 x Line 9) 24.7 37.0 18.5 9.2 4.6 2.3 1.2 0.6 0.3 0.1 0.1 0.0 0.0
9 Terminal Value of CCA Tax Shield - - - - - - - - - - - - -
10 Terminal Value - - - - - - - - - - - - -
11
12 Free Cash Flow Line 6 + 7 + 8 + 9 + 10 (362.9) 58.1 40.0 31.2 27.0 25.1 24.4 24.3 24.5 24.8 25.3 25.7 26.2
13
14 After Tax WACC % 7.10% 7.10% 7.10% 7.10% 7.10% 7.10% 7.10% 7.10% 7.10% 7.10% 7.10% 7.10% 7.10%
15 Present Value of Free Cash Flow 3 Line 12 / (Schedule 1, Line 3) (363.6) 53.0 34.1 24.8 20.0 17.4 15.8 14.7 13.8 13.1 12.4 11.8 11.3
16 Total Present Value of Free Cash Flow Sum of Line 15 (4.8)
17
18 1 - Earnings Before Interest, Taxes, Depreciation & Amortization (EBITDA)
19 2 - Net of CIAC and removal costs (if applicable) and excludes capitalized overhead
20 3 - 2014 present value calculates capital expenditure to occur at time zero Sept 1

Appendix C. Financial Model
Page 25
Appendix C - Tsawwassen Springs Development Phase 3
Schedule 5 (Phase 3) Discounted Cash Flow Analysis Schedule 5 (Phase 3) Discounted Cash Flow Analysis
($000's), unless otherwise stated
Continued (2027 - 2039)
2027 2028 2029 2030 2031 2032 2033 2034 2035 2036 2037 2038 2039
1 Cash Flow
2 Add: Revenue Schedule 1, Line 14 45.5 46.4 47.4 48.3 49.3 50.3 51.3 52.3 53.3 54.4 55.5 56.6 38.2
3 Less: O&M, Property Tax Expense & Cost of EnergySchedule 2, (Line 2) (9.9) (10.1) (10.3) (10.5) (10.7) (10.9) (11.1) (11.4) (11.6) (11.8) (12.0) (12.3) (8.4)
4 Revenue - Cash Expenses (EBITDA1) Line 2 + Line 3 35.6 36.4 37.1 37.8 38.6 39.3 40.1 40.9 41.8 42.6 43.4 44.3 29.9
5 Capital Expenditures2- - - - - - - - - - - - -
6 Pre-Tax Cash Flow Line 4 + Line 5 35.6 36.4 37.1 37.8 38.6 39.3 40.1 40.9 41.8 42.6 43.4 44.3 29.9
7 Income Tax Expense (before CCA) (Schedule 4, - Line 9) x Line 4 (8.9) (9.1) (9.3) (9.5) (9.6) (9.8) (10.0) (10.2) (10.4) (10.6) (10.9) (11.1) (7.5)
8 CCA Tax Shield Schedule 4 (Line 6 x Line 9) 0.0 0.0 0.0 0.0 0.0 0.0 0.0 0.0 0.0 0.0 0.0 0.0 0.0
9 Terminal Value of CCA Tax Shield - - - - - - - - - - - - -
10 Terminal Value - - - - - - - - - - - - 71.7
11
12 Free Cash Flow Line 6 + 7 + 8 + 9 + 10 26.7 27.3 27.8 28.4 28.9 29.5 30.1 30.7 31.3 31.9 32.6 33.2 94.1
13
14 After Tax WACC % 7.10% 7.10% 7.10% 7.10% 7.10% 7.10% 7.10% 7.10% 7.10% 7.10% 7.10% 7.10% 7.10%
15 Present Value of Free Cash Flow 3 Line 12 / (Schedule 1, Line 3) 10.7 10.2 9.7 9.3 8.8 8.4 8.0 7.6 7.2 6.9 6.6 6.3 16.9
16 Total Present Value of Free Cash Flow Sum of Line 15
17
18 1 - Earnings Before Interest, Taxes, Depreciation & Amortization (EBITDA)
19 2 - Net of CIAC and removal costs (if applicable) and excludes capitalized overhead
20 3 - 2014 present value calculates capital expenditure to occur at time zero Sept 1

Appendix C. Financial Model
Page 26
Appendix C - Tsawwassen Springs Development Phase 4
Schedule 1 (Phase 4) - Rate Design & Thermal Energy Services Deferral Sub Account Schedule 1 (Phase 4) - Rate Design & Thermal Energy Services Deferral Sub Account
($000's), unless otherwise stated
(2015 - 2027)
Line Particulars Reference 2015 2016 2017 2018 2019 2020 2021 2022 2023 2024 2025 2026 2027
1 Annual Contract Revenue starting Sept 1, 2015123.4 23.8 24.3 24.8 25.3 25.8 26.3 26.9 27.4 27.9 28.5 29.1 29.7
2 Annual Discount Rate (After-Tax WACC) 7.10% 7.10% 7.10% 7.10% 7.10% 7.10% 7.10% 7.10% 7.10% 7.10% 7.10% 7.10% 7.10%
3 Cummulative Discount Factor51.024 1.096 1.174 1.257 1.347 1.442 1.545 1.654 1.772 1.897 2.032 2.176 2.331
4 Annual Contract Revenue based on Calendar Year47.8 23.5 24.0 24.5 25.0 25.5 26.0 26.5 27.0 27.6 28.1 28.7 29.3
5 PV of Annual Contract Revenue Line 4 / Line 3 7.6 21.5 20.4 19.5 18.5 17.7 16.8 16.0 15.3 14.5 13.8 13.2 12.6
6 PV of Total Revenue Collected Sum Line 5 3237
8 Annual Cost of Service3 (Calendar Year) Schedule 2, Line 8 (6.8) 9.1 23.4 30.2 33.3 34.6 34.9 34.8 34.4 34.0 33.4 32.9 32.3
9 PV of Annual Cost of Service Line 8 / Line 3 (6.7) 8.3 19.9 24.0 24.7 24.0 22.6 21.0 19.4 17.9 16.5 15.1 13.9
10 PV of Total Cost of Service Sum Line 9 32311
12 Annual Difference Line 8 - Line 4 (14.6) (14.5) (0.7) 5.7 8.3 9.1 8.9 8.3 7.4 6.4 5.3 4.2 3.1 13
14 Total Annual Revenue Line 4 7.8 23.5 24.0 24.5 25.0 25.5 26.0 26.5 27.0 27.6 28.1 28.7 29.3 15
16 Thermal Energy Services Deferral Sub Account17 Contract Revenue — Cost of Service Line 4 - Line 8 14.6 14.5 0.7 (5.7) (8.3) (9.1) (8.9) (8.3) (7.4) (6.4) (5.3) (4.2) (3.1)
18 Deferred Charge
19 Opening Balance Line 28 previous year - (11.3) (23.4) (25.6) (22.9) (18.1) (12.3) (6.3) (0.3) 5.5 10.8 15.7 20.0
20 Gross Addition - Line 17 (14.6) (14.5) (0.7) 5.7 8.3 9.1 8.9 8.3 7.4 6.4 5.3 4.2 3.1
21 Income Tax Rate 25.0% 25.0% 25.0% 25.0% 25.0% 25.0% 25.0% 25.0% 25.0% 25.0% 25.0% 25.0% 25.0%
22 Tax - Line 20 x Line 21 3.7 3.6 0.2 (1.4) (2.1) (2.3) (2.2) (2.1) (1.8) (1.6) (1.3) (1.0) (0.8)
23 Net Addition Line 20 + Line 22 (11.0) (10.8) (0.5) 4.3 6.3 6.8 6.7 6.2 5.5 4.8 4.0 3.1 2.3
24 AFUDC
25 Equity7 (0.2) (0.7) (0.9) (0.9) (0.8) (0.6) (0.4) (0.1) 0.1 0.3 0.5 0.7 0.8
26 Debt6(0.2) (0.5) (0.7) (0.7) (0.6) (0.5) (0.3) (0.1) 0.1 0.2 0.4 0.5 0.7
27
28 Closing Balance Line 19 + 23 + 26 (11.3) (23.4) (25.6) (22.9) (18.1) (12.3) (6.3) (0.3) 5.5 10.8 15.7 20.0 23.8
29 1 - Contract Revenue based on Phase 4 monthly fee of $1,800 or $21,600 per year, quoted in 2011$; Inflated at 2% / yr beginning Sept 1, 2012
30 3 - Cost of Service = Revenue Requirement
31 4 - Calendar year adjustment of contract revenue, 4 months of current year + 8 months of previous year
32 5 - (1 + Line 2) * previous year discount factor, 2015 discount factor based on 4 months (1+7.10% * 4/12)
33 6 - (Line 19 + Line 23/2) * ((Schedule 3, Line 23 * Line 24) + (Schedule 3, Line 28 * Line 29) * (1 - Line 21))
34 7 - (Line 19 + Line 23/2) * (Schedule 3, Line 18 * Line 19)
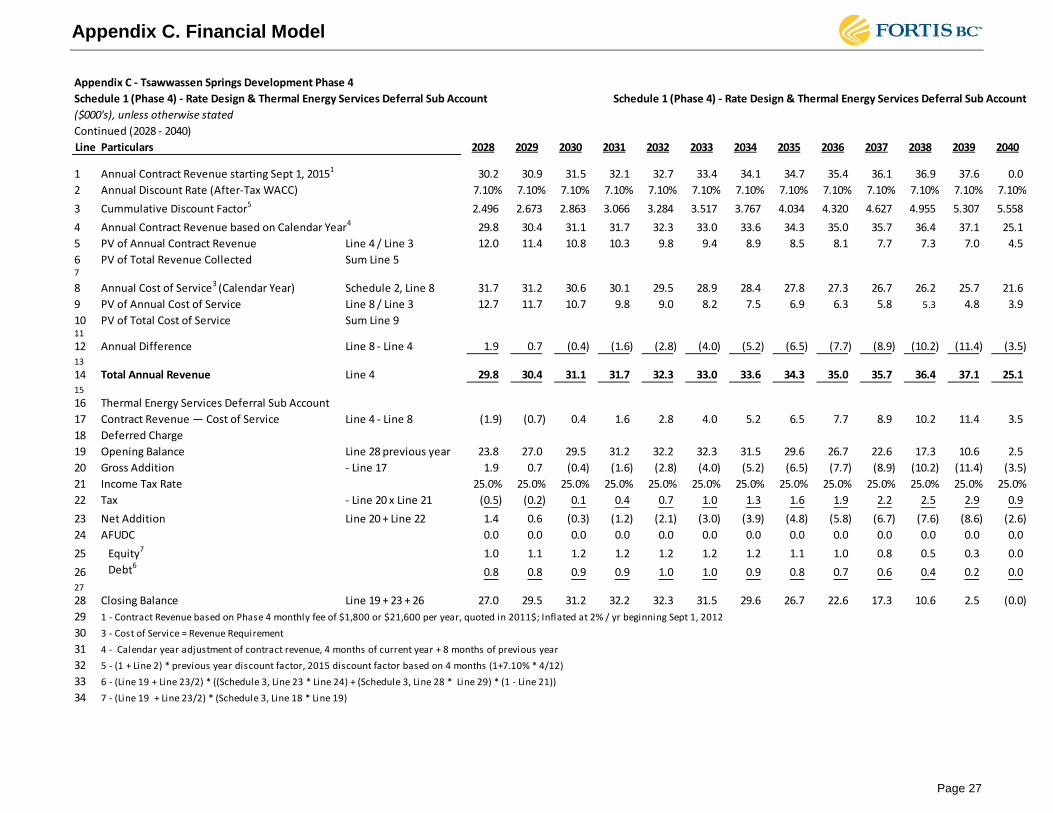
Appendix C. Financial Model
Page 27
Appendix C - Tsawwassen Springs Development Phase 4
Schedule 1 (Phase 4) - Rate Design & Thermal Energy Services Deferral Sub Account Schedule 1 (Phase 4) - Rate Design & Thermal Energy Services Deferral Sub Account
($000's), unless otherwise stated
Continued (2028 - 2040)
Line Particulars 2028 2029 2030 2031 2032 2033 2034 2035 2036 2037 2038 2039 2040
1 Annual Contract Revenue starting Sept 1, 20151 30.2 30.9 31.5 32.1 32.7 33.4 34.1 34.7 35.4 36.1 36.9 37.6 0.0
2 Annual Discount Rate (After-Tax WACC) 7.10% 7.10% 7.10% 7.10% 7.10% 7.10% 7.10% 7.10% 7.10% 7.10% 7.10% 7.10% 7.10%
3 Cummulative Discount Factor5 2.496 2.673 2.863 3.066 3.284 3.517 3.767 4.034 4.320 4.627 4.955 5.307 5.558
4 Annual Contract Revenue based on Calendar Year4 29.8 30.4 31.1 31.7 32.3 33.0 33.6 34.3 35.0 35.7 36.4 37.1 25.1
5 PV of Annual Contract Revenue Line 4 / Line 3 12.0 11.4 10.8 10.3 9.8 9.4 8.9 8.5 8.1 7.7 7.3 7.0 4.5
6 PV of Total Revenue Collected Sum Line 57
8 Annual Cost of Service3 (Calendar Year) Schedule 2, Line 8 31.7 31.2 30.6 30.1 29.5 28.9 28.4 27.8 27.3 26.7 26.2 25.7 21.6
9 PV of Annual Cost of Service Line 8 / Line 3 12.7 11.7 10.7 9.8 9.0 8.2 7.5 6.9 6.3 5.8 5.3 4.8 3.9
10 PV of Total Cost of Service Sum Line 911
12 Annual Difference Line 8 - Line 4 1.9 0.7 (0.4) (1.6) (2.8) (4.0) (5.2) (6.5) (7.7) (8.9) (10.2) (11.4) (3.5) 13
14 Total Annual Revenue Line 4 29.8 30.4 31.1 31.7 32.3 33.0 33.6 34.3 35.0 35.7 36.4 37.1 25.1 15
16 Thermal Energy Services Deferral Sub Account
17 Contract Revenue — Cost of Service Line 4 - Line 8 (1.9) (0.7) 0.4 1.6 2.8 4.0 5.2 6.5 7.7 8.9 10.2 11.4 3.5
18 Deferred Charge
19 Opening Balance Line 28 previous year 23.8 27.0 29.5 31.2 32.2 32.3 31.5 29.6 26.7 22.6 17.3 10.6 2.5
20 Gross Addition - Line 17 1.9 0.7 (0.4) (1.6) (2.8) (4.0) (5.2) (6.5) (7.7) (8.9) (10.2) (11.4) (3.5)
21 Income Tax Rate 25.0% 25.0% 25.0% 25.0% 25.0% 25.0% 25.0% 25.0% 25.0% 25.0% 25.0% 25.0% 25.0%
22 Tax - Line 20 x Line 21 (0.5) (0.2) 0.1 0.4 0.7 1.0 1.3 1.6 1.9 2.2 2.5 2.9 0.9
23 Net Addition Line 20 + Line 22 1.4 0.6 (0.3) (1.2) (2.1) (3.0) (3.9) (4.8) (5.8) (6.7) (7.6) (8.6) (2.6)
24 AFUDC 0.0 0.0 0.0 0.0 0.0 0.0 0.0 0.0 0.0 0.0 0.0 0.0 0.0
25 Equity7 1.0 1.1 1.2 1.2 1.2 1.2 1.2 1.1 1.0 0.8 0.5 0.3 0.0
26 Debt60.8 0.8 0.9 0.9 1.0 1.0 0.9 0.8 0.7 0.6 0.4 0.2 0.0
27
28 Closing Balance Line 19 + 23 + 26 27.0 29.5 31.2 32.2 32.3 31.5 29.6 26.7 22.6 17.3 10.6 2.5 (0.0)
29 1 - Contract Revenue based on Phase 4 monthly fee of $1,800 or $21,600 per year, quoted in 2011$; Inflated at 2% / yr beginning Sept 1, 2012
30 3 - Cost of Service = Revenue Requirement
31 4 - Calendar year adjustment of contract revenue, 4 months of current year + 8 months of previous year
32 5 - (1 + Line 2) * previous year discount factor, 2015 discount factor based on 4 months (1+7.10% * 4/12)
33 6 - (Line 19 + Line 23/2) * ((Schedule 3, Line 23 * Line 24) + (Schedule 3, Line 28 * Line 29) * (1 - Line 21))
34 7 - (Line 19 + Line 23/2) * (Schedule 3, Line 18 * Line 19)
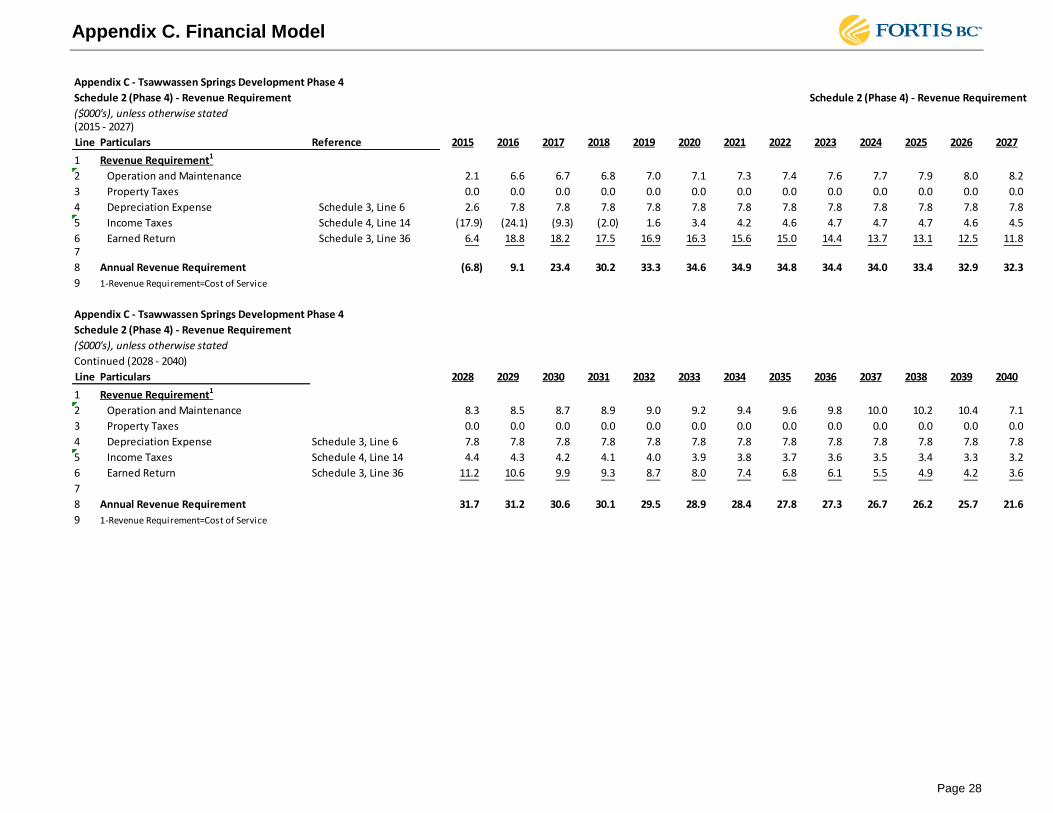
Appendix C. Financial Model
Page 28
Appendix C - Tsawwassen Springs Development Phase 4
Schedule 2 (Phase 4) - Revenue Requirement Schedule 2 (Phase 4) - Revenue Requirement
($000's), unless otherwise stated(2015 - 2027)
Line Particulars Reference 2015 2016 2017 2018 2019 2020 2021 2022 2023 2024 2025 2026 2027
1 Revenue Requirement1
2 Operation and Maintenance 2.1 6.6 6.7 6.8 7.0 7.1 7.3 7.4 7.6 7.7 7.9 8.0 8.2
3 Property Taxes 0.0 0.0 0.0 0.0 0.0 0.0 0.0 0.0 0.0 0.0 0.0 0.0 0.0
4 Depreciation Expense Schedule 3, Line 6 2.6 7.8 7.8 7.8 7.8 7.8 7.8 7.8 7.8 7.8 7.8 7.8 7.8
5 Income Taxes Schedule 4, Line 14 (17.9) (24.1) (9.3) (2.0) 1.6 3.4 4.2 4.6 4.7 4.7 4.7 4.6 4.5
6 Earned Return Schedule 3, Line 36 6.4 18.8 18.2 17.5 16.9 16.3 15.6 15.0 14.4 13.7 13.1 12.5 11.87
8 Annual Revenue Requirement (6.8) 9.1 23.4 30.2 33.3 34.6 34.9 34.8 34.4 34.0 33.4 32.9 32.3
9 1-Revenue Requirement=Cost of Service
Appendix C - Tsawwassen Springs Development Phase 4
Schedule 2 (Phase 4) - Revenue Requirement
($000's), unless otherwise stated
Continued (2028 - 2040)
Line Particulars 2028 2029 2030 2031 2032 2033 2034 2035 2036 2037 2038 2039 2040
1 Revenue Requirement1
2 Operation and Maintenance 8.3 8.5 8.7 8.9 9.0 9.2 9.4 9.6 9.8 10.0 10.2 10.4 7.1
3 Property Taxes 0.0 0.0 0.0 0.0 0.0 0.0 0.0 0.0 0.0 0.0 0.0 0.0 0.0
4 Depreciation Expense Schedule 3, Line 6 7.8 7.8 7.8 7.8 7.8 7.8 7.8 7.8 7.8 7.8 7.8 7.8 7.8
5 Income Taxes Schedule 4, Line 14 4.4 4.3 4.2 4.1 4.0 3.9 3.8 3.7 3.6 3.5 3.4 3.3 3.2
6 Earned Return Schedule 3, Line 36 11.2 10.6 9.9 9.3 8.7 8.0 7.4 6.8 6.1 5.5 4.9 4.2 3.6
7
8 Annual Revenue Requirement 31.7 31.2 30.6 30.1 29.5 28.9 28.4 27.8 27.3 26.7 26.2 25.7 21.6
9 1-Revenue Requirement=Cost of Service
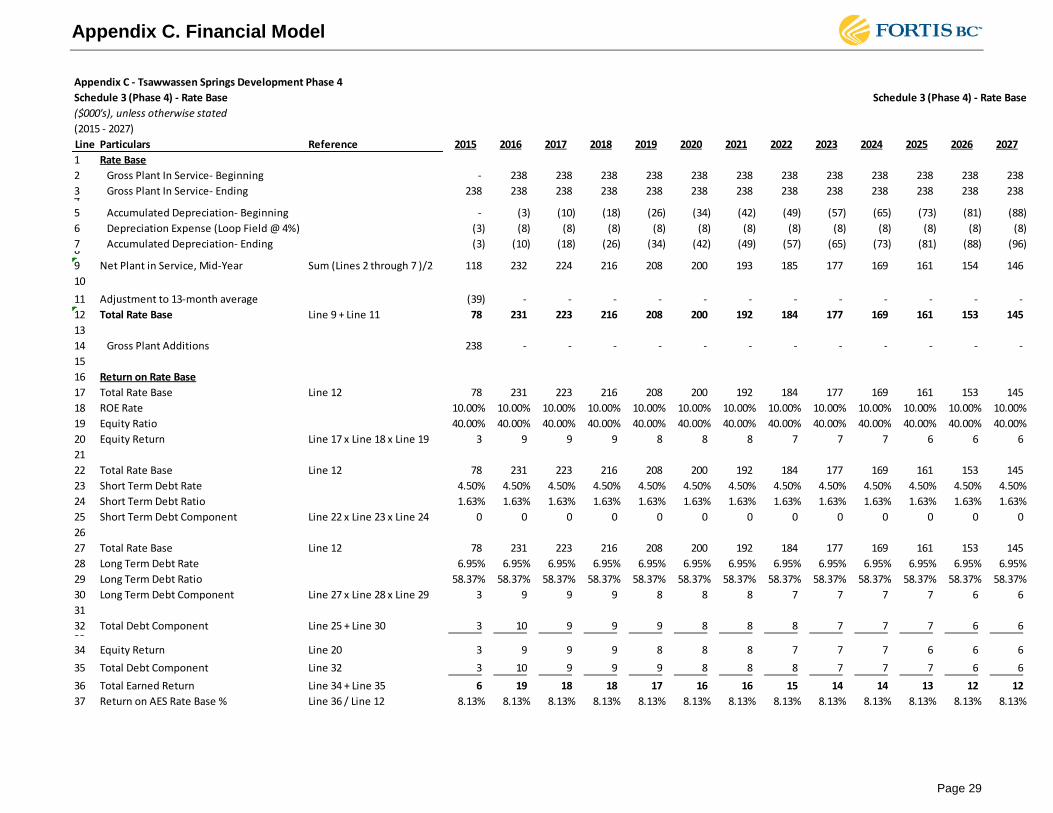
Appendix C. Financial Model
Page 29
Appendix C - Tsawwassen Springs Development Phase 4
Schedule 3 (Phase 4) - Rate Base Schedule 3 (Phase 4) - Rate Base
($000's), unless otherwise stated
(2015 - 2027)
Line Particulars Reference 2015 2016 2017 2018 2019 2020 2021 2022 2023 2024 2025 2026 2027
1 Rate Base
2 Gross Plant In Service- Beginning - 238 238 238 238 238 238 238 238 238 238 238 238
3 Gross Plant In Service- Ending 238 238 238 238 238 238 238 238 238 238 238 238 238 4
5 Accumulated Depreciation- Beginning - (3) (10) (18) (26) (34) (42) (49) (57) (65) (73) (81) (88)
6 Depreciation Expense (Loop Field @ 4%) (3) (8) (8) (8) (8) (8) (8) (8) (8) (8) (8) (8) (8)
7 Accumulated Depreciation- Ending (3) (10) (18) (26) (34) (42) (49) (57) (65) (73) (81) (88) (96) 8
9 Net Plant in Service, Mid-Year Sum (Lines 2 through 7 )/2 118 232 224 216 208 200 193 185 177 169 161 154 146
10
11 Adjustment to 13-month average (39) - - - - - - - - - - - -
12 Total Rate Base Line 9 + Line 11 78 231 223 216 208 200 192 184 177 169 161 153 145
13
14 Gross Plant Additions 238 - - - - - - - - - - - -
15
16 Return on Rate Base
17 Total Rate Base Line 12 78 231 223 216 208 200 192 184 177 169 161 153 145
18 ROE Rate 10.00% 10.00% 10.00% 10.00% 10.00% 10.00% 10.00% 10.00% 10.00% 10.00% 10.00% 10.00% 10.00%
19 Equity Ratio 40.00% 40.00% 40.00% 40.00% 40.00% 40.00% 40.00% 40.00% 40.00% 40.00% 40.00% 40.00% 40.00%
20 Equity Return Line 17 x Line 18 x Line 19 3 9 9 9 8 8 8 7 7 7 6 6 6
21
22 Total Rate Base Line 12 78 231 223 216 208 200 192 184 177 169 161 153 145
23 Short Term Debt Rate 4.50% 4.50% 4.50% 4.50% 4.50% 4.50% 4.50% 4.50% 4.50% 4.50% 4.50% 4.50% 4.50%
24 Short Term Debt Ratio 1.63% 1.63% 1.63% 1.63% 1.63% 1.63% 1.63% 1.63% 1.63% 1.63% 1.63% 1.63% 1.63%
25 Short Term Debt Component Line 22 x Line 23 x Line 24 0 0 0 0 0 0 0 0 0 0 0 0 0
26
27 Total Rate Base Line 12 78 231 223 216 208 200 192 184 177 169 161 153 145
28 Long Term Debt Rate 6.95% 6.95% 6.95% 6.95% 6.95% 6.95% 6.95% 6.95% 6.95% 6.95% 6.95% 6.95% 6.95%
29 Long Term Debt Ratio 58.37% 58.37% 58.37% 58.37% 58.37% 58.37% 58.37% 58.37% 58.37% 58.37% 58.37% 58.37% 58.37%
30 Long Term Debt Component Line 27 x Line 28 x Line 29 3 9 9 9 8 8 8 7 7 7 7 6 6
31
32 Total Debt Component Line 25 + Line 30 3 10 9 9 9 8 8 8 7 7 7 6 6 33
34 Equity Return Line 20 3 9 9 9 8 8 8 7 7 7 6 6 6
35 Total Debt Component Line 32 3 10 9 9 9 8 8 8 7 7 7 6 6
36 Total Earned Return Line 34 + Line 35 6 19 18 18 17 16 16 15 14 14 13 12 12
37 Return on AES Rate Base % Line 36 / Line 12 8.13% 8.13% 8.13% 8.13% 8.13% 8.13% 8.13% 8.13% 8.13% 8.13% 8.13% 8.13% 8.13%

Appendix C. Financial Model
Page 30
Appendix C - Tsawwassen Springs Development Phase 4
Schedule 3 (Phase 4) - Rate Base Schedule 3 (Phase 4) - Rate Base
($000's), unless otherwise stated
Continued (2028 - 2040)
Line Particulars 2028 2029 2030 2031 2032 2033 2034 2035 2036 2037 2038 2039 2040
1 Rate Base
2 Gross Plant In Service- Beginning 238 238 238 238 238 238 238 238 238 238 238 238 238
3 Gross Plant In Service- Ending 238 238 238 238 238 238 238 238 238 238 238 238 238 4
5 Accumulated Depreciation- Beginning (96) (104) (112) (120) (127) (135) (143) (151) (158) (166) (174) (182) (190)
6 Depreciation Expense (Loop Field @ 4%) (8) (8) (8) (8) (8) (8) (8) (8) (8) (8) (8) (8) (8)
7 Accumulated Depreciation- Ending (104) (112) (120) (127) (135) (143) (151) (158) (166) (174) (182) (190) (197) 8
9 Net Plant in Service, Mid-Year Sum (Lines 2 through 7 )/2 138 130 123 115 107 99 91 84 76 68 60 52 45 10
11 Cash Working Capital (0) (0) (0) (0) (0) (0) (0) (0) (0) (0) (0) (0) (0)
12 Total Rate Base Line 9 + Line 11 138 130 122 114 106 99 91 83 75 67 60 52 44 13
14 Gross Plant Additions - - - - - - - - - - - - - 15
16 Return on Rate Base
17 Total Rate Base Line 12 138 130 122 114 106 99 91 83 75 67 60 52 44
18 ROE Rate 10.00% 10.00% 10.00% 10.00% 10.00% 10.00% 10.00% 10.00% 10.00% 10.00% 10.00% 10.00% 10.00%
19 Equity Ratio 40.00% 40.00% 40.00% 40.00% 40.00% 40.00% 40.00% 40.00% 40.00% 40.00% 40.00% 40.00% 40.00%
20 Equity Return Line 17 x Line 18 x Line 19 6 5 5 5 4 4 4 3 3 3 2 2 2
21
22 Total Rate Base Line 12 138 130 122 114 106 99 91 83 75 67 60 52 44
23 Short Term Debt Rate 4.50% 4.50% 4.50% 4.50% 4.50% 4.50% 4.50% 4.50% 4.50% 4.50% 4.50% 4.50% 4.50%
24 Short Term Debt Ratio 1.63% 1.63% 1.63% 1.63% 1.63% 1.63% 1.63% 1.63% 1.63% 1.63% 1.63% 1.63% 1.63%
25 Short Term Debt Component Line 22 x Line 23 x Line 24 0 0 0 0 0 0 0 0 0 0 0 0 0
26
27 Total Rate Base Line 12 138 130 122 114 106 99 91 83 75 67 60 52 44
28 Long Term Debt Rate 6.95% 6.95% 6.95% 6.95% 6.95% 6.95% 6.95% 6.95% 6.95% 6.95% 6.95% 6.95% 6.95%
29 Long Term Debt Ratio 58.37% 58.37% 58.37% 58.37% 58.37% 58.37% 58.37% 58.37% 58.37% 58.37% 58.37% 58.37% 58.37%
30 Long Term Debt Component Line 27 x Line 28 x Line 29 6 5 5 5 4 4 4 3 3 3 2 2 2
31
32 Total Debt Component Line 25 + Line 30 6 5 5 5 4 4 4 3 3 3 2 2 2
33
34 Equity Return Line 20 6 5 5 5 4 4 4 3 3 3 2 2 2
35 Total Debt Component Line 32 6 5 5 5 4 4 4 3 3 3 2 2 2
36 Total Earned Return Line 34 + Line 35 11 11 10 9 9 8 7 7 6 5 5 4 4
37 Return on AES Rate Base % Line 36 / Line 12 8.13% 8.13% 8.13% 8.13% 8.13% 8.13% 8.13% 8.13% 8.13% 8.13% 8.13% 8.13% 8.13%
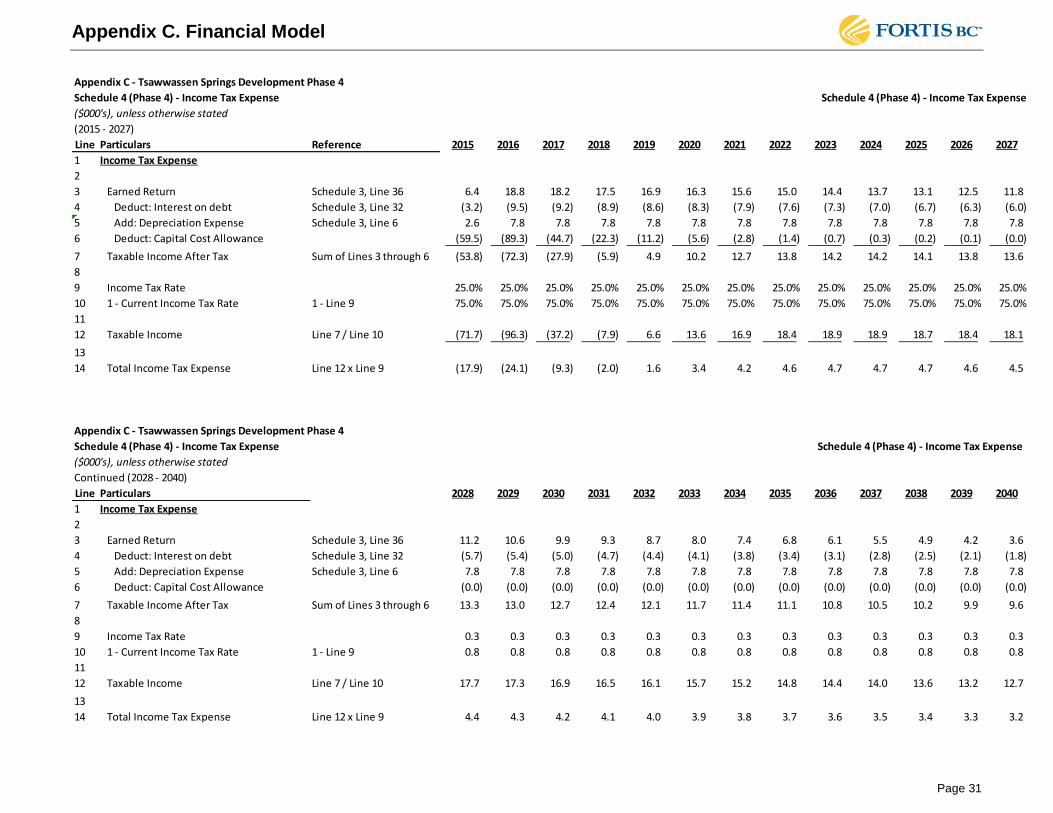
Appendix C. Financial Model
Page 31
Appendix C - Tsawwassen Springs Development Phase 4
Schedule 4 (Phase 4) - Income Tax Expense Schedule 4 (Phase 4) - Income Tax Expense
($000's), unless otherwise stated
(2015 - 2027)
Line Particulars Reference 2015 2016 2017 2018 2019 2020 2021 2022 2023 2024 2025 2026 2027
1 Income Tax Expense
2
3 Earned Return Schedule 3, Line 36 6.4 18.8 18.2 17.5 16.9 16.3 15.6 15.0 14.4 13.7 13.1 12.5 11.8
4 Deduct: Interest on debt Schedule 3, Line 32 (3.2) (9.5) (9.2) (8.9) (8.6) (8.3) (7.9) (7.6) (7.3) (7.0) (6.7) (6.3) (6.0)
5 Add: Depreciation Expense Schedule 3, Line 6 2.6 7.8 7.8 7.8 7.8 7.8 7.8 7.8 7.8 7.8 7.8 7.8 7.8
6 Deduct: Capital Cost Allowance (59.5) (89.3) (44.7) (22.3) (11.2) (5.6) (2.8) (1.4) (0.7) (0.3) (0.2) (0.1) (0.0)
7 Taxable Income After Tax Sum of Lines 3 through 6 (53.8) (72.3) (27.9) (5.9) 4.9 10.2 12.7 13.8 14.2 14.2 14.1 13.8 13.6
8
9 Income Tax Rate 25.0% 25.0% 25.0% 25.0% 25.0% 25.0% 25.0% 25.0% 25.0% 25.0% 25.0% 25.0% 25.0%
10 1 - Current Income Tax Rate 1 - Line 9 75.0% 75.0% 75.0% 75.0% 75.0% 75.0% 75.0% 75.0% 75.0% 75.0% 75.0% 75.0% 75.0%
11
12 Taxable Income Line 7 / Line 10 (71.7) (96.3) (37.2) (7.9) 6.6 13.6 16.9 18.4 18.9 18.9 18.7 18.4 18.1
13
14 Total Income Tax Expense Line 12 x Line 9 (17.9) (24.1) (9.3) (2.0) 1.6 3.4 4.2 4.6 4.7 4.7 4.7 4.6 4.5
Appendix C - Tsawwassen Springs Development Phase 4
Schedule 4 (Phase 4) - Income Tax Expense Schedule 4 (Phase 4) - Income Tax Expense
($000's), unless otherwise stated
Continued (2028 - 2040)
Line Particulars 2028 2029 2030 2031 2032 2033 2034 2035 2036 2037 2038 2039 2040
1 Income Tax Expense
2
3 Earned Return Schedule 3, Line 36 11.2 10.6 9.9 9.3 8.7 8.0 7.4 6.8 6.1 5.5 4.9 4.2 3.6
4 Deduct: Interest on debt Schedule 3, Line 32 (5.7) (5.4) (5.0) (4.7) (4.4) (4.1) (3.8) (3.4) (3.1) (2.8) (2.5) (2.1) (1.8)
5 Add: Depreciation Expense Schedule 3, Line 6 7.8 7.8 7.8 7.8 7.8 7.8 7.8 7.8 7.8 7.8 7.8 7.8 7.8
6 Deduct: Capital Cost Allowance (0.0) (0.0) (0.0) (0.0) (0.0) (0.0) (0.0) (0.0) (0.0) (0.0) (0.0) (0.0) (0.0)
7 Taxable Income After Tax Sum of Lines 3 through 6 13.3 13.0 12.7 12.4 12.1 11.7 11.4 11.1 10.8 10.5 10.2 9.9 9.6
8
9 Income Tax Rate 0.3 0.3 0.3 0.3 0.3 0.3 0.3 0.3 0.3 0.3 0.3 0.3 0.3
10 1 - Current Income Tax Rate 1 - Line 9 0.8 0.8 0.8 0.8 0.8 0.8 0.8 0.8 0.8 0.8 0.8 0.8 0.8
11
12 Taxable Income Line 7 / Line 10 17.7 17.3 16.9 16.5 16.1 15.7 15.2 14.8 14.4 14.0 13.6 13.2 12.7
13
14 Total Income Tax Expense Line 12 x Line 9 4.4 4.3 4.2 4.1 4.0 3.9 3.8 3.7 3.6 3.5 3.4 3.3 3.2
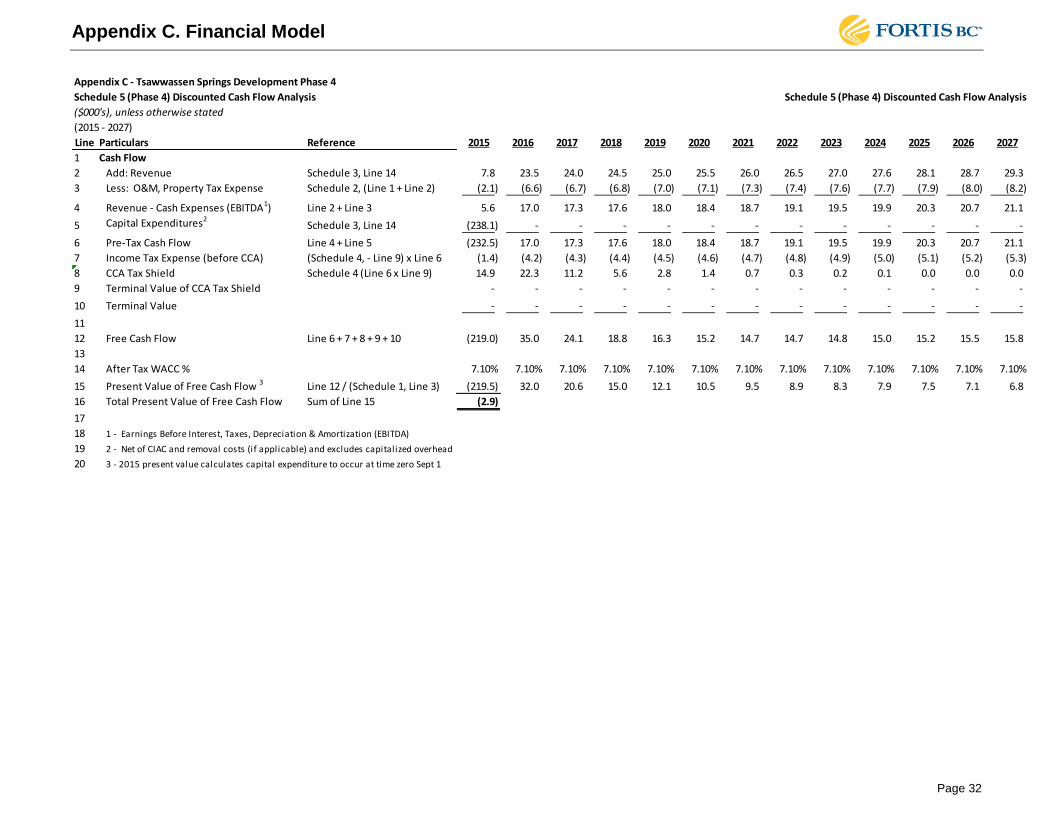
Appendix C. Financial Model
Page 32
Appendix C - Tsawwassen Springs Development Phase 4
Schedule 5 (Phase 4) Discounted Cash Flow Analysis Schedule 5 (Phase 4) Discounted Cash Flow Analysis
($000's), unless otherwise stated
(2015 - 2027)
Line Particulars Reference 2015 2016 2017 2018 2019 2020 2021 2022 2023 2024 2025 2026 2027
1 Cash Flow
2 Add: Revenue Schedule 3, Line 14 7.8 23.5 24.0 24.5 25.0 25.5 26.0 26.5 27.0 27.6 28.1 28.7 29.3
3 Less: O&M, Property Tax Expense Schedule 2, (Line 1 + Line 2) (2.1) (6.6) (6.7) (6.8) (7.0) (7.1) (7.3) (7.4) (7.6) (7.7) (7.9) (8.0) (8.2)
4 Revenue - Cash Expenses (EBITDA1) Line 2 + Line 3 5.6 17.0 17.3 17.6 18.0 18.4 18.7 19.1 19.5 19.9 20.3 20.7 21.1
5 Capital Expenditures2Schedule 3, Line 14 (238.1) - - - - - - - - - - - -
6 Pre-Tax Cash Flow Line 4 + Line 5 (232.5) 17.0 17.3 17.6 18.0 18.4 18.7 19.1 19.5 19.9 20.3 20.7 21.1
7 Income Tax Expense (before CCA) (Schedule 4, - Line 9) x Line 6 (1.4) (4.2) (4.3) (4.4) (4.5) (4.6) (4.7) (4.8) (4.9) (5.0) (5.1) (5.2) (5.3)
8 CCA Tax Shield Schedule 4 (Line 6 x Line 9) 14.9 22.3 11.2 5.6 2.8 1.4 0.7 0.3 0.2 0.1 0.0 0.0 0.0
9 Terminal Value of CCA Tax Shield - - - - - - - - - - - - -
10 Terminal Value - - - - - - - - - - - - -
11
12 Free Cash Flow Line 6 + 7 + 8 + 9 + 10 (219.0) 35.0 24.1 18.8 16.3 15.2 14.7 14.7 14.8 15.0 15.2 15.5 15.8
13
14 After Tax WACC % 7.10% 7.10% 7.10% 7.10% 7.10% 7.10% 7.10% 7.10% 7.10% 7.10% 7.10% 7.10% 7.10%
15 Present Value of Free Cash Flow 3 Line 12 / (Schedule 1, Line 3) (219.5) 32.0 20.6 15.0 12.1 10.5 9.5 8.9 8.3 7.9 7.5 7.1 6.8
16 Total Present Value of Free Cash Flow Sum of Line 15 (2.9)
17
18 1 - Earnings Before Interest, Taxes, Depreciation & Amortization (EBITDA)
19 2 - Net of CIAC and removal costs (if applicable) and excludes capitalized overhead
20 3 - 2015 present value calculates capital expenditure to occur at time zero Sept 1
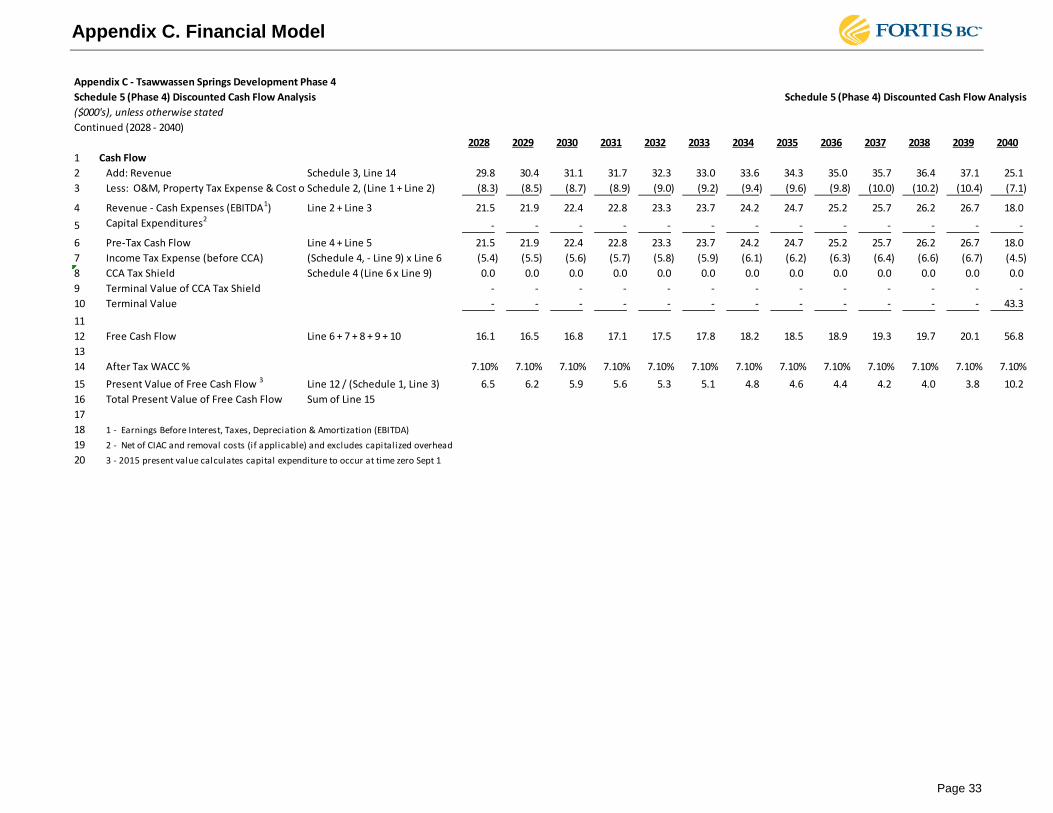
Appendix C. Financial Model
Page 33
Appendix C - Tsawwassen Springs Development Phase 4
Schedule 5 (Phase 4) Discounted Cash Flow Analysis Schedule 5 (Phase 4) Discounted Cash Flow Analysis
($000's), unless otherwise stated
Continued (2028 - 2040)
2028 2029 2030 2031 2032 2033 2034 2035 2036 2037 2038 2039 2040
1 Cash Flow
2 Add: Revenue Schedule 3, Line 14 29.8 30.4 31.1 31.7 32.3 33.0 33.6 34.3 35.0 35.7 36.4 37.1 25.1
3 Less: O&M, Property Tax Expense & Cost of EnergySchedule 2, (Line 1 + Line 2) (8.3) (8.5) (8.7) (8.9) (9.0) (9.2) (9.4) (9.6) (9.8) (10.0) (10.2) (10.4) (7.1)
4 Revenue - Cash Expenses (EBITDA1) Line 2 + Line 3 21.5 21.9 22.4 22.8 23.3 23.7 24.2 24.7 25.2 25.7 26.2 26.7 18.0
5 Capital Expenditures2- - - - - - - - - - - - -
6 Pre-Tax Cash Flow Line 4 + Line 5 21.5 21.9 22.4 22.8 23.3 23.7 24.2 24.7 25.2 25.7 26.2 26.7 18.0
7 Income Tax Expense (before CCA) (Schedule 4, - Line 9) x Line 6 (5.4) (5.5) (5.6) (5.7) (5.8) (5.9) (6.1) (6.2) (6.3) (6.4) (6.6) (6.7) (4.5)
8 CCA Tax Shield Schedule 4 (Line 6 x Line 9) 0.0 0.0 0.0 0.0 0.0 0.0 0.0 0.0 0.0 0.0 0.0 0.0 0.0
9 Terminal Value of CCA Tax Shield - - - - - - - - - - - - -
10 Terminal Value - - - - - - - - - - - - 43.3
11
12 Free Cash Flow Line 6 + 7 + 8 + 9 + 10 16.1 16.5 16.8 17.1 17.5 17.8 18.2 18.5 18.9 19.3 19.7 20.1 56.8
13
14 After Tax WACC % 7.10% 7.10% 7.10% 7.10% 7.10% 7.10% 7.10% 7.10% 7.10% 7.10% 7.10% 7.10% 7.10%
15 Present Value of Free Cash Flow 3 Line 12 / (Schedule 1, Line 3) 6.5 6.2 5.9 5.6 5.3 5.1 4.8 4.6 4.4 4.2 4.0 3.8 10.2
16 Total Present Value of Free Cash Flow Sum of Line 15
17
18 1 - Earnings Before Interest, Taxes, Depreciation & Amortization (EBITDA)
19 2 - Net of CIAC and removal costs (if applicable) and excludes capitalized overhead
20 3 - 2015 present value calculates capital expenditure to occur at time zero Sept 1

Appendix D
EVIDENCE IN SUPPORT OF EQUITY RISK PREMIUM
Foster Associates, Inc.
P a g e | 1
Opinion of
Kathleen C. McShane
EQUITY RISK PREMIUM
FOR THERMAL ENERGY SERVICE
I. INTRODUCTION AND PURPOSE OF TESTIMONY 1
2
My name is Kathleen C. McShane and my business address is 4550 Montgomery Avenue, Suite 3
350N, Bethesda, Maryland 20814. I am President of Foster Associates, Inc., an economic 4
consulting firm. I hold a Masters in Business Administration with a concentration in Finance 5
from the University of Florida (1980) and am a Chartered Financial Analyst (1989). I have 6
testified on issues related to cost of capital and various ratemaking issues on behalf of local gas 7
distribution utilities, pipelines, electric utilities and telephone companies in more than 200 8
proceedings in Canada and the U.S., including the British Columbia Utilities Commission 9
(“BCUC” or “Commission”). My professional experience is provided in Appendix A. 10
11
I have been requested by FortisBC Energy Inc. (“FEI”) to provide an expert opinion on the 12
reasonableness of its proposed 50 basis point risk premium for the Thermal Energy Service 13
(“TES”) class of service above the return on equity (“ROE”) applicable to the benchmark utility. 14
15
II. BACKGROUND 16
17
FEI is applying to the BCUC for a Certificate of Public Convenience and Necessity (“CPCN”) 18
for the construction and operation of thermal energy projects at 19 individual sites in the Delta 19
School District ("SD") and for the approval of rates and rate design pursuant to agreements 20
entered into between FEI and SD. The rates for which FEI seeks approval include a proposed 21
rate of return comprised of a capital structure containing 60% debt and 40% equity and an ROE 22

Foster Associates, Inc.
P a g e | 2
equal to that applicable to the benchmark utility plus an incremental equity risk premium of 50 23
basis points. 24
25
In Order Number G-205-11, dated December 2, 2011, the British Columbia Utilities 26
Commission (“BCUC” or “Commission”) directed FortisBC Energy Inc. (“FEI”) to file 27
supplemental evidence to support its request for an additional risk premium for the thermal class 28
of service above the benchmark ROE that applies to FEI's natural gas class of service. FEI filed 29
evidence on this topic on December 9, 2011. I have reviewed FEI’s evidence and this Opinion is 30
based on the facts stated in it. 31
32
III. PRINCIPLES 33
34
In the determination of the overall cost of capital for regulated utilities, the following principles 35
should be respected: 36
37
The Stand-Alone Principle 38
Compatibility of Return with Business Risks 39
Maintenance of Creditworthiness/Financial Integrity 40
Comparability of Returns 41
42
A. THE STAND-ALONE PRINCIPLE 43
44
Under the stand-alone principle, utilities are regulated as if the provision of the regulated service 45
were the only activity in which the company was engaged. The cost of providing utility service 46
and rates for provision of that service are to reflect only the expenses, capital costs, risks and 47
required returns associated with the provision of regulated service. Respect for the stand-alone 48
principle is consistent with basing the allowed return on an opportunity cost of capital that 49
reflects the use of funds (the risks of the operations to which the funds are committed), rather 50
than the source of those funds. Respect for the stand-alone principle is intended to promote 51
efficient allocation of capital resources and avoid cross-subsidies. The stand-alone principle has 52
been respected by virtually every Canadian regulator, including the BCUC, in setting both 53

Foster Associates, Inc.
P a g e | 3
regulated capital structures and allowed rates of returns on equity.1 I am advised that the 54
Thermal Energy Service class of service has been segregated from the natural gas class of 55
service (i.e., separate rate base and costs to be recovered from a separate group of customers). In 56
these circumstances, the stand-alone principle should be applied in establishing the overall rate 57
of return for the TES cost of service and the TES projects that make up that class of service. 58
59
60
B. RELATIONSHIP BETWEEN BUSINESS RISK AND COST OF CAPITAL 61
62
The overall cost of capital depends on both business and financial risk. Business risk relates 63
largely to the assets. Business risk comprises the fundamental operating elements of the business 64
that together determine the probability that future returns to investors will fall short of expected 65
and required returns. For regulated entities, business risks also include regulatory risks, i.e., the 66
regulatory framework under which the regulated entity operates. The prevailing regulatory 67
framework effectively represents the current allocation of the fundamental business risks 68
between investors and ratepayers. 69
70
The cost of capital is also a function of financial risk. Financial risk refers to the additional risk 71
that is borne by the equity shareholder because debt is used to finance a portion of the assets. 72
The capital structure, comprised of debt and common equity, can be viewed as a summary 73
measure of financial risk. The use of debt in a firm’s capital structure creates a class of investors 74
whose claims on the cash flows of the firm take precedence over those of the equity holder. 75
Since the issuance of debt carries unavoidable servicing costs which must be paid before the 76
equity shareholder receives any return, the potential variability of the equity shareholder’s return 77
rises as more debt is added to the capital structure. Thus, as the debt ratio rises, the cost of 78
equity rises. 79
80
1 The stand-alone principle has been recognized by the BCUC by adopting capital structures and ROEs for the
individual utilities it regulates that reflect the risks of those utilities, rather than the risks of their intermediate or
ultimate parents, e.g., In the Matter of Terasen Gas Inc. and Terasen Gas (Vancouver Island) Inc., Application to
Determine the Appropriate Return on Equity and Capital Structure and to Review and Revise the Automatic
Adjustment Mechanism, March 2006, and the December 2009 Cost of Capital Decision.

Foster Associates, Inc.
P a g e | 4
In the case of the TES, the proposed capital structure contains 60% debt and 40% equity, 81
equivalent to the capital structure adopted by the Commission for the benchmark utility. If the 82
business risks of the TES are higher than those of the benchmark utility, but the financial risks 83
are similar (i.e., the capital structures are similar), the cost of equity for the TES will be higher 84
than the benchmark utility cost of equity. In that case, a fair allowed ROE for the TES requires 85
an incremental equity risk premium above the benchmark utility allowed ROE. 86
87
C. MAINTENANCE OF CREDITWORTHINESS AND FINANCIAL INTEGRITY 88
89
A reasonable capital structure, in conjunction with the returns allowed on the various sources of 90
capital, should provide the basis for stand-alone investment grade debt ratings. For the majority 91
of regulated Canadian companies, a target debt rating in the A category is optimal from both a 92
cost and market access perspective. Debt ratings in the A category assure that the regulated 93
company would be able to access the capital markets on reasonable terms and conditions during 94
both robust and difficult, or weak, capital market conditions. The critical nature of maintaining 95
investment grade debt ratings arises from two factors: market access and cost. Even regulated 96
issuers with BBB ratings can be closed out of the market at times, particularly at the longer end 97
(20-30 year term) of the debt market. 98
99
For the TES, its small size would make it difficult to achieve debt ratings in the A category on a 100
stand alone basis, irrespective of the level of equity in the capital structure and allowed ROE. 101
Moreover, the small size of the TES would make it inefficient from a cost perspective to finance 102
on a stand-alone basis. FEI is proposing to use the company-wide cost of long-term debt for the 103
TES. As a result, the TES should contribute their fair share toward the maintenance of the debt 104
ratings through the overall return allowed. 105
106
A pure application of the stand-alone principle would impute to the TES the actual cost of debt 107
those operations would be able to obtain on their own. However, given the small size of the TES 108
relative to FEI in total, the latter’s cost of debt would not be impacted in any measurable way by 109
the financing requirements of the TES. While the assignment of FEI’s cost of debt to the TES is 110
a departure from the pure application of the stand-alone principle, it is consistent with regulatory 111
Foster Associates, Inc.
P a g e | 5
practice, where the actual cost of debt of the entity raising the debt is mirrored down to its 112
various regulated operations. This practice implicitly recognizes that all customers benefit by 113
way of a lower cost of debt from the size and diversity of the company’s operations. 114
115
D. COMPARABILITY OF RETURNS 116
117
The fair return standard requires that the regulated utility be afforded the opportunity to earn a 118
return on its investment that is comparable to the returns available from investments of similar 119
risk. The fair return standard applies to the overall return, which encompasses both capital 120
structure and ROE. 121
122
IV. BUSINESS RISK OF THE TES CLASS OF SERVICE 123
124
The TES class of service, as described in more detail in the Company’s supplemental evidence, 125
faces higher business risk on a stand-alone basis than the benchmark utility, FEI. FEI was most 126
recently designated the benchmark utility in December 2009. 127
128
The higher business risk of the TES class of service relative to the benchmark utility reflects the 129
combination of: 130
131
(1) its greenfield characteristics, including its lack of established customer base; 132
(2) relatively high upfront capital costs that must be recovered from TES customers 133
only; 134
(3) competition from conventional sources of energy; 135
(4) competition from other providers of TES services; 136
(5) reliance on less established technologies to provide the service; and 137
(6) small size of individual TES projects, e.g., fewer customers to recover the costs of 138
the assets constructed and operated to serve them; and 139
(7) reliance on non-traditional rate structures to make the TES projects competitive 140
and provide an opportunity to recover the related investment. 141
142

Foster Associates, Inc.
P a g e | 6
The higher business risk of the TES class of service relative to FEI, the benchmark utility, results 143
in a higher cost of capital, which needs to be reflected in a higher allowed return. Inasmuch as 144
the proposed capital structure for the TES class of service is similar to that of the benchmark’s 145
utility’s (60% debt and 40% equity), the higher business risk of the TES class of service needs to 146
be reflected in an incremental equity risk premium above that applicable to the benchmark 147
utility. 148
149
V. COMPARABILITY OF RETURNS 150
151
FEI is seeking an incremental equity risk premium of 50 basis points above the ROE applicable 152
to the benchmark utility (i.e., FEI’s natural gas class of service) for the TES class of service. As 153
noted above, the fair return needs to be comparable to the returns available from investments of 154
similar risk. As such, the reasonableness of the requested 50 basis point equity risk premium 155
needs to be evaluated by reference to returns available to investments of reasonably comparable 156
risk. 157
158
To my knowledge, there are no publicly-traded companies in Canada whose operations are 159
directly comparable to the regulated TES class of service. In the absence of publicly-traded 160
companies that are directly comparable to the TES class of service, the estimation of a 161
reasonable incremental equity risk premium is subject to judgment. Two relevant points of 162
comparison are (1) the equity risk premiums that the Commission has already adopted for similar 163
projects in the same class of service; and (2) the equity risk premiums that the Commission has 164
adopted for natural gas service utilities in the Province, which are smaller and riskier than the 165
benchmark utility. 166
167
As regards the first, the Commission has previously approved equity risk premiums of 50 basis 168
points and 100 basis points over the benchmark utility for Corix Multi-Utility Services Inc. and 169
Dockside Green Energy LLP respectively, both with capital structures containing 60% debt and 170
40% equity.2 With respect to the latter, the equity risk premiums adopted for the smaller, riskier 171
2 British Columbia Utilities Commission, CORIX MULTI-UTILITY SERVICES INC. NEIGHBOURHOOD UTILITY
SERVICE AT UNIVERCITY BURNABY CERTIFICATE OF PUBLIC CONVENIENCE AND NECESSITY

Foster Associates, Inc.
P a g e | 7
(than the benchmark utility) natural gas service utilities have ranged from 40 basis points (Pacific 172
Northern Gas-Fort St. John/Dawson Creek) to 65 basis points (Pacific Northern Gas-Tumbler 173
Ridge and Pacific Northern Gas-West). Both FortisBC Energy (Vancouver Island) Inc. and 174
FortisBC Energy (Whistler) Inc. had incremental equity risk premiums of 50 basis points 175
adopted by the BCUC in 2009.3 With respect to the PNG equity risk premiums, it bears noting 176
that DBRS considers PNG’s return on equity to be low for its business risk profile.4 In that 177
context, the 65 basis point upper end of the range of adopted incremental equity risk premiums 178
for the smaller natural gas service utilities is a conservative comparator for FEI’s proposed 50 179
basis point risk premium for the TES class of service. 180
181
Further, the reasonableness of a proposed equity risk premium of 50 basis points can be judged 182
by reference to the full spectrum of equity risk premiums that have been adopted for natural gas 183
service utilities, including those that are still developing. Recent cost of capital decisions for 184
Enbridge Gas New Brunswick and Heritage Gas Ltd., gas distribution utilities which still have 185
developing markets, have been awarded ROEs of 10.9% and 11.0% respectively, both on higher 186
common equity ratios (45%) than the 40% proposed for the TES class of service.5 By reference 187
to the BC benchmark utility only, the ROEs reflect incremental risk premiums of close to 150 188
basis points, materially higher than the 50 basis points requested for the TES class of service. 189
190
As a further benchmark for assessing the reasonableness of the magnitude of the proposed risk 191
premium, reference can be made to the studies on small size and returns conducted by Ibbotson 192
Associates Inc. Based on 82 years of data, Ibbotson’s analysis shows that the returns for small 193
publicly-traded electric, gas and sanitary utilities have been approximately 150 and 300 basis 194
DECISION, May 6, 2011; British Columbia Utilities Commission, Dockside Green Energy LLP Application for a
Certificate of Public Convenience and Necessity To Construct and Operate the Dockside Green District Energy
System REASONS FOR DECISION, April 18, 2008. 3British Columbia Utilities Commission, IN THE MATTER OF TERASEN GAS INC. TERASEN GAS
(VANCOUVER ISLAND) INC. TERASEN GAS (WHISTLER) INC. AND RETURN ON EQUITY AND CAPITAL
STRUCTURE DECISION, December 16, 2009. 4 DBRS, Rating Report: Pacific Northern Gas Ltd., June 10, 2011.
5 New Brunswick Energy and Utilities Board, DECISION IN THE MATTER OF a Review of Cost of Capital for
Enbridge Gas New Brunswick L.P. (EGNB), November 30, 2010; Nova Scotia Utility and Review Board,
DECISION IN THE MATTER OF AN APPLICATION by HERITAGE GAS LIMITED for the approval of
amendments to its Schedule of Rates, Tolls and Charges, NSUARB-NG-HG-R-11, November 24, 2011.
Foster Associates, Inc.
P a g e | 8
points higher on a compound and arithmetic average basis respectively than those of large 195
utilities.6 196
197
While the specific business risks faced by the TES class of service are not identical to those of 198
the referenced thermal energy utility projects nor to those of the smaller natural gas service 199
utilities in BC, they are sufficiently comparable, in my expert opinion, to support the proposed 200
50 basis point incremental equity risk premium above that of the benchmark utility. The 201
additional points of reference (developing utility and small utility risk premiums) also indicate 202
that a 50 basis point premium for the TES class of service is conservative when judged within 203
the broader range of utility equity risk premiums. 204
6 Morningstar, Ibbotson SBBI, 2008 Valuation Yearbook: Market Results for Stocks, Bonds, Bills and Inflation,
1926-2007, pages 154-155.

Foster Associates, Inc.
P a g e 1
APPENDIX A
QUALIFICATIONS OF KATHLEEN C. McSHANE
Kathleen McShane is President and senior consultant with Foster Associates, Inc., where she has
been employed since 1981. She holds an M.B.A. degree in Finance from the University of
Florida, and M.A. and B.A. degrees from the University of Rhode Island. She has been a CFA
charterholder since 1989.
Ms. McShane worked for the University of Florida and its Public Utility Research Center,
functioning as a research and teaching assistant, before joining Foster Associates. She taught
both undergraduate and graduate classes in financial management and assisted in the preparation
of a financial management textbook.
At Foster Associates, Ms. McShane has worked in the areas of financial analysis, energy
economics and cost allocation. Ms. McShane has presented testimony in more than 200
proceedings on rate of return and capital structure before federal, state, provincial and territorial
regulatory boards, on behalf of U.S. and Canadian gas distributors and pipelines, electric utilities
and telephone companies. These testimonies include the assessment of the impact of business
risk factors (e.g., competition, rate design, contractual arrangements) on capital structure and
equity return requirements. She has also testified on various ratemaking issues, including
deferral accounts, rate stabilization mechanisms, excess earnings accounts, cash working capital,
and rate base issues. Ms. McShane has provided consulting services for numerous U.S. and
Canadian companies on financial and regulatory issues, including financing, dividend policy,
corporate structure, cost of capital, automatic adjustments for return on equity, form of regulation
(including performance-based regulation), unbundling, corporate separations, stand-alone cost of
debt, regulatory climate, income tax allowance for partnerships, change in fiscal year end,
treatment of inter-corporate financial transactions, and the impact of weather normalization on
risk.

Foster Associates, Inc.
P a g e 2
Ms. McShane was principal author of a study on the applicability of alternative incentive
regulation proposals to Canadian gas pipelines. She was instrumental in the design and
preparation of a study of the profitability of 25 major U.S. gas pipelines, in which she developed
estimates of rate base, capital structure, profit margins, unit costs of providing services, and
various measures of return on investment. Other studies performed by Ms. McShane include a
comparison of municipal and privately owned gas utilities, an analysis of the appropriate
capitalization and financing for a new gas pipeline, risk/return analyses of proposed water and
gas distribution companies and an independent power project, pros and cons of performance-
based regulation, and a study on pricing of a competitive product for the U.S. Postal Service.
She has also conducted seminars on cost of capital and related regulatory issues for public
utilities, with focus on the Canadian regulatory arena.
PUBLICATIONS, PAPERS AND PRESENTATIONS
■ Utility Cost of Capital: Canada vs. U.S., presented at the CAMPUT Conference, May
2003.
■ The Effects of Unbundling on a Utility’s Risk Profile and Rate of Return, (co-authored
with Owen Edmondson, Vice President of ATCO Electric), presented at the Unbundling
Rates Conference, New Orleans, Louisiana sponsored by Infocast, January 2000.
■ Atlanta Gas Light’s Unbundling Proposal: More Unbundling Required? presented at the
24th
Annual Rate Symposium, Kansas City, Missouri, sponsored by several commissions
and universities, April 1998.
■ Incentive Regulation: An Alternative to Assessing LDC Performance, (co-authored with
Dr. William G. Foster), presented at the Natural Gas Conference, Chicago, Illinois
sponsored by the Center for Regulatory Studies, May 1993.
■ Alternative Regulatory Incentive Mechanisms, (co-authored with Stephen F. Sherwin),
prepared for the National Energy Board, Incentive Regulation Workshop, October 1992.
■ “The Fair Return”, (co-authored with Michael Cleland), Energy Law and Policy, Gordon
Kaiser and Bob Heggie, eds., Toronto: Carswell Legal Publications, 2011.
Foster Associates, Inc.
P a g e 3
EXPERT TESTIMONY/OPINIONS
ON
RATE OF RETURN AND CAPITAL STRUCTURE
Alberta Natural Gas
1994
Alberta Utilities Generic Cost of Capital
2011
AltaGas Utilities
2000
Ameren (Central Illinois Public Service)
2000, 2002, 2005, 2007 (2 cases),
2009 (2 cases)
Ameren (Central Illinois Light Company)
2005, 2007 (2 cases), 2009 (2 cases)
Ameren (Illinois Power)
2004, 2005, 2007 (2 cases), 2009 (2 cases)
Ameren (Union Electric) 2000 (2 cases), 2002 (2 cases), 2003,
2006 (2 cases)
ATCO Electric
1989, 1991, 1993, 1995, 1998, 1999, 2000,
2003, 2010
ATCO Gas
2000, 2003, 2007
ATCO Pipelines
2000, 2003, 2007, 2011
ATCO Utilities
(Generic Cost of Capital) 2008
Bell Canada
1987, 1993
Benchmark Utility Cost of Equity (British
Columbia)
1999
Canadian Western Natural Gas
1989, 1996, 1998, 1999
Centra Gas B.C.
1992, 1995, 1996, 2002
Centra Gas Ontario
1990, 1991, 1993, 1994, 1995
Direct Energy Regulated Services
2005
Dow Pool A Joint Venture
1992
Electricity Distributors Association
2009
Enbridge Gas Distribution
1988, 1989, 1991, 1992, 1993, 1994, 1995,
1996, 1997, 2001, 2002
Enbridge Gas New Brunswick
2000, 2010
Enbridge Pipelines (Line 9)
2007, 2009

Foster Associates, Inc.
P a g e 4
Enbridge Pipelines (Southern Lights)
2007
EPCOR Water Services Inc.
1994, 2000, 2006, 2008, 2011
FortisBC
1995, 1999, 2001, 2004
FortisBC Energy Inc.
1992, 1994, 2005, 2009, 2011
FortisBC Energy (Vancouver Island) Inc.
2008
Gas Company of Hawaii
2000, 2008
Gaz Métro
1988
Gazifère
1993, 1994, 1995, 1996, 1997, 1998, 2010
Generic Cost of Capital, Alberta (ATCO
and AltaGas Utilities)
2003
Heritage Gas
2004, 2008, 2011
Hydro One
1999, 2001, 2006 (2 cases)
Insurance Bureau of Canada
(Newfoundland)
2004
Laclede Gas Company
1998, 1999, 2001, 2002, 2005
Laclede Pipeline
2006
Mackenzie Valley Pipeline
2005
Maritime Electric
2010
Maritimes NRG (Nova Scotia) and (New
Brunswick)
1999
MidAmerican Energy Company
2009
Multi-Pipeline Cost of Capital Hearing
(National Energy Board)
1994
Natural Resource Gas
1994, 1997, 2006, 2010
New Brunswick Power Distribution
2005
Newfoundland & Labrador Hydro
2001, 2003
Newfoundland Power
1998, 2002, 2007, 2009
Newfoundland Telephone
1992
Northland Utilities
2008 (2 cases)
Northwestel, Inc.
2000, 2006
Northwestern Utilities
1987, 1990
Northwest Territories Power Corp.
1990, 1992, 1993, 1995, 2001, 2006

Foster Associates, Inc.
P a g e 5
Nova Scotia Power Inc.
2001, 2002, 2005, 2008, 2011
Ontario Power Generation
2007, 2010
Ozark Gas Transmission
2000
Pacific Northern Gas
1990, 1991, 1994, 1997, 1999, 2001, 2005,
2009
Plateau Pipe Line Ltd.
2007
Platte Pipeline Co.
2002
St. Lawrence Gas
1997, 2002
Southern Union Gas
1990, 1991, 1993
Stentor
1997
Tecumseh Gas Storage
1989, 1990
Telus Québec
2001
TransCanada PipeLines
1988, 1989, 1991 (2 cases), 1992, 1993
TransGas and SaskEnergy LDC
1995
Trans Québec & Maritimes Pipeline
1987
Union Gas
1988, 1989, 1990, 1992, 1994, 1996, 1998,
2001
Westcoast Energy
1989, 1990, 1992 (2 cases), 1993, 2005
Yukon Electrical Company
1991, 1993, 2008
Yukon Energy
1991, 1993
Foster Associates, Inc.
P a g e 6
EXPERT TESTIMONY/OPINIONS ON
OTHER ISSUES
Client Issue Date
Heritage Gas Criteria for a Mature Utility 2011
Alberta Utilities Management Fee on CIAC 2011
Maritimes & Northeast Pipeline Return on Escrow Account 2010
Nova Scotia Power Calculation of ROE 2009
New Brunswick Power Distribution Interest Coverage/Capital Structure 2007
Heritage Gas Revenue Deficiency Account 2006
Hydro Québec Cash Working Capital 2005
Nova Scotia Power Cash Working Capital 2005
Ontario Electricity Distributors Stand-Alone Income Taxes 2005
Caisse Centrale de Réassurance Collateral Damages 2004
Hydro Québec Cost of Debt 2004
Enbridge Gas New Brunswick AFUDC 2004
Heritage Gas Deferral Accounts 2004
ATCO Electric Carrying Costs on Deferral Account 2001
Newfoundland & Labrador Hydro Rate Base, Cash Working Capital 2001
Gazifère Inc. Cash Working Capital 2000
Maritime Electric Rate Subsidies 2000
Enbridge Gas Distribution Principles of Cost Allocation 1998
Enbridge Gas Distribution Unbundling/Regulatory Compact 1998
Maritime Electric Form of Regulation 1995
Northwest Territories Power Rate Stabilization Fund 1995
Canadian Western Natural Gas Cash Working Capital/
Compounding Effect
1989
Gaz Métro/
Province of Québec
Cost Allocation/
Incremental vs. Rolled-In Tolling
1984

FortisBC Energy Inc.
Application for a
Certificate of Public Convenience and Necessity for
Approval of Contracts and Rate for Public Utility Service to Provide Thermal Energy Service to
Delta School District Number 37
Supplemental Evidence on Return on Equity for
Thermal Energy Service
December 9, 2011

FORTISBC ENERGY INC. DELTA SCHOOL DISTRICT THERMAL ENERGY PROJECT CONTRACTS CPCN APPLICATION SUPPLEMENTAL EVIDENCE ON RETURN ON EQUITY FOR THERMAL ENERGY SERVICE
Page 1
The provision of Thermal Energy Service (“TES”) to the Delta School District occurs as
part of FortisBC Energy Inc.’s (“FEI”) TES class of service pursuant to the Utilities
Commission Act (“UCA”) and the General Terms & Conditions (“GT&C”), Section 12A.
Section 60(1)(c) of the UCA requires that rates for TES be determined “as a self-
contained unit”, separate from the natural gas service. As such, the Return on Equity
(“ROE”) for the TES class of service must be determined with reference to the business
risks of providing TES on a stand-alone basis. In this Supplemental Evidence, we
discuss the basis for the ROE for the TES class of service, which was reflected in the
agreement with the Delta School District.
Reflecting the business risks for the stand-alone TES class of service, as well as
maintaining an appropriate standard of financial integrity and respecting the relative
returns of comparable TES public utility services, FEI believes that the appropriate rate
of return for TES is determined by using a capital structure equivalent to that of the
benchmark utility (40% equity/60% debt), using FEI’s cost of debt, and a 50 basis points
equity risk premium over the benchmark ROE. As the benchmark ROE is adjusted from
time to time so will the ROE for the TES class of service.
This Supplemental Evidence is organized as follows:
Section 1: Fair Return Standard and Benchmark
Section 2: Stand-Alone Principle: Applicable to TES Class of Service
Section 3: Business Risk Overview
Section 4: Debt Financing
Section 5: Capital Structure
Section 6: Comparability of Returns
Section 7: Conclusion
1. FAIR RETURN STANDARD AND BENCHMARK The basis for determining the cost of capital for public utilities in BC is the fair return
standard. The “fair return standard” is based on court rulings on cost of capital matters,
and has three elements. It has been established that a fair return gives a regulated utility
the opportunity to:
1. Earn a return on investment comparable with that of similar risk enterprises;
2. Maintain its financial integrity; and
3. Attract capital on reasonable terms and conditions.
In British Columbia, the Commission has historically established the ROE and capital
structure for a benchmark utility and set ROEs and capital structures for all other utilities
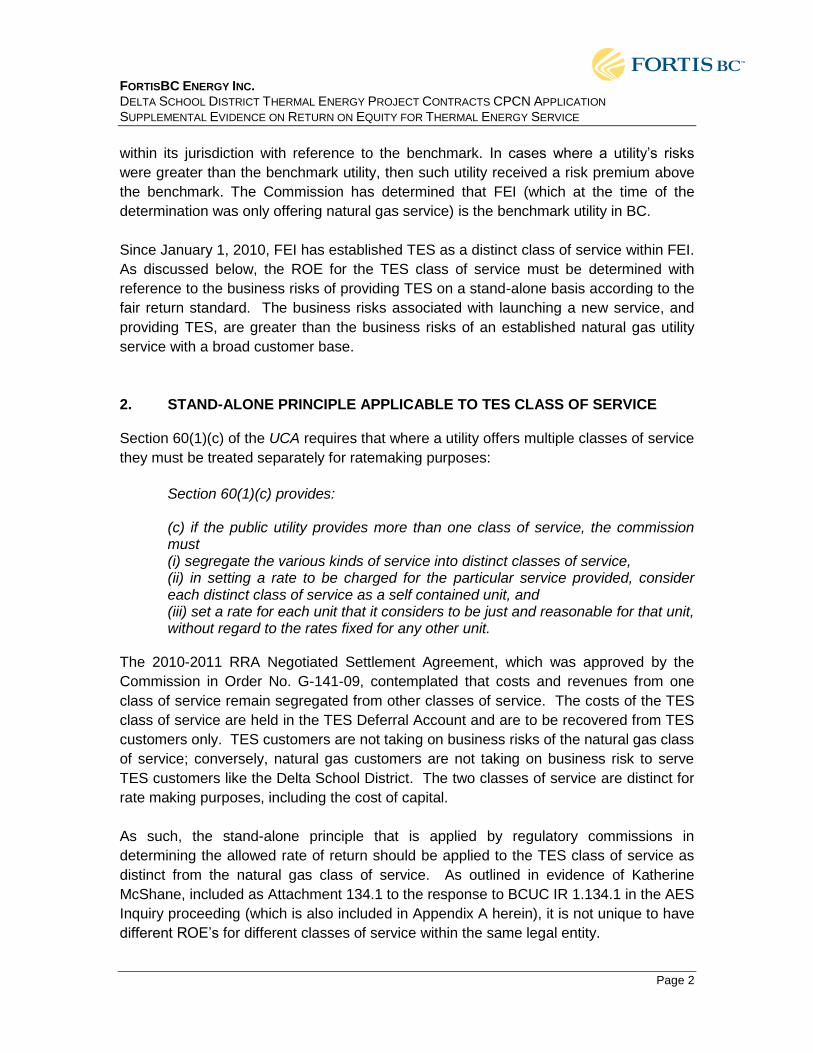
FORTISBC ENERGY INC. DELTA SCHOOL DISTRICT THERMAL ENERGY PROJECT CONTRACTS CPCN APPLICATION SUPPLEMENTAL EVIDENCE ON RETURN ON EQUITY FOR THERMAL ENERGY SERVICE
Page 2
within its jurisdiction with reference to the benchmark. In cases where a utility’s risks
were greater than the benchmark utility, then such utility received a risk premium above
the benchmark. The Commission has determined that FEI (which at the time of the
determination was only offering natural gas service) is the benchmark utility in BC.
Since January 1, 2010, FEI has established TES as a distinct class of service within FEI.
As discussed below, the ROE for the TES class of service must be determined with
reference to the business risks of providing TES on a stand-alone basis according to the
fair return standard. The business risks associated with launching a new service, and
providing TES, are greater than the business risks of an established natural gas utility
service with a broad customer base.
2. STAND-ALONE PRINCIPLE APPLICABLE TO TES CLASS OF SERVICE Section 60(1)(c) of the UCA requires that where a utility offers multiple classes of service
they must be treated separately for ratemaking purposes:
Section 60(1)(c) provides: (c) if the public utility provides more than one class of service, the commission must (i) segregate the various kinds of service into distinct classes of service, (ii) in setting a rate to be charged for the particular service provided, consider each distinct class of service as a self contained unit, and (iii) set a rate for each unit that it considers to be just and reasonable for that unit, without regard to the rates fixed for any other unit.
The 2010-2011 RRA Negotiated Settlement Agreement, which was approved by the
Commission in Order No. G-141-09, contemplated that costs and revenues from one
class of service remain segregated from other classes of service. The costs of the TES
class of service are held in the TES Deferral Account and are to be recovered from TES
customers only. TES customers are not taking on business risks of the natural gas class
of service; conversely, natural gas customers are not taking on business risk to serve
TES customers like the Delta School District. The two classes of service are distinct for
rate making purposes, including the cost of capital.
As such, the stand-alone principle that is applied by regulatory commissions in
determining the allowed rate of return should be applied to the TES class of service as
distinct from the natural gas class of service. As outlined in evidence of Katherine
McShane, included as Attachment 134.1 to the response to BCUC IR 1.134.1 in the AES
Inquiry proceeding (which is also included in Appendix A herein), it is not unique to have
different ROE’s for different classes of service within the same legal entity.

FORTISBC ENERGY INC. DELTA SCHOOL DISTRICT THERMAL ENERGY PROJECT CONTRACTS CPCN APPLICATION SUPPLEMENTAL EVIDENCE ON RETURN ON EQUITY FOR THERMAL ENERGY SERVICE
Page 3
For clarity, FEI contemplates a single rate of return on equity for the TES class of service
as a whole. The TES class of service will be, however, comprised of a number of
individual TES projects with similar risk characteristics. The business risk of the class as
a whole will, at a high level, reflect the risk associated with (a) attracting TES customers
to generate revenue to recover overhead that is recorded in the TES Deferral Account,
and (b) earning a return on, and recovering capital invested in, TES projects that
proceed. The latter risk will be similar for all TES projects and will reflect the risk
associated with undertaking the Delta School District project.
The subsequent sections address the TES-specific business risk considerations that
support the proposed return for the TES class of service.
3. BUSINESS RISK OVERVIEW Business risks are those risks that generally relate to the probability of future returns
falling short of required returns. In this section, we address business risk facing the TES
class of service on a stand-alone basis distinct from the natural gas class of service. As
a new alternative energy utility service, the TES class of service has a fundamentally
different risk profile than that of natural gas class of service, the benchmark utility. The
TES class of service is riskier than the natural gas class of service. The Commission has
recognized this for other TES projects in the Province and other smaller utilities, which
have higher approved ROEs than the benchmark utility based on a similar capital
structure.
3.1 TES Class of Service is More Risky Compared to the Benchmark A lack of established customer base, competition from conventional energy sources,
competition from other providers of TES, the size of the individual TES projects, the use
of new technologies, and regulatory uncertainties are some of the major business risks
that the TES class of service face. These are further explored below, and we also
discuss how they compare to the risk faced by the natural gas class of service.
No Established Customer Base
The TES class of service came into effect as of January 2010 and is a new class of
service within FEI. Establishing the new class of service has required significant up-front
investment by FEI. The costs of the TES class of service are held in the TES Deferral
Account and are to be recovered from TES customers only. These costs must be
recovered through multiple projects that provide a revenue contribution to recover not

FORTISBC ENERGY INC. DELTA SCHOOL DISTRICT THERMAL ENERGY PROJECT CONTRACTS CPCN APPLICATION SUPPLEMENTAL EVIDENCE ON RETURN ON EQUITY FOR THERMAL ENERGY SERVICE
Page 4
only the project costs but also a contribution to overhead. By their very nature, TES
projects are small, and many projects will be required to recover the accumulated
overhead.
There are currently no TES customers within FEI. In the event that the customer base
does not grow and insufficient customers take service, any unrecovered balance in the
TES Deferral Account is borne by the shareholder.
This stands in contrast to the natural gas class of service where there is a very
significant established customer base. Although there are long-term challenges on the
natural gas side with respect to declining natural gas throughput, competition and
declining capture rates for new customers, for instance, these customers do take service
currently and provide a contribution to the system costs. As such, the natural gas
business does not face the challenge of having to build a green-field customer base to
generate any revenues at all.
Competitive Challenges FEI faces significant challenges in developing the TES customer base to permit full
recovery of capital invested in pursuing the TES business over time. These include two
competitive challenges:
1. The challenge of promoting TES energy alternatives that have higher up front
capital costs than conventional energy alternatives; and
2. Competition among TES providers to meet demand for TES.
The TES market that FEI is pursuing at this time is the large institutional and municipal
market, which is motivated, or in some cases has a mandate, to lower GHG emissions.
However, these customers often face budgetary constraints and are typically sensitive to
energy costs. Conventional fuel sources may provide, or be perceived by the potential
customer to provide, the best opportunity to control energy costs. Electricity is a
conventional fuel source that potential customers are familiar with and can provide a
ready alternative for some of these potential customers as a means of lowering their
GHG emissions as well.
As can be seen in the Delta School District project, per page 44 in the Application, the
upfront capital costs to establish public utility services are significant and require a
transitional rate measure to facilitate access to the overall savings. Examples of
regulatory rate making tools to overcome these challenges include, but are not limited to
deferral accounts, and levelized rates. This is typical of greenfield public utility

FORTISBC ENERGY INC. DELTA SCHOOL DISTRICT THERMAL ENERGY PROJECT CONTRACTS CPCN APPLICATION SUPPLEMENTAL EVIDENCE ON RETURN ON EQUITY FOR THERMAL ENERGY SERVICE
Page 5
developments where the high up-front capital costs are the largest barrier to adoption of
the new technology or system. The necessity of such rate constructs to enable
development to occur, and FEI’s reliance on the Commission to approve such
measures, raises the regulatory risks relative to established public utilities with
established connection policies and the ability to employ standard rate constructs to
recover the full cost of service.
In circumstances where the potential customer has determined to adopt a TES solution,
FEI competes with a number of other TES service providers to provide that solution.
FEI’s main competitors are currently Corix Multi-Utility Services and developers and
institutions that can self-supply. Corix has a number of holdings in the Province already,
and is a bidder on many of the projects in which FEI has been involved. There are
recent examples, such as the Parklane project, of developers establishing their own
utility to provide the service. Thus, by its nature, the FEI’s TES class of service must
compete with other energy forms (natural gas, electricity) and then it must compete with
other service providers of TES to provide service to a customer.
Size of the TES Projects Once FEI is successful in securing a TES customer, there remains a risk associated with
the investment made in the project itself. The risk relates to both the ability of the
shareholder to earn a return on the capital invested in the TES project, and the ability to
recover the capital invested over time. Given that these TES projects are smaller in size
and have few customers that can make use of the assets installed, these projects are of
higher risk than FEI’s natural gas system.
Use of New Technology Some technologies are less well established than those used to provide natural gas
service. While FEI has experience with TES technologies, the technology still presents
greater risk than natural gas technology on its own.
Regulatory Uncertainty There is regulatory risk associated with any regulated entity, and TES is no exception.
The regulatory risk factors into both being able to attract customers to TES, and also
being able to earn a return on and of capital invested in projects for new customers.
As described above, the TES class of service is heavily reliant on the Commission’s
approval of non-traditional rate structures such as levelizing to make TES viable as an

FORTISBC ENERGY INC. DELTA SCHOOL DISTRICT THERMAL ENERGY PROJECT CONTRACTS CPCN APPLICATION SUPPLEMENTAL EVIDENCE ON RETURN ON EQUITY FOR THERMAL ENERGY SERVICE
Page 6
option for most customers. Hence, there is significant regulatory risk associated with
building a customer base. This risk will remain higher than the natural gas business for
so long as the rate design techniques are required to address the barrier presented by
higher upfront costs associated with TES. There also remains considerable regulatory
uncertainty for the TES class of service – to a greater extent than the natural gas class
of service where the Commission has established processes for determining rates,
customer additions, and project approvals - while the AES Inquiry remains outstanding
and an efficient and effective process remains to be determined. The uncertainty
represents a challenge for FEI in marketing TES as an option for customers.
The regulatory risk associated with projects constructed, as with the natural gas class of
service, relates to setting rates on a forecast basis. Variances from the forecast can
affect the return earned on the invested capital, and FEI is reliant on the Commission to
determine appropriate depreciation rates to ensure recovery of capital over the service
life.
3.2 Risk Factors Faced By Natural Gas Class of Service Are Generally Inapplicable to TES Class of Service
The business risk profile of TES and natural gas classes of services are quite different.
FEI highlighted the following drivers of increased business risks related to natural gas
class of service in its 2009 ROE and Capital Structure proceeding:
1. Competitive position of natural gas versus electricity
2. Provincial climate change and energy policies
3. Capture rates of natural gas versus electricity
4. Trends in per customer usage
5. Competition with alternative energy sources
6. Aboriginal rights issues
These factors influence the long term throughput on the natural gas system and are of
limited relevance to TES. The factors that have the most relevance to TES are the need
to be competitive (discussed above) and provincial climate change and energy policies,
which do favour the development of TES in many respects. A discussion of how the
Delta School Project meets British Columbia’s energy objectives, for instance, is found
at pages 10 to 13 of the Application. The TES target customers are large institutions
and municipalities with an interest in, or mandate to, reduce GHG emissions. However,
as described in the previous section, the main risks associated with TES relate to the
size and scope of the business and these risks cannot be offset by the “green” nature of
the service.
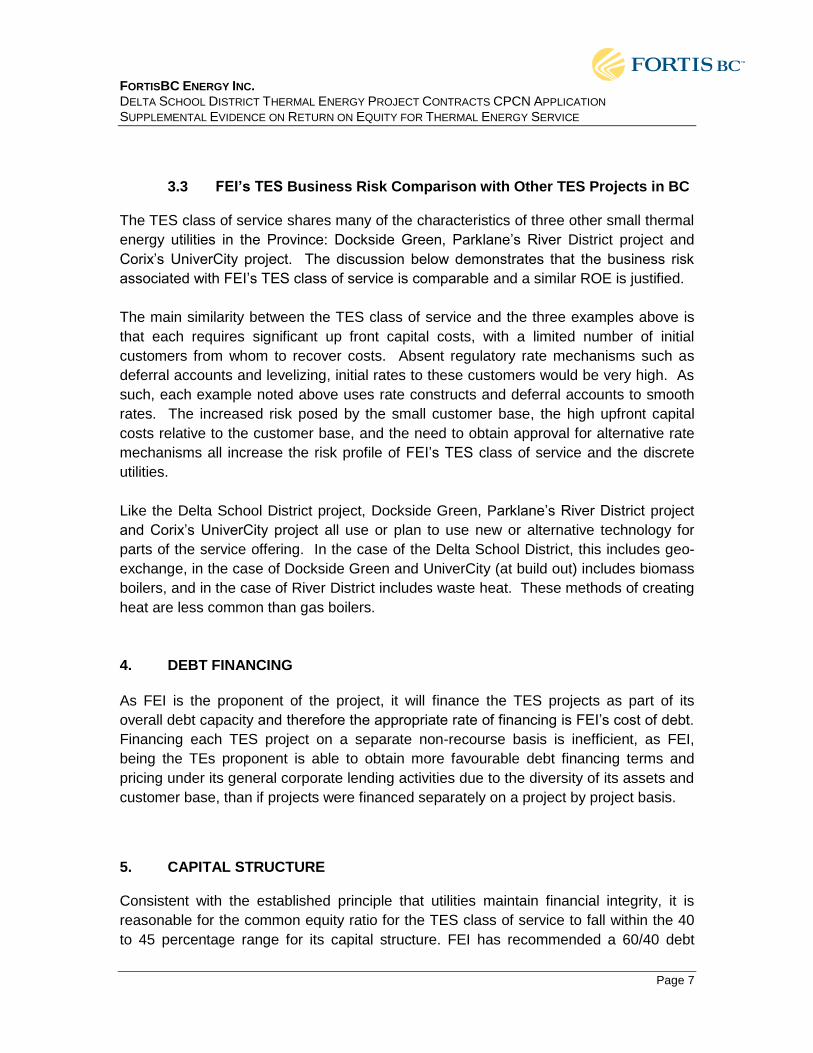
FORTISBC ENERGY INC. DELTA SCHOOL DISTRICT THERMAL ENERGY PROJECT CONTRACTS CPCN APPLICATION SUPPLEMENTAL EVIDENCE ON RETURN ON EQUITY FOR THERMAL ENERGY SERVICE
Page 7
3.3 FEI’s TES Business Risk Comparison with Other TES Projects in BC The TES class of service shares many of the characteristics of three other small thermal
energy utilities in the Province: Dockside Green, Parklane’s River District project and
Corix’s UniverCity project. The discussion below demonstrates that the business risk
associated with FEI’s TES class of service is comparable and a similar ROE is justified.
The main similarity between the TES class of service and the three examples above is
that each requires significant up front capital costs, with a limited number of initial
customers from whom to recover costs. Absent regulatory rate mechanisms such as
deferral accounts and levelizing, initial rates to these customers would be very high. As
such, each example noted above uses rate constructs and deferral accounts to smooth
rates. The increased risk posed by the small customer base, the high upfront capital
costs relative to the customer base, and the need to obtain approval for alternative rate
mechanisms all increase the risk profile of FEI’s TES class of service and the discrete
utilities.
Like the Delta School District project, Dockside Green, Parklane’s River District project
and Corix’s UniverCity project all use or plan to use new or alternative technology for
parts of the service offering. In the case of the Delta School District, this includes geo-
exchange, in the case of Dockside Green and UniverCity (at build out) includes biomass
boilers, and in the case of River District includes waste heat. These methods of creating
heat are less common than gas boilers.
4. DEBT FINANCING
As FEI is the proponent of the project, it will finance the TES projects as part of its
overall debt capacity and therefore the appropriate rate of financing is FEI’s cost of debt.
Financing each TES project on a separate non-recourse basis is inefficient, as FEI,
being the TEs proponent is able to obtain more favourable debt financing terms and
pricing under its general corporate lending activities due to the diversity of its assets and
customer base, than if projects were financed separately on a project by project basis.
5. CAPITAL STRUCTURE Consistent with the established principle that utilities maintain financial integrity, it is
reasonable for the common equity ratio for the TES class of service to fall within the 40
to 45 percentage range for its capital structure. FEI has recommended a 60/40 debt

FORTISBC ENERGY INC. DELTA SCHOOL DISTRICT THERMAL ENERGY PROJECT CONTRACTS CPCN APPLICATION SUPPLEMENTAL EVIDENCE ON RETURN ON EQUITY FOR THERMAL ENERGY SERVICE
Page 8
equity split for capital structure based on FEI being the proponent. This will be applied to
the Delta project and other projects.
6. COMPARABILITY OF RETURNS
The Commission has reflected the greater business risk associated with other TES
projects and other small utilities in the Province relative to the benchmark utility in a
combination of thicker equity ratios and incremental equity risk premiums. Although FEI
believe that the business risks profile for each of these utilities are different, recognizing
that all these smaller utilities and TES projects have smaller size and scope compared to
the benchmark utility make comparability of returns justified.
A summary of the ROE and capital structure of other BC utilities and TES projects is set
out in the table below.
Utility
Risk Premium
Capital Structure (Debt to Equity)
BCUC Decision Order No.
FortisBC Energy (Vancouver Island) Inc. + 50 basis points 60/40 G-158-09
FortisBC Energy (Whistler) Inc. + 50 basis points 60/40 G-158-09
FortisBC Inc. + 40 basis points 60/40 G-58-06
Pacific Northern Gas Ltd.
G-84-10 PNG-West Division + 65 basis points 55/45
Fort St. John/Dawson Creek Division + 40 basis points 60/40
Tumbler Ridge Division
+ 65 basis points 60/40
FortisBC Alternative Energy Inc.
Gateway Lakeview Estates Propane System
+ 60 basis points
65/35
C-22-06
Dockside Green Energy LLP + 100 basis points 60/40 C-1-08
Corix Multi-Utility Services Inc.
Neighbourhood Utility Service at UniverCity
+ 50 basis points
60/40
C-7-11
River District Energy Utility Approval Sought
+ 50 basis points
Approval Sought
60/40
Regulatory review
in progress
As discussed above, the most comparable utilities with approved rates are Dockside
Green and UniverCity. Given that the Commission approved a 100 basis point premium
for the Dockside Green district energy system, and a 50 basis point premium for the
UniverCity district energy system, FEI believe it is appropriate to set the TES class of
service ROE at a 50 basis point premium also.
While it is possible to arrive at alternate combinations of debt and equity and their
attendant rates relative to the benchmark utility as noted above, an appropriate range is
40 to 45% equity and FEI is proposing 40%.

FORTISBC ENERGY INC. DELTA SCHOOL DISTRICT THERMAL ENERGY PROJECT CONTRACTS CPCN APPLICATION SUPPLEMENTAL EVIDENCE ON RETURN ON EQUITY FOR THERMAL ENERGY SERVICE
Page 9
7. CONCLUSION Upon consideration and application of each of these principles, FEI submits that for the
TES class of service, a total return on rate base at 8.13%, or 20 basis points premium
compared to the benchmark utility is reasonable and can be achieved as follows:
40% equity at 50 basis points above the benchmark rate of return on equity; and
60% debt at the rate for FEI.
This combination balances the need to reflect the business risks for the stand-alone TES
class of service, maintaining an appropriate standard of financial integrity and respecting
the relative returns of comparable TES public utility services.
Appendix A
FOSTER & ASSOCIATES EVIDENCE

Foster Associates, Inc.
P a g e | 1
4550 Montgomery Avenue, Suite 350N, Bethesda, Maryland 20814
TEL: (301) 664-7852* FAX: (301) 664-7810
___________________________________________________________________________________________________________
TO: Shawn Hill October 28, 2011
From: Kathleen C. McShane
Re: DIFFERENTIAL RATES OF RETURN
This memo is in response to your request for assistance regarding the issue of setting different
allowed rates of return for different lines of business or different service classes within the same
corporate entity.
DIFFERENTIAL RETURNS FOR DIFFERENT LINES OF BUSINESS
Canada:
In Canada, the stand-alone principle has been a hallmark of regulation as regards the
establishment of allowed rates of return. Reliance on the stand-alone principle for purposes of
rate of return is, to use the language of the predecessor to the Alberta Utilities Commission:
designed to remove the effects of diversification by utilities into non-regulated
activities. Using the stand-alone principle in this case, a utility is regulated as if
the provision of the regulated service were the only activity in which the company
is engaged. This application of the principle ensures that the revenue requirement
of regulated utility operations is not influenced up or down by the operations of a
parent or „sister‟ company. Thus the cost (or revenue requirement) of providing
utility service reflects only the expenses, capital costs, risks and required returns
associated with the provision of the regulated service. 1
1 Alberta Energy and Utilities Board, Genco and Disco 2000 Pool Price Deferral Accounts Proceeding, Decision
2001-92, December 12, 2001, pp. 24-25.

Foster Associates, Inc.
P a g e | 2
In Alberta, different rates of return have been adopted for the different functions of utilities‟
electric utility business within the same corporate entity (transmission, distribution and heritage
generation) since the electric utility industry was restructured in 1996. For example, ATCO
Electric Inc., a subsidiary of CU Inc., operates both electric transmission and electric distribution
businesses within the same corporate entity.2 The different rates of return for the regulated
transmission and distribution functions are reflected in different capital structures. ATCO Gas
and Pipelines Inc. operates both a gas transmission and gas distribution business. The two lines
of business have different allowed capital structures.3
In Ontario, to my knowledge, the only utility that operates different lines of business within the
same corporate entity is Hydro One (electric transmission and distribution). In principle, rates of
return between the two services could be different, as the two lines of business are operated
separately, but the Ontario Energy Board determined that there was insufficient evidence to
conclude that the risks of the two lines of business were sufficiently different to justify different
rates of return.
In the most recent Ontario Power Generation rate application, as per an OEB directive, the
question of whether there should be different equity ratios for the company‟s two regulated
generation “technologies”, hydroelectric and nuclear, was addressed. The OEB acknowledged
that there were differences in risk between the two technologies, but that there were no
methodologies which permitted a robust determination of the differentials and that, for rate
setting purposes, there may not be any material benefits to ratepayers in the long-term of setting
different capital structures.
2 The same is true of EPCOR Distribution and Transmission Inc. and Enmax Power Corporation.
3 Prior to 1998, Canadian Utilities Limited had two separate subsidiaries, Canadian Western Natural Gas and
Northwestern Utilities, each of which was a combined gas distribution and transmission business with separate
operating territories. In 1998, the utilities were restructured, combined into a single corporate entity, ATCO Gas and
Pipelines Inc., separated for rate purposes into four divisions, two distribution and two transmission. The two
distribution operations have the same allowed capital structure as do the two transmission operations.

Foster Associates, Inc.
P a g e | 3
At the National Energy Board, up until 1997, Westcoast‟s mainline transportation and gas
processing operations had the same allowed ROE and capital structure. In 1997, the two were
separated; the allowed common equity ratio of the mainline transportation operations was set at
30% (versus 35% previously for the combined operations). The gas processing operations have
since been subject to light-handed regulation, with no specified ROE or capital structure.
Also at the NEB, the three different segments of Enbridge Pipelines Inc., the “Older System”,
Line 8 and Line 9, have each been treated for regulatory purposes, including rate of return, on a
stand-alone basis. Line 9 has been treated as a stand-alone operation since its inception, when it
was constructed with government support to provide oil transportation service from Western
Canada to Montréal during the oil crisis in the 1970s. Known as the Montréal Extension at the
time, Line 9 extends from Sarnia, Ontario to Montréal. Line 9 continued to be treated as a stand-
alone operation when it was reversed in the 1990s to provide westbound transportation of off-
shore crude to Ontario refineries under a long-term Facilities Service Agreement with specific
customers. Line 8 (called the Oil Products Transportation System), which has a separate rate
base, ROE and capital structure from the other two pipeline segments, is also subject to a
separate Facilities Service Agreement. The separate regulatory models and rates of return for the
three segments are all the result of negotiated agreements between Enbridge Pipelines Inc. and
the relevant shippers on the segments, not a litigated rate proceeding.
United States:
There are a number of combination utilities in the U.S. whose gas, electric and steam operations
are housed in the same corporate entity. It is not uncommon for these utilities to seek rate
changes for the different utility lines of business at the same time. To assess the extent to which
regulators have allowed differential rates of return for the different utility lines of business, we
identified all rate decisions issued by the same regulator on the same date for separate utility
businesses of the same legal entity since 2000. Of the 86 relevant situations identified, in eight

Foster Associates, Inc.
P a g e | 4
instances in seven regulatory jurisdictions, regulators set different allowed ROEs for the gas and
electric utility operations of the same corporate entities.4
LINE OF BUSINESS/CLASS OF SERVICE VERSUS RATE CLASSES WITHIN A LINE
OF BUSINESS/CLASS OF SERVICE
While it is not uncommon to adopt separate rates of return for different lines of utility business
(or class of service, to use the B.C terminology), I am not aware of any situations in which a
single regulator has adopted separate rates of return for rate classes or individual services within
the utility line of business/class of service. In the case of Union Gas, for example, which offers
separate tariffs for regulated storage, transmission and distribution, as well as separate tariffs for
distribution to different customer classes, there is only one capital structure and return on equity,
intended to compensate for the overall risk of the total regulated business. Many gas pipelines,
e.g., TransCanada PipeLines, offer a wide variety of transportation related services, e.g., firm
transportation under long-term contract, storage, interruptible, etc., but there are not separate
rates of return assigned to each of the services. Electric transmission utilities offer network
services and point-to-point transmission services, but there is a single capital structure and return
on equity for the entire transmission line of business.
It is widely accepted that different utilities which operate within the same line of business/class
of service (e.g., different utilities which offer natural gas service or different utilities which offer
electric service) are exposed to different levels of business risk as a result of, among other
factors, different customer profiles. For example, Gaz Métro is regarded as a higher risk gas
distributor than Enbridge Gas, in part due to its comparatively larger industrial customer base.
However, it would be difficult, if not impossible, to estimate separate costs of capital for Gaz
Métro‟s industrial customer service than for its residential customer service. First of all, each
customer class contributes to the system. While the existence of a small number of large
industrial customers with alternative sources of energy may create higher risk relative to a
system with a more balanced customer profile, that same class, ceteris paribus, creates the ability
4 Colorado, Illinois, Indiana, Iowa, Louisiana, Maryland and Nevada. There may be other instances where the
allowed rates of return of the different lines of utility business were intended to reflect different levels of risk, but,
due to the different timing of rate filings, they were not readily identifiable.

Foster Associates, Inc.
P a g e | 5
of the system to operate at a higher load factor and thus at relatively lower unit costs. Setting a
higher rate of return for industrial customers could, in fact, create, perverse incentives for those
customers to leave the system in favour of an alternative form of energy, adversely impacting the
costs to remaining customers. In this context, setting differential rates of return for different
classes of service could actually raise the overall cost of capital for the entire utility line of
business.

Foster Associates, Inc.
P a g e 1
QUALIFICATIONS OF KATHLEEN C. McSHANE
Kathleen McShane is President and senior consultant with Foster Associates, Inc., where she has
been employed since 1981. She holds an M.B.A. degree in Finance from the University of
Florida, and M.A. and B.A. degrees from the University of Rhode Island. She has been a CFA
charterholder since 1989.
Ms. McShane worked for the University of Florida and its Public Utility Research Center,
functioning as a research and teaching assistant, before joining Foster Associates. She taught
both undergraduate and graduate classes in financial management and assisted in the preparation
of a financial management textbook.
At Foster Associates, Ms. McShane has worked in the areas of financial analysis, energy
economics and cost allocation. Ms. McShane has presented testimony in more than 200
proceedings on rate of return and capital structure before federal, state, provincial and territorial
regulatory boards, on behalf of U.S. and Canadian gas distributors and pipelines, electric utilities
and telephone companies. These testimonies include the assessment of the impact of business
risk factors (e.g., competition, rate design, contractual arrangements) on capital structure and
equity return requirements. She has also testified on various ratemaking issues, including
deferral accounts, rate stabilization mechanisms, excess earnings accounts, cash working capital,
and rate base issues. Ms. McShane has provided consulting services for numerous U.S. and
Canadian companies on financial and regulatory issues, including financing, dividend policy,
corporate structure, cost of capital, automatic adjustments for return on equity, form of regulation
(including performance-based regulation), unbundling, corporate separations, stand-alone cost of
debt, regulatory climate, income tax allowance for partnerships, change in fiscal year end,
treatment of inter-corporate financial transactions, and the impact of weather normalization on
risk.
Foster Associates, Inc.
P a g e 2
Ms. McShane was principal author of a study on the applicability of alternative incentive
regulation proposals to Canadian gas pipelines. She was instrumental in the design and
preparation of a study of the profitability of 25 major U.S. gas pipelines, in which she developed
estimates of rate base, capital structure, profit margins, unit costs of providing services, and
various measures of return on investment. Other studies performed by Ms. McShane include a
comparison of municipal and privately owned gas utilities, an analysis of the appropriate
capitalization and financing for a new gas pipeline, risk/return analyses of proposed water and
gas distribution companies and an independent power project, pros and cons of performance-
based regulation, and a study on pricing of a competitive product for the U.S. Postal Service.
She has also conducted seminars on cost of capital and related regulatory issues for public
utilities, with focus on the Canadian regulatory arena.
PUBLICATIONS, PAPERS AND PRESENTATIONS
■ Utility Cost of Capital: Canada vs. U.S., presented at the CAMPUT Conference, May
2003.
■ The Effects of Unbundling on a Utility’s Risk Profile and Rate of Return, (co-authored
with Owen Edmondson, Vice President of ATCO Electric), presented at the Unbundling
Rates Conference, New Orleans, Louisiana sponsored by Infocast, January 2000.
■ Atlanta Gas Light’s Unbundling Proposal: More Unbundling Required? presented at the
24th
Annual Rate Symposium, Kansas City, Missouri, sponsored by several commissions
and universities, April 1998.
■ Incentive Regulation: An Alternative to Assessing LDC Performance, (co-authored with
Dr. William G. Foster), presented at the Natural Gas Conference, Chicago, Illinois
sponsored by the Center for Regulatory Studies, May 1993.
■ Alternative Regulatory Incentive Mechanisms, (co-authored with Stephen F. Sherwin),
prepared for the National Energy Board, Incentive Regulation Workshop, October 1992.
■ “The Fair Return”, (co-authored with Michael Cleland), Energy Law and Policy, Gordon
Kaiser and Bob Heggie, eds., Toronto: Carswell Legal Publications, 2011.

Foster Associates, Inc.
P a g e 3
EXPERT TESTIMONY/OPINIONS
ON
RATE OF RETURN AND CAPITAL STRUCTURE
Alberta Natural Gas
1994
Alberta Utilities Generic Cost of Capital
2011
AltaGas Utilities
2000
Ameren (Central Illinois Public Service)
2000, 2002, 2005, 2007 (2 cases),
2009 (2 cases)
Ameren (Central Illinois Light Company)
2005, 2007 (2 cases), 2009 (2 cases)
Ameren (Illinois Power)
2004, 2005, 2007 (2 cases), 2009 (2 cases)
Ameren (Union Electric) 2000 (2 cases), 2002 (2 cases), 2003,
2006 (2 cases)
ATCO Electric
1989, 1991, 1993, 1995, 1998, 1999, 2000,
2003, 2010
ATCO Gas
2000, 2003, 2007
ATCO Pipelines
2000, 2003, 2007, 2011
ATCO Utilities
2008
Bell Canada
1987, 1993
Benchmark Utility Cost of Equity (British
Columbia)
1999
Canadian Western Natural Gas
1989, 1996, 1998, 1999
Centra Gas B.C.
1992, 1995, 1996, 2002
Centra Gas Ontario
1990, 1991, 1993, 1994, 1995
Direct Energy Regulated Services
2005
Dow Pool A Joint Venture
1992
Edmonton Water/EPCOR Water Services
1994, 2000, 2006, 2008
Electricity Distributors Association
2009
Enbridge Gas Distribution
1988, 1989, 1991, 1992, 1993, 1994, 1995,
1996, 1997, 2001, 2002
Enbridge Gas New Brunswick
2000, 2010

Foster Associates, Inc.
P a g e 4
Enbridge Pipelines (Line 9)
2007, 2009
Enbridge Pipelines (Southern Lights)
2007
Epcor Water Services Inc.
2011
FortisBC
1995, 1999, 2001, 2004
Gas Company of Hawaii
2000, 2008
Gaz Métro
1988
Gazifère
1993, 1994, 1995, 1996, 1997, 1998, 2010
Generic Cost of Capital, Alberta (ATCO
and AltaGas Utilities)
2003
Heritage Gas
2004, 2008, 2011
Hydro One
1999, 2001, 2006 (2 cases)
Insurance Bureau of Canada
(Newfoundland)
2004
Laclede Gas Company
1998, 1999, 2001, 2002, 2005
Laclede Pipeline
2006
Mackenzie Valley Pipeline
2005
Maritime Electric
2010
Maritimes NRG (Nova Scotia) and (New
Brunswick)
1999
MidAmerican Energy Company
2009
Multi-Pipeline Cost of Capital Hearing
(National Energy Board)
1994
Natural Resource Gas
1994, 1997, 2006, 2010
New Brunswick Power Distribution
2005
Newfoundland & Labrador Hydro
2001, 2003
Newfoundland Power
1998, 2002, 2007, 2009
Newfoundland Telephone
1992
Northland Utilities
2008 (2 cases)
Northwestel, Inc.
2000, 2006
Northwestern Utilities
1987, 1990
Northwest Territories Power Corp.
1990, 1992, 1993, 1995, 2001, 2006
Nova Scotia Power Inc.
2001, 2002, 2005, 2008, 2011

Foster Associates, Inc.
P a g e 5
Ontario Power Generation
2007, 2010
Ozark Gas Transmission
2000
Pacific Northern Gas
1990, 1991, 1994, 1997, 1999, 2001, 2005,
2009
Plateau Pipe Line Ltd.
2007
Platte Pipeline Co.
2002
St. Lawrence Gas
1997, 2002
Southern Union Gas
1990, 1991, 1993
Stentor
1997
Tecumseh Gas Storage
1989, 1990
Telus Québec
2001
Terasen Gas
1992, 1994, 2005, 2009
Terasen Gas (Whistler)
2008
TransCanada PipeLines
1988, 1989, 1991 (2 cases), 1992, 1993
TransGas and SaskEnergy LDC
1995
Trans Québec & Maritimes Pipeline
1987
Union Gas
1988, 1989, 1990, 1992, 1994, 1996, 1998,
2001
Westcoast Energy
1989, 1990, 1992 (2 cases), 1993, 2005
Yukon Electrical Company
1991, 1993, 2008
Yukon Energy
1991, 1993

Foster Associates, Inc.
P a g e 6
EXPERT TESTIMONY/OPINIONS ON
OTHER ISSUES
Client Issue Date
Heritage Gas Criteria for a Mature Utility 2011
Alberta Utilities Management Fee on CIAC 2011
Maritimes & Northeast Pipeline Return on Escrow Account 2010
Nova Scotia Power Calculation of ROE 2009
New Brunswick Power Distribution Interest Coverage/Capital Structure 2007
Heritage Gas Revenue Deficiency Account 2006
Hydro Québec Cash Working Capital 2005
Nova Scotia Power Cash Working Capital 2005
Ontario Electricity Distributors Stand-Alone Income Taxes 2005
Caisse Centrale de Réassurance Collateral Damages 2004
Hydro Québec Cost of Debt 2004
Enbridge Gas New Brunswick AFUDC 2004
Heritage Gas Deferral Accounts 2004
ATCO Electric Carrying Costs on Deferral Account 2001
Newfoundland & Labrador Hydro Rate Base, Cash Working Capital 2001
Gazifère Inc. Cash Working Capital 2000
Maritime Electric Rate Subsidies 2000
Enbridge Gas Distribution Principles of Cost Allocation 1998
Enbridge Gas Distribution Unbundling/Regulatory Compact 1998
Maritime Electric Form of Regulation 1995
Northwest Territories Power Rate Stabilization Fund 1995
Canadian Western Natural Gas Cash Working Capital/
Compounding Effect
1989
Gaz Métro/
Province of Québec
Cost Allocation/
Incremental vs. Rolled-In Tolling
1984

Appendix E
DRAFT ORDER
SIXTH FLOOR, 900 HOWE STREET, BOX 250 VANCOUVER, BC V6Z 2N3 CANADA
web site: http://www.bcuc.com
B R I T I S H CO LU M B I A
UT I L I T I E S CO M M I S S I O N OR D E R NU M B E R
TELEPHONE: (604) 660-4700
BC TOLL FREE: 1-800-663-1385 FACSIMILE: (604) 660-1102
DRAFT ORDER
IN THE MATTER OF
the Utilities Commission Act, R.S.B.C. 1996, Chapter 473
and
An Application by FortisBC Energy Inc. for Approval of a Capital Expenditure Schedule and Rate Design and Rates Established in an Operating and Maintenance Agreement between FortisBC Energy Inc. and the Strata Corporation of Tsawwassen Springs
Development to Provide Thermal Energy Services (“TES”)
BEFORE:
(Date)
WHEREAS:
A. On March 1, 2012, FortisBC Energy Inc. (FEI) filed an application (Application) with the British Columbia Utilities Commission (Commission) for Approval of a Capital Expenditure Schedule and Rate Design and Rates Established in an Operating and Maintenance Agreement (Service Agreement) between FEI and the Strata Corporation of Tsawwassen Springs Development to provide Thermal Energy Services (TES);
B. FEI filed Appendices A and B to the Application confidentially;
C. In the Application, FEI seeks acceptance of capital expenditures, pursuant to section 44.2 of the Utilities Commission Act (Act), of $1.184 million for the Loop Field System component of the Ground Source Heat Pump System;
D. FEI also seeks approval, pursuant to sections 59-61 of the Act and Commission Order No. G-141-09, of the rate design and rates established by the Service Agreement filed with this Application as just and reasonable rates under sections 59-61 of the Act;
E. The Commission has reviewed the Application and concludes that the requests as outlined in the Application should be approved.
2
BRITI SH COLUM BI A
UTIL I T IE S COMMI SSIO N OR DER NUMBER
NOW THEREFORE pursuant to Sections 44.2 and 59-61 of the Utilities Commission Act, the Commission orders as follows:
1. Pursuant to section 44.2 of the Act, the capital expenditures estimated at $1.184 million for the Loop Field Systems at Tsawwassen Springs Development as described in section 2.5.1 the Application are accepted.
2. Pursuant to sections 59-61 of the Act, the rate design and rates established in the Service Agreement, filed as Appendix A with the Application, and described in section 2.3.1 of the Application, are approved.
3. FEI is to file, by [MONTH] of each year, a forecast of the Tsawwassen Springs Development cost of service, and the revenue (the “Rate”) for the upcoming contract year, which runs from July to June.
DATED at the City of Vancouver, In the Province of British Columbia, this day of <MONTH>, 2012.
BY ORDER