Embed Size (px)
Citation preview

A Designed-Based Learning Math Curriculum for Middle School Education
Part II
Math City Project
By
Sharon Soto
6th Grade Math

Table of Contents
2
Title Page ………………………………………………………………………………………………... 1
Introduction ……………………………………………………………………………………………... 4
Purpose of the Math City Project ……………………………………………………………………….. 5
Comparing Backwards Thinking™ and Traditional Design Process ……………………………………. 6
Backwards Thinking™ -- 6 ½ Steps Process in Math City Project ............................................................. 7
Backwards Thinking™ ................................................................................................................................ 8
Backwards Thinking™ -- Steps 4, 5, and 6 ……………………………………………………………… 9
The Story of Math City ………………………………………………………………………………….. 10
Long-Range Planning Boards …………………………………………………………………………… 12
2-D Stylized Portrait of the Challenges Sequence ………………………………………………………. 14
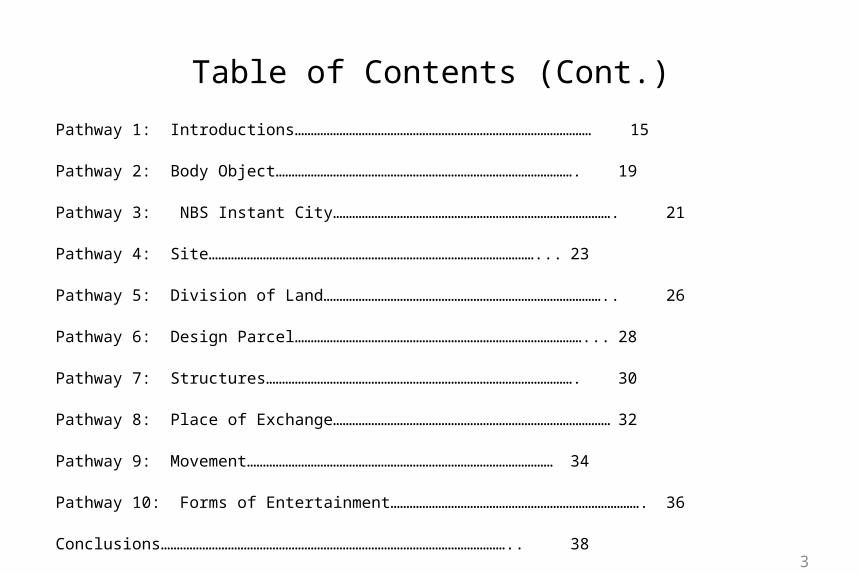
Table of Contents (Cont.)
Pathway 1: Introductions………………………………………………………………………………… 15
Pathway 2: Body Object…………………………………………………………………………………. 19
Pathway 3: NBS Instant City……………………………………………………………………………. 21
Pathway 4: Site…………………………………………………………………………………………... 23
Pathway 5: Division of Land…………………………………………………………………………….. 26
Pathway 6: Design Parcel………………………………………………………………………………... 28
Pathway 7: Structures……………………………………………………………………………………. 30
Pathway 8: Place of Exchange…………………………………………………………………………… 32
Pathway 9: Movement…………………………………………………………………………………… 34
Pathway 10: Forms of Entertainment……………………………………………………………………. 36
Conclusions……………………………………………………………………………………………….. 383

IntroductionI Believe Math Classes Should…
• Train students to be self-sufficient
• Increase higher level thinking skills
• Improve communication skills
• Train students to become better problem solvers and
problem seekers
• Inspire creative thinking and originality
• Develop proficient computational skills
• Develop an understanding of mathematical concepts
• Make connections from classroom work to the real world
• Incorporate the mathematics state standards
• Develop team work skills
4
Suzanne Middle School
I, Sharon Soto, am a 6th grade math teacher at Suzanne Middle School in the Walnut Valley Unified School District in Walnut, California. Classes are a heterogeneous grouping of students that may include RSP (Resource Specialist Program), SDC (Special Day Class), ELL (English Language Learners), or GATE.
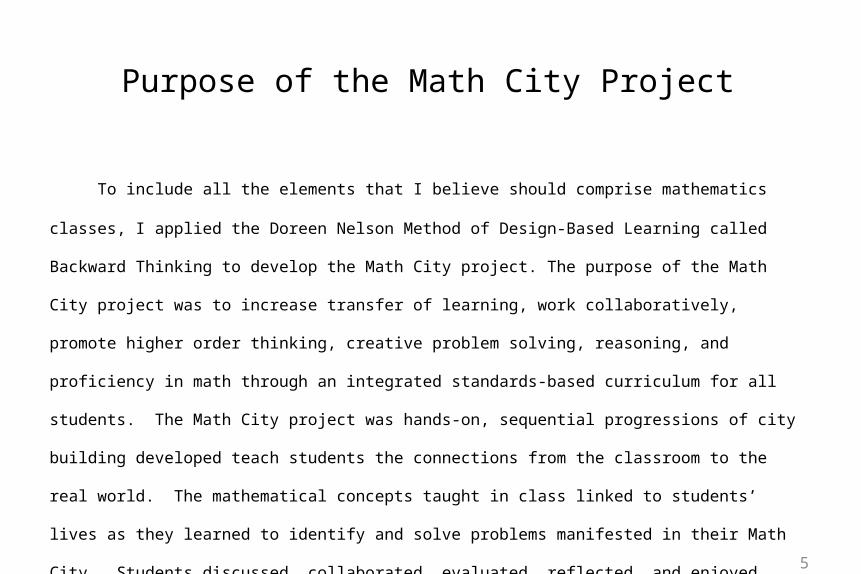
Purpose of the Math City Project
To include all the elements that I believe should comprise mathematics classes, I applied the Doreen
Nelson Method of Design-Based Learning called Backward Thinking to develop the Math City project. The purpose
of the Math City project was to increase transfer of learning, work collaboratively, promote higher order thinking,
creative problem solving, reasoning, and proficiency in math through an integrated standards-based curriculum for all
students. The Math City project was hands-on, sequential progressions of city building developed teach students the
connections from the classroom to the real world. The mathematical concepts taught in class linked to students’ lives
as they learned to identify and solve problems manifested in their Math City. Students discussed, collaborated,
evaluated, reflected, and enjoyed working on the Math City project: a designed-based mathematics curriculum for
middle school education that was unified through a physical and psychological vehicle, the Story of Math City.
5

Comparing Backwards Thinking™ and Traditional Design Process
Backwards Thinking ™ is a 6 ½ step process
1. Identify the theme, concept , or standard to teach
2. Identify the problem from the curriculum
½ State a Never-Before-Seen design challenge that results in a 3-D model to resolve the problem
3. Students talk to each other about the challenge, the teacher monitors and asks questions, and students build their 3-D model
4. Set criteria for assessment that correlates to the chosen theme, concept, or standard
5. Students present their model with their results, then teacher presents the guided lessons
6. Students assess and synthesize what they learned, then make necessary revisions
Traditional Design Process: Frontwards is a 7 step process
1. Identify and define problem
2. Gather and analyze information
3. Determine performance criteria for successful solutions
4. Generate alternative solutions and build prototypes
5. Evaluate and select appropriate solutions
6. Implement choices
7. Evaluate outcomes
6
Similarities between Backwards Thinking ™ and Traditional Design Process
1. Collaborative work 2. Building objects or products
1. Traditional is used to train designers2. Backwards gives it a try before gathering information to promote originality.3. Backwards develops required skills 4. Contextual learning in Backwards
Differences between Backwards Thinking ™ and Traditional Design Process

4 3
5
2
1
1/2
What Do I Need to Teach?
Identify a Problem
State as a “Never-Before-Seen”
Set Criteria for AssessmentLet Students
“Give It a Try”
Teach Guided Lessons
Students Revise Design
6 ½ Steps
Backwards Thinking™ - 6 ½ Steps Process in Math City ProjectStep 1: Identify the theme, concept, or standard to teach.
Example: Students deepened their understanding of the
measurement of plane and solid shapes and used this
understanding to solve problems.
Step 2: Identify the problem from the curriculum. Example:
Structures needed to be built for people to live and for places
of exchange.
Step ½: State a Never-Before-Seen design challenge that
results in a 3-D model to resolve the problem. Example:
Build structures to accommodate the residents, places of
exchange, and public spaces on their parcel.
7
6
The Backwards Thinking™ process emphasized the need to continually assess and improve the artifact through the circular design.
The Doreen Nelson Method of Design-Based Learning Backwards Thinking Process™ Chart

Backwards Thinking™• Don’t Want and Needs were the check off lists for the
students. The criteria list introduced vocabulary.
• For example, ABS means already-before-seen and NBS
means Never-Before-Seen. This is to promote
originality.
• Students were given points for each item that was done
correctly. For example: In the Structure Challenge the
type of structure was a tall rectangular prism because
there was not much land to support the number of
people in the city.
• The items on the list led to the guided lessons from the
curriculum.
8
Don’t Want Needs
ABS NBS
2-D 3-D
Spend a lot ofMoney
Functional – reason forthe type of structure
Quantity and size ofstructures must be
reasonable forthe population
Criteria List for Structure Design
Step 3: Set criteria for assessment that correlated to the chosen
theme, concept, or standard.
Example: Find the area of each structure and number of people
that fit in each structure.
Do not want was in red for “stop,” do not put it in; and green was for “go,” meaning go ahead and use it

Backwards Thinking™ – Steps 4, 5, and 6
9
Step 4: Students talked to each other about the
challenge, the teacher monitored and asked questions,
and students built their 3-D model.
Step 5: Students presented their 3-D model with their
results, then the teacher presented the guided lesson and
the students wrote about their discoveries.
Step 6: Students assessed and synthesized what they
learned, then made the necessary revisions.Students made a 2-D net (flat diagram that was like a flat gift box that folds into the box) that was folded into a 3-D solid to represent their structures.
The Story of Math City
At the beginning of the school year the students did not know each other or Design-Based Learning (DBL). My Math
City project for the year sequenced ten pathways which became progressively more complex to provide an integrated
curriculum by combining strands for the mathematics standards. Each pathway had a challenge followed by guided
lessons. First, students made objects to introduce themselves to each other and to classify objects by finding common
factors. Then, they dressed up as the objects to learn another way of knowing about each other and to learn scale.
After they got to know each other, they needed a place to live. They built an Instant City to learn that buildings should
be in proportion to the population and their needs. Then, they chose a parcel of land from a real location. They assessed
the way the land is used and ways to improve it. They supported their decisions based on their mathematical
computations.
10

The Story of Math City (Cont.)
Next, they built structures for shelter, work, and social or cultural functions, using measurement and
proportion. They needed to work in order to support themselves, so they used percentages and algebraic
equations to design a Place of Exchange for commerce.
They discovered they needed a way to go from one place to another. Studying the use of rates and
distances they made a new way of Movement. Once commerce, living areas, and Places of Exchange were
made , they had time to relax with family and friends so they made NBS Entertainment using probability and
statistics to determine if the game was fair.
To commemorate their achievements for prosperity, they built a NBS Time Capsule that contained a
review and assessment of the year’s mathematics concepts learned within the context of the Math Story.
11

The Long-Range Planning Boards I made the Long-Range Planning Boards to display my integrated
standards-based mathematics curriculum for a school year and
sequenced each month as a pathway. Each pathway presented a
problem for students to solve by completing a challenge, using set
criteria as a guideline. The pathways were connected or held together
by The Story of Math City. Each pathway had guided lessons.
The ten boards provided a visual representation of the required
guided lessons and standards that were taught throughout the year. I
showed this to parents, administrators, teachers, and the students. I
found that the boards served as a reference for all to perceive the
standards, lessons, and increasing level of difficulty as the project
progressed.
12
The legend that displayed the strands of math is to the left. The strands of math are displayed underneath the challenges in large rectangles coded by color (yellow - Number Sense, pink - Algebra and Functions, purple -Math Reasoning, blue - Measurement and Geometry, and green - Statistics, Data Analysis and Probability). Each rectangle contained the guided lesson(s) on top and the standards underneath. On the right displayed the tenth month of guided lessons with the standards that were taught. The gold rhombus on the top row were the challenges designed for the students.

13
The Long-Range Planning Boards (Cont.)
The photograph of the Long-Range Planning Boards above displays a standards-based integrated mathematics curriculum for one school year. The ten boards contained mathematics curriculum to promote higher level thinking skills, increase both reasoning skills and creative problem solving, enhance collaborative working skills, in a hands-on sequential progression within the context of the Math City project. The legend attached to the first board on the left displayed the strands, or the different branches, of math. The strands were color-coded: yellow – number sense, pink – algebra and functions, purple – math reasoning, blue – measurement and geometry, and green – statistics, data analysis and probability. Each month was represented by one board. The pathways were connected by The Story of Math City that made connections from the classroom to the real world. Each pathway presented a problem for students to solve by completing a challenge. The gold rhombuses on the top row contained the challenges designed for the students. Each rectangle contained the guided lessons on top in the larger font, with the standards underneath in the smaller font.
14
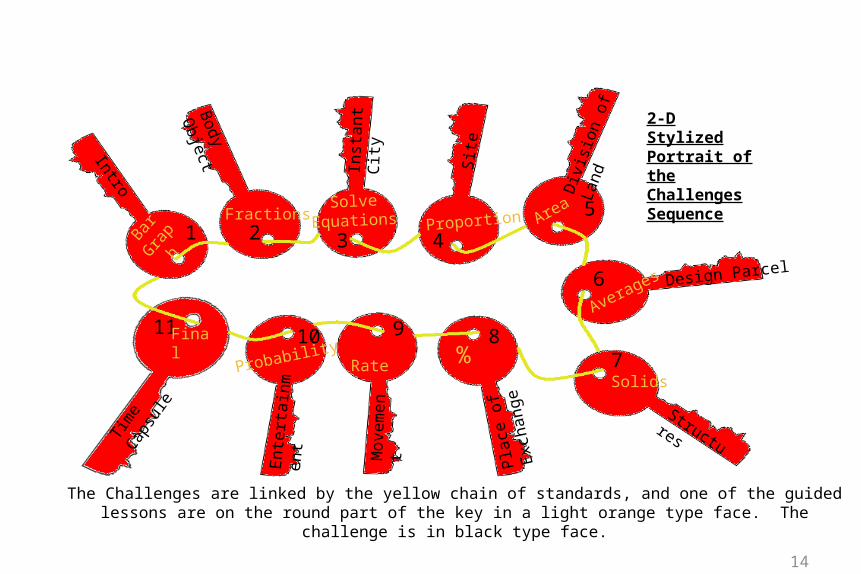
1 2 3 4
6
5
7891011
Intro Site
Body O
bject
Div
isio
n of
Lan
d
Design ParcelE
nter
tain
men
t
Inst
ant C
ity
Structures
Plac
e of
Exc
hang
e
Mov
emen
t
Tim
e Cap
sule
BarGra
ph
FractionsSolve
Equations Proportion Area
Averages
Solids
%RateProbabilityFinal
The Challenges are linked by the yellow chain of standards, and one of the guided lessons are on the round part of the key in a light orange type face. The challenge is in black type face.
2-D Stylized Portrait of the Challenges Sequence
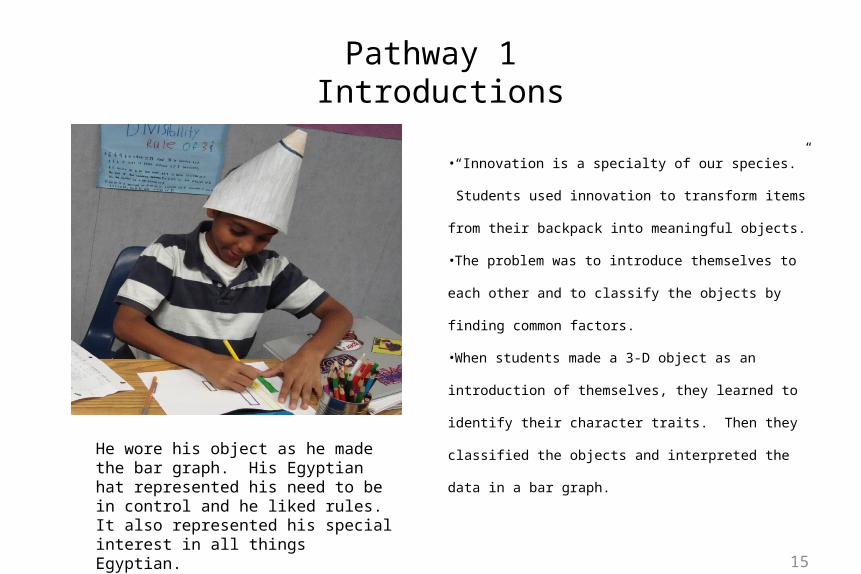
Pathway 1 Introductions
•“Innovation is a specialty of our species.” Students
used innovation to transform items from their backpack
into meaningful objects.
•The problem was to introduce themselves to each other
and to classify the objects by finding common factors.
•When students made a 3-D object as an introduction of
themselves, they learned to identify their character
traits. Then they classified the objects and interpreted
the data in a bar graph.
15
He wore his object as he made the bar graph. His Egyptian hat represented his need to be in control and he liked rules. It also represented his special interest in all things Egyptian.

Pathway 1 (Cont.)
The NBS Intro Challenge in both years, 2008 and 2009,
was met with enthusiasm by the Math 7 and Basic Math
students. A few students did not believe it related to
math and thought they were getting some free time. I
learned from 2008 the importance of making a clear
deadline to finish building the object. In 2008, a whole
period was needed to build the object. In 2009, the
time limit was 30 minutes. Although I worried that their
objects would not be as well done or thought through
since they had less time to build, they tied in their
objects to the criteria list better in 2009 than 2008.
16
He created a messy notebook to show that he is messy and disorganized. “Yeah, sometimes stuff kinda gets lost.”Two weeks later he showed me his binder because it was well-organized with dividers.
Pathway 1 (Cont.)
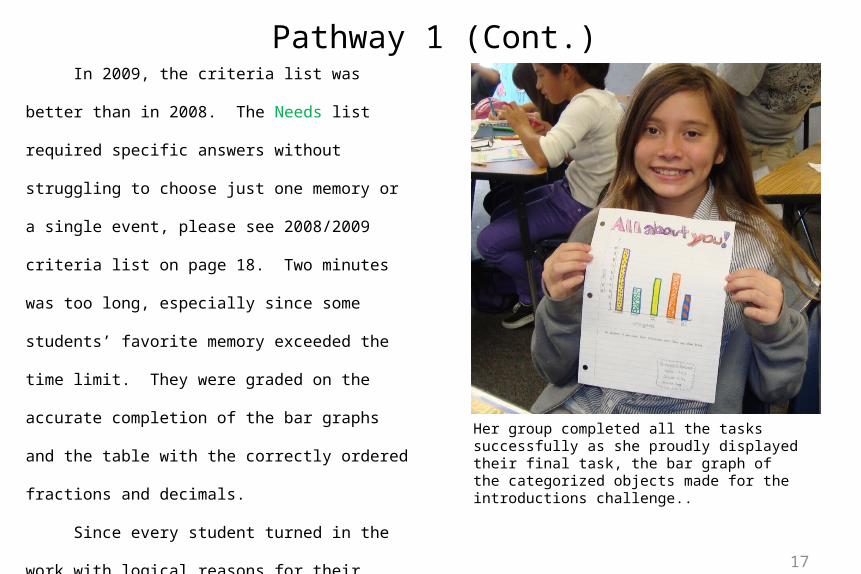
Her group completed all the tasks successfully as she proudly displayed their final task, the bar graph of the categorized objects made for the introductions challenge..
17
In 2009, the criteria list was better than in 2008. The
Needs list required specific answers without struggling to
choose just one memory or a single event, please see
2008/2009 criteria list on page 18. Two minutes was too
long, especially since some students’ favorite memory
exceeded the time limit. They were graded on the accurate
completion of the bar graphs and the table with the correctly
ordered fractions and decimals.
Since every student turned in the work with logical
reasons for their categorization choices, I considered this a
successful design challenge. Despite the improved criteria
list, next time I do this challenge a time limit will be placed
in the needs column of less than one minute.

Pathway 1: Criteria Lists
Don’t Want Needs
ABS NBS
2-D 3-D
Less than one minute Name
Objects made from items in their backpack (exceptions
were tape and scissors)
Relative—people living with them
Hobby, sport, special interest
Favorite TV show, movie, actress, actor, book, song
Character trait that you are most important or most
proud
18
Don’t want Needs
Embarrassed Full name
More than 2 minutes NBS
Objects made from
items in their
backpack
Hobby/sport
An important event in
their life
Favorite memory
Criteria List for 2008-2009 Criteria List for 2009-2010
The criteria list became more dense in the 2009-2010 year. The teacher learned to make the needs list more specific to guide the students’ thought process faster.

Pathway 2 Body Object
•“We construct our own realities, and we can reshape
them.” Students enlarged an object that represented
them.
•The problem was to learn scale.
•When students made the Body Object they learned to
enlarge their small object, then they calculated scale by
using proportions.
19
Student measured the enlarged object and learned about scale. The student recorded the measurement in centimeters, converted centimeters to inches, and then converted inches to feet.

Pathway 2 (Cont.)
In 2008, the Basic Math students got into the spirit of
this one. Someone delivering papers to the classroom
wanted to know why he was not invited to the costume
party and a student was quick to reply, “Hey, this is no
costume, but who we are.” The student’s instant
response was significant since it indicated the student’s
role-playing involvement. There was a lot of good
dialogue. For instance a student applied estimation and
then measured to get the actual measurement, “Well, if
I’m this tall and minus my head and below the knees,
it’s probably 3 feet.”
20
The displayed curriculum integration chart organized the standards, in yellow boxes; the guided lessons, in orange boxes; and the challenge in the red triangle. For example, the first yellow box has the Number Sense 1.2 standard that is to interpret and use ratios in different contexts. One guided lesson had the students identify the category of the objects then write a ratio. Another way ratios were used involved the measurement of the object itself and the enlarged object to find the scale.
1.4 Number Sense Students calculate given
% of quantities
1.2 Number Sense Interpret and use ratios in different
contexts
1.0 Measurement and Geometry
Students deepen their understanding of the
measurement of plane and solid shapes
2.1 Algebra and Functions Convert one unit of
measurement to another
1.1 Number Sense Compare and order
positive and negative fractions, decimals, and mixed numbers and place them on a
number line
After finding the ratio for body objects’ shapes, calculate the %
Set up ratios according to different groupings
Measure and identify body
objects’ shapes
Inches to feet
Centimeters to inches
Body objects groups (ratios
for object shapes) placed in order from
least to greatest
Design-Based Learning Curriculum Integration ChartDoreen Nelson
POWERFUL IDEA
Standards
GuidedLessons
Design ChallengeNever Before Seen…
Body Object

Pathway 3NBS Instant City
• “What we want is often not what we need.” The
students had to restructure their city to
accommodate the population by making their
community center or parks smaller so more living
areas could be built.
• The problem was to identify places and spaces in
the built environment, the Instant City.
• When students built an Instant City, they learned
to identify the various solids that made up their
model, then they categorized these solids and
calculated the area of the solids that represented
different types of structures for commerce, living
area, and public space. 21
The buildings were connected with a roadway on the rooftops to eliminate car traffic on the ground. The city was composed of a huge mall, businesses, and open space with a lake. During this group’s presentation, another student pointed out the scarcity of living areas. The students who made this city, did some quick thinking and said people commuted from other areas. Another student pointed out that there were no apparent means of transportation into their city. The group conceded revisions were needed.
Pathway 3 (Cont.)
Don’t Want Needs
ABS NBS
Spend a lot of money Homes (sugar cube or 1.5 cm x 1.5 cm holds 4
people)
Look like a real city Places to exchange
paint Place to build things like factories or industry
labels Way to go from place to place
Places to play
Tell how may people live in your city
15 in by 15 in cardboard for your city
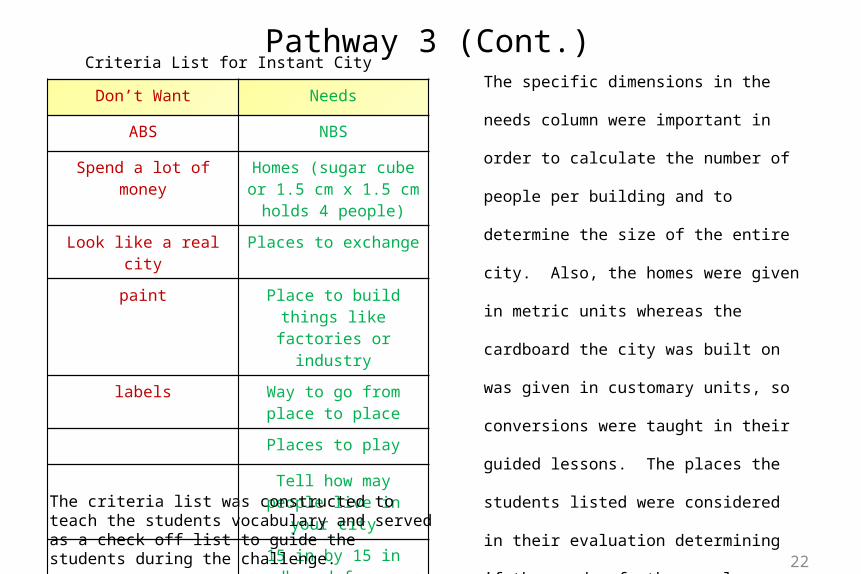
The specific dimensions in the needs column were
important in order to calculate the number of
people per building and to determine the size of
the entire city. Also, the homes were given in
metric units whereas the cardboard the city was
built on was given in customary units, so
conversions were taught in their guided lessons.
The places the students listed were considered in
their evaluation determining if the needs of the
people were met. For instance, based upon the
number of people living in the city, they decided if
there were enough work places.
22
Criteria List for Instant City
The criteria list was constructed to teach the students vocabulary and served as a check off list to guide the students during the challenge.
Pathway 4 Site
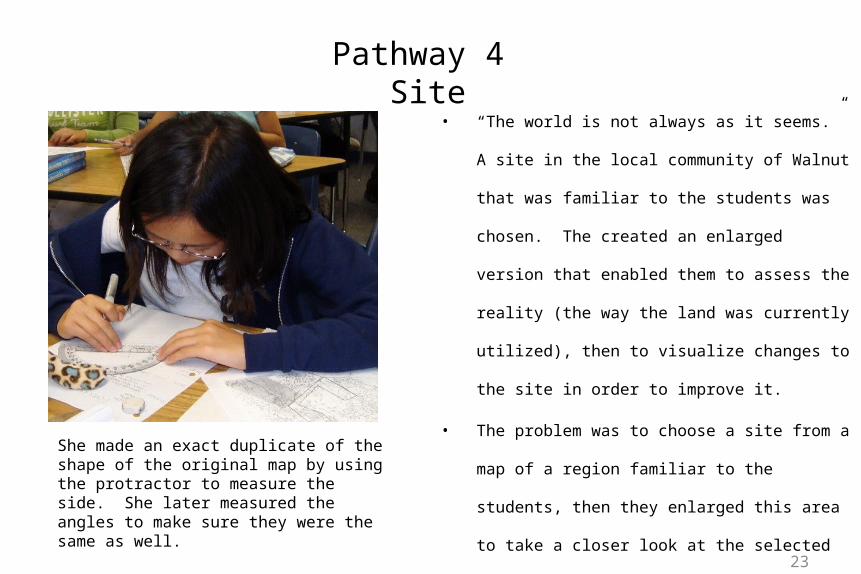
• “The world is not always as it seems.” A site in the local
community of Walnut that was familiar to the students was
chosen. The created an enlarged version that enabled
them to assess the reality (the way the land was currently
utilized), then to visualize changes to the site in order to
improve it.
• The problem was to choose a site from a map of a region
familiar to the students, then they enlarged this area to
take a closer look at the selected site.
• When the students selected a landsite, they learned to
identify differing parts of a map, then they reconstructed
the chosen site into a larger size in order to see the details.23
She made an exact duplicate of the shape of the original map by using the protractor to measure the side. She later measured the angles to make sure they were the same as well.

Pathway 4 (Cont.)
• Since protractors were not used before this project, reading
angles was taught. I drew angles on the overhead projector
and placed the protractor on the vertex of one angle and
lined it up correctly. By determining whether an angle was
acute or not, they could decide whether to use the inside
measurements or the outside measurements on the
protractor. We did the next two angle measure as a class.
Then, I asked them to draw a 65º angle and a 140º angle. I
put up the two angles and they did the neighbor check. Then
they worked collaboratively in their groups to complete their
challenge.
24
Don’t Want Needs
Regular polygons Irregular polygons
Scale
Compass
Legend (key)
Straight lines (use a ruler)
Accurate measurements
List of reasons the site was chosen
Enlarged site must cover most of the
butcher paper
Criteria List for Site
The criteria list provided the terminology from the standards and requirements needed for the guided lessons.
Pathway 4 (Cont.)
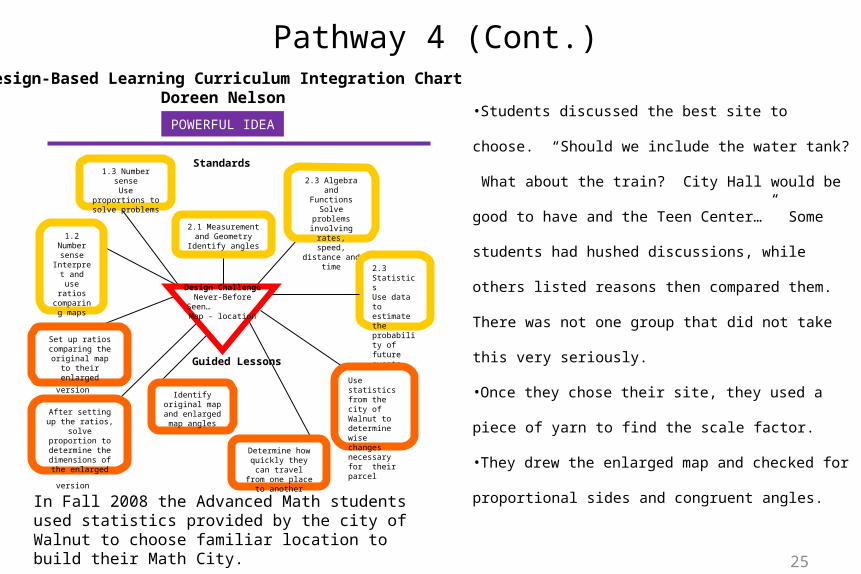
•Students discussed the best site to choose. “Should we
include the water tank? What about the train? City Hall
would be good to have and the Teen Center…” Some
students had hushed discussions, while others listed
reasons then compared them. There was not one group that
did not take this very seriously.
•Once they chose their site, they used a piece of yarn to
find the scale factor.
•They drew the enlarged map and checked for proportional
sides and congruent angles.
25
2.3 Algebra and Functions
Solve problems involving rates, speed, distance
and time1.2
Number sense
Interpret and use
ratios comparing
maps
1.3 Number senseUse proportions to
solve problems
2.1 Measurement and Geometry Identify angles
2.3 StatisticsUse data to estimate the probability of future events
Use statistics from the city of Walnut to determine wise changes necessary for their parcel
Set up ratios comparing the
original map to their enlarged version
After setting up the ratios, solve proportion to determine the
dimensions of the enlarged version
Identify original map and
enlarged map angles
Determine how quickly they can travel from one place to another
Standards
Design ChallengeNever-Before Seen…
Map - location
Guided Lessons
POWERFUL IDEA
Design-Based Learning Curriculum Integration ChartDoreen Nelson
In Fall 2008 the Advanced Math students used statistics provided by the city of Walnut to choose familiar location to build their Math City.
Pathway 5 Division of Land
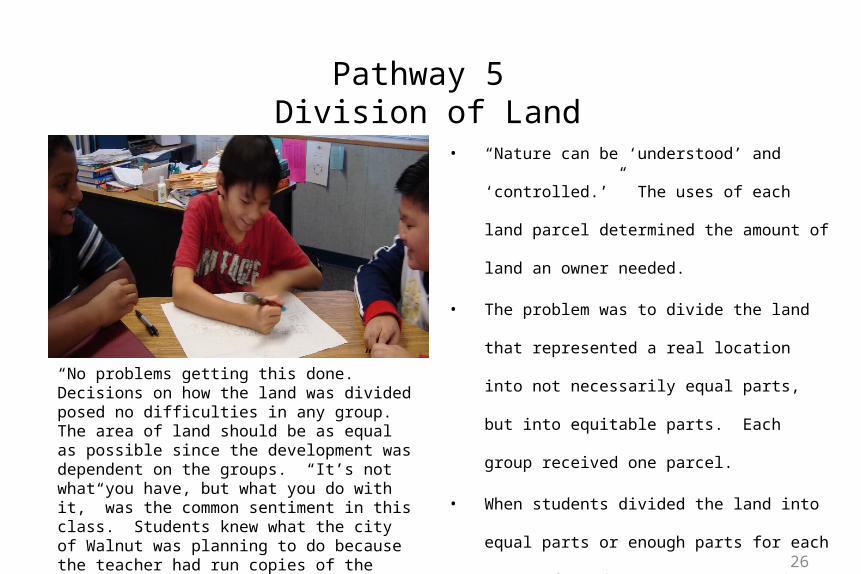
• “Nature can be ‘understood’ and ‘controlled.’” The
uses of each land parcel determined the amount of land
an owner needed.
• The problem was to divide the land that represented a
real location into not necessarily equal parts, but into
equitable parts. Each group received one parcel.
• When students divided the land into equal parts or
enough parts for each group of students to own a
section of land, they learned to recognize equitable
parcels. Then they justified the division of the land of
the site into parcels to be distributed.26
“No problems getting this done.” Decisions on how the land was divided posed no difficulties in any group. The area of land should be as equal as possible since the development was dependent on the groups. “It’s not what you have, but what you do with it,” was the common sentiment in this class. Students knew what the city of Walnut was planning to do because the teacher had run copies of the area that City Hall posted on the internet and distributed to them.
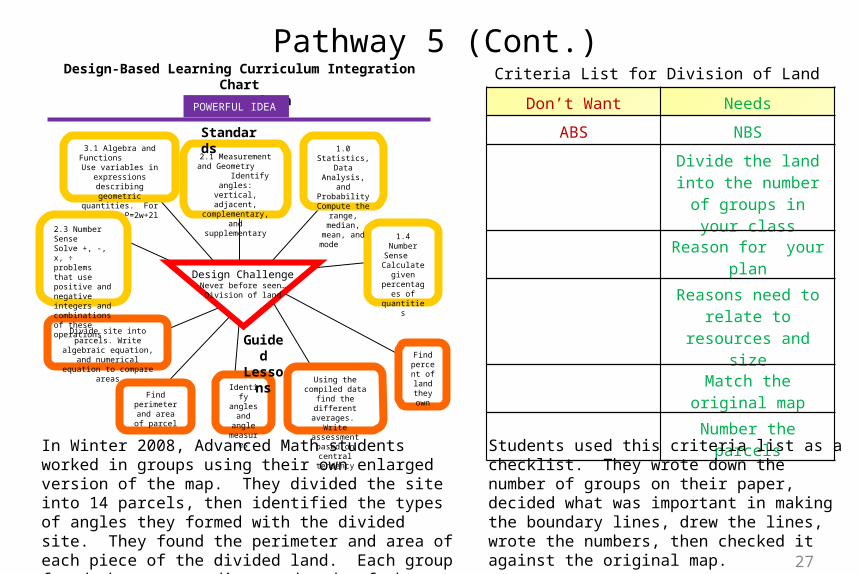
Pathway 5 (Cont.)Criteria List for Division of Land
27
In Winter 2008, Advanced Math students worked in groups using their own enlarged version of the map. They divided the site into 14 parcels, then identified the types of angles they formed with the divided site. They found the perimeter and area of each piece of the divided land. Each group found the mean, median, and mode of the data set composed of these areas.
Don’t Want Needs
ABS NBS
Divide the land into the number of groups in
your class
Reason for your plan
Reasons need to relate to resources and size
Match the original map
Number the parcels
Students used this criteria list as a checklist. They wrote down the number of groups on their paper, decided what was important in making the boundary lines, drew the lines, wrote the numbers, then checked it against the original map.
Design-Based Learning Curriculum Integration ChartDoreen Nelson
POWERFUL IDEA
2.1 Measurement and Geometry Identify angles:
vertical, adjacent, complementary, and
supplementary
1.4 Number Sense
Calculate given
percentages of quantities
Find percent of land
they own
Divide site into parcels. Write algebraic equation, and numerical equation to
compare areas
Find perimeter and area of
parcel
Identify angles
and angle measures
Using the compiled data find the different
averages. Write assessment based on
central tendency
1.0 Statistics, Data Analysis, and Probability
Compute the range, median,
mean, and mode
3.1 Algebra and Functions Use variables in
expressions describing geometric quantities. For
example, P=2w+2l
2.3 Number Sense Solve +, -, x, ÷ problems that use positive and negative integers and combinations of these operations
Design ChallengeNever before seen…
Division of land
Standards
GuidedLessons

Pathway 6Design Parcel
• “ We construct our own realities and we can reshape
them.” Students reshaped their own land parcel to
improve the value of their land.
• The problem was to determine how to restructure the
land development to increase its value.
• When students built on a land parcel in a real location,
they learned to select the amount of area needed for
buildings and open spaces. Then, they supported their
decisions based on their mathematical computations.
28
He enlarged his parcel. His partner measured the angles and sides on the divided parcel paper (before it was cut). The site was divided into parcels, the parcels have been distributed, and the class has compiled the criteria list. The first step was to enlarge the parcel they got onto a piece of butcher paper. Then, they referred back to the original map that guided them on the decisions of where they placed things.
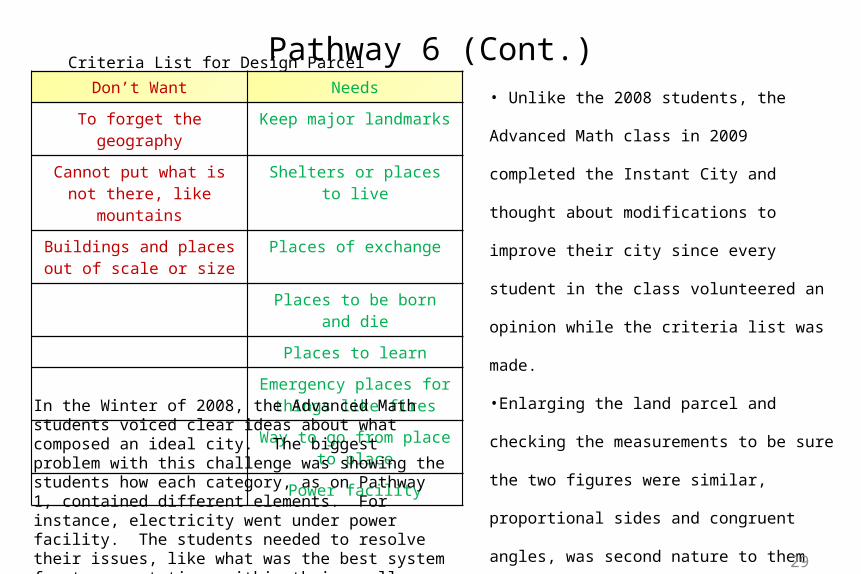
Pathway 6 (Cont.)• Unlike the 2008 students, the Advanced Math class
in 2009 completed the Instant City and thought about
modifications to improve their city since every
student in the class volunteered an opinion while the
criteria list was made.
•Enlarging the land parcel and checking the
measurements to be sure the two figures were similar,
proportional sides and congruent angles, was second
nature to them now.
•Discussions regarding size and location of the places
took an entire 50 minute period. Students were
already talking about the shapes of the structures.
29
Criteria List for Design Parcel
Don’t Want Needs
To forget the geography Keep major landmarks
Cannot put what is not there, like mountains
Shelters or places to live
Buildings and places out of scale or size
Places of exchange
Places to be born and die
Places to learn
Emergency places for things like fires
Way to go from place to place
Power facility
In the Winter of 2008, the Advanced Math students voiced clear ideas about what composed an ideal city. The biggest problem with this challenge was showing the students how each category, as on Pathway 1, contained different elements. For instance, electricity went under power facility. The students needed to resolve their issues, like what was the best system for transportation, within their smaller groups.

Pathway 7Structures
• “There are many paths to the good stuff.” Structures did not
need to have conventional designs. There were many ways (or
paths) to make structures become more functional and
aesthetically pleasing for a future lifestyle.
• The problem was to make structures for the building types on
their land parcels.
• When students built structures that became a building type
such as a cylinder with a half sphere dome for a government
building, they learned to identify solids. Then they calculated
surface area and volume to justify the size of the structure for
its function.
30
He had trouble folding his net, but was helped by his partner.
He combined two polyhedrons for hisstructure. His partner chose the pyramid for his structure. He said it was going to be a themed building.
Sample nets, 2-D paper that can be folded to form a polyhedron, were passed out to the groups . They learned how to make their own nets to form polyhedrons that were combined to form NBS structures.

Pathway 7 (Cont.)
Don’ Want Needs
Spend a lot of money
3-D
Only one type of polyhedron
NBS
Combine at least two polyhedrons to make a structure
Place the structures on their design parcel where the allocated areas were
specified on their paper
Nets must be drawn, folded to make the polyhedron, then combined to
create the structure
Structures must have something drawn on it to indicate the structure’s
function
31
The group designed a sports building without a floor. Instead, there was turf or grass on the ground stadium seats for the audience. The designer glued the structure directly to the blueprint, butcher paper, and said he hoped it wouldn’t come down. Of course, it did. They learned making a good foundation for a structure was important and included tabs the next time to brace it.
Criteria List for Structures
In 2009, the Advanced Math students already discussed structure design, but simply making the nets then turning them into their structures took two entire class periods of fifty minutes.

Pathway 8Place of Exchange
• “We shape intermediaries and then they reshape
us.” Students will determine NBS goods or
services that were valuable to consumers.
• The problem was to construct a place to exchange
goods or services.
• When students built a place of exchange, they
learned to identify the value of goods or services
and the costs involved. Then, they justified the
success of the place based on their mathematical
computation.
32
The student said the cost of painting was higher because it required premium paint due to the state of the art structure design, but the cost was offset by using solar energy. The rooftops of the structures were solar panels. The clothing store created huge demands, but unfortunately the place of exchange did not have enough parking spaces to accommodate all customers. Online shopping was a solution, but other alternatives like a sky rise or an underground parking structure were considered. The student realized he needed a unique solution to commute to the place of exchange. A list explaining the functions of all the structures and the goods or services provided was made with a cost breakdown.

Pathway 8 (Cont.)
Don’t Want Needs
Spend a lot of money NBS
Rushed look (neatness and detail count)
3-D
15 inch by 15 inch cardboard to represent
land for place of exchange
Products and or services with an estimated cost to produce or give service
Attract customers
Projected number of customers based on
population
Way to go from place to place
• Place of Exchange was completed once in 2009 with
an Advanced Math class. Retail costs of products and
services were discussed before students worked in
their groups. The class was told that for convenience
sake the wholesale price was 30% less than the price
cited on the list of retail prices of products. For
services, $8.00 per hour was used for minimum wage.
• After the groups decided on products and services
needed for the city, the cost and profit sheets were
drawn up. Then the students designed their structures.
• Students enjoyed designing the place of exchange, but
formulas were used to calculate cost and profit.
33
Criteria List for Place of Exchange
The criteria list was developed to determine the economic structure for the place of exchange.

Pathway 9Movement
• “We shape intermediaries and then they reshape us.”
Humans invented the motor vehicle and the motor
vehicle shaped the way we live today. It also shaped
our lives environmentally (pollution), economically
(gas and manufacturing jobs), and politically (control
of oil). Students devised ways of going from place to
place to think about reshaping our lives for the better.
Students became environmentalists who envisioned a
future of movement that would be more healthy, in
other words more biking and walking, and alternative
power sources would be used.
• The problem came from the need to move people or
goods from one place to another in the newly
designed city. This fit into the math curriculum
because a movement object was made from
combining solids and analyzing how weight and
angles affected the performance of the movement
object.
• When students built a movement container, they
learned to recognize how the size and the shape of the
load affected movement, then they evaluated if the
movement container worked based on their
mathematical computations.34

Pathway 9 (Cont.)
Don’t Want Needs
Spend a lot of money NBS
Purchase kit 3-D
Legos, hot wheels, etc. Move goods or people from place to place
Must be able to move and stop
Movement must be controlled from start to
finish
35
There was a diversity of ideas. The top left was a bow-and-arrow type system to deliver messages. He and his partner took home their project because they needed to think of a way to control the distance the message was sent. On the top right, items to be moved would be placed inside the chutes and powered by wind . The bottom was a ramp-like structure to roll containers down to different cubicles inside a building. The pencils on the side were the guidance system.
Criteria List for Movement
The movement container took on many forms and the things being moved were different. Groups even met at home to experiment on their projects by changing the weight or the angle of the ramp to increase speed and control the direction or to redesign the look of the project. The criteria list was composed of the necessary elements needed for the guided lessons.

Pathway 10Forms of Entertainment
• As Mary Poppin’s says, “In every job that must be done
there is an element of fun.” Everyone has different
views of what was entertaining, but it took one’s
creativity to make work into a fun form of entertainment.
• All the necessary components for daily living were
completed so now they had time to relax, so the problem
was to create NBS Entertainment using probability and
statistics.
• When students made a form of entertainment, they
learned to identify if the form of entertainment was fair.
Then, they created a marketable form of entertainment
and assessed its profitability by using mathematical
computations. 36
Students worked math problems for four straight fifty minute periods and looked forward to doing them because they were part of their form of entertainment. They wrote directions for playing. They wrote math solutions, often using more than one method. Original word problems and more challenging problems were included to exercise the mind.

Pathway 10 (Cont.)
37
Students wrote a survey to decide what type of
entertainment was popular . After they analyzed their
data, they chose their form of entertainment for the
project. This was done to review frequency table and
central tendency.
The criteria was to create a form of entertainment that
would be profitable in their city. To make the form of
entertainment profitable, the students had to consider the
cost of the materials necessary to construct it. They
needed to find the surface area of their package to use the
least material possible. It had to be cost efficient and eco
friendly.
1.3 Measurement and Geometry Know and use the
formulas for volume and surface area
2.1 Number Sense solve problems involving addition, subtraction, multiplication, and division
• 1.1 Algebra and Functions write and solve one-step linear equations in one variable
3.1 Math Reasoning Evaluate the reasonableness of the solution in the context of the original situation
3.2 Statistics, Data Analysis, and
Probability Represent all
possible outcomes for compound events in an
organized way and express the
theoretical probability of each outcome
Decide if the form of entertainment is fair.
Solve problems that involve the marketing costs
Compute the cost to produce the form of entertainment
Decide which marketing method to use
Design a package for your form of entertainment that uses the least material possible
Design-Based Learning Curriculum Integration Chart Doreen Nelson
POWERFUL IDEA
Design ChallengeNever-Before Seen…
Form of Entertainment
Standards
Guided Lessons
Integrated all five strands into the final challenge.

Conclusions• Storing supplies and organizing the classroom was a
difficult task when I first began the Math City project. But as
I progressed with each project I was able to address these
matters and expand my teaching practice.
• I was able to add to my 2009/2010 NBS Introductions
pathway from my 2008/2009 school year. The students were
better organized and reached higher levels of thinking. They
tied the criteria list to their object and were able to categorize
their objects without the teachers assistance.
• When surveyed in 2010, 80% of the students said that
lecture and taking notes was a better way of learning for
them. In elementary school the teachers lectured and did note
taking with the students.
This was their first year in the Math City project. The
students may have chosen what they were familiar with
instead of the DBL method.
• In the Math City project the students simultaneously
learned creative problem solving and had fun integrating
math into the DBL projects. In the survey, 82% of the
students marked they learned from classmates and discovered
different ways to solve problems.
•The Math City project allowed the students to apply math to
their lives. Overall they enhanced their problem solving
skills and understanding of mathematics.
38