Embed Size (px)
Citation preview
A Differential Spectral
Responsivity Measuring System
for Solar Cell Calibration
Gan Xu and Xuebo Huang
National Metrology Centre
A*STAR Singapore
NEWRAD 2011, Maui, Hawaii
20 Sep 2011
1
Outlines
• Introduction
• Differential spectral responsivity (DSR)
• DSR measurement system at NMC
• Measurement result and uncertainty budget
• Summary
• Future works
• References
2
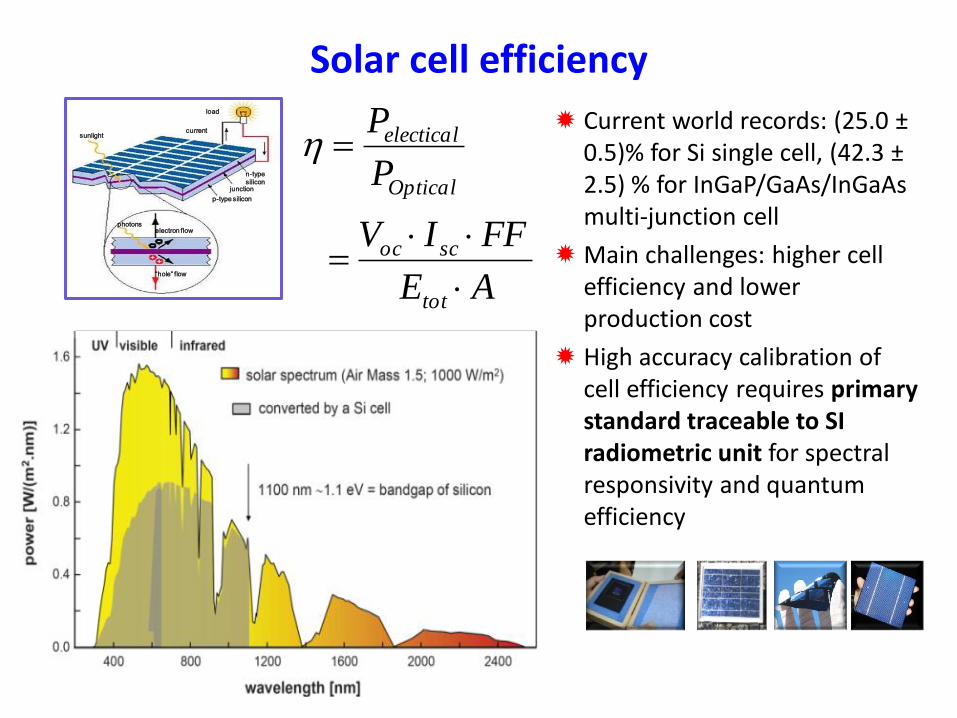
Solar cell efficiency
AE
FFIV
P
P
tot
scoc
Optical
electical
sunlight
load
current
n-type
silicon junction
p-type silicon
photons electron flow
“hole” flow
Current world records: (25.0 ± 0.5)% for Si single cell, (42.3 ± 2.5) % for InGaP/GaAs/InGaAs multi-junction cell
Main challenges: higher cell efficiency and lower production cost
High accuracy calibration of cell efficiency requires primary standard traceable to SI radiometric unit for spectral responsivity and quantum efficiency
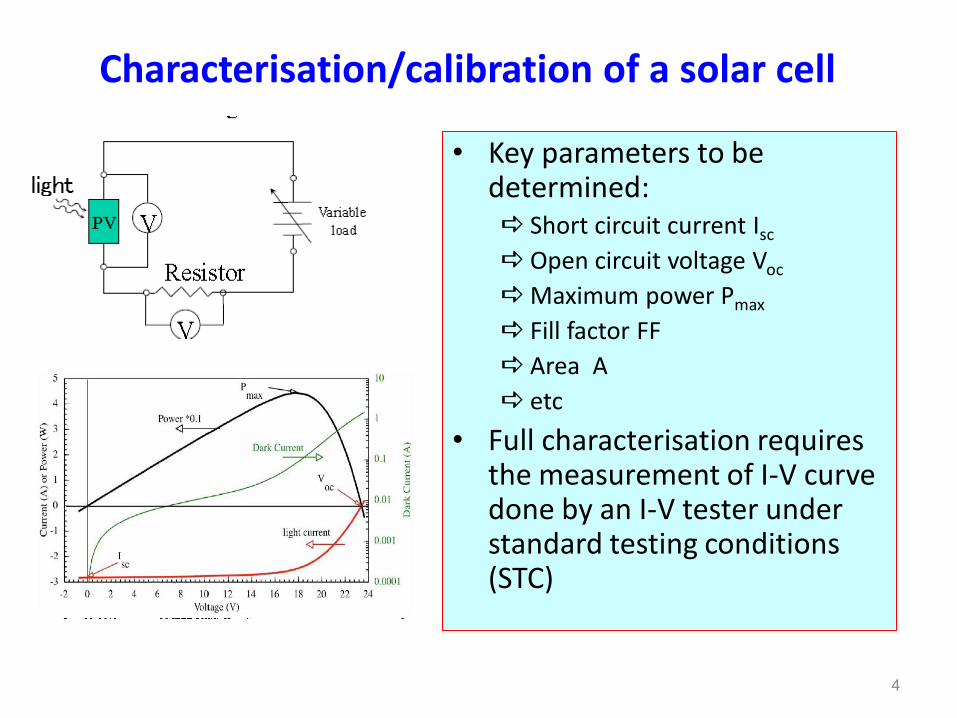
Characterisation/calibration of a solar cell
• Key parameters to be determined: Short circuit current Isc
Open circuit voltage Voc
Maximum power Pmax
Fill factor FF
Area A
etc
• Full characterisation requires the measurement of I-V curve done by an I-V tester under standard testing conditions (STC)
4
-2.00E-01
0.00E+00
2.00E-01
4.00E-01
6.00E-01
8.00E-01
1.00E+00
1.20E+00
1.40E+00
1.60E+00
1.80E+00
0.0 500.0 1000.0 1500.0 2000.0 2500.0 3000.0 3500.0 4000.0
Ref Solar Spectral Irradiance
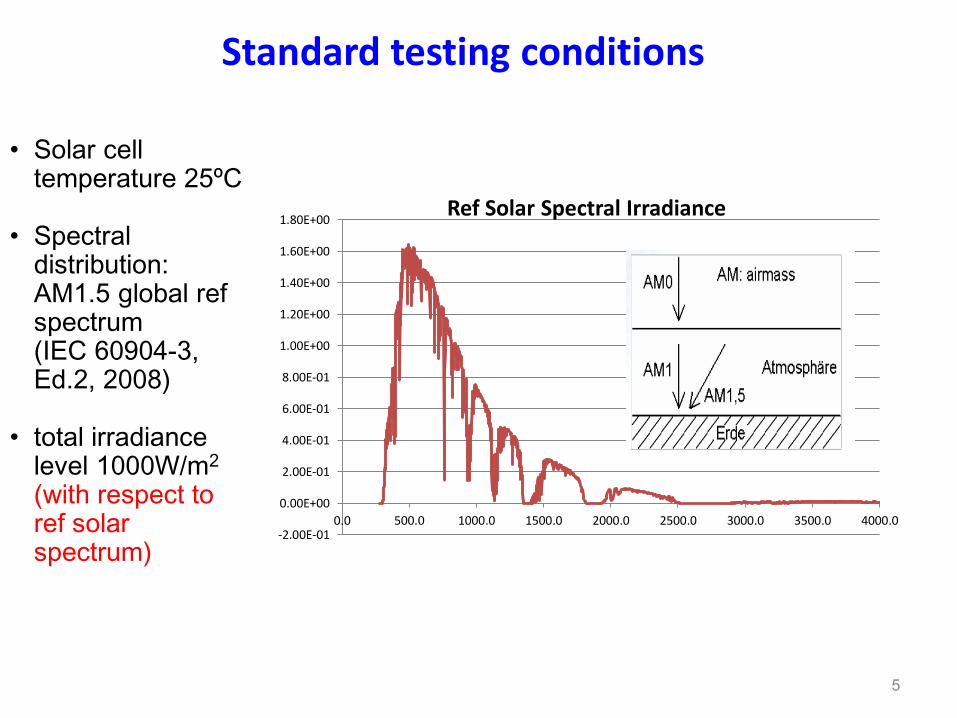
Standard testing conditions
5
• Solar cell temperature 25ºC
• Spectral
distribution: AM1.5 global ref spectrum (IEC 60904-3, Ed.2, 2008)
• total irradiance level 1000W/m2 (with respect to ref solar spectrum)
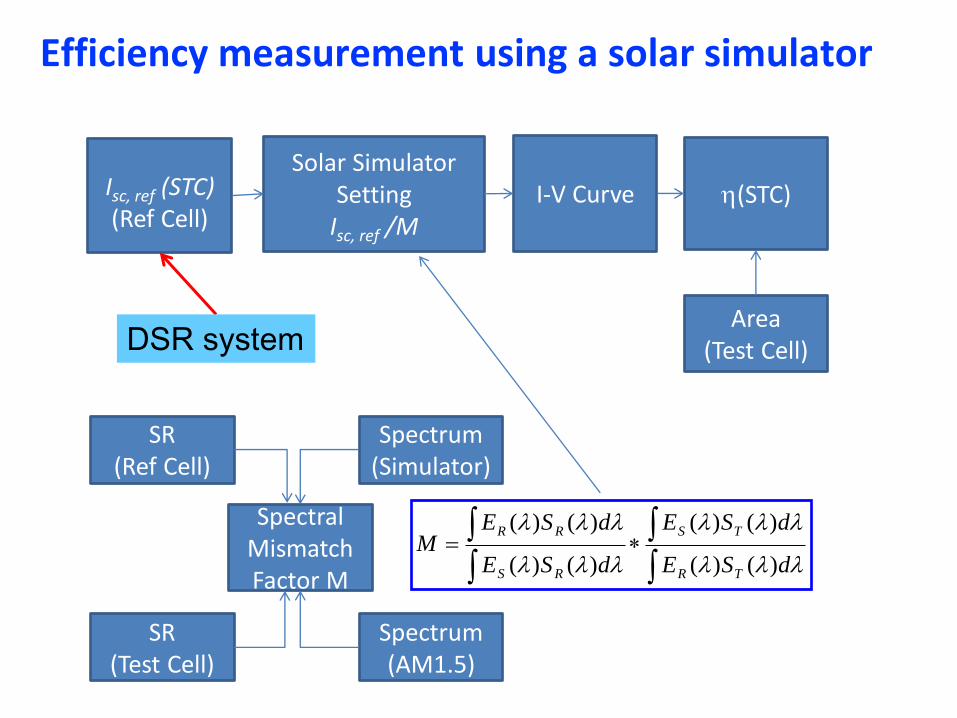
Efficiency measurement using a solar simulator
SR (Ref Cell)
SR (Test Cell)
Spectral Mismatch Factor M
Spectrum (AM1.5)
Spectrum (Simulator)
dSE
dSE
dSE
dSEM
TR
TS
RS
RR
)()(
)()(
)()(
)()(
Isc, ref (STC) (Ref Cell)
Solar Simulator
Setting Isc, ref /M
I-V Curve
Area (Test Cell)
(STC)
DSR system
Outlines
• Introduction
• Differential Spectral Responsivity (DSR)
• DSR Measurement System at NMC
• Measurement result and uncertainty budget
• Summary
• Future works
• References
7
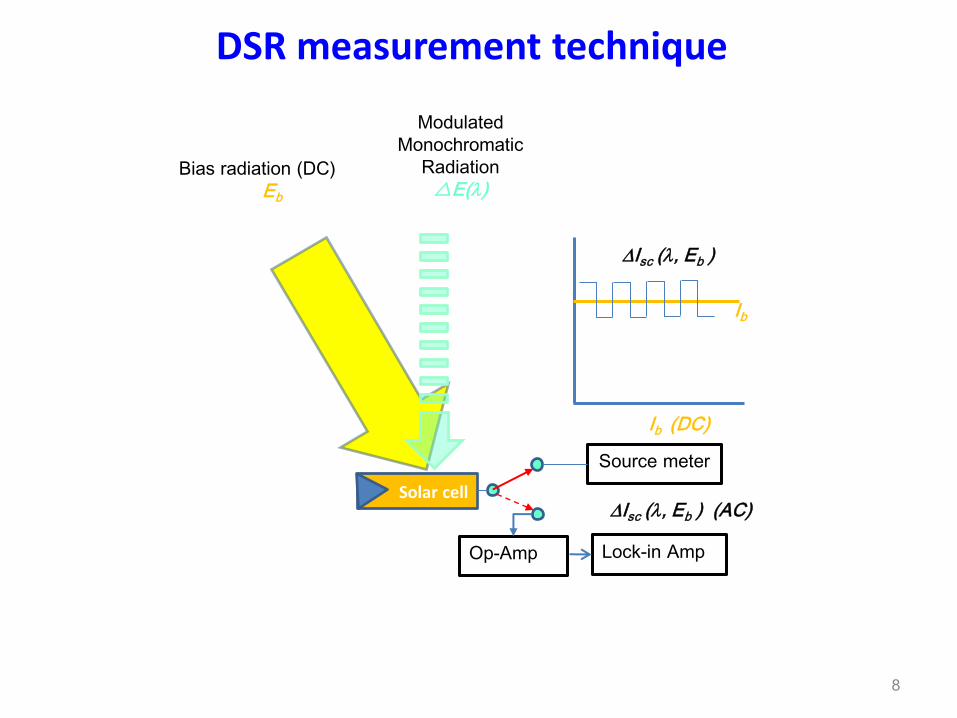
DSR measurement technique
8
Bias radiation (DC)
Eb
Modulated
Monochromatic
Radiation
E()
Solar cell
Ib
Isc (, Eb )
Op-Amp Lock-in Amp
Ib (DC)
Source meter
Isc (, Eb ) (AC)
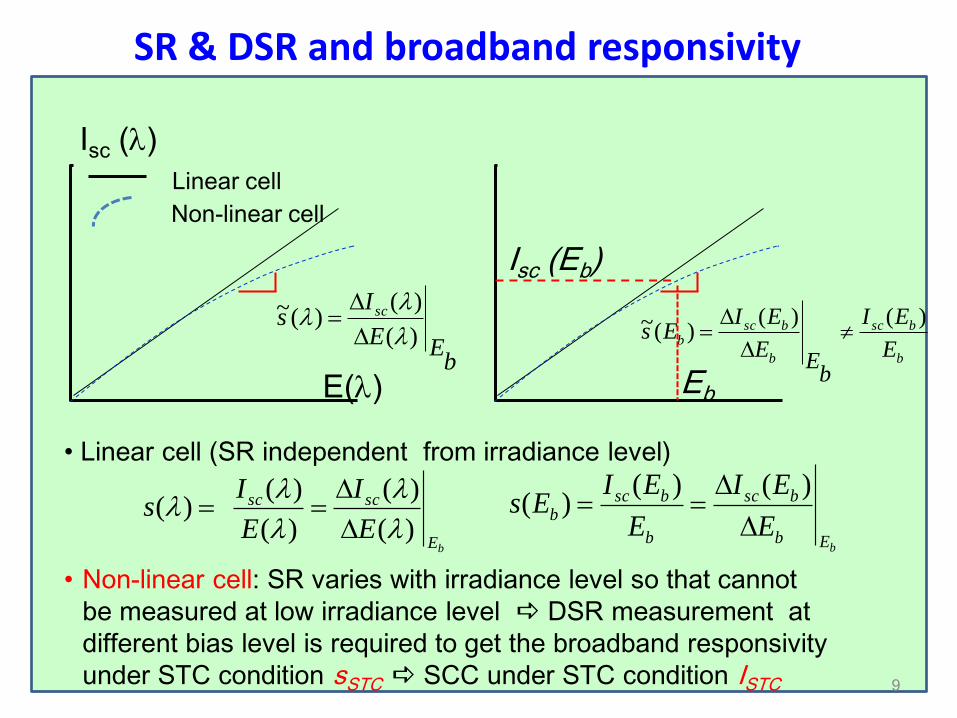
SR & DSR and broadband responsivity
9
bEE
Is sc
)(
)()(~
E()
Isc ()
Eb
Isc (Eb)
b
bsc
b
bscb
E
EI
bE
E
EIEs
)()()(~
Linear cell
Non-linear cell
• Linear cell (SR independent from irradiance level)
• Non-linear cell: SR varies with irradiance level so that cannot
be measured at low irradiance level DSR measurement at
different bias level is required to get the broadband responsivity
under STC condition sSTC SCC under STC condition ISTC
bE
scsc
E
I
E
Is
)(
)(
)(
)()(
bEb
bsc
b
bscb
E
EI
E
EIEs
)()()(
Copyright © 2008 All rights reserved
National Metrology Centre
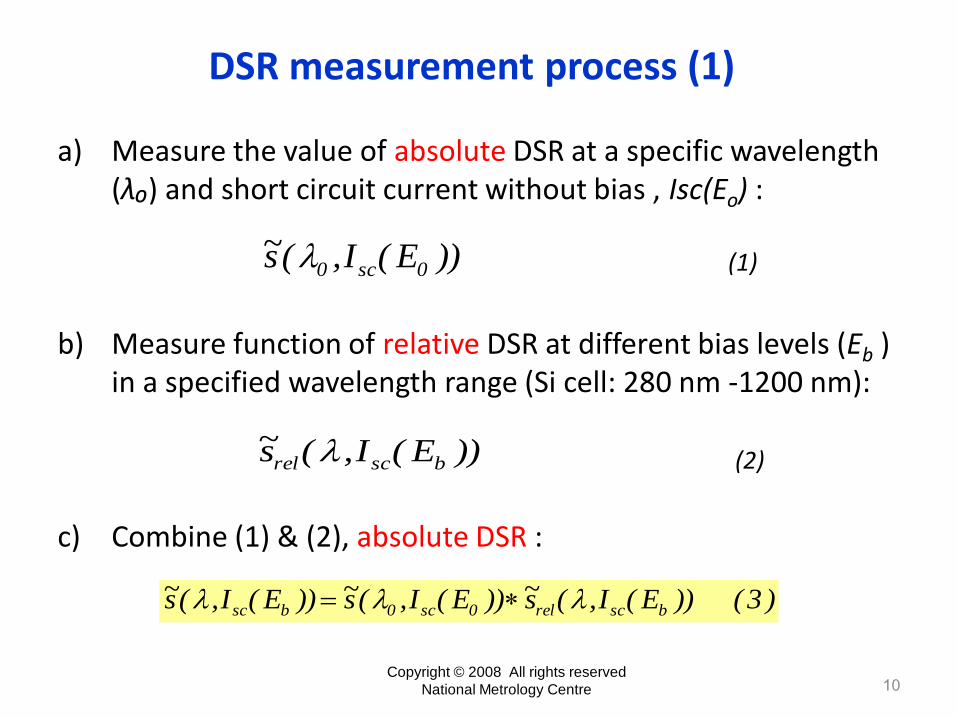
DSR measurement process (1)
a) Measure the value of absolute DSR at a specific wavelength (λ₀) and short circuit current without bias , Isc(Eo) :
(1)
b) Measure function of relative DSR at different bias levels (Eb ) in a specified wavelength range (Si cell: 280 nm -1200 nm):
(2)
c) Combine (1) & (2), absolute DSR :
10
)3())E(I,(s~))E(I,(s~))E(I,(s~ bscrel0sc0bsc
))E(I,(s~ 0sc0
))E(I,(s~ bscrel
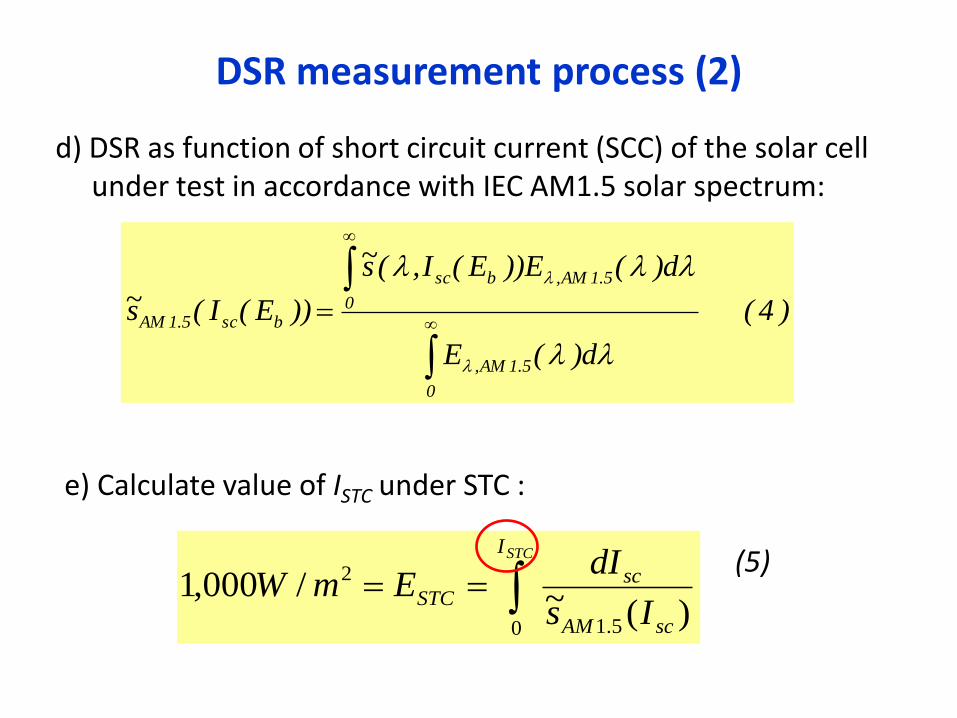
DSR measurement process (2)
d) DSR as function of short circuit current (SCC) of the solar cell under test in accordance with IEC AM1.5 solar spectrum:
)4(
d)(E
d)(E))E(I,(s~
))E(I(s~
0
5.1AM,
0
5.1AM,bsc
bsc5.1AM
e) Calculate value of ISTC under STC :
(5)
STCI
scAM
scSTC
Is
dIEmW
0 5.1
2
)(~/000,1
Outlines
• Introduction
• Differential Spectral Responsivity (DSR)
• DSR Measurement System at NMC
• Measurement Procedure and Data Processing
• Measurement result and uncertainty budget
• Summary
• Future works
• References
12
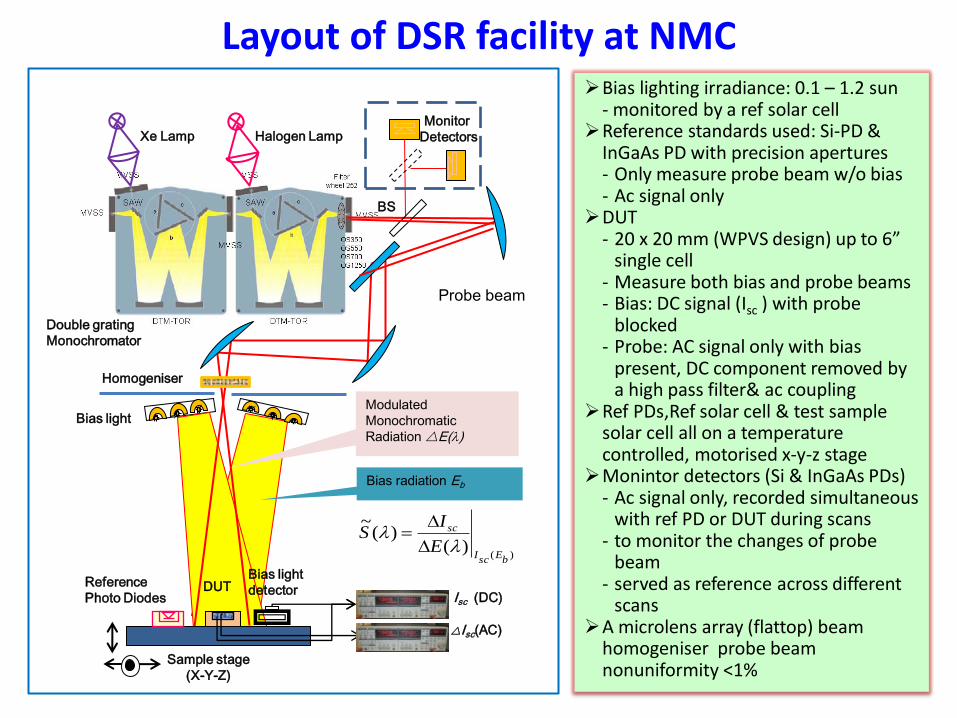
Layout of DSR facility at NMC Bias lighting irradiance: 0.1 – 1.2 sun
- monitored by a ref solar cell Reference standards used: Si-PD &
InGaAs PD with precision apertures - Only measure probe beam w/o bias - Ac signal only
DUT - 20 x 20 mm (WPVS design) up to 6”
single cell - Measure both bias and probe beams - Bias: DC signal (Isc ) with probe
blocked - Probe: AC signal only with bias
present, DC component removed by a high pass filter& ac coupling
Ref PDs,Ref solar cell & test sample solar cell all on a temperature controlled, motorised x-y-z stage
Monintor detectors (Si & InGaAs PDs) - Ac signal only, recorded simultaneous
with ref PD or DUT during scans - to monitor the changes of probe
beam - served as reference across different
scans A microlens array (flattop) beam
homogeniser probe beam nonuniformity <1%
Monitor
Detectors
Isc (DC)
Isc(AC)
Sample stage
(X-Y-Z)
Xe Lamp Halogen Lamp
Bias light
Bias light
detector
BS
Modulated
Monochromatic
Radiation E()
Bias radiation Eb
)()(
)(~
bE
scI
sc
E
IS
DUT Reference
Photo Diodes
Probe beam
Double grating
Monochromator
Homogeniser
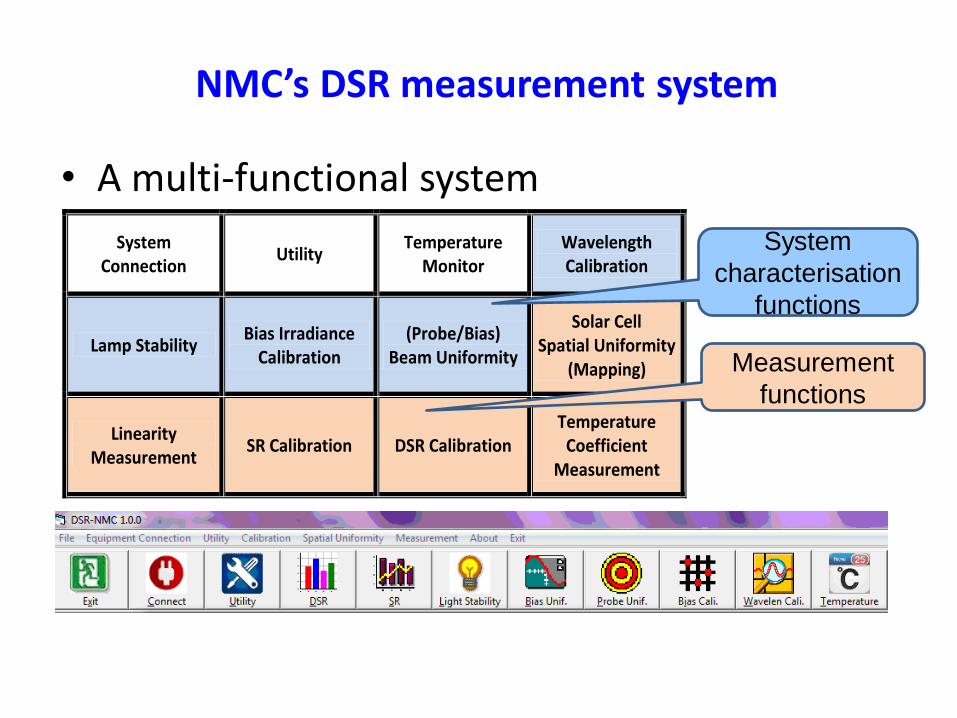
System Connection
Utility Temperature
Monitor Wavelength Calibration
Lamp Stability Bias Irradiance
Calibration (Probe/Bias)
Beam Uniformity
Solar Cell Spatial Uniformity
(Mapping)
Linearity Measurement
SR Calibration DSR Calibration Temperature
Coefficient Measurement
System
characterisation
functions
Measurement
functions
• A multi-functional system
NMC’s DSR measurement system
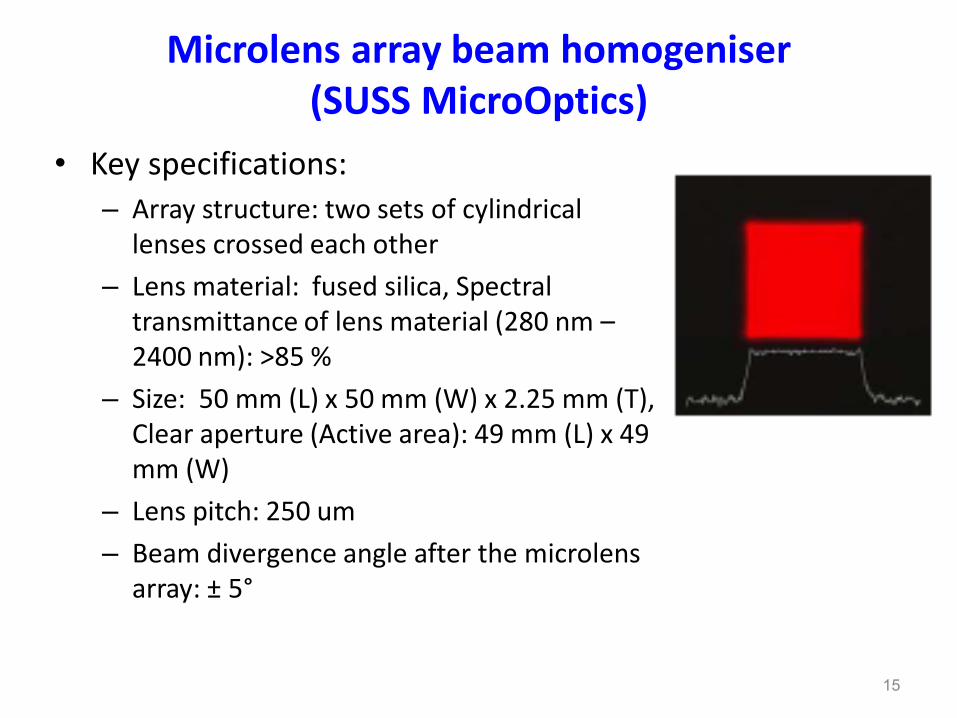
Microlens array beam homogeniser (SUSS MicroOptics)
• Key specifications:
– Array structure: two sets of cylindrical lenses crossed each other
– Lens material: fused silica, Spectral transmittance of lens material (280 nm – 2400 nm): >85 %
– Size: 50 mm (L) x 50 mm (W) x 2.25 mm (T), Clear aperture (Active area): 49 mm (L) x 49 mm (W)
– Lens pitch: 250 um
– Beam divergence angle after the microlens array: ± 5°
15
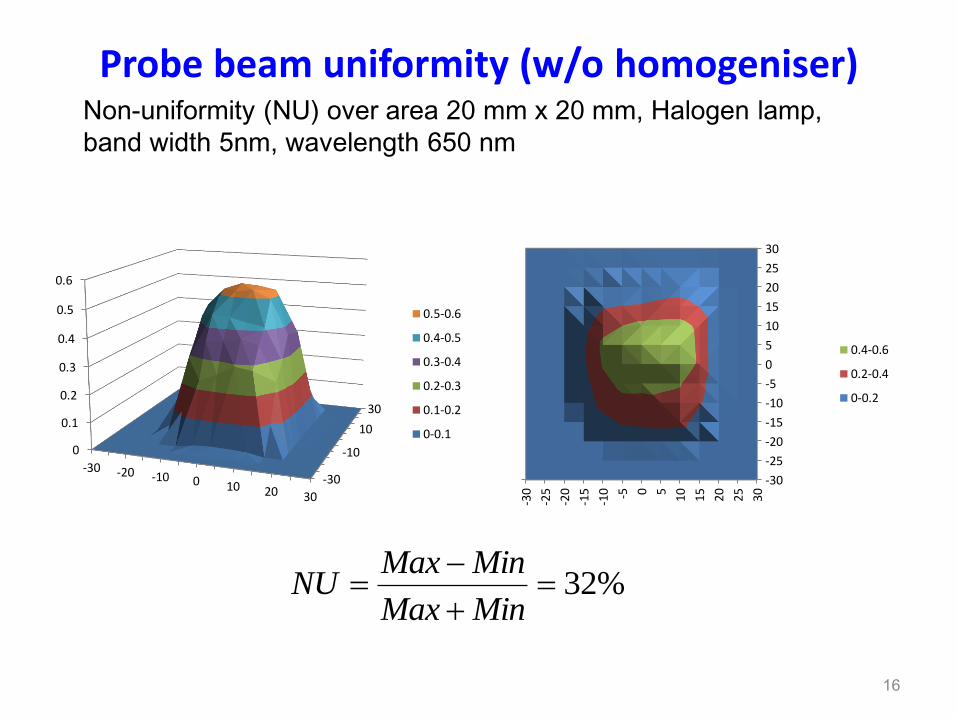
Probe beam uniformity (w/o homogeniser)
16
-30
-10
10
30
0
0.1
0.2
0.3
0.4
0.5
0.6
-30 -20 -10 0 10 20 30
0.5-0.6
0.4-0.5
0.3-0.4
0.2-0.3
0.1-0.2
0-0.1
-30
-25
-20
-15
-10
-5
0
5
10
15
20
25
30
-30
-25
-20
-15
-10 -5 0 5
10 15 20 25 30
0.4-0.6
0.2-0.4
0-0.2
Non-uniformity (NU) over area 20 mm x 20 mm, Halogen lamp,
band width 5nm, wavelength 650 nm
%32
MinMax
MinMaxNU
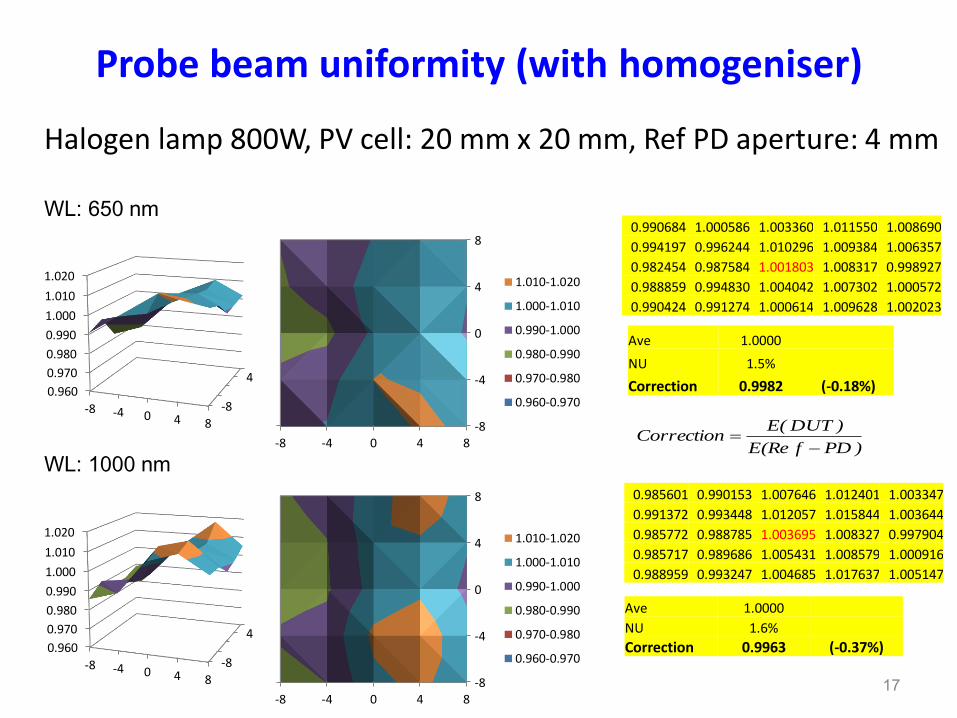
Probe beam uniformity (with homogeniser)
17
Halogen lamp 800W, PV cell: 20 mm x 20 mm, Ref PD aperture: 4 mm WL: 650 nm
WL: 1000 nm
0.990684 1.000586 1.003360 1.011550 1.008690
0.994197 0.996244 1.010296 1.009384 1.006357
0.982454 0.987584 1.001803 1.008317 0.998927
0.988859 0.994830 1.004042 1.007302 1.000572
0.990424 0.991274 1.000614 1.009628 1.002023
0.985601 0.990153 1.007646 1.012401 1.003347
0.991372 0.993448 1.012057 1.015844 1.003644
0.985772 0.988785 1.003695 1.008327 0.997904
0.985717 0.989686 1.005431 1.008579 1.000916
0.988959 0.993247 1.004685 1.017637 1.005147
Ave 1.0000
NU 1.5%
Correction 0.9982 (-0.18%)
Ave 1.0000
NU 1.6%
Correction 0.9963 (-0.37%)
-8
40.960
0.970
0.980
0.990
1.000
1.010
1.020
-8 -4 0 4 8
1.010-1.020
1.000-1.010
0.990-1.000
0.980-0.990
0.970-0.980
0.960-0.970
-8
-4
0
4
8
-8 -4 0 4 8
1.010-1.020
1.000-1.010
0.990-1.000
0.980-0.990
0.970-0.980
0.960-0.970
-8
40.960
0.970
0.980
0.990
1.000
1.010
1.020
-8 -4 0 4 8
1.010-1.020
1.000-1.010
0.990-1.000
0.980-0.990
0.970-0.980
0.960-0.970
-8
-4
0
4
8
-8 -4 0 4 8
1.010-1.020
1.000-1.010
0.990-1.000
0.980-0.990
0.970-0.980
0.960-0.970
)PDf(ReE
)DUT(ECorrection
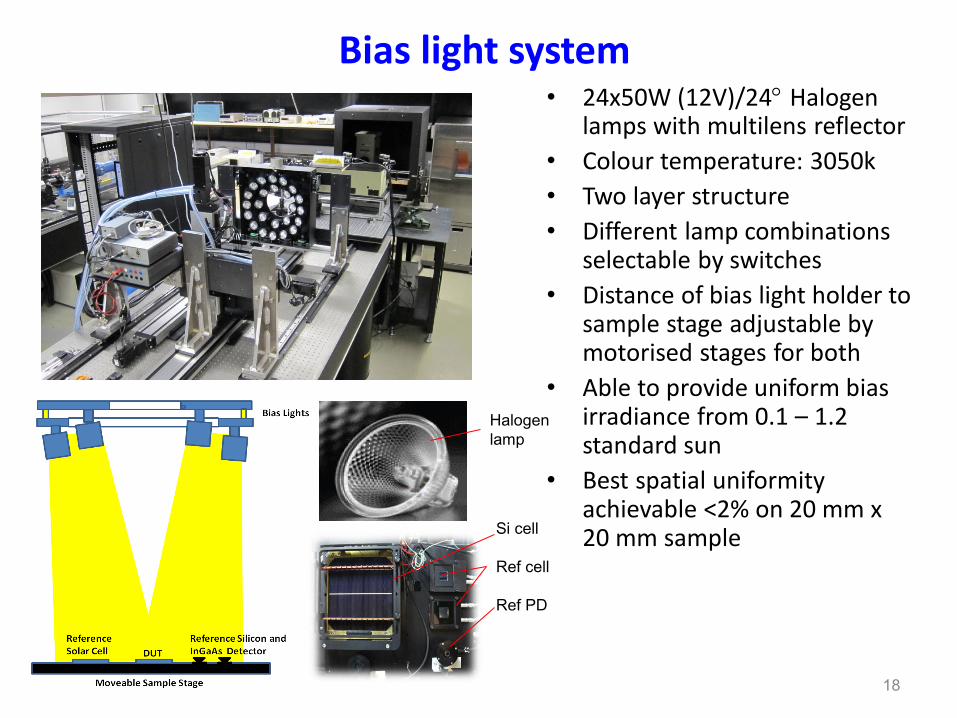
Bias light system
18
• 24x50W (12V)/24 Halogen lamps with multilens reflector
• Colour temperature: 3050k
• Two layer structure
• Different lamp combinations selectable by switches
• Distance of bias light holder to sample stage adjustable by motorised stages for both
• Able to provide uniform bias irradiance from 0.1 – 1.2 standard sun
• Best spatial uniformity achievable <2% on 20 mm x 20 mm sample
Halogen
lamp
Si cell
Ref cell
Ref PD
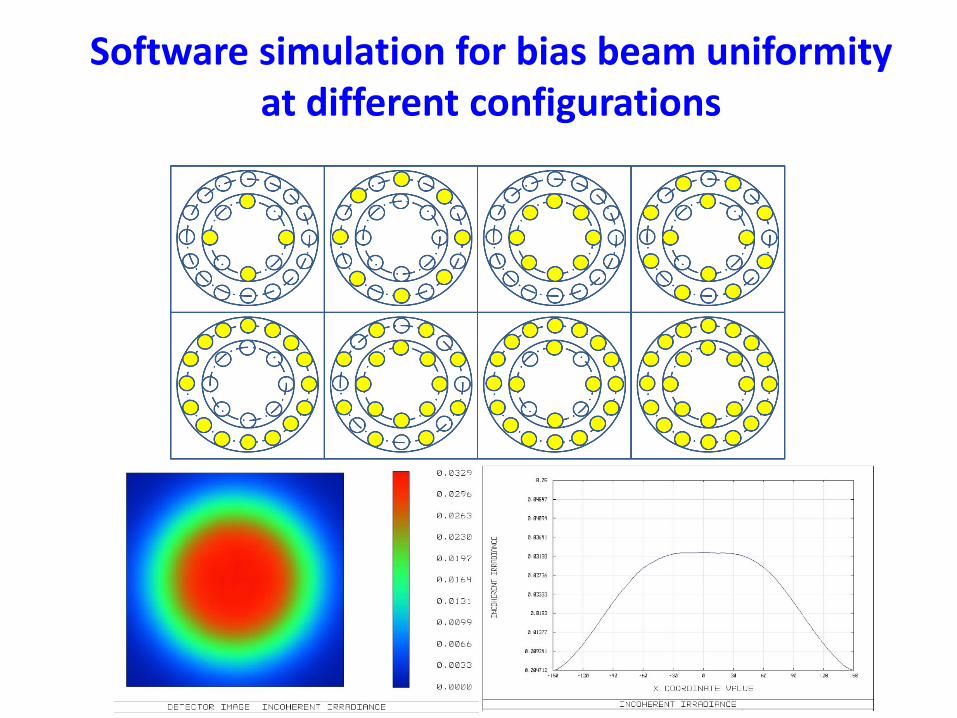
Software simulation for bias beam uniformity at different configurations
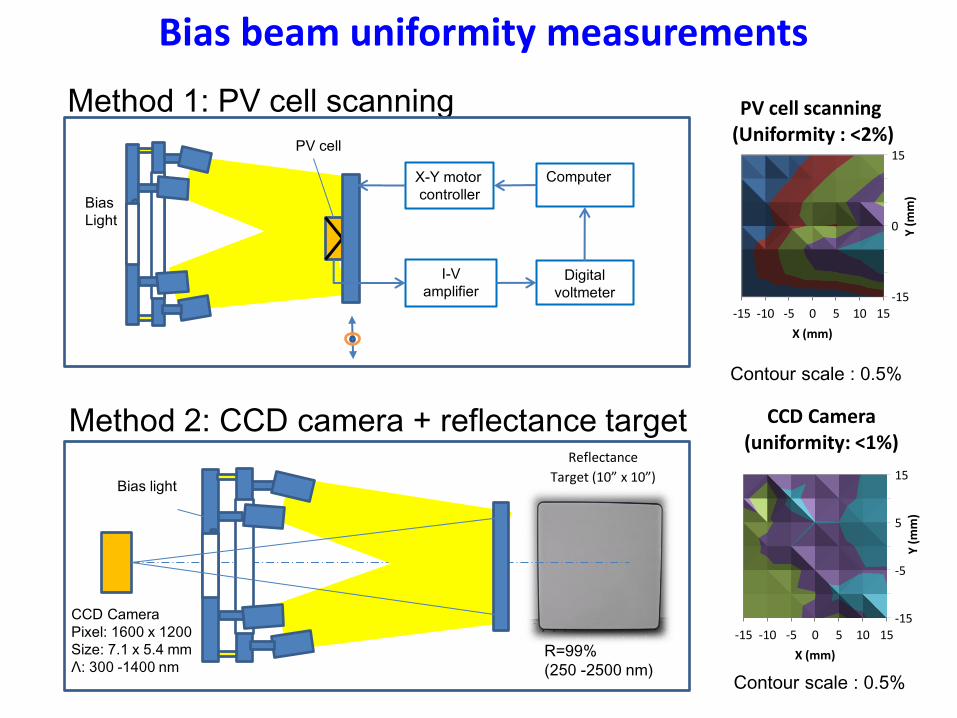
Bias beam uniformity measurements
Reflectance
Target (10” x 10”)
CCD Camera
Pixel: 1600 x 1200
Size: 7.1 x 5.4 mm
Λ: 300 -1400 nm
Method 2: CCD camera + reflectance target
Bias light
Method 1: PV cell scanning
X-Y motor
controller
Computer
I-V
amplifier Digital
voltmeter
PV cell
Bias
Light
Contour scale : 0.5%
Contour scale : 0.5%
-15
-5
5
15
-15 -10 -5 0 5 10 15
Y (
mm
)
X (mm)
CCD Camera (uniformity: <1%)
-15
0
15
-15 -10 -5 0 5 10 15
Y (
mm
)
X (mm)
PV cell scanning (Uniformity : <2%)
R=99%
(250 -2500 nm)
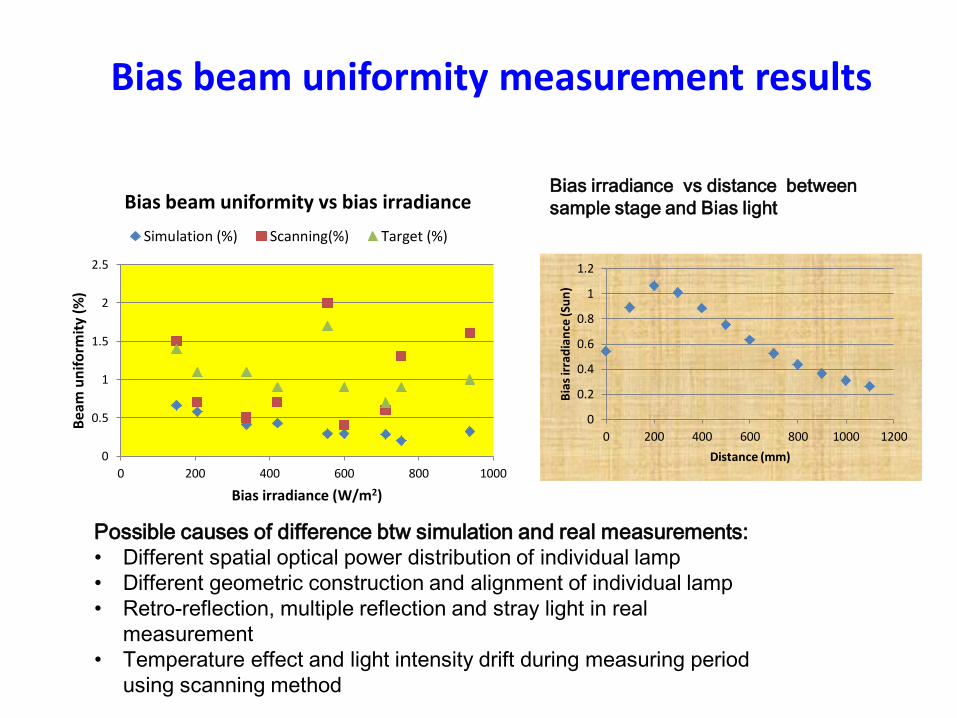
Bias beam uniformity measurement results
0
0.5
1
1.5
2
2.5
0 200 400 600 800 1000
Bea
m u
nif
orm
ity
(%)
Bias irradiance (W/m2)
Bias beam uniformity vs bias irradiance
Simulation (%) Scanning(%) Target (%)
0
0.2
0.4
0.6
0.8
1
1.2
0 200 400 600 800 1000 1200
Bia
s ir
rad
ian
ce (S
un
)
Distance (mm)
Bias irradiance vs distance between
sample stage and Bias light
Possible causes of difference btw simulation and real measurements:
• Different spatial optical power distribution of individual lamp
• Different geometric construction and alignment of individual lamp
• Retro-reflection, multiple reflection and stray light in real
measurement
• Temperature effect and light intensity drift during measuring period
using scanning method
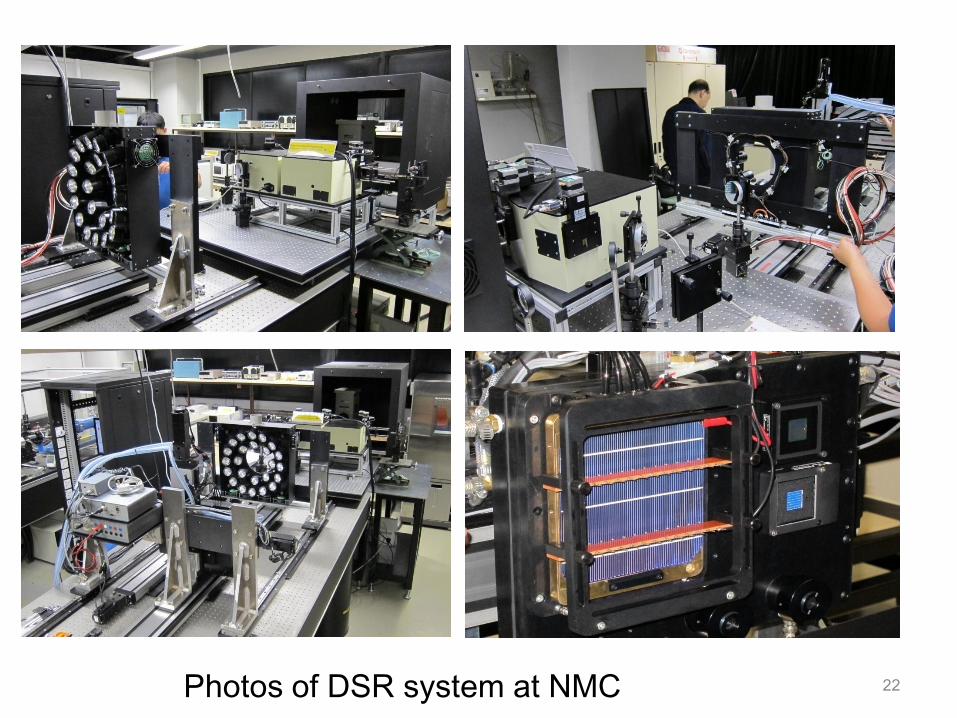
22 Photos of DSR system at NMC
Outlines
• Introduction
• Differential Spectral Responsivity (DSR)
• DSR Measurement System at NMC
• Measurement result and uncertainty budget
• Summary
• Future works
• References
23
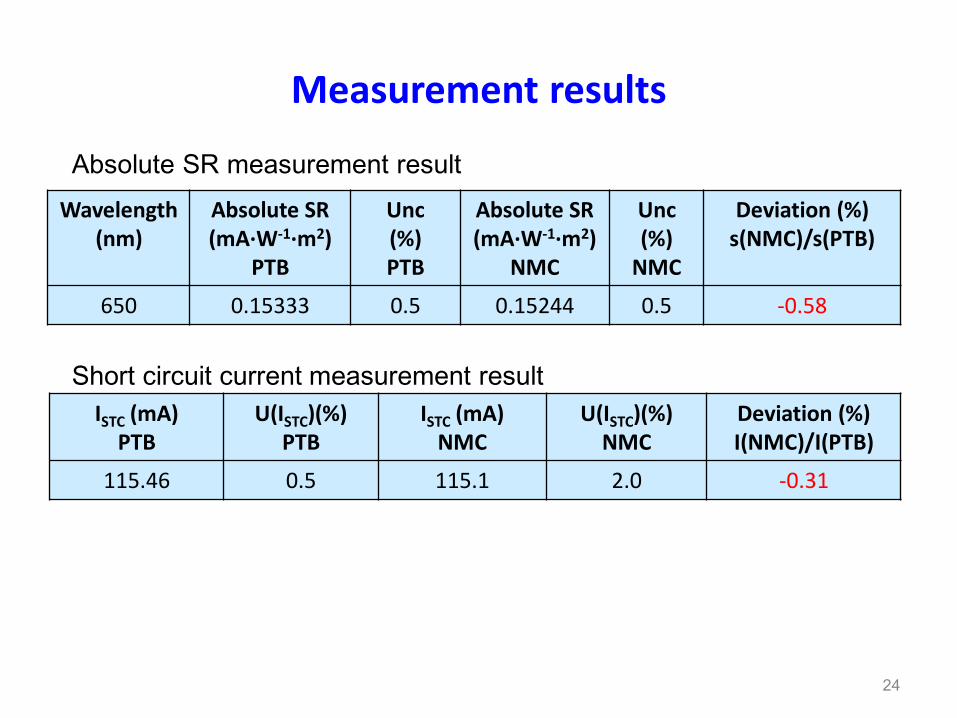
Measurement results
Wavelength (nm)
Absolute SR (mA∙W-1∙m2)
PTB
Unc (%) PTB
Absolute SR (mA∙W-1∙m2)
NMC
Unc (%)
NMC
Deviation (%) s(NMC)/s(PTB)
650 0.15333 0.5 0.15244 0.5 -0.58
24
ISTC (mA) PTB
U(ISTC)(%) PTB
ISTC (mA) NMC
U(ISTC)(%) NMC
Deviation (%) I(NMC)/I(PTB)
115.46 0.5 115.1 2.0 -0.31
Absolute SR measurement result
Short circuit current measurement result
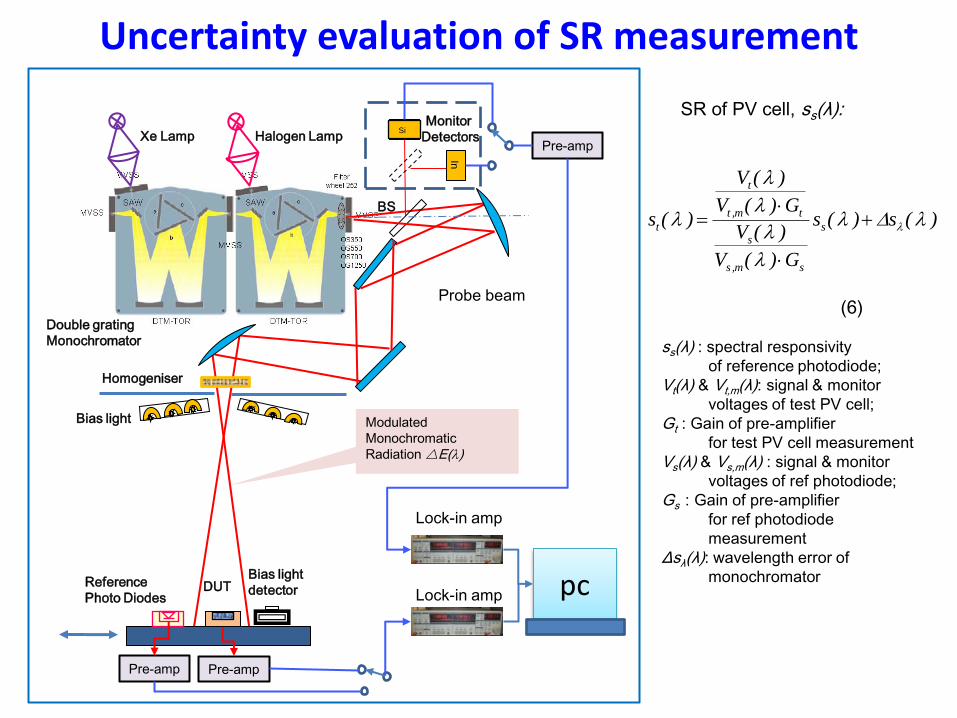
Uncertainty evaluation of SR measurement
Monitor
Detectors
Xe Lamp Halogen Lamp
Bias light
Bias light
detector
BS
In
Si
Modulated
Monochromatic
Radiation E()
DUT Reference
Photo Diodes
Probe beam
Double grating
Monochromator
Homogeniser
Pre-amp Pre-amp
Pre-amp
pc
Lock-in amp
Lock-in amp
)(s)(s
G)(V
)(V
G)(V
)(V
)(s s
sm,s
s
tm,t
t
t
SR of PV cell, ss(λ):
ss(λ) : spectral responsivity
of reference photodiode;
Vt(λ) & Vt,m(λ): signal & monitor
voltages of test PV cell;
Gt : Gain of pre-amplifier
for test PV cell measurement
Vs(λ) & Vs,m(λ) : signal & monitor
voltages of ref photodiode;
Gs : Gain of pre-amplifier
for ref photodiode
measurement
Δsλ(λ): wavelength error of
monochromator
(6)
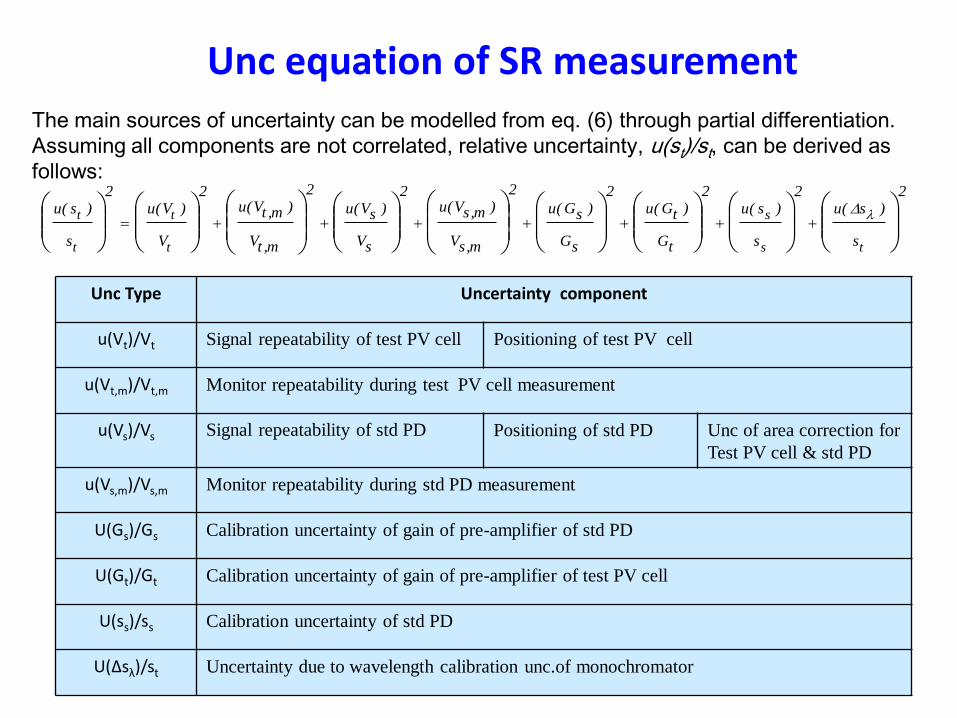
Unc equation of SR measurement
The main sources of uncertainty can be modelled from eq. (6) through partial differentiation.
Assuming all components are not correlated, relative uncertainty, u(st)/st, can be derived as
follows: 2
s
)s(u2
s
)s(u2
tG
)tG(u2
sG
)sG(u
2
m,sV
)m,sV(u2
sV
)sV(u
2
m,tV
)m,tV(u2
V
)V(u2
s
)s(u
ts
s
t
t
t
t
Unc Type Uncertainty component
u(Vt)/Vt Signal repeatability of test PV cell Positioning of test PV cell
u(Vt,m)/Vt,m Monitor repeatability during test PV cell measurement
u(Vs)/Vs Signal repeatability of std PD Positioning of std PD Unc of area correction for
Test PV cell & std PD
u(Vs,m)/Vs,m Monitor repeatability during std PD measurement
U(Gs)/Gs Calibration uncertainty of gain of pre-amplifier of std PD
U(Gt)/Gt Calibration uncertainty of gain of pre-amplifier of test PV cell
U(ss)/ss Calibration uncertainty of std PD
U(Δsλ)/st Uncertainty due to wavelength calibration unc.of monochromator
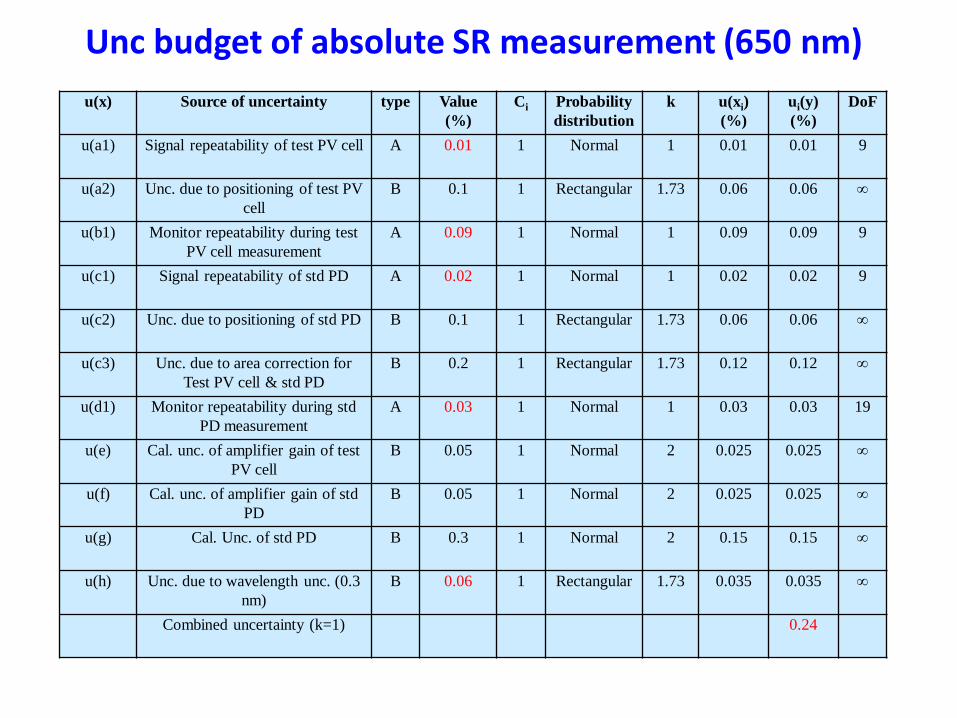
Unc budget of absolute SR measurement (650 nm)
u(x) Source of uncertainty type Value
(%)
Ci Probability
distribution
k u(xi)
(%)
ui(y)
(%)
DoF
u(a1) Signal repeatability of test PV cell A 0.01 1 Normal
1 0.01 0.01 9
u(a2) Unc. due to positioning of test PV
cell
B 0.1 1 Rectangular 1.73 0.06 0.06 ∞
u(b1) Monitor repeatability during test
PV cell measurement
A 0.09 1 Normal
1 0.09 0.09 9
u(c1) Signal repeatability of std PD A 0.02 1 Normal
1 0.02 0.02 9
u(c2) Unc. due to positioning of std PD B 0.1 1 Rectangular 1.73 0.06 0.06 ∞
u(c3) Unc. due to area correction for
Test PV cell & std PD
B 0.2 1 Rectangular 1.73 0.12 0.12 ∞
u(d1) Monitor repeatability during std
PD measurement
A 0.03 1 Normal
1 0.03 0.03 19
u(e) Cal. unc. of amplifier gain of test
PV cell
B 0.05 1 Normal 2 0.025 0.025 ∞
u(f) Cal. unc. of amplifier gain of std
PD
B 0.05 1 Normal 2 0.025 0.025 ∞
u(g) Cal. Unc. of std PD B 0.3 1 Normal 2 0.15 0.15 ∞
u(h) Unc. due to wavelength unc. (0.3
nm)
B 0.06 1 Rectangular 1.73 0.035 0.035 ∞
Combined uncertainty (k=1) 0.24
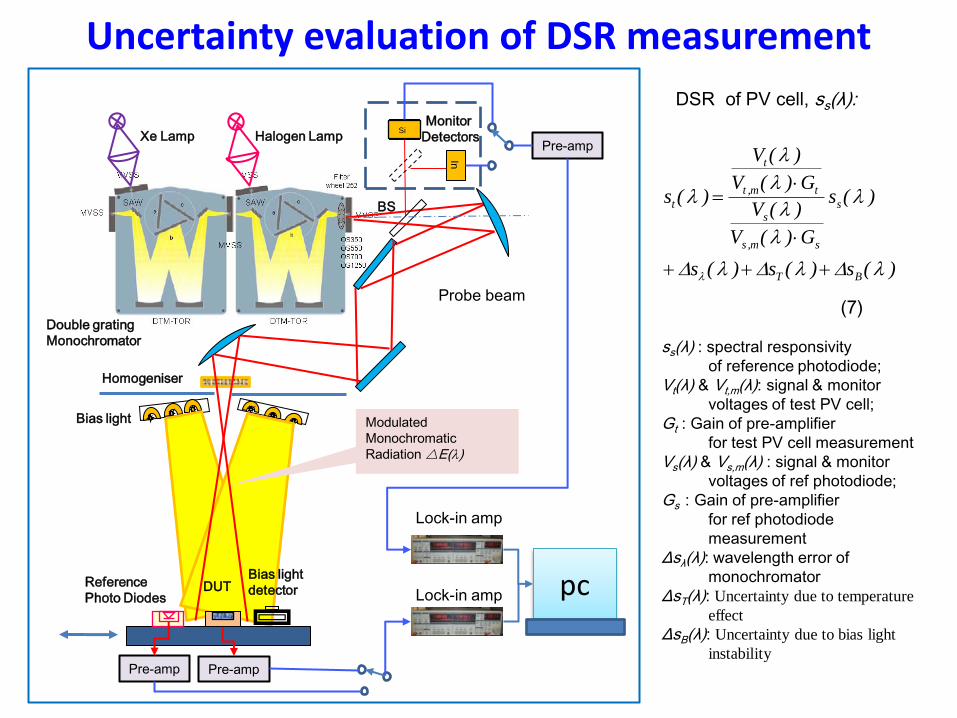
Uncertainty evaluation of DSR measurement
)(s)(s)(s
)(s
G)(V
)(V
G)(V
)(V
)(s
BT
s
sm,s
s
tm,t
t
t
DSR of PV cell, ss(λ):
ss(λ) : spectral responsivity
of reference photodiode;
Vt(λ) & Vt,m(λ): signal & monitor
voltages of test PV cell;
Gt : Gain of pre-amplifier
for test PV cell measurement
Vs(λ) & Vs,m(λ) : signal & monitor
voltages of ref photodiode;
Gs : Gain of pre-amplifier
for ref photodiode
measurement
Δsλ(λ): wavelength error of
monochromator
ΔsT(λ): Uncertainty due to temperature
effect
ΔsB(λ): Uncertainty due to bias light
instability
Monitor
Detectors
Xe Lamp Halogen Lamp
Bias light
BS
In
Si
Probe beam
Double grating
Monochromator
Homogeniser
Pre-amp Pre-amp
Pre-amp
pc
Lock-in amp
Lock-in amp
Bias light
detector DUT Reference
Photo Diodes
Modulated
Monochromatic
Radiation E()
(7)
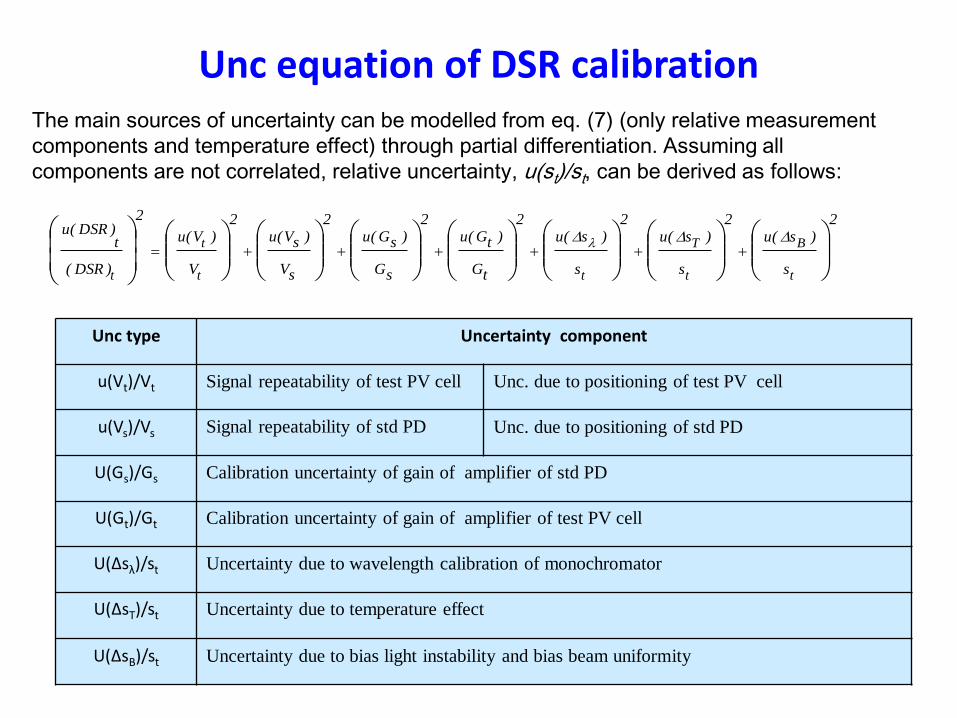
Unc equation of DSR calibration
The main sources of uncertainty can be modelled from eq. (7) (only relative measurement
components and temperature effect) through partial differentiation. Assuming all
components are not correlated, relative uncertainty, u(st)/st, can be derived as follows:
2
s
)s(u2
s
)s(u2
s
)s(u2
tG
)tG(u2
sG
)sG(u2
sV
)sV(u2
V
)V(u
2
)DSR(
t)DSR(u
t
B
t
T
tt
t
t
Unc type Uncertainty component
u(Vt)/Vt Signal repeatability of test PV cell Unc. due to positioning of test PV cell
u(Vs)/Vs Signal repeatability of std PD Unc. due to positioning of std PD
U(Gs)/Gs Calibration uncertainty of gain of amplifier of std PD
U(Gt)/Gt Calibration uncertainty of gain of amplifier of test PV cell
U(Δsλ)/st Uncertainty due to wavelength calibration of monochromator
U(ΔsT)/st
Uncertainty due to temperature effect
U(ΔsB)/st Uncertainty due to bias light instability and bias beam uniformity
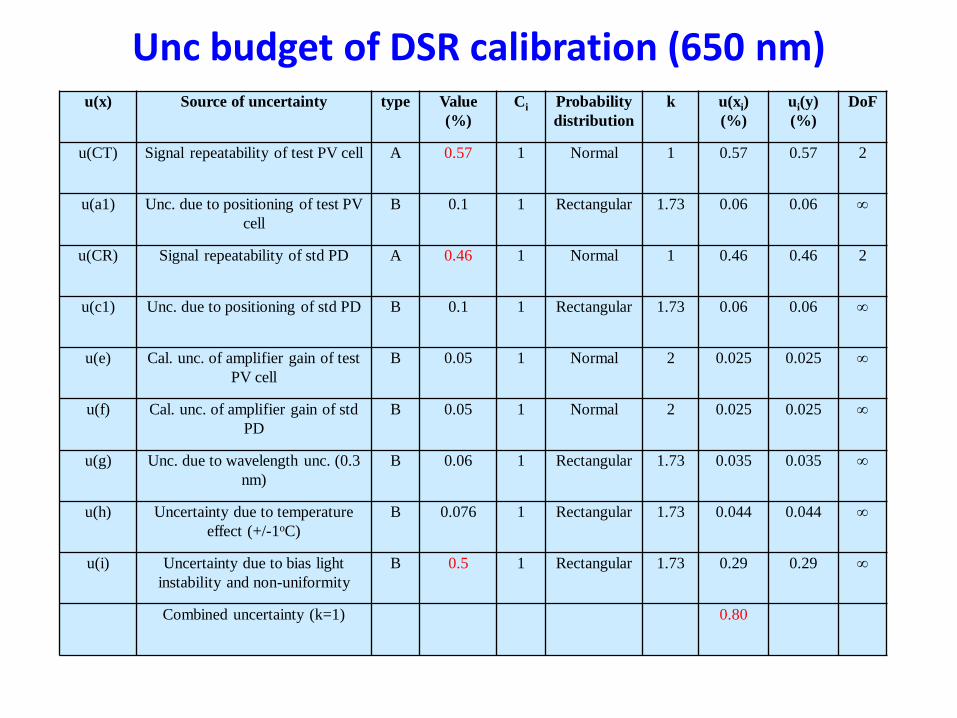
Unc budget of DSR calibration (650 nm) u(x) Source of uncertainty type Value
(%)
Ci Probability
distribution
k u(xi)
(%)
ui(y)
(%)
DoF
u(CT) Signal repeatability of test PV cell A 0.57 1 Normal
1 0.57 0.57 2
u(a1) Unc. due to positioning of test PV
cell
B 0.1 1 Rectangular 1.73 0.06 0.06 ∞
u(CR) Signal repeatability of std PD A 0.46 1 Normal
1 0.46 0.46 2
u(c1) Unc. due to positioning of std PD B 0.1 1 Rectangular 1.73 0.06 0.06 ∞
u(e) Cal. unc. of amplifier gain of test
PV cell
B 0.05 1 Normal 2 0.025 0.025 ∞
u(f) Cal. unc. of amplifier gain of std
PD
B 0.05 1 Normal 2 0.025 0.025 ∞
u(g) Unc. due to wavelength unc. (0.3
nm)
B 0.06 1 Rectangular 1.73 0.035 0.035 ∞
u(h) Uncertainty due to temperature
effect (+/-1oC)
B 0.076 1 Rectangular 1.73 0.044 0.044 ∞
u(i) Uncertainty due to bias light
instability and non-uniformity
B 0.5 1 Rectangular 1.73 0.29 0.29 ∞
Combined uncertainty (k=1) 0.80
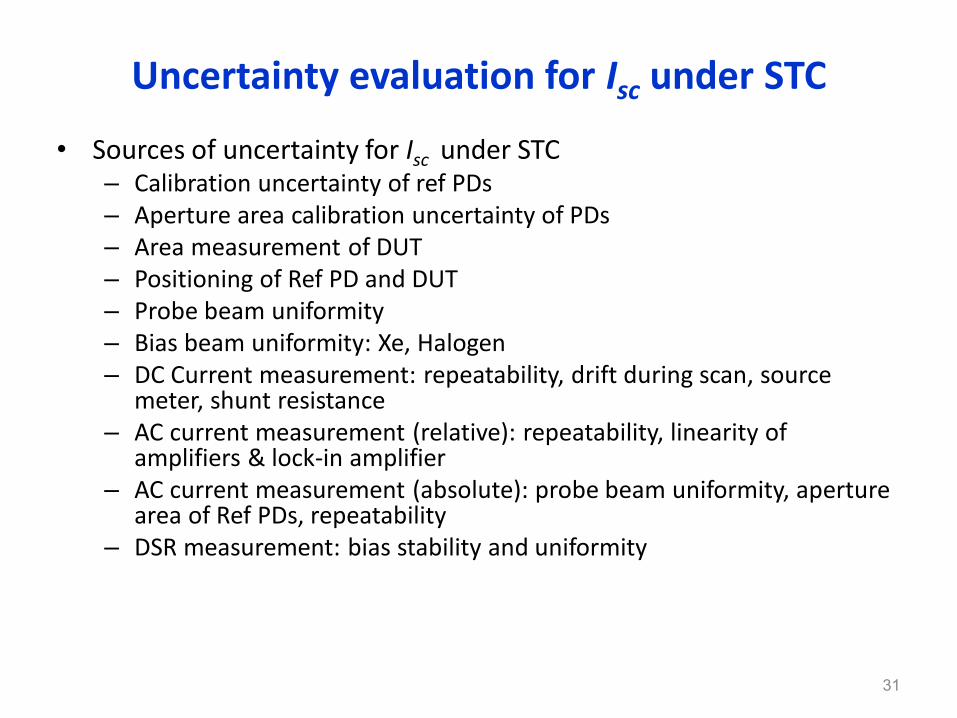
Uncertainty evaluation for Isc under STC
• Sources of uncertainty for Isc under STC
– Calibration uncertainty of ref PDs – Aperture area calibration uncertainty of PDs – Area measurement of DUT – Positioning of Ref PD and DUT – Probe beam uniformity – Bias beam uniformity: Xe, Halogen – DC Current measurement: repeatability, drift during scan, source
meter, shunt resistance – AC current measurement (relative): repeatability, linearity of
amplifiers & lock-in amplifier – AC current measurement (absolute): probe beam uniformity, aperture
area of Ref PDs, repeatability – DSR measurement: bias stability and uniformity
31
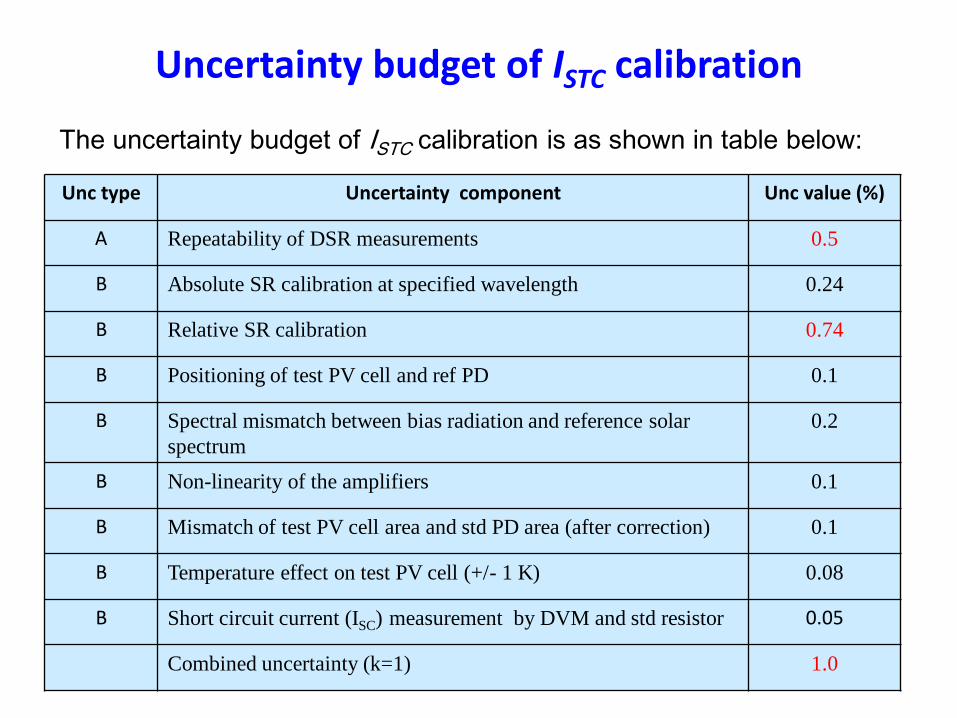
Uncertainty budget of ISTC calibration
The uncertainty budget of ISTC calibration is as shown in table below:
Unc type Uncertainty component Unc value (%)
A Repeatability of DSR measurements 0.5
B Absolute SR calibration at specified wavelength 0.24
B Relative SR calibration 0.74
B Positioning of test PV cell and ref PD 0.1
B Spectral mismatch between bias radiation and reference solar
spectrum
0.2
B Non-linearity of the amplifiers 0.1
B Mismatch of test PV cell area and std PD area (after correction) 0.1
B Temperature effect on test PV cell (+/- 1 K) 0.08
B Short circuit current (ISC) measurement by DVM and std resistor 0.05
Combined uncertainty (k=1) 1.0
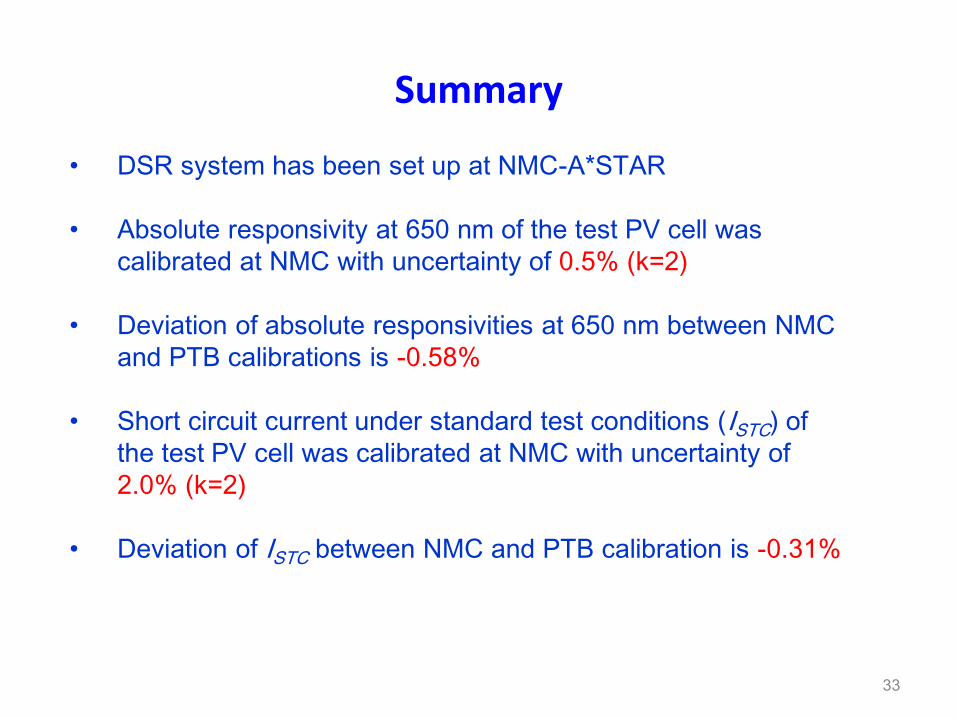
Summary
33
• DSR system has been set up at NMC-A*STAR
• Absolute responsivity at 650 nm of the test PV cell was
calibrated at NMC with uncertainty of 0.5% (k=2)
• Deviation of absolute responsivities at 650 nm between NMC
and PTB calibrations is -0.58%
• Short circuit current under standard test conditions (ISTC) of
the test PV cell was calibrated at NMC with uncertainty of
2.0% (k=2)
• Deviation of ISTC between NMC and PTB calibration is -0.31%
Future works
34
• Study and improve repeatability of relative SR
measurements
• Study and improve repeatability of DSR measurements
• Investigation of bias light instability effect on ISTC
measurements
• Investigation of temperature effect on ISTC measurements
• Investigation of spectral bandwidth effect on ISTC
measurements
Acknowledgement
35
This work is funded by Science & Engineering
Research Council of A*STAR of Singapore
The Authors would like to thank Dr Stefan
Winter of PTB for information on the PTB DSR
system and Dr Keith Emery of NREL for advice
on signal detection system

References
36
1. Calibration of Solar Cells 1. the differential spectral responsivity
method, J Mozdorf, Appl. Optics, 28(9), 1701-1727,1987
2. Primary reference cell calibration at the PTB based on improved
DSR facility, S Winter, T Wittchen and J Metzdorf, 16th European
Photovoltaic Solar Energy Conf. Glasgow 2000
3. Uncertainty Analysis of Certified Photovoltaic Measurement at
NREL, Technical Report NREL/TP-520-45299 Keith Emery,
2009

37