Embed Size (px)
Citation preview

A
miflLpLutTd©
K
1
alaoirvpnr
0d
Biosensors and Bioelectronics 22 (2007) 2564–2569
A fluorescent indicator to visualize ligand-induced receptor/coactivatorinteractions for screening of peroxisome proliferator-activated
receptor � ligands in living cells
Muhammad Awais a, Moritoshi Sato a,b, Yoshio Umezawa a,∗a Department of Chemistry, School of Science, The University of Tokyo and Japan Science and Technology Agency (JST), Hongo,
Bunkyo-ku, Tokyo 113-0033, Japanb PRESTO, Japan Science and Technology Agency, 4-1-8 Honcho Kawaguchi, Saitama, Japan
Received 24 May 2006; received in revised form 29 September 2006; accepted 5 October 2006Available online 13 November 2006
bstract
Peroxisome proliferator-activated receptor � (PPAR�) is a member of nuclear receptors (NRs) superfamily and plays an important role forodulation of insulin sensitivity in type 2 diabetes. Ligand-dependent protein–protein interactions between NRs and NR coactivators are critical
n regulation of transcription. To visualize the ligand-induced coactivator recruitment to PPAR� in live cells, we developed a genetically encodeduorescent indicator in which PPAR� ligand binding domain (PPAR� LBD) was connected to a steroid receptor coactivator peptide that containsXXLL motif (L = leucine and X = any amino acid) through a flexible linker. This fusion protein was inserted between cyan and yellow fluorescentroteins (CFP and YFP, donor and acceptor fluorophore, respectively). Monitoring real-time ligand-induced conformational change in the PPAR�BD to interact with the coactivator allowed screening of natural and synthetic ligands (drugs against type 2 diabetes) in single living cellssing intramolecular fluorescence resonance energy-transfer (FRET) microscopy. The high sensitivity of the present indicator made it possible
o distinguish between strong and weak affinity ligands for PPAR� in a dose-dependent fashion, immediately after adding a ligand to live cells.he indicator can discriminate agonist from antagonist compounds efficiently within a few minutes. The present system may be promising in theevelopment of PPAR�-targeted drugs against type 2 diabetes and inflammation.2006 Elsevier B.V. All rights reserved.
e; Co
i1rlaaicca
eywords: Peroxisome proliferator-activated receptor �; Conformational chang
. Introduction
The peroxisome proliferator-activated receptor � (PPAR�),member of nuclear receptors (NRs) superfamily, acts as a
igand-activated transcription factor (Gronemeyer et al., 2004)nd plays an important role in adipogenesis and glucose home-stasis (Lee et al., 2004; Spiegelman, 1998). Although originallydentified as an orphan receptor, PPAR� and the closely relatedeceptors, PPAR� and PPAR�, are now known to bind to aariety of fatty acids and their metabolites, e.g. 15-deoxy-�12,14-
rostaglandin J2, PGJ2 (Forman et al., 1995). Synthetic ago-ists that activate PPAR�, such as thiazolidinediones (TZDs),osiglitazone and pioglitazone are effectively utilized in clin-∗ Corresponding author. Tel.: +81 3 5841 4351; fax: +81 3 5841 8349.E-mail address: [email protected] (Y. Umezawa).
ctrh2
e
956-5663/$ – see front matter © 2006 Elsevier B.V. All rights reserved.oi:10.1016/j.bios.2006.10.013
activator; Agonist; Antagonist; Fluorescence resonance energy-transfer
cal practice as “insulin sensitizers” in type 2 diabetes (Day,999). Like other NRs, PPAR� is comprised of several sepa-able functional domains (A–F). The E region constitutes theigand-binding domain (LBD) that contains a ligand-dependentctivation function 2, AF-2, in its carboxy-terminal region (Nagynd Schwabe, 2004). The transcriptional activity of the PPARs regulated by a ligand. The ligand binding leads to a signifi-ant conformational change within the LBD, which results in thereation of a recognition surface for coactivator proteins (Nagynd Schwabe, 2004; Nolte et al., 1998; Shiau et al., 1998). Thisonformational change in the LBD allows the binding of coac-ivators that subsequently mediate transcriptional activation viaecruitment of additional factors and enzymatic activity such as
istone acetylation (Gronemeyer et al., 2004; Tsai and Fondell,004).A large number of NR coactivators, often ubiquitouslyxpressed, have been identified and characterized, and many

Bioel
on2fdwaHaobhlatctttssttaat2
gpNtprsoibytta2at(tPmprarnssc
2
2
spepafcPamCr
2
FhbcsmctAam
2
1ts0ad
2
F1ecpcI
M. Awais et al. / Biosensors and
f these coactivators utilize a conserved mechanism to recog-ize and interact with a ligand-bound NR (Nagy and Schwabe,004). Steroid receptor coactivator 1 (SRC-1) belongs to aamily of p160 family of NR coactivators, and it interactsirectly with the LBD via an amphipathic �-helical motifith the consensus sequence LXXLL (L = leucine, X = any
mino acid), also known as the NR box (Onate et al., 1995;eery et al., 1997). The conformational change induced by
n agonist ligand creates a hydrophobic groove on the surfacef the receptor LBD, which is recognized by the hydropho-ic leucine residues of the coactivator LXXLL motif. Twoighly conserved residues of the LBD, a positively chargedysine residue of helix 3 and a negatively charged glutamiccid residue of helix 12 on either side of the groove, con-ribute to an additional degree of selectivity by clamping theoactivator LXXLL motif at both the amino- and carboxy-erminal ends by hydrogen bonding with the backbone ofhis motif (Nolte et al., 1998; Shiau et al., 1998). Comple-ion of the charge clamp requires the ligand-dependent repo-itioning of helix 12 in order to place the absolutely con-erved glutamic acid residue of AF-2 in the correct posi-ion to recognize the coactivator LXXLL motif. By con-rast, an antagonist because of its long side-chain induces
conformational change in the LBD in which helix 12ppears to be in a position that blocks the site for coactiva-or binding on the LBD (Shiau et al., 1998; Bourguet et al.,000).
Previously, we developed indicators for steroid NRs, andro-en and estrogen receptors (Awais et al., 2006, 2004). In theresent report, we developed an indicator for a non-steroidR, PPAR�, which is an important clinical target, for high-
hroughput screening of PPAR� ligands in live cells. Therinciple is shown schematically in Fig. 1a. A fluorescenceesonance energy-transfer (FRET)-based indicator was con-tructed in which a coactivator peptide (687HKILHRLLQEG697)f SRC-1 was connected to the PPAR� LBD through a flex-ble linker (GGNN)6. The resultant protein was sandwichedetween two different-colored fluorescent proteins, cyan andellow fluorescent protein (CFP and YFP, donor and accep-or fluorophore, respectively), in such a way that the exci-ation and emission spectra for these fluorescent proteinsre suitable for FRET in single living cells (Sato et al.,005; Awais et al., 2006). This fusion protein functions asfluorescent indicator to visualize ligand-induced conforma-
ional changes in the peroxisome proliferator-activated receptorFLIPER) thus allowing interaction with the coactivator pep-ide in an intramolecular FRET fashion. Upon addition of aPAR agonist to cultured cells expressed with FLIPER pro-otes binding between the PPAR LBD and the coactivator
eptide within FLIPER. This results in an increase in FRETesponse from CFP to YFP. In contrast, an antagonist doesllow the coactivator to interact with the PPAR� LBD thusesulting in no FRET increase. The presence of an antago-
ist also inhibits agonist activity to promote FRET. Therefore,creening of PPAR� ligands, agonists and antagonists, is pos-ible with FLIPER in the physiological environment of liveells.Wooa
ectronics 22 (2007) 2564–2569 2565
. Material and methods
.1. Chemicals
Ham’s F-12 medium, fetal calf serum (FCS), Hank’s balancedalt solution (HBSS) and LipofectAMINE 2000 reagents wereurchased from Life Technologies (Rockville, MD). Minimumssential medium (MEM), trypsin-EDTA, 15-deoxy-�12,14-rostaglandin J2, pioglitazone, ciglitazone, Wy 14643, GW9662nd bisphenol A diglycidyl ether (BADGE) were purchasedrom Sigma Chemicals Co. (St. Louis, MO). T0070907 was pur-hased from Cayman Chemicals (Ann Arbor, MI). The humanPAR�2 was a kind gift from Dr. Suzawa (Institute of Molecularnd Cellular Biosciences, the University of Tokyo). A mam-alian expression vector pcDNA3.1 (+) was from Invitrogeno. (Carlbad, CA). All other chemicals used were of analytical
eagent grade.
.2. Plasmid construction
To prepare the cDNAs for the FLIPER constructs shown inig. 1b, fragment cDNAs of ECFP (1–238 aa); EYFP (1–238 aa);PPAR� (235–505 aa), a flexible linker (GGNN)6; SRC-1 NRox II (687–697 aa) were generated by standard polymerasehain reaction to attach a Kozak sequence and restriction siteshown in constructs (Fig. 1b). The cDNA encoding FLIPERutant, FLIPER/3A, was generated by standard polymerase
hain reaction in which the three hydrophobic leucine residues ofhe SRC-1 NR box II were replaced with alanine (A) residues.ll PCR fragments were sequenced with an ABI310 genetic
nalyzer. This cDNA was inserted at HindIII and XhoI sites ofammalian expression vector pcDNA3.1 (+).
.3. Cell culture and transfection
PK-15 cells were cultured in MEM supplemented with0% FCS, 1.0 mM sodium pyruvate and 0.1 mM nonessen-ial amino acids, respectively, at 37 ◦C in a humidified atmo-phere of 5% CO2. The cultured cells were transfected with.8 �g cDNA (FLIPER) using LipofectAMINE 2000 reagentccording to manufacturer’s instructions in 3.5 cm glass-bottomishes.
.4. Imaging of cells
We confirmed the expression of the expected 85-KDaLIPER by Western blotting analysis (data not shown). Within2–24 h after transfection, culture medium of PK-15 cellsxpressed with FLIPER was replaced with HBSS for fluores-ence imaging experiments. The cells were imaged at room tem-erature on a Carl Zeiss Axiovert 135 microscope with a cooledharge-coupled device camera MicroMAX (Roper Scientificnc, Tucson, AZ), controlled by MetaFluor (Universal Imaging,
est Chester, PA). Set the glass-bottomed dish onto the 40×il immersion objective (Carl Zeiss, Jena, Germany) equippedn the fluorescence microscope. The cells were observed with440 nm excitation filter, 455 nm dichroic mirror and 535 nm

2566 M. Awais et al. / Biosensors and Bioelectronics 22 (2007) 2564–2569
Fig. 1. A fluorescent indicator to visualize ligand-induced coactivator recruitment to the PPAR� LBD in living cells. (a) Principle of the FLIPER, based onintramolecular FRET, to visualize the ligand-dependent interaction between the PPAR� LBD and the coactivator, SRC-1 peptide. An agonist promotes bindingbetween the PPAR� LBD and the coactivator peptide. Consequently, CFP is oriented in close proximity to YFP, resulting in an increase in the FRET response. Bycontrast, an antagonist prevents binding of the coactivator peptide to the PPAR� LBD. Replacement of an agonist with an antagonist results in dissociation of thereceptor/coactivator complex to abolish the FRET change. The magnitude of the FRET increase strongly depends on the relative orientation and distance between thedonor (CFP) and acceptor (YFP) fluorophore. Fig. 1a is derived from Umezawa (2005). (b) The construct of the FLIPER for expression and imaging in mammaliancells. Shown at top of each bar are restriction sites. SRC-1 peptide contains 11 residues (687–697 aa). (GGNN)6 is a flexible linker that consists of 24 aa. PPAR� LBDcontains residues from 235–505 aa. CFP and YFP are different-colored mutants of GFP derived from Aequorea victoria with mammalian codons and the followinga nd YFw ant, Fr
emtiistefia
3
3tl
dditional mutations: CFP, F64L/S65T/Y66W/N146I/M153T/V163A/N212K ahich allows optimal translation initiation in mammalian cells. In FLIPER mut
esidues.
mission filter. By browsing the cells on the dish, we selectedoderately bright cells in which the fluorescence is well dis-
ributed in the cytosol. Determined the desired observation fieldn which only cell(s) of interest is covered. Selected the region ofnterest within the cell to examine time course of CFP/YFP emis-ion ratio during the following image acquisition. Then started
o acquire images every 10–20 s for 10–15 min with the 440 nmxcitation filter (CFP), 455 nm dichroic mirror, 480 nm emissionlter (CFP) and 535 nm emission filter (YFP). During the imagecquisition, added stimuli of interest, for example, PGJ2.wao
P, S65G/V68L/Q69K/S72A/T203Y. Kz is an abbreviation of Kozak sequence,LIPER/3A, the leucine residues of the SRC-1 peptide are replaced with alanine
. Results and discussion
.1. Time course of the ligand-induced interaction betweenhe PPARγ LBD and coactivator peptide within FLIPER inive cells
The FLIPER was expressed in cultured cells and stimulatedith HBSS (vehicle without ligand) followed by PGJ2 (10 �M),
n endogenous PPAR� ligand, to the same cells. This event wasbserved by the time course of the changes in FRET. The cell

M. Awais et al. / Biosensors and Bioel
Fig. 2. FRET was expressed as emission ratio of CFP to YFP signals. (a) Pseu-docolor images of the CFP/YFP emission ratio before (time 0 sec) and at 200,300, 400, 500 and 600 s after the addition of HBSS followed by PGJ2 (10 �M),obtained from a cell expressed with FLIPER. (b) Time course of the FRETresponses of FLIPER upon addition of HBSS followed by PGJ (10 �M) to cul-te3
ilstFwtdTectlatdCrLi
acpac
iochbhchoWtiPiitl
3
ztLT1aaFPtwr
PPAR� transcriptional activity depends on the binding of lig-ands. Natural ligands, such as certain polyunsaturated fatty acidsand PGJ2, have been shown to bind to this receptor at concentra-tions in micromolar range (Kliewer et al., 1995, 1997; Forman
2
ured PK-15 cells expressed with FLIPER. For each experiment, 0.8 �g of thexpression vector encoding FLIPER was transfected to cultured PK-15 cells in.5 cm glass-base dishes. Results represent a typical of five independent trials.
mages were recorded before and at different time intervals afterigand stimulation as shown in Fig. 2a, where the CFP/YFP emis-ion ratio was represented by pseudocolor images that depicthe efficiency of FRET between the fluorescent units withinLIPER. No considerable change in the pseudocolor was notedhen cells were stimulated with HBSS, but addition of PGJ2
o the same cells induced a blue shift in the pseudocolor as aecrease in the CFP/YFP emission ratio (increase in FRET).he decrease in the emission ratio was detectable within sev-ral seconds and reached a plateau within ∼100 s (Fig. 2b). Toonfirm that the increase in FRET was actually triggered byhe PPAR� LBD and coactivator interaction upon PGJ2 stimu-ation, we made a FLIPER mutant, FLIPER/3A, by replacingll the hydrophobic leucine (L) residues of the coactivator pep-ide with alanine (A) residues. As expected, the mutant FLIPERid not show any significant change in the emission ratio ofFP/YFP upon PGJ2 stimulation (data not shown). From these
esults, it is concluded that the FRET response was due to PPAR�BD/coactivator peptide interaction within FLIPER, which was
nduced by an agonist, PGJ2.According to the X-ray crystallographic analysis of lig-
nd/receptor LBD/coactivator complexes, an agonist ligand is
ompletely enveloped within the hydrophobic ligand bindingocket that is always larger than the size of the ligand, and adoptslow energy conformation. An agonist induces a conformationalhange in the LBD by repositioning helix 12 over the LBD to sealF(a
ectronics 22 (2007) 2564–2569 2567
t. This conformational change creates a hydrophobic grooven the surface of the LBD for recruitment of a coactivator. Aoactivator interacts with the agonist-bound LBD by using itsydrophobic LXXLL motif, and this interaction is stabilizedy hydrogen bonds between the receptor’s glutamate residue ofelix 12 and backbone amides of K688, I689 and L690 of SRC-1oactivator. At the same time, the lysine residue of helix 3 formsydrogen bonds with two backbone carbonyls of L693 and L694f the LXXLL motif (Nolte et al., 1998; Shiau et al., 1998).e have shown the ligand-induced conformational change in
he PPAR� LBD to interact with the coactivator LXXLL motifn living cells (Fig. 2a and b). Because of the PGJ2-inducedPAR� LBD/coactivator interactions, CFP got a chance to be
n proximity to YFP within the FLIPER and resulted in anncrease in the FRET response. This allows real-time imaging ofhe ligand-induced PPAR� LB/coactivator interactions in intactiving cells.
.2. Dose-dependent screening of PPARγ agonists
PGJ2 and other PPAR agonists such as pioglitazone, ciglita-one, troglitazone and Wy 14643, were also applied to FLIPERo assess their ability to promote interactions between the PPARBD and coactivator, as shown in dose–response curves (Fig. 3).hese compounds were tested in a concentration range from.0 × 10−4 to 1.0 × 10⁻⁹ M; pioglitazone showed a highestctivity (EC50 = 0.1 �M) followed by PGJ2 (EC50 = 3.0 �M)nd ciglitazone (EC50 = 4.0 �M). The same magnitude of theRET response to that of pioglitazone was displayed byGJ2 or ciglitazone but with 10-fold higher concentration than
he pioglitazone. Troglitazone and Wy 14643 exhibited veryeak responses only at/above 1.0 and 10 �M concentrations,
espectively.
ig. 3. FRET responses of FLIPER for various concentrations of pioglitazone�), PGJ2 (♦), ciglitazone (�), troglitazone (�) and Wy 14643 (©). The resultsre the means ± S.D. of emission ratios from five different cells/experiments.

2568 M. Awais et al. / Biosensors and Bioelectronics 22 (2007) 2564–2569
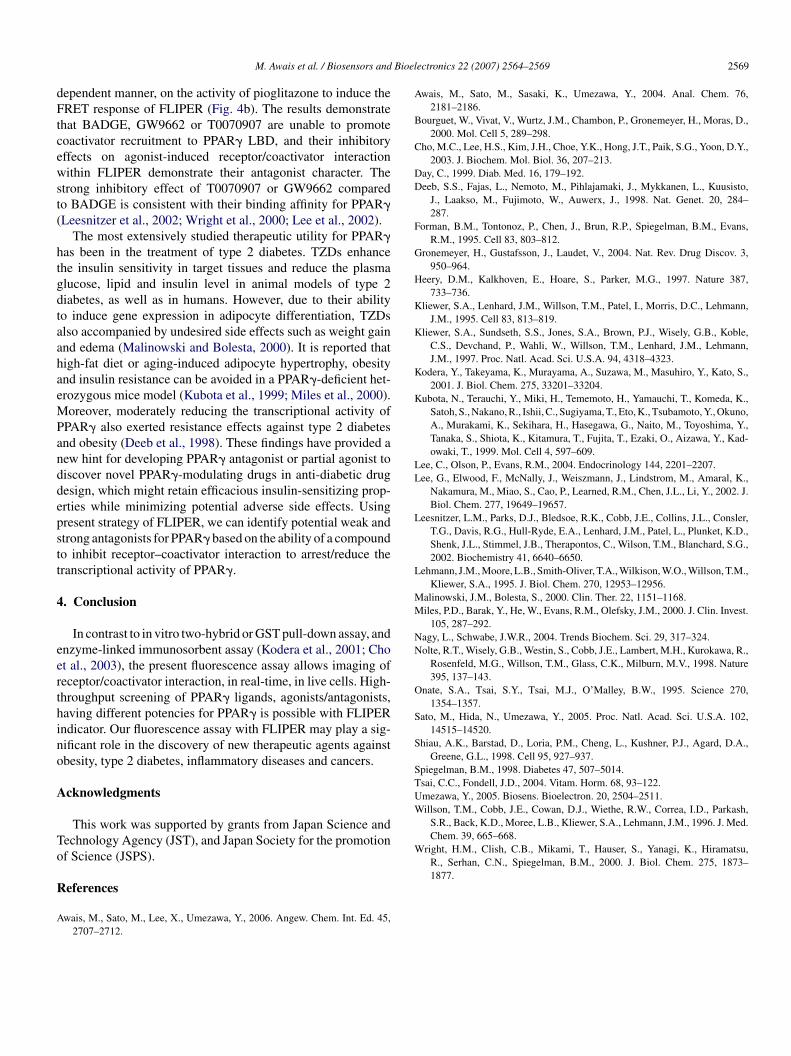
Fig. 4. (a) Time course of the FRET response of FLIPER upon addition of GW9662 (10 �M) to cultured cells expressing FLIPER. (b) Emission ratio change forpioglitazone (1.0 �M) was assessed in the presence of various concentrations of BADGE, GW9662 or T0070907. For each experiment, the antagonist of variousconcentrations (1.0, 10, 100 �M) was added to glass-base dishes containing PK-15 cells expressing the FLIPER indicator and the resultant mixture incubated for10–12 min at room temperature. Cells were imaged and added 1.0 �M of pioglitazone in the same cells without washing the antagonist to monitor the inhibitory effecto ithinw ationF differ
edWatrKT12spsatatTN
3L
2eFFrswBcp1
f the antagonist on the pioglitazone-induce receptor/coactivator interaction with FLIPER were prepared to evaluate the inhibitory effect of each concentrRET response. The results are the means ± S.D. of emission ratios from three
t al., 1995), whereas the synthetic anti-diabetic thiazoledine-iones are able to bind to PPAR� with a KD of 50–700 nM, andy 14643 in millimolar range (Forman et al., 1995; Lehmann et
l., 1995). The EC50 values of the tested compounds are almost inhe same range as described in the previous reports with in vitroeceptor binding and reporter gene assays (Forman et al., 1995;liewer et al., 1997; Willson et al., 1996; Kodera et al., 2001).he weak ability of troglitazone to promote PPAR� LBD/SRC-peptide within FLIPER is in consistent with the Kodera et al.,001, which suggests that troglitazone-bound PPAR may recruitome unknown coactivator to form transcription initiation com-lex. Reporter gene and receptor binding assays is a good tool tocreen NR ligands but reporter gene assay requires over 1 day,nd for a binding assay, a large amount of purified receptor pro-ein is required. With present indicator, we can screen ligands, in
dose-dependent manner, without purification of any protein inhe physiological environment of live cells within a few minutes.herefore, FLIPER can accelerate high-throughput screening ofR ligands.
oBIa
FLIPER. Three separate glass-base dishes containing cultured cells expressedof the antagonists used. From each dish, one cell was selected to monitor theent cells.
.3. Inhibitory effect of PPARγ antagonists on PPARBD/coactivator interaction
The effect of PPAR� antagonists, T0070907 (Lee et al.,002) GW9662 (Leesnitzer et al., 2002) or BADGE (Wrightt al., 2000), on PPAR� LBD/coactivator interaction withinLIPER was observed in cultured cells expressed withLIPER. No significant change in the CFP/YFP emissionatio was observed when FLIPER expressing cells weretimulated with antagonists (Fig. 4a, and data not shown). Next,e evaluated the response of pioglitazone in the presence ofADGE, GW9662 or T0070907 to evaluate the potency of theseompounds for inhibiting the activity of pioglitazone. In theresence of various concentrations of BADGE, the addition of�M pioglitazone resulted in nearly the same FRET response
f FLIPER as that in the absence of BADGE, indicating thatADGE displayed no significant inhibitory effect (Fig. 4b).n contrast, GW9662 and T0070907 showed a significantnd strong inhibitory effect, respectively, in a concentration
Bioel
dFtcewst(
htgdtaahaeMPanddepstt
4
eerthino
A
To
R
A
A
B
C
DD
F
G
H
K
K
K
K
LL
L
L
MM
NN
O
S
S
STUW
S.R., Back, K.D., Moree, L.B., Kliewer, S.A., Lehmann, J.M., 1996. J. Med.Chem. 39, 665–668.
Wright, H.M., Clish, C.B., Mikami, T., Hauser, S., Yanagi, K., Hiramatsu,R., Serhan, C.N., Spiegelman, B.M., 2000. J. Biol. Chem. 275, 1873–
M. Awais et al. / Biosensors and
ependent manner, on the activity of pioglitazone to induce theRET response of FLIPER (Fig. 4b). The results demonstrate
hat BADGE, GW9662 or T0070907 are unable to promoteoactivator recruitment to PPAR� LBD, and their inhibitoryffects on agonist-induced receptor/coactivator interactionithin FLIPER demonstrate their antagonist character. The
trong inhibitory effect of T0070907 or GW9662 comparedo BADGE is consistent with their binding affinity for PPAR�Leesnitzer et al., 2002; Wright et al., 2000; Lee et al., 2002).
The most extensively studied therapeutic utility for PPAR�as been in the treatment of type 2 diabetes. TZDs enhancehe insulin sensitivity in target tissues and reduce the plasmalucose, lipid and insulin level in animal models of type 2iabetes, as well as in humans. However, due to their abilityo induce gene expression in adipocyte differentiation, TZDslso accompanied by undesired side effects such as weight gainnd edema (Malinowski and Bolesta, 2000). It is reported thatigh-fat diet or aging-induced adipocyte hypertrophy, obesitynd insulin resistance can be avoided in a PPAR�-deficient het-rozygous mice model (Kubota et al., 1999; Miles et al., 2000).oreover, moderately reducing the transcriptional activity of
PAR� also exerted resistance effects against type 2 diabetesnd obesity (Deeb et al., 1998). These findings have provided aew hint for developing PPAR� antagonist or partial agonist toiscover novel PPAR�-modulating drugs in anti-diabetic drugesign, which might retain efficacious insulin-sensitizing prop-rties while minimizing potential adverse side effects. Usingresent strategy of FLIPER, we can identify potential weak andtrong antagonists for PPAR� based on the ability of a compoundo inhibit receptor–coactivator interaction to arrest/reduce theranscriptional activity of PPAR�.
. Conclusion
In contrast to in vitro two-hybrid or GST pull-down assay, andnzyme-linked immunosorbent assay (Kodera et al., 2001; Chot al., 2003), the present fluorescence assay allows imaging ofeceptor/coactivator interaction, in real-time, in live cells. High-hroughput screening of PPAR� ligands, agonists/antagonists,aving different potencies for PPAR� is possible with FLIPERndicator. Our fluorescence assay with FLIPER may play a sig-ificant role in the discovery of new therapeutic agents againstbesity, type 2 diabetes, inflammatory diseases and cancers.
cknowledgments
This work was supported by grants from Japan Science andechnology Agency (JST), and Japan Society for the promotionf Science (JSPS).
eferences
wais, M., Sato, M., Lee, X., Umezawa, Y., 2006. Angew. Chem. Int. Ed. 45,2707–2712.
ectronics 22 (2007) 2564–2569 2569
wais, M., Sato, M., Sasaki, K., Umezawa, Y., 2004. Anal. Chem. 76,2181–2186.
ourguet, W., Vivat, V., Wurtz, J.M., Chambon, P., Gronemeyer, H., Moras, D.,2000. Mol. Cell 5, 289–298.
ho, M.C., Lee, H.S., Kim, J.H., Choe, Y.K., Hong, J.T., Paik, S.G., Yoon, D.Y.,2003. J. Biochem. Mol. Biol. 36, 207–213.
ay, C., 1999. Diab. Med. 16, 179–192.eeb, S.S., Fajas, L., Nemoto, M., Pihlajamaki, J., Mykkanen, L., Kuusisto,
J., Laakso, M., Fujimoto, W., Auwerx, J., 1998. Nat. Genet. 20, 284–287.
orman, B.M., Tontonoz, P., Chen, J., Brun, R.P., Spiegelman, B.M., Evans,R.M., 1995. Cell 83, 803–812.
ronemeyer, H., Gustafsson, J., Laudet, V., 2004. Nat. Rev. Drug Discov. 3,950–964.
eery, D.M., Kalkhoven, E., Hoare, S., Parker, M.G., 1997. Nature 387,733–736.
liewer, S.A., Lenhard, J.M., Willson, T.M., Patel, I., Morris, D.C., Lehmann,J.M., 1995. Cell 83, 813–819.
liewer, S.A., Sundseth, S.S., Jones, S.A., Brown, P.J., Wisely, G.B., Koble,C.S., Devchand, P., Wahli, W., Willson, T.M., Lenhard, J.M., Lehmann,J.M., 1997. Proc. Natl. Acad. Sci. U.S.A. 94, 4318–4323.
odera, Y., Takeyama, K., Murayama, A., Suzawa, M., Masuhiro, Y., Kato, S.,2001. J. Biol. Chem. 275, 33201–33204.
ubota, N., Terauchi, Y., Miki, H., Tememoto, H., Yamauchi, T., Komeda, K.,Satoh, S., Nakano, R., Ishii, C., Sugiyama, T., Eto, K., Tsubamoto, Y., Okuno,A., Murakami, K., Sekihara, H., Hasegawa, G., Naito, M., Toyoshima, Y.,Tanaka, S., Shiota, K., Kitamura, T., Fujita, T., Ezaki, O., Aizawa, Y., Kad-owaki, T., 1999. Mol. Cell 4, 597–609.
ee, C., Olson, P., Evans, R.M., 2004. Endocrinology 144, 2201–2207.ee, G., Elwood, F., McNally, J., Weiszmann, J., Lindstrom, M., Amaral, K.,
Nakamura, M., Miao, S., Cao, P., Learned, R.M., Chen, J.L., Li, Y., 2002. J.Biol. Chem. 277, 19649–19657.
eesnitzer, L.M., Parks, D.J., Bledsoe, R.K., Cobb, J.E., Collins, J.L., Consler,T.G., Davis, R.G., Hull-Ryde, E.A., Lenhard, J.M., Patel, L., Plunket, K.D.,Shenk, J.L., Stimmel, J.B., Therapontos, C., Wilson, T.M., Blanchard, S.G.,2002. Biochemistry 41, 6640–6650.
ehmann, J.M., Moore, L.B., Smith-Oliver, T.A., Wilkison, W.O., Willson, T.M.,Kliewer, S.A., 1995. J. Biol. Chem. 270, 12953–12956.
alinowski, J.M., Bolesta, S., 2000. Clin. Ther. 22, 1151–1168.iles, P.D., Barak, Y., He, W., Evans, R.M., Olefsky, J.M., 2000. J. Clin. Invest.
105, 287–292.agy, L., Schwabe, J.W.R., 2004. Trends Biochem. Sci. 29, 317–324.olte, R.T., Wisely, G.B., Westin, S., Cobb, J.E., Lambert, M.H., Kurokawa, R.,
Rosenfeld, M.G., Willson, T.M., Glass, C.K., Milburn, M.V., 1998. Nature395, 137–143.
nate, S.A., Tsai, S.Y., Tsai, M.J., O’Malley, B.W., 1995. Science 270,1354–1357.
ato, M., Hida, N., Umezawa, Y., 2005. Proc. Natl. Acad. Sci. U.S.A. 102,14515–14520.
hiau, A.K., Barstad, D., Loria, P.M., Cheng, L., Kushner, P.J., Agard, D.A.,Greene, G.L., 1998. Cell 95, 927–937.
piegelman, B.M., 1998. Diabetes 47, 507–5014.sai, C.C., Fondell, J.D., 2004. Vitam. Horm. 68, 93–122.mezawa, Y., 2005. Biosens. Bioelectron. 20, 2504–2511.illson, T.M., Cobb, J.E., Cowan, D.J., Wiethe, R.W., Correa, I.D., Parkash,
1877.