Embed Size (px)
Citation preview

A FRAMEWORK BASED ON CONTINUOUS SECURITY MONITORING
A THESIS SUBMITTED TO THE GRADUATE SCHOOL OF INFORMATICS
OF THE MIDDLE EAST TECHNICAL UNIVERSITY
BY
VOLKAN ERTÜRK
IN PARTIAL FULFILLMENT OF THE REQUIREMENTS FOR THE DEGREE OF MASTER OF SCIENCE
IN THE DEPARTMENT OF INFORMATION SYSTEMS
SEPTEMBER 2008

Approval of the Graduate School of Informatics
__________________
Prof. Dr. Nazife BAYKAL
Director
I certify that this thesis satisfies all the requirements as a thesis for the degree of Master
of Science.
___________________
Prof. Dr. Yasemin YARDIMCI
Head of Department
This is to certify that we have read this thesis and that in our opinion it is fully adequate,
in scope and quality, as a thesis for the degree of Master of Science.
_________________
Dr. Ali ARİFOĞLU Dr. Attila ÖZGİT
Supervisor Co-Supervisor
Examining Committee Members
Prof. Dr. Nazife BAYKAL (METU, II) _____________________
Dr. Ali ARİFOĞLU (METU, II) _____________________
Dr. Attila ÖZGİT (METU, CENG) _____________________
Assoc. Prof. Dr. Murat ERTEN (INNOVA) _____________________
Dr. Altan KOÇYİĞİT (METU, II) _____________________

iii
I hereby declare that all information in this document has been obtained and
presented in accordance with academic rules and ethical conduct. I also declare
that, as required by these rules and conduct, I have fully cited and referenced all
material and results that are not original to this work.
Name, Last name: Volkan Ertürk
Signature : _________________

iv
ABSTRACT
A FRAMEWORK BASED ON
CONTINUOUS SECURITY MONITORING
Ertürk, Volkan
M.S., Department of Information Systems
Supervisor: Dr. Ali Arifoğlu
Co-Supervisor: Dr. Attila Özgit
December 2008, 164 pages
Continuous security monitoring is the process of following up the IT systems by collecting
measurements, reporting and analysis of the results for comparing the security level of the
organization on continuous time axis to see how organizational security is progressing in the
course of time. In the related literature there is very limited work done to continuously monitor
the security of the organizations. In this thesis, a continuous security monitoring framework
based on security metrics is proposed. Moreover, to decrease the burden of implementation a
software tool called SecMon is introduced. The implementation of the framework in a public
organization shows that the proposed system is successful for building an organizational
memory and giving insight to the security stakeholders about the IT security level in the
organization.
Keywords: Security monitoring, continuous monitoring, security metrics, security reporting,
security metric automation.

v
ÖZ
SÜREKLİ GÜVENLİK İZLEME ÇATISI
Ertürk, Volkan
Yüksek Lisans, Bilişim Sistemleri Bölümü
Tez Yöneticisi: Dr. Ali Arifoğlu
Ortak Tez Yöneticisi: Dr. Attila Özgit
Aralık 2008, 164 sayfa
Güvenlik izleme çatısı, kurum ve kuruluşlardaki bilişim sistemlerinin sürekli olarak gözlenmesi
için oluşturulmuş bir yöntemdir. Seçilmiş ölçümlerin toplanıp, raporlandıktan sonra analiz
edilerek kurumların güvenlik seviyelerinin zaman ekseninde nasıl değiştiğinin
gözlemlenmesidir. Yapılan akademik yayım taramasında, kurum ve kuruluşlarda bilişim
güvenliği izlenmesi alanında yapılan çalışmaların çok az olduğu gözlenmiştir. Bu tez ile, sürekli
güvenlik izleme çatısı güvenlik ölçümleme methodu baz alınarak oluşturulmuştur. Bunun
yanında çatının uygulanması sürecinde yaşanabilecek zorlukları azaltmak adına SecMon isimli
bir otomasyon yazılımı geliştirilmiştir. Çatının bir kamu kurumunda uygulanması sonucu,
önerilen çatının kurumsal hafızayı oluşturma ve güvenlik yöneticilerine kurumsal güvenlik ile
ilgili anlayış kazandırmada başarılı olduğu gözlemlenmiştir.
Anahtar kelimeler: Güvenlik izleme, sürekli izleme, güvenlik ölçümleri, güvenlik raporlaması,
güvenlik ölçümlerinin otomasyonu.

vi
DEDICATION
To ones,
Enthusiastic about production
Brave enough to look for happiness
Somehow help the earth to become a better place

vii
ACKNOWLEDGMENTS
I would like express my gratitude to Dr. Ali Arifoğlu and Dr. Attila Özgit for their
guidance and insight throughout the research.
During the development of SecMon application, expertise of Seyit Çağlar Abbasoğlu on
C# and expertise of Tolga Özdemirel on PHP/Ajax helped me to save many critical days
of work. Additionally, I am bound to Tolga Özdemirel for his touch on the visual design
of the reporting module.
I want to thank Deniz Hemen and Hamdi Alper Memiş for looking closely at the final
version of the thesis for English style and grammar. Their hard work and patience
deserves more than thanks.
I would like to give my special thanks to Mr. Topuz for his cooperation and assistance
during the pilot implementation of my thesis. Without his support, it would not have
been possible to complete the pilot study in such a tight schedule.
I would to thank my colleagues and managers in inTellect for their support and
encouragement for my BS studies and thesis.
Behind every successful man, there is a woman. For my case this is not one but two. I
would like to render my thanks and congratulate Alev Özbey and Zehra Tatlıcı for their
great faith in me and their patience to tolerate me during this period.
viii
TABLE OF CONTENTS
ABSTRACT .................................................................................................................................. iv
ÖZ .................................................................................................................................................. v
DEDICATION .............................................................................................................................. vi
ACKNOWLEDGMENTS ........................................................................................................... vii
TABLE OF CONTENTS ............................................................................................................ viii
LIST OF TABLES ........................................................................................................................ xi
LIST OF FIGURES .................................................................................................................... xiii
LIST OF ABBREVIATIONS AND ACRONYMS .................................................................... xiv
CHAPTER
1 INTRODUCTION ................................................................................................................. 1
1.1 Background .................................................................................................................... 1
1.2 Problem .......................................................................................................................... 2
1.3 Objective ........................................................................................................................ 4
1.4 Structure of the Thesis ................................................................................................... 4
2 RELATED RESEARCH ....................................................................................................... 6
2.1 Security and Compliance Monitoring ............................................................................ 6
2.2 Security Metrics ............................................................................................................. 8
2.2.1 Definition and introduction .................................................................................... 8

ix
2.2.2 Why do we need metrics? .................................................................................... 11
2.2.3 Who use security metrics? ................................................................................... 13
2.2.4 Taxonomy ............................................................................................................ 14
2.2.5 Security Metrics Development And Implementation Programs .......................... 16
2.2.6 Traps of security metrics ...................................................................................... 23
2.2.7 Sample metrics ..................................................................................................... 24
2.3 Security Reporting And Visualization ......................................................................... 25
3 APPROACH AND FRAMEWORK PROPOSAL .............................................................. 31
3.1 Purpose and Scope ....................................................................................................... 31
3.2 Assumptions ................................................................................................................. 33
3.3 Solution Strategy and CSMF Proposal ........................................................................ 33
3.3.1 Information Security Measures Development ..................................................... 38
3.3.2 Prepare for Data Collection .................................................................................. 43
3.3.3 Collect Data ......................................................................................................... 49
3.3.4 Security Reporting ............................................................................................... 52
3.3.5 Analyze Results.................................................................................................... 58
4 SOFTWARE IMPLEMENTATION OF THE PROPOSED FRAMEWORK .................... 62
4.1 Requirements analysis of the Software Implementation .............................................. 69
4.2 Conceptual design of the database ............................................................................... 73
4.3 Modules of the Proposed Software Implementation .................................................... 74
4.4 Implementation of the SecMon application ................................................................. 78
4.5 Sample Deployment of the SecMon application ......................................................... 78
5 FIELD IMPLEMENTATION OF THE PROPOSED FRAMEWORK .............................. 80

x
5.1 Implementation of the CSMF in a public organization ................................................ 82
6 VALIDATION ................................................................................................................... 100
6.1 Discussion of the objectives ....................................................................................... 100
7 SUMMARY AND CONCLUSION ................................................................................... 113
7.1 Results ........................................................................................................................ 114
7.2 Future Work ............................................................................................................... 115
REFERENCES .......................................................................................................................... 117
APPENDICES
A: List of Candidate Measures ............................................................................................... 120
B: Security Metrics Employed ............................................................................................... 123
C: Organizational IT Security Perception Survey .................................................................. 154
D: Use Case Diagrams ........................................................................................................... 157
xi
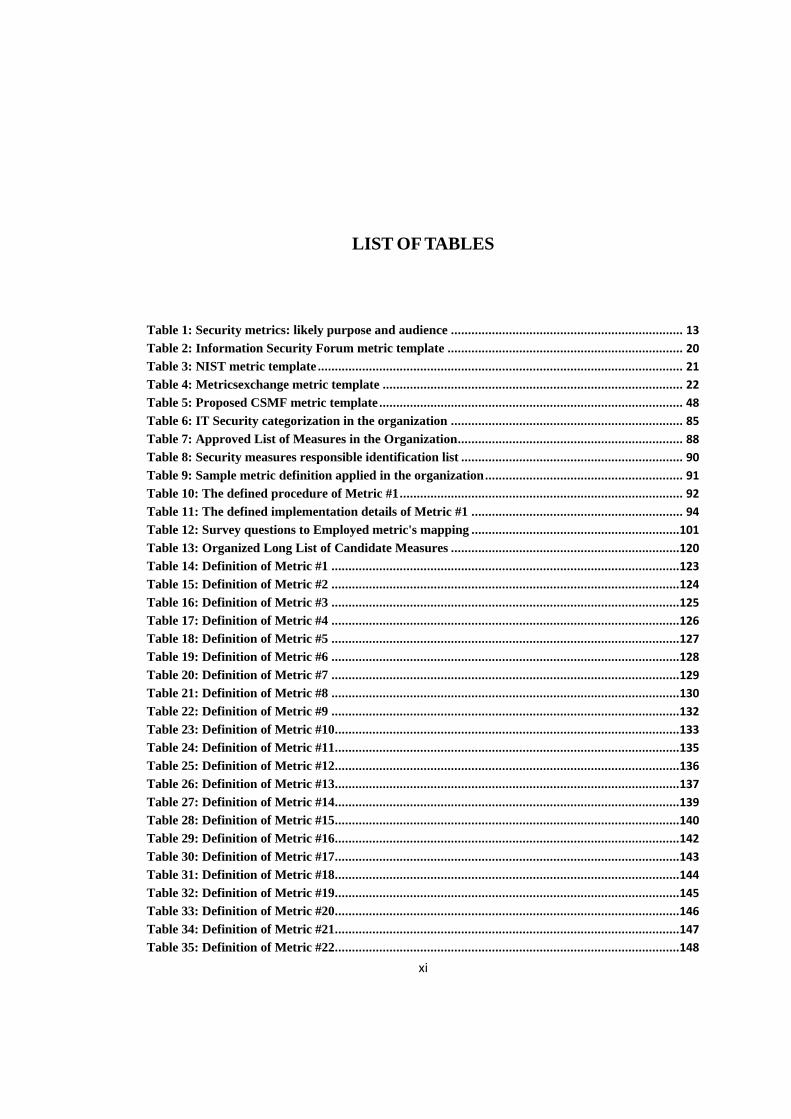
LIST OF TABLES
Table 1: Security metrics: likely purpose and audience .................................................................... 13 Table 2: Information Security Forum metric template ..................................................................... 20 Table 3: NIST metric template ........................................................................................................... 21 Table 4: Metricsexchange metric template ........................................................................................ 22 Table 5: Proposed CSMF metric template ......................................................................................... 48 Table 6: IT Security categorization in the organization .................................................................... 85 Table 7: Approved List of Measures in the Organization .................................................................. 88 Table 8: Security measures responsible identification list ................................................................. 90 Table 9: Sample metric definition applied in the organization .......................................................... 91 Table 10: The defined procedure of Metric #1 ................................................................................... 92 Table 11: The defined implementation details of Metric #1 .............................................................. 94 Table 12: Survey questions to Employed metric's mapping ............................................................. 101 Table 13: Organized Long List of Candidate Measures ................................................................... 120 Table 14: Definition of Metric #1 ...................................................................................................... 123 Table 15: Definition of Metric #2 ...................................................................................................... 124 Table 16: Definition of Metric #3 ...................................................................................................... 125 Table 17: Definition of Metric #4 ...................................................................................................... 126 Table 18: Definition of Metric #5 ...................................................................................................... 127 Table 19: Definition of Metric #6 ...................................................................................................... 128 Table 20: Definition of Metric #7 ...................................................................................................... 129 Table 21: Definition of Metric #8 ...................................................................................................... 130 Table 22: Definition of Metric #9 ...................................................................................................... 132 Table 23: Definition of Metric #10 ..................................................................................................... 133 Table 24: Definition of Metric #11 ..................................................................................................... 135 Table 25: Definition of Metric #12 ..................................................................................................... 136 Table 26: Definition of Metric #13 ..................................................................................................... 137 Table 27: Definition of Metric #14 ..................................................................................................... 139 Table 28: Definition of Metric #15 ..................................................................................................... 140 Table 29: Definition of Metric #16 ..................................................................................................... 142 Table 30: Definition of Metric #17 ..................................................................................................... 143 Table 31: Definition of Metric #18 ..................................................................................................... 144 Table 32: Definition of Metric #19 ..................................................................................................... 145 Table 33: Definition of Metric #20 ..................................................................................................... 146 Table 34: Definition of Metric #21 ..................................................................................................... 147 Table 35: Definition of Metric #22 ..................................................................................................... 148

xii
Table 36: Definition of Metric #23 ..................................................................................................... 149 Table 37: Definition of Metric #24 ..................................................................................................... 150 Table 38: Definition of Metric #25 ..................................................................................................... 151 Table 39: Definition of Metric #26 ..................................................................................................... 152 Table 40: Use Case #1 ........................................................................................................................ 157 Table 41: Use Case #2 ........................................................................................................................ 157 Table 42: Use Case #3 ........................................................................................................................ 158 Table 43: Use Case #4 ........................................................................................................................ 158 Table 44: Use Case #5 ........................................................................................................................ 159 Table 45: Use Case #6 ........................................................................................................................ 159 Table 46: Use Case #7 ........................................................................................................................ 160 Table 47: Use Case #8 ........................................................................................................................ 160 Table 48: Use Case #9 ........................................................................................................................ 161 Table 49: Use Case #10 ...................................................................................................................... 161 Table 50: Use Case #11 ...................................................................................................................... 162 Table 51: Use Case #12 ...................................................................................................................... 162 Table 52: Use Case #13 ...................................................................................................................... 163 Table 53: Use Case #14 ...................................................................................................................... 163 Table 54: Use Case #15 ...................................................................................................................... 164 Table 55: Use Case #16 ...................................................................................................................... 164
xiii
LIST OF FIGURES
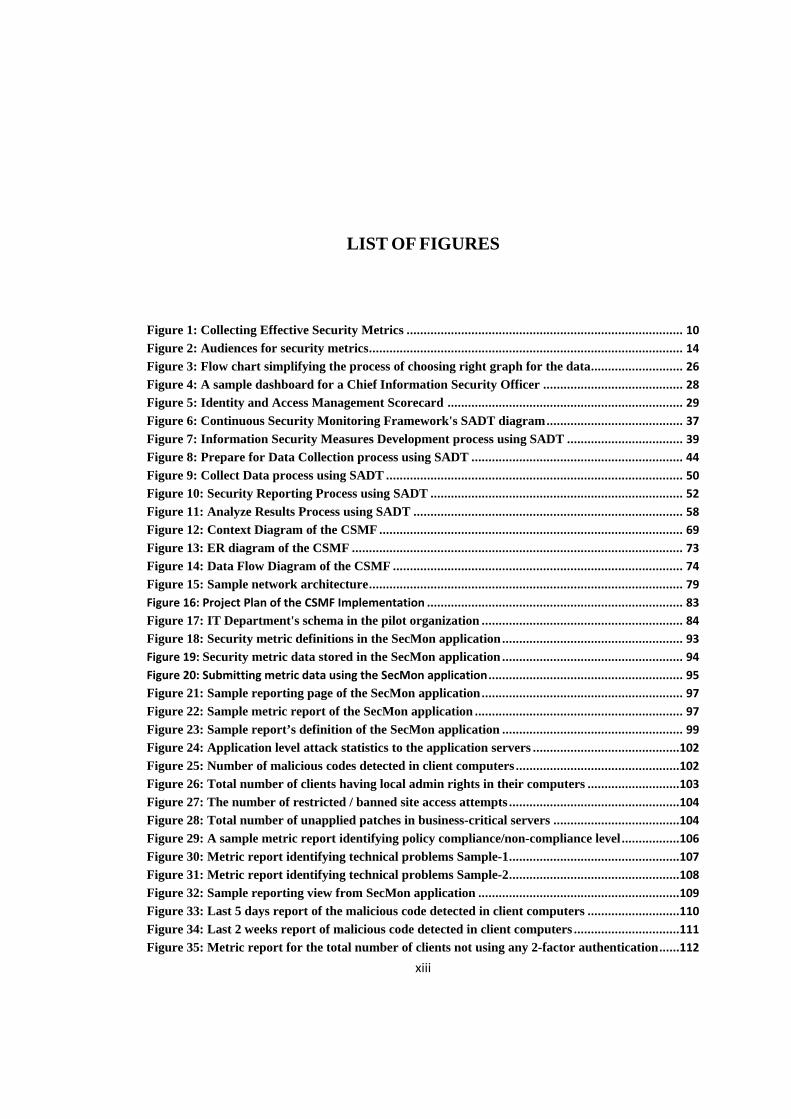
Figure 1: Collecting Effective Security Metrics ................................................................................. 10 Figure 2: Audiences for security metrics ............................................................................................ 14 Figure 3: Flow chart simplifying the process of choosing right graph for the data ........................... 26 Figure 4: A sample dashboard for a Chief Information Security Officer ......................................... 28 Figure 5: Identity and Access Management Scorecard ..................................................................... 29 Figure 6: Continuous Security Monitoring Framework's SADT diagram ........................................ 37 Figure 7: Information Security Measures Development process using SADT .................................. 39 Figure 8: Prepare for Data Collection process using SADT .............................................................. 44 Figure 9: Collect Data process using SADT ....................................................................................... 50 Figure 10: Security Reporting Process using SADT .......................................................................... 52 Figure 11: Analyze Results Process using SADT ............................................................................... 58 Figure 12: Context Diagram of the CSMF ......................................................................................... 69 Figure 13: ER diagram of the CSMF ................................................................................................. 73 Figure 14: Data Flow Diagram of the CSMF ..................................................................................... 74 Figure 15: Sample network architecture ............................................................................................ 79 Figure 16: Project Plan of the CSMF Implementation ........................................................................... 83 Figure 17: IT Department's schema in the pilot organization ........................................................... 84 Figure 18: Security metric definitions in the SecMon application ..................................................... 93 Figure 19: Security metric data stored in the SecMon application ..................................................... 94 Figure 20: Submitting metric data using the SecMon application ......................................................... 95 Figure 21: Sample reporting page of the SecMon application ........................................................... 97 Figure 22: Sample metric report of the SecMon application ............................................................. 97 Figure 23: Sample report’s definition of the SecMon application ..................................................... 99 Figure 24: Application level attack statistics to the application servers ........................................... 102 Figure 25: Number of malicious codes detected in client computers ................................................ 102 Figure 26: Total number of clients having local admin rights in their computers ........................... 103 Figure 27: The number of restricted / banned site access attempts .................................................. 104 Figure 28: Total number of unapplied patches in business-critical servers ..................................... 104 Figure 29: A sample metric report identifying policy compliance/non-compliance level ................. 106 Figure 30: Metric report identifying technical problems Sample-1 .................................................. 107 Figure 31: Metric report identifying technical problems Sample-2 .................................................. 108 Figure 32: Sample reporting view from SecMon application ........................................................... 109 Figure 33: Last 5 days report of the malicious code detected in client computers ........................... 110 Figure 34: Last 2 weeks report of malicious code detected in client computers ............................... 111 Figure 35: Metric report for the total number of clients not using any 2-factor authentication ...... 112
xiv
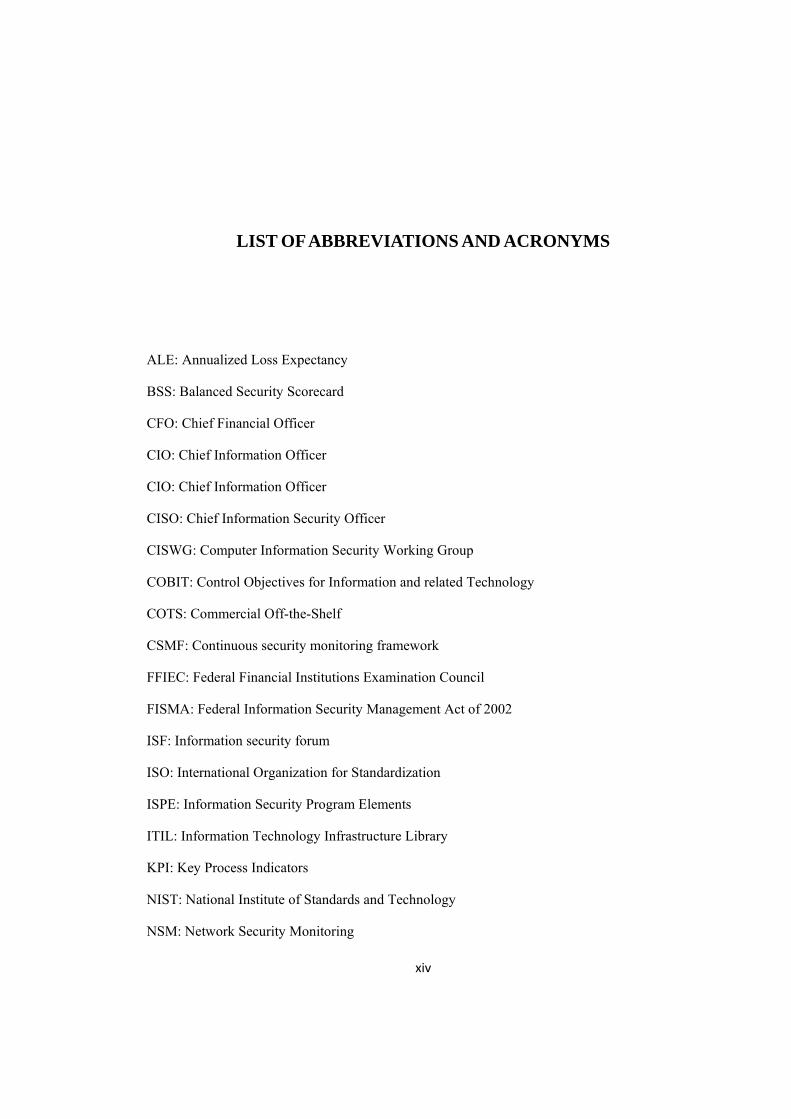
LIST OF ABBREVIATIONS AND ACRONYMS
ALE: Annualized Loss Expectancy
BSS: Balanced Security Scorecard
CFO: Chief Financial Officer
CIO: Chief Information Officer
CIO: Chief Information Officer
CISO: Chief Information Security Officer
CISWG: Computer Information Security Working Group
COBIT: Control Objectives for Information and related Technology
COTS: Commercial Off-the-Shelf
CSMF: Continuous security monitoring framework
FFIEC: Federal Financial Institutions Examination Council
FISMA: Federal Information Security Management Act of 2002
ISF: Information security forum
ISO: International Organization for Standardization
ISPE: Information Security Program Elements
ITIL: Information Technology Infrastructure Library
KPI: Key Process Indicators
NIST: National Institute of Standards and Technology
NSM: Network Security Monitoring

xv
PCI: Payment Card Industry
SCADA: Supervisory Control and Data Acquisition
SEI CMM: Software Engineering Institute’s Compatibility Maturity Model
SEM: Security Event Manager
SNMP: Simple Network Management Protocol
SOX: Sarbanes-Oxley Act of 2002
SADT: Structured Analysis and Design Technique
1
CHAPTER 1
1 INTRODUCTION
1.1 Background
Due to the fact that business processes are becoming IT oriented, security needs of the IT
systems are increasing and becoming even more important day by day. Currently, internet is not
the only source of information but it is also a medium that people do business. Companies have
no choice but to connect their internal networks to the rest of the world, to do business with
customers, suppliers, partners, and their own employees. However, this connection also poses
new threats: malicious hackers, criminals, industrial spies. These threats not only steal
organizational assets, but also cause service shortage or system failure, that is harming the
reputation of the company and frighten customers (Schneier, 2001).
The increased complexity of the internet and its applications and unmanaged e-transformation of
the organizations to seize the new business opportunities have increased the insecurity of the
digital world. IDC survey results point out that IT security is a growing priority for the
organizations and more than 80% of the organizations expect an increase in their IT security
investments. The survey foresees that “The Western European security software market grew by
19.1% in 2006, and will continue to grow from 2006 to 2011 by 11.4%” (Kelly, 2007). Despite
the fact that organizations continuously invest on the IT security products, the security threats
and incidents are increasing day by day. Schneier (2001) explains this fact as: “Security based on
products is inherently fragile. Newly discovered attacks, the proliferation of attack tools, and

2
flaws in the products themselves all result in a network becoming vulnerable at random (and
increasingly frequent) intervals.”
Not only investing on security products but also employing IT security standards enhance the
level of IT security in the organizations. FISMA law for USA federal agencies, Basel II and PCI
financial organizations and ISO 2700X and COBIT with their success stories are chosen to be
implemented either as a must or as a “need to do”. These standards and regulations change the
way that IT security and the IT security operations are managed, which affects the security level
of the organizations positively.
As addressed by the IT security standards and regulations, security monitoring is an essential
part of the organizational security and security management is not possible when monitoring is
absent. Security monitoring is critical to be able to identify control failures before a security
incident occurs, to detect an intrusion or other security incident in due time to give an effective
and timely response, and to support post-event forensics activities (FFIEC, 2006). Schneier
(2001) in his article stresses the importance of security monitoring as: “Monitoring provides
immediate feedback regarding the efficacy of a network’s security— in real time, as it changes
in the face of new attacks, new threats, software updates, and reconfigurations. Monitoring is the
window into a network’s security; without it, a security administrator is flying blind.”
Security monitoring can be employed by the following branches: Organizational security,
standard compliance and executive reporting. Organizational security means the monitoring of
the system to determine threats and vulnerabilities, to detect and interfere in the incidents as
early as possible to avoid or decrease the effects of the malicious activities. Monitoring the
standards compliance is measuring the program compliance level of the system on the basis of
the employed standard (COBIT, ISO 27001 etc.). Executive reporting means revealing an insight
into the organization by executive level reporting the organizational security and standards’
compliance issues.
1.2 Problem
Security monitoring is crucial both for operational and management perspectives. Without
security monitoring, it is not possible to identify the threats and vulnerabilities which cause
security incidents and it is difficult for the security administrators to detect and solve such

3
threats and vulnerabilities. On the other hand, lack of threat and vulnerability information
renders it impossible to make risk analysis. As far as managers are concerned, risk analysis and
current situation of the organization is important to make strategic planning in order to build the
future of the organization. This makes security monitoring not only technically but also
strategically important for the organizations.
Although security monitoring systems have the potential to make such contributions to the
organizations, structured and automated security monitoring systems are not common due to
technical and resource limitations. Here are some of the issues that need to be addressed by the
security monitoring systems:
1. Measurement: It is hard to measure security processes and program compliance as they
are mostly composed of intangible logical and software components. Measures should
be defined and developed.
2. Evaluation and Analysis: It is necessary to control the measurements, to detect the
conflicting measures, to resolve conflicts and to analyze the measurements to draw up
reports.
3. Reporting: Being the only output of security monitoring system, the reporting
capabilities of continuous security monitoring systems are vital for the success of the
implementation. Goal oriented, interactive and easy to use reporting are the basic
functionalities expected from the reporting modules.
4. Automation: As continuous measurements are need to be made on each of the system
component on predefined time intervals to monitor the system; it will not be feasible to
collect frequently needed measures manually. Doing so is waste of resources and may
not be feasible for every case. For the frequent measurements some automation software
has to be employed to decrease the burden and to increase the accuracy of measurement
collection.
5. Management support: Security monitoring is a process that needs good planning and
effort to develop and put it into production. As all the security stakeholders in the
organization need to participate in the implementation of continuous security monitoring
framework, management committee need to both foster and participate the process.
6. Staff participation: For the non-automated measurements, participation of the staff is
needed. Prejudices and doubts of the staff prejudgments and doubts on the

4
measurements should be addresses as staff might take the measurements as individual
evaluation.
7. Sustainability: Due to the change in IT systems of the organizations over time, the
security monitoring needs and the requirements should be adapted accordingly. It is
necessary to adopt the organizational changes and to make fine-tuning of the system
according to the feedback received.
1.3 Objective
The main goal of this thesis is to give managers and administrators an idea about the current
situation and the security trends in the organization by proposing a continuous security
monitoring framework. To reach the goals of the thesis, the following objectives are defined:
Obj-1) To create an organizational memory for changing the IT security perception that
is currently based on individual memory
Obj-2) To assess policy compliance
Obj-3) To determine non-compliance
Obj-4) To detect technical problems
Obj-5) To decrease the complexity of security monitoring
Obj-6) To report on the basis of users’ needs
Obj-7) To give an idea to the managers and administrators about security trends and
current situation IT security in the organization
Obj-8) To improve the security level of the organization in the course of time
Obj-9) To provide benchmarking
1.4 Structure of the Thesis
Proposing a security monitoring framework to give an insight into the organizational security,
CSMF is organized as follows:
• Chapter 2 presents the literature survey about security monitoring, security metrics,
security reporting/visualization and related projects.
• Chapter 3 discusses the writer’s approach to the security monitoring concept and
includes the proposal on the CSMF.
• Chapter 4 includes the discussion of need for software implementation of the proposed
framework and the proposal of the proof of concept application SecMon.

5
• Chapter 5 covers the implementation details of the proposed framework in a pilot
organization
• Chapter 6 includes the validation of the objectives stated in the introduction chapter.
• Chapter 7 concludes the thesis with review of the work done and includes some thoughts
about the future directions.

6
CHAPTER 2
2 RELATED RESEARCH
This chapter introduces main issues about measurement, monitoring, visualization and reporting
from information security point of view. As the continuous security monitoring is a vast concept,
literature survey is narrowed only to the resources showing parallel approaches like use of
security metrics while discussing security monitoring. To give an example, real time monitoring
of hacking attempts with various techniques can also be reviewed under the continuous security
monitoring whereas, as introduced in the introduction chapter, the approach to this case is only
collecting measurement results for reporting about hacking attempts, thus doesn’t include attack
detection techniques, attack response or countermeasures taken during and after the attack. Each
of the concepts discussed in this chapter forms the bases of the thesis approach to continuous
security monitoring that are huge research topics by themselves. As this thesis utilizes each of
them in the proposed framework, related research part summarize the concepts and the
approaches as shortly as possible and these findings will be frequently referred in the approach
chapter while defining the framework.
2.1 Security and Compliance Monitoring
To know and report what is going on, the processes and tasks in organizations’ IT systems is
needed to measure. Monitoring, particularly security monitoring, is the required concept to
understand how the system is acting. Schneier (2001), in his article stresses the importance of
security monitoring as: “Monitoring provides immediate feedback regarding the efficacy of a
network’s security— in real time, as it changes in the face of new attacks, new threats, software
7
updates, and reconfigurations. Monitoring is the window into a network’s security; without it, a
security administrator is flying blind.”
As discussed in FFIEC (2006) booklet, “security monitoring is primarily performed to assess
policy compliance, identify non-compliance with the institution’s policies, and identify
intrusions and support an effective intrusion response. Because security monitoring is typically
an operational procedure performed over time, it is capable of providing continual assurance.”
To detect malicious activity and security controls failures, information systems must be
continuously monitored. The frequency of the security monitoring is varying up to the criticality
of the systems, security policy of the company or up to the compliancy requirements. FFEIC
states that security monitoring level and frequency is subject to the risks (higher risk requires
frequent monitoring) that each system exhibit.
FFEIC classify the security monitoring systems into two parts based on the monitoring type.
First type of monitoring is Activity Monitoring which consists of host and network data
gathering, and analysis includes Network Intrusion Detection Systems, Honeypots and Host
Intrusion Detection Systems and Log Transmission, Normalization, Storage, and Protection.
Second type of monitoring is Condition Monitoring that is composed of Self Assessments,
Metrics and Audit and Penetration tests.
In his doctorate thesis Kuperman (2004) classify computer security monitoring systems into
three parts based on Decision Making Technique: Anomaly Detection, Misuse Detection and
Target Based Monitoring. Anomaly detection technique is described a security violations
detected from abnormal patterns of system usage by Denning (1987). Kuperman defines Misuse
detection is based on a set of fixed rules (based on Expert System, Signature Matching and
Policy Violation) used to determine if a particular audit event should trigger an alarm. Finally,
Target Based Monitoring defined as enumerating certain actions that should never be performed
by any user of a specified system or identifying objects on the system that should never be
accessed by any actions.
Security monitoring is executed by various manual and automated tools and procedures that help
security administrators and managers to monitor the corporate security. Employing advanced

8
security monitoring solutions will decrease the monitoring overhead (while increasing the
budget requirements to built a monitoring system) of the security administrators, giving them
more visibility and faster response possibility to the incidences. Schneier (2001) in his article
stresses that: “Real security is about people. On the day you’re attacked, it doesn’t matter how
your network is configured, what kind of boxes you have, or how many security devices you’ve
installed. What matters is who is defending you.” So by itself security monitoring systems is not
a complete but an important part of the solution, since people monitoring the system and
interpreting the reports are the key factor of success in security monitoring.
Security monitoring needs and implementations are varying in different sectors like finance
(auditing), SCADA (power plant systems etc.) systems and IT systems. Even security
monitoring for IT systems has its own sub-branches like network security monitoring (NSM). In
the book “The Tao of Network Security Monitoring beyond Intrusion Detection”, Bejtlich
(2004) discusses best practices, deployment considerations and products of NSM. There is no
one size fits all security monitoring policy or procedure for the companies. Companies should
define their security monitoring needs up to the standards compliance, criticality of their
systems, procedures/internal requirements and best practices.
2.2 Security Metrics
2.2.1 Definition and introduction
Lord Kelvin’s famous saying “You cannot improve what you cannot measure” also paraphrased
as “an activity cannot be managed if it cannot be measured” is stressing the importance of
monitoring in the organizations. Managers always queries the adequacy of security controls,
policies and procedures in order to decide if additional information security resources are
required and identify and evaluate nonproductive security controls. However, they make
decisions in line with the information they get. Unanswered questions, personal comments or
extreme incident examples highlighted to the managers, can be the examples of misleading the
managers. Jaquith (2007) states; “fear, uncertainty and doubt can be used by the middle
managers or administrators to abuse or misrepresent data for the purpose of manufacturing
security scare stories, thus compel the managers to approve that is required.”
What is needed by the administrators and the managers to get relevant answers for their system,
policy and procedure based questions? In other words, what can be done to objectively measure

9
the processes and events? The candidate for this measure may be the security metrics. Swanson
et al. (2003) from NIST defines security metrics as follows: “IT security metrics are tools
designed to facilitate decision making and improve performance and accountability through
collection, analysis, and reporting of relevant performance related data.” There are various
definitions of security metrics in the literature, all of the definitions include measurement and
improvement terms but the definition varies up to the model or approach followed throughout
the paper.
Measuring IT security related processes, security controls and compliance may not seem a hard
issue initially. System administrators may think that they define questions and get replies in
terms of percentage, size, amount etc and since everything is about numbers, which are discrete
and objective, they can easily measure security controls and compliance. It is not true actually.
Hinson (2006) states that, “measuring anything makes it easier to drive improvements but
measuring the wrong things leads to improving wrong things. The hard part is not measurement
but is figuring out the suite of parameters that need altering and to measure and work on them
all.” One needs to consider some terms and conditions while defining security metrics that make
the metrics: good metrics otherwise they will be the bad metrics. According to George Jelen
(Payne, 2006), good metrics are goal oriented and exhibit SMART characteristics: Specific,
Measurable, Attainable, Repeatable, and Time dependent. Jaquith (2007) in his book defines the
good security metric as: consistently measured, cheap to gather, expressed as a cardinal number
or percentage, expressed using at least one unit of measure and contextually specific. Both of the
“good metric” specifications of Jelen and Jaquith are similar to each other, as the logic behind
the need and development of the metrics is same. Every organization employing security metrics
have to take into consideration of the good metrics defined above; else the results of the
implementation will be ineffective, time-consuming and misleading.
What about the bad metrics? Jaquith (2007) defines bad metrics by negating the good metric
definition as: inconsistently measured, cannot be gathered cheaply, or does not express results
with numbers or units of measure. He also argues that exuberant uses of security frameworks
like ISO 17799 and the annualized loss expectancy (ALE) scores are bad metrics. Jaquith also
comments that being a good taxonomy and audit standard, ISO17799 standard has excessive
focus on audit, subjective success criteria and insufficient attention to measurement that makes
the standard suffer from serious deficiencies as a metrics framework. On the other hand,
10
Villarrubia et al. (2004) proposed a series of security metrics based on the ISO 17799:2000
edition of the standard. It is easily concluded that use of compliance standards as security
metrics are under discussion.
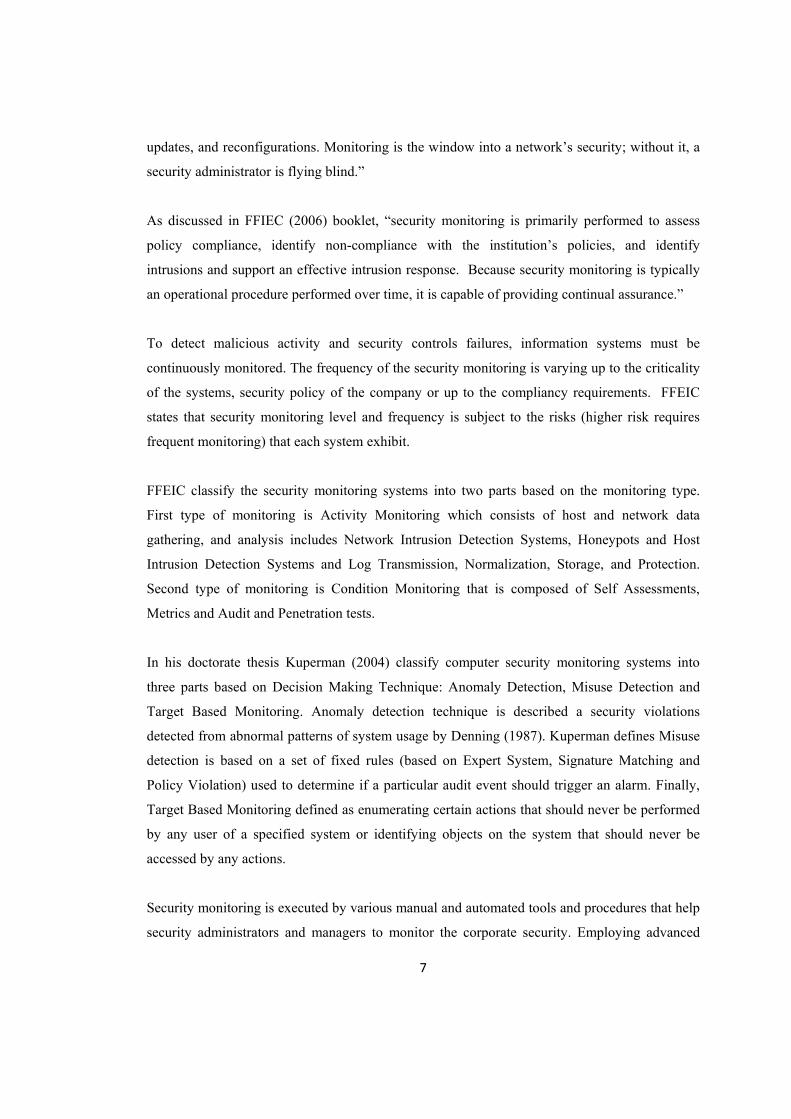
Robert Frances Group’s survey (Robinson, 2005) gives important clues about the use of security
metrics in the organizations. As it can seen in Figure 1 (Robinson, 2005), even if most of the
participant companies (92%) collect and report security metrics, only 39% of them feel that
these practices are effective. This low rate means, rest of the companies spent time on collecting
metrics, but do not use the metric data to monitor the security of the system. There is one
additional criterion, which is the automation of the metrics reporting, the survey shows the real
situation in security metrics implementation that is to say only 8% of the participants have an
automation of the metrics reporting. The only efficient way to measure security in today’s
complex and heterogeneous environments is through automation, which is covered in the
coming sections. This result most probably indicates a lack of centralized metrics data collection
and performing analysis and reporting tasks which are vital for the continuous security
monitoring.
Figure 1: Collecting Effective Security Metrics
Ravenel (2006) commented on the Robert Frances Groups’ survey as: “Most participants
collected and tracked metrics from products that make this process straightforward, such as virus
and spam detection packages. These metrics are an attempt to measure the effectiveness of

11
specific technologies deployed; they are not designed to show information about current
operational risk to the organization, but rather to show some type of return on investment.” This
is an implicit result of the survey which is critical to understand that the security metrics concept
is at the early ages in 2005. The metrics collected by most of the organizations are the
effectiveness metrics that is the measurements showing how a product is performing. The
missing part is that, the selected metrics is far away of providing measurements to facilitate
decision making and implementation of organizations information security programs to
organization-level strategic planning efforts.
2.2.2 Why do we need metrics?
Payne (2006) argues that “Metrics can be an effective tool for security managers to discern the
effectiveness of various components of their security programs, the security of a specific system,
product or process, and the ability of staff or departments within an organization to address
security issues for which they are responsible.” While defining the security metrics it is stressed
that security metrics is important for decision making, managing and improving IT controls and
processes. In the preceding section importance of the security metrics is empowered by the
references from the literature and standards. In this section “Why do we need security metrics?”
question will be discussed and before introducing the security metric program and development
process, how the security metrics help for decision making, managing and improving IT controls
and processes will be discussed.
Chew et al. (2008) from NIST states that, a security metrics program provides organizational and
financial benefits and these benefits include: increasing accountability for information security
performance (identify security controls that are implemented incorrectly, not implemented or
ineffective); improving effectiveness of information security activities (demonstrate quantifiable
progress in accomplishing agency strategic goals and objectives); demonstrating compliance
with laws, rules and regulations; (security metrics program will help to generate compliance
reports and gathered measurements can be used as audit data) and providing quantifiable inputs
for resource allocation decisions (support risk-based decision making by contributing
quantifiable information to the risk management process).
In his book security metrics Jaquith (2007) lists the advantages of employing security metrics as:
• Understand security risks

12
• Spot emerging problems
• Understand weaknesses in their security infrastructures
• Measure performance of countermeasure processes
• Recommend technology and process improvements
Presenting a new approach, Jaquith also states that security metrics can be used for “Diagnosing
problems and measuring technical security activities” and “Measuring Program Effectiveness”.
He has grouped diagnosing problems and measuring technical security activities into four
categories: perimeter defenses, coverage and control, availability/reliability, and applications.
Measuring Program Effectiveness has the subcategories: risk management, policies compliance,
employee training, identity management, and security program management.
Up to the results of the meetings and reaches the Information Security Forum (ISF) (2006), the
following common reasons for employing security metrics were identified:
• Managing information security in an organization
• Providing information for management reporting
• Indicating compliance to legislation, regulation and standards
• Showing efficiency, effectiveness and performance against objectives
• Demonstrating the value of security (return on security investment)
• Supporting the adoption of a risk-based approach to information security
• Supplying information for risk management activities
• Providing information about information security risks
• Highlighting information security strengths and weaknesses
• Benchmarking information security arrangements against competitors or peers.
Why do we need security metrics is a critical question while deciding to implement security
metrics in the organizations. Not being a straight forward process to do, extensive planning,
management support and resource dedication is required for a successful implementation. Above
discussion and answers to the why question can be god starting point in decision making
process.
13
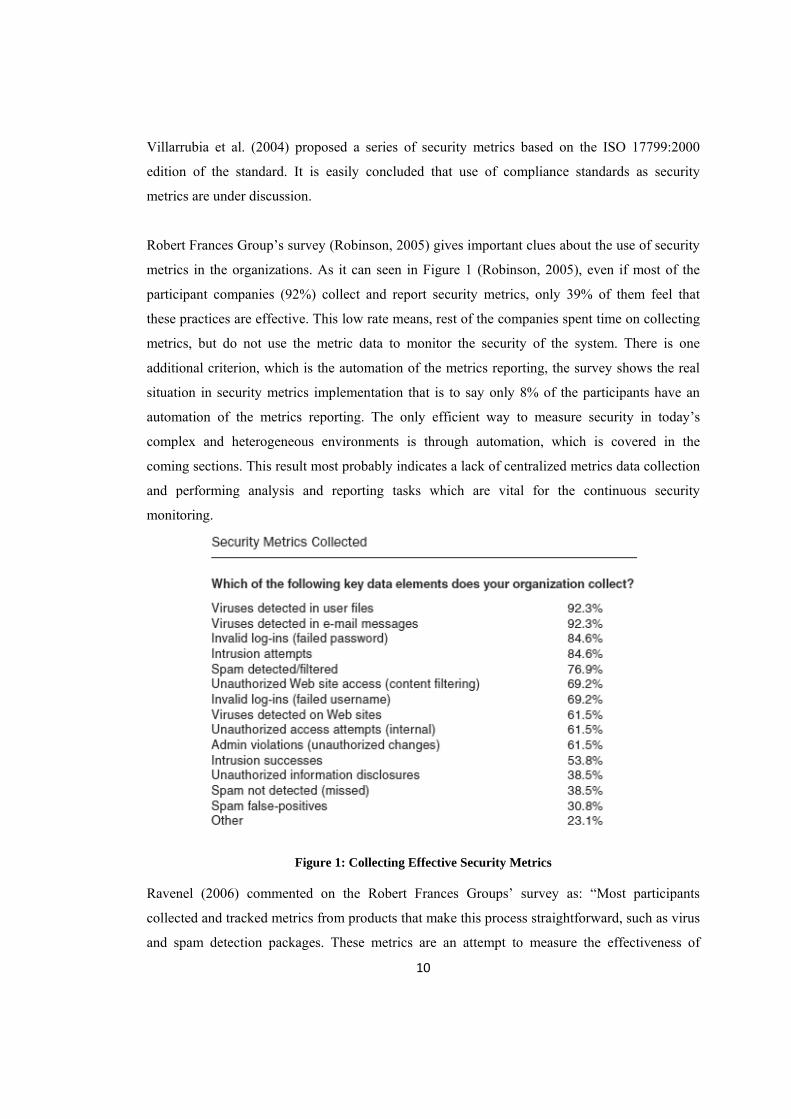
2.2.3 Who use security metrics?
Security metrics are directly related from the technical personnel to the CIO/board of the
company. Defining the roles and responsibilities is important for developing and measuring
security metrics. ISF (2006) states the possible audiences as:
• Broad/executive committee (CxO, including CIO and CISO)
• IT staff and management
• Audit (internal, external and committee)
• Information security function (staff and management)
Table 1 (ISF 2006) defines the roles and purposes of each role in the security metrics
development and management lifecycle. Also Chew et al. (2008) from NIST defines the roles in
responsibilities in the guide of “Performance measurement guide for information security” that is
similar to the definition SIF group made. Because of the table structure notation it is preferred to
annotate the ISF report in this section.
Table 1: Security metrics: likely purpose and audience

14
Figure 2 shows the result of a survey, that is revealing who is using the security metrics most
frequently in the organization. The participants think that CISO will be the one that will use the
security metric tools at most.
2.2.4 Taxonomy
Taxonomies are important for the classification and analysis of the security metrics. Various
number of taxonomy are proposed by Seddigh et al. (2004), Savola (2007), WISSSR (2001),
Vaughn et al. (2003) and Chew et al. (2008) for the categorization of security metrics. This part
includes a review of the most comprehensive and publicly available taxonomies in the literature.
The WISSSR (2001) workshop provides a key venue for researchers for understanding and
interpreting many issues about information security and security metrics. The workshop didn’t
return taxonomy on security metrics however discussions are organized in three tracks: technical
track, organizational track and the operational track. Up to the Seddigh et al. (2004) there would
seem to be an intuitive understanding among workshop participants that three themes would
provide a useful basis around which to organize taxonomy of security metrics.
Vaughn et al. (2003) state that objective of assurance measurement could be grouped into two
distinct categories: assessing an organization's information assurance (IA) posture
(Organizational security) and measuring the IA capabilities of systems or products (technical
target of assessment (TTOA)). Organization security metrics measure the organizational
Figure 2: Audiences for security metrics

15
programs and processes, thus provide feedback to improve the IA posture of the organization.
TTOA metrics measure how much a technical object; system or product is capable of providing
assurance in terms of protection, detection and response. For each category, sub-categories are
also defined and explained in the taxonomy.
Seddigh et al. (2004) introduces an information assurance metric taxonomy to represent the IA
health of an IT network. Paper extends the definition of IA as “the ability of a network or
system to facilitate the timely transfer of information between two or more parties in an accurate
and secure faction” and forms the taxonomy, based on this definition, into three categories:
Security, Quality of Service and Availability. The proposed taxonomy has multi tier approach;
such as each category has different technical, organizational and operational metrics. Each
subcategory has its own subcategories which are defined and explained in details in the paper.
Being one of the complete taxonomy proposals, further work is done by El-Hassan et al., (2008)
using the proposed taxonomy.
Savola, (2007) proposes a high level information security metrics taxonomy that incorporates
both organizational information security management and product management, that emphasizes
the need of a typical company producing information and communication technology products.
Savola defines the highest category as the security metrics for business management and stresses
that the security and trust metrics defined must be aligned to the business/major goals of a
company/organization or a collaborating value to the business. Paper categorizes the business
metrics into five: Security metrics for cost-benefit analysis, Trust metrics for business
collaboration, Security metrics for business-level risk analysis, Security metrics for information
security management (ISM) and Security, Dependability and Trust metrics for ICT products,
systems and services.
July 2003, Swanson et al. (2003) from NIST publishes a comprehensive taxonomy for metric
categorization, namely Security Metrics Guide for Information Technology Systems or SP 800-
55. Categorizing the security metrics into three main categories as: Management, Technical and
Operational, the document provides guidance on how an organization, through the use of
metrics, identifies the adequacy of in-place security controls, policies, and procedures. The guide
includes metric development and implementation process which provides useful data for
managing the information security resources and simplifies the preparation of performance

16
related reports. Revision 1 of the guide is published in July 2008, titled “Performance
Measurement Guide for Information Security” (Chew et al., 2008) is intended to assist agencies
in developing, selecting and implementing security measures to be used at the IT system and
program levels. “Such measures are used to facilitate decision making, improve performance,
and increase accountability through the collection, analysis, and reporting of relevant
performance-related data—providing a way to tie the implementation, efficiency, and
effectiveness of information system and program security controls to an agency's success in
achieving its mission.” guide states. In revision 1, NIST updates the initial metric categorization
as: Implementation metrics (to measure execution of security policy), Effectiveness/ efficiency
metrics (to measure results of security services delivery) and Impact metrics (to measure
business/mission consequences of security events). Revision 1 of the guide additionally provides
additional program-level guidelines for quantifying information security performance in support
of organizations’ strategic goals through strategic planning process.
2.2.5 Security Metrics Development And Implementation Programs
Security metrics program is the master plan for the security metrics implementation in an
organization. There are papers Lowans (2002), Payne (2006), Chew et al. (2008), Jaquith (2007),
Sademies (2004) and Lennon (2003) in the literature either discussing the security metrics
programs or proposing new program models.
NIST states that an information security metrics program should include four interdependent
components. The four components are as follows:
1. Strong upper-level management support; is vital to establish a solid foundation of the
program in the organization for a success implementation.
2. Practical information security policies and procedures; draw the information security
management structure, assign information security responsibilities and lay the
foundation needed to reliably measure progress and compliance.
3. Quantifiable performance measures; is designed to capture and provide meaningful
performance data based on based on information security performance goals and
objectives.
4. Results oriented measures analysis; emphasizes consistent periodic analysis of the
measured data.

17
NIST also defines the success criteria’s of the security metrics program:
• Degree to which meaningful results are produced
• Provide substantive justification for decisions that directly affect the information
security posture
• Assist in the preparation of required reports relating to information security performance
Starting security metric development without planning may lead to wrong or misleading reports
as discussed in the preceding sections. So it is advised to employ a security metrics development
process before moving to the implementation process. According to Lennon (2003), “the
universe of possible metrics, based on existing policies and procedures, will be quite large.
Metrics must be prioritized to ensure that the final set selected for initial implementation
facilitates improvement of high priority security control implementation. Based on current
priorities, no more than 10 to 20 metrics at a time should be used. This ensures that an IT
security metrics program will be manageable.” Parallel to Lennon, Chew et al. (2008)
recommends each stakeholder to be initially responsible of two or three metrics. Thus it is wise
to see the whole picture and choosing right security metrics by processing a security metrics
measurement process.
Payne (2006) proposes a security metrics program which indeed coincides to the term “the
information security measures development process” in the Chew et al. (2008) paper. (Since
there is no common literature for the security metrics, unfortunately different wording for the
same term is a common problem in the security metrics literature.) These seven key steps below
could be used to guide the process of establishing a security metrics development process:
1. Define the metrics program goal(s) and objectives
2. Decide which metrics to generate
3. Develop strategies for generating the metrics
4. Establish benchmarks and targets
5. Determine how the metrics will be reported
6. Create an action plan and act on it
7. Establish a formal program review/refinement cycle
According to NIST, the information security measures development process consists of two
major activities:

18
• Identification and definition of the current information security program
• Development and selection of specific measures to gauge the implementation,
effectiveness, efficiency, and impact of the security controls.
Chew et al. (2008) states that, the information security measures development process is further
divided into following activities, which need not to be done sequential:
1. Stakeholder Interest Identification
2. Goals and Objectives Definition
3. Information Security Policies, Guidelines, and Procedures Review
4. Information Security Program Implementation Review
5. Measures Development and Selection
a. Measure Development Approach
b. Measures Prioritization and Selection
c. Establishing Performance Targets
6. Measures Development Template
7. Feedback Within the Measures Development Process
Chew et al.’s (2008) guide discusses that, “Goals and Objectives Definition Review” activity
produces business impact metrics, “Information Security Policies, Guidelines, and Procedures
Review” activity produces effectiveness/efficiency metrics and “Information Security Program
Implementation Review” activity produces operational metrics.
After developing the security metrics, Chew et al. (2008) guides the readers for the
implementation of the developed metrics using six stepped process called information security
metrics implementation process:
1. Prepare for Data Collection
2. Collect Data and Analyze Results
3. Identify Corrective Actions
4. Develop business case
5. Obtain resources
6. Apply Corrective Actions

19
Having defining two different lists as development and implementation of the security metrics,
NIST’s guide is still parallel to the rest of the security metrics development models proposed in
this section. NIST’s only difference is proposing the definition, identification and development
of the security metrics steps as a separate process than the metrics implementation process.
ISF (2006) proposes the security measures development process phases as follows:
1. Define requirements
2. Identify relevant security metrics
3. Collect data required
4. Produce security metrics
5. Prepare presentations
6. Use dashboards and/or scorecards
7. Review the use of security metrics.
In security metrics book, Jaquith (2007) defines the life cycle of security metric program in 11
phases:
1. Identification
2. Definition
3. Development
4. Quality assurance
5. Production deployment
6. Visualization of results
7. Analysis of results
8. Scorecard layout
9. Scorecard publication
10. Notification publication
11. Scorecard archival
In his paper, Payne also advises to ground the metrics program in process improvement
frameworks that are already familiar to the organization such as Six Sigma, ISO17799 and SEI-
CMM. In the absence of any preexisting framework, Payne proposes: “a top-down or a bottom-
up approach for determining which metrics might be desirable could be used. The top-down
approach starts with the objectives of the security program, and then works backward to identify

20
specific metrics that would help determine if those objectives are being met, and lastly
measurements needed to generate those metrics.” NIST documentation (Chew et al. (2008)) did
not explicitly define such a requirement but discuss the framework need in many chapters of the
guide over the SP800-53A “Guide for Assessing the Security Controls in Federal Information
Systems” guide.
Developed metrics should be in a standard format to ensure the repeatability, development,
measurement, analysis and reporting of the metrics. The standard format called metric template
will guide the developer to provide the required details by requiring input for each field of the
template. Except the general fields like metric name, value and frequency, the template
definitions may vary up to the metric development model and the implementation details. Below
two metric development models’ and a metric development project’s metric templates are
presented.
ISF (2006) metric template:
Table 2: Information Security Forum metric template
Characteristic Comments
Title A meaningful title (or name) to describe the security metric Purpose What the security metric is designed to do Cost An estimate or actual cost of collecting the security metric
Type What the security metric is, for example: technical or managerial; leading or lagging; numerical or textual
Location
Where the data for the security metric can be collected, previous data used in the security metric is located and previous instances of the security metric can be found
Frequency How often the data needs to be collected and the security metric needs to be presented
Category The category a security metric should be placed in such as number, frequency, duration and cost
Start/stop criteria
Criteria for starting and stopping the collection of data for the security metric and use and presentation of the security metric
Duration of collection An estimate of, or actual, time period in which data will be collected
Duration of use An estimate of, or actual, time period in which the security metric will be used

21
Chew et al. (2008) Metric template:
Table 3: NIST metric template
Field Data
Measure ID State the unique identifier used for measure racking and sorting. Goal Statement of strategic goal and/or information security goal. Measure Statement of measurement.
Type Statement of whether the measure is implementation, effectiveness/efficiency, or impact
Formula Calculation to be performed that results in a numeric expression of a measure
Target Threshold for a satisfactory rating for the measure, such as milestone completion or a statistical measure.
Implementation Evidence
Implementation evidence is used to compute the measure, validate that the activity is performed, and identify probable causes of unsatisfactory results for a specific measure.
Frequency Indication of how often the data is collected and analyzes and how often the data is reported.
Responsible parties
Indicate the following key stakeholders: Information Owner, Information Collector, and Information Customer.
Data sources Location of the data to be used in calculating the measure Reporting format
Indication of how the measure will be reported, such as a pie chart, line chart, bar graph, or other format.

22
Nichols’ (2008) metric template proposal that is used in metricsexchange project:
Table 4: Metricsexchange metric template
Field Data
Name The description of the metric Version A sequentially assigned version number for the metric definition
Rating A score that is derived from user ratings of the metric. Displayed as 0-5 stars
Views The number of page views that have been served as a measure of a metric’s popularity
Description of Results
A description of results produced by the metric in terms, including unit(s) of measure
Target A description of desired result--can be as simple as “Low is good” High Water Mark
All time record high value or a value that is considered to be in the highest 10%.
Low Water Mark
All time record low value or value that is considered to be in the lowest 10%.
Objective A description of what the metric is designed to measure and why it is important
Abstract A discussion of key characteristics, how to interpret, background, etc. How to Calculate A detailed description of how to calculate the metric from raw data sources
Sources Description of sources that could provide needed data to compute the metric
Measurement Frequency Suggested measurement rate, e.g. real-time, hourly, daily, weekly, etc Default Visualization An image that represents an effective way to visualize computed results
License A reference to a license such as GPL, LGPL, Mozilla, etc that defines terms of use
Created/Updated Dates State Possible states: Draft, Reviewed, Approved, in-Production, Passive.
Tags A list of tags from one or more context hierarchies to indicate the metric’s relevance to a topic
Owner The name of the metric’s owner who has the authority to transition the metric state
Contributors A list of individuals that have contributed to the definition of the metric
Use Cases
A description of practical experiences in using the metric from registered Metrics Center members, can include identification of unintended consequences
Cost to Measure Discussion of implementation costs
Scale Discussion of issues related to scalability
Scope Discussion if issues related to scope

23
2.2.6 Traps of security metrics
Up to now several facts about the security metrics is revised and discussed. Before practicing the
use of security metrics in continuous security monitoring system, it will be wise to review the
fallacies of the security metrics in order not to make the well know mistakes in the project.
Wiegers (1997) in the paper, "Software Metrics: Ten Traps to Avoid" explains the common
fallacies of the metric program as follows:
1. Lack of Management Commitment: Educating the managers, tying the metrics program
to the business goals and meeting the managerial needs will increase the manager
commitment.
2. Measuring Too Much, Too Soon: Begin with employing small and balanced (from each
metric type) number of metrics. Expanding the program after getting useful results is
important.
3. Measuring Too Little, Too Late: User resistance may be an issue as without metrics
users are more comfortable working Undercover. As with number two, the balanced set
of metrics is critical to success.
4. Measuring the Wrong Things: Select measures that help steering process improvement
activities, by showing whether process changes are having the desired effect. Review the
audience of the metrics data, and make sure the metrics being collected will accurately
answer their questions.
5. Imprecise Metrics Definitions: A complete and consistent set of definitions for the
things being measured is essential to combine data from several sources.
6. Using Metrics Data to Evaluate Individuals: Clear statement and management
understanding of the goals of the metrics is important and if this success the metrics
won’t be used for individual evaluation.
7. Using Metrics to Motivate, Rather than to understand: Metric measurement results are
informative and should be used to understand and evaluate the current reality so to
improve processes accordingly.
8. Collecting Data That Is Not Used: Selected public metrics trends must be made visible
to all stakeholders, so that the contributors of the program will see and support the
program.
9. Lack of Communication and Training: If used participation is required, the participants
to the program must be trained.

24
10. Misinterpreting Metrics Data: Monitor the trends that key metrics exhibit over time, and
don’t overreact to single data points.
2.2.7 Sample metrics
There are various on purpose developed metrics in the literature. Defining the goals and targets
of the security metrics program, organizations can employ the required metrics from the below
resources and also develop by themselves.
Jaquith (2007) in his book developed two types of metrics to measure the technical security level
and the compliance program effectiveness:
• Diagnosing Problems and Measuring Technical Security: 80 metrics defined.
• Measuring Program Effectiveness: 65 metrics defined.
Current version of the Security Metrics Catalog, by PlexLogic (n.d.) project is publishing sample
program compliance metrics about the following standards:
• ISO 27002: 132 metrics defined.
• CISWG’s ISPE controls: 105 metrics defined.
• NIST taxonomy applied for Application Security metrics: 41 metrics defined.
Kahraman (2005) in his thesis developed metrics to measure IT Security Performance and the
adequacy of security policies and protocols. The metrics are organized as follows:
• Organizational View: 43 metrics defined
• Technical view: 47 metrics defined
Nichols et al., (2007) in the paper “A Metrics Framework to Drive Application Security
Improvement” defined the key metrics for application security monitoring.
Chew et al. (2008) in the NIST guide “Performance measurement guide for information
security” includes both system and program level sample metrics in the appendix based on the
“Recommended Security Controls for Federal Information Systems” guide from NIST.
Additionally the key performance/goal indicators in the COBIT and ITIL guides can be referred
for the development of security metrics.

25
2.3 Security Reporting And Visualization
Managers used to monitor or audit business by doing site visits or examining the paper work of
the organization. As the IT automation ratio in business increases, the reporting and the
monitoring needs changed and need increased in parallel. In this section the visualization and
reporting concepts are surveyed from IT security point of view and major findings are
summarized.
Literature has various articles and projects about reporting and visualization, even if the subject
is limited to the “security”. For example, DAVIX (http://davix.secviz.org) project and Mukosaka
and Koike’s (2007) paper present good security visualization approaches but these approaches
are processing various types of raw (non-metric based) data that is making them unusable for the
security metrics reporting. To narrow the research and get reusable approaches, the survey is
limited to the reporting and visualization of the security metrics. The books and articles
summarized below are chosen based on this criterion.
Jaquith (2007) thinks that the most popular security data visualization tools which are bar/pie
charts and traffic lights are problematic, as bar/pie charts present little data in relatively huge
space and traffics lights oversimplify issues. He states that the effective visualization of metrics
data boils down to six principles:
• The presented data is important, not the design
• Just say no to three-dimensional graphics and cutesy chart junk
• Don’t use the wizards to create crowded graphs
• Erase the needless parts of the graphs
• Reconsider Technicolor for using monochromatic colors
• Label honestly and without contortions
Many types of graphs introduced in the literature can be used to visualize data. Each graph has
its own features and is suited for a specific analysis scenario. Some graphs are great at
visualizing large amounts of data; others are better suited for highlighting slight variations and
trends.
Here is a short list of the most widely used graphs from the Jaquith (2007) and Marty (2008):

26
• Simple pie/bar/line charts
• Stacked pie/bar/line charts
• Histograms
• Time Series Charts
• Box plots
• Scatter plots
• Parallel coordinates
• Link graphs
• Two-by-Two Matrices
• Period-Share Chart
• Pareto Charts
• Maps
• Tables
• Treemaps
Marty (2008) summarizes the process of choosing the right graph in Figure 3. Up to aim of the
graph (showing distribution, relationship, comparison or trend) and visualization needs;
concerning the available data, below graphs can be chosen for security reporting.
Figure 3: Flow chart simplifying the process of choosing right graph for the data
Each of the listed graphs has different capabilities and emphasizes specific aspects of the data
presented. The graphs facilitate the analysis of the distribution of values in a single dimension or
27
the relationship between two or more dimensions in the data. The details of each of the graph
format is not covered as this much detail is out of scope of the thesis.
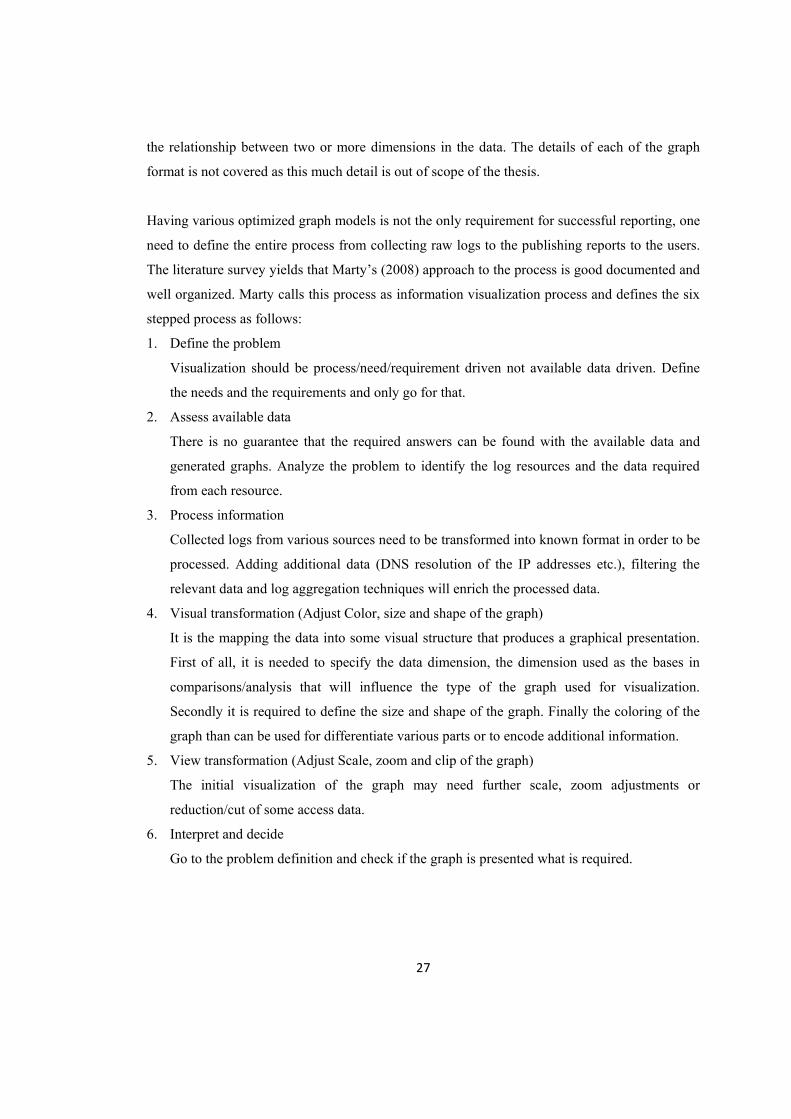
Having various optimized graph models is not the only requirement for successful reporting, one
need to define the entire process from collecting raw logs to the publishing reports to the users.
The literature survey yields that Marty’s (2008) approach to the process is good documented and
well organized. Marty calls this process as information visualization process and defines the six
stepped process as follows:
1. Define the problem
Visualization should be process/need/requirement driven not available data driven. Define
the needs and the requirements and only go for that.
2. Assess available data
There is no guarantee that the required answers can be found with the available data and
generated graphs. Analyze the problem to identify the log resources and the data required
from each resource.
3. Process information
Collected logs from various sources need to be transformed into known format in order to be
processed. Adding additional data (DNS resolution of the IP addresses etc.), filtering the
relevant data and log aggregation techniques will enrich the processed data.
4. Visual transformation (Adjust Color, size and shape of the graph)
It is the mapping the data into some visual structure that produces a graphical presentation.
First of all, it is needed to specify the data dimension, the dimension used as the bases in
comparisons/analysis that will influence the type of the graph used for visualization.
Secondly it is required to define the size and shape of the graph. Finally the coloring of the
graph than can be used for differentiate various parts or to encode additional information.
5. View transformation (Adjust Scale, zoom and clip of the graph)
The initial visualization of the graph may need further scale, zoom adjustments or
reduction/cut of some access data.
6. Interpret and decide
Go to the problem definition and check if the graph is presented what is required.

28
Using dashboards in security reporting:
A security dashboard is a visual display of security information needed that is designed up to the
target audience and can be monitored at a glance. Figure 4 (Marty, 2008) presents a sample
security dashboard. Marty (2008) proposes to use dashboards for real-time monitoring to
understand the current state of the systems and applications and presently ongoing tasks or
events of interest.
Figure 4: A sample dashboard for a Chief Information Security Officer
Marty (2008) grouped the required reporting dashboards for the computer security monitoring
into three:
1) Strategic: A business level dashboard that helps monitoring the execution of strategic
objectives.
2) Tactical: An IT/IS level dashboard, used for tracking processes of departments, networks,
states of machines, etc.
3) Operational: A process level dashboard used to track core processes, metrics, and status.

29
Up to the organizational needs and efforts one or more of the dashboards can be built for
security reporting. As it is straight forward from the definitions, operational dashboards presents
low level information to the security analysts for real time monitoring the technical issues.
Tactical dashboards are used for analyzing security issues to understand the root cause of the
problems that are used by the managers. Strategic dashboards include business oriented trend
reports used for the coordination and collaboration of the top management with the
organizational security trends.
In parallel to the dashboards, Jaquith (2007) argues that Balanced Security Scorecard (BSS)
provides a holistic view of organizational security performance. Parallel to general techniques,
balanced security scorecard balances Financial, Customer, Internal Process, and Learning and
Growth in terms of security perspectives to arrive at an overall security scorecard for an
organization. Audience targeted BSS can be used for one screen reporting of the organizational
IT security.
Figure 5: Identity and Access Management Scorecard

30
Figure 5 (ClearPoint Metrics, 2008) is a sample security scorecard developed by the ClearPoint
metrics, crafted specially for monitoring the identity and access management activities. Being a
successful example of security monitoring using scorecard/dashboard, it can be categorized as an
operational scorecard, as it includes low level technical information to the security analysts for
real time monitoring the technical issues. The proposed balanced security scorecard by Jaquith
on the other hand, can be categorized as strategic scorecard that can be a powerful reporting tool
for the top managers.
Nichols, E. A. and G. Peterson (2007) uses security scorecard to report on OWASP Top 10
categories. The used security scorecard provides additional indicators that show an upward,
downward, or unmoving trend for the given time period relative to previous periods. Opacki
(2005) in his article argues the two methods of building security scorecards and give hints for
producing executive scorecards.

31
CHAPTER 3
3 APPROACH AND FRAMEWORK PROPOSAL
3.1 Purpose and Scope
How can organizational information security be monitored? As discussed in the survey chapter,
one needs to collect and process the cumulative data, and to report the findings. Let’s think about
continuous security monitoring of an ATM. The bank installs a camera, which collects data, to
record continuously the things happening around the ATM. In case of a reported incident or at a
suspicious circumference, the camera recordings are reviewed and the information needed is
gathered from the archived video, which processes the cumulative data. Finally the findings are
reported to the related parties, which is the reporting part. Information security monitoring is not
very different from this example, only the data monitoring frequency (on scheduled bases or
after an incidence) and the utilization of the cameras and the recordings vary according to the
implementation and the maturity of the organization.
As discussed in section 2.1, security monitoring is made to assess policy compliance, to identify
non-compliance, to detect technical problems, to identify intrusions and to support an effective
intrusion response. Each of these activities is comprehensive in themselves and various
automation products are developed to address the detection (such as non-compliance with
mobile device use policy) and reporting requirements of these issues. In other words, it is not
hard to find programs or services that meet most of organization’s needs with regard to the either
of the above listed activities. However, this is not enough to solve the problem of security
monitoring, actually the problem starts here, that is to say each organization uses tens to
hundreds of products and technologies to secure its organizational assets and operations (or

32
decreasing/escalating security risks) and this fact makes the security monitoring complex and
also renders it hard to manage the security monitoring on a daily basis.
Each security product’s reports are valuable to see the performance of a product and more
importantly, to track how the system is performing. These reports are mostly used by the system
administrators or security officers to monitor the performance of the products in order to make
fine-tuning in configurations. What about the manager of the administrators or the chief
information security officer who is trying to monitor the system? Shall they need to ask a copy
of every single report from the administrators and try to obtain required data for tracking
organization-wide security? What if the product reports do not include the answers of the
questions the managers have? What about the excessive data presented in the reports? Well,
current technologies can do better; system administrators can define custom reports in line with
the needs of the managers in each product to address the above-mentioned needs. This requires
much effort and might not be feasible in every organization. Although this approach will provide
the required data with less bulk data, processing of these various reports, like comparing values
within current reports, comparing reports with old reports or analyzing and reasoning the results,
is the aspect that is not addressed in this approach.
Continuous security monitoring framework (CSMF) proposes a security measurement, collection
and reporting framework. Similar approach exists in the Security Event Management (SEM)
products, which are implementing central log management via collection, aggregation,
correlation and reporting of the raw logs and event from various system sources. However, there
is a significant difference in the nature of two approaches; SEM products process logs and
generate reports based on the raw logs and events whereas, CSMF collects metric data, which is
based on the organizational needs and goals. Therefore, SEM tools present the data that can be
obtained from the system logs and the organizations use the reports that are required, however,
CSMF formulates the measurements based on the organizational monitoring/reporting needs,
thus, may meet every need of the organization. CSMF may also use the SEM products’ reports
and findings as an input. Therefore, it is possible to say that SEM tools are more focused
products that can be used by the CSMFs.
As discussed in section 1.3, the main goal of this thesis is to give an insight to the managers and
administrators about the current situation and the security trends in the organization. Utilizing

33
the well-known security measurement guides, with enhanced usability and few prerequisites, the
CSMF presents measures development and implementation methods in order to provide the
managers with meaningful and mandatory security oriented information. As validated in chapter
6, organizations employing the CSMF (with or without a software implementation) gain an
insight into the organizational security and will see the improvements in the security level of the
organization in the course of time.
3.2 Assumptions
To be able to talk about security monitoring in an organization, first of all the organization
should have some level of security. An organization having preliminary security controls (which
is more than the risk tolerance of the organization) should make investments in order to increase
the organizational security to an acceptable level, which is documented and agreed by the
management. Although it is possible to talk about security monitoring in an organization having
preliminary security controls, the limited visibility in the system and the expected findings will
turn out to be a gap analysis but not security monitoring. That is to say, the proposed continuous
security monitoring framework requires the organizations to have defined and well-functioning
IT security in the organizations.
The proposed security monitoring framework is purely designed for the IT security needs of an
organization. Applied security monitoring perspective does not cover the sectors like health care,
homeland security and industrial control systems using IT technologies. Thus, this approach may
not be applicable to any SCADA or purpose built IT systems.
3.3 Solution Strategy and CSMF Proposal
Solution strategy and framework proposal section includes the discussion of the security metric
implementation approaches (which is covered in the research chapter) and the proposal of the
developed approach for the security monitoring. The CSMF approach has a systematic approach
for continuous security monitoring for the organizations, which is easy to follow and apply in
production systems. Since the framework has few prerequisites but offers various
implementation details, it constitutes a good reference for continuous security monitoring.
Security monitoring is not a straight-forward topic that can be easily applied in the organizations
since it is a continuous process that has many fallacies, which may cause the efforts to fail. As

34
discussed in the survey chapter, use of security metrics is commonly agreed for security
monitoring, however, the use of security metrics vary in terms of standards and guides.
Therefore, use of security metrics for security measurement is taken as a fact and the discussion
will be around how to use the security metrics to build a framework for security monitoring.
Categorization of the security measurements is important to link the measures to business
processes and stakeholders. This categorization will help the organizations to gain a wider
insight into the development and application of security measures. Metric taxonomies are used to
classify the security metrics by providing logical groupings and the relationships between them.
There are various taxonomies proposed in literature. The comprehensive ones reviewed in
section 2.2.4 can be listed as: Seddigh et al. (2004), Savola (2007), WISSSR (2001), Vaughn et
al. (2003) and Chew et al. (2008). Taxonomies reflect the motivation of approach to the metric
categorization. After the revision of the listed taxonomies, the proposed taxonomy by NIST is
chosen to be the most applicable to grouping metrics for use of security monitoring. Here is the
short list review which explains why NIST’s taxonomy is chosen:
• WISSSR (2001): Having classified the metrics as technical, organizational and operational,
actually this is an intuitive understanding of the metric taxonomy. Despite being a key
reference for researchers, it is far from being a complete taxonomy.
• Vaughn et al. (2003): Grouping the security metrics as the assessment of an organization's
organizational security and the measurement of information assurance capabilities of
systems or products, Seddigh et al. (2004) concluded that further work may be needed to
refine the taxonomy in order to make it appropriate for an IT organization. On the other
hand, the intention of applying it against a specific product makes the taxonomy not
applicable for security monitoring in an organization.
• Seddigh et al. (2004): Defining the taxonomy on the basis of Security, Quality of Service
and Availability groups. Information assurance being the main motivation, proposed
taxonomy is not appropriate for to be used for security monitoring. In addition to technical
controls, security monitoring may encompass (up to the implementation) process
monitoring, compliance monitoring and IT governance dimensions, which makes the
proposed taxonomy inapplicable or hard to apply together with a security metrics program
used.

35
• Savola, (2007): Adoption of a wider perspective and inclusion of both information security
and product management topics under five metric groups are the strong parts of the
taxonomy. On the other hand, lack of application details renders this approach inappropriate
for use.
• Chew et al. (2008): In the revised revision of the guide, NIST's publication categorizes
security metrics as Implementation, Effectiveness/Efficiency and Impact. Implementation
metrics will provide daily operational results, effectiveness/efficiency metrics will conduct
the security services delivery results and impact metrics will provide the business/mission
consequences of security events in the organization. This approach and metric categorization
in the revised version meet the requirements of business processes of the information
systems and program security controls. A supportive argument is raised by Seddigh et al.
(2004): “Unlike Vaughn taxonomy's TTOA category, NIST's technical category of metrics is
not intended to apply against a specific product.” Here, Seddigh emphasizes that system-
wide approach is vital for successful application of security monitoring. These points
demonstrate that among the above-reviewed taxonomies, the NIST’s taxonomy is the best-
fitting one to be applied for security monitoring.
Therefore, the proposed framework will categorize the applied/developed metrics under one of
the following categories:
1. Implementation Metrics
2. Effectiveness/ Efficiency Metrics
3. Impact Metrics
Compared to organizations with emerging IT systems, mature organizations are expected to
apply more effectiveness/efficiency and impact metrics, and this is interpreted by Chew et al.
(2008) as: “…less mature information security programs need to develop their goals and
objectives before being able to implement effective measurement. More mature programs use
implementation measures to evaluate performance, while the most mature programs use
effectiveness/efficiency and business impact measures to determine the effect of their
information security processes and procedures.”
Successful implementation of security monitoring relies on the correctness and effectiveness of
the measure development and implementation processes. Incorrect measures will be misleading

36
for the organization in various aspects, and will contradict with the objectives of the security
monitoring. Correctness of the measures does not mean only to calculate metric data in a correct
way; it also involves the selection and definition of correct metric set (for the organization),
which is used to define what to monitor. Application of inaccurate metrics for the organization
leads to the collection of useless metric data, to put it differently, waste of valuable
organizational resources. On the other hand, incorrect calculation of metric data will present
non-existing issues as facts. These fallacy points are addressed in the CSMF by the information
security measure development and information security measures implementation processes.
Information security measures development process is the development and selection of specific
measures to gauge the security controls, whereas information security measures implementation
process consists of identification, development, selection, collection and reporting of metrics that
are defined by the information security measures development process.
While comparing the security metrics development models, it can be easily seen that each model
is substitutable by one another. For example Chew et al. (2008) states that “The information
security measures development process consists of two major activities; identification and
definition of the current information security program, and development and selection of specific
measures…” which means “Information Security Measures Development” corresponds to
“Identification”, “Definition” and “Development” processes in the model proposed by Jaquith
(2007) and “Define requirements” and “Identify relevant security metrics” terms in the model
proposed by ISF (2006). Similar correspondences can be named for the rest of the processes in
the models. As each model can correspond one to another, one of the popular and commonly
used reference’s security metrics development and implementation processes are employed to
utilize in the proposed framework, which is the Chew et al.’s (2008) guide known as NIST
SP800-55. While keeping the governing ideas and naming structure of the Chew et al.’s (2008)
information security measures development process, it is tuned for security monitoring purposes,
to be adopted easily by the organizations in the CSMF.

37
Figure 6: Continuous Security Monitoring Framework's SADT diagram
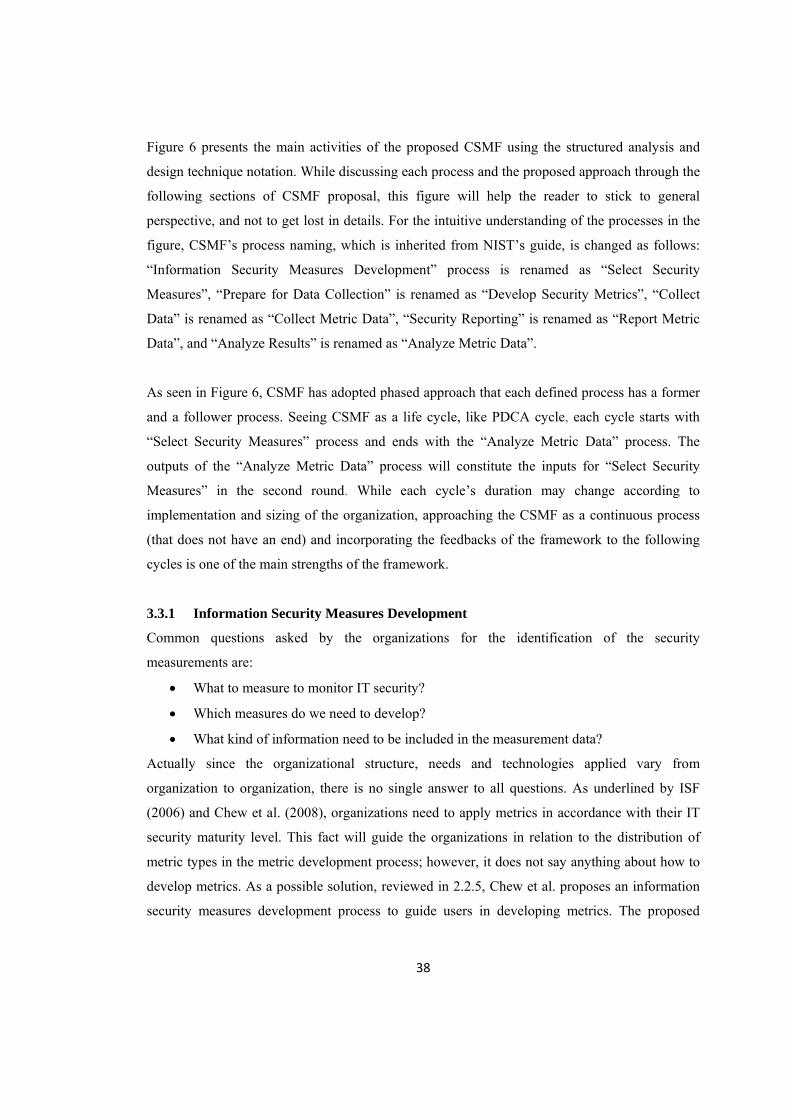
38
Figure 6 presents the main activities of the proposed CSMF using the structured analysis and
design technique notation. While discussing each process and the proposed approach through the
following sections of CSMF proposal, this figure will help the reader to stick to general
perspective, and not to get lost in details. For the intuitive understanding of the processes in the
figure, CSMF’s process naming, which is inherited from NIST’s guide, is changed as follows:
“Information Security Measures Development” process is renamed as “Select Security
Measures”, “Prepare for Data Collection” is renamed as “Develop Security Metrics”, “Collect
Data” is renamed as “Collect Metric Data”, “Security Reporting” is renamed as “Report Metric
Data”, and “Analyze Results” is renamed as “Analyze Metric Data”.
As seen in Figure 6, CSMF has adopted phased approach that each defined process has a former
and a follower process. Seeing CSMF as a life cycle, like PDCA cycle, each cycle starts with
“Select Security Measures” process and ends with the “Analyze Metric Data” process. The
outputs of the “Analyze Metric Data” process will constitute the inputs for “Select Security
Measures” in the second round. While each cycle’s duration may change according to
implementation and sizing of the organization, approaching the CSMF as a continuous process
(that does not have an end) and incorporating the feedbacks of the framework to the following
cycles is one of the main strengths of the framework.
3.3.1 Information Security Measures Development
Common questions asked by the organizations for the identification of the security
measurements are:
• What to measure to monitor IT security?
• Which measures do we need to develop?
• What kind of information need to be included in the measurement data?
Actually since the organizational structure, needs and technologies applied vary from
organization to organization, there is no single answer to all questions. As underlined by ISF
(2006) and Chew et al. (2008), organizations need to apply metrics in accordance with their IT
security maturity level. This fact will guide the organizations in relation to the distribution of
metric types in the metric development process; however, it does not say anything about how to
develop metrics. As a possible solution, reviewed in 2.2.5, Chew et al. proposes an information
security measures development process to guide users in developing metrics. The proposed
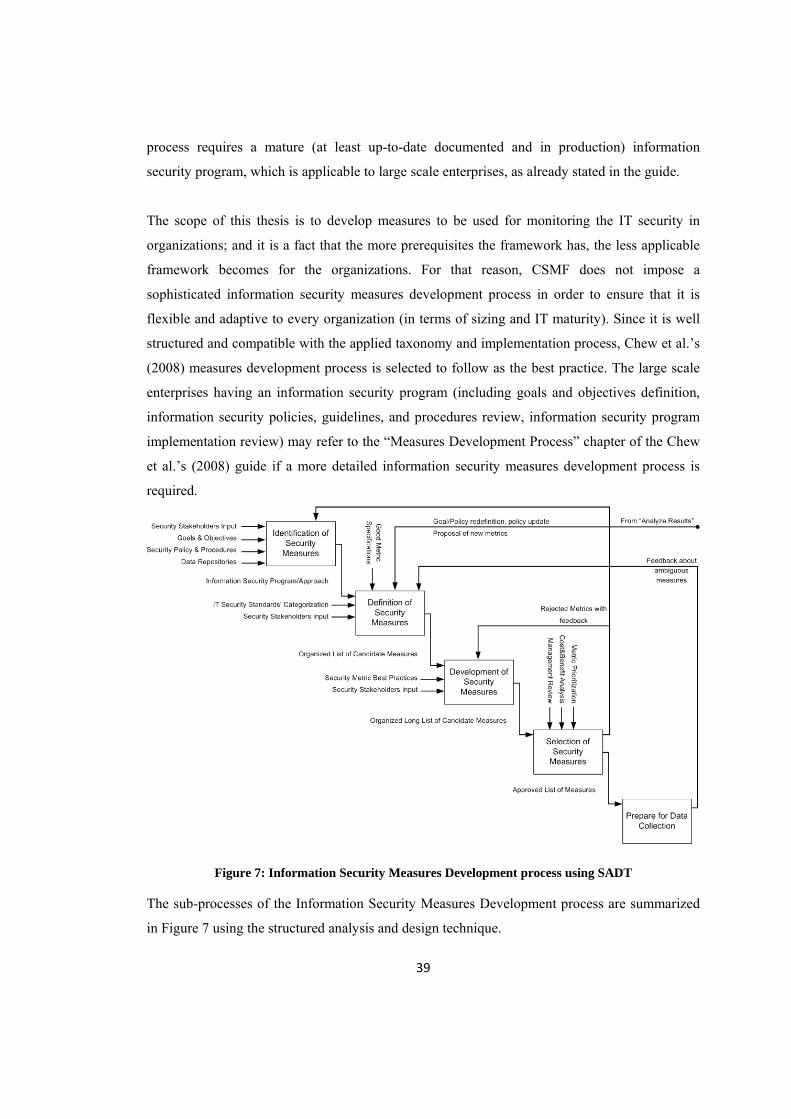
39
process requires a mature (at least up-to-date documented and in production) information
security program, which is applicable to large scale enterprises, as already stated in the guide.
The scope of this thesis is to develop measures to be used for monitoring the IT security in
organizations; and it is a fact that the more prerequisites the framework has, the less applicable
framework becomes for the organizations. For that reason, CSMF does not impose a
sophisticated information security measures development process in order to ensure that it is
flexible and adaptive to every organization (in terms of sizing and IT maturity). Since it is well
structured and compatible with the applied taxonomy and implementation process, Chew et al.’s
(2008) measures development process is selected to follow as the best practice. The large scale
enterprises having an information security program (including goals and objectives definition,
information security policies, guidelines, and procedures review, information security program
implementation review) may refer to the “Measures Development Process” chapter of the Chew
et al.’s (2008) guide if a more detailed information security measures development process is
required.
Figure 7: Information Security Measures Development process using SADT
The sub-processes of the Information Security Measures Development process are summarized
in Figure 7 using the structured analysis and design technique.

40
Information security measures development process aims to identify and define the information
security approach/program in the organization, and to develop relevant security measures to
gauge the security controls. NIST recommends using four-phased security measures
development process, namely, identification, definition, development and selection. Being the
planning phase of the security monitoring, information security measures development process
requires most participation, effort and attention from every stakeholder in the organization, since
defective plans do not stand any chance of being concluded with successful implementation.
Identification of the security measures needs to be based on the information security
stakeholders’ inputs. Limiting identification only to certain roles or departments leads to
overlook the business strategy, since each stakeholder’s interest will lie on different aspects of
business. In addition to executive committee, CIO, CISO, Information Security Officer,
administrators and security engineers, also CFO, Training Centre and Human Resources can be
counted as security stakeholders. These stakeholders’ interests need to be considered to
successfully identify the organizational measure needs. Although “stakeholder interests are
driven by laws and regulations” (Chew et al. (2008)), during the identification phase, various
methods such as interviews, brainstorming sessions need to be used to determine the interests of
each stakeholder. Stakeholders’ involvement to each process is vital for ensuring a sense of
ownership of the information system security measures at multiple levels of the organization.
Depending on the structure and size of the organization, the responsible staffs that take role in
the process vary. To give an example of the ideal case: every information stakeholder, with the
help of Information Security Officers, selects and/or develops security metrics, Chief
Information Security Officer can revise and review the chosen metrics and Chief Information
Officer approves the work and presents it to upper management. As this example is only
applicable to large scale enterprises, it is possible to have more than one task that can be
undertaken by the same staff in small and medium size organizations.
Information security goals and objectives are valuable documents from which performance
measurement criteria can be derived with the contribution of relevant security stakeholders. On
the other hand, if available, organization specific security policies, guidelines and procedures
applied can be reviewed to identify information security controls and performance targets to

41
develop related metrics. Finally, data repositories or data sources can be reviewed to reveal
implementation evidence facts, indicating information security performance objectives being
met, or the level of applicability. With the contribution of the related stakeholders, the above
listed sets of information sources produce a “list of candidate measures”. These candidate
measures are expected to represent the organizations’ perception and priorities in information
security.
One needs to consider some terms and conditions while defining security metrics that make the
metrics good metrics, otherwise they will turn out to be bad metrics to implement. As discussed
in section 2.2.5, Jaquith (2007) defines the good security metric as: consistently measured, cheap
to gather, expressed as a cardinal number or percentage, expressed using at least one unit of
measure and contextually specific. The measures developed by the stakeholders should comply
with the good metric definition; else implementation of the metric will be ineffective, time-
consuming and misleading.
The candidate measures will be numerous for most of the organizations, thus requiring some
leveling and categorization. For the organizations implementing any of the IT standards or
frameworks (like ISO 27001, COBIT or ITIL), it is best to categorize (organize) the candidate
measures according to standard/framework applied in the organization. As the standard’s
approach (categorization) applied in the IT security is well-known by security stakeholders,
developing a security measure system structured parallel to the standard used will ease the
management and the understanding of the candidate security measures. Organizations not
following any of the IT standards or frameworks may even apply one of the IT standard’s
approaches or define their own categorization. (Likewise, they can generic headlines: Perimeter
Security, Client Security, Physical Security and Software Security) Defining measures’
categorization will enable organizations to have an “organized list of candidate measures”.
Although getting input from security stakeholders and reviewing organizational goals, policies
and procedures in order to produce candidate measures is the recommended and ideal way of
developing measures, immature or inexperienced organizations in the field of security
monitoring might prefer to review security measures best practices available in the literature.
This review will help the security stakeholders to compare in-house built metrics with the best
practices so that the measures requiring correction and measures’ categories lacking metrics can

42
be reinforced with appropriate best practice measures. A list of resources that include well
known best practice security measures are listed in Section 2.2.7. Reinforcing best practice
measures will increase the number of measures in the list; thus, will enable the organization to
have an “organized long list of candidate measures”. Finalized list will be claiming that this set
of measures are expressing and covering the organizational security measurement needs.
With the aim of covering the missing points in the categorized measures list, organizations, if
needed, may revise the order of above discussed perspective that first defines the categorization,
then reviews the best practice measures and finally (if required) develops additional metrics
from scratch to cover the lacking points in the categorized measures list. Even though initial
approach is recommended, organizations lacking defined policies, procedures and/or
inexperienced in the field of security measurement might decide to use the alternative approach.
Measures development phase is followed by the selection phase. Reviewing the best practices or
translating every objective in the procedures and guidelines may lead to have numerous metrics
to collect and monitor. However, as discussed in section 2.2.5, it is important to start with a
small number of metrics (around 10 to 20) then in line with the success of the program, it is wise
to increase the number of metrics. This raises the question of how we can decide on the relevant
metrics among the developed long list of candidate measures. Chew et al. (2008) recommends
prioritization of candidate measures in accordance with the predefined organizational criteria,
such as:
• Facilitates improvement of high-priority security control implementation
• Uses data that can be realistically obtained from existing sources and data repositories
• Measures processes that already exist and established.
Another important aspect that needs to be considered while prioritizing measures is the cost of
collecting measures data in the organization. The burden of data collection in the chosen metrics
is an important factor while applying metrics which has high collection frequency (measures
data collected hourly). If an organization needs to exert days of man/hour effort to collect
weekly measures data, this burden will affect the sustainability of the program in the midterm.
Besides the cost/benefit balance, security measures implementation needs to balance the
automation level to the burden of manual processes for the success of the program. That is to
say, it is not required or needed to automate every single measure developed for the

43
organization, as this will limit the choice of measures or will pose technological obstacles to the
measure collection.
Considering the above discussed security measure prioritization and automation
recommendations, IT security manager, with the contribution of the security stakeholders, will
review the organized long list of candidate measures and, if needed, the number of chosen
measures is reduced to a reasonable number for the organization. The review process leads to the
“organized short list of candidate measures”. Finally the short metric list is presented to the
upper management to get their approval. Feedbacks of the upper management including, rejected
metrics and comments on the metrics are conveyed to the information security stakeholders for
further discussions and revisions. The approved list of measures will be used in the security
metrics implementation process to define, collect and report on the selected measures.
3.3.2 Prepare for Data Collection
Prepare for data collection process may be confusing after reviewing Information Security
Measures Development process as reader might think that why an additional preparation for data
collection is required since the approved list of security measures are produced in the
information security measures development process. Approved list of security measures is the
approved measurement perspective of the organization for security monitoring in the
organization for a period of time, however it does not include any implementation details of each
measurement. Organizations need to define further details of each measure so that the approved
security measures become “security metrics” that can be collected and reported for security
monitoring.
Given approved list of security measures, one can directly move to the data collection process
bypassing the preparation for data collection, however, it is for sure that the implementer will
spend more time and make mistakes while trying to collect metrics data. Ignoring the planning
of metric data collection will lead to the failure of the implementation phase as defective plans
do not stand any chance of being concluded with successful implementation.
Prepare for Data Collection process will end up with the developed security metrics and it
involves information security measurement identification, definition, development and selection

44
sub-processes. This process shows each approved measure’s goal, responsible party, data source,
reporting, and data collection frequency details that will be used in the data collection process.
Figure 8: Prepare for Data Collection process using SADT
The Prepare for Data Collection process and its relation to other processes are stated in Figure 8
using the structured analysis and design technique.
An important aspect in metric development is the role and responsibilities of the users that are
involved in the processes. Questions to define possible roles are as follows:
• Who will derive the related metrics from the approved measures?
• Who will define the metric goals, target and baseline values of the metrics?
• Who will collect the metric data from in-production metrics?
• Which users/roles are authorized to monitor each metric report?
The staff responsible for the above-mentioned duties varies according to the structure and size of
the organization. In small to medium organizations, more than one task may be performed by the
same staff. However, the most important point is to delegate the liability of a certain task to a
specific staff so that problems related to the metric can be reported to and handled by a specific
person.
Defining the goals of the measures is important to remember and follow up the main reason of
metric development. It is important to remember that security monitoring is not a technical
45
activity but a management activity to bring an insight to the stakeholders. Definition of a goal is
important in terms of revising whether the metric definition is compatible with the
organizational goals and targets defined for security monitoring. On the other hand, according to
the business needs, limitations, performance targets and baselines may need to be defined for
each measurement. For instance, for a e-commerce organization, the uptime of the e-commerce
servers are critical for the doing business and reputation, thus, may define the baseline of the
availability of the e-commerce servers as 99.9% and targeting 100% as this metric is business
critical for the organization. Finally the metric data frequency defines how often the metric data
is collected and reported. According to the rate of change in particular security control and the
criticality of the measurement, the frequency is defined as follows: hour, day, week, month,
quarter and year. The ambiguous measures detected via the identification and definition sub-
processes are reported to the relevant information security stakeholder for review.
As a last point, CSMF recommends to define alert criteria and alert type for each metric. (Most
probably alerting functionality will be useful in a software implementation of the CSMF.) As
baseline and target measurement values are defined for each metric, for the real time or average
metric measures not satisfying the defined business or technical condition, alert condition can be
defined.
Identification and definition of the security metrics is followed by the development of the related
metrics. Different from the measures development, metric development defines how to calculate
the metric data via a written procedure and covers the consequences of the concepts discussed
during the identification and definition sub-processes. This procedure should be replicable and
need to be based on the organizational resources only. That is to say, procedures should not use
evaluation products to generate metric data or non-replicable inputs like statistics from the
output of an audit report generated quarterly to feed a metric having weekly frequency. The
procedures formulate how to collect the metric data to be used in the metric calculation
formulae.
Metric calculation is required to be well defined to avoid any ambiguity during the data
collection process. Therefore, for each metric definition, a mathematical formula including the
explanation of the terms/parameters used in the formulas need be defined. It is common to have
more than one metric formula and collected data (can be named as sub-metric) to calculate the

46
require metric, an example of this implementation type can be observed in the Appendix chapter
of the Chew et al. (2008). This approach increases the complexity during the data collection and
reporting processes as one metric might become a dozen of metrics, and decreases the reuse of
the sub-metrics. Hence, CSMF employs the approach of naming each data collection and
formulation as a single metric in other words, calling the sub-metrics of the above approach as
metrics. As this approach significantly increases the number of defined metrics, organizations
can introduce grouping or numbering (with sub-numbers) of the metrics to better organize and
manage the metrics. This approach will decrease complexity and ambiguity in the metric
formulas by using the (sub) metric numbers instead of names. Moreover, this will enhance the
drill down reporting capability of the CSMF as each (sub) metric can be inquired easily.
Selection sub-phase stands for the decision making on conflicting issues encountered in the
metric development process. As is the case in the selection of data collection and tracking tools,
organizations may have more than one way of implementing metrics in certain conditions, thus
selection sub-phase is introduced to resolve this issue.
As it is discussed in the solution strategy, the measures developed in the information security
measures development process are grouped under the NIST taxonomy as: Implementation
Metrics, Effectiveness/ Efficiency Metrics and Impact Metrics, however, distribution of the
number of employed security metrics in each metric group varies by the maturity of the
information security program. Considering that the CSMF has a life cycle, at the establishment
period of the program, it is expected to have more implementation metrics. In the subsequent
cycles, more effectiveness and efficiency metrics can be developed according to the success of
the implementation metrics and the change in the organizations maturity level. Chew et al.
(2008) describes this metric development and metric change cycle as follows: “Although
different types of measures can be used simultaneously, the initial concentration is on the
implementation metrics. As the implementation of the information security program matures and
performance data becomes more readily available, measuring will focus on the program
effectiveness/efficiency and the operational results of security control implementation. Having
integrated the information security into organization's processes, the mission or business impact
of information security-related actions and events can be determined by analyzing and
correlating the measurement data.”
47
To ease the management of the implementation metrics, although not available in the chosen
taxonomy, the framework further divides the implementation metrics into two:
1. Technical security measurement
2. Compliance measurement
By the further partitioning, it becomes easier to follow up two distinct and significant topics in
addition to easy management and reporting in line with the metric types.
Discussion of what needs to be done to develop security metrics from the security measures
demonstrates that many points need to be clarified and documented. In order to represent
security metrics in a standard and formal way, as reviewed in section 2.2.5, ISF (2006), Chew et
al. (2008) and Nichols (2008) propose security metric templates. It is a fact that these templates
guide people so that it becomes easier to define the metric via answering certain questions. In
addition to representation of the security metrics, employing a security metric template will also
contribute to the detailed and complete definition of each metric developed.
The analysis of each template reveals that the basic fields are same in each template, such as:
Metric Name, Goal, Value, Type, How to Calculate, Target, Frequency and Responsible Party.
Chew et al. (2008) states that “...depending upon internal practices and procedures, organizations
may tailor their own performance measurement templates by using a subset of the provided
fields or adding more fields on their environment and requirements.” The metric templates under
discussion are good examples of NIST’s statement. For example Nichols (2008) proposes a
detailed template having 24 metric data fields to be used in the metrics-exchange project since
the web-based user interface, metric editor, metric rating & ranking and metric licensing features
employed requires these fields. On the other hand, ISF (2006) and Chew et al. (2008)’s
templates have 10 and 11 metric data fields respectively. It must be noted that metric data fields
in each template can be extended/restricted in accordance with the implementation needs of the
security metric development process.
The proposed CSMF requires the metric template to have data source information, reporting
requirements, production state, reference information and alerting requirements in addition to the
common requirements defined by the reviewed templates. As there is a need for this set of
additional requirements, none of the proposed templates is fully appropriate for the security
monitoring framework. Thus, extending the proposed security templates with the current needs

48
of the framework, CSMF metric template is defined in Table 5. While defining the CSMF
template only the must-to-have fields are employed from the reviewed templates in order to
decrease the burden of the metric development/collection and increase the usability without
missing any functionality. CSMF metric template including the explanation of each metric data
field is as follows:
Table 5: Proposed CSMF metric template
Field Description Metric Definition State the unique identifier used for measure racking and sorting. Goal Statement of strategic goal and/or information security goal. Value Value of the metric measurement. Unit Unit of the value
Type Statement of whether the measure is implementation, effectiveness/efficiency, or impact
Category State in which category the metric definition is under based on employed standards or in-house defined categorization.
How to Calculate Calculation to be performed that results in a numeric expression of a measure
Target Threshold for a satisfactory rating for the measure, such as milestone completion or a statistical measure.
Baseline Value that is considered to be least tolerable threshold.
Frequency Indication of how often the data is collected and analyzes and how often the data is reported.
Responsible parties
Indicate the following key stakeholders: Information Owner, Information Collector, Information Customer and Metric Owner
Data sources Location and type of the product/information to be used in calculating the measure
Reporting format Indication of how the measure will be reported, such as a pie chart, line chart, bar graph, or other format, including unit(s) of measure
Reference Specify the reference if the metric is employed from other sources.
State Possible states: Draft, Reviewed, Approved, inProduction, Passive.
Alert Criteria Alert criteria definition that will trigger an alert, such as not receiving metric data or metric data is below the baseline etc.
Alert Alert type definition (e-mail, SMS, event log etc.) and alert content.

49
In the implementation sub-process, organizations are expected to build their security metric lists
based on the above template including the metric data calculation procedures. After the
completion of security metrics list, organizations may pass to the “collect data” process.
3.3.3 Collect Data
Collect Data phase involves methods of metric data collection, metric data storage and
identification of collected metrics meeting the goals defined. Chew et al. (2008) puts data
collection and result analysis steps in the same process as Collect Data and Analyze results.
Details of this phase can be listed as follows:
• Collect measures data
• Aggregate measures as appropriate to derive higher level measures
• Consolidate collected data and store in a format conducive to data analysis and reporting
• Conduct gap analysis to compare collected measurements with targets and identify gaps
between actual and desired performance
• Identify causes of poor performance
• Identify areas that require improvement
As data collection and result analysis, including security reporting, are the key points of security
monitoring, according to the CSMF, the best approach would be to discuss each process on
distinct sections. Thus, approach chapter will be better organized and reader will be able to
follow each phase easier. Therefore, only the first three steps will be covered under data
collection phase, while the rest of the steps will be discussed in the Analyze Results phase.

50
Figure 9: Collect Data process using SADT
The Collect Data process and its relation to other processes are given in Figure 9 using the
structured analysis and design technique.
As security metrics are identified by the information security stakeholders, data source can be
any business asset or process that can be measured according to the business needs. Due to the
unforeseeable nature of the data sources, the metric data collection tools need to be flexible to
ease the integration of the security measurement system into the organization’s architecture.
Depending on CSMF approach, possible data sources can be grouped into three as:
1. System Users
2. System Devices
3. Administrative Units
System users are the employees of the organization observing or learning about the security
issues while communicating with colleagues in daily operations. Examples of the system users
can be: managers, (CIO, executive committee members, etc.) human resources department
members, security officers and administrators (DB, System, Application, Security and Network).
System devices are the system assets used by the organization to enable communication and
security in the organization such as firewall, IPS/IDS, vulnerability scanner, antivirus
management system, proxy, mail server, switch, user database, router, web server, application
server, database, ERP and CRM systems. Administrative units stand for both paperwork and

51
digital data-stores and reports in the organization such as penetration test reports, audit reports,
asset database, configuration management reports, patch management reports, incident
management reports, and identity and access management reports. Although this categorization
does not help the manual implementation of the CSMF, data sources’ categorization will be
important to identify the data flows for the organizations planning to use software
implementations.
An important point that requires clarification is the security metric collection and storage issues.
Although the best way to implement the CSMF is to use a digital data-store in order to keep
metric data and employ a software tool in order to ease the submission of metric data to the
defined data-store, the CSMF does not force to use any software automation. Organizations can
employ any kind of paper work or spreadsheet kind of office automation tools to run the CSMF.
Each choice offers certain advantages both from technological and financial point of views.
Small to medium enterprise organizations, having a small set of metrics and a dedicated staff for
the management of security operations, may perfectly implement the CSMF. On the other hand,
large scale enterprises which have numerous security stakeholders and security metrics need to
implement software automation in order to centrally collect metric data and communicate reports
to the related users.
As discussed in section 3.3.1, security metrics automation is vital for the employed metrics
having high frequency of collection. Security metrics automation means, automatic collection
metric data collection on defined intervals. This automation does not need to be the software
implementation of the whole CSMF, but the automation of a method that produces the metric
data. To illustrate, one may need to get the statistics file from the anti-spam gateway to collect
number of spam e-mails daily, and this can be done by writing down the statistics from the GUI
of the program at noon every day. Automation of the method can be achieved by writing a script
that copies the statistics file to another location and by scheduling the script to run daily at noon.
During the implementation of the CSMF, implementers will observe that excessive but valuable
information will be collected and processed for calculating the required metric data. An example
of this may be metric reporting the number of client computers having out-of-date antivirus
signatures. Although metric definition only requires the number of the computers, one needs to
make a list of computers having out-of-date antivirus signatures to count them and report as the

52
metric data. Even though not required by the metric definition, the list may be required during
the security evaluation meetings. Although it is not a requirement of the CSMF, keeping the
details of the metric data is recommended.
In any phase of the metric data collection process, cases such that the metric definition and the
real world implementation does not match and metric data collection may not be possible as
documented can be encountered. As long as it is possible to handle this problem with minor
updates in the metric definition within the security manager’s knowledge, the metric will be used
in the production environment and related security stakeholder will not be informed about the
case. The metric data collected on the predefined intervals is used for the reporting and analysis
of the security measurements as described in the following section.
3.3.4 Security Reporting
The major aim of the security reporting in the scope of the CSMF is to get to understand of the
collected metric data and it does not include developing a model to predict about possible future
incidents in the organization. Because of this, time-series analysis methods (like statistical time-
series analysis) are not covered, only approaches and tools that help to get to understand of the
collected data is analyzed and some of them are employed by the framework.
Figure 10: Security Reporting Process using SADT
53
The Security Reporting process and its relation to other processes are stated in Figure 10 by
using the structured analysis and design technique.
As every single security and network product has detailed reporting facility, detailed technical
reports are easily generated and commonly used in the organizations. On the other hand,
consolidated security reports (made up of numerous products, giving insight about information
security) are expensive to prepare and mostly drawn manually but this type of reporting is the
most needed type, since custom designed reports inform the target audience on need to know
bases. Based on this fact, the CSMF recommends using role based dashboards for the overview
of the organizational security based on the dashboard grouping discussed in section 2.3 based on
Marty’s (2008) proposal:
1) Strategic dashboards
2) Tactical dashboards
3) Operational dashboards
In this way, every single user will see a role based, personalized, global information security
view of the organization, with respect to the authorization and responsibility of the staff. This
will help the users (especially for the users using operational and tactical dashboards) to see the
security-wide whole picture of the organization before drilling down into the details of each
business issue. Thus, security dashboards help users to:
• Make prioritization about the current issues
• Avoid missing or ignoring important issues
• See all the problems in the same window, therefore helping the user to approach the case
from different perspectives.
Fundamentally, security dashboards use the reports described/designed by the framework. The
metrics developed or chosen to be used in the design of the dashboard identify the type of the
dashboard (strategic, tactical or operational). It is logical to link the type of the metrics
developed (Implementation, Effectiveness/ Efficiency, Impact) to the type of dashboards, that is
to say impact metrics will be commonly used in the strategic dashboards. On the other hand, as
an alternative approach, organizations may choose to use the balanced security scorecard
approach, which is proposed by Jaquith (2007) and discussed in section 2.3 to create their
dashboards. This approach proposes to use Financial, Customer, Internal Process, and Learning

54
and Growth metrics in terms of security perspectives to reach an overall security scorecard for
an organization. First approach is straight forward to apply since there is one to one mapping
between the metric types and the dashboard types. However, the main drawback of this approach
is that especially tactical and strategic dashboards might be lacking the required measurements
in the initial phases of the implementation as the impact and effectiveness/ efficiency metrics
require organizational maturity and functional operational metrics. Presenting four different
perspectives in the same dashboard, the second approach requires considering each perspective
while defining and developing the security metrics. This might be applicable for some
organizations; however, it is obvious that it makes the metric development cycle complicated. It
is up to the organizations’ dynamics and requirements to choose any or a mixture of the
approaches stated above.
In addition to dashboards, standard and customizable reports will be available to visualize the
security metric data. As the reports are the only output of the system and most of the success
criteria of the framework rely on the usability and efficiency of reporting, metric data
visualization is the key factor of success in the proposed framework. Standard reports are
predefined reports in the system, containing frequently monitored data and they need to be
flexible to some extent, like supporting change of time frame or the shape of the graph up to the
visualization needs. On the other hand, custom reports are required to create additional reports,
meeting the further reporting needs of the users, which are mainly the comparison of various
standard reports. To illustrate, after examining the virus infection distribution in Turkey and
Italy braches of the organization, the security manager would like to compare both of the reports
in the same report, thus, use custom reports to combine different reports.
In addition to the dashboards and standard/custom reports, the CSMF introduces diagnostic
reports. Diagnostic reports can be defined as the reporting of lacking metric data in the expected
time frame. This report will describe the problematic situation in a product, collection method or
the stakeholder who is responsible for collecting the metric data.
As discussed in the metric data collection process, the automation issues need to be discussed for
the security reporting part. Although a software implementation of the reporting process
enhances the usability and increases the efficiency of the reports, proposed CSMF does not

55
force organizations to use a software implementation. The organizations doing manual reporting
may use the publicly available, spreadsheet based, tools building reports and dashboards.
To design required security visualization reports, the CSMF employs the information
visualization process proposed by Marty (2008) as summarized in section 2.3. The usage of the
six stepped process in the framework is discussed as follows:
1. Define The Problem
Visualization should never be data driven; it must be based on requirements. At this very first
step, the visualization requirements must be specified clearly. Security metric reporting is the
visualization of developed security metrics’ data thus, fulfilling the requirements of security
metric identification and definition sub-process also means defining the visualization problem.
The metric definition and metric goal fields defined in the metric template corresponds to the
visualization problem definition.
It is possible that users may request reports that are not available in the system. Although it
might be possible to address the request using the information visualization process, it should be
kept in mind that reporting is only one of the steps in the information security metrics
development process and starts from the initial step of metric development (as most of the
visualization definitions are inherited from metric templates). Metric development process will
end either by defining a new security metric or by guiding about how to use the available metric
data to create the requested report. If a new security metric is developed as the result of the
request, the newly defined metric’s definition includes the reporting details. Else, the requested
report can be created using the custom reports creation function and can be added to the standard
reports if required.
2. Assess Available Data
Aligning the visualization problem definition to the metric definition and identification, which is
discussed in step 1, brings the advantage of simplified process of assessing the available data in
the metric visualization. Assessing available data is simplified because business requirements
trigger security metric development (including metric data production) and at the end of this
process, data visualization is triggered by the developed security metrics based on the metric
data. Thus, assessed data in terms of raw logs and events is the responsibility of the security
56
metrics development process, whereas assessing the available data in the security metric data
storage (as discussed in 3.3.2) is the responsibility of the reporting process.
As discussed in section 2.3, there is no guarantee that inquiries of the users can be answered with
the available data and generated graphs. Information visualization model recommends
identifying the log resources and data required from each resource to determine if additional data
is required for reporting. Therefore, if the data is not available for reporting, as acquiring metric
data is beyond the scope of reporting process, it is only possible to report the case to the user and
system administrator. It is expected that through the feedback received from the reporting
process, the metric development process would be able to cover the missing metric data and of
the metric report would be regenerated.
3. Process Information
Information processing step is described in section 2.3 as log parsing, filtering and aggregation
of the collected raw logs and events. As raw log and event processing steps were covered in the
metric data collection section, information processing step can be interpreted as processing of
accumulated metric data in the data-store. Having a metric template, including the reporting
format enables direct reporting without any metric data processing. However, for some cases,
like a user requesting a yearly report based on hourly collected metric, require processing of
hourly metric data to calculate monthly metric values before visualizing the report.
4. Visual Transformation
This step is mapping the metric data into some visual structure, which produces a graphical
presentation. The metric data has one dimension: the metric value collected at time t. The
distribution of metric data over time is mainly required type of reporting, thus appropriate type
of reports applicable to this prerequisite needs to be chosen. From the graph types discussed in
section 2.3, the unidirectional ones that can be used in reporting are as follows:
• Pie/Bar/Line Charts
• Histogram
• Map
• Treemap
• Time series Charts
• Pareto Charts
57
With respect to the implementation, in the design of strategic dashboards or up to the reporting
needs of the users, the number of reporting dimensions may increase, thus, other graph types
may be introduced. The proposed CSMF is neither limiting nor forcing the organizations to
employ above graph types only. CSMF’s metric template includes the reporting format
specification, which defines the visualization reporting format preferred by the information
stakeholder.
Size, color and shape are important factors for the presentation of the data. If effectively used,
these factors make the reports more readable and understandable. In section 2.3, Jaquith (2007)
presents the six principles of effective visualization of metrics data that certainly contribute to
the implementation of the reporting. Despite not forcing, as parallel to Jaquith’s principles,
CSMF recommends keeping the size of the data visualization as small as possible without
affecting the readability of the graph including the units and legend. With regard to the use of
coloring in the reports, framework discourages the organizations to use color as an additional
dimension of reporting, as the metric data does not need much dimensions in reports. On the
other hand, colors can be used for differentiating various parts of a graph such as, the values
exceeding the threshold values of a measurement.
5. View Transformation
Although the graph choice for each of the defined metric is made by the information
stakeholders, from time to time, the generated graph for reporting the metric data may not meet
the user requirements. For such conditions, arming the reporting tools with graph customization
functions will increase the efficiency of reporting. These functions can be:
• Scaling: Adjusting the timeline of the graph to drill down a specific time period or
browse past trends is an important requirement.
• Zoom: Adjusting the size of the graph might be useful for the user to increase the
readability or fit more reports in a single view.
• Color: Changing color template of the reports may affect the seriousness of the reports
that might be preferred by the user.
• Timeline: Adjusting the timeline covered for reporting may be useful for the user to
increase or decrease the number of data in the report to monitor different trends.

58
6. Interpret And Decide
If the predefined reporting format does not meet the information stakeholders’ requirements, the
reporting definitions must be updated to meet the user requirements. Although this report
customization can be done manually, it can be automated such that through the view
transformation step, user can update the default report definition as the customized view.
3.3.5 Analyze Results
Security monitoring enables organizations to be aware of and manage the security state in their
organizations. It is a fact that, increasing usage of intelligent systems (automation) used in
security monitoring, lowers the burden of security monitoring. Even though the CSMF proposes
tools to ease analyzing results, the framework mainly relies on the users for the analysis of the
reports generated. Although various automation tools might be introduced to ease the report
analysis, further analysis of the analyzed metric data will not contribute much to the result, as the
result analysis process needs human intervention ultimately. The importance of human
intervention to the framework is underscored in section 2.1: “…security monitoring systems is
not a complete but an important part of the solution, since people monitoring the system and
interpreting the reports are the key factor of success in security monitoring.” Thus, the CSMF
leaves analyzing the report to framework users and user groups while proposing tools to support
users’ analysis.
Figure 11: Analyze Results Process using SADT

59
The Analyze Results process and its relation to other processes are given in Figure 11 using the
structured analysis and design technique.
Chew et al. (2008) defines Collect Data and Analyze results phase in six stepped approach. As
the first three steps were covered in section 3.3.2, the following steps will be discussed in this
section:
• Conduct gap analysis to compare collected measurements with targets and identify gaps
between actual and desired performance
• Identify causes of poor performance
• Identify areas that require improvement
While analyzing the reports, CSMF users utilize two major analysis methods:
1. Gap analysis of the collected measurements with targets
2. Trend analysis of the current measurements with past data.
Analysis of each method including implementation tips will be discussed for the automated
reporting implementation. Organizations employing manual reporting may adopt these methods
to their own reporting implementation.
For the gap analysis method, the CSMF uses the baseline and target metric definitions laid down
in the metric template to guide the users. Thus, users will be able to better analyze the metric
values by considering the organizational baselines and targets. With respect to the framework,
the baseline and target values of each metric should be specified within the metric reports either
using different coloring or should be noted in the explanation part of the graphs. On the other
hand, traffic lights based on overview reporting may be used for presenting the baseline and
target compliance of the organizations. Although it will vary from implementation to
implementation, one example of the usage of traffic lights might be as follows:
• Meeting the target for that metric:
Yes → Green light highlighted
No but above baseline → Orange light highlighted
No and below baseline → Red light highlighted

60
Trend analysis becomes easy with the time scaling and custom reporting functions as explained
in the reporting section above. Users are able to see hourly, daily, weekly, monthly and yearly
reports with time scaling. Moreover, they are able to combine reports having same metric
definition but different time scales in the same view. In addition to easy reporting functions,
traffic lights based on overview reporting may be used for presenting the general trend of the
organizations. Although it will vary from implementation to implementation, one example of the
usage of traffic lights might be as follows:
• Does the metric improved over time? :
Yes → Green light highlighted
No → Red light highlighted
While analyzing the reports, users generally need to discuss the reports or ask questions to other
users in related topics. Although it is possible to communicate through various ways (i.e. e-mail,
telephone etc.), discussing the reports while monitoring them may enhance the analysis
capabilities of the users and increase the usage of the system. Using this feature, various users
may interact with each other by asking questions or answering them based on their knowledge.
For these reasons, incorporating a forum feature to the reporting module might increase the
efficiency and effectiveness of the reporting module. Although it is not a must in the
implementation of the framework, employing a forum feature is strongly recommended.
In addition to the forum feature, “guideline presenting” feature can be developed for guiding the
users in relation to the definitions and best practices of the concepts that help them to analyze the
reports if they need. This feature will help to answer questions such as: “How does the
decreasing number of un-patched machines help us to become more secure?” by redirecting user
about the importance of patch management. Although it is not imposed by the framework, this
feature can be especially requested by the managers to understand some technologies to analyze
the reports. For the implementation, the defined security metric template by the framework can
be extended to include links to the related guidelines and definitions of the terms used in the
metrics.
Performing the discussed analysis techniques including “recommended to have” features help
the framework users to analyze the security reports to gain an insight into the security practices
in the organizations. Although discussed analysis techniques and features ease the analysis of the

61
reports, from time to time they will not be enough to analyze the root cause of the problem. An
example to better express the concept might be: “the increase in the number of virus infections in
the user terminals of the organization”. Unless the organization employs any other security
metric to measure other aspects of virus infections, it will be possible to possible to find the root
cause of the problem. For example employing patch management metrics, mobile storage unit
usage metrics or gateway antivirus protection systems effectiveness metrics might help to detect
the root cause of the problem. This issue cannot be solved immediately and can be addressed in
the security metrics life cycle by employing additional metrics related to virus infection
monitoring. The average round trip of the security metric life cycle is up to the organization and
will vary from organization to organization.
Although NIST’s guide proposes to employ “Identify Corrective Actions”, “Develop business
case and Obtain resources” and “Apply Corrective Actions” processes in the guide, it is believed
that these contents are out of the scope of the CSMF. Although security monitoring is directly
linked to the business processes and involves management activities, the results of the security
monitoring processes are thought to be employed by other models and approaches which are not
a part of the security monitoring framework. Else these processes will extend the scope and
goals of the security monitoring, as they are including the business level analysis, which will
change whole baseline and core functionalities of the framework.

62
CHAPTER 4
4 SOFTWARE IMPLEMENTATION OF THE
PROPOSED FRAMEWORK
As discussed in the survey chapter, use of security metrics for continuous security monitoring is
not common in the literature (Literature introduces intrusion prevention systems or network
sniffers for continuous security monitoring). It is observed that while addressed in some
standards (like Basel-II and SOX), continuous monitoring (with security metrics) is more
commonly discussed in the industry compared to the literature. Additionally, COBIT, ITIL and
ISO27001 standards define metrics and KPI’s for the continuous measurement of the processes
and programs defined in the standards. Although it was addressed by the guides and standards,
continuous security monitoring based on security metrics was not commonly implemented in a
structured way in the organizations. Despite giving an insight into and providing technical
information about security metrics, the valuable resources such as Jaquith (2007), Chew et al.
(2008) and ISF (2006), are not enough to fill the gap of implementation of security metrics
approach for continuous security monitoring.
Considering the above needs, the thesis not only proposes a framework for security monitoring
utilizing security metrics, but also includes the software development and field application of the
CSMF. This chapter consists of the discussion for the need of implementation, requirements
analysis, design of the database, description of the software modules and implementation details.

63
Before discussing the requirements of the proposed framework, it is wise to start with the
question: Is there a need for Software Implementation of the CSMF? The rest of this section is
discussing the need for a software implementation of the CSMF.
The Continuous Security Monitoring Framework proposed in Chapter 3 includes brief
discussion of the “need for automation” for each process composing the framework. Although
the CSMF does not force to use software automation for the implementation of the CSMF,
software automation of the CSMF offers various benefits to the organization. This section will
be discussing the need for developing software, the processes that provide the most advantage in
return and the advantages of the software implementation.
It is possible for the organizations to implement the CSMF using standard office automation
tools like word processors and spreadsheets. As office automations tools are commonly used in
the organizations and many free distributions of these tools are available in the market, do the
organizations need to buy or implement a software program for the CSMF? The answer of the
question depends on the organization. Organizations may answer this question considering
certain parameters in their organization. Here is a list of the concepts that deserve consideration:
1. Cost of the implementation: Remember the saying which goes as: “IT is an investment
decision”. The cost of implementation is one of the leading factors that affect the
decision of the managers. Both software implementation/purchase of COTS product
(including maintenance costs) and manual implementation of the CSMF bring a certain
cost. Organizations need to analyze the cost of the both choices.
2. Number of the security stakeholders in the organization: The number of security
stakeholders contributing to the CSMF implementation increases both the
implementation burden and complexity of the applied method. On the other hand, this
parameter increases criticality of fifth, seventh and eight items.
3. Number of security metrics in the repository: Management of the developed metrics
includes managing metrics in different states such as: draft, reviewed, approved, in
production and passive. Following CSMF’s second or third cycle, the management of
the metric definitions (including measure definitions) brings extra burden.
4. Confidentiality, Integrity and Availability (CIA) of the metric data: The criticality of the
CIA in collected metric data changes according to the organization. Integrity and
Availability of metric data directly affects the reporting and trend analysis of the CSMF,
64
whereas confidentiality of metric data may affect many issues like reputation of the
organization. The number of metrics in production, the number of metric data collected
and the number of participated stakeholders affects the management of the metric
implementation, which includes the CIA concerns of the metric data. Central and secure
storage of metric data and the access of security stakeholders to be able to submit/query
metric data may be main concerns. Another point worth mentioning is that the
percentage of human intervention included in the metric data collection processes is
directly proportional to the probability of errors in data processing.
5. Number of high frequency metrics: High frequency metrics are most commonly required
for monitoring critical systems’. Increased frequency decreases the time interval for
collecting metric data from the data sources, thus, increases costs and decreases the
feasibility and sustainability of the system for manual implementations of the CSMF.
6. Need of reporting: The interactive reports and dashboard views defined by the CSMF
are feasible for the software implementation whereas standard reports can be generated
in both of the implementation type. The organizations which want to have flexible
reports both in content and timeline for the analysis need software automation.
7. Review meetings and communication: Although review meetings can be organized at
scheduled times, effective report analyzing process requires frequent communication of
the security stakeholders with each other. Asking questions and comments and stressing
some trends or drawing attention to an incident can be the reasons of communication.
Defining the means of communication for security monitoring is important for the
privacy and efficiency of the communication.
8. Criticality of the response time: Manual implementations of the framework dramatically
increase the response time of the organization for the incidents detected using the
CSMF. On the other hand, software implementation leads automatic response and/or
alerting to the related security stakeholder depending on the defined alert method.
Although the need for software implementation is discussed in the above list, actually managers
are not limited to make a choice between two choices. While reviewing the CSMF, organizations
may evaluate the framework process-wide for the manual/software implementation. According
to the priorities of the organization it may be feasible to implement only some of the processes.
Below list is discussing the benefits and drawbacks of software implementation for each process
of the CSMF.

65
1. Information Security Measures Development
As discussed in section 3.3.1, Information Security Measures Development process aims to
identify and define the information security approach/program in an organization and
development of the relevant security measurements to gauge the security controls. The
process consists of:
• Identification and definition of the current information security program: Considering
inputs of security stakeholders and organizational targets and policies.
• Development and selection of related measures: Considering current information
security program and best practices, developing list of security measures and selecting
the measures on the basis of certain criteria. Process is completed with the approval of
the selected measures by management.
As summarized above, the process derives the current information security policy from
organizational targets, policies and stakeholders contribution. Although it is possible to do
software implementation to capture the inputs of the stakeholders and manage organizational
targets and policies, automation neither enhances the efficiency nor decreases the cost (time
and budget) of the implementation of the process. Therefore, software implementation is not
recommended for this process. Use of word processing tools to capture the knowledge and
manage the list of measures should be enough for most of the organizations.
2. Prepare for Data Collection
As discussed in section 3.3.1, Prepare for Data Collection process defines further details of
each measure so that the approved security measures become “security metrics” that can be
collected and reported for security monitoring. This process defines each approved
measure’s goal, responsible party, data source, reporting, and data collection frequency
details that will be used in the data collection process and it uses metric template formatting
to keep the metric definitions. Although there are many similarities between the previous
and this process, Prepare for Data Collection process produces metric definitions which have
various specifications, and produced metric definitions are used in each step of the CSMF,
which are not valid for the Information Security Measures Development process.
66
Having sub-processes parallel to Information Security Measures Development process, the
same arguments about automation of the process (neither enhances the efficiency nor
decreases the cost) are valid for Prepare for Data Collection process. On the other hand, to
be able to effectively manage metric definitions in the CSMF and ease the use of metric
definitions in the Collect Data and Security Reporting processes, software implementation
for managing the security metric definitions is recommended for the implementation.
Software implementation of the metric data/definition will have the following advantages:
• Eases the management of metrics in multi-user environments
• Helps managing revisions of the metric definitions
• Helps managing various states (approved, in-production, passive etc.) of the metrics
3. Collect Data
Collect Data process is composed of collection, validation and storage of the metric data.
Metric data is collected from system users, system devices and administrative units, as
discussed in section 3.3.3. Validation is controlling the validity of metric data that is
submitted to the CSMF. Metric data storage addresses the storage concerns of the metric
data including backup and multi-user support for accessing the past metric data.
Although it is possible to collect, store and share the metric data manually using spreadsheet
kind of tools, it is recommended to make a software implementation that addresses the
below points:
• Supporting central data storage: employing a database facilitates the management of
metric data and backups.
• GUI enhancing the metric data submission: facilitates the manual metric data
submission process by guiding users with menus.
• Service validating and receiving metric data: Data validation service will control the
submitted metric data on the basis of defined criteria and will support automation of
metric data submission from various system components.
An important point that needs discussion is the metric data collection process that is defined
by procedures in the metric definitions. In terms of automation, metric data collection can be
categorized as:
67
1. Full automatic: The metric data collection procedures have full automation if the
metric data is generated and submitted to the CSMF without any human
intervention.
2. Partial automatic: The metric data collection procedures have partial automation if
the users only use the pre-calculated (the raw logs and events are processed by 3rd
party products/methods) measures to calculate metric data and submit it to the
CSMF.
3. Manual: The metric data collection procedures are manual if the raw logs and
events need processing by the users to calculate the metric data.
An example for the above categorization may help the reader to clarify the differences of
each category. A SEM tool, collecting and processing raw logs and events in the
organization, can be configured to calculate metric data if required raw data is available in
the system. SEM tool can be configured to submit the metric data to the CSMF (or CSMF
can be configured to get the data from SEM); that is to say automation of the every step of
data collection. On the other hand, metric data sources can be configured to generate the
required metric data or the measures that are used in the calculation of the metric data via
reporting components, custom scripts etc. Then, the stakeholder responsible for the metric, if
required, calculates the metric and then submits it to the CSMF. As human intervention is
required for data submission, this method is partially automatic. Finally manual data
collection performs every step defined in the metric definition procedure manually,
including processing raw logs, calculation of metric data and submission the metric data to
the CSMF.
Full automation seems the best choice to implement in the CSMF, however full automation
has some drawbacks to consider such as:
• Full automation is applicable to the system devices only; to the metrics having data
sources since system users and organizational units requires manual collection.
• Full automation requires sophisticated products like SEM products or development
of advanced tools; therefore, it is more costly compared to other methods.
• Full automated CSMF has high maintenance costs as each change in the system
devices affects the automation tools.
68
For the organizations not utilizing full automation, partial automation method is strictly
recommended for the collection of metric data from system devices. By incorporating
system devices’ reporting components, system devices can be utilized to generate the needed
measures. The metric data obtained from system devices’ reports are submitted to the CSMF
by the responsible stakeholder. If required measures cannot be obtained from reporting
components or the reporting components are not available, then it is recommended to use
custom scripts/tools to generate required measures, which is followed by the submission of
metric data to the CSMF by the responsible stakeholder.
4. Security Reporting
Security Reporting is the reporting of the current and past metric data to the system users
based on user preferences and metric definitions. Software implementation is recommended
to enhance the usability and increase the efficiency of the reporting process. Software
implementation of the security reporting will have the following advantages:
• Eases the access of system users to reports
• Removes the burden of report processing with initial investment,
• Supports authorization to enable access control rights
• Supports interactive reporting
• Supports customization of the reports in accordance with the needs of users
• Supports executive level dashboard based reporting
Linking the Metric Definition Management, Collect Data and Security Reporting processes
with software implementation will enhance the sustainability and success of the
implementation, considering the tight relation built in the CSMF between the processes.
5. Analyze Results
As discussed in section 3.3.3, CSMF mainly relies on the stakeholders for the analysis of the
reports generated; therefore Analyze Results process depends on stakeholder participation.
For this reason, software automation is not required for Analyze Result process while minor
enhancements on Security Reporting implementation can be done to support stakeholders’
report analysis.

69
This section discusses the need for software implementation of the CSMF considering the
advantages and burden of the implementation. The aim of the chapter is help the reader to find
the answers of the questions that may arise before deciding on a software implementation of the
CSMF. It is recommended to go through this section before launching the implementation of the
CSMF.
4.1 Requirements analysis of the Software Implementation
After the discussion on the need of a software implementation for the CSMF in the preceding
section; this section moves a step forward; that is analyzing the requirements of the software
implementation of the CSMF. Although it is possible to make complete requirement analysis of
the framework, only the processes recommended for implementation will be discuss in the
section for practical reasons.
As security metrics are identified by the information security stakeholders, data source can be
any business asset or process that can be measured depending on the business needs. As
discussed in section 3.3.3, CSMF approach states that, possible data sources can be grouped into
System Users, System Devices and Administrative Units. The proposed framework is designed
to interact with data source groups, namely system users, system devices and administrative
units, depending on the defined security metrics. Figure 12 summarizes the relations between the
CSMF with the external entities.
Figure 12: Context Diagram of the CSMF

70
System Users are the generic name of the personnel having roles in the IT Security related
operations. It is not possible to give a perfect matching full list since the organization schema
and role definitions vary from organization to organization, however, just to give an idea, the
most common role definitions used are as follows: Managers, Human Resources department
members, Security Officer and Administrators (as stated in section 3.3.3). Mentioned system
users are a sample list of users, if needed some of the duties/roles can be grouped or further
divided into sub-roles. In terms of data input, members of the system users are responsible for
collecting metric data for the non-automated metrics, making comments on specified reports and
answering system directed questions that may be raised by other users or by the system-wide
defined security metrics. The members may also direct questions to the related system users of
the system or ask for comments based on reports. Authorized users are capable of
defining/updating standard report templates and metric definitions or use reporting functionality
to monitor the IT security of the organization. Interaction between the system users and the
CSMF is crucial in terms of giving insight into the organizational security, monitoring how the
IT security evolves over time and detecting the root cause of the abnormalities or problems
reported.
System Devices is the generic name for the network equipments, business applications/servers
and IT security related systems that are the part of the corporate infrastructure producing
operational and audit logs. As discussed in introduction of Chapter 4, organizations need to be
careful while employing metrics with high frequency if automation is not available for the
employed metrics. CSMF neither aims nor is designed to store any forensic or raw (operational
and audit) data. CSMF is designed to store metric data which is defined by the security metrics
definitions. The details of the required data (i.e. definition, format and unit) are set by the
security metric definitions employed. For instance, “total number of attacks in the last 24 hours”
and “total number of successful attacks in the last 24 hours” sample metrics can be used to give
an idea on what kind of data may be obtained from the IPS system.
Considering the nature of human being and business limitations (limited resources etc.), it is not
feasible to employ high frequency metrics for the system users. In other words, it is not feasible
to design a system that asks questions and requests answers every hour or day to the system
users. Therefore, each data source group interacts with the system differently; for instance

71
system users are expected to use the reporting to analyze the reports and perform manual metric
data collection, whereas system devices only provide metric data to the CSMF.
Administrative Units is the generic name for the internal departments of the organization which
represents the reports and tests prepared (internal audits etc.), acquired (from 3rd parties) and
generated (using IT security and risk management software tools). The data processing approach
is similar to the one defined in the system devices part, which processes and collects data from
the reports in the required format as defined by the security metrics, and submits the metric data
to the CSMF.
Specification of the external entities and their relation to the CSMF is followed by the definition
of the requirements of the CSMF implementation using use case technique. To ease following
the functional requirements, they are organized in accordance to the defined processes in the
CSMF.
1. Information Security Measures Development
No software implementation is planned for this process.
2. Prepare for Data Collection
For effective management of metric definitions in the CSMF, software implementation is
recommended to manage the security metric definitions having following requirements:
UC1: Submit metric definitions to the system
UC2: Manage (query/update/delete) metric definitions
UC3: Manage (define/update) users
UC4: Delete users
UC5: Define log sources
UC6: Define system authorization rights
UC7: Define schedules for metric data collection
UC8: Submit metric data manually
UC9: Submit metric data manually automatically
The details of each use case can be found in Appendix D.
72
3. Collect Data
Proposed CSMF is recommending software implementation of the Collect Data process which is
composed of collection, validation and storage of the metric data. This process doesn’t have any
functional requirements that are interacting with the external entities.
4. Security Reporting
To enhance the usability and increase the efficiency of the reporting process in the CSMF,
software implementation is recommended for reporting the security metric data collected in the
system having following requirements:
UC10: Browse metric categories/definitions
UC11: Generate report based on metric definition
UC12: Browse interactive reports
UC13: Customize home page
UC14: Ask/Answer questions
UC15: Make/Request comments
UC16: Manage report templates
The details of each use case can be found in Appendix D.
5. Analyze Results
No software implementation is planned for this process.

73
4.2 Conceptual design of the database
As discussed in the preceding sections, a data store is required for the management of the metric
definitions, metric data and the reporting. Thus the database having the following design is
developed:
Figure 13: ER diagram of the CSMF
Figure 13 presents the Entity Relationship Diagram of the CSMF that is illustrating the logical
structure of the database used in the developed software implementation.
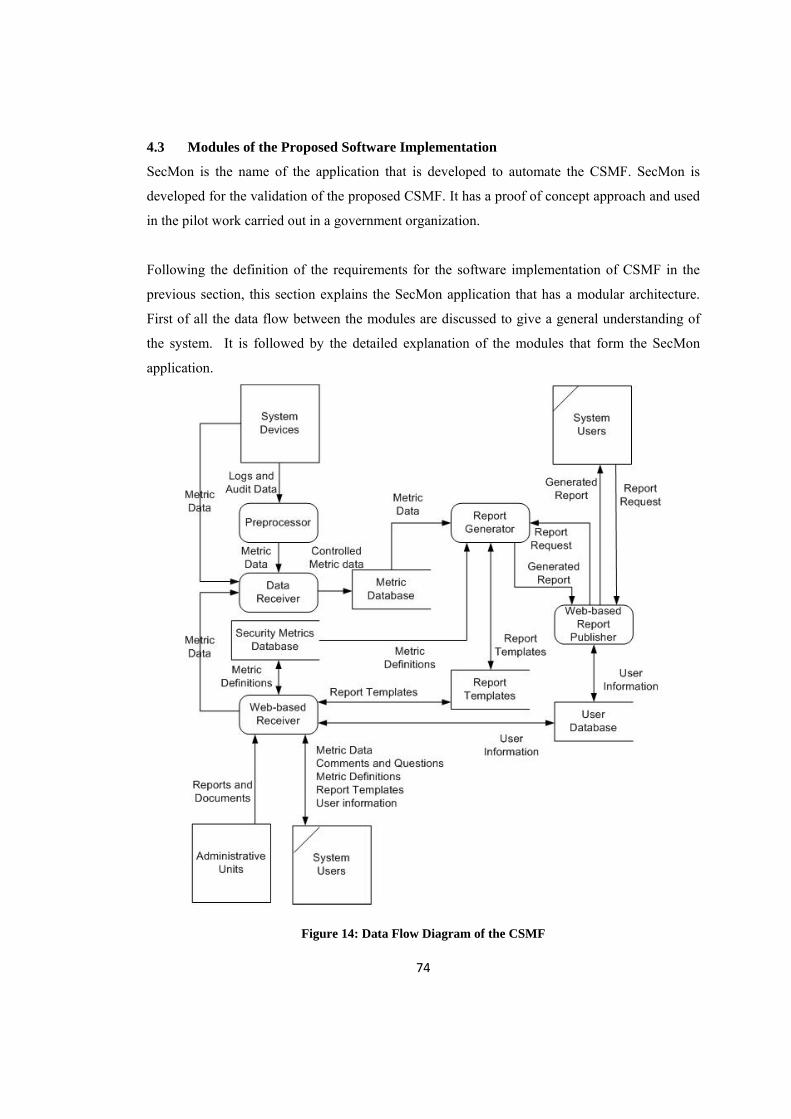
74
4.3 Modules of the Proposed Software Implementation
SecMon is the name of the application that is developed to automate the CSMF. SecMon is
developed for the validation of the proposed CSMF. It has a proof of concept approach and used
in the pilot work carried out in a government organization.
Following the definition of the requirements for the software implementation of CSMF in the
previous section, this section explains the SecMon application that has a modular architecture.
First of all the data flow between the modules are discussed to give a general understanding of
the system. It is followed by the detailed explanation of the modules that form the SecMon
application.
Figure 14: Data Flow Diagram of the CSMF
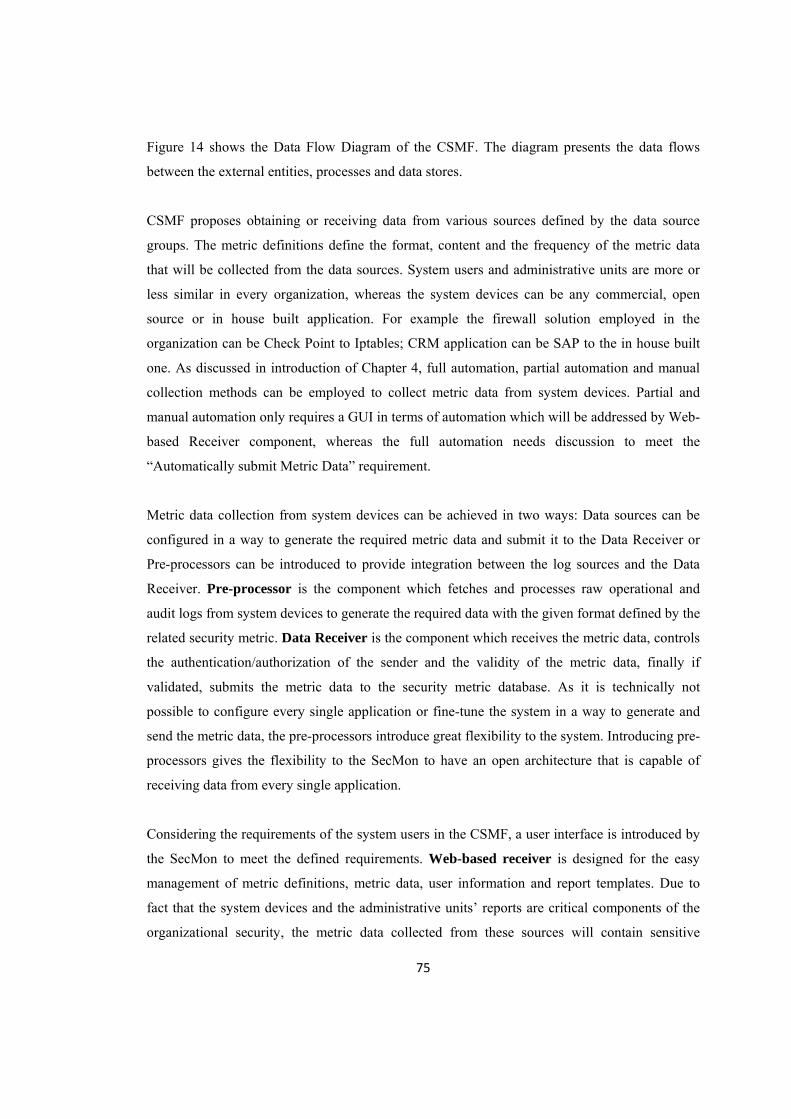
75
Figure 14 shows the Data Flow Diagram of the CSMF. The diagram presents the data flows
between the external entities, processes and data stores.
CSMF proposes obtaining or receiving data from various sources defined by the data source
groups. The metric definitions define the format, content and the frequency of the metric data
that will be collected from the data sources. System users and administrative units are more or
less similar in every organization, whereas the system devices can be any commercial, open
source or in house built application. For example the firewall solution employed in the
organization can be Check Point to Iptables; CRM application can be SAP to the in house built
one. As discussed in introduction of Chapter 4, full automation, partial automation and manual
collection methods can be employed to collect metric data from system devices. Partial and
manual automation only requires a GUI in terms of automation which will be addressed by Web-
based Receiver component, whereas the full automation needs discussion to meet the
“Automatically submit Metric Data” requirement.
Metric data collection from system devices can be achieved in two ways: Data sources can be
configured in a way to generate the required metric data and submit it to the Data Receiver or
Pre-processors can be introduced to provide integration between the log sources and the Data
Receiver. Pre-processor is the component which fetches and processes raw operational and
audit logs from system devices to generate the required data with the given format defined by the
related security metric. Data Receiver is the component which receives the metric data, controls
the authentication/authorization of the sender and the validity of the metric data, finally if
validated, submits the metric data to the security metric database. As it is technically not
possible to configure every single application or fine-tune the system in a way to generate and
send the metric data, the pre-processors introduce great flexibility to the system. Introducing pre-
processors gives the flexibility to the SecMon to have an open architecture that is capable of
receiving data from every single application.
Considering the requirements of the system users in the CSMF, a user interface is introduced by
the SecMon to meet the defined requirements. Web-based receiver is designed for the easy
management of metric definitions, metric data, user information and report templates. Due to
fact that the system devices and the administrative units’ reports are critical components of the
organizational security, the metric data collected from these sources will contain sensitive

76
information, which increases the CIA criticality of the metric data. Therefore, authentication and
authorization controls are introduced in SecMon to adopt the “need to know” principle in the
system. User information and access rights are stored in the user database and managed over the
web-based receiver.
The metric data which is received from external entities is stored in Metric Database. On the
other hand, the metric database stores the metric definitions that are developed via information
security measures development process. CSMF approach recommends the storage of log source
and system users’ information in the database to enable central and practical management of the
users and log sources. Authorized users are able to inquire and update the metric database via
defined processes up to the current needs of the organization. The other processes have access to
the metric definitions and metric data stored in the database.
Reports are the only output of the framework, thus they have a critical role to realize the
“monitoring” part of the framework. Being discussed in the approach chapter, a critical
requirement in the analysis part, both report pulling and report pushing methods are
implemented as interactive reports and standard reports respectively in the SecMon software.
Standard reports are predefined reports by the system that answer the question of “What is
needed to be monitored by the system?”. Best practices, benchmarks, compliance/security
standards or organization specific monitoring needs can be used to design the reports. Interactive
reports are the drill down reporting part of the system. Interactive reports are based on the
standard reports, however, the difference is that the interactive reports support drill down
reporting, which helps the user to get detailed information by means of making detailed inquiries
based on the standard report outputs. Interactive reports are powerful when evaluating the
reports. By using interactive reports, users can access the dynamically needed information while
evaluating the reports via a few clicks.
Constituting the only output of the CSMF, reporting functionality needs to be easy to use and
flexible to increase the usability and efficiency of the CSMF. Parallel to the requirements
defined for security reporting, web-based publisher component is introduced. By using the
web-based publisher, users generate standard reports or browse the interactive reports. Using the
component, reports can be scheduled in a way to be generated and transmitted to the users

77
automatically. Report generator component is introduced to interact with the metric database to
query metric data then to generate and transfer the required reports to the web-based publisher.
Although neither specified as a requirement nor discussed by the CSMF, other components can
be introduced to the SecMon application. Even if not implemented, it is argued that in order to
get more useful information from the stored metric data, metric database can be designed to
work with an analyzer component, which can be named as the business logic of the system. One
of the methods that can be utilized by the analyzer component is the evaluation method.
Evaluation method compares the values of different metric data received from same log source
using the same metric definition for the same time period. (Identical metric data collection using
different methods for the same log source and metric definition can be used for validation
purposes.) This conflicting metric data pair can be used in two ways: In case an evaluation
technique is not implemented in the system, some mathematical algorithms (Jaquith, 2007) can
be used to merge different data for the same metric to calculate the required data to be stored for
that metric. Thus, different answers for the same metric are converged in a single data and this
situation is not reflected to the users, which means a potential security problem is ignored. In
case evaluation techniques are implemented, different data for the same metric can be used to
perform a cross check analysis to justify the data stored or to determine contradictions before
calculating the actual data to be stored for that metric. The contradictions found in the received
data for the same metric can be highlighted in the published reports; even special reports can be
designed like, conflict analysis report. For the calculation of the actual data, again the above
discussed mathematical algorithms can be employed and evaluation technique can be used to
ignore the incorrect data in the calculations.
In addition to the evaluation method, correlation method can be introduced as a part of the
analyzer component, which continuously crawl the metric database to analyze and relate data
collected from numerous devices using various security metrics. As defined by DeRodeff
(2002), correlation is the ability to access, analyze, and relate different attributes of events from
multiple sources to bring something to the attention of an analyst that would have otherwise
gone unnoticed. Correlation of the data from various metrics will contribute intelligence to the
framework and lead to “smarter” reports. As security metrics state the data format required, the
correlator will only see the processed data whereas similar log correlator modules are able to see

78
and analyze every single line of the log from the devices. Therefore, it is not possible to use the
commonly used correlation algorithms, thus different correlation logic needs to be developed.
4.4 Implementation of the SecMon application
SecMon application is developed using two different platforms. Due to the flexibility and
available libraries Visual Studio .NET 2003 using C# language is used for the implementation of
metric definition management and data collection components. For the reporting component,
PHP and AJAX is chosen for the implementation of the reporting requirements. As report
generator, a PHP based open source charting library is used.
Microsoft SQL Server 2005 Express version is used as the database of the SecMon application.
All the components use the same database as the data-store.
4.5 Sample Deployment of the SecMon application
It is depending on the organizations size and security policy to decide on the implementation of
the SecMon application; for instance to install each module on the same machine or distinct
machines.
Every single organization has various types of security devices; the SecMon application is
designed to be a flexible system to be able to collect metric data. The pre-processors can be used
for the full automation of data collection from system components. The pre-processors of the
SecMon application can either be installed on the operating system or the system devices can be
configured to send the logs/events to a server by syslog then the pre-processor installed on the
server generates the metric data from the logs.
79
Figure 15: Sample network architecture
Figure 15 presents the network topology of a sample deployment of SecMon software.

80
CHAPTER 5
5 FIELD IMPLEMENTATION OF THE PROPOSED
FRAMEWORK
Regarding the design and the prerequisites of the proposed framework, it can be easily employed
by any corporate organization. The implementation time and cost of the framework vary by
maturity level and approach of the organization to security monitoring.
• Since they have a defined, documented and in-production IT security program, probably
mature organizations will spend less time and budget to build the framework compared
to the evolving organizations.
• It is a common knowledge that it is hard to find a defined, documented and in-
production IT security program in small and medium private organizations due to budget
and skilled human resources constraints.
• Public organizations are obligated to comply with certain regulations and standards
which outnumber the ones that any private sector company has to comply with. On the
other hand, IT security is strategically important to keep the CIA of the organizational
services.
As there are not many private large-scale enterprise organizations in Ankara (where the author
resides), no other choice was left except for making a choice between small- and medium-sized
private organizations and public institutions. Due to limited time and resources for the
completion of the thesis, public organizations’ corporate structure and available (both human
and IT) resources to employ the proposed framework makes the public sector best fitting one to

81
the pilot needs of the CSMF. Thus government sector is chosen as the pilot sector for the
planned pilot implementation of the CSMF.
It is foreseen at least 4 weeks is needed to be able to launch the CSMF and integrate the IT
system of the organization with SecMon application. Actually this is the minimum duration
required to implement the first round of the CSMF and it does not include the reviewing and
planning phases of the framework. First week of the foreseen schedule is reserved for
developing the security metrics and the following three weeks is reserved for the collecting,
reporting and analyzing the metric data. The 4-week-period ends with the review of the first
round.
Considering the time schedule of the thesis and the duration of each pilot study, it has been
agreed to carry out the pilot study only in one of the chosen organizations. Although ideal one is
to carry out the implementation work in more than one organization in order to support the
validation of the proposed CSMF, other techniques are also employed to support the single-
organization limited pilot study. Decision of carrying out the pilot in public sector is followed by
finding a public agency which will be interested in security monitoring and which will agree to
dedicate time and resource to the project.
After grouping the public organizations into three, namely big enterprises and medium- and
small-sized enterprises, a medium-sized public organization has been opted for. Considering that
• the time needed to be spent in each phase of the framework is proportional to the size
and maturity level of the organization and
• required implementation time of the CSMF to be able to get significant reports is
inversely proportional to the organization’s size
medium-sized public organizations are found the most eligible ones in the face of above-
mentioned targets and limitations. On the other hand, big public organizations are eliminated due
to time constraint and small public organizations are eliminated due to hesitations about the low
profile reports resulting from the limited metric data available. Medium-sized public
organization can be defined as organizations having 400 to 800 users with at least one e-
government project in production.

82
Three medium-sized public organizations meeting the requirements have identified and have
been contacted for the pilot work. The meeting held with the first candidate public organization
was very positive and it has been agreed to carry out the pilot study in that organization.
Due to organizational security reasons (while defining and arguing security metrics much of the
organizational private information needs to be discussed, including the system components) and
possible use of the sensible security measurement results (if exists, poor performance measure
results can be used by third parties like newspapers and hackers for different purposes) the
identity of the public organization will not be disclosed. Nevertheless, just to give readers an
idea about the size and organizational details, the pilot public organization has,
• 4 core business units.
• One headquarters without any branch offices.
• 500 employees and each user have a computer.
• 20 business critical servers and totally 46 servers in the system room.
Hereinafter the chosen pilot organization, whose details are revealed above, will be referred to as
the public organization.
5.1 Implementation of the CSMF in a public organization
Before discussing the implementation details of the CSMF, it will be useful to give some basic
information about the launch of the CSMF implementation work. After agreeing on the pilot
study, first week is spent on:
• Meeting with security stakeholders
• Identifying the organizational structure
• Understanding the IT infrastructure
• Addressing the prerequisites (a work place for the onsite operations and a workstation to
install the SecMon application)
• Introducing and explaining the CSMF to the security stakeholders
• Planning the pilot study
in the organization. Actually first week can be identified as the preliminary work which aims the
aligning the goals and targets of the public organization and the framework. During preliminary
work, two presentations are made to the security stakeholders (one is about security monitoring
and the other one is about CSMF) with the aim of meeting with the security stakeholders and

83
informing them about the pilot study. An additional site visit is organized to understand the IT
infrastructure.
Figure 16: Project Plan of the CSMF Implementation
Figure 16 presents the project plan of the CSMF implementation in the pilot organization.
Following the preliminary work, only the 1st cycle of the CSMF is implemented due to time
limitations. The implementation work includes one week of metric development and 3 weeks of
metric data collection. During the metric data collection users was able to access the reports
anytime they needed. Report analysis meetings were held weekly to discuss the findings in the
metric reports.
Although every organization can implement the CSMF without the support of any 3rd party, the
author of the thesis has participated in every stage of pilot study to measure the effectiveness and
to identify the problematic aspects (if any) of the CSMF.
CSMF employed a phased iterative approach that is discussed in the previous chapters. To help
the reader to easily follow the implementation details as well as to keep the section well-
organized, rest of this section is organized in sub-sections and each sub-section corresponds to a
phase of the CSMF.

84
5.1.1 Information Security Measures Development
In the first week of the pilot study numerous meetings have been held to identify the information
security program or approach of the organization. Not only the staff in the IT department, but
also the staffs in other units have been visited to collect the required information. The aim of the
meetings is to identify the business critical processes and assets in the organization including the
CIA criticality of each process and asset. Following the completion of meetings with the units
the meeting, notes taken during meetings have been gathered to work on them with the security
stakeholders.
Figure 17: IT Department's schema in the pilot organization
Figure 17 presents the diagram of IT department in the organization. Head of the IT department,
who reports to the executive committee, manages two sections in the department namely:
Hardware section and Software section. Although the software section manager has participated
in the meetings, the details of the software section are not given in the figure as the section is out
of the scope of the pilot work (at least for the first round of the CSMF, which is decided after the
review meeting). Hardware section of the organization is given in details since each member of
the section has participated actively in the pilot work.
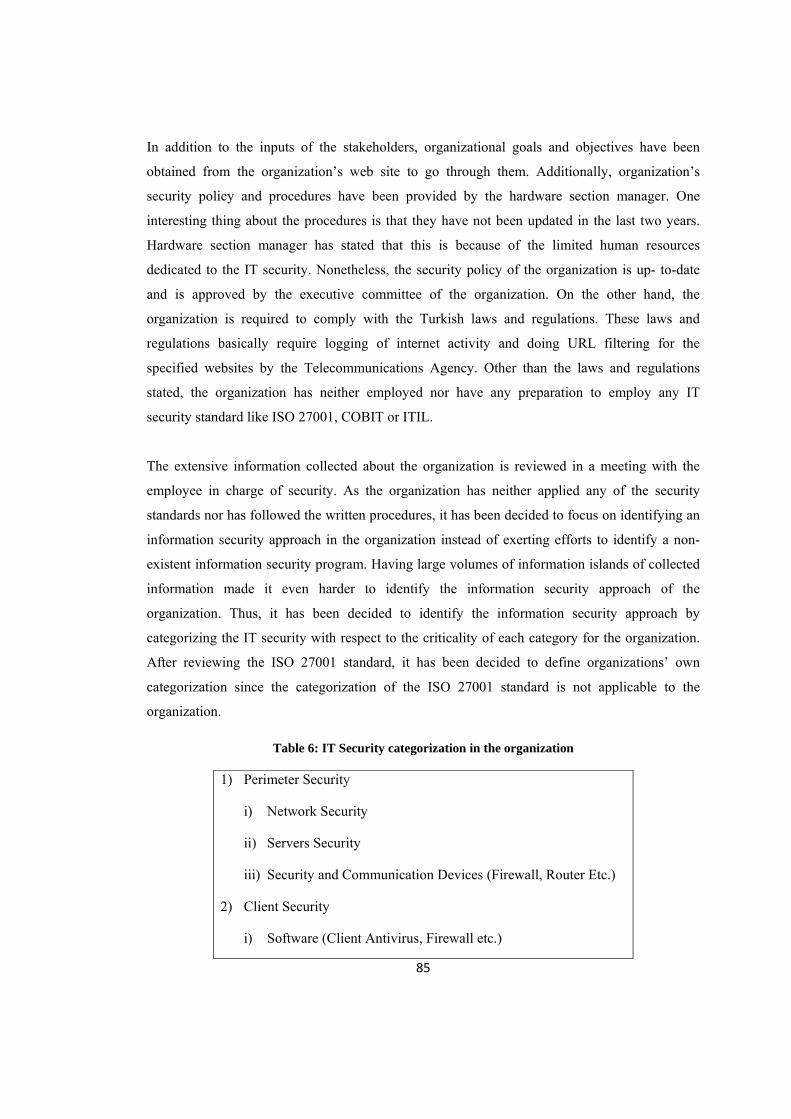
85
In addition to the inputs of the stakeholders, organizational goals and objectives have been
obtained from the organization’s web site to go through them. Additionally, organization’s
security policy and procedures have been provided by the hardware section manager. One
interesting thing about the procedures is that they have not been updated in the last two years.
Hardware section manager has stated that this is because of the limited human resources
dedicated to the IT security. Nonetheless, the security policy of the organization is up- to-date
and is approved by the executive committee of the organization. On the other hand, the
organization is required to comply with the Turkish laws and regulations. These laws and
regulations basically require logging of internet activity and doing URL filtering for the
specified websites by the Telecommunications Agency. Other than the laws and regulations
stated, the organization has neither employed nor have any preparation to employ any IT
security standard like ISO 27001, COBIT or ITIL.
The extensive information collected about the organization is reviewed in a meeting with the
employee in charge of security. As the organization has neither applied any of the security
standards nor has followed the written procedures, it has been decided to focus on identifying an
information security approach in the organization instead of exerting efforts to identify a non-
existent information security program. Having large volumes of information islands of collected
information made it even harder to identify the information security approach of the
organization. Thus, it has been decided to identify the information security approach by
categorizing the IT security with respect to the criticality of each category for the organization.
After reviewing the ISO 27001 standard, it has been decided to define organizations’ own
categorization since the categorization of the ISO 27001 standard is not applicable to the
organization.
Table 6: IT Security categorization in the organization
1) Perimeter Security
i) Network Security
ii) Servers Security
iii) Security and Communication Devices (Firewall, Router Etc.)
2) Client Security
i) Software (Client Antivirus, Firewall etc.)

86
Table 7: (Cont.)
ii) Authentication
iii) Network Access
3) Application Security
i) Protect Integrity of Application Data
ii) Authorization
4) Compliance
i) Internet Access Policy
5) Backup Management
6) Vulnerability and Patch Management
Table 6 demonstrates the defined IT security categorization in the organization. It is important to
indicate that the IT security categorization list in Table 6 is not an exhaustive list of security
categorization; however, it includes the categories that are mostly referred and identified as
critical in the information collected about the organization. Although the topics like physical
security, disaster recovery, software security, security consciousness trainings and data leakage
prevention was under discussion in the meeting, it has been decided not to include any
category/sub-category that cannot be monitored in the near future due to non-replicable nature of
the process in the organization. Actually, this decision can be argued as an early prioritization
and selection of the measures. This selection is valid only for the first round (cycle) of the CSMF
and will not affect other rounds of the framework, as the organization may expand the list of
items in latter rounds. Although selection of measures at an early stage is not discussed in the
CSMF, being in the first round, it has been argued that this decision will not harm the targets of
the framework. In the following rounds, the organization may extend the number of items in the
categorization to improve the security perspective in the organization.
As they do not have any previous experience in security measures development for the
development of the security measures, security stakeholders have preferred to start with
reviewing the best practice measures in the literature. This is the alternative approach defined for
developing the security measures in the CSMF. Therefore, the best practice measures referred in
section 2.2.7 have been reviewed and each chosen measure has been categorized with respect to
the developed categorization. This activity forms the “organized list of candidate measures” of

87
the organization. Choosing suitable measures from the best practice measures does not
necessarily form a complete list of security measures for the organization. As discussed in the
CSMF, organizations need to define their own measures in line with organizational needs.
Therefore, security stakeholders have discussed the missing points in the organized list of
candidate measures and developed additional measures especially in client security, application
security and backup management categories. Development of additional measures was expected
as the organization is managing many in-house built applications and defining strong
authentication schemas for these applications. Extending the organized list of candidate
measures with the additional in-house built measures forms the “organized long list of candidate
measures” (see Appendix A). While choosing the security measures among best practices or
developing them from scratch, good security metric specifications have been considered.
Development of the security measures is followed by the selection of the measures. The
hardware section manager, security responsible and the software section manager have
participated in the meeting held with a view to selecting the security measures. Participants have
discussed each candidate measure in terms of metric prioritization criteria to decrease the
number of candidate measures and, furthermore, have made cost-benefit analysis to finalize the
short list of measures. The prioritization criteria of “Using data that can be realistically obtained
from existing sources and data repositories” and “the burden of collecting metric data” are the
most referred terms while eliminating measures from the long list of candidate measures. Then,
“organized short list of candidate measures” have been sent to the head of the IT department for
his consideration. The head of the IT department has approved the “organized short list of
candidate measures” without demanding any update; however he has asked questions especially
about the application security measures. For the approved list of security measures, see Table 7.
With this approval, the “approved list of measures” has been formed. With the completion of
this step the information security measures development process has been completed.

88
Table 8: Approved List of Measures in the Organization
1) Perimeter security
i) Host uptime percentage of mission critical servers
ii) Service uptime percentage of mission critical servers
iii) Unplanned service downtime of mission critical servers to the total downtime.
iv) Number of not approved open ports on mission critical servers
v) Number of incoming Spam detected and filtered in e-mail messages
vi) Number of incoming Spam not detected/missed in e-mail messages
vii) Number of outgoing email viruses and spywares caught at gateway
viii) Number of detected attacks targeting application servers
2) Client security
i) Number of malicious codes detected in client computers
ii) Percentage of client computers covered by antivirus software
iii) Percentage of client computers with current antivirus signatures
iv) Total number of clients having local admin rights in their computers
v) Percentage of directory accounts dead or disabled
vi) Total number of clients not using any two factor authentication
vii) Total number of clients’ failed logins to the computers
viii) Total number of denied connection attempts from client computers to the low ports of the servers located in the server segment.
3) Application Security
i) Total number of transaction done in the application servers
ii) Total number of researchers using the application servers
iii) Average number of transactions done by each researcher using application servers
iv) Maximum number of transactions done from a single IP address using the

89
Table 7: (Cont.) application servers
4) Compliance
i) Malicious codes detected on websites browsed by the clients
ii) The number of restricted / banned site access attempts
5) Backup management
i) Back up percentage of critical servers' business data up to the defined back up policy
ii) Back up percentage of critical servers' operating systems up to the defined back up policy
6) Vulnerability and Patch management
i) Percentage of hosts not compliant to policy patch level
ii) Total number of unapplied patches in business-critical servers
The approved list of measures will be used for the development of the security metrics.
5.1.2 Prepare for Data Collection
As discussed in the CSMF, the development of the security metrics necessitates the definition of
the terms like metric goal, how to calculate, collection frequency, responsible party, data source
and alerting options. As the definitions of the metrics require much time and system analysis, it
has been decided to identify which party is responsible from each measure and then each party
will work separately to define the required details of the measures. It has been agreed that to a
final meeting will be held to review and discuss the uncertain points before passing to the
Collect Data phase.

90
Table 9: Security measures responsible identification list
Metric # Metric Definition Responsible Metric 1 Host uptime percentage of mission critical servers Network Responsible
Metric 2 Service uptime percentage of mission critical servers Network Responsible
Metric 3 Unplanned service downtime of mission critical servers to the total downtime. Network Responsible
Metric 4 Number of not approved open ports on mission critical servers OS Responsible
Metric 5 Number of incoming Spam detected and filtered in email messages Security Responsible
Metric 6 Number of incoming Spam not detected/missed in email messages Security Responsible
Metric 7 Number of outgoing email viruses and spywares caught at gateway Security Responsible
Metric 8 Number of detected attacks targeting application servers Security Responsible
Metric 9 Number of malicious codes detected in client computers Security Responsible
Metric 10 Percentage of client computers covered by antivirus software Security Responsible
Metric 11 Percentage of client computers with current antivirus signatures Security Responsible
Metric 12 Total number of clients having local admin rights in their computers
Hardware Sec. Manager
Metric 13 Total number of clients not using any two factor authentication OS Responsible
Metric 14 Total number of clients’ failed logins to computers OS Responsible Metric 15 Percentage of directory accounts dead or disabled OS Responsible
Metric 16
Total number of denied connection attempts from client computers to the low ports of the servers located in the server segment.
Hardware Sec. Manager
Metric 17 Total number of transaction done in the application servers Software Sec. Manager
Metric 18 Total number of researchers using the application servers Software Sec. Manager
Metric 19 Average number of transactions done by each researcher using application servers Software Sec. Manager
Metric 20 Maximum number of transactions done from a single IP address using the application servers Software Sec. Manager
Metric 21 Malicious codes detected on websites browsed by the clients Security Responsible

91
Table 8: (Cont.)
Metric 22 The number of restricted / banned site access attempts
Hardware Sec. Manager
Metric 23 Back up percentage of critical servers' business data with respect to the defined back up policy
Hardware Sec. Manager
Metric 24 Back up percentage of critical servers' operating systems with respect to the defined back up policy
Hardware Sec. Manager
Metric 25 Percentage of hosts not compliant to policy patch level OS Responsible
Metric 26 Total number of unapplied patches in business-critical servers OS Responsible
Table 8 identifies the responsible parties that are responsible for the approved list of measures.
Each responsible party defines the type and the goal of the measures that help to figure out the
purpose of the measure. Considering the purpose of the measure and its criticality for the
organization, the frequency, baseline value, target value and alerting criteria of the measure is
again defined by the responsible party. By analyzing the IT systems, responsible parties seek the
most applicable data source(s) that can be utilized to collect the required measure data. After
making a decision on the data source, calculation of the metric value (using the measures
collected from data sources) is formulated.
Table 10: Sample metric definition applied in the organization
Field Description Metric Definition Host uptime percentage of business-critical servers
Goal Keep the business critical systems up and running by availability measurement for business-critical hosts and systems
Value between 0 and 100 Unit % Type Implementation/technical How to Calculate Average (host uptime percentage of each business critical server) Target 99.9 Baseline 99 Frequency Daily Responsible Party Network Responsible Data sources PRTG Network Monitor Reporting format line graph Reference Jaquith 2007 State Reviewed Alert Criteria metric value < Baseline → e-mail alert Alert e-mail to Network Responsible

92
Using the metric template of the CSMF, the metric definitions are organized as shown in Table
9. An addition to the metric definition, each security metric requires having a procedure which
describes how to collect the metric data from the defined data source. Metric procedure is the set
of required steps to calculate the metric data.
Table 11: The defined procedure of Metric #1
1. Use PRTG Network Monitor application’s reporting to track daily host uptime
percentage of each critical server.
2. Calculate the daily average host uptime percentage from the values in step 1.
The defined procedure of Metric 1 is described in Table 10 to give an example to the reader. In
total 26 metrics have been employed in the organization; rest of the metric definitions, including
the procedures of each metric, is listed in Appendix B.
Following the definition of the security metrics, the security stakeholders have convened to
review and discuss the uncertain points in the metric definitions. After discussing and revising
some points in the metric definitions, the metric definitions have been finalized. This is the end
of the Prepare for Data Collection process.
All of the steps covered in the Prepare for Data Collection process have been realized in the first
week of the pilot study. Although the process was challenging and required some overtime work,
it was an achievement on the part of the security stakeholders of the organization to complete the
process successfully.

93
Figure 18: Security metric definitions in the SecMon application
The finalized metric definitions have been defined in the SecMon application, which is installed
on a workstation in the organization. The security stakeholders were able to use the application
from their own computers to manage the metric definitions. Figure 18 shows a screenshot of the
defined security metrics in the SecMon application.
5.1.3 Collect Data
With the definition of the security metrics and the procedures the paper work that the
stakeholders are supposed to do for security monitoring is completed. It is the Collect Data
process that metric definitions are used to collect data with respect to the defined procedures.
During the planning and development of the security metrics, collecting data according to the
defined procedures sounds easy, however, developing the required metric data might turn out to
be quite challenging from time to time.
Responsible parties should fine-tune the data sources or write scripts (discussed under metric
automation) to obtain the metric data in order to transfer the defined procedures of the security
metrics to the real life applications. This part needs lots of internet search and trial in the
production system from the side of each responsible party. The required steps to calculate the
metric data is defined as metric procedure, but procedures don’t cover the details of the initial

94
work done for enabling partial automation. Where implemented, the documentation of the partial
and full automation is documented as the “implementation details” for each metric. The steps of
implementation details are only implemented once for enabling the partial/full automation of the
security metrics. Enabling the implementation details is followed by executing the metric
procedures to generate metric data on defined schedules. Nevertheless, all of the metrics’ data
collection procedures and implementation details were documented and in production before the
end of the second week.
Table 12: The defined implementation details of Metric #1
1. Define business critical servers to the PRTG Network monitor application.
2. Define ping health check for each defined server with the timeout period of 5 seconds.
3. Configure PRTG to report ping downtime of the critical servers on daily bases.
The defined implementation details of Metric #1 are described in Table 11 to give an example to
the reader. In total 26 metrics have been employed in the organization, rest of the metric
implementation details is listed in Appendix B.
Figure 19: Security metric data stored in the SecMon application
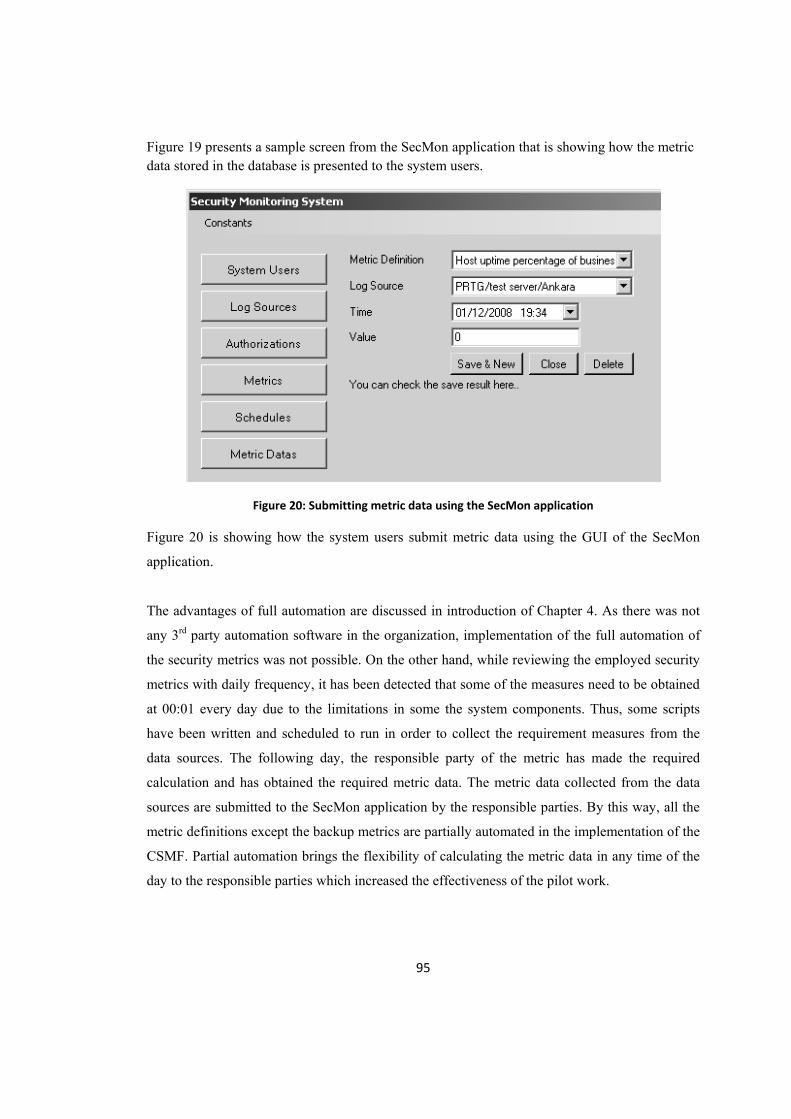
95
Figure 19 presents a sample screen from the SecMon application that is showing how the metric data stored in the database is presented to the system users.
Figure 20: Submitting metric data using the SecMon application
Figure 20 is showing how the system users submit metric data using the GUI of the SecMon
application.
The advantages of full automation are discussed in introduction of Chapter 4. As there was not
any 3rd party automation software in the organization, implementation of the full automation of
the security metrics was not possible. On the other hand, while reviewing the employed security
metrics with daily frequency, it has been detected that some of the measures need to be obtained
at 00:01 every day due to the limitations in some the system components. Thus, some scripts
have been written and scheduled to run in order to collect the requirement measures from the
data sources. The following day, the responsible party of the metric has made the required
calculation and has obtained the required metric data. The metric data collected from the data
sources are submitted to the SecMon application by the responsible parties. By this way, all the
metric definitions except the backup metrics are partially automated in the implementation of the
CSMF. Partial automation brings the flexibility of calculating the metric data in any time of the
day to the responsible parties which increased the effectiveness of the pilot work.
96
The final point that requires discussion is the tools and programs used for the partial automation.
The CSMF recommends to use the resources that are either belong to the organization or that are
free of charge for the sustainability of the metric data collection. During the Collect Data phase
the data sources for collecting the “Host uptime percentage of mission critical servers” and
“Service uptime percentage of mission critical servers” metrics have been discussed intensively.
Finally it has been agreed to try a sophisticated enterprise product in the pilot study and to
procure the product if it meets the requirements of the organization. Thus, the evaluation version
of the PRTG Network Monitor tool has been used in the pilot study. Rest of the tools and scripts
employed like Nessus Vulnerability Scanner and Microsoft Security Baseline Analyzer in the
pilot work are either open source or free of charge.
With respect to the project plan, at the beginning of the second week, the organization should
start collecting the metric data from the specified data sources, however because of the some
technical challenges, metric data creation was not possible for some of the metrics in the first
few days of the first week. As it was not possible to obtain the missing metric data afterwards,
some of the metric data is not available in the security reports.
5.1.4 Security Reporting
The metric data submitted to the SecMon is stored in a database and security stakeholders can
use the reporting component of the SecMon to browse the metric reports which are derived from
the metric definitions and data sources.
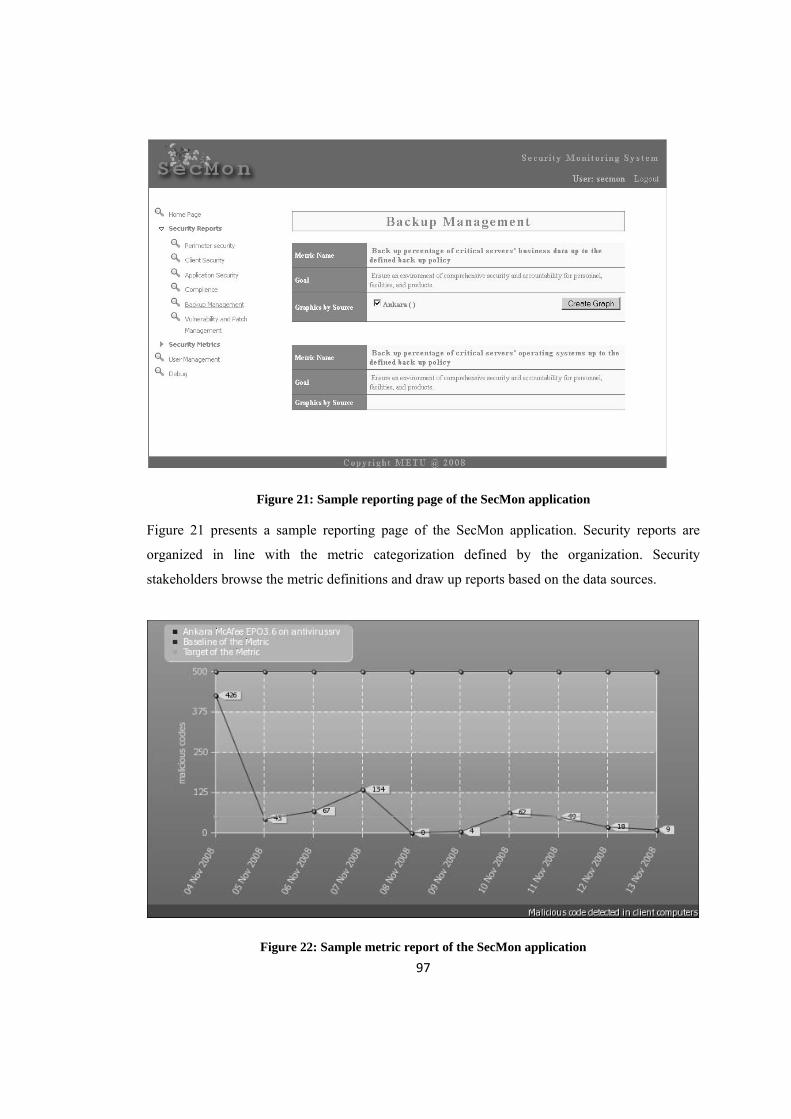
97
Figure 21: Sample reporting page of the SecMon application
Figure 21 presents a sample reporting page of the SecMon application. Security reports are
organized in line with the metric categorization defined by the organization. Security
stakeholders browse the metric definitions and draw up reports based on the data sources.
Figure 22: Sample metric report of the SecMon application

98
Figure 22 presents a sample report of the SecMon application. The reports have headings which
contain the metric definitions in the metric template form.
5.1.5 Analyze Results
While discussing the analysis techniques and recommending implementation tips, the CSMF
argues that the report analyzing process mainly depends on the security stakeholders. Being one
of the analysis techniques of the CSMF, trend analysis is not applicable in the first few rounds of
the CSMF implementation since it is not possible to have trend reports from limited number of
metric data. On the other hand, the gap analysis method may be used in every stage of the CSMF
implementation.
Due to time constraint, it has been decided to hold the review meetings on the first day of each
week. These meetings would help the organization to discuss the report findings, to evaluate the
security metric reports using gap analysis method and to plan the remediation process for the
problematic points. The second week’s (as first week was spent on developing the measures)
metric reports were containing unexpected problematic points which surprised the security
stakeholders of the organization. In addition to metric data collection, during the third and fourth
week, security stakeholders have also worked on fixing the problematic issues set forth in the
reports.
Although various implementation tips are discussed in the CSMF to facilitate the analysis of the
metric reports, due to limited time available only a few of them can be implemented in the
reporting component of the SecMon application.
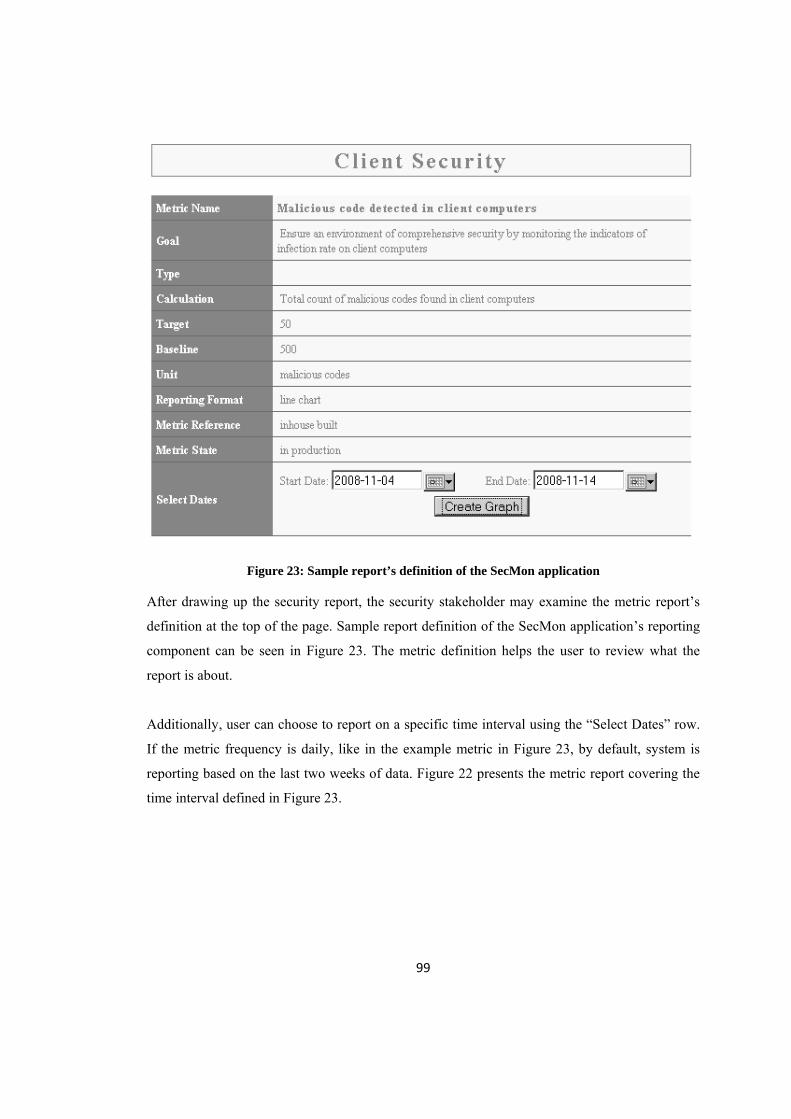
99
Figure 23: Sample report’s definition of the SecMon application
After drawing up the security report, the security stakeholder may examine the metric report’s
definition at the top of the page. Sample report definition of the SecMon application’s reporting
component can be seen in Figure 23. The metric definition helps the user to review what the
report is about.
Additionally, user can choose to report on a specific time interval using the “Select Dates” row.
If the metric frequency is daily, like in the example metric in Figure 23, by default, system is
reporting based on the last two weeks of data. Figure 22 presents the metric report covering the
time interval defined in Figure 23.

100
CHAPTER 6
6 VALIDATION
It is not possible to prove or to validate directly the continuous security monitoring, the ultimate
goal of the thesis. Therefore, the objectives of continuous security monitoring defined in section
1.3 are discussed and evaluated. As each of the defined objectives requires intensive discussion,
section 6.1 has been organized with respect to the objectives.
Out of 9 objectives defined at the beginning of the thesis, 8 of them are validated with the
proposed CSMF. Although the failed objective is an important objective, it does not affect the
ultimate goal directly. Thus, by achieving 8 objectives out of a total of 9, the proposed CSMF
has accomplished to validate the ultimate goal; that is to say continuous security monitoring.
6.1 Discussion of the objectives
Obj-1) To create an organizational memory for changing the IT security perception which
is currently based on individual memory:
It is a fact that the critical organizational decisions (related to IT Security) are adopted
considering the ideas of a few people. In other words, critical decisions are shaped according to
the IT security perception of the managers. It is argued that long-term organizational memory
changes the IT security perception of the stakeholders in the organization. It is claimed that the
proposed framework changes the IT security perception in the organizations by building an
organizational memory that is imposing the individual’s memories.

101
To verify this claim, a survey has been held before starting to collect security metrics in the pilot
organization. The survey questions were actually parallel with the developed measures and each
question has represented a metric definition in the CSMF. The answers of the survey questions
can be taken as the individual memory and the finding of the metric can be taken as the
organizational memory. If it is possible to show that the stakeholder’s IT security perception has
chanced parallel to the findings in the CSMF, then the claim is verified.
The survey which has been conducted in Turkish can be found in Appendix-C.
Table 13: Survey questions to Employed metric's mapping
Question # Metric # Before After Change Rate Question 1 Metric 2 3.75 4 6% Question 2 Metric 4 3.75 4 6% Question 3 Metric 6 3.75 4 6% Question 4 Metric 8 4.75 2.5 -90% Question 5 Metric 9 2 2.5 20% Question 6 Metric 11 3.75 3.75 0% Question 7 Metric 12 1.75 2.25 22% Question 8 Metric 20 2 2 0% Question 9 Metric 22 2.75 3.75 27% Question 10 Metric 23 4.25 4 -6% Question 11 Metric 26 4 3.25 -23%
The mapping of survey questions to the develop metrics can be found in Table 12. Table 12 also
presents the average scores that the survey participants have voted in the survey both before and
after the pilot study. The percentages of difference of the average scores between the two
surveys are presented in the Change Rate column. Only five of the questions show a difference
in the results that deserve real attention. Here is the discussion of each question that leads a
change in the survey results.

102
Figure 24: Application level attack statistics to the application servers
Question 4: (Metric 8: Number of detected attacks targeting application servers)
Before the pilot study, participants of the survey gave 4.75 points to the question in which high
points means “very rarely” and low points means “very frequently”. After the survey, by
analyzing the report presented in Figure 24 in the review meetings, the participants gave 2.5
points to the same question. Decision change of the participants of the survey is consistent with
report findings as the daily number of attacks is more than expected by the organization.
Figure 25: Number of malicious codes detected in client computers

103
Question 5: (Metric 9: Number of malicious codes detected in client computers)
Before the pilot study, participants of the survey gave 2 points to the question in which high
points means “very high” and low points means “very low”. After the survey, by analyzing the
report presented in Figure 25 in the review meetings, the participants gave 2.5 points to the same
question. Change in the decision of the participants of the survey is consistent with report
findings as the number of malicious codes detected on client computers is far more than the
target.
Figure 26: Total number of clients having local admin rights in their computers
Question 7: (Metric 12: Total number of clients having local admin rights in their computers)
Before the pilot study, participants of the survey gave 1.75 points to the question in which high
points means “very high” and low points means “very low”. After the survey, by analyzing the
report presented in Figure 26 in the review meetings, the participants gave 2.25 points to the
same question. Change in the decision of the participants of the survey is consistent with report
findings.
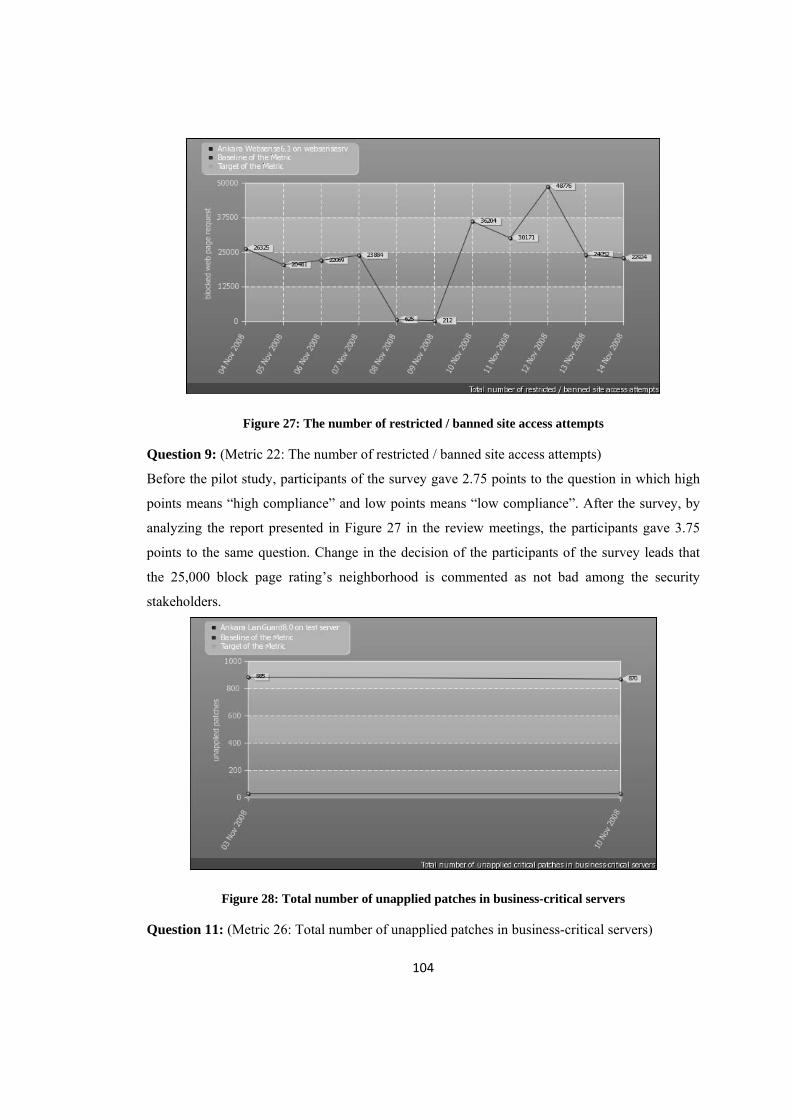
104
Figure 27: The number of restricted / banned site access attempts
Question 9: (Metric 22: The number of restricted / banned site access attempts)
Before the pilot study, participants of the survey gave 2.75 points to the question in which high
points means “high compliance” and low points means “low compliance”. After the survey, by
analyzing the report presented in Figure 27 in the review meetings, the participants gave 3.75
points to the same question. Change in the decision of the participants of the survey leads that
the 25,000 block page rating’s neighborhood is commented as not bad among the security
stakeholders.
Figure 28: Total number of unapplied patches in business-critical servers
Question 11: (Metric 26: Total number of unapplied patches in business-critical servers)

105
Before the pilot study, participants of the survey gave 4 points to the question in which high
points means “at an optimum level” and low points means “at a critical level”. After the survey,
by analyzing the report presented in Figure 28 in the review meetings, the participants gave 3.25
points to the same question. Change in the decision of the participants of the survey is consistent
with report findings as there are numerous critical vulnerabilities detected on the servers.
When the survey results are considered, it is interesting and impressive that the stakeholder’s IT
security perception has chanced parallel to the findings in the CSMF, which verifies the claim.
Therefore, the objective is validated.
Obj-2) To assess policy compliance:
Information security measures development process identifies the information security
program/approach to develop the measures. Therefore, the employed measures represent a part
or whole of the information security program in the organization.
Detailed development of the measures includes the baseline values which are the minimum
accepted level for the measure, and target values denote the optimum or expected level for the
measure. The metric values over the baseline indicate the policy compliance for that metric and
the metric values above the target value of the metric indicate fulfillment of the performance
targets for the relevant metric. As proposed by the CSMF, it is possible to built custom reports or
even dashboards to report on the compliance level of the organization.

106
Figure 29: A sample metric report identifying policy compliance/non-compliance level
Figure 29 presents the “Percentage of unplanned downtime of business critical systems” from
the pilot study. The red line indicates the baseline, the blue line indicates the metric data and the
green line indicates the target values. The values under the baseline show the days that
organization has complied with the requirements of the stated metric definition. Being able to
report on compliance level and having examples in the pilot work are the valid requirements for
validating the objective.
Obj-3) To determine non-compliance:
The validation method of objective 2 and 3 are identical, therefore, same introductory
information of objective 2 is valid for objective 3. The metric values below the baseline show
policy or performance non-compliance for the relevant metric. In figure 29, the values above the
baseline show the days that the organization has not complied with the requirements of the stated
metric definition. Being able to report non-compliance and having examples in the pilot study
are the valid requirements for validating the objective.
Obj-4) To detect technical problems
CSMF introduces diagnostic reports for the detection and report of technical problems.
Diagnostic reports can be defined as the reporting of metrics that lack metric data in the expected
time frame. This report will point the problematic situation in a product, collection method or the
stakeholder who is responsible for collecting the metric data.

107
Figure 30: Metric report identifying technical problems Sample-1
An example from the pilot installation might be the “incoming spam detected and filtered in e-
mail messages” metric whose report can be seen on Figure 30. Although numerous spam
messages are filtered each day, on 9th of November, the detected number of spam e-mail
messages is zero. On the other hand, on 9th of November, it has been checked that other system
components are healthy. This might mean two things; spam filtering product does not function at
all or it functions improperly. The answer turns out to be the first alternative.
CSMF may help the organizations not only to identify shortage of services but also the problems
that may arise due to efficiency of the system components. An example of this statement is the
patch management system in the pilot organization. During the 3rd week of the pilot study, it has
been observed that the non-compliance percentage of hosts dramatically increased, which can be
checked from the metric report in Figure 31. Investigating the reasons of the problem, it has been
detected out that the patch management system does not effectively distribute the new patches to
the client computers. In other words, patch management system is able to distribute the required
patches to the clients between 5 to 10 days. As it is not a technical limitation embodied by the
product, it has been concluded that either a configuration mistake or a system error caused this
problem.
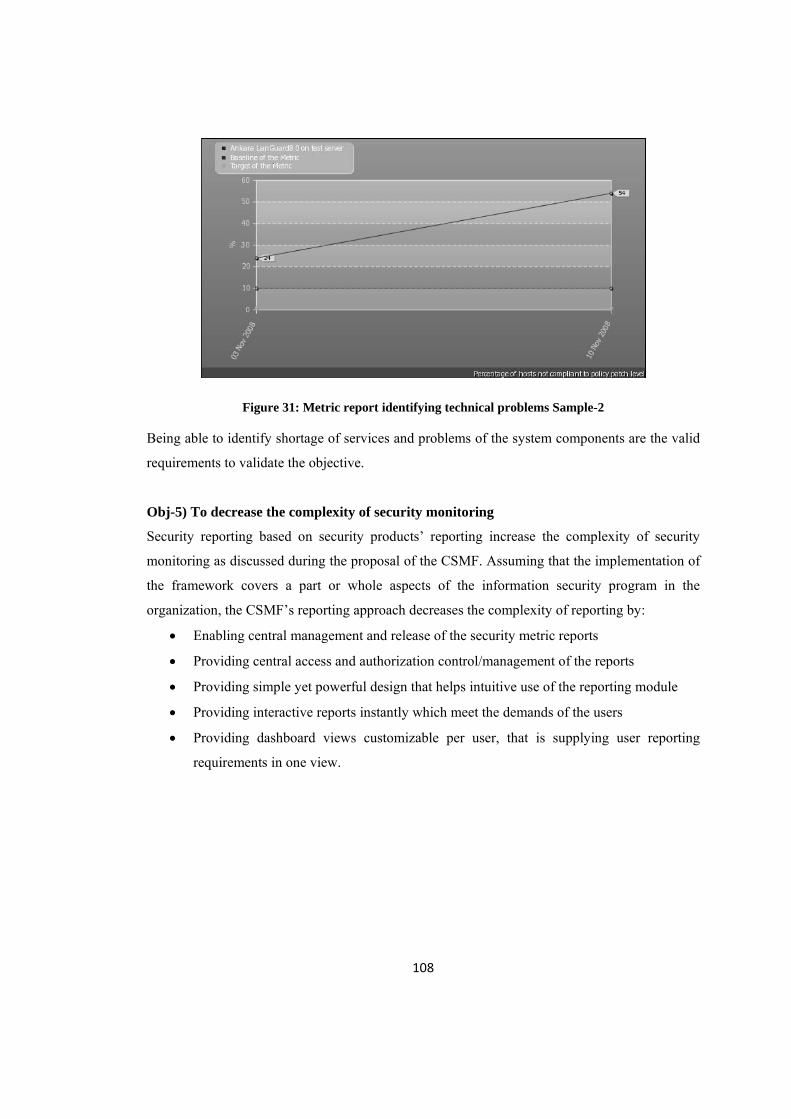
108
Figure 31: Metric report identifying technical problems Sample-2
Being able to identify shortage of services and problems of the system components are the valid
requirements to validate the objective.
Obj-5) To decrease the complexity of security monitoring
Security reporting based on security products’ reporting increase the complexity of security
monitoring as discussed during the proposal of the CSMF. Assuming that the implementation of
the framework covers a part or whole aspects of the information security program in the
organization, the CSMF’s reporting approach decreases the complexity of reporting by:
• Enabling central management and release of the security metric reports
• Providing central access and authorization control/management of the reports
• Providing simple yet powerful design that helps intuitive use of the reporting module
• Providing interactive reports instantly which meet the demands of the users
• Providing dashboard views customizable per user, that is supplying user reporting
requirements in one view.

109
Figure 32: Sample reporting view from SecMon application
Figure 32 presents a sample view of the reporting component of the SecMon application.
Current version of the SecMon application meets the first three requirements which can be easily
observed from Figure 32. Although interactive reports and dashboards are available in the
proposed framework, due to limited time it was not possible to implement these functionalities.
As the CSMF is able to satisfy the requirement of decreasing the complexity of reporting, it can
be said that the objective is validated.
Obj-6) To report on the basis of users’ needs
CSMF discuss that three levels of reporting is needed in the organizations: executive level
reporting (to enable managers to gain an insight into IT systems), administrator level reporting
(measuring technical security level of the organization to meet organizational technical
objectives) and technical reporting (to identify technical problems). CSMF introduces strategic
dashboards, tactical dashboards and operational dashboards to meet the requirements of each
level of reporting respectively. In addition to the dashboards, CSMF proposes standard, custom
and diagnostic reports to meet the various reporting needs of system users. CSMF offers various
types of reports meeting the needs of the users, which is adequate in itself to validate the
objective.

110
Obj-7) To give an idea to the managers and administrators about security trends and
current situation IT security in the organization
As discussed in objective 2, information security measures development process identifies the
information security program/approach, and the employed measures give a partial or overall
picture of the information security program in the organization. The reporting types introduced
by the CSMF helps the users (both managers and administrators) to monitor the security trends
and to visualize the current situation of IT security in the organization.
The reporting component of the SecMon application may be used to justify this argument with
production data from the pilot study.
Figure 33: Last 5 days report of the malicious code detected in client computers
Figure 33 is an example of the malicious code detected in client computers over the last 5 days.
Considering the metric definition, this metric is defined as technical implementation metric
which is mainly used by the security administrators. Managers may browse the
efficiency/effectiveness and impact metrics to obtain executive level reports.

111
Figure 34: Last 2 weeks report of malicious code detected in client computers
Trend based reporting is also supported by the SecMon application. Having a flexible
architecture, system users query the SecMon application to generate reports spanning large time
intervals. Due to limited data available in the pilot system, Figure 34 reports only the last 2
weeks malicious code detected in client computers metric, which can be regarded as the trend
report. Therefore, reporting capabilities of the CSMF make the framework adequate to validate
the objective.
Obj-8) To improve the security level of the organization in the course of time
Effective management of continuous security monitoring using CSMF offers prospects for the
achievement of various improvements in the security level of the organization. This objective is
validated via many examples during the pilot study.

112
Figure 35: Metric report for the total number of clients not using any 2-factor authentication
Figure 35 represents the last 2 weeks reporting of the total number of clients not using any two
factor authentication to login their computers metric. The measurement made in the 1st week of
November reveals that there are 120 non-compliant users who do not use any two factor
authentication. During the review meeting, it has been discussed that this number exceeds the
expected number of privileged users in the system and the review process is planned. The
measurement made in the 2nd week of November reveals that the metric value has dropped to 87.
This indicates that 28% of the privileged users did not comply with the security policy.
Therefore, the continuous security monitoring lifecycle proposed by the CSMF makes the
framework adequate to validate the objective.
Obj-9) Provide Benchmarking
Objective of this item is the use of the CSMF for benchmarking. With the accumulated metric
data it is possible for the organizations to compare their security level with respect to the other
organizations. Although methodologies for benchmarking surveyed during the literature survey,
it was not possible to propose a benchmarking methodology.
Therefore, the proposed CSMF failed to satisfy this objective.
113
CHAPTER 7
7 SUMMARY AND CONCLUSION
The CSMF is proposed to monitor the organizational security in line with the needs and
requirements of the organizations. As security monitoring is affected by various components
(like size of the IT systems, management approach, system administrators/operators, business
sector, size of the organization, maturity of the IT systems etc.) this makes the security
monitoring requirements and implementation unique for each organization. That is to say, a
security monitoring implementation which is successful in organization A does not necessarily
work for organization B.
Seeing continuous security monitoring as a life cycle, likewise PDCA cycle, is the most critical
feature of the CSMF. In addition to the goals and expected gains of the framework, NIST’s
guide discusses the side effects of employing the framework as: “Measures that are ultimately
selected for implementation will be useful not only for measuring performance, identifying
causes of unsatisfactory performance, and pinpointing improvement areas, but also for
facilitating consistent policy implementation, affecting information security policy changes,
redefining goals and objectives, and supporting continuous improvement.”
Although the proposed CSMF is discussed in details, it is for sure that some aspects in relation
to the implementation of CSMF may be unclear for the reader. As the implementation chapter
covers the application of the CSMF to an organization and validation chapter includes the results
and findings of the implementation of the CSMF, it is expected that the unclear points will be
clarified throughout these chapters.

114
7.1 Results
After an overview of the continuous security monitoring concept and related technologies, a
continuous security monitoring framework based on security metrics is proposed. Utilizing the
security metrics concept is the one of the milestones of the thesis since security metrics concept
already includes the measures development, collection, storage and reporting steps in its
architecture. The NIST Special Publication 800-55 Revision-1 “Performance Measurement
Guide for Information Security” is found to be the most applicable guide. While sticking to the
governing ideas, the guide is adopted for security monitoring.
A proposal on the CSMF is followed by designing and developing a proof of concept software
application, SecMon, which facilitates the implementation of the framework in the
organizations. The proposed framework with the support of the SecMon application is tested in a
medium-sized public organization in Turkey. It is a pleasure to see that the proposed framework
meets the goals and most of the defined objectives of the thesis, thus the framework is evaluated
as successful.
The major advantages brought by the approach presented in this thesis are:
• The creation of organizational memory which enhances the IT security perception
• The idea given to the stakeholders about the security trends in the organization
• The decrease in the complexity of security monitoring
• The improvement in the security level of the organization in the course of time
• The simplified assessment of the policy compliance and non-compliance
These contributions can be ensured by the organizations by only utilizing the organizational
dynamics without any additional investment. This statement should not confuse the reader as the
proposed framework is not a plug and play tool. In addition to making some configuration
changes in the system devices, organizations need to provide human resources and ensure
participation of the management for the success of the implementation. The statement underlines
that just by making use of existent resources in the organization one can ensure the above
mentioned contributions without buying any additional service or product. It should be noted
that the use of organizational resources for the implementation of the CSMF has a cost, which
needs to be taken into consideration.

115
The use of the proposed framework has the following additional advantages:
• Evaluate and enhance the efficiency of the products in the organization.
• Identify technical problems.
• Decrease detection and response time to the incidents.
Although being minor issues, the proposed framework can be improved by means of the
followings as discussed during the implementation process:
• Adding metric procedure and metric implementation details to the metric definition
• A way to link the metric data to the raw event and logs can be introduced for enhancing
the performance of the framework for the administrators.
• Report explanations in the metric definition or report template can be introduced to
support the system users while analyzing the reports.
• Measurement selection can also be introduced for the pre-selection of the IT Security
categories.
Having a few prerequisites, CSMF can be easily implemented in any organization. The
sustainability of the implementation is one of the main requirements of the process. Taking this
point into account, organizations can decide on the implementation cost and burden in line with
their available resources.
Proposing a systematical approach to continuous security monitoring, continuous security
monitoring framework is a powerful tool for monitoring the IT security in the organizations.
7.2 Future Work
There are many areas in which the proposed framework can be extended as a future work. Here
is the list of items that can be discussed as future work:
• Introducing a risk analysis approach, including asset management and categorization,
will enhance the type and content of the reports. Therefore, the framework can be named
continuous risk monitoring, which will contribute the adjustment of IT systems to the
business needs.

116
• The missing objective security benchmarking is left as a future work. Benchmarking
reports is an important tool for the organizations to see how they are performing in their
sector and compare their IT security level with the security best practices.
• A cost benefit analysis discussion can be a future work that is important for the
organizations to analyze the Return on Investment of the CSMF.
For the SecMon application, the future work items can be as follows:
• The Preprocessor’s can be developed for the automatic metric collection including wide
number of application support.
• Implementation of the custom reports and dashboards is an important point missing in
the application. These additional components contribute significantly to reporting
performance.
• Introducing an auto response for the user-configured cases (sending email, command
injection etc.) will decrease the response time to the threats and increase the
effectiveness of the system.

117
REFERENCES
Bejtlich, R. (2004). The Tao of Network Security Monitoring: Beyond Intrusion Detection, Addison-Wesley Professional. Chew, E., M. Swanson, et al. (2008). Performance measurement guide for information security, NIST. Denning, D. E. (1987). "An Intrusion-Detection Model." IEEE Transactions on Software Engineering SE-13(2): 11. DeRodeff, C. (2002). Got correlation? Not without normalization, Arcsight. El-Hassan, F., A. Matrawy, et al. (2008). Quantitative Evaluation of Network Security: A Case Study of Intrusion Detection Metrics. Carleton university technical report - sce-08-05. Carleton university. FFIEC (2006). "Information Systems IT Examinations Handbook." 138. Hinson, G. (2006). "Seven myths about information security metrics." ISSA. ISF (2006). Information Security Metrics Report. Information Security Forum. 48. Jaquith, A. (2007). Security Metrics: Replacing Fear, Uncertainty, and Doubt, Addison-Wesley Professional. Kahraman, E. (2005). Evaluating IT security performance with quantifiable metrics. Dept. of Computer and Systems Sciences, Stockholm University. MS: 55.

118
Kelly, L. (2007). "IT security spending on the increase" from http://www.computing.co.uk/computing/news/2194221/security-spending-increase. Kuperman, B. A. (2004). A categorization of computer security monitoring systems and the impact on the design of audit sources, Purdue University: 151. Lennon, E. B. (2003) IT security metrics. National Institute of Standards and Technology, Computer Security Resource Center. http://csrc.nist.gov/publications/nistbul/bulletin08-03.pdf Lowans, P. W. (2002). Implementing a Network Security Metrics Program. SANS. Mukosaka S., Koike H. 2007 Integrated Visualization System for Monitoring Security in Large-Scale Local Area Network, Asia-Pacific Symposium on Visualization 2007 Nichols, E. A. and G. Peterson (2007). "A Metrics Framework to Drive Application Security Improvement." IEEE Security and Privacy 5(2): 88-91. Nichols, E. A. (2008). Metrics Center: Technical Note http://www.plexlogic.com/images/Metrics_Center_Note-1_v4.pdf Opacki D. 2005 Security Metrics: Building Business Unit Scorecards. http://www.adotout.com/BU_Scorecards.pdf Payne, S. C. (2006). A Guide to Security Metrics. SANS. http://www.sans.org/reading_room/whitepapers/auditing/55.php Ranavel, P. (2006). "Effective Operational Security Metrics." Infosectoday. Rayford B. Vaughn, J., R. Henning, et al. (2003). Information Assurance Measures and Metrics " State of Practice and Proposed Taxonomy. Proceedings of the 36th Annual Hawaii International Conference on System Sciences (HICSS'03) - Track 9 - Volume 9, IEEE Computer Society. Robinson, C. (2005) Collecting Effective Security Metrics. CSO Online, Data Protection. http://www.csoonline.com/article/219182/Collecting_Effective_Security_Metrics

119
Ross, R., S. Katzke, et al. (2007). Recommended Security Controls for Federal Information Systems. Sademies, A. (2004) Process approach to information security metrics in Finnish industry and state institutions. Savola, R. (2007). Towards a Security Metrics Taxonomy for the Information and Communication Technology Industry. ICSEA: 60. Schneier, B. (2001). "Managed security monitoring: network security for the 21st century." Computers and Security 20(6): 13. Security Metrics Catalog, by PlexLogic (n.d.). Retrieved October 10, 2008, from http://www.metricscenter.org/index.php/plexlogicmetricviewer Seddigh, N., P. Pieda, et al. (2004). Current Trends and Advances in Information Assurance Metrics. Proceeding of the Second Annual Conference on Privacy. Swanson, M., N. Bartol, et al. (2003). Security Metrics Guide for Information Technology Systems, NIST: 99. Villarrubia, C., E. Fern´andez-Medina, et al. (2004) Analysis of ISO/IEC 17799:2000 to be used in Security Metrics. Wiegers, K. E. (1997). Software Metrics: Ten Traps To Avoid. Software Development. WISSSR (2001). Information System Security Attribute Quantification or Ordering Workshop Proceedings S. S. S. a. R. workshop on Information.

120
APPENDICES
APPENDIX A: List of Candidate Measures
Table 14: Organized Long List of Candidate Measures
Note: Each metrics’ reference is stated in Appendix B.
1) Perimeter security
i) Inbound connections/sessions to Internet-facing servers
ii) Average utilization of the ISP lines
iii) Host uptime percentage of mission critical servers
iv) Service uptime percentage of mission critical servers
v) Unplanned downtime of mission critical servers
vi) Percentage of systems with monitored event and activity logs
vii) Percentage of systems with an established contingency plan
viii) Number of not approved open ports on mission critical servers
ix) Percentage of business-critical systems under active monitoring
x) Percentage of critical assets/functions with cost of compromise estimated
xi) Number of incoming Spam detected and filtered in email messages
xii) Number of incoming Spam not detected/missed in email messages
xiii) Number of viruses and spyware detected in e-mail messages

121
Table 13: (Cont.)
xiv) Number of outgoing viruses and spyware caught at gateway
xv) Number of successful attacks
xvi) Number of detected attacks targeting application servers
2) Client security
i) Number of malicious codes detected in client computers
ii) Number of malicious code incidents requiring manual cleanup
iii) Malicious code incidents’ cleanup cost
iv) Percentage of client computers covered by antivirus software
v) Percentage of client computers with current antivirus signatures
vi) Total Number of improper shares per end point devices
vii) Number of not approved open ports on workstations
viii) Number of accounts with default passwords still being used
ix) Number of active user IDs assigned to only one person
x) Percentage of users with authorized system access
xi) Percentage of highly privileged employees whose privileges reviewed this period
xii) Total number of clients having local admin rights in their computers
xiii) Total number of clients not using any two factor authentication
xiv) Total number of clients’ failed logins to the computers
xv) Percentage of directory accounts dead or disabled
xvi) Cycle time to remove terminated or inactive users
xvii) Percentage of inactive/terminated user accounts disabled per policy
xviii) Total number of denied connection attempts from client computers to the low ports of the servers located in the server segment.
3) Application Security
i) Cost of security for revenue-generating systems
ii) Cycle time to grant customer/partner access to company systems
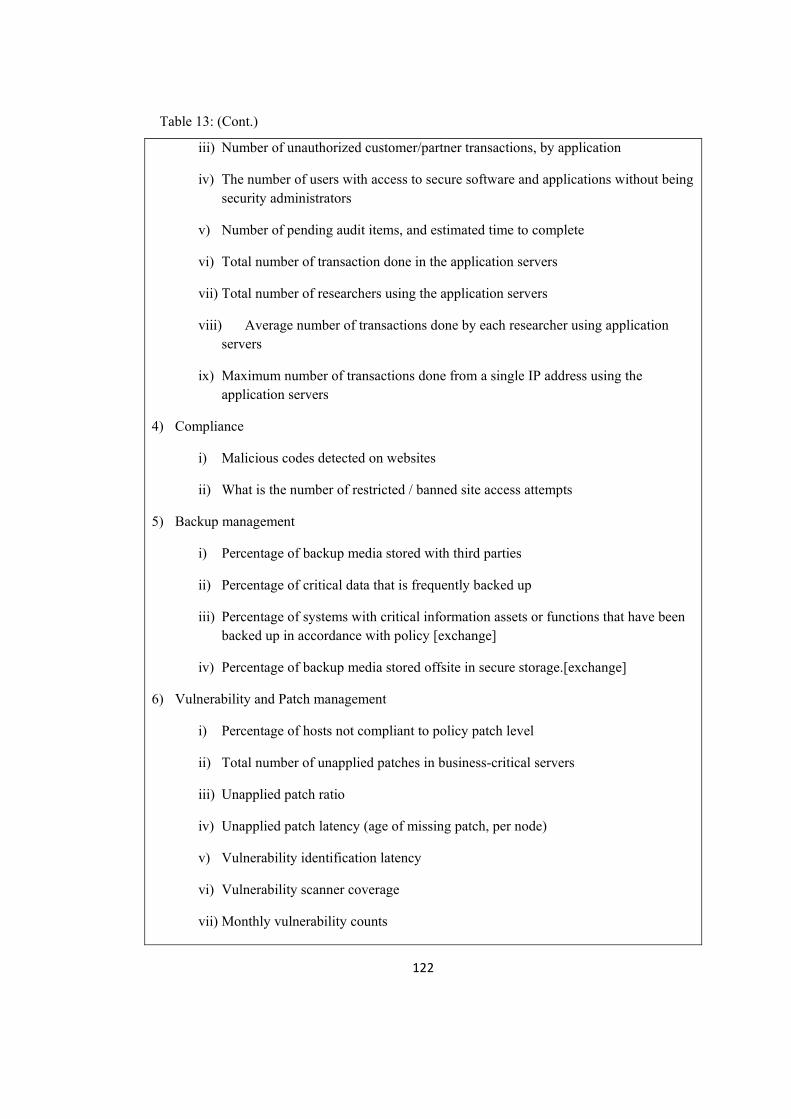
122
Table 13: (Cont.)
iii) Number of unauthorized customer/partner transactions, by application
iv) The number of users with access to secure software and applications without being security administrators
v) Number of pending audit items, and estimated time to complete
vi) Total number of transaction done in the application servers
vii) Total number of researchers using the application servers
viii) Average number of transactions done by each researcher using application servers
ix) Maximum number of transactions done from a single IP address using the application servers
4) Compliance
i) Malicious codes detected on websites
ii) What is the number of restricted / banned site access attempts
5) Backup management
i) Percentage of backup media stored with third parties
ii) Percentage of critical data that is frequently backed up
iii) Percentage of systems with critical information assets or functions that have been backed up in accordance with policy [exchange]
iv) Percentage of backup media stored offsite in secure storage.[exchange]
6) Vulnerability and Patch management
i) Percentage of hosts not compliant to policy patch level
ii) Total number of unapplied patches in business-critical servers
iii) Unapplied patch ratio
iv) Unapplied patch latency (age of missing patch, per node)
v) Vulnerability identification latency
vi) Vulnerability scanner coverage
vii) Monthly vulnerability counts

123
APPENDIX B: Security Metrics Employed
Table 15: Definition of Metric #1
Field Description Metric Definition Host uptime percentage of business-critical servers
Goal Keep the business critical systems up and running by availability measurement for business-critical hosts and systems
Value between 0 and 100 Unit % Type Implementation/technical How to Calculate Average of host uptime percentage of each business critical server Target 99.9 Baseline 99 Frequency Daily Responsible parties Network Responsible Data sources PRTG Network Monitor Reporting format line graph Reference Jaquith 2007 State Reviewed Alert Criteria metric value < Baseline → email alert Alert email to Network Responsible
Procedure:
1. Use PRTG Network Monitor application’s reporting to track daily host uptime
percentage of each critical server.
2. Calculate the daily average host uptime percentage from the values in step 1.
Implementation details:
1. Define business critical servers to the PRTG Network monitor application.
2. Define ping health check for each defined server with the timeout period of 5 seconds.
3. Configure PRTG to report ping downtime of the critical servers on daily bases.

124
Table 16: Definition of Metric #2
Field Description Metric Definition Service uptime percentage of business-critical systems
Goal Keep the business critical systems up and running by availability measurement for business-critical hosts and systems
Value between 0 and 100 Unit % Type implementation
How to Calculate Average of service uptime percentage of each business critical server Target 99.5 Baseline 98 Frequency Daily Responsible parties Network Responsible Data sources PRTG Network Monitor Reporting format line graph Reference Jaquith 2007 State Reviewed Alert Criteria metric value < Baseline → email alert Alert email to System administrator
Procedure:
1. Use PRTG Network Monitor application’s reporting to track daily service uptime
percentage of each critical server.
2. If more than one service is running on the same server, while reporting, take the service
that has the least uptime.
3. Calculate the daily average service uptime percentage from the values in step 1.
Implementation details:
1. Define the applications running on the business critical servers to the PRTG Network
monitor application.
2. Define service health check for each defined service with the timeout period of 5
seconds.
3. Configure PRTG to report service downtime of the critical servers on daily bases.
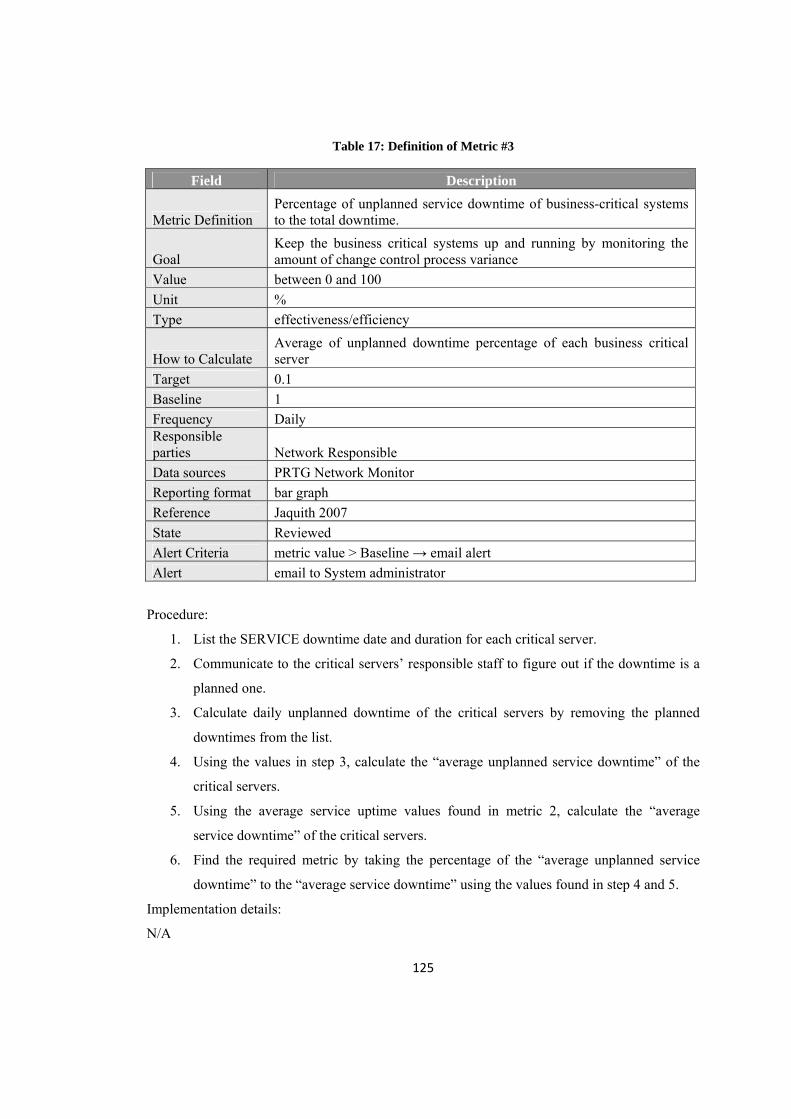
125
Table 17: Definition of Metric #3
Field Description
Metric Definition Percentage of unplanned service downtime of business-critical systems to the total downtime.
Goal Keep the business critical systems up and running by monitoring the amount of change control process variance
Value between 0 and 100 Unit % Type effectiveness/efficiency
How to Calculate Average of unplanned downtime percentage of each business critical server
Target 0.1 Baseline 1 Frequency Daily Responsible parties Network Responsible Data sources PRTG Network Monitor Reporting format bar graph Reference Jaquith 2007 State Reviewed Alert Criteria metric value > Baseline → email alert Alert email to System administrator
Procedure:
1. List the SERVICE downtime date and duration for each critical server.
2. Communicate to the critical servers’ responsible staff to figure out if the downtime is a
planned one.
3. Calculate daily unplanned downtime of the critical servers by removing the planned
downtimes from the list.
4. Using the values in step 3, calculate the “average unplanned service downtime” of the
critical servers.
5. Using the average service uptime values found in metric 2, calculate the “average
service downtime” of the critical servers.
6. Find the required metric by taking the percentage of the “average unplanned service
downtime” to the “average service downtime” using the values found in step 4 and 5.
Implementation details:
N/A

126
Table 18: Definition of Metric #4
Field Description Metric Definition Total number of not approved open ports on business critical servers
Goal Ensure an environment of comprehensive security by monitoring and identifying malicious activities.
Value 0<x<100,000 Unit open ports Type Implementation
How to Calculate Sum up the number of open ports detected on each business critical server
Target 0 Baseline 5 Frequency weekly Responsible parties OS Responsible Data sources Nessus network vulnerability scanner Reporting format bar chart Reference in house developed State Reviewed Alert Criteria metric value > Baseline → email alert Alert email to System administrator
Procedure:
1. Use Nessus Vulnerability Scanner application with port_scanner policy to scan the TCP
and UDP ports of the critical servers.
2. List the open ports for each critical server.
3. Communicate to the critical servers’ responsible staff to figure out if the open ports are
used by the authorized services. This will give the number of unapproved open ports on
each critical server.
4. Find the required metric by summing up the number of unapproved ports in each server.
Implementation details:
1. Define the port_scanner policy on the Nessus Vulnerability Scanner application having:
a. All plug-ins disabled.
b. With “Nessus TCP scanner”, “netstat portscanner” (both SSH and WMI)
enabled only.
2. For easier management of the policies in Nessus, Nessgui application is used.

127
Table 19: Definition of Metric #5
Field Description Metric Definition Number of incoming Spam detected and filtered in email messages
Goal Ensure an environment of comprehensive security by filtering spam email messages
Value 0<=x<100,000,000 Unit spam email messages Type implementation
How to Calculate Total count of incoming email messages blocked as spam in the antispam gateway
Target - Baseline - Frequency daily Responsible parties Security Responsible Data sources Gateway antispam system Reporting format bar chart Reference Jaquith 2007 State Reviewed Alert Criteria metric value = 0 → email alert Alert email to System administrator
Procedure:
1. Get the total number of spam emails filtered from daily statistics report
2. Get the total number of spam emails filtered from previous day’s report
3. Subtract the current day’s spam value from the previous day’s spam value to calculate
the required metric data.
Implementation details:
1. Write a script to take a copy of the statistics file of the antispam gateway system.
2. Schedule via crontab configuration to run the script everyday at 23:59.
By this way, for each day a distinct statistics file will be created, that will be used by the
defined procedure.

128
Table 20: Definition of Metric #6
Field Description Metric Definition Number of incoming Spam not detected/missed in email messages
Goal Ensure an environment of comprehensive security by filtering spam email messages
Value 0<=x<100,000,000 Unit spam email messages Type implementation
How to Calculate Total count of incoming email messages blocked as spam in the email server
Target 400 (max 1 spam emails per mail account) Baseline - Frequency daily Responsible parties Security Responsible Data sources eMail server antispam software Reporting format line chart Reference Jaquith 2007 State Reviewed Alert Criteria Alert
Procedure:
1. Browse the McAfee Groupshield reports: Detected Items→Spam
2. Query the spam report for the required day.
3. Total count of spam email in the report is the required metric data.
Implementation details:
N/A

129
Table 21: Definition of Metric #7
Field Description Metric Definition Number of outgoing email viruses and spywares caught at gateway
Goal Ensure an environment of comprehensive security by monitoring the indicators of internal infections
Value 0<=x<100,000,000 Unit malicious email messages Type implementation How to Calculate Total count of email messages blocked as spam in the email server Target 0 Baseline 100 Frequency daily Responsible parties Security Responsible Data sources Gateway antivirus/antispam system Reporting format line chart Reference Jaquith 2007 State Reviewed Alert Criteria metric value > baseline → email alert Alert email to System administrator
Procedure:
1. Get the total number of outgoing malicious code filtered from daily statistics report
2. Get the total number of malicious code filtered from previous day’s report
3. Subtract the current day’s spam value from the previous day’s malicious code value to
calculate the required metric data.
Implementation details:
1. Write a script to take a copy of the statistics file of the gateway antivirus/antispam
system.
2. Schedule via crontab configuration to run the script everyday at 23:59.
By this way, for each day a distinct statistics file will be created, that will be used by the
defined procedure.

130
Table 22: Definition of Metric #8
Field Description Metric Definition Number of detected attacks targeting application servers
Goal Ensure an environment of comprehensive security by monitoring the indicators of malicious activity
Value 0<=x<100,000,000 Unit attacks Type implementation How to Calculate Total count of application level attack logs/alarms Target Baseline Frequency daily Responsible parties Security Responsible Data sources Firewall's IPS module's logs Reporting format line chart Reference in house built State Reviewed Alert Criteria Alert
Procedure:
1. Open Smartview Tracker application of Check Point Firewall management to monitor
the logs.
2. Filter the logs up to the below criteria:
a) Destination address: web servers
b) Service: Http
c) Product: Smart Defense
d) Date: Specify the date
3. Count the total number of attacks using the “get number of filtered records” button
which gives the required metric data.
Implementation details:
1. Update the server configuration in Check Point firewall to define the web server and
application engine details of the web servers in the organization.
2. Configure the Web-Intelligence module of the Check Point firewall to monitor the
incoming traffic to the defined servers.

131
3. Configure Web Intelligence module to block the cross-site scripting, LDAP injection,
command injection and directory traversal attacks in addition to error concealment
protection.

132
Table 23: Definition of Metric #9
Field Description Metric Definition Number of malicious codes detected in client computers
Goal Ensure an environment of comprehensive security by monitoring the indicators of infection rate on client computers
Value Unit malicious codes Type implementation How to Calculate Total count of malicious codes found in client computers Target 50 Baseline 500 Frequency daily Responsible parties Security Responsible Data sources antivirus management system Reporting format line graph Reference in house built State Reviewed Alert Criteria metric value > baseline → email alert Alert email to System administrator
Procedure:
1. Browse the McAfee ePolicy Orchestrator reports: Reporting →... → Antivirus →
Detection → Detection History
2. Query the detection history report for the required day with excluding the Anti Spam
statistics.
3. Total count of detected malicious codes in the report is the required metric data.
Implementation details:
N/A
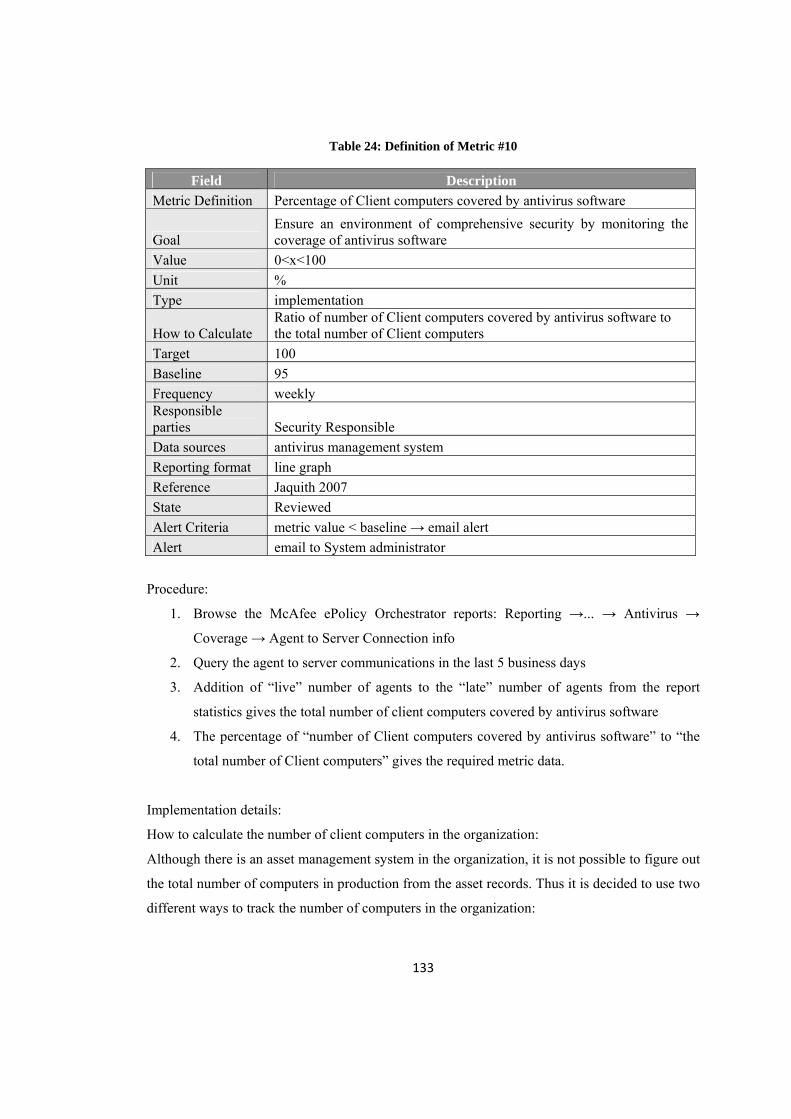
133
Table 24: Definition of Metric #10
Field Description Metric Definition Percentage of Client computers covered by antivirus software
Goal Ensure an environment of comprehensive security by monitoring the coverage of antivirus software
Value 0<x<100 Unit % Type implementation
How to Calculate Ratio of number of Client computers covered by antivirus software to the total number of Client computers
Target 100 Baseline 95 Frequency weekly Responsible parties Security Responsible Data sources antivirus management system Reporting format line graph Reference Jaquith 2007 State Reviewed Alert Criteria metric value < baseline → email alert Alert email to System administrator
Procedure:
1. Browse the McAfee ePolicy Orchestrator reports: Reporting →... → Antivirus →
Coverage → Agent to Server Connection info
2. Query the agent to server communications in the last 5 business days
3. Addition of “live” number of agents to the “late” number of agents from the report
statistics gives the total number of client computers covered by antivirus software
4. The percentage of “number of Client computers covered by antivirus software” to “the
total number of Client computers” gives the required metric data.
Implementation details:
How to calculate the number of client computers in the organization:
Although there is an asset management system in the organization, it is not possible to figure out
the total number of computers in production from the asset records. Thus it is decided to use two
different ways to track the number of computers in the organization:

134
1. Track the total number of live Active Directory accounts. Knowing each user is using
only one computer (with known 12 exceptions) in the organization, from the live
account number it is possible to figure out the number of computers in the system. For
this reason a script (namely, LastLogon.vbs) from Richard L. Mueller’s web site is used.
2. The freeware application Look@Lan which is developed by Carlo Medas is used to
track the number of live computers with ping control. The application can be configured
to do a client check every 10 minutes and keep the discovered hosts in its repository.
Although the computers in the organization are controlled by the group policy which
disables the client firewall applications in the client computers, it is known that, this
application may not give the total number of client computers. But it is used to double
check the number that is found from the first option.
Another method that is discussed is checking the firewall logs for counting the unique
number of IP addresses. Due to the topology of the organization, firewall is receiving all the
broadcast traffic of the clients thus this is a more guaranteed way of counting client
computers. Due to calculation complexity, it is decided to try the first and second methods
first of all. In case they fail, this method will be implemented.

135
Table 25: Definition of Metric #11
Field Description Metric Definition Percentage of Client computers with current antivirus signatures
Goal Ensure an environment of comprehensive security by monitoring the up-to-datedness of antivirus software
Value 0<x<100 Unit % Type effectiveness How to Calculate Target 100 Baseline 95 Frequency weekly Responsible parties Security Responsible Data sources antivirus management system Reporting format line graph Reference Jaquith 2007 State Reviewed Alert Criteria metric value < baseline → email alert Alert email to System administrator
Procedure:
1. Browse the McAfee ePolicy Orchestrator reports: Reporting →... → Antivirus →
Coverage → DAT/Definition deployment summary
2. Query the DAT/Definition deployment summary for the last 4 versions.
3. Addition of number of client having current or max 4 out of date versions of antivirus
signatures gives the total number of client computers with current antivirus signatures.
4. The total number of client computers covered by antivirus software can be used from
Metric 10.
5. The percentage of total number of client computers with current antivirus signatures to
the total number of client computers covered by antivirus software gives the required
metric data.
Implementation details:
N/A

136
Table 26: Definition of Metric #12
Field Description Metric Definition Total number of clients having local admin rights in their computers
Goal Ensure an environment of comprehensive security by reviewing highly privileged client computers.
Value 0<x<100,000 Unit highly privileged clients Type implementation
How to Calculate Total count of undocumented users having admin rights in each client computer.
Target 0 Baseline 5 Frequency weekly Responsible parties Hardware Sec. Manager Data sources Network Scanner Reporting format line graph Reference in house built State Reviewed Alert Criteria metric value < baseline → email alert Alert email to System administrator
Procedure:
1. Define the IP address block of the clients that will be scanned to the Microsoft Baseline
Security Analyzer application.
2. Run the scanner two different days of the week, considering the probability of the client
computers uptime.
3. Check the Windows scan results → Administrative Vulnerabilities → Administrators if
any other user/user-group other than help desk is defined.
4. List the name of the computers that are not compliant with the control in step 3 in each
list.
5. Merge the two list results to find the list of clients having local admin rights in their
computers.
6. The count of computers in the list is the required metric data.
Implementation details:
N/A
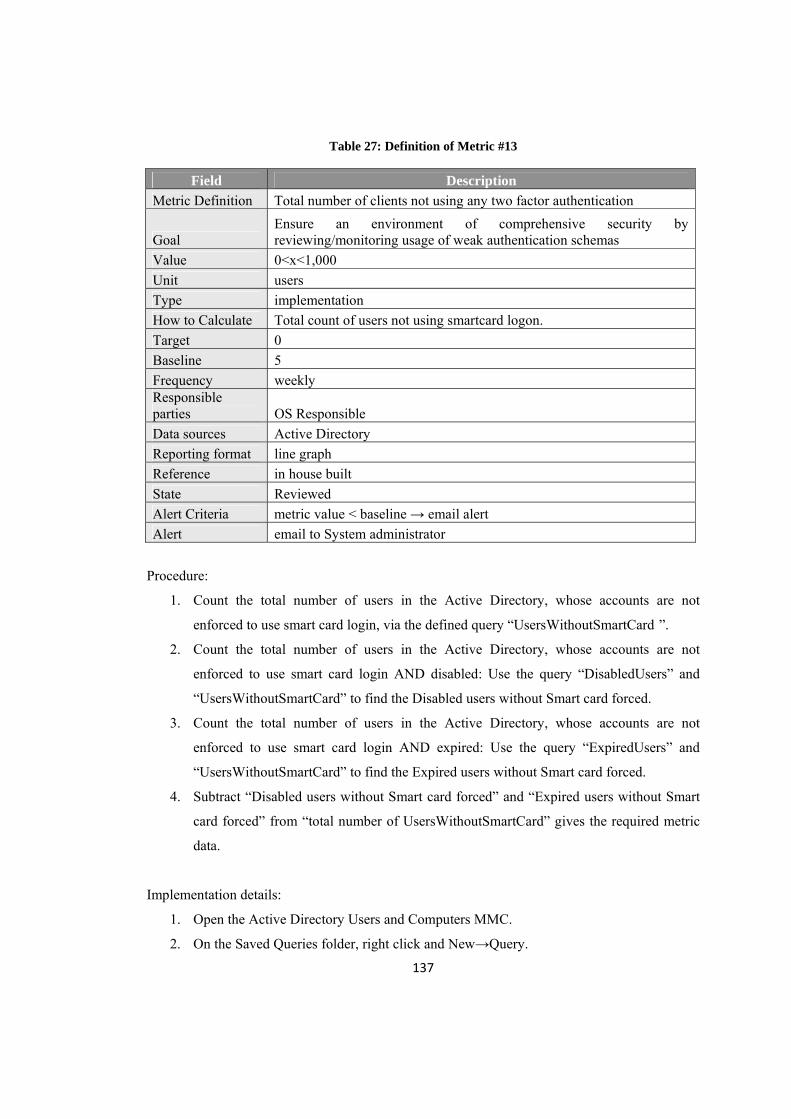
137
Table 27: Definition of Metric #13
Field Description Metric Definition Total number of clients not using any two factor authentication
Goal Ensure an environment of comprehensive security by reviewing/monitoring usage of weak authentication schemas
Value 0<x<1,000 Unit users Type implementation How to Calculate Total count of users not using smartcard logon. Target 0 Baseline 5 Frequency weekly Responsible parties OS Responsible Data sources Active Directory Reporting format line graph Reference in house built State Reviewed Alert Criteria metric value < baseline → email alert Alert email to System administrator
Procedure:
1. Count the total number of users in the Active Directory, whose accounts are not
enforced to use smart card login, via the defined query “UsersWithoutSmartCard ”.
2. Count the total number of users in the Active Directory, whose accounts are not
enforced to use smart card login AND disabled: Use the query “DisabledUsers” and
“UsersWithoutSmartCard” to find the Disabled users without Smart card forced.
3. Count the total number of users in the Active Directory, whose accounts are not
enforced to use smart card login AND expired: Use the query “ExpiredUsers” and
“UsersWithoutSmartCard” to find the Expired users without Smart card forced.
4. Subtract “Disabled users without Smart card forced” and “Expired users without Smart
card forced” from “total number of UsersWithoutSmartCard” gives the required metric
data.
Implementation details:
1. Open the Active Directory Users and Computers MMC.
2. On the Saved Queries folder, right click and New→Query.

138
3. Define
a. Name: UsersWithoutSmartCard
b. Define Name: Custom Search → Advanced →
“(&(objectCategory=person)(objectClass=user)(!useraccountcontrol:1.2.840.11
3556.1.4.803:=262144))”
4. On the Saved Queries folder, right click and New→Query.
5. Define
a. Name: DisabledUsers
b. Define Name: Custom Search → Advanced →
“(&(objectCategory=person)(objectClass=user)(userAccountControl:1.2.840.11
3556.1.4.803:=2))”
6. On the Saved Queries folder, right click and New→Query.
7. Define
a. Name: ExpiredUsers
b. Define Name: Custom Search → Advanced →
“userAccountControl:1.2.840.113556.1.4.803:=8388608”

139
Table 28: Definition of Metric #14
Field Description Metric Definition Total number of clients’ failed logins to the computers
Goal Ensure an environment of comprehensive security by reviewing/monitoring malicious client activities
Value 0<x<10,000 Unit users
Type implementation How to Calculate Count the number of logon failure from event logs of the DC. Target 0 Baseline 5 Frequency daily Responsible parties OS Responsible Data sources Active Directory Reporting format line graph Reference in house built State Reviewed Alert Criteria metric value < baseline → email alert Alert email to System administrator
Procedure:
1. Open Event Viewer application in the Domain Controller.
2. Right clicking on the Security logs, choose View → Filter. Define
a. Event ID : 675 (Authentication failure with password incorrect)
b. Define the date to query using the “From” and “To” parameters.
3. The total count of the events is the required metric data.
Implementation details:
1. Audit Failure is disabled by default and needs to be opened from Group Policy
Management. Open the group policy manager.
2. Browse the domain controllers and edit Default Domain Controllers Policy
3. From Group Policy Object Editor browse:
Computer Configuration → Windows Settings → Security Settings → Local Policies →
Audit Policy Audit Account Logon Events: Failure & Success
Audit Logon Events: Failure & Success
4. Start → Run → “gpupdate /force”

140
Table 29: Definition of Metric #15
Field Description Metric Definition Percentage of dead or disabled active directory accounts
Goal Ensure an environment of comprehensive security by hardining user database
Value 0<x<100 Unit % Type implementation
How to Calculate 10 Target 0 Baseline 5 Frequency weekly Responsible parties OS Responsible Data sources Active Directory Reporting format line graph Reference in house built State Reviewed Alert Criteria metric value < baseline → email alert Alert email to System administrator
Procedure:
1. Count the number of accounts that is not used for computer logon in the last 14 days.
(As discussed in Metric 10, implementation details 1)
2. Count the number of accounts in the Active Directory that is identified as late logon
AND disabled: Use the query “DisabledUsers” and Step 1 to find the late logon accounts
because of disabled account.
3. Count the number of accounts in the Active Directory that is identified as late logon
AND expired: Use the query “ExpiredUsers” and Step 1 to find the late logon accounts
because of expired account.
4. Count the number of accounts in the Active Directory that is identified as late logon
AND service account: List the service accounts and compare the list with Step 1 to find
the late logon accounts because of service usage only.
5. Subtract Value (step2), Value (step3) and Value (step4) from Value (step1) gives the
number of dead accounts in the AD.

141
6. The percentage of dead accounts to the total number of accounts gives the required
metric data.
Implementation details:
N/A

142
Table 30: Definition of Metric #16
Field Description
Metric Definition Total number of denied connection attempts from client computers to the low ports of the servers located in the server segment.
Goal Ensure an environment of comprehensive security by reviewing/monitoring malicious client activities
Value 0<x<100,000 Unit denied connection attempts Type Implementation
How to Calculate Count of Drop logs from client computers to the server pool from low ports.
Target Baseline Frequency daily Responsible parties Hardware Sec. Manager Data sources Firewall Reporting format line graph Reference in house built State Reviewed Alert Criteria Alert
Procedure:
1. Open Smartview Tracker application of Check Point Firewall management to monitor
the logs.
2. Filter the logs up to the below criteria:
e) Source address: Client networks
f) Destination address: Server NET
g) Service: TCP and UDP low ports
h) Action: Drop
i) Date: Specify the date
3. Count the total number of drop packets using the “get number of filtered records” button
which gives the required metric data.
Implementation details:
N/A

143
Table 31: Definition of Metric #17
Field Description Metric Definition Total number of transaction done in the application servers
Goal Ensure business application security by monitoring usage trends and behaviors
Value 0<x<100,000 Unit transactions Type implementation How to Calculate Count total number of transactions from application server logs Target Baseline Frequency daily Responsible parties Software Sec. Manager Data sources application server logs Reporting format bar graph Reference in house built State Reviewed Alert Criteria metric value=0 → email alert Alert email to Application administrator
Procedure:
1. Application logs are stored in the DB. Execute the following SQL statement in the DB
to find the required metric data:
Select count (*) from APPLOGS where to_char (searchtime,'dd.mm.yyyy') =
'04.11.2008'
Note: Table name is altered for security reasons.
Implementation details:
N/A
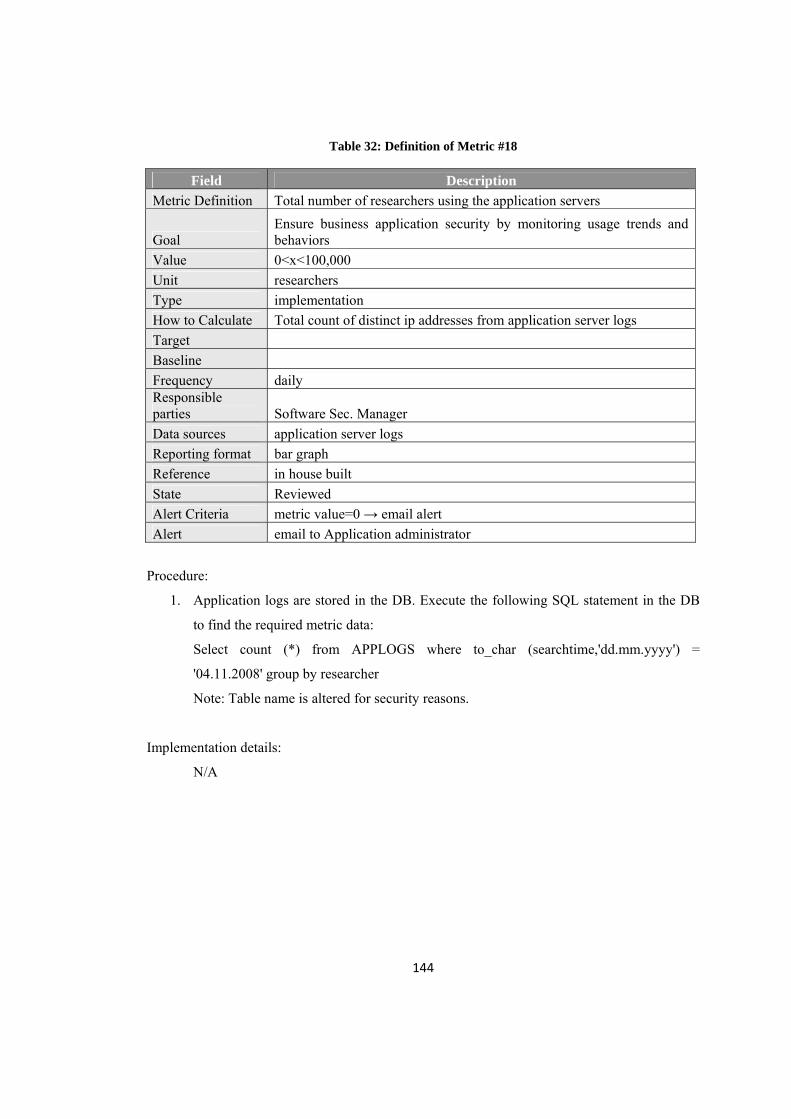
144
Table 32: Definition of Metric #18
Field Description Metric Definition Total number of researchers using the application servers
Goal Ensure business application security by monitoring usage trends and behaviors
Value 0<x<100,000 Unit researchers Type implementation How to Calculate Total count of distinct ip addresses from application server logs Target Baseline Frequency daily Responsible parties Software Sec. Manager Data sources application server logs Reporting format bar graph Reference in house built State Reviewed Alert Criteria metric value=0 → email alert Alert email to Application administrator
Procedure:
1. Application logs are stored in the DB. Execute the following SQL statement in the DB
to find the required metric data:
Select count (*) from APPLOGS where to_char (searchtime,'dd.mm.yyyy') =
'04.11.2008' group by researcher
Note: Table name is altered for security reasons.
Implementation details:
N/A
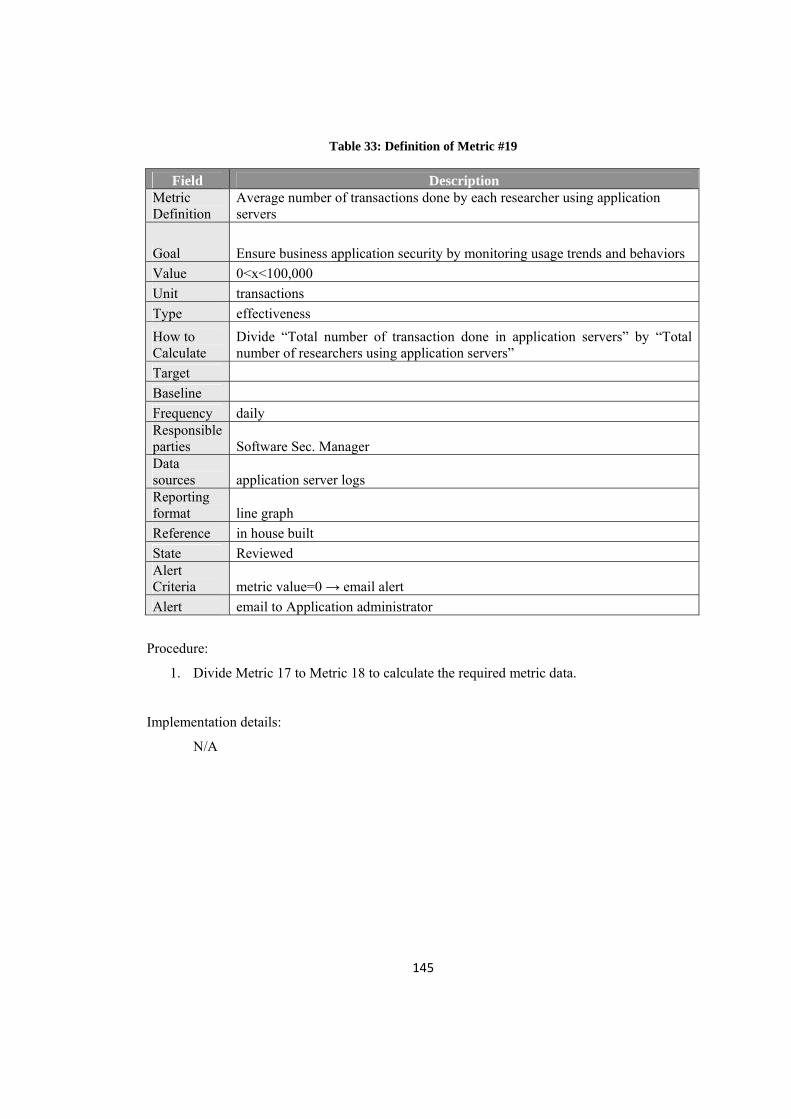
145
Table 33: Definition of Metric #19
Field Description Metric Definition
Average number of transactions done by each researcher using application servers
Goal Ensure business application security by monitoring usage trends and behaviors Value 0<x<100,000 Unit transactions Type effectiveness How to Calculate
Divide “Total number of transaction done in application servers” by “Total number of researchers using application servers”
Target Baseline Frequency daily Responsible parties Software Sec. Manager Data sources application server logs Reporting format line graph Reference in house built State Reviewed Alert Criteria metric value=0 → email alert Alert email to Application administrator
Procedure:
1. Divide Metric 17 to Metric 18 to calculate the required metric data.
Implementation details:
N/A

146
Table 34: Definition of Metric #20
Field Description
Metric Definition Maximum number of transactions done from a single IP address using the application servers
Goal Ensure business application security by monitoring usage trends and behaviors
Value 0<x<100,000 Unit transactions Type implementation
How to Calculate max(total number of transactions done from distinct IP addresses) from application server logs
Target Baseline Frequency daily Responsible parties Software Sec. Manager Data sources application server logs Reporting format bar graph Reference in house built State Reviewed Alert Criteria metric value=0 → email alert Alert email to Application administrator
Procedure:
1. Application logs are stored in the DB. Execute the following SQL statement in the DB
to find the required metric data:
Select max (count (*)) from APPLOGS where to_char (searchtime,'dd.mm.yyyy') =
'04.11.2008' group by researcher
Note: Table name is altered for security reasons.
Implementation details:
N/A

147
Table 35: Definition of Metric #21
Field Description Metric Definition Malicious codes detected on websites browsed by the clients
Goal Ensure an environment of comprehensive security by reviewing/monitoring malicious client activities
Value 0<x<100,000 Unit Malicious codes Type implementation
How to Calculate Count of HTTP/FTP based malicious code detection logs in the gateway antivirus system.
Target Baseline Frequency daily Responsible parties Security Responsible Data sources gateway antivirus system Reporting format line graph Reference Jaquith 2007 State Reviewed Alert Criteria Alert
Procedure:
1. Get the total number of Malicious codes detected from daily statistics report
2. Get the total number of Malicious codes detected from previous day’s report
3. Subtract the current day’s Malicious codes detection value from the previous day’s
Malicious codes detection value to calculate the required metric data.
Implementation details:
1. Write a script to take a copy of the statistics file of the gateway antivirus system.
2. Schedule via crontab configuration to run the script everyday at 23:59.
By this way, for each day a distinct statistics file will be created, that will be used by the
defined procedure.

148
Table 36: Definition of Metric #22
Field Description Metric Definition The number of restricted / banned site access attempts
Goal Ensure an environment of comprehensive security by reviewing/monitoring malicious client activities
Value 0<x<100,000 Unit blocked web page request Type implementation
How to Calculate Count the total number of blocked web page request from Url filtering system logs/reports
Target Baseline Frequency daily Responsible parties Hardware Sec. Manager Data sources Url Filtering System Reporting format Bar Graph Reference Kahraman (2005) State Reviewed Alert Criteria Alert
Procedure:
1. Browse the Websense Enterprise Explorer reports: Reporting → Disposition
2. Refine the query by defining the date
3. The number of occurrences in “Category Block” is the required metric data.
Implementation details:
N/A

149
Table 37: Definition of Metric #23
Field Description
Metric Definition Back up percentage of critical servers' business data up to the defined backup policy
Goal Ensure an environment of comprehensive security and accountability for personnel, facilities, and products.
Value % Unit 0<x<100 Type implementation
How to Calculate Percentage of “Total number of critical servers compliant to the data backup policy” to “Total number of critical servers”
Target 100 Baseline 95 Frequency weekly Responsible parties Hardware Sec. Manager Data sources Data protector Reporting format bar graph Reference Kahraman (2005) State Reviewed Alert Criteria metric value < baseline → email alert Alert email to System administrator
Procedure:
1. Communicate to the critical servers’ responsible staff to figure out the compliance with
the defined data backup policy for each server.
2. Percentage of “Total number of critical servers compliant to the backup policy” to
“Total number of critical servers” is the required metric data.
Implementation details:
N/A
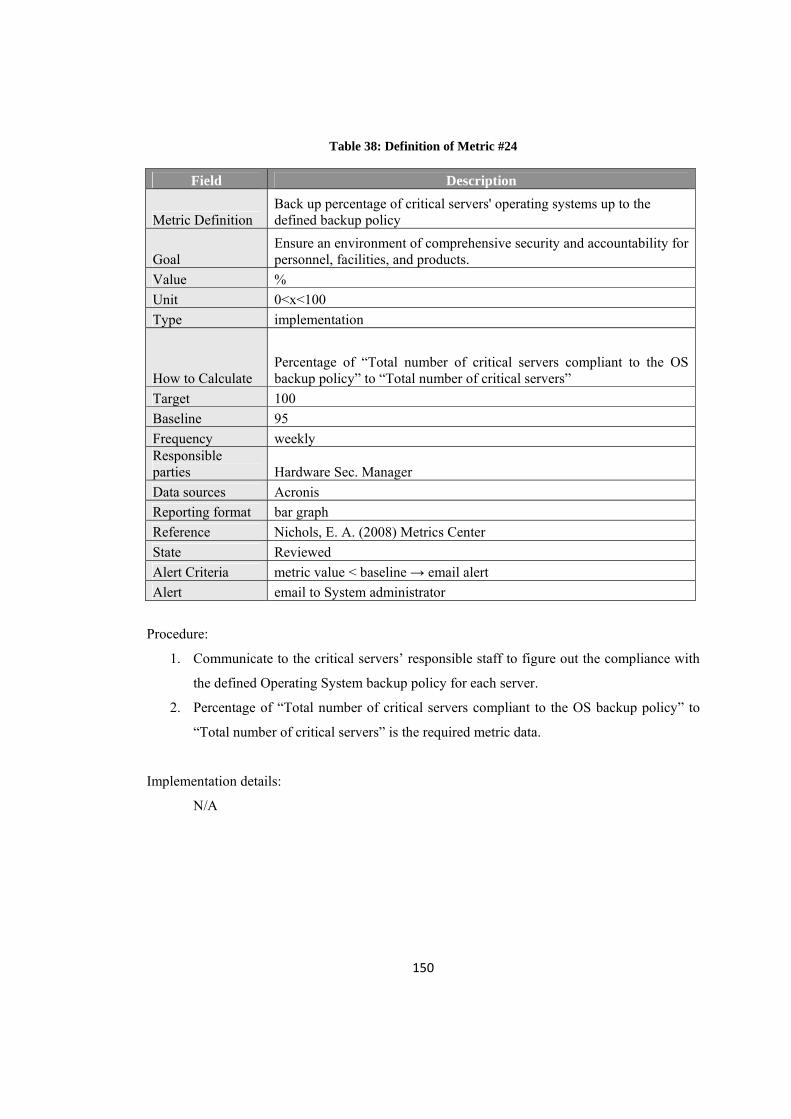
150
Table 38: Definition of Metric #24
Field Description
Metric Definition Back up percentage of critical servers' operating systems up to the defined backup policy
Goal Ensure an environment of comprehensive security and accountability for personnel, facilities, and products.
Value % Unit 0<x<100 Type implementation
How to Calculate Percentage of “Total number of critical servers compliant to the OS backup policy” to “Total number of critical servers”
Target 100 Baseline 95 Frequency weekly Responsible parties Hardware Sec. Manager Data sources Acronis Reporting format bar graph Reference Nichols, E. A. (2008) Metrics Center State Reviewed Alert Criteria metric value < baseline → email alert Alert email to System administrator
Procedure:
1. Communicate to the critical servers’ responsible staff to figure out the compliance with
the defined Operating System backup policy for each server.
2. Percentage of “Total number of critical servers compliant to the OS backup policy” to
“Total number of critical servers” is the required metric data.
Implementation details:
N/A
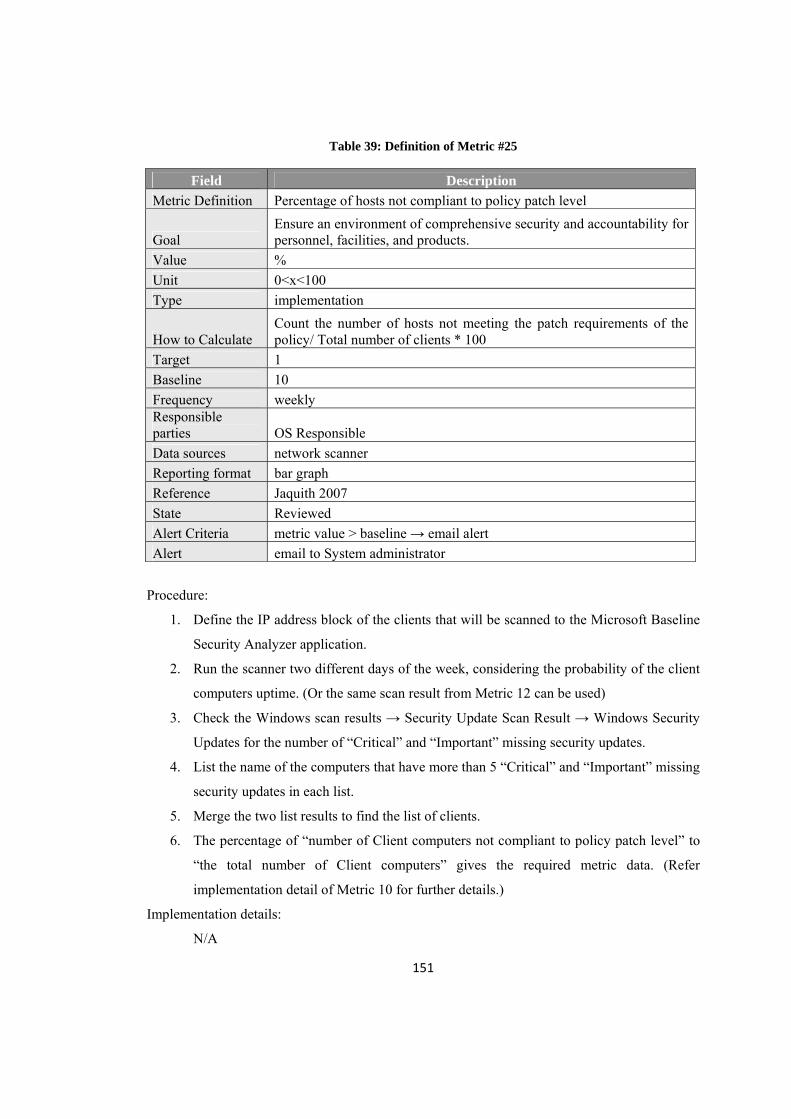
151
Table 39: Definition of Metric #25
Field Description Metric Definition Percentage of hosts not compliant to policy patch level
Goal Ensure an environment of comprehensive security and accountability for personnel, facilities, and products.
Value % Unit 0<x<100 Type implementation
How to Calculate Count the number of hosts not meeting the patch requirements of the policy/ Total number of clients * 100
Target 1 Baseline 10 Frequency weekly Responsible parties OS Responsible Data sources network scanner Reporting format bar graph Reference Jaquith 2007 State Reviewed Alert Criteria metric value > baseline → email alert Alert email to System administrator
Procedure:
1. Define the IP address block of the clients that will be scanned to the Microsoft Baseline
Security Analyzer application.
2. Run the scanner two different days of the week, considering the probability of the client
computers uptime. (Or the same scan result from Metric 12 can be used)
3. Check the Windows scan results → Security Update Scan Result → Windows Security
Updates for the number of “Critical” and “Important” missing security updates.
4. List the name of the computers that have more than 5 “Critical” and “Important” missing
security updates in each list.
5. Merge the two list results to find the list of clients.
6. The percentage of “number of Client computers not compliant to policy patch level” to
“the total number of Client computers” gives the required metric data. (Refer
implementation detail of Metric 10 for further details.)
Implementation details:
N/A

152
Table 40: Definition of Metric #26
Field Description Metric Definition Total number of unapplied critical patches in business-critical servers
Goal Ensure an environment of comprehensive security and accountability for personnel, facilities, and products.
Value unapplied patches Unit 0<x<10,000 Type implementation
How to Calculate Sum of the number of unapplied patches in each business-critical server identified with network scanner.
Target 0 Baseline 30 Frequency weekly Responsible parties OS Responsible Data sources network scanner Reporting format bar graph Reference Jaquith 2007 State Reviewed Alert Criteria metric value > baseline → email alert Alert email to System administrator
Procedure:
1. Run the predefined Nessus sessions.
2. Sum the number of “High” vulnerabilities identified by Nessus in each server to
calculate the required metric.
Implementation details:
1. Scan windows servers with the following scan policy:
a. Credentials → Windows credentials: Define administrator credentials
b. Enable the following plug-ins: Backdoors, DoS, FTP, General, P2P, RPC,
Remote file access, SMTP problems, SNMP, Service detection, Settings,
Useless services, Web Servers, Windows, Microsoft Bulletins and User
management.
2. Scan Linux servers with the following scan policy:
a. Credentials → SSH settings: Define root credentials

153
b. Enable the following plug-ins: Backdoors, CGI abuses, CGI abuses: Xss,
Databases (Oracle), Default Unix accounts, DoS, FTP, Finger abuses, Gain shell
remotely, Gain root remotely, General, HP-UX Local security checks, Misc,
Remote file access, SNMP, Service detection, Settings, Useless services, Web
servers.
3. Define the IP addresses of the critical servers as the target hosts by grouping windows
and Linux servers as different sessions.

154
APPENDIX C: Organizational IT Security Perception Survey
Kurumsal Güvenlik Algısı Anketi
Kurumsal güvenlik dediğimizde öne çıkan noktalarda kurumunuzun ne kadar başarılı olduğunu düşünüyorsunuz? Bu anketi doldurarak kurumsal güvenlik puanınızı belirlemiş olacaksınız. Sorulan sorulara kurumunuzun bulunduğu duruma göre 1 ile 5 arası puanlama yapmanız beklenmektedir. Her sorunun altında puanlama ile ilgili bilgi bulunmaktadır. Her soruyu cevaplama zorunluluğu yoktur. Cevabını bilmediğiniz veya sizinle ilgisiz olduğunu düşündüğünüz soruları lütfen cevaplamayınız.
* Required
Adınız Soyadınız: * Göreviniz: *
1. Kurumsal sunucularınız tarafından verilmekte olan hizmetin kesintisizliğini, yaşadığınız sorunlara ve aldığınız/duyduğunuz şikayetlere bağlı olarak değerlendirir misiniz?
1 2 3 4 5
çok düşük çok iyi
2. Kurumsal sunucularınız iç ve dış tehditlere karşı maruz kaldığı güvenlik risklerinin azaltılması için sizce ne kadar sıkılaştırılmıştır? Sıkılaştırmaya, kullanılmayan servisler kapatılması ve erişim denetim listelerinin oluşturulması gibi örnekler verilebilir.
1 2 3 4 5
çok düşük çok iyi

155
3. Kurumunuzda mevcutta kullanılmakta olan spam eposta önleme sisteminin, spam eposta yakalamada ne kadar başarılı çalıştığını düşünüyorsunuz?
1 2 3 4 5
çok kötü çok iyi
4. Kurumunuzda dışarıya hizmet veren servislerin üzerinde çalıştığı sunucular ne sıklıkla saldırıya maruz kalmaktadır?
1 2 3 4 5
çok sık çok nadir
5. Kurumsal bilgilerin bulunduğu istemci bilgisayarları, virüs ve zararlı kod tehditlerinden ne kadar etkilenmektedir? İstemci bilgisayarlarında bulunan virüs ve zararlı kod miktarı bu tehditlerin bir göstergesi olabilir.
1 2 3 4 5
çok az çok fazla
6. İstemci bilgisayarlarında hali hazırda kullanılmakta olan McAfee virüs koruma yazılımı, sizce zararlı kodların oluşturduğu tehditlere karşı korumayı sağlamakta başarılı mıdır?
1 2 3 4 5
çok başarısız çok başarılı
7. Kurumsal kullanıcıların neden olduğu yetki aşımı sizce ne seviyededir? Yetki aşımı olarak, kurumsal bilgisayarlara izinsiz yazılım kurma, kişiye zimmetlenenin haricindeki kurumsal bilgisayarları kullanma, smartcard'sız oturum açma gibi örnekler verilebilir.
1 2 3 4 5
çok düşük çok yüksek
8. Kurumsal uygulamalardan A (kurumun güvenliği için gizlenmiştir) uygulaması dış kullanıcılar tarafından, sizce amacı dışında kötü niyetle kullanılmakta mıdır?

156
1 2 3 4 5
asla kesinlikle
9. Kurum çalışanlarının, yayınlanan kurumsal güvenlik politikasına dikkat edip, uyum sağlama düzeyleri sizce nedir?
1 2 3 4 5
çok düşük çok yüksek
10. Kurumunuzda kritik sunucularda uygulanan veri yedekleme sistemi sizce yeterli midir?
1 2 3 4 5
çok yetersiz çok iyi
11. Kurumunuzda yama ve zafiyet yönetimi sizce yeterli seviyede midir?
1 2 3 4 5
çok yetersiz çok iyi

157
APPENDIX D: Use Case Diagrams
Table 41: Use Case #1
Use Case UC1: Submit metric definitions to the system Description Inputting security metric definitions developed in the Information
Security Measures Development process. Actors Security Stakeholder assigned responsible of the metric definition. Success Condition Metric definition received by the system is saved. Assumptions Metric definition is developed in the Information Security
Measures Development process. Steps 1. User inputs the metric definition to the system.
2. System does the data validation controls. 3. System saves the metric definition.
Variations #2.1 Authentication/Authorization Fails: System ignores the input #2.2 Data validation fails: System does not save input and reports the error condition to the user. #2.3 System cannot save the metric definition: System reports the error condition to the user.
Table 42: Use Case #2
Use Case UC2: Manage (query/update/delete) metric definitions Description Defined security metric definitions in the Information Security
Measures Development process may require preview, update or deletion while performing the latter processes of the framework.
Actors Security Stakeholder assigned responsible of the metric definition. Success Condition The query performed is displayed by the system.
The updated metric definition is saved by the system. The deleted metric successfully removed from the system.
Assumptions There are metric definitions defined in the system. Steps 1. User query/update/delete metric definition
2. System performs the query/update/delete command Variations #2.1 Authentication/Authorization Fails: System ignores the
command. #2.2 Updated metric definition validation fails: System does not save input and reports the error condition to the user. #2.3 System cannot save/delete the metric definition: System reports the error condition to the user.

158
Table 43: Use Case #3
Use Case UC3: Manage (define/update) users Description System administrators define /update security stakeholders or
managers to the system. Actors Security Stakeholders accessing or requiring access to the system. Success Condition User is successfully defined to the system.
User details are successfully updated in the system. Assumptions - Steps 1. User define/update the requested user details
2. System performs the input validation control. 3. System updates the records about updated/defined user.
Variations #2.1 Authentication/Authorization Fails: System ignores the input #2.2 Data validation fails: System does not save input and reports the error condition to the user. #2.3 System cannot save the user details: System reports the error condition to the user.
Table 44: Use Case #4
Use Case UC4: Delete users Description System administrators delete security stakeholders or managers
from the system. Actors Security Stakeholders performing the user management of the
system. Success Condition System user is successfully removed from the system. Assumptions - Steps 1. User queries the user who will be deleted.
2. System responds with the answer of the query. 3. User deletes the listed user. 4. System validates if the user is linked to any metric
definition or data source. 5. Validated users are deleted from the system.
Variations #2.1 Authentication/Authorization Fails: System ignores the input #4.1 User is linked to other sources: System rejects the command returning the error.

159
Table 45: Use Case #5
Use Case UC5: Define log sources Description Define the log sources that metric data will be collected from Actors Security Stakeholder assigned responsible of the metric definition. Success Condition Log sources are successfully defined to the system. Assumptions - Steps 1. User defines the log source to the system.
2. System does the data validation controls. 3. System saves the log source information.
Variations #2.1 Authentication/Authorization Fails: System ignores the input #2.2 Data validation fails: System does not save input and reports the error condition to the user. #2.3 System cannot save the log source information: System reports the error condition to the user.
Table 46: Use Case #6
Use Case UC6: Define system authorization rights Description Defining the system users’ rights for the management of the log
source definitions and reporting. Actors Security Stakeholders performing the user management of the
system. Success Condition System authorization right definition is saved. Assumptions - Steps 1. Security Stakeholders performing the user management,
query the current rights of the user. 2. System responds with the answer of the query. 3. User defines/updates system authorization rights of the
requested user 4. System performs the input validation control. 5. System updates the records about updated/defined user.
Variations #2.1 Authentication/Authorization Fails: System ignores the input #4.1 Data validation fails: System does not save input and reports the error condition to the user. #5.1 System cannot save the system authorization rights: System reports the error condition to the user.

160
Table 47: Use Case #7
Use Case UC7: Define schedules for metric data collection Description Define the time period that specified metric definition will be in
production for the defined log source. Actors Security Stakeholder assigned responsible of the metric definition. Success Condition Metric schedule is successfully defined to the system. Assumptions The metric definition and log source is specified by the
responsible security stakeholder Steps 1. User defines the metric schedule to the system.
2. System does the data validation controls. 3. System saves the metric schedule information.
Variations #2.1 Authentication/Authorization Fails: System ignores the input #2.2 Data validation fails: System does not save input and reports the error condition to the user. #2.3 System cannot save the metric schedule information: System reports the error condition to the user.
Table 48: Use Case #8
Use Case UC8: Submit metric data manually Description Responsible security stakeholder submits the collected metric
data. Actors Security Stakeholder assigned responsible of the metric definition. Success Condition Metric data is successfully accepted by the system. Assumptions System User is authenticated and authorized
Security Metric definition is defined in the system Steps 1. User chooses the security metric definition he/she will
submit the metric data for. 2. User chooses the log source he/she will submit the metric
data for. 3. User submits the metric data to the system. 4. System saves the metric data.
Variations #3.1 Data validation fails: System does not save input and reports the error condition to the user. #4.1 System cannot save the metric data: System reports the error condition to the user.

161
Table 49: Use Case #9
Use Case UC9: Submit metric data manually automatically Description System device’s metric data is calculated and submitted to the
system Actors System device Success Condition Metric data send to system is saved Assumptions - Steps 1. System device pushes a Metric Data to system
2. System saves the Metric Data Variations #2.1 Authentication Fails: System ignores the message
#2.2 Data validation fails: System does not save message and sends system device the validation error back #2.3 System cannot save the metric data : System sends system device the validation error back
Table 50: Use Case #10
Use Case UC10: Browse metric categories/definitions Description Security stakeholder browses the metric definitions grouped up to
metric categories Actors Security Stakeholders Success Condition Requested metric definitions are displayed to the user Assumptions Metric definitions and categories are available in the system Steps 1. User query metric definitions and categories
2. System displays the queried metric definitions Variations #2.1 Authentication/Authorization Fails: System ignores the
command. #2.2 System cannot query the metric definition: System reports the error condition to the user.

162
Table 51: Use Case #11
Use Case UC11: Generate report based on metric definition Description Security stakeholder generate report by choosing the metric
definition Actors Security Stakeholders Success Condition Requested report is displayed to the user Assumptions Metric definitions are available in the system
User is authenticated and authorized Steps 1. User chooses the metric definition for reporting.
2. User requests the report. 3. System generates and displays the metric report to the
user. Variations #3.1 System cannot generate the report: System reports the error
condition to the user. #3.2 Chosen metric definition doesn’t contain any metric data: System reports the error condition to the user.
Table 52: Use Case #12
Use Case UC12: Browse interactive reports Description Security stakeholder fine-tunes the interactive reports up to the
requirements. Actors Security Stakeholders Success Condition Reports are customized up to the user needs. Assumptions Metric definitions are available in the system
User is authenticated and authorized Steps 1. User choose the metric definition for reporting
2. User request the report 3. System generates and displays the report to the user. 4. User updates the reporting parameters. 5. System generates and displays the report up to the
changed parameters. Variations #3.1 System cannot generate the report: System reports the error
condition to the user. #3.2 Chosen metric definition doesn’t contain any metric data: System reports the error condition to the user. #5.1 System cannot generate the report: System reports the error condition to the user. #5.2 System receives wrong parameters: System reports the error condition to the user.

163
Table 53: Use Case #13
Use Case UC13: Customize home page Description System users update their homepages with their favorite reports. Actors Security Stakeholders Success Condition User updates his/her homepage Assumptions Metric definitions are available in the system
User is authenticated and authorized Steps 1. User displays his/her favorite report.
2. User requests the displayed report to be his/her homepage report.
3. System updates the user’s homepage. Variations #3.1 System cannot update the user’s homepage: System reports
the error condition to the user.
Table 54: Use Case #14
Use Case UC14: Ask/Answer questions Description System users ask/answer questions that may rise while browsing
the reports. Actors Security Stakeholders Success Condition User submits the question/answer to the system. Assumptions User is authenticated and authorized Steps 1. User browses the security report.
2. User submits the question/answer for the report. 3. System receives and publishes the question/answer for the
related report. Variations #3.1 System cannot receive/publish the user’s question/answer:
System reports the error condition to the user.

164
Table 55: Use Case #15
Use Case UC15: Make/Request comments Description System users make/request comments that may rise while
browsing the reports. Actors Security Stakeholders Success Condition User submits the request for comment/comment to the system. Assumptions User is authenticated and authorized Steps 1. User browses the security report.
2. User submits the request for comment/comment for the report.
3. System receives and publishes the request for comment/comment for the related report.
Variations #3.1 System cannot receive/publish the user’s request for comment/comment: System reports the error condition to the user.
Table 56: Use Case #16
Use Case UC16: Manage report templates Description System users customize report templates up to their reporting
needs. Actors Security Stakeholders Success Condition System saves the updated report templates up to the needs of the
users. Assumptions User is authenticated and authorized
There are defined report templates in the system Steps 1. User browses the available report templates.
2. User submits the request for changes for the report templates.
3. System saves the additional reports to the available reports.
Variations #1.1 System cannot display the report templates: System reports the error condition to the user. #2.1 System cannot receive the user’s request for changes: System reports the error condition to the user. #3.1 System cannot save the additional report definition: System reports the error condition to the user.


![[Quality Meetup #13] Piotr Marczydło - Gdy testy to za mało – Continuous Monitoring](https://img.pdfslide.tips/doc/110x75/5a66aeb77f8b9a21208b4655/quality-meetup-13-piotr-marczydlo-gdy-testy-to-za-malo-continuous.jpg)