Embed Size (px)
Citation preview

A MULTI-COUNTRY ASSESSMENT OF PRODUCER WILLINGNESS TO ADOPT GM RICE
Alvaro Durand-Morat
Ravello (Italy): June 16 - 19, 2015

Future Challenges Sustained growth of rice demand
~ 50 million or 11% by 2025 Limited resources to expand production
Land use for rice reached a record 162 million ha Small growth in yields over the last decade Climate change and its impact on the availability and
productivity of natural resources Negative impact on global rice production (e.g., Liu et al.
2013, Tatsumi et al. 2011) Distorting policies that affect the efficient allocation of
resources
Introduction

Current Situation of GM Crops Important adoption of GM crops, except food grain crops
(e.g., rice and wheat)
The GM technology has generated sizable benefits in both developed and developing countries
Economic benefits of GM technology(US$ billions)GM Crop 2012 1996-2012
HT soybean 4.8 37HT corn 1.2 5.4IR corn 6.7 32.3IR cotton 5.3 36.3Other 0.8 5.6Total 18.8 116.6Source: Brookes and Barfoot, 2014
Introduction

Introduction

Current Status of GM Rice There are already first and second generation GM rice
events (e.g., LL rice, RR rice, Bt rice, Golden rice)
No GM rice has been commercialized at a large scale
Benefits of GM rice estimated at US$ 64 billion/year (Demont and Stein, 2013) due to:
Lower production costs
Higher yields due to improved pest management
Health benefits to farmers and farm operators
Health benefits to consumers
Introduction
Assess rice producers’ preferences toward GM rice across the developing world
Estimate farmers WTA GM rice
Analyze the variables affecting farmers’ preferences towards GM rice
Objective of the study

MethodologyThe probability that a utility maximizer with a cumulative valuation distribution function would accept to pay for technology is:
Where is the value of an individual utility function, and is the price of the technological improvement.
In the context of our study, the probability that a utility maximizing producer would accept GM rice () that grants, for instance, yield gain is,
Where represents the minimum threshold required for a farmer to switch from conventional to GM rice.

The stochastic payment card method (SPC) proposed by Wang (1997) is used
Using the SPC data matrix and assuming a distribution function for , we can estimate the mean and variance of the valuation probability function μ σ
For instance, assuming is normally distributed, then, the probability that individual will adopt GM rice granting a yield advantage level , , is
Rearranging we obtain
Estimate the mean and variance for each respondentμ σ
Perform econometric analysis of individuals’ valuation distributions
Methodology
Methodology
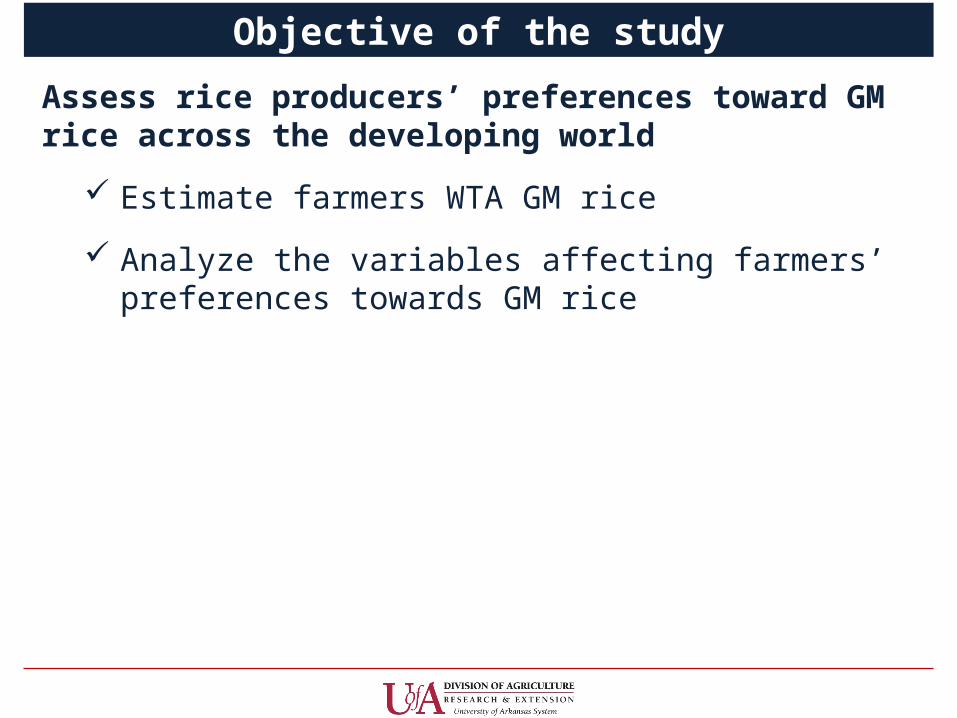
Countries, regions, and number of producers surveyedCountry Surveyed region # farmers surveyed
Bangladesh Sherpur, Mymensingh, Bogra and Dinajpur 200Colombia El Espinal and Saldaña, Tolima 200Ghana Tamale 204Honduras Guangolola, Jesus de Otoro, and Cuyamel 103Tanzania Mbeya and Morogoro 200

Stochastic payment card question for GM rice granting yield benefits vis-à-vis conventional riceAssume that GM rice has: (1) The same production cost as conventional rice, (2) Receives the same price as conventional riceWould you produce GM rice if its yield gain relative to conventional rice were:
Same 5% Higher 10% Higher 15% Higher 20% HigherDefinitely yes Definitely yes Definitely yes Definitely yes Definitely yesProbably yes Probably yes Probably yes Probably yes Probably yesNot sure Not sure Not sure Not sure Not sureProbably yes Probably yes Probably yes Probably yes Probably yesDefinitely yes Definitely yes Definitely yes Definitely yes Definitely yes
Methodology
Methodology
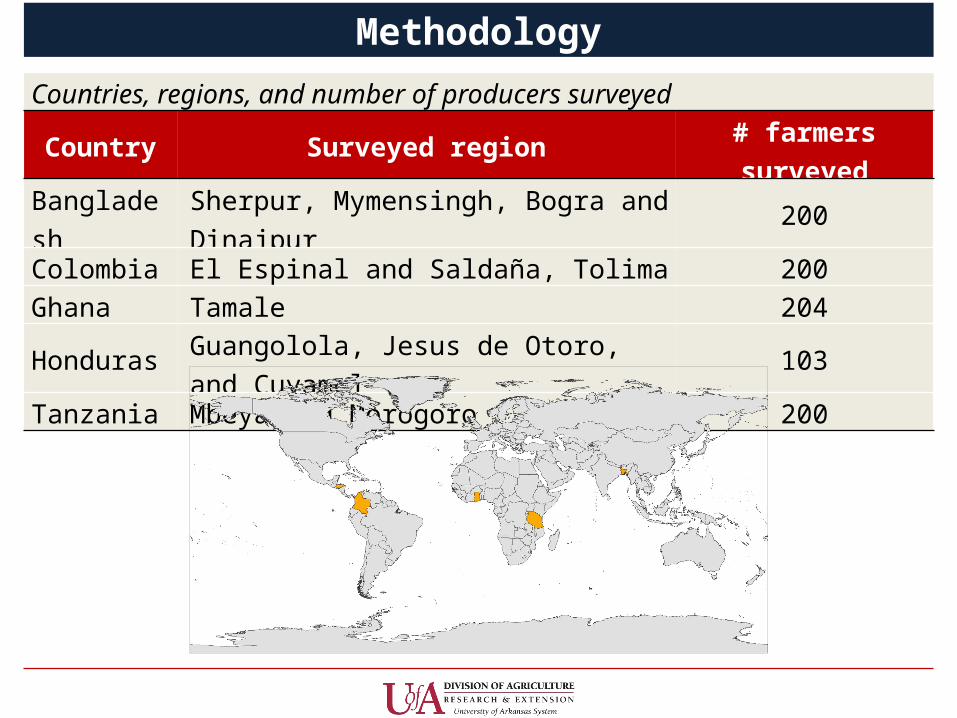
Categories of SPC responsesCase Type of Response pattern
1Including "definitely no" at the lowest and "definitely yes" at the highest asking benefits
2Including "definitely no" at the lowest and any other answer but (i) "definitely yes" at the highest asking benefit, and (ii) all "definitely no"
3Including "definitely yes" at the highest and any other answer but (i) "definitely no" at the lowest asking benefit, and (ii) all "definitely yes"
4Showing consistent behavior within the "definitely no" and "definitely yes" bounds
5 All responses "definitely no"6 All responses "probably no"7 All responses "not sure"8 All responses "probably yes"9 All responses "definitely yes"
10 Inconsistent answers (non-monotonic valuation functions)

Mean TL by trait and sampling method
Mean TL varies significantly across countries Censoring significantly affects the mean TL across all
countries No significant differences across traits by country except in
Ghana higher TL for second generation GM rice
Results
Yield Cost Production Nutrition
Not Censored
0.0%
2.0%
4.0%
6.0%
8.0%
10.0%
Yield Cost Production Nutrition
Mea
n TL
Censored at Zero
Bangladesh Colombia Ghana Honduras Tanzania
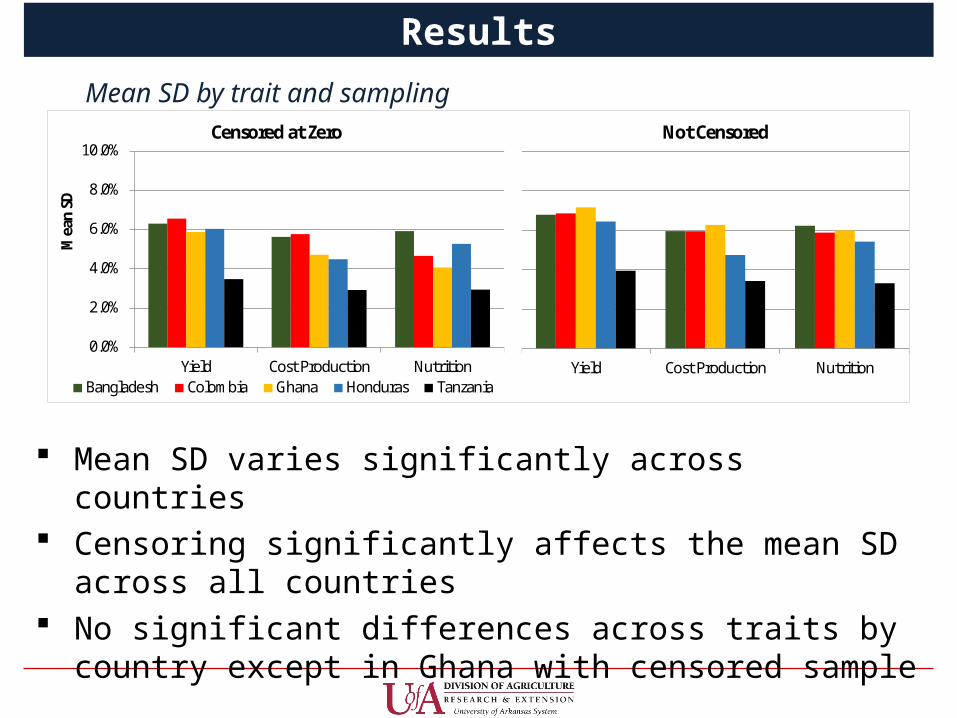
Mean SD by trait and sampling method
Mean SD varies significantly across countries Censoring significantly affects the mean SD across all
countries No significant differences across traits by country except in
Ghana with censored sample
Results
0.0%
2.0%
4.0%
6.0%
8.0%
10.0%
Yield Cost Production Nutrition
Mea
n SD
Censored at Zero
Bangladesh Colombia Ghana Honduras TanzaniaYield Cost Production Nutrition
Not Censored

GM rice has the potential to contribute to stabilize rice production and improve global food security
Barriers still remain that constrain its commercialization Producers’ preferences
Vary significantly across countries Are similar across traits in all countries except Ghana
These findings are valuable for stakeholders and the definition of their strategies to advance the adoption of GM rice The selection of GM rice events subject to be released in
Tanzania and Honduras, for instance, must be done more carefully to ensure larger gains vis-à-vis conventional rice than, say, Bangladesh or Colombia
Conclusions
Heterogeneous producers’ preferences across countries call for mixed approaches to the marketing and promotion of the GM rice technology to improve the chances of success in the adoption of this promising technology
Analysis of the data collected is under way to econometrically estimate the determinants of farmers’ valuation distributions The results of these econometric estimations will provide
more insights regarding the preferences of farmers toward GM rice and potentially help stakeholders define their strategies regarding this technology
Conclusions

Thanks
Questions???


![KESANGGUPAN MEMBAYAR [WILLINGNESS TO …eprints.utm.my/id/eprint/12410/1/NorHayatiSallehMFAB2009.pdfKESANGGUPAN MEMBAYAR [WILLINGNESS TO PAY] OLEH PENGUNJUNG TERHADAP HUTAN BANDAR](https://img.pdfslide.tips/doc/110x75/5cd5affd88c9937d508c37a8/kesanggupan-membayar-willingness-to-membayar-willingness-to-pay-oleh-pengunjung.jpg)


![kesanggupan membayar [willingness to pay] oleh pengunjung](https://img.pdfslide.tips/doc/110x75/5866836f1a28abd2408b5db7/kesanggupan-membayar-willingness-to-pay-oleh-pengunjung-.jpg)