Embed Size (px)
Citation preview

�������� ����� ��
A multicentric study to evaluate the use of relative retention times in targetedproteomics
Vital Vialas, Nuria Colome-Calls, Joaquın Abian, Kerman Aloria, Glo-ria Alvarez-Llamas, Oreto Antunez, Jesus M. Arizmendi, Mikel Azkargorta,Silvia Barcelo-Batllori, Marıa G. Barderas, Francisco Blanco, J. Ignacio Casal,Vanessa Casas, Carolina de la Torre, Eduardo Chicano-Galvez, Felix Elortza,Guadalupe Espadas, Josep M. Estanyol, Joaquın Fernandez-Irigoyen, PatriciaFernandez-Puente, Marıa Jose Fidalgo, Manuel Fuentes, Marina Gay, ConchaGil, Alexandre Hainard, Maria Luisa Hernaez, Nieves Ibarrola, Arthur T.Kopylov, Antonio Lario, Juan Antonio Lopez, Marıa Lopez-Lucendo, MiguelMarcilla, Anabel Marina-Ramırez, Gyorgy Marko-Varga, Luna Martın, MariaI. Mora, Esperanza Morato-Lopez, Javier Munoz, Maria Antonia Odena,Eliandre de Oliveira, Irene Orera, Ignacio Ortea, Carla Pasquarello, KevinB. Ray, Melinda Rezeli, Isabel Ruppen, Eduard Sabido, Manuel M. Sanchezdel Pino, Jaime Sancho, Enrique Santamarıa, Jesus Vazquez, Marta Vilaseca,Fernando Vivanco, James J. Walters, Victor G. Zgoda, Fernando J. Corrales,Francesc Canals, Alberto Paradela
PII: S1874-3919(16)30452-3DOI: doi: 10.1016/j.jprot.2016.10.014Reference: JPROT 2700
To appear in: Journal of Proteomics
Received date: 27 July 2016Revised date: 27 September 2016Accepted date: 24 October 2016
Please cite this article as: Vialas Vital, Colome-Calls Nuria, Abian Joaquın, Alo-ria Kerman, Alvarez-Llamas Gloria, Antunez Oreto, Arizmendi Jesus M., AzkargortaMikel, Barcelo-Batllori Silvia, Barderas Marıa G., Blanco Francisco, Casal J. Ignacio,Casas Vanessa, de la Torre Carolina, Chicano-Galvez Eduardo, Elortza Felix, EspadasGuadalupe, Estanyol Josep M., Fernandez-Irigoyen Joaquın, Fernandez-Puente Patri-cia, Fidalgo Marıa Jose, Fuentes Manuel, Gay Marina, Gil Concha, Hainard Alexandre,Hernaez Maria Luisa, Ibarrola Nieves, Kopylov Arthur T., Lario Antonio, Lopez JuanAntonio, Lopez-Lucendo Marıa, Marcilla Miguel, Marina-Ramırez Anabel, Marko-VargaGyorgy, Martın Luna, Mora Maria I., Morato-Lopez Esperanza, Munoz Javier, OdenaMaria Antonia, de Oliveira Eliandre, Orera Irene, Ortea Ignacio, Pasquarello Carla, RayKevin B., Rezeli Melinda, Ruppen Isabel, Sabido Eduard, del Pino Manuel M. Sanchez,Sancho Jaime, Santamarıa Enrique, Vazquez Jesus, Vilaseca Marta, Vivanco Fernando,Walters James J., Zgoda Victor G., Corrales Fernando J., Canals Francesc, ParadelaAlberto, A multicentric study to evaluate the use of relative retention times in targetedproteomics, Journal of Proteomics (2016), doi: 10.1016/j.jprot.2016.10.014
ACC
EPTE
D M
ANU
SCR
IPT
ACCEPTED MANUSCRIPT
1
A MULTICENTRIC STUDY TO EVALUATE THE USE OF
RELATIVE RETENTION TIMES IN TARGETED PROTEOMICS
Vital Vialas1, £, Núria Colomé-Calls2, £ , Joaquín Abian3, Kerman Aloria4, Gloria Alvarez-Llamas5,
Oreto Antúnez6, Jesus M. Arizmendi7, Mikel Azkargorta8, Silvia Barceló-Batllori9, María G.
Barderas10, Francisco Blanco11, J. Ignacio Casal12, Vanessa Casas3, Carolina de la Torre9, Eduardo
Chicano-Gálvez13, Felix Elortza8, Guadalupe Espadas14, Josep M. Estanyol15, Joaquín Fernandez-
Irigoyen16, Patricia Fernandez-Puente11, María José Fidalgo15, Manuel Fuentes17, Marina Gay18,
Concha Gil1, Alexandre Hainard19, Maria Luisa Hernaez1, Nieves Ibarrola17, Arthur T. Kopylov20,
Antonio Lario21, Juan Antonio Lopez22,María López-Lucendo12, Miguel Marcilla23, Anabel
Marina-Ramírez24, Gyorgy Marko-Varga25, Luna Martín2, Maria I. Mora26, Esperanza Morato-
López24, Javier Muñoz27, Maria Antonia Odena28, Eliandre de Oliveira28, Irene Orera29,Ignacio
Ortea13, Carla Pasquarello19, Kevin B. Ray30, Melinda Rezeli25, Isabel Ruppen27, Eduard Sabidó14,
Manuel M. Sanchez del Pino31, Jaime Sancho21, Enrique Santamaría16, Jesus Vazquez22, Marta
Vilaseca18, Fernando Vivanco5, James J. Walters30, Victor G. Zgoda20, Fernando J. Corrales26,
Francesc Canals2,¥, Alberto Paradela23,¥.
1 ProteoRed-ISCIII, Universidad Complutense de Madrid, Madrid 28040, Spain
2 ProteoRed-ISCIII, Vall d’Hebron Institute of Oncology (VHIO), Barcelona 08035, Spain
3 ProteoRed-ISCIII, Instituto de Investigaciones Biomédicas de Barcelona, IIBB-CSIC/IDIBAPS,
Barcelona 08036, Spain
4 Department of Biochemistry and Molecular Biology, University of the Basque Country-
UPV/EHU, Leioa 48940, Spain
5 ProteoRed-ISCIII , IIS Fundación Jimenez Diaz, Madrid, Spain
6 ProteoRed-ISCIII, SCSIE Universitat de Valencia, Burjassot 46100, Spain
7 ProteoRed-ISCIII, University of the Basque Country-UPV/EHU, Leioa 48940, Spain
8 ProteoRed-ISCIII, CIC bioGUNE, Science and Technology Park of Bizkaia, Derio, Spain
9 ProteoRed-ISCIII, Bellvitge Biomedical Research Institute (IDIBELL), Barcelona, Spain
10 ProteoRed-ISCIII, Hospital Nacional de Parapléjicos-SESCAM, Toledo, Spain
11ProteoRed-ISCIII, INIBIC-CHUAC, A Coruña 15006, Spain
12 ProteoRed-ISCIII, Centro de Investigaciones Biológicas-CSIC, Madrid 28040, Spain
13 ProteoRed-ISCIII, Maimonides Institute for Biomedical Research and Universidad de
Córdoba, Córdoba 14004, Spain
14 ProteoRed-ISCIII, Centre de Regulació Genòmica, Universitat Pompeu Fabra, Barcelona
08003, Spain

ACC
EPTE
D M
ANU
SCR
IPT
ACCEPTED MANUSCRIPT
2
15 ProteoRed-ISCIII, Scientific and Technological Centers (CCiTUB), University of Barcelona,
Barcelona 08036, Spain
16 ProteoRed-ISCIII, Navarrabiomed Biomedical Research Center-IdiSNa, Pamplona, Spain
17 ProteoRed-ISCIII, Cancer Research Center, University of Salamanca-CSIC, IBSAL, Salamanca
37007, Spain
18 ProteoRed-ISCIII, Institute for Research in Biomedicine (IRB Barcelona), Barcelona 08028,
Spain
19 Proteomics Core Facility CMU, University of Geneva, Geneva, Switzerland
20 Orekhovich Institute of Biomedical Chemistry RAMS, Moscow 119121, Russian Federation
21 ProteoRed-ISCIII, IPBLN (CSIC), Armilla-Granada, Spain
22 ProteoRed-ISCIII, Centro Nacional de Investigaciones Cardiovasculares Carlos III (CNIC),
Madrid 28029, Spain
23 ProteoRed-ISCIII, Centro Nacional de Biotecnologia (CSIC), Madrid 28049, Spain
24 ProteoRed-ISCIII, CBM Severo Ochoa (CSIC-UAM), Madrid 28049, Spain
25 Centre of Excellence in Biological and Medical Mass spectrometry, Lund University, Lund,
Sweden
26 ProteoRed-ISCIII, CIMA, University of Navarra, Pamplona 31008, Spain
27 ProteoRed-ISCIII, Spanish National Cancer Research Centre (CNIO), Madrid 28029, Spain
28ProteoRed-ISCIII, Barcelona Science Park, Barcelona 08028, Spain
29 ProteoRed-ISCIII, Instituto Aragonés de Ciencias de la Salud, Zaragoza 50009, Spain
30 MilliporeSigma, St. Louis, MO, USA
31 eparta ent de Bio u ica i Biologia olecular, Universitat de Valencia, Burjassot 46100,
Spain
Authors contribution
£, equal contribution; FC designed the experiment. FC, NCC and AP prepared the PME10
sample. VV, FC and AP analyzed the data and wrote the manuscript. The rest of the authors
performed the proteomics experiments.
¥ Co-corresponding authors at: [email protected]; [email protected]

ACC
EPTE
D M
ANU
SCR
IPT
ACCEPTED MANUSCRIPT
3
Abstract
Despite the maturity reached by targeted proteomic strategies, reliable and
standardized protocols are urgently needed to enhance reproducibility among different
laboratories and analytical platforms, facilitating a more widespread use in biomedical
research. To achieve this goal, the use of dimensionless relative retention times (iRT),
defined on the basis of peptide standard retention times (RT), has lately emerged as a
powerful tool. The robustness, reproducibility and utility of this strategy were examined
for the first time in a multicentric setting, involving 28 laboratories that included 24 of
the Spanish network of proteomics laboratories (ProteoRed-ISCIII). According to the
results obtained in this study, dimensionless retention time values (iRTs) demonstrated
to be a useful tool for transferring and sharing peptide retention times across different
chromatographic set-ups both intra- and inter-laboratories. iRT values also showed
very low variability over long time periods. Furthermore, parallel quantitative analyses
showed a high reproducibility despite the variety of experimental strategies used, either
MRM (multiple reaction monitoring) or pseudoMRM, and the diversity of analytical
platforms employed.
KEYWORDS:
Proteomics; liquid chromatography; targeted proteomics; reproducibility;
standardization; inter-laboratory validation; multiple reaction monitoring.
Introduction
Quantitative analysis of specific target proteins present in complex proteomes has
turned out to be one of the most attractive tools available in modern proteomics[1-3].
Collectively known as targeted proteomics, these techniques track the
presence/absence of protein-specific peptides (proteotypic peptides[4, 5]) in the
samples studied and, under specific experimental conditions, are amenable to produce
absolute quantification data[6-12].
Despite having low resolution and medium mass accuracy, triple quadrupole mass
spectrometers are the instrument of choice to perform targeted analysis[13]. These
instruments offer excellent sensitivity, high selectivity and dynamic range as well as
high speed to monitor in a single liquid chromatography coupled to mass spectrometry
(LC-MS) analysis tens or hundreds of proteotypic peptides corresponding to many
different proteins. In this targeted approach (Multiple Reaction Monitoring, or MRM),
often described as tandem mass spectrometry in space, peptides are selected in the
first quadrupole or Q1 according to the m/z (mass to charge) ratio of the precursor ion,
ACC
EPTE
D M
ANU
SCR
IPT
ACCEPTED MANUSCRIPT
4
fragmented by collision-induced dissociation (CID) in the collision cell, Q2 or second
quadrupole and finally, predefined peptide-specific fragments are selected in the
second mass filter (Q3 or third quadrupole), followed by the measurement of the
intensity of the transmitted ions or transitions. Other mass spectrometers perform
targeted experiments as well, but peptide selection and fragmentation is usually
accomplished with ions trapped in the same place, with multiple separation steps
taking place over time (tandem mass spectrometry in time)[14, 15]. Methods
developed using the last type of mass spectrometers are often described as
pseudoMRM methods.
However, monitoring too many transitions in a single LC-MS targeted experiment could
increase the total cycle time up to a point where there are no sufficient data points to
reconstruct with adequate resolution the chromatographic elution profiles of the
targeted peptides, affecting to the global quality of the data. In these cases, targeted
proteomics strategies may benefit from a great enhancement in efficiency if targeted
peptides are monitored solely around the expected retention time (scheduled
approaches)[16, 17]. Concatenating multiple retention time windows, each
corresponding to different sets of target scheduled peptides, the otherwise limited
number of peptides that can reasonably be measured in one LC-MS run can be greatly
increased, without compromising the accuracy of quantitation or the sensitivity of the
detection. Additionally, targeted signal acquisition in the expected time window
provides additional experimental evidence supporting that the detected signal is
actually generated by the selected peptide and fragments. Therefore, scheduled
approaches favour a significant increase of the number of individual proteotypic
peptides that can be reasonably analysed per LC-MS run, extending the number of
transitions measured per proteins and/or the number of different proteins studied[18,
19].
Selection of proteotypic peptides is usually based on previous data either from
repositories (PeptideAtlas, SRM Atlas)[20, 21] or obtained in a discovery, non-targeted
analysis, typically using LC-MS shotgun experimental approaches that, in addition to
peptide sequences, also provide information about the chromatographic retention times
of the peptides of interest. At first glance, translation of peptide retention times from the
discovery phase to a targeted proteomics protocol should be straightforward. In
practice, empirically measured peptide retention times (RT) are only valid for each
specific experimental set up resulting from the influence of many different parameters,
such as solvents, gradient, column length, dead volumes in the LC system, type of
stationary phase used, column aging and many others. To solve this issue, Escher and

ACC
EPTE
D M
ANU
SCR
IPT
ACCEPTED MANUSCRIPT
5
collaborators proposed a normalized, dimensionless retention time value (named iRT
score) for peptides as a useful tool for transferring and sharing peptide retention times
across chromatographic set-ups both intra- and inter-laboratories[22]. The iRT score
for a given peptide is calculated and normalized relative to a set of synthetic peptides
and its value should remain stable across a wide range of LC configurations.
The use of retention time standards allows the normalization of peptide RT to a
“universal” scale, that can be useful to facilitate sharing of targeted analysis methods
across different experimental setups and laboratories, pinpoint wrong signal
assignments to particular peptides, or design scheduled targeted methods[23]. We
think that these are crucial issues in the context of projects that require the coordination
of multiple participants, such as the Human Proteome Project[24, 25].
To assess the robustness and reproducibility of iRT values in the context of a multi-
centric study, the Spanish network of proteomics laboratories ProteoRed-ISCIII
[26](www.prb2.org/es/proteored) has coordinated a new multicentric study, PME10, in
which a total number of 28 (n=24 from ProteoRed-ISCIII) different laboratories have
taken part. The global objective of PME10 was to evaluate the suitability of retention
time standards to improve targeted proteomic analyses. To achieve this goal,
participants were requested to estimate relative retention times (iRT) from a provided
set of retention time standards and their empirically measured retention times. Then an
averaged set of relative RT values is obtained and used as a global iRT scale to
assess its capability of predicting empirical RTs in hypothetical scheduled assays. For
that purpose, a single centralized pre-digested sample was analysed under different
chromatograpic conditions.
Finally, in the context of the Spanish Human Proteome Project[25] (spHPP-
Chromosome 16) we evaluated the accuracy and reproducibility of a quantitative
analysis of 16 peptides belonging to a set of chromosome 16 – encoded proteins
previously detected in MCF7 cell line, and for which validated MRM methods had been
already set up in the context of the HPP project.
PME10 adds up to previous multicentric experiments illustrating ProteoRed´s
commitment with the improvement of the accuracy, reproducibility and robustness of
different proteomic methodologies[27-29]. Previous multicentric experiments have
evaluated the sensitivity, efficacy and robustness of targeted proteomic approaches
[30-32] but this is the first inter-laboratory study, to our knowledge, that has combined
this methodology and the evaluation of normalized chromatographic retention times.

ACC
EPTE
D M
ANU
SCR
IPT
ACCEPTED MANUSCRIPT
6
MATERIALS AND METHODS
A more detailed description of the materials, methods and instrumentation used is
provided as Supplementary information (supplementary Table 3).
1) Materials
Each participant received a dried study sample containing a mixture composed of: a)
20 micrograms of a tryptic digest of MCF7 human breast cancer cell line total
proteome; b) the MSRT1 calibration mix peptide standard mixture, kindly supplied by
SIGMA-ALDRICH (St. Louis, MO), composed by 14 isotopically labeled synthetic
peptides (average of 4000 fmol/peptide, Table 1) and c) 16 isotopically labeled heavy
peptide standards (400 fmol/peptide, Table 1) corresponding to 16 human proteins for
which SRM methods had been set up and validated by the Spanish chr16 spHPP
consortium (data not shown). Peptides were labeled either with 13C6 15N1 Leu (+7Da),
13C6 15N2 Lys (+8Da) or 13C6
15N4 Arg (+10Da). MSRT1 calibration peptide mixture is a
LC-MS platform standard intended to test chromatographic parameters such as LC
resolution, peptide elution profiles, and retention time prediction. It has been designed
to span a wide range of chromatographic elution times. The amounts of individual
peptides vary to display relatively similar electrospray responses. Normalized retention
time (iRTs) values relative to the previously described Biognosys standards[22] were
also provided (Supplementary Table 1).
In addition, every participant also received a second dried aliquot of pure MSRT1
peptide standards (average 3000 fmol/peptide), and of the labeled peptide standards
mixture (800 fmol/peptide, Supplementary table 2). Samples were sent ready for LC-
MS analysis.
2) Sample Preparation Protocol:
Participants were suggested to dissolve the dried peptide mixtures in a small volume of
20-30% Acetonitrile, 0.1% formic acid in water, and to dilute this stock solution with
0.1% formic acid in water to reduce the acetonitrile concentration to 2-5% at the
moment of the analysis. Participants were suggested to inject 0.2-1 g of MCF7 digest,
40-200 fmol MSRT1 peptides and 4-20 fmol of heavy peptide standards per run.
3) Analysis conditions:
a. Chromatography:
ACC
EPTE
D M
ANU
SCR
IPT
ACCEPTED MANUSCRIPT
7
PME10 participants were recommended to analyse the sample using three different
liquid chromatography (LC) gradients of increasing length. More precisely, a linear
gradient of 0-40% acetonitrile in water in 60, 90 and 120 minutes was recommended,
while relatively permissive conditions were allowed in other LC parameters. Specific
analysis conditions are detailed in Supplementary table 3, but a brief outline of the
conditions is as follows: C18-based reversed phase chromatographic columns internal
diameters ranged from 50 m to 2.1 mm; flow rates were 220 nL/min to 300 L/min;
sample load: 0.4-2 g. In general, most of the participants employed nanoLC
conditions (flow rates 220-500 nL/min) while only two laboratories used microLC
conditions (flow rates 700-1000 nL/min). Finally, a unique participant employed
standard analytical LC conditions (300 L/min)
b. Mass spectrometry:
According to the type of instrumentation (Supplementary table 3), 13 triple quadrupole
mass spectrometers were used, including 9 ABSciex 5500 Qtrap instruments. The rest
of instruments used included 10 different versions of the Thermo Orbitrap family, 2
ABSciex 5600 TripleTOF QTOF mass spectrometers, two three dimensional ion-traps
(Bruker AmaZon Speed) and finally, one Thermo QExactive instrument. The list of
precursors and fragment ion m/z values to be monitored as well as the recommended
dwell times, declustering potentials and collision energies were made available to the
participants either as tables (Supplementary tables 4a and 4b) or skyline files (not
shown). For MSRT1 peptides the transitions listed are the ones suggested in the
Sigma-Aldrich webpage. The consensus SRM parameters for 16 heavy (standard) -
light (endogenous) peptide pairs corresponding to 16 proteins encoded in the
chromosome 16, plus nine additional non isotopically labeled peptides, was obtained
from the Spanish spHPP-Chromosome project, totalling 164 transitions. Therefore, the
list includes the transitions corresponding to at least one labeled standard peptide for
each of the 16 Chromosome 16-encoded proteins.
Some participants adapted the acquisition parameters to the specific instrument and
experimental setups, either for SRM or other targeted approaches (pseudoSRM).
Participants using Thermo Orbitrap (OT) instruments were suggested to apply parallel
reaction monitoring (PRM) acquisition methods similar to those described in PME8
study[29]. In some cases, for analysis in OT or other instruments, it was necessary to
shorten the list of targeted precursor ions. In such cases, the analysis was limited to
the 14 MSRT1 standard peptides, plus the 16 chromosome 16-encoded protein peptide

ACC
EPTE
D M
ANU
SCR
IPT
ACCEPTED MANUSCRIPT
8
heavy-light pairs. Due to the limited amount of sample available, optimization of
acquisition parameters was beyond the aim of the study.
4) Study design:
Samples were prepared and distributed to the 28 participants (24 from Spain, and one
from Russia, Sweden, Switzerland and United States, respectively). The participants
were invited to analyse at least one run of the sample containing the pure MSRT1
standard and three independent runs of the PME10 sample for each of the three
suggested gradient lengths, summing a total of 12 LC-MS runs. Extracted ion
chromatograms (XIC) corresponding to target peptides were first used to obtain their
specific retention times and next to calculate the corresponding iRT values.
Furthermore, for quantification purposes, we asked the participants to calculate the
light/heavy (L/H) ratios for each of the signals detected for the 16 peptides included in
the labeled standard mixture.
5) iRT Calculations:
Participants were suggested to submit the data through a standardized spreadsheet file
for a centralized analysis. In order to normalize all observed retention times to a
common iRT scale, participants were requested to plot the reference MSRT1 iRT
values (Supplementary table 1), against their observed experimental retention times for
each of the recommended LC-MS runs (60, 90 and 120 min). Reference MSRT1 iRT
values were calculated according to the iRT scale defined by Escher et al[22].
Calculation of a linear regression fit in each plot (figure 1) results in a linear equation
for each run, in the form:
iRT = mRT(obs) + b
The equations were used, together with the experimental retention times, to calculate
the iRTs of all the observed peptides in two variants: an external estimation, where the
conversion equation was obtained from plotting the MSRT1 iRT values versus the
measured RTs of the pure MSRT1 peptides; and an internal estimation, where the
equation was obtained from plotting the MSRT1 iRT values versus the RTs of the
MSRT1 peptides spiked in the cell extract (see an example in fig.1).
The iRT values from all participants and gradients were collected, filtered for outliers
(values outside the range defined as 1.5 times the inter-quartile range extending from
quartiles one and three respectively), averaged for every peptide and used to
ACC
EPTE
D M
ANU
SCR
IPT
ACCEPTED MANUSCRIPT
9
reconstruct a global (in the scope of the multi-centric experiment) iRT scale on which
the predictive capability of measured RTs can be tested.
4- Quantification of MCF7 proteins
For each isotopically labelled heavy peptide corresponding to the Chromosome 16 –
encoded proteins, participants were requested to calculate the light to heavy ratio (L/H),
for each of the three technical replicas of each LC gradient. Averaged L/H ratios were
calculated considering all values, as well as standard deviations. Finally, absolute
amounts, expressed as fmol of protein per g of MCF7 total proteome, were calculated.
As in previous ProteoRed Multicentric experiments (PME), we suggested the
participants to submit their results for a centralized analysis. Templates as well as
specific details were made available through the ProteoRed webpage
(http://www.legacy.proteored.org/).
RESULTS AND DISCUSSION
Sharing chromatographic methods for proteomic analyses among laboratories is not
straightforward, given the widely diverse array of instruments and experimental setups
(e.g., from shotgun to targeted approaches), as many variables must be precisely
tuned and integrated. In this regard, methods allowing a reliable prediction of peptide
RT might be of great benefit. The use of peptide RT as the reference parameter for
method sharing has demonstrated relevant restrictions, even when variables, such as
gradient, column dimensions and type of stationary phase, or LC-system dead volumes
were relatively controlled, as was also observed in this study..Figure 2 shows the RT
values for two different sets of synthetic peptides (fig. 2a, 2b) obtained in different
laboratories with a 90 min gradient and a relatively limited range of instrumental setups.
Similar, results were obtained upon use of 60 and 120 minutes gradients
(Supplementary figures 2 a-d). Data variability or distribution is illustrated by the
standard deviation (SD) and the interquartile range (IQR) that in 90 min gradients were
in the range of 8.5 and 10.5, respectively, in most cases. With respect to IQR, which
depicts the range required to cluster the central 50% of the RT values, most of the
values grouped around 10 minutes. Analysis of the results from 60 and 120 min
gradients, demonstrated small, albeit consistent changes in the dispersion values
(supplementary figures 2a-d). Thus, SD and IQR values were in the range of 7 and 7.5
for 60 min gradients and, 10 and 14 for 120 min gradients, respectively. A different
landscape results upon RT normalization (iRTs). Each participant laboratory reported
the estimated sets of iRT peptide values in each of the LC-MS runs in both, external
and internal settings (see Materials and methods). Figures 3 a-d summarize the results

ACC
EPTE
D M
ANU
SCR
IPT
ACCEPTED MANUSCRIPT
10
obtained, which in this case have been plotted considering all the three different
gradients from each laboratory, either using external or internal conversion equations.
Similar observations were made when gradient-dependent results were represented
(data not shown). Overall, both SD and IQR values were in general smaller than those
from RT and enhanced the reproducibility of the measured iRTs across different
gradients and laboratories. On the other hand, no particular instrument dependence in
the calculation of iRTs was observed. This statement was particularly evident when
considering the MSRT1 peptide set, perhaps reflecting that these peptides have been
selected due to their suitability as standards for LC-MS based experimental
approaches. Moreover some MCF7 peptides were poorly or incorrectly detected,
compromising the overall quality of the study (e.g., peptide GHYTEGAELVDSVLDVVR).
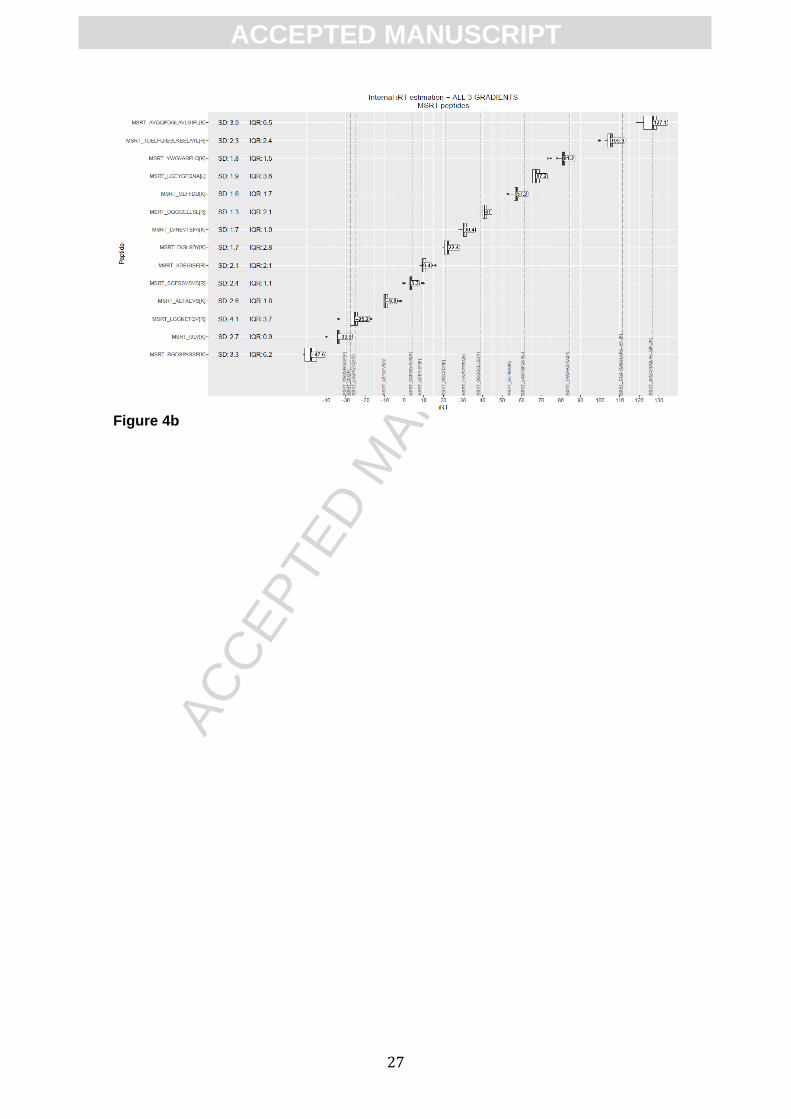
iRT values remain stable over time
Once established the stability of IRTs among laboratories and experimental conditions
(figures 3a-d), we wondered about the potential deviations that may result when the
analyses are repeated over time. To specifically address this question, a small
representative subset of six laboratories repeated the analysis after one year, following
essentially the same working scheme as initially designed. Our results clearly
demonstrated that data dispersion of the new set of normalized iRTs (figures 4 a-d), is
significantly lower than that corresponding to the non-normalized RTs (supplementary
figures 4 a-f), as suggested by both, SD and IQR. We also found a significant reduction
in data dispersion, probably reflecting the restricted number of participant laboratories
(n=6 in this 2nd phase versus n=28 in the 1st phase). Nonetheless, median values
calculated from iRTs are very similar to those obtained in the first inter-laboratory
experimental phase, demonstrating that iRT values remain stable over time.
Relative retention time scales and iRT score for predicting and transferring RT
The two compiled sets, external and internal iRTs for each MCF7 peptide across
gradients, replicates and laboratories were first filtered for outliers, as defined in the
materials and method section. Next, the outlier-filtered sets were averaged to obtain a
final, global iRT score for each of the MCF7 peptides. This scale was then used to
illustrate the usefulness and robustness of these relative retention times for empirical
RT prediction and transfer across LC set ups both spatially, in different laboratories,
and temporally, over a long periods of time.
For each of the three gradients, the iRT sets (internal and external) were used to
predict RTs, by interpolating (in the plot that correlates MSRT1 iRT values with MSRT1

ACC
EPTE
D M
ANU
SCR
IPT
ACCEPTED MANUSCRIPT
11
empirical RTs) in the opposite direction to obtain a predicted RT from a fixed iRT scale
for all the monitored MCF7 peptides. Then the predictive capability of this approach
was accepted when the absolute value of the difference between the predicted and the
empirical RTs that had been initially measured for every peptide lies within discrete
time windows of up to 1 to 5 minutes. This simulation of a scheduled assay scenario,
where a certain peptide signal could be monitored at a predicted RT value with a
restricted time window, can be represented quantitatively (in terms of the percentage of
laboratories that would successfully detect the peptide signal for all LC-MS runs of a
certain gradient) using a heatmap format as shown for 90 min gradients in Figure 5 a-b.
Similar predictive results were obtained for 60- and 120 gradients (Supplementary
figures 5 a-d). According to our results, the majority of the participant laboratories could
successfully detect the monitored peptides signals within an acceptable time window
range for scheduled approaches. Similar results were obtained during the second set
of analyses performed one year later, and using the same original iRT scale (data not
shown).
Overall, these results provide a solid foundation in support of the use of relative
retention time scales as a valuable tool for sharing and transferring RTs, not only
across different laboratories but also over long time periods, addressing thus a key
issue that otherwise hinders the spread and reuse of implemented scheduled targeted
methods.
Targeted Quantitative analysis of MCF7 peptides.
Finally, in addition to the main interest of PME10 multicentric study, that was focused
on the utility of iRTs to standardize and universalize targeted measurements, 16
peptides from chr16 proteins were simultaneously quantified in a MCF7 cell extract
spiked with known quantities of the corresponding heavy versions as internal
references. The results obtained are shown as fmol/g in figure 6, including (figure 6a)
or excluding (figure 6b) the quantitative results corresponding to the peptide
GVVDSEDIPLNLSR. The results show remarkably low inter-laboratory %CV for most
of the peptides, with the reasonably expected exception of the peptides at the lowest
and highest concentration. Since all the isotopically labeled standard peptides were
spiked in at similar concentrations, the larger variability observed at the extreme
concentrations may be partly explained by the larger error expected in the
determination of the ratios at values more divergent from 1:1. Due to the high quality of
these quantitative results, this multicentric study did not evaluate the expected
improving effect that the use of scheduled MRM methods, developed taking into

ACC
EPTE
D M
ANU
SCR
IPT
ACCEPTED MANUSCRIPT
12
account the iRT values, would have on the quantitative data. In fact, we estimated that
the eventual improvement would be minimal and poorly indicative of the puissance of
the scheduled approaches. A possible explanation for these highly reproducible results
is that the centralized preparation of the samples used in this study could have had a
positive impact on the quality of the quantitative results. A more usual situation, in
which every participant laboratory had prepared independently the sample, would
unquestionably increase the dispersion of the quantitative results. An interesting
example can be observed when quantitative results obtained in the first set of data (27
participant laboratories, fig. 6a/b) is compared with the second set of quantitative
results obtained one year later (supplementary figures 6 a/b). In both cases, the
samples were prepared in a centralized way but in different periods. According to this
situation, quantitative results were highly similar but significant differences are evident,
both in terms of absolute quantitative values as well as in terms of data dispersion. On
the other hand, no significant differences, neither in accuracy nor in variability, were
observed when comparing the MRM measurements on triple quadrupole instruments
or other pseudo-MRM targeted approaches. In summary, the high reproducibility of the
quantitative data demonstrated the reliability of the MRM approaches for the
quantitative analysis of proteotypic peptides in complex samples.
ACKNOWLEDGEMENTS: The authors wish to dedicate this manuscript to the memory
of our colleague and former ProteoRed-ISCIII coordinator Juan Pablo Albar. All
laboratories from Spain are members of ProteoRed (Plataforma de Recursos
Biomoleculares y Bioinformáticos) and are supported by grant PT13/0001 funded by
Instituto de Salud Carlos III (ISCIII) and FEDER.
ABBREVIATIONS: iRT, dimensionless relative retention time; RT, retention time; LC-
MS, liquid chromatography coupled to mass spectrometry; MRM, multiple reaction
monitoring; CID, collision-induced dissociation; SRM, single reaction monitoring; HPP,
Human Proteome Project.
[1] S. Gallien, E. Duriez, B. Domon, Selected reaction monitoring applied to proteomics, Journal of mass spectrometry : JMS 46(3) (2011) 298-312. [2] P. Picotti, R. Aebersold, Selected reaction monitoring-based proteomics: workflows, potential, pitfalls and future directions, Nature methods 9(6) (2012) 555-66. [3] A.N. Hoofnagle, J.O. Becker, M.N. Oda, G. Cavigiolio, P. Mayer, T. Vaisar, Multiple-reaction monitoring-mass spectrometric assays can accurately measure the relative protein abundance in complex mixtures, Clinical chemistry 58(4) (2012) 777-81.

ACC
EPTE
D M
ANU
SCR
IPT
ACCEPTED MANUSCRIPT
13
[4] R. Craig, J.P. Cortens, R.C. Beavis, The use of proteotypic peptide libraries for protein identification, Rapid communications in mass spectrometry : RCM 19(13) (2005) 1844-50. [5] B. Kuster, M. Schirle, P. Mallick, R. Aebersold, Scoring proteomes with proteotypic peptide probes, Nature reviews. Molecular cell biology 6(7) (2005) 577-83. [6] E.J. Bennett, J. Rush, S.P. Gygi, J.W. Harper, Dynamics of cullin-RING ubiquitin ligase network revealed by systematic quantitative proteomics, Cell 143(6) (2010) 951-65. [7] A.P. Drabovich, M.P. Pavlou, A. Dimitromanolakis, E.P. Diamandis, Quantitative analysis of energy metabolic pathways in MCF-7 breast cancer cells by selected reaction monitoring assay, Molecular & cellular proteomics : MCP 11(8) (2012) 422-34. [8] M. Jovanovic, L. Reiter, P. Picotti, V. Lange, E. Bogan, B.A. Hurschler, C. Blenkiron, N.J. Lehrbach, X.C. Ding, M. Weiss, S.P. Schrimpf, E.A. Miska, H. Grosshans, R. Aebersold, M.O. Hengartner, A quantitative targeted proteomics approach to validate predicted microRNA targets in C. elegans, Nature methods 7(10) (2010) 837-42. [9] C. Lawless, S.W. Holman, P. Brownridge, K. Lanthaler, V.M. Harman, R. Watkins, D.E. Hammond, R.L. Miller, P.F. Sims, C.M. Grant, C.E. Eyers, R.J. Beynon, S.J. Hubbard, Direct and Absolute Quantification of over 1800 Yeast Proteins via Selected Reaction Monitoring, Molecular & cellular proteomics : MCP (2016). [10] P. Picotti, B. Bodenmiller, L.N. Mueller, B. Domon, R. Aebersold, Full dynamic range proteome analysis of S. cerevisiae by targeted proteomics, Cell 138(4) (2009) 795-806. [11] Y. Zhao, B. Tian, C.B. Edeh, A.R. Brasier, Quantitation of the dynamic profiles of the innate immune response using multiplex selected reaction monitoring-mass spectrometry, Molecular & cellular proteomics : MCP 12(6) (2013) 1513-29. [12] V. Brun, C. Masselon, J. Garin, A. Dupuis, Isotope dilution strategies for absolute quantitative proteomics, Journal of proteomics 72(5) (2009) 740-9. [13] R.A. Yost, C.G. Enke, Triple quadrupole mass spectrometry for direct mixture analysis and structure elucidation, Analytical chemistry 51(12) (1979) 1251-64. [14] K.P. Law, Y.P. Lim, Recent advances in mass spectrometry: data independent analysis and hyper reaction monitoring, Expert review of proteomics 10(6) (2013) 551-66. [15] A. Lesur, B. Domon, Advances in high-resolution accurate mass spectrometry application to targeted proteomics, Proteomics 15(5-6) (2015) 880-90. [16] R. Huttenhain, M. Soste, N. Selevsek, H. Rost, A. Sethi, C. Carapito, T. Farrah, E.W. Deutsch, U. Kusebauch, R.L. Moritz, E. Nimeus-Malmstrom, O. Rinner, R. Aebersold, Reproducible quantification of cancer-associated proteins in body fluids using targeted proteomics, Science translational medicine 4(142) (2012) 142ra94. [17] J. Stahl-Zeng, V. Lange, R. Ossola, K. Eckhardt, W. Krek, R. Aebersold, B. Domon, High sensitivity detection of plasma proteins by multiple reaction monitoring of N-glycosites, Molecular & cellular proteomics : MCP 6(10) (2007) 1809-17. [18] H.A. Ebhardt, Selected reaction monitoring mass spectrometry: a methodology overview, Methods in molecular biology 1072 (2014) 209-22. [19] A. Bertsch, S. Jung, A. Zerck, N. Pfeifer, S. Nahnsen, C. Henneges, A. Nordheim, O. Kohlbacher, Optimal de novo design of MRM experiments for rapid assay

ACC
EPTE
D M
ANU
SCR
IPT
ACCEPTED MANUSCRIPT
14
development in targeted proteomics, Journal of proteome research 9(5) (2010) 2696-704. [20] F. Desiere, E.W. Deutsch, N.L. King, A.I. Nesvizhskii, P. Mallick, J. Eng, S. Chen, J. Eddes, S.N. Loevenich, R. Aebersold, The PeptideAtlas project, Nucleic acids research 34(Database issue) (2006) D655-8. [21] E.W. Deutsch, H. Lam, R. Aebersold, PeptideAtlas: a resource for target selection for emerging targeted proteomics workflows, EMBO reports 9(5) (2008) 429-34. [22] C. Escher, L. Reiter, B. MacLean, R. Ossola, F. Herzog, J. Chilton, M.J. MacCoss, O. Rinner, Using iRT, a normalized retention time for more targeted measurement of peptides, Proteomics 12(8) (2012) 1111-21. [23] R. Bruderer, O.M. Bernhardt, T. Gandhi, L. Reiter, High-precision iRT prediction in the targeted analysis of data-independent acquisition and its impact on identification and quantitation, Proteomics (2016). [24] Y.K. Paik, S.K. Jeong, G.S. Omenn, M. Uhlen, S. Hanash, S.Y. Cho, H.J. Lee, K. Na, E.Y. Choi, F. Yan, F. Zhang, Y. Zhang, M. Snyder, Y. Cheng, R. Chen, G. Marko-Varga, E.W. Deutsch, H. Kim, J.Y. Kwon, R. Aebersold, A. Bairoch, A.D. Taylor, K.Y. Kim, E.Y. Lee, D. Hochstrasser, P. Legrain, W.S. Hancock, The Chromosome-Centric Human Proteome Project for cataloging proteins encoded in the genome, Nature biotechnology 30(3) (2012) 221-3. [25] V. Segura, J.A. Medina-Aunon, E. Guruceaga, S.I. Gharbi, C. Gonzalez-Tejedo, M.M. Sanchez del Pino, F. Canals, M. Fuentes, J.I. Casal, S. Martinez-Bartolome, F. Elortza, J.M. Mato, J.M. Arizmendi, J. Abian, E. Oliveira, C. Gil, F. Vivanco, F. Blanco, J.P. Albar, F.J. Corrales, Spanish human proteome project: dissection of chromosome 16, Journal of proteome research 12(1) (2013) 112-22. [26] A. Paradela, P.R. Escuredo, J.P. Albar, Geographical focus. Proteomics initiatives in Spain: ProteoRed, Proteomics 6 Suppl 2 (2006) 73-6. [27] J.J. Bech-Serra, A. Borthwick, N. Colome, C. ProteoRed, J.P. Albar, M. Wells, M. Sanchez del Pino, F. Canals, A multi-laboratory study assessing reproducibility of a 2D-DIGE differential proteomic experiment, Journal of biomolecular techniques : JBT 20(5) (2009) 293-6. [28] A. Campos, R. Diaz, S. Martinez-Bartolome, J. Sierra, O. Gallardo, E. Sabido, M. Lopez-Lucendo, J. Ignacio Casal, C. Pasquarello, A. Scherl, C. Chiva, E. Borras, A. Odena, F. Elortza, M. Azkargorta, N. Ibarrola, F. Canals, J.P. Albar, E. Oliveira, Multicenter experiment for quality control of peptide-centric LC-MS/MS analysis - A longitudinal performance assessment with nLC coupled to orbitrap MS analyzers, Journal of proteomics 127(Pt B) (2015) 264-74. [29] N. Colomé-Calls, A. Campos, S. Martinez-Bartolome, A. Paradela, C. ProteoRed, E. Oliveira, M.R. Radabaugh, J.J. Walters, K.B. Ray, J.P. Albar, A Multi-Centric Study To Assess Reproducibility of Protein Quantification By SRM LC-MS Proteomic Analysis, Journal of biomolecular techniques : JBT 23(S57) (2012). [30] J.J. Kennedy, S.E. Abbatiello, K. Kim, P. Yan, J.R. Whiteaker, C. Lin, J.S. Kim, Y. Zhang, X. Wang, R.G. Ivey, L. Zhao, H. Min, Y. Lee, M.H. Yu, E.G. Yang, C. Lee, P. Wang, H. Rodriguez, Y. Kim, S.A. Carr, A.G. Paulovich, Demonstrating the feasibility of large-scale development of standardized assays to quantify human proteins, Nature methods 11(2) (2014) 149-55. [31] A.J. Percy, A.G. Chambers, J. Yang, A.M. Jackson, D. Domanski, J. Burkhart, A. Sickmann, C.H. Borchers, Method and platform standardization in MRM-based quantitative plasma proteomics, Journal of proteomics 95 (2013) 66-76.

ACC
EPTE
D M
ANU
SCR
IPT
ACCEPTED MANUSCRIPT
15
[32] A.J. Percy, J. Tamura-Wells, J.P. Albar, K. Aloria, A. Amirkhani, G.D.T. Araujo, J.M. Arizmendi, F. Blanco, F. Canals, J.-Y.-. Cho, N. Colomé-Calls, F.J. Corrales, G. Domont, G. Espadas, P. Fernandez-Puente, C. Gil, P.A. Haynes, M.L. Hernáez, J.Y. Kim, A. Kopylov, M. Marcilla, M.J. McKay, M. Mirzaei, M.P. Molloy, L.B. Ohlund, Y.K. Paik, A. Paradela, M. Raftery, E. Sabido, L. Sleno, D. Wilffert, J.C. Wolters, J.S. Yoo, V. Zgoda, C.E. Parker, C.H. Borchers, Inter-laboratory evaluation of instrument platforms and experimental workflows for quantitative accuracy and reproducibility assesment, EuPA Open Proteomics 8(september) (2015) 6-15.
ACC
EPTE
D M
ANU
SCR
IPT
ACCEPTED MANUSCRIPT
16
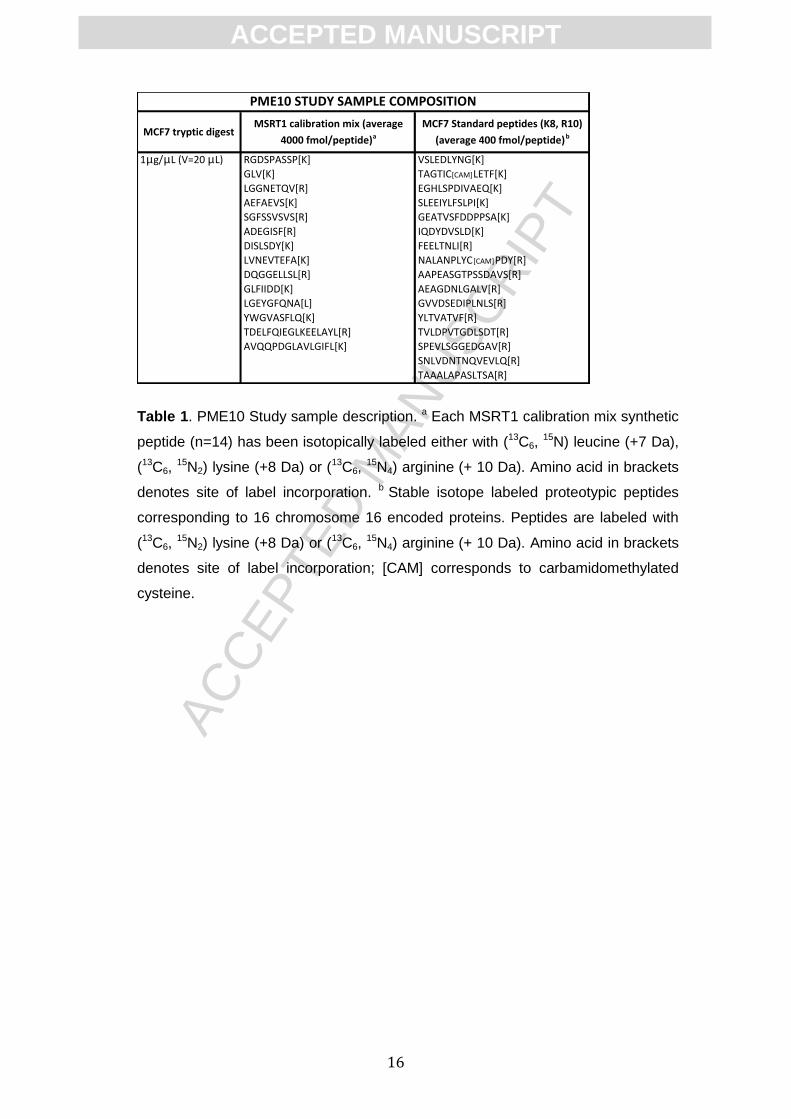
Table 1. PME10 Study sample description. a Each MSRT1 calibration mix synthetic
peptide (n=14) has been isotopically labeled either with (13C6, 15N) leucine (+7 Da),
(13C6, 15N2) lysine (+8 Da) or (13C6,
15N4) arginine (+ 10 Da). Amino acid in brackets
denotes site of label incorporation. b Stable isotope labeled proteotypic peptides
corresponding to 16 chromosome 16 encoded proteins. Peptides are labeled with
(13C6, 15N2) lysine (+8 Da) or (13C6,
15N4) arginine (+ 10 Da). Amino acid in brackets
denotes site of label incorporation; [CAM] corresponds to carbamidomethylated
cysteine.
MCF7trypticdigestMSRT1calibrationmix(average
4000fmol/peptide)aMCF7Standardpeptides(K8,R10)
(average400fmol/peptide)b
1mg/mL(V=20mL) RGDSPASSP[K] VSLEDLYNG[K]
GLV[K] TAGTIC[CAM]LETF[K]
LGGNETQV[R] EGHLSPDIVAEQ[K]
AEFAEVS[K] SLEEIYLFSLPI[K]
SGFSSVSVS[R] GEATVSFDDPPSA[K]
ADEGISF[R] IQDYDVSLD[K]
DISLSDY[K] FEELTNLI[R]
LVNEVTEFA[K] NALANPLYC [CAM]PDY[R]
DQGGELLSL[R] AAPEASGTPSSDAVS[R]
GLFIIDD[K] AEAGDNLGALV[R]
LGEYGFQNA[L] GVVDSEDIPLNLS[R]
YWGVASFLQ[K] YLTVATVF[R]
TDELFQIEGLKEELAYL[R] TVLDPVTGDLSDT[R]
AVQQPDGLAVLGIFL[K] SPEVLSGGEDGAV[R]
SNLVDNTNQVEVLQ[R]
TAAALAPASLTSA[R]
PME10STUDYSAMPLECOMPOSITION

ACC
EPTE
D M
ANU
SCR
IPT
ACCEPTED MANUSCRIPT
17
Figure 1. Representative example obtained after plotting MSRT1 Peptide Standard
experimental retention time values (y-axis, using a 90 min gradient) against MSRT1
reference iRT values (x-axis).
Figure 2. Measured retention times (RT) for MSRT1 (a) and MCF7 (b) peptide sets
employing a consensus 90-min gradient. For each peptide the following information is
included: Standard deviation (SD); Interquartile range (IQR), defined as the range
necessary to cluster the central 50% of RT values; the number of different laboratories
detecting each specific peptide (#Labs); values within the Q1-1.5IQR, Q3+1.5IQR
range are represented as whiskers; boxes represent IQR; numbers inside boxes
indicate the median of the RT values.
Figure 3. Normalized retention times (iRT) for MSRT1 (a and b) and MCF7 (c and d)
peptides. Data from the three different gradients (60,90 and 120 min) were considered,
either using an external (a and c) or an internal estimation (b and d). For each peptide
the following information is included: Standard deviation (SD); Interquartile range (IQR),
defined as the range necessary to cluster the central 50% of iRT values; values within
the Q1-1.5IQR, Q3+1.5IQR range are represented as whiskers; boxes represent IQR;
numbers inside boxes indicate the median of the iRT values. Dashed vertical lines (fig.
3a, 3b) indicate iRT values provided by SIGMA.
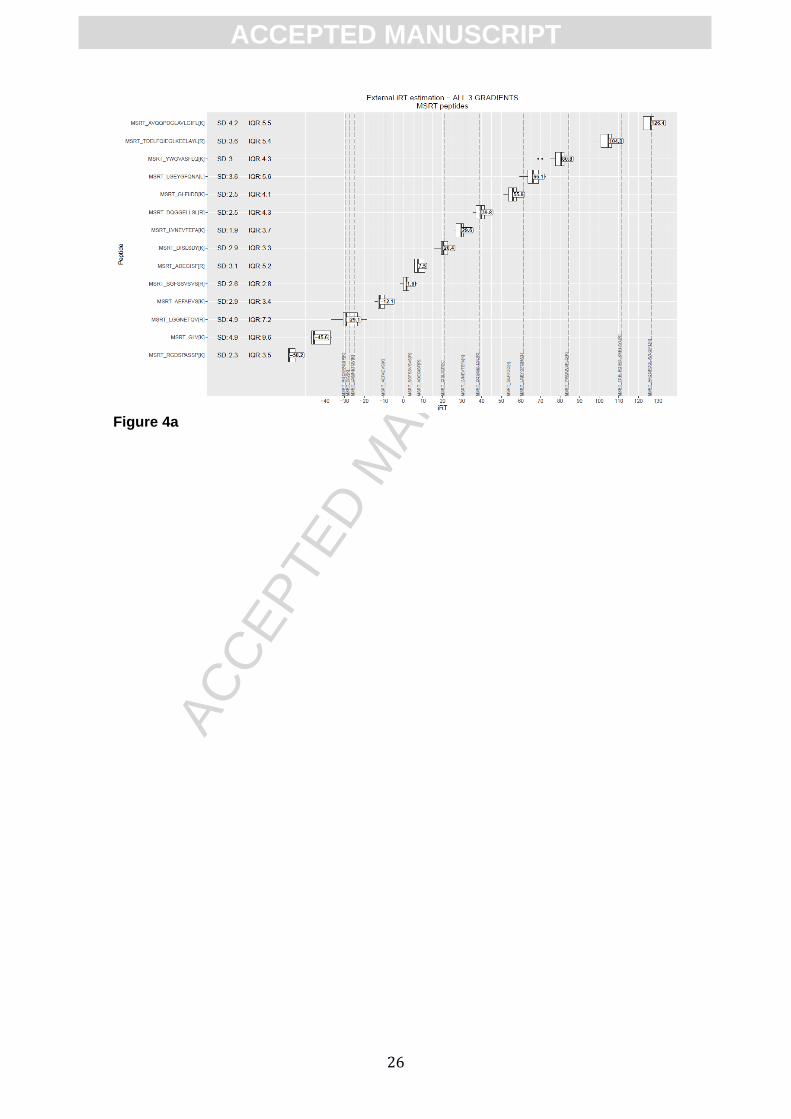
Figure 4. iRT values remain stable over time. Normalized retention times (iRT) from
a second phase of the multicentric analysis (participant laboratories n=6) are shown for
MSRT1 (a and b) and MCF7 (c and d) peptide sets. Data from all different gradients
(60, 90 and 120 min) were considered, either using an external (a and c) or an internal
estimation (b and d). Statistical analysis parameters are depicted as in figure 3
(Standard deviation (SD), Interquartile range (IQR), whiskers, boxes and numbers
inside boxes). Dashed vertical lines (fig. 4a, 4b) indicate iRT values provided by
SIGMA.
Figure 5. Evaluation of the capacity of iRT scores to predict and to facilitate the
transference of peptide RT. The efficacy of RT prediction for a hypothetical
scheduled approach is shown as heat maps. This simulated scenario is recreated by
subtracting from the predicted RT the experimental RT originally measured for each
peptide and gradient. The intensity of gray indicates the percentage of laboratories that
would individually successfully detect the peptides in time windows from 1 to 5 minutes.
Results are shown for 90 min gradients in Figure 5 either using external (fig. 5a) or
ACC
EPTE
D M
ANU
SCR
IPT
ACCEPTED MANUSCRIPT
18
internal (Fig 5b) calibration. Similar results obtained for 60- (supplementary Fig. 5a, 5b)
and 120-gradients (supplementary Fig. 5c, 5d) are also shown.
Figure 6. Targeted Quantitative analysis of MCF7 peptides. MCF7 peptides (n=16)
quantification was estimated using either a MRM or a pseudo-MRM experimental
approach (number of participant laboratories n=28). Data are represented with (figure
6a) or without (figure 6b) data from GVVDSEDIPLNLSR peptide. The following
information is shown: standard deviation (SD); boxes represent Interquartile range
(IQR), defined as the range necessary to cluster the central 50% of iRT values; values
within the Q1-1.5IQR, Q3+1.5IQR range are represented as whiskers; numbers inside
boxes indicate the median of the iRT values.

ACC
EPTE
D M
ANU
SCR
IPT
ACCEPTED MANUSCRIPT
19
Figure 1

ACC
EPTE
D M
ANU
SCR
IPT
ACCEPTED MANUSCRIPT
20
Figure 2a

ACC
EPTE
D M
ANU
SCR
IPT
ACCEPTED MANUSCRIPT
21
Figure 2b

ACC
EPTE
D M
ANU
SCR
IPT
ACCEPTED MANUSCRIPT
22
Figure 3a

ACC
EPTE
D M
ANU
SCR
IPT
ACCEPTED MANUSCRIPT
23
Figure 3b

ACC
EPTE
D M
ANU
SCR
IPT
ACCEPTED MANUSCRIPT
24
Figure 3c

ACC
EPTE
D M
ANU
SCR
IPT
ACCEPTED MANUSCRIPT
25
Figure 3d
ACC
EPTE
D M
ANU
SCR
IPT
ACCEPTED MANUSCRIPT
26
Figure 4a
ACC
EPTE
D M
ANU
SCR
IPT
ACCEPTED MANUSCRIPT
27
Figure 4b

ACC
EPTE
D M
ANU
SCR
IPT
ACCEPTED MANUSCRIPT
28
Figure 4c

ACC
EPTE
D M
ANU
SCR
IPT
ACCEPTED MANUSCRIPT
29
Figure 4d

ACC
EPTE
D M
ANU
SCR
IPT
ACCEPTED MANUSCRIPT
30
Figure 5a

ACC
EPTE
D M
ANU
SCR
IPT
ACCEPTED MANUSCRIPT
31
Figure 5b

ACC
EPTE
D M
ANU
SCR
IPT
ACCEPTED MANUSCRIPT
32
Figure 6a

ACC
EPTE
D M
ANU
SCR
IPT
ACCEPTED MANUSCRIPT
33
Figure 6b

ACC
EPTE
D M
ANU
SCR
IPT
ACCEPTED MANUSCRIPT
34
Graphical abstract

ACC
EPTE
D M
ANU
SCR
IPT
ACCEPTED MANUSCRIPT
35
Conflict of interest
The authors declare that there is no conflict of interest
ACC
EPTE
D M
ANU
SCR
IPT
ACCEPTED MANUSCRIPT
36
Significance
From the very beginning of proteomics as an analytical science there has been a
growing interest in developing standardized methods and experimental
procedures in order to ensure the highest quality and reproducibility of the results.
In this regard, the recent (2012) introduction of the dimensionless retention time
concept has been a significant advance. In our multicentric (28 laboratories) study
we explore the usefulness of this concept in the context of a targeted proteomics
experiment, demonstrating that dimensionless retention time values is a useful
tool for transferring and sharing peptide retention times across different
chromatographic set-ups.

ACC
EPTE
D M
ANU
SCR
IPT
ACCEPTED MANUSCRIPT
37
Highlights
Dimensionless retention time (iRT) values for peptides have been proposed
as a useful tool for transferring and sharing retention times across
chromatographic set-ups both intra- and inter-laboratories.
In a coordinated effort (28 laboratories) we have evaluated the suitability of
retention time standards to improve targeted proteomic analyses.
We have demonstrated that dimensionless retention time values (iRT) are a
useful tool for transferring and sharing peptide retention times accross
different chromatographic set-ups.
Quantitative analyses showed a high reproducibility despite the variety of
experimental strategies and analytical platforms employed.