Embed Size (px)
Citation preview

Sede Amministrativa: Università degli Studi di Padova
Dipartimento di Ingegneria Industriale
CORSO DI DOTTORATO DI RICERCA IN: INGEGNERIA INDUSTRIALE
CURRICOLO: INGEGNERIA CHIMICA, DEI MATERIALI E MECCANICA
CICLO: XXIX
A NEW SET OF GUIDELINES FOR INVENTIVE PROBLEM SOLVING
Coordinatore: Ch.mo Prof. Paolo Colombo
Supervisore: Ch.mo Prof. Enrico Savio
Co Supervisori: Ch.ma Prof.ssa Caterina Rizzi, Ch.mo Prof. Davide Russo
Dottorando: Christian Spreafico

2

3
Abstract The rapid changes characterizing the economy in the last decades convinced companies, especially the most
advanced, to heavily invest in innovation and in approaches to support it in a systematic way to increase the
qualitative level of their products and reduce the time-to-market. Academia answered to this demand with
an increasing number of publications on this topic every year; in addition, industry developed its own
procedures, often internally. As result, today a lot of strategies, theories, methods and tools are available for
systematic innovation. However, an accepted and unified theory and objective criteria able to assist the
problem solver in the selection of the most suitable approach according to her/his needs are still missing.
The Ph.D. thesis refers to this context and its main objectives have been: (1) reviewing and classifying the
huge multitude of systematic innovation methods (for new concept design, product improvement, robust
design, physical investigation, information retrieval, etc.) and (2) developing a methodology to assist the
designer in selecting the most suitable method in accordance with the application context.
Among the several possibilities, I choose to develop a set of guidelines that are both comprehensive and
practical to apply especially in industrial contexts. However, writing guidelines is a complicated activity, as
demonstrated by the numerous examples from literature describing problems and limitations in conceiving
and/or applying them.
Based on literature review, involving not only papers but also patents and empirical evidences collected
during the collaborations in industrial projects and tests with students, I identified the main key features of
the guidelines for inventive problem solving. They are: the structure of single guideline, the organization of
multiple guidelines and the suggested methods and tools. In particular, I focused attention to comprehend
how the suggestions provided by the guidelines change in relation to the kinds of addressed problems, the
different phases in problem solving activity and the user, and how to enrich them through specific
methodological contents.
Then, according to the mentioned features, I developed a set of specific guidelines to improve Spark, a
methodology for systematic innovation developed at University of Bergamo, reviewing some parts and
integrating with some proposed models.
The research activities have been carried out in five phases as described in the following.
During the first activity, a state of the art about the kinds of addressed problems, and the main problem
solving methods, approaches and strategies to support systematic innovation has been carried out.
In the second activity, the main features of the guidelines have been identified through a detailed analysis
based on literature surveys, of Design models (e.g., FBS), Risk analysis techniques (FMEA), Problem solving
tools (TRIZ) and empirical evidences collected in the companies and by involving engineering students.
The results have been organized according to three main aspects: the definition of the most suitable
structure of a single guideline (in terms of provided text, graphical representations and examples), the
organization of multiple guidelines (hierarchical maps, random lists, matrices, etc.) and the models and tools
suggested by the guidelines in accordance to the addressed inventive problems and the phase in problem
solving activity.
This results have then been summarized in a set of rules for writing guidelines.
During the third activity, the identified features have been applied to improve some parts of Spark
methodology, which is structured as an ordered step by step procedure to enhance the different problem

4
solver skills: function identification, evolutionary overview identification, problem identification, problem
reformulation and idea generation. Even if this methodology has been successfully applied in industrial cases
studies, it still presents some limitations (e.g., by supporting new product design).
I tried to improve Spark by expanding its domain of application to all the considered inventive problems and
by ameliorating its comprehension and applicability, through an increased level of awareness of the designer
while maintaining the suggested path. To do this, I improved the parts of function and problem identification
through the introduction of two specific models derived from FBS and FMEA, and I reformulated the part of
idea generation by providing a more rigorous ontology and a more intuitive organization to the already
contained guidelines. Finally, I proposed a comprehensive set of guidelines to guide the user in the use of the
improved version of Spark.
The resulting approach maintains a unique path to face all the considered inventive problems and allows
specific iterations and ramifications inside the main steps, depending on the problem and the context of
application.
In the fourth activity, the goal has been to drive the user to model the problem with a functional approach,
in order to be able to consult the Information Retrieval tools in the proper way to find out if someone has
already solved the problem in another context. More in detail, this means to conceive a guideline able to
support the user in defining the right element on which to work, the function and the behaviour of the
solution, at least in terms of physical effect. Patent repository is used as technical source for gathering such
an information. During the doctorate, I learned techniques and software prototypes developed by the
University of Bergamo, for query expansions based on hyponyms, meronyms, hypernyms and lexical variants.
I tested them in industrial case studies, to comprehend how to integrate info gathering into the guidelines
structure.
During the fifth activity, I recombined all the results previously achieved within of a software platform that I
developed. It collects flexible guidelines, able to adapt to the different kinds of problems, which are organized
through the conceptual scheme studied during the third activity, and integrates the knowledge retrieval
techniques of the fourth activity.
The proposed platform and the guidelines have been tested with real industrial case studies proposed by
companies with whom I collaborated, such as ABB, Tenacta-Imetec. The tests involved MsD and PhD
students, during thesis works, project works and group sessions with more than 10 students each one. The
achieved results, compared to traditional Spark and other approaches, have been encouraging in terms of
function identification, by facilitating the determination of the required operative zone and operative time,
problem identification, with an increased user’s awareness about the dynamic of occurrence, and idea
generation, with a great number of qualitatively better achieved solutions.
Keywords: Systematic Innovation, Guidelines for Inventive Problem Solving, Computer Aided Innovation.
5
Riassunto I rapidi cambiamenti che caratterizzano l’economia negli ultimi decenni hanno convinto le industrie,
specialmente le più avanzate, ad investire ampiamente sugli approcci a supporto dell’innovazione
sistematica, con l’obiettivo di migliorare il livello qualitativo dei propri prodotti e ridurre il tempo di sviluppo.
L’accademia ha risposto a questa necessità con un numero di pubblicazioni in quest’ambito crescente di anno
in anno; in più anche l’industria sviluppa i propri approcci, spesso internamente. Come risultato, sono oggi
disponibili una grande quantità di strategie, teorie, metodi e strumenti a supporto dell’innovazione
sistematica. Tuttavia una teoria unificata ed accattata è ancora mancante, così come criteri oggettivi di scelta
capaci di supportare il problem solver nella scelta dell’approccio più adatto alle sue necessità.
Questa tesi di Dottorato fa riferimento a tale contesto ed i suoi principali obiettivi sono stati: (1) rivedere e
classificare i molti metodi di innovazione (progettazione di nuovi prototipi, product improvement, robust
design, investigazione della fisica del problema, ricerca di informazioni, ecc.) e (2) sviluppare una metodologia
per assistere il problem solver nella scelta dell’approccio più adatto in relazione al contesto applicativo.
Tra le molte possibilità, ho scelto di sviluppare un insieme di linee guida che siano allo stesso tempo
comprensibili e pratiche da applicare specialmente in contesti industriali. Tuttavia, scrivere linee guida è
un’attività complicata, come testimoniato da numerosi esempi dalla letteratura che descrivono i problemi e
le limitazioni derivanti dalla loro creazione e dalla loro applicazione.
Sulla base di una dettagliata revisione della letteratura, contenente non solo articoli ma anche brevetti ed
evidenze sperimentali raccolte durante collaborazioni in progetti industriali e test con gli studenti, ho
identificato le principali caratteristiche delle linee guida per la risoluzione dei problemi inventivi. Esse sono:
la struttura delle singole linee guida, l’organizzazione di più linee guida ed i metodi e gli strumenti suggeriti
da esse. In particolare, ho focalizzato l’attenzione per comprendere come i suggerimenti delle linee guida
cambiano in relazione alla tipologia di problema affrontato, alle differenti fasi nell’attività di problem solving
e all’utente, e ad arricchire le linee guida attraverso contenuti metodologici precisi.
Quindi, sulla base dei tali caratteristiche, ho sviluppato un insieme di linee guida specifiche per migliorare
Spark, una metodologia a supporto dell’innovazione sistematica, sviluppata dall’Università degli Studi di
Bergamo, rivedendone alcune parti ed integrandola con modelli proposti.
L’attività di ricerca è stata portata avanti in cinque fasi come descritto nel seguito.
Durante la prima attività è stato eseguito uno stato dell’arte relativo alle tipologie di problemi affrontati e ai
principali metodi, approcci e strategie di problem solving a supporto dell’innovazione sistematica.
Durante la seconda attività sono state identificate le principali caratteristiche delle linee guida, attraverso
un’analisi dettagliata della letteratura relativa ai modelli per la progettazione (e.g., FBS), tecniche di analisi
dei rischi (e.g., FMEA), strumenti per il problem solving (TRIZ) ed evidenze empiriche raccolte nelle aziende e
coinvolgendo studenti di ingegneria.
I risultati sono stati organizzati secondo tre aspetti principali: la definizione della struttura più opportuna per
le singole linee guida (in termini di testo proposto, rappresentazioni grafiche ed esempi), l’organizzazione di
più linee guida (mappe gerarchiche, liste casuali, matrici, ecc.) ed i modelli e gli strumenti suggeriti dalle linee
guida in relazione ai problemi inventivi affrontati e alla fase nell’attività di problem solving.
Questi risultati sono stati quindi riassunti in un insieme di regole per scrivere le linee guida.

6
Durante la terza attività, le caratteristiche identificate delle linee guida sono state applicate per migliorare
alcune parti della metodologia Spark, la quale è strutturata come un percorso ordinato e diviso in fasi per
accrescere le differenti abilità del problem solver: identificazione della funzione principale, identificazione
della panoramica evolutiva, identificazione del problema, riformulazione del problema e generazione di idee.
Anche se questa metodologia è stata applicata con successo in casi studio industriali, presenta ancora alcune
limitazioni (e.g., nel supportare la progettazione concettuale di nuovi prodotti).
Ho quindi cercato di migliorare Spark, espandendo il suo dominio di applicazione a tutti i problemi inventivi
considerati e migliorando la sua comprensione e la sua applicabilità attraverso l’accrescimento del livello di
consapevolezza del problem solver e mantenendo il percorso suggerito. Per far ciò, ho migliorato le parti
dell’identificazione della funzione principale e del problema, introducendo due modelli specifici derivati da
FBS e FMEA, e riformulando la parte della generazione delle idee con una struttura ontologica più rigorosa
ed una organizzazione più intuitiva delle linee guida presenti. Infine ho proposto un insieme complessivo di
linee guida per supportare l’utente durante l’utilizzo della versione modificata di Spark.
L’approccio risultate mantiene un unico percorso per affrontare tutti i problemi inventivi considerati e
permette iterazioni e ramificazioni specifiche all’interno degli step principali a seconda del problema e del
contesto di applicazione.
Durante la quarta attività, l’obiettivo è stato guidare l’utente a modellare il problema con un approccio
funzionale, in modo da poter consultare nella maniera opportuna uno strumento per la ricerca delle
informazioni, così da poter apprendere se il problema in questione sia già stato risolto in un altro contesto.
Più in dettaglio, ciò significa concepire linee guida capaci di portare l’utente a definire il giusto elemento sul
quale lavorare e la funzione ed il comportamento della soluzione almeno in termini di effetto fisico. I
database brevettuali sono stati usati come fonte per la raccolta di tali informazioni. Durante il Dottorato, ho
appreso tecniche e software prototipali, sviluppati dall’Università degli Studi di Bergamo, per espandere le
chiavi di ricerca basati su iponimi, iperonimi, meronimi e varianti lessicali. Li ho quindi testati su casi studio
industriali per comprendere come poter integrare il recupero delle informazioni all’interno della struttura
delle linee guida.
Durante la quinta attività, ho ricombinato tutti i risultati raggiunti all’interno di una piattaforma software che ho sviluppato. Essa raccoglie linee guida flessibili, capaci di adattarsi alle differenti tipologie di problemi, organizzate attraverso lo schema concettuale studiato durante la terza attività e integra le tecniche di recupero della conoscenza della quarta attività.
La piattaforma e le linee guida proposte sono state testate con casi studio industriali reali, proposti dalle aziende con le quali ho collaborato, come ABB e Tenacta-Imetec. I test hanno coinvolto studenti della laura magistrale e del dottorato, durante lavori di tesi, progetti d’anno e sessioni di gruppo con almeno 10 partecipanti ciascuna. I risultati raggiunti, comparati con Spark tradizionale e altri approcci, sono stati incoraggianti in termini di: identificazione della funzione, facilitando l’individuazione di zone e tempi operativi, di identificazione del problema, con l’accrescimento della consapevolezza relativa alla dinamica di accadimento e di generazione delle idee, con un maggior numero di soluzioni qualitativamente migliori identificate.
Parole chiave: Innovazione Sistematica, Linee guida Inventive per la soluzione inventiva dei problemi,
Computer Aided Innovation.
7
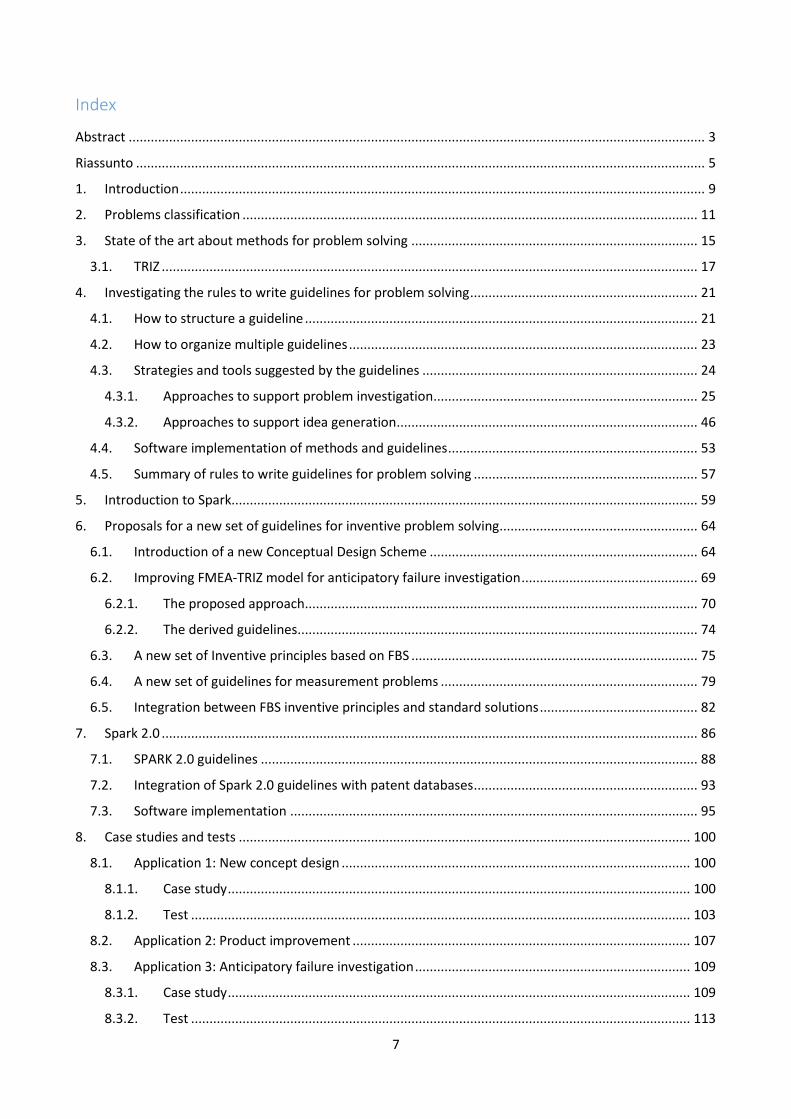
Index
Abstract ............................................................................................................................................................. 3
Riassunto ........................................................................................................................................................... 5
1. Introduction ............................................................................................................................................... 9
2. Problems classification ............................................................................................................................ 11
3. State of the art about methods for problem solving .............................................................................. 15
3.1. TRIZ .................................................................................................................................................. 17
4. Investigating the rules to write guidelines for problem solving .............................................................. 21
4.1. How to structure a guideline ........................................................................................................... 21
4.2. How to organize multiple guidelines ............................................................................................... 23
4.3. Strategies and tools suggested by the guidelines ........................................................................... 24
4.3.1. Approaches to support problem investigation ........................................................................ 25
4.3.2. Approaches to support idea generation .................................................................................. 46
4.4. Software implementation of methods and guidelines .................................................................... 53
4.5. Summary of rules to write guidelines for problem solving ............................................................. 57
5. Introduction to Spark............................................................................................................................... 59
6. Proposals for a new set of guidelines for inventive problem solving...................................................... 64
6.1. Introduction of a new Conceptual Design Scheme ......................................................................... 64
6.2. Improving FMEA-TRIZ model for anticipatory failure investigation ................................................ 69
6.2.1. The proposed approach ........................................................................................................... 70
6.2.2. The derived guidelines ............................................................................................................. 74
6.3. A new set of Inventive principles based on FBS .............................................................................. 75
6.4. A new set of guidelines for measurement problems ...................................................................... 79
6.5. Integration between FBS inventive principles and standard solutions ........................................... 82
7. Spark 2.0 .................................................................................................................................................. 86
7.1. SPARK 2.0 guidelines ....................................................................................................................... 88
7.2. Integration of Spark 2.0 guidelines with patent databases ............................................................. 93
7.3. Software implementation ............................................................................................................... 95
8. Case studies and tests ........................................................................................................................... 100
8.1. Application 1: New concept design ............................................................................................... 100
8.1.1. Case study .............................................................................................................................. 100
8.1.2. Test ........................................................................................................................................ 103
8.2. Application 2: Product improvement ............................................................................................ 107
8.3. Application 3: Anticipatory failure investigation ........................................................................... 109
8.3.1. Case study .............................................................................................................................. 109
8.3.2. Test ........................................................................................................................................ 113

8
8.4. Application 4: Idea generation in problems with contradiction ................................................... 118
8.5. Application 5: Idea generation for Measurement problems ......................................................... 121
8.6. Discussion of the results ................................................................................................................ 123
9. Conclusions ............................................................................................................................................ 125
9
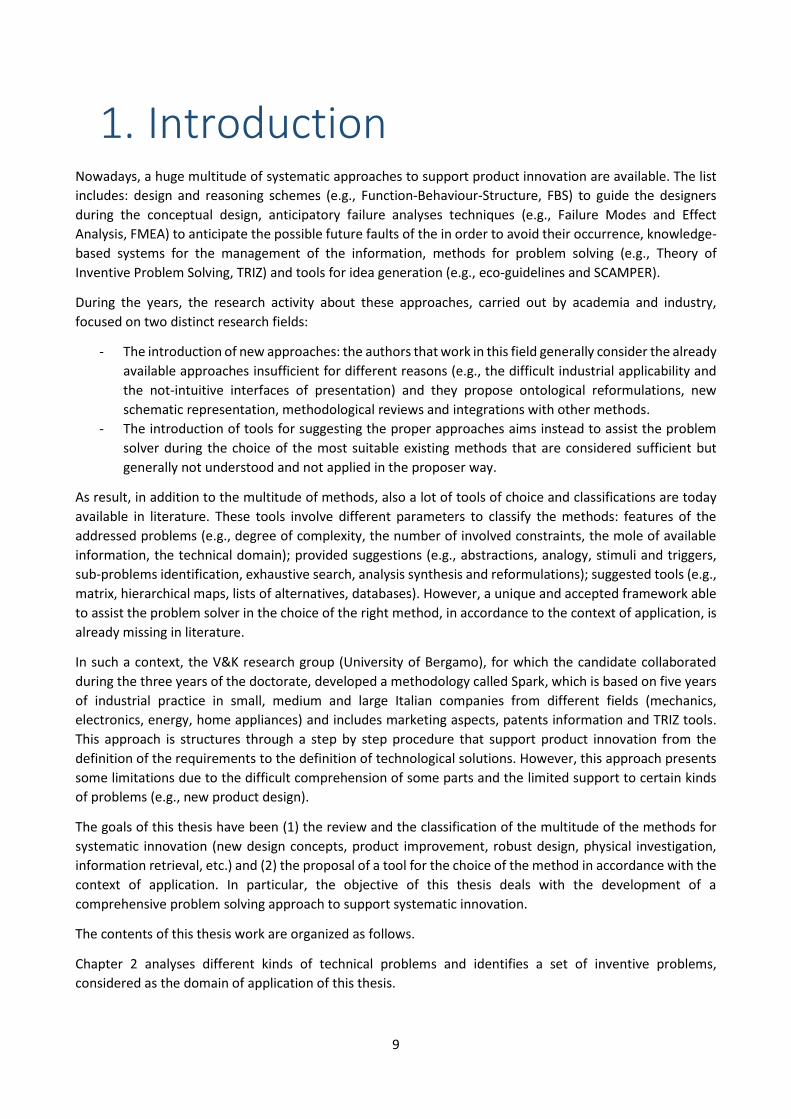
1. Introduction Nowadays, a huge multitude of systematic approaches to support product innovation are available. The list
includes: design and reasoning schemes (e.g., Function-Behaviour-Structure, FBS) to guide the designers
during the conceptual design, anticipatory failure analyses techniques (e.g., Failure Modes and Effect
Analysis, FMEA) to anticipate the possible future faults of the in order to avoid their occurrence, knowledge-
based systems for the management of the information, methods for problem solving (e.g., Theory of
Inventive Problem Solving, TRIZ) and tools for idea generation (e.g., eco-guidelines and SCAMPER).
During the years, the research activity about these approaches, carried out by academia and industry,
focused on two distinct research fields:
- The introduction of new approaches: the authors that work in this field generally consider the already
available approaches insufficient for different reasons (e.g., the difficult industrial applicability and
the not-intuitive interfaces of presentation) and they propose ontological reformulations, new
schematic representation, methodological reviews and integrations with other methods.
- The introduction of tools for suggesting the proper approaches aims instead to assist the problem
solver during the choice of the most suitable existing methods that are considered sufficient but
generally not understood and not applied in the proposer way.
As result, in addition to the multitude of methods, also a lot of tools of choice and classifications are today
available in literature. These tools involve different parameters to classify the methods: features of the
addressed problems (e.g., degree of complexity, the number of involved constraints, the mole of available
information, the technical domain); provided suggestions (e.g., abstractions, analogy, stimuli and triggers,
sub-problems identification, exhaustive search, analysis synthesis and reformulations); suggested tools (e.g.,
matrix, hierarchical maps, lists of alternatives, databases). However, a unique and accepted framework able
to assist the problem solver in the choice of the right method, in accordance to the context of application, is
already missing in literature.
In such a context, the V&K research group (University of Bergamo), for which the candidate collaborated
during the three years of the doctorate, developed a methodology called Spark, which is based on five years
of industrial practice in small, medium and large Italian companies from different fields (mechanics,
electronics, energy, home appliances) and includes marketing aspects, patents information and TRIZ tools.
This approach is structures through a step by step procedure that support product innovation from the
definition of the requirements to the definition of technological solutions. However, this approach presents
some limitations due to the difficult comprehension of some parts and the limited support to certain kinds
of problems (e.g., new product design).
The goals of this thesis have been (1) the review and the classification of the multitude of the methods for
systematic innovation (new design concepts, product improvement, robust design, physical investigation,
information retrieval, etc.) and (2) the proposal of a tool for the choice of the method in accordance with the
context of application. In particular, the objective of this thesis deals with the development of a
comprehensive problem solving approach to support systematic innovation.
The contents of this thesis work are organized as follows.
Chapter 2 analyses different kinds of technical problems and identifies a set of inventive problems,
considered as the domain of application of this thesis.

10
Chapter 3 presents the state of the art about the main strategies and methods for supporting problem
solving, with a focus on TRIZ.
Chapter 4 investigates the rules to write guidelines for problem solving, by presenting the features of the
structure of a single guideline (text, examples and graphical representation), the organisation of multiple
guidelines and the most popular strategies and tools suggested by the guidelines depending on the different
problems and the phases of problem solving. Then, the main advantages of software implementation for the
guidelines are discussed and, finally, a set of rules for writing guidelines, summarizing the identified features,
are proposed.
Chapter 5 introduces Spark methodology and its main advantages and limitations.
Chapter 6 proposes some integrations and revisions of Spark: A new Conceptual Design Scheme to support
the first steps of the methodology, the improvement of a FMEA-TRIZ model to support problem investigation
and a new set of inventive principles based on FBS and a new set of guidelines for measurement problems
to support idea generation.
Chapter 7 proposes a comprehensive approach, based on Spark and including the introduced models, and
the derived guidelines. The last part of the chapter presents an integration of the guidelines with patent
databases and a software implementation.
Chapter 8 summarizes the results of some applications of the guidelines in real industrial problem, through
case studies and tests. The first application deals with new concept design, the second one deals with product
improvement, the third one deals with anticipatory failure investigation, the fourth one application deals
with idea generation of problems with contradictions and the last one regards measurement problems.
Finally, the results are discussed.
Chapter 9 draws the conclusions and the future developments.
11
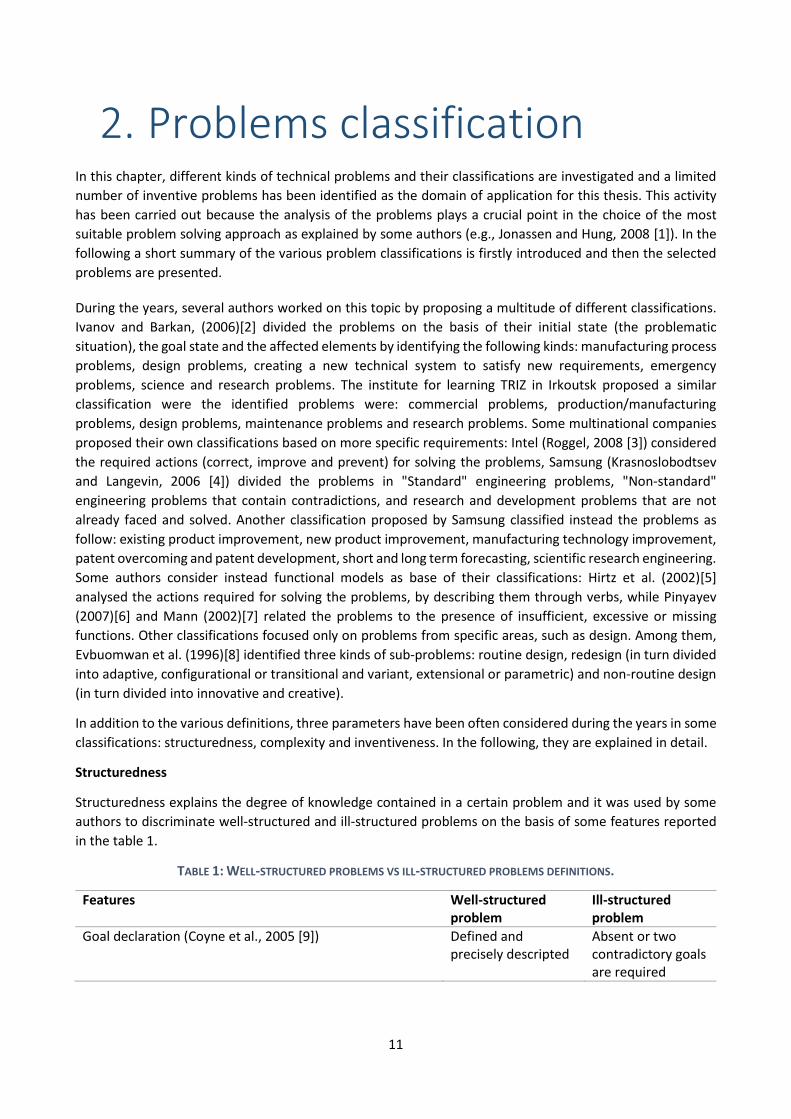
2. Problems classification In this chapter, different kinds of technical problems and their classifications are investigated and a limited
number of inventive problems has been identified as the domain of application for this thesis. This activity
has been carried out because the analysis of the problems plays a crucial point in the choice of the most
suitable problem solving approach as explained by some authors (e.g., Jonassen and Hung, 2008 [1]). In the
following a short summary of the various problem classifications is firstly introduced and then the selected
problems are presented.
During the years, several authors worked on this topic by proposing a multitude of different classifications.
Ivanov and Barkan, (2006)[2] divided the problems on the basis of their initial state (the problematic
situation), the goal state and the affected elements by identifying the following kinds: manufacturing process
problems, design problems, creating a new technical system to satisfy new requirements, emergency
problems, science and research problems. The institute for learning TRIZ in Irkoutsk proposed a similar
classification were the identified problems were: commercial problems, production/manufacturing
problems, design problems, maintenance problems and research problems. Some multinational companies
proposed their own classifications based on more specific requirements: Intel (Roggel, 2008 [3]) considered
the required actions (correct, improve and prevent) for solving the problems, Samsung (Krasnoslobodtsev
and Langevin, 2006 [4]) divided the problems in "Standard" engineering problems, "Non-standard"
engineering problems that contain contradictions, and research and development problems that are not
already faced and solved. Another classification proposed by Samsung classified instead the problems as
follow: existing product improvement, new product improvement, manufacturing technology improvement,
patent overcoming and patent development, short and long term forecasting, scientific research engineering.
Some authors consider instead functional models as base of their classifications: Hirtz et al. (2002)[5]
analysed the actions required for solving the problems, by describing them through verbs, while Pinyayev
(2007)[6] and Mann (2002)[7] related the problems to the presence of insufficient, excessive or missing
functions. Other classifications focused only on problems from specific areas, such as design. Among them,
Evbuomwan et al. (1996)[8] identified three kinds of sub-problems: routine design, redesign (in turn divided
into adaptive, configurational or transitional and variant, extensional or parametric) and non-routine design
(in turn divided into innovative and creative).
In addition to the various definitions, three parameters have been often considered during the years in some
classifications: structuredness, complexity and inventiveness. In the following, they are explained in detail.
Structuredness
Structuredness explains the degree of knowledge contained in a certain problem and it was used by some
authors to discriminate well-structured and ill-structured problems on the basis of some features reported
in the table 1.
TABLE 1: WELL-STRUCTURED PROBLEMS VS ILL-STRUCTURED PROBLEMS DEFINITIONS.
Features Well-structured problem
Ill-structured problem
Goal declaration (Coyne et al., 2005 [9]) Defined and precisely descripted
Absent or two contradictory goals are required
12
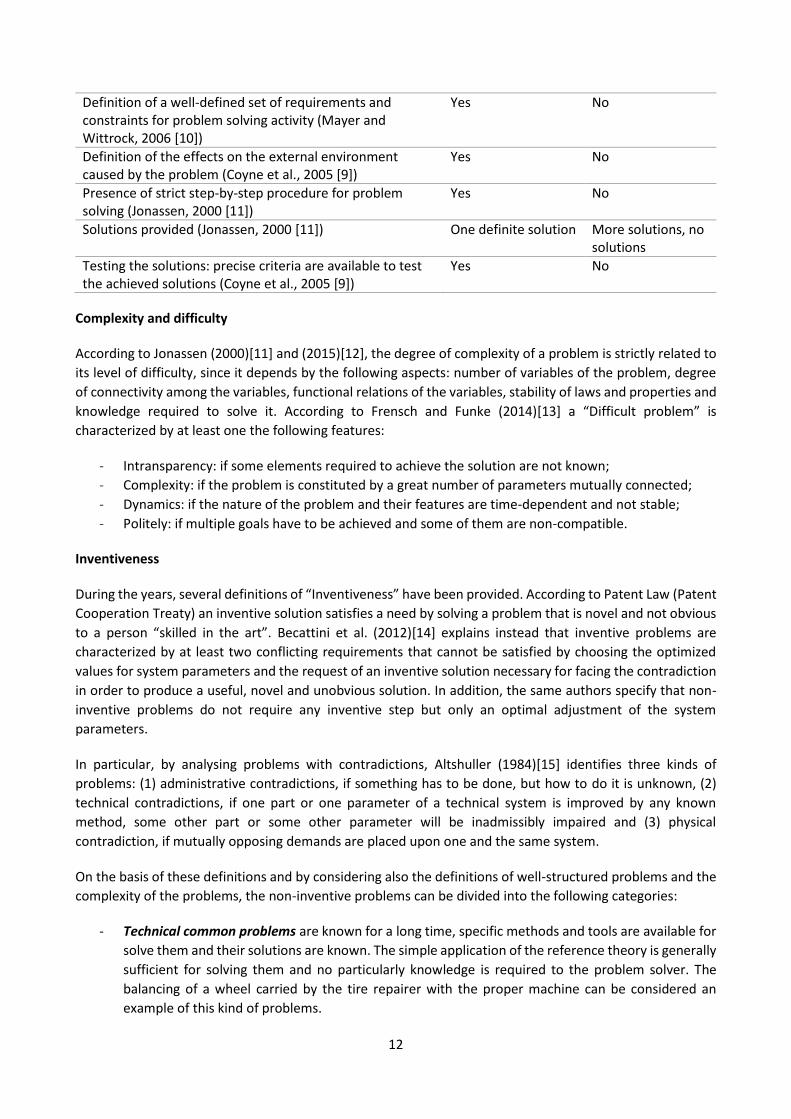
Definition of a well-defined set of requirements and constraints for problem solving activity (Mayer and Wittrock, 2006 [10])
Yes No
Definition of the effects on the external environment caused by the problem (Coyne et al., 2005 [9])
Yes No
Presence of strict step-by-step procedure for problem solving (Jonassen, 2000 [11])
Yes No
Solutions provided (Jonassen, 2000 [11]) One definite solution More solutions, no solutions
Testing the solutions: precise criteria are available to test the achieved solutions (Coyne et al., 2005 [9])
Yes No
Complexity and difficulty
According to Jonassen (2000)[11] and (2015)[12], the degree of complexity of a problem is strictly related to
its level of difficulty, since it depends by the following aspects: number of variables of the problem, degree
of connectivity among the variables, functional relations of the variables, stability of laws and properties and
knowledge required to solve it. According to Frensch and Funke (2014)[13] a “Difficult problem” is
characterized by at least one the following features:
- Intransparency: if some elements required to achieve the solution are not known;
- Complexity: if the problem is constituted by a great number of parameters mutually connected;
- Dynamics: if the nature of the problem and their features are time-dependent and not stable;
- Politely: if multiple goals have to be achieved and some of them are non-compatible.
Inventiveness
During the years, several definitions of “Inventiveness” have been provided. According to Patent Law (Patent
Cooperation Treaty) an inventive solution satisfies a need by solving a problem that is novel and not obvious
to a person “skilled in the art”. Becattini et al. (2012)[14] explains instead that inventive problems are
characterized by at least two conflicting requirements that cannot be satisfied by choosing the optimized
values for system parameters and the request of an inventive solution necessary for facing the contradiction
in order to produce a useful, novel and unobvious solution. In addition, the same authors specify that non-
inventive problems do not require any inventive step but only an optimal adjustment of the system
parameters.
In particular, by analysing problems with contradictions, Altshuller (1984)[15] identifies three kinds of
problems: (1) administrative contradictions, if something has to be done, but how to do it is unknown, (2)
technical contradictions, if one part or one parameter of a technical system is improved by any known
method, some other part or some other parameter will be inadmissibly impaired and (3) physical
contradiction, if mutually opposing demands are placed upon one and the same system.
On the basis of these definitions and by considering also the definitions of well-structured problems and the
complexity of the problems, the non-inventive problems can be divided into the following categories:
- Technical common problems are known for a long time, specific methods and tools are available for
solve them and their solutions are known. The simple application of the reference theory is generally
sufficient for solving them and no particularly knowledge is required to the problem solver. The
balancing of a wheel carried by the tire repairer with the proper machine can be considered an
example of this kind of problems.
13
- Technical complex problems require the application of specific algorithms (i.e., FE analysis) and
theories. The solutions are generally not noted and they are iteratively achieved through
optimisation.
- Industrial design problems are characterized by low complexity (only few constraints are generally
required and contradictions between the requirements are not present), are not previously solved
and are not without supporting by structured methods. Designer’s creativity and experience are
required to solve them.
- Inventive problems share some similarities with technical complex problems (the complexity of the
problem, the number of requirements) and with industrial design problems (the lack of supporting
approaches). Among the identified problems, the inventive ones have been considered as the
reference domain of this thesis and they have further been divided into the following categories
according to Jonassen (2000)[11]:
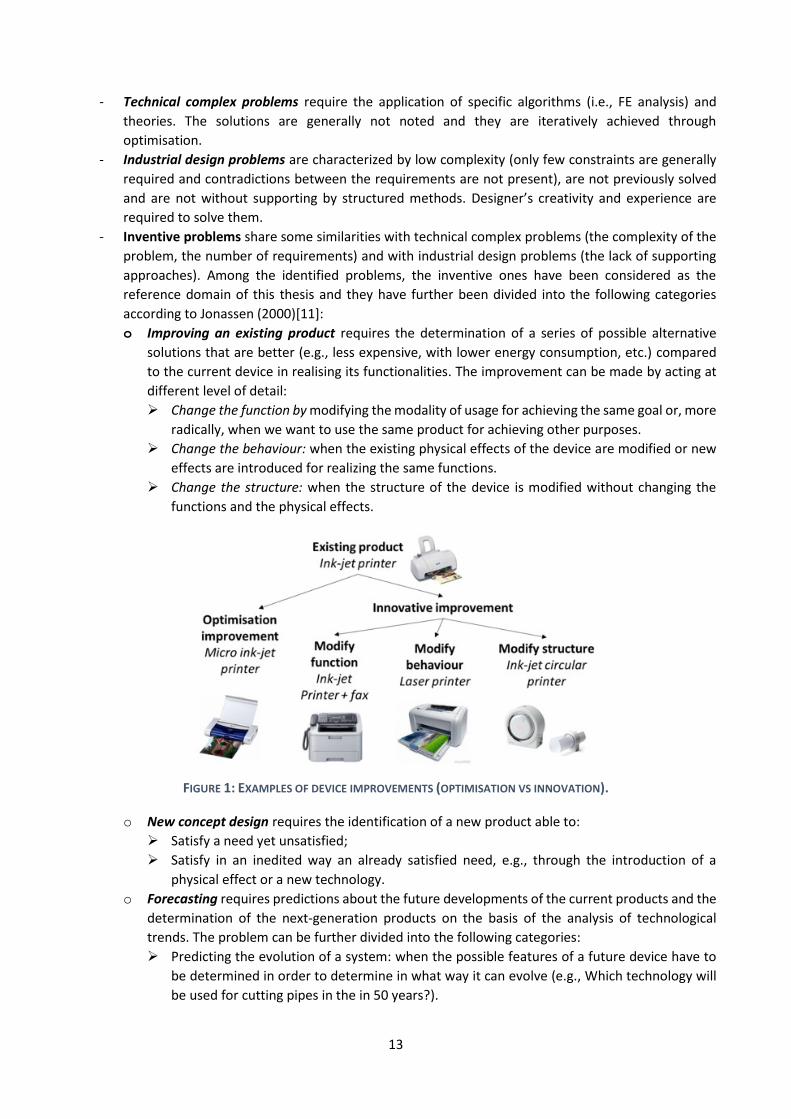
o Improving an existing product requires the determination of a series of possible alternative
solutions that are better (e.g., less expensive, with lower energy consumption, etc.) compared
to the current device in realising its functionalities. The improvement can be made by acting at
different level of detail:
Change the function by modifying the modality of usage for achieving the same goal or, more
radically, when we want to use the same product for achieving other purposes.
Change the behaviour: when the existing physical effects of the device are modified or new
effects are introduced for realizing the same functions.
Change the structure: when the structure of the device is modified without changing the
functions and the physical effects.
FIGURE 1: EXAMPLES OF DEVICE IMPROVEMENTS (OPTIMISATION VS INNOVATION).
o New concept design requires the identification of a new product able to:
Satisfy a need yet unsatisfied;
Satisfy in an inedited way an already satisfied need, e.g., through the introduction of a
physical effect or a new technology.
o Forecasting requires predictions about the future developments of the current products and the
determination of the next-generation products on the basis of the analysis of technological
trends. The problem can be further divided into the following categories:
Predicting the evolution of a system: when the possible features of a future device have to
be determined in order to determine in what way it can evolve (e.g., Which technology will
be used for cutting pipes in the in 50 years?).

14
Finding possible future applications for a system: when the problem regards the research of
possible future applications of a current product (duly improved), generally not achievable
at the present situation, i.e. could laser be used for cooling food?
Predicting new needs: differently to new product design, in this case we want to predict the
future needs of the next generation products (e.g., Glasses for augmented reality).
- Anticipatory failure investigation requires the prediction of possible undesired unknown effects and
unknown causes that can occur in a device and its improvement to avoid them.
- Eliminate undesired effect requires the elimination of a manifested undesired effect, e.g., the
overheating of an electrical component, which is considered dangerous for the user, the
environment or the device itself.
15
3. State of the art about methods for problem solving
In literature, several definitions about problem solving have been provided during the years, and more in
particular about technical and inventive problem solving. The definitions involve several key factors, such as
the addressed problems, the context of application, the problem solvers’ backgrounds, etc. According to
Mayer and Wittrock (2006)[10], problem solving is “A cognitive processing directed at achieving a goal when
no solution method is obvious to the problem solver”, Lynch (2000)[16] defines instead problem solving as
"The practical application of reasoning and other types of skills in a process that involves the identification
and use of relevant information". Others authors specifically link problem solving to design: e.g., Hatchuel
(2003)[17] explains that problem solving theory is a special and restricted case of Design theory.
Other authors identified a general step by step procedure for problem solving. One of the most accepted
definition, proposed by D’Zurilla and Goldfried (1971)[18] and reviewed by Chang et al. (2004)[19], is
constituted by 4 main steps that require different problem solver skills:
- Problem definition and formulation. During these phases, the problem solver analyses and
comprehends the problem by gathering specific information about it, by identifying demands and
obstacles and by setting realistic problem-solving goals (e.g., by changing the situation for the better,
accepting the situation and minimizing emotional distress).
- Generation of alternative solutions. During this phase, the problem solver focuses on the problem-
solving goals and she/he identifies all the potential solutions, including both conventional and non-
conventional ones.
- Decision making. During this phase, the problem solver evaluates the potential solutions by
hypothesizing the possible negative effects of each one and by choosing the “best” or potentially
most effective solution.
- Solution. During this phase, the problem solver implements the chosen solution by considering all
the arising issues.
Although this approach is very general and related to generic problem solving (e.g., social problem solving),
it can be taken as reference also for technical problem solving (e.g., optimisation) and in particular for
inventive problem solving to support systematic innovation (e.g., designing new products, introducing new
functionalities and physical effects, using the existing products in an unusual way, etc.), since constitutes the
basis for the supporting methods. In the rest of the chapter some problem solving approaches and methods
are presented with a focus on those supporting inventive problem solving such as TRIZ, which is one of the
most diffused especially in industrial contexts.
During the years, several definitions about problem solving methods have been provided in literature.
According to Clancey (1985)[20], a problem solving method describes the reasoning to reach a goal in terms
of a series of actions that required knowledge, which can be divided into two categories: domain knowledge
and generic knowledge. The first one is directly linked to the domain of application of the problem, while the
second one provides the methodological knowledge for supporting the application of the methods in
different context of applications and it typically works with a higher level of detail. According to Benjamins
et al. (1996)[21], a problem solving methods is instead a series of abstract actions related to domain
knowledge and to the goals of the problem by a series of assumptions, which are made by the problem solver.
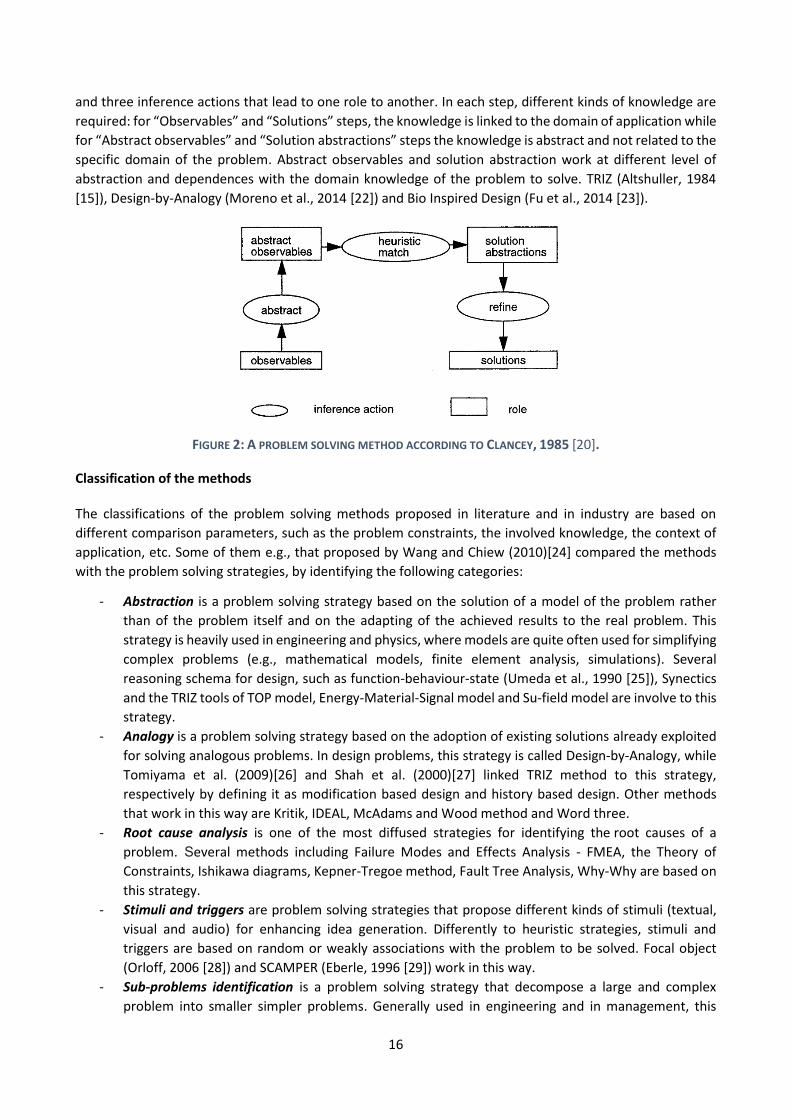
Clancey (1985)[20] defines a problem solving method as the sequence of four steps (called knowledge roles)
16
and three inference actions that lead to one role to another. In each step, different kinds of knowledge are
required: for “Observables” and “Solutions” steps, the knowledge is linked to the domain of application while
for “Abstract observables” and “Solution abstractions” steps the knowledge is abstract and not related to the
specific domain of the problem. Abstract observables and solution abstraction work at different level of
abstraction and dependences with the domain knowledge of the problem to solve. TRIZ (Altshuller, 1984
[15]), Design-by-Analogy (Moreno et al., 2014 [22]) and Bio Inspired Design (Fu et al., 2014 [23]).
FIGURE 2: A PROBLEM SOLVING METHOD ACCORDING TO CLANCEY, 1985 [20].
Classification of the methods
The classifications of the problem solving methods proposed in literature and in industry are based on
different comparison parameters, such as the problem constraints, the involved knowledge, the context of
application, etc. Some of them e.g., that proposed by Wang and Chiew (2010)[24] compared the methods
with the problem solving strategies, by identifying the following categories:
- Abstraction is a problem solving strategy based on the solution of a model of the problem rather
than of the problem itself and on the adapting of the achieved results to the real problem. This
strategy is heavily used in engineering and physics, where models are quite often used for simplifying
complex problems (e.g., mathematical models, finite element analysis, simulations). Several
reasoning schema for design, such as function-behaviour-state (Umeda et al., 1990 [25]), Synectics
and the TRIZ tools of TOP model, Energy-Material-Signal model and Su-field model are involve to this
strategy.
- Analogy is a problem solving strategy based on the adoption of existing solutions already exploited
for solving analogous problems. In design problems, this strategy is called Design-by-Analogy, while
Tomiyama et al. (2009)[26] and Shah et al. (2000)[27] linked TRIZ method to this strategy,
respectively by defining it as modification based design and history based design. Other methods
that work in this way are Kritik, IDEAL, McAdams and Wood method and Word three.
- Root cause analysis is one of the most diffused strategies for identifying the root causes of a
problem. Several methods including Failure Modes and Effects Analysis - FMEA, the Theory of
Constraints, Ishikawa diagrams, Kepner-Tregoe method, Fault Tree Analysis, Why-Why are based on
this strategy.
- Stimuli and triggers are problem solving strategies that propose different kinds of stimuli (textual,
visual and audio) for enhancing idea generation. Differently to heuristic strategies, stimuli and
triggers are based on random or weakly associations with the problem to be solved. Focal object
(Orloff, 2006 [28]) and SCAMPER (Eberle, 1996 [29]) work in this way.
- Sub-problems identification is a problem solving strategy that decompose a large and complex
problem into smaller simpler problems. Generally used in engineering and in management, this
17
strategy is also particularly common in design strategies based on functional decomposition, e.g.,
SAPB (Pahl and Beitz (1977)[30]).
- Lateral thinking is a problem solving strategy based on the research of new points of views of the
problems for raising new questions and new possibilities. STC (size-time-cost) (Fey and Rivin, 2005
[31]) is a TRIZ tool based on this strategy, which suggest to exaggerate or minimize the resources of
the technical system.
- Exhaustive search is a problem solving strategy based on the systematic search of all the possible
solutions. It can be supported by brainstorming and techniques for information retrieval, such as
Functional Behaviour Oriented Search (FBOS) (Montecchi and Russo, 2015 [32]) and Knowledge
Organizing Module (KOM) (Russo et al., 2012 [33]).
- Analysis, synthesis and reformulations are problem solving strategies that reduce a given problem
to a known category and they suggest how to find a particular solution for it. ARIZ (Altshuller, 1985
[34]) is one of the most TRIZ tools, which works in this way for solving technical problems.
Other classifications (e.g., Porter (2010)[35]) of the methods can be more extensive and they classify the
methods into families on the basis of the implemented specific approaches and tools (e.g. statistical analyses,
matrices, road- mapping, trend analysis, expert opinions, scenarios analysis, etc.).
3.1. TRIZ
Among the multitude of methods to support technical problem solving, TRIZ (Theory of Inventive Problem
Solving) is one of the most known, used and appreciated, especially in the companies. The theory has been
developed by Altshuller since the second half of the forties, through the determination of a common
resolutive path for supporting problem solving, identified in a large number of patents. The first official
publication about TRIZ dates back to 1956 (Altshuller and Shapiro, 1956), in which the authors outlined some
of the most well-known tools (technical contradictions, ideality, multiscreen and inventive principles) that
constitute the theory. Over the years, the existing tools have been reviewed and new tools have been
introduced. Among them, the introduction of the formalisation for physical contradictions (Zlotin et al., 1977)
represented a turning point in the method, by considerably improving its usefulness. Recent developments
of the methodology include various re-updating of the contradiction matrix (Mann, 2003 [36]) and OTSM-
TRIZ (Cavallucci and Khomenko, 2006 [37]).
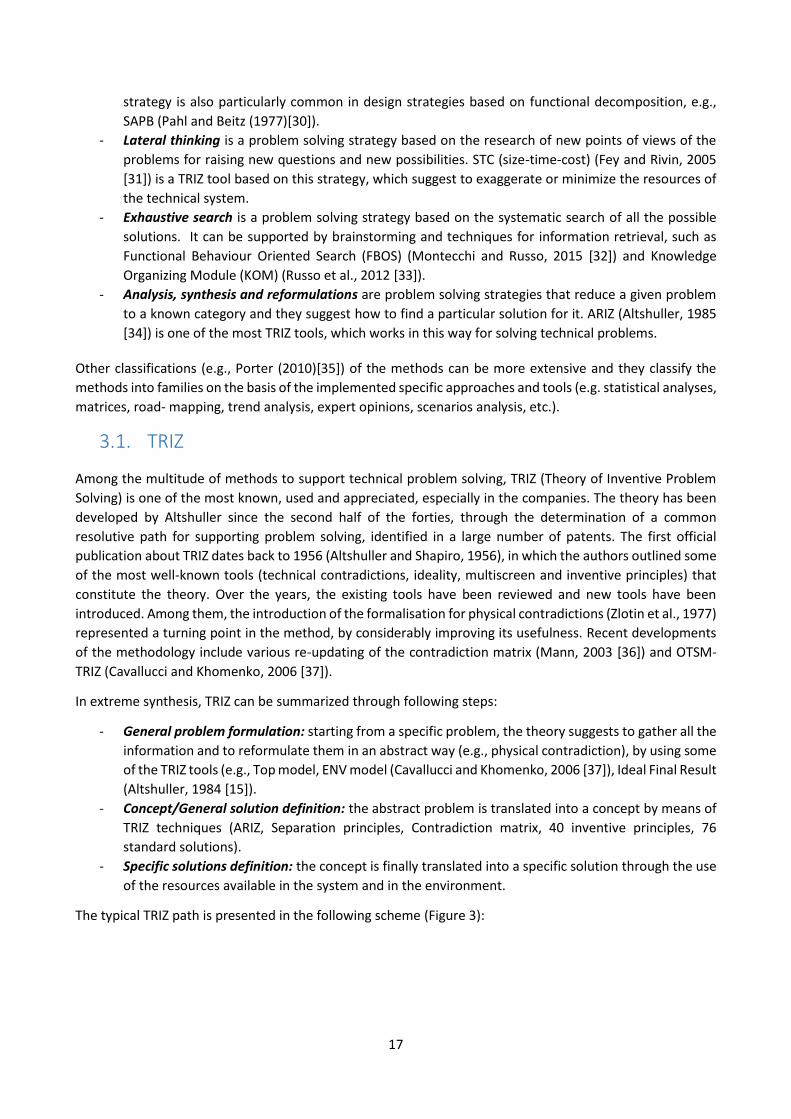
In extreme synthesis, TRIZ can be summarized through following steps:
- General problem formulation: starting from a specific problem, the theory suggests to gather all the
information and to reformulate them in an abstract way (e.g., physical contradiction), by using some
of the TRIZ tools (e.g., Top model, ENV model (Cavallucci and Khomenko, 2006 [37]), Ideal Final Result
(Altshuller, 1984 [15]).
- Concept/General solution definition: the abstract problem is translated into a concept by means of
TRIZ techniques (ARIZ, Separation principles, Contradiction matrix, 40 inventive principles, 76
standard solutions).
- Specific solutions definition: the concept is finally translated into a specific solution through the use
of the resources available in the system and in the environment.
The typical TRIZ path is presented in the following scheme (Figure 3):
18
FIGURE 3: TRIZ SCHEME.
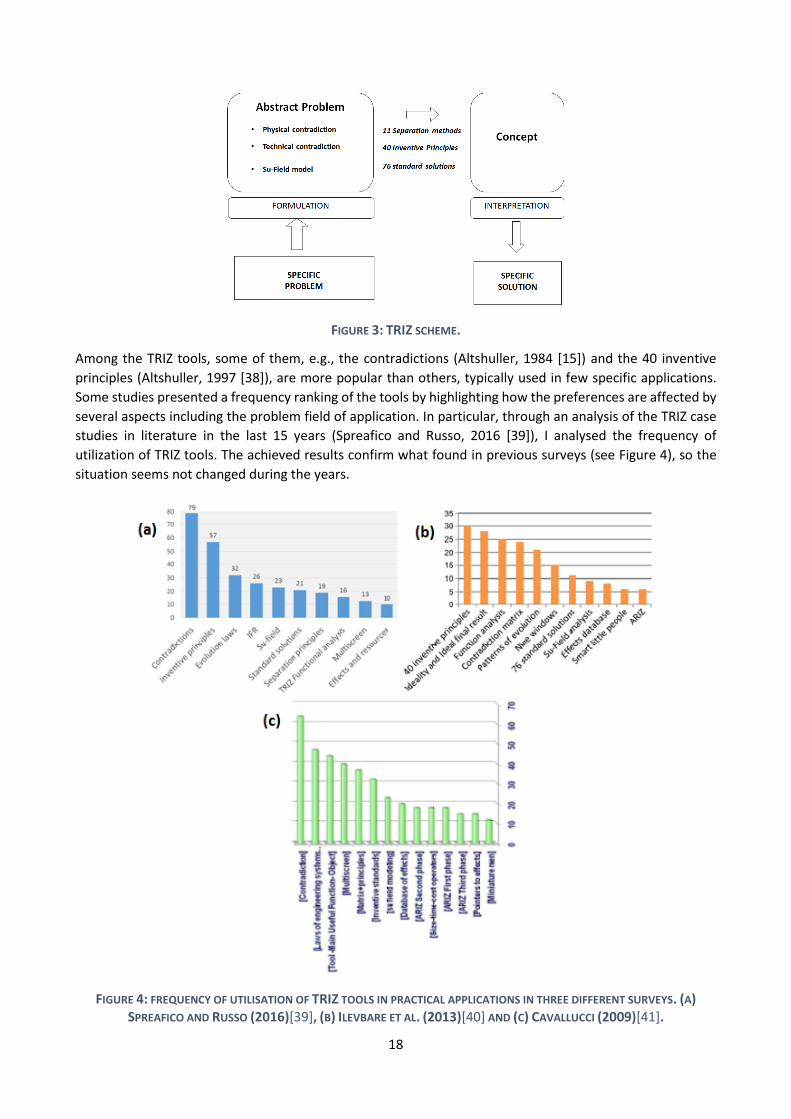
Among the TRIZ tools, some of them, e.g., the contradictions (Altshuller, 1984 [15]) and the 40 inventive
principles (Altshuller, 1997 [38]), are more popular than others, typically used in few specific applications.
Some studies presented a frequency ranking of the tools by highlighting how the preferences are affected by
several aspects including the problem field of application. In particular, through an analysis of the TRIZ case
studies in literature in the last 15 years (Spreafico and Russo, 2016 [39]), I analysed the frequency of
utilization of TRIZ tools. The achieved results confirm what found in previous surveys (see Figure 4), so the
situation seems not changed during the years.
FIGURE 4: FREQUENCY OF UTILISATION OF TRIZ TOOLS IN PRACTICAL APPLICATIONS IN THREE DIFFERENT SURVEYS. (A)
SPREAFICO AND RUSSO (2016)[39], (B) ILEVBARE ET AL. (2013)[40] AND (C) CAVALLUCCI (2009)[41].

19
Among the different TRIZ contexts of application, the following categories have been identified in Spreafico
and Russo, (2016)[39]:
- Early design: TRIZ is used for conceptual design, in order to identify alternative physical effects or
define the behaviour of a potential solution. Several examples show TRIZ integrated with Pahl and
Beitz approach and FBS Function Behaviour Structure theory.
- Optimization and Robust design: TRIZ is used to support optimization stage during design, FEM
analysis, and robust design.
- Decision making and Forecasting: TRIZ can lead a different prospective highlighting new business
opportunities and forecasting.
- Eco-design: TRIZ is used in an eco-design approach, especially to solve contradictions that emerged
from the application of a partial solution.
- Design for X: TRIZ is used for improving product manufacturing, assembly and maintenance or for
improving risk management models.
Figure 5 shows the absolute frequency of utilization of TRIZ in the different identified problem solving
activities.
FIGURE 5: NUMBER OF CASE STUDIES DESCRIBING IDEAS, CONCEPTS OR FINAL PRODUCTS DESIGNED BY USING TRIZ
(SPREAFICO AND RUSSO, 2016 [39]).
TRIZ improvements
Despite the multitude of successful applications of TRIZ in industrial and academic applications, some limits
and shortcoming have been identified and several improvements have been proposed. Among them, some
authors and companies directly modified the methodology, while others integrated TRIZ with other methods
and tools. In the following, the most popular improvements are summarized:
- Unified Structured Inventive Thinking (USIT): Developed on the basis of SIT (Systematic Inventive
Thinking), an extreme simplification of TRIZ that drastically reduced the number of the inventive
principles, USIT (Sickafus, 1997)[42] was developed in Ford Motor Company starting from 1995, with
the aim to simplify TRIZ theory and facilitate its industrial application. Nakagawa (2000)[43]
summarized USIT as follow:
o The theory aims to be applied to real practical problems for rapidly generating multiple
conceptual solutions. Differently to TRIZ that does not put emphasis on amazing inventions.
o USIT provides a clearly defined simple procedure for applying the methodology, divided into
three steps: Problem Definition, Problem Analysis, and Solution Generation.
o Elements of techniques in USIT are simple and well explained in guidelines.
o No outside knowledge bases and software tools are used in USIT.
o Engineering details, such as specifications, figures, numbers, costs, deadlines, etc., are put aside
the consideration during the USIT procedure.

20
- OTSM-TRIZ: Developed by Cavallucci and Khomenko (2006)[37], OTSM-TRIZ aims to improve the TRIZ
ability in solving complex problems through the introduction and the modification of some TRIZ tools,
such as the Contradiction Network, a tool for solving a system of multiple contradictions where the
parameters are mutually interdepended.
- Advanced Systematic Inventive Thinking (ASIT): Introduced by Horowitz (2001)[44], ASIT simplifies
TRIZ by improving the concept of ideality the solution of the contradictions and the inventive
principles, while it eliminated other TRIZ tools.
- TRIZ integrations: A lot of authors combined TRIZ with other methods and tools for better supporting
some specific tasks, especially those less supported by traditional TRIZ tools, such as the
management of the requirements with the integration of the Quality Function Deployment, the
function analysis with Energy Material Signal model and the decision making through the integration
with Fuzzy logic and the principles of the Value engineering.
21
4. Investigating the rules to write guidelines for problem solving
During the years, a lot of guidelines for problem solving have been proposed in literature and several studies
to investigate their efficacy have been presented. On the basis of this material and through empirical
evidences collected during industrial collaborations and tests with students, I identified the main features of
the guidelines or the most suitable structures, organisations, suggested strategies and tools and software
interfaces in relation to the application context. The results have then been summarized in a concise
framework. In the following they are presented in detail.
4.1. How to structure a guideline
In this chapter, the main elements constituting a guideline (structure of the content, texts, examples, images)
are analysed in relation to the methodological content provided, the addressed problem, the context of
application and the user.
Structure of the content
Among the several possibilities for organising the content of a guideline (e.g., Jonassen, 2000 [11] and
Anderson, 2009 [45]), the approach proposed by Russo and Duci (2014)[46] has been taken as a reference
for its simplicity and concision in describing the main parts in relation to the main aspects of problem solving
activities. According to the authors, (well-written) guidelines are constituted by the following 5 parts:
- Description of problem type (Main goal): The first part of the guidelines suggests the problem to be
faced by providing the information about the initial state of the problem (e.g., “Presence of a harmful
action”), or the description of the present situation that the guideline wants to change, and the goal
of the guideline (e.g., “Reduce the harmful action”), or in what manner the guideline can change the
initial situation.
- Description of the sub-goal: This description clarifies the declared main goal, by explaining, the
conceptual solutions that the guideline can lead to. If the guidelines are a lot, the selection of the
proper one can be based on the information provided by the declared goal and sub-goal.
- Generic suggestion: This is the part of the guideline that explains how to manipulate the current
state for achieving the declared goal and sub-goal. Differently to the sub-goal, the suggestion works
with a more practical and operative point of view and they provide strategies and suggestions for
achieving the considered goal and sub-goal.
- Specific suggestion: provide more detailed information about the modalities to exploit the generic
suggestions, by suggesting a list of materials, the physical effects or the operative zone. For instance,
if the generic suggestion is “Modify a substance”, the specific suggestions can be “Make the
substance flexible” or “Change the shape of the substance”. Russo and Duci (2015)[47] proposes a
set of guidelines were generic and specific suggestions are clearly defined and for each generic
suggestion, more specific suggestions can be considered. Often, some guidelines merge the two,
without providing a clear distinction: e.g., see the guidelines proposed by Russo et al., 2011 [48].
22
- Examples: present the possible solution for the considered guideline, derived from its application in
other problems.
Text
Several authors analysed the textual information provided by the guidelines by focusing attention on some
features such as the used lexicon, the length of the text, the choice of the functional verbs. On the basis of
them, two opposites kinds of guidelines have been identified:
- Textual stimuli and triggers: are characterized by a synthetic textual form, often limited to one word,
and they consist in random associations of suggestions, generally weakly related or not related to
the context of application of the problem and they aim to be used as source of inspiration. Some
authors (e.g., Goldschmidt and Sever, 2011 [49]) highlighted their positive effects in supporting idea
generation, especially in design problems, others (e.g., Chiu and Shu (2012)[50]) explained the
influence of suitable verbs to increment the user’s creativity.
- Structured textual guidelines: are instead characterized by a wider descriptive content and they are
more precise in explaining the strategies, the involved elements, the examples and their role during
problem solving activity.
Graphical representation
In addition or in substitution to the text, some guidelines also provide graphical representations, such as
images, photos, icons, which can be, as the text, dependent or independent from the domain of application
of the problem. In the following the main advantages of the most diffused representations are presented.
- Random images: are generally used as stimuli to enhance idea generation, with good results in some
cases from literature. Goldschmidt and Sever (2011)[49] empirically demonstrated their positive
effects on problem solves’ creativity during design problems. Van der Lugt (2005)[51] experimented
instead positive influences during brainstorming. Sarkar and Chakrabarti (2008)[52] tested instead
the goodness of images for common problem solving activities, especially during the first stages of
conceptual design and in well-defined problems.
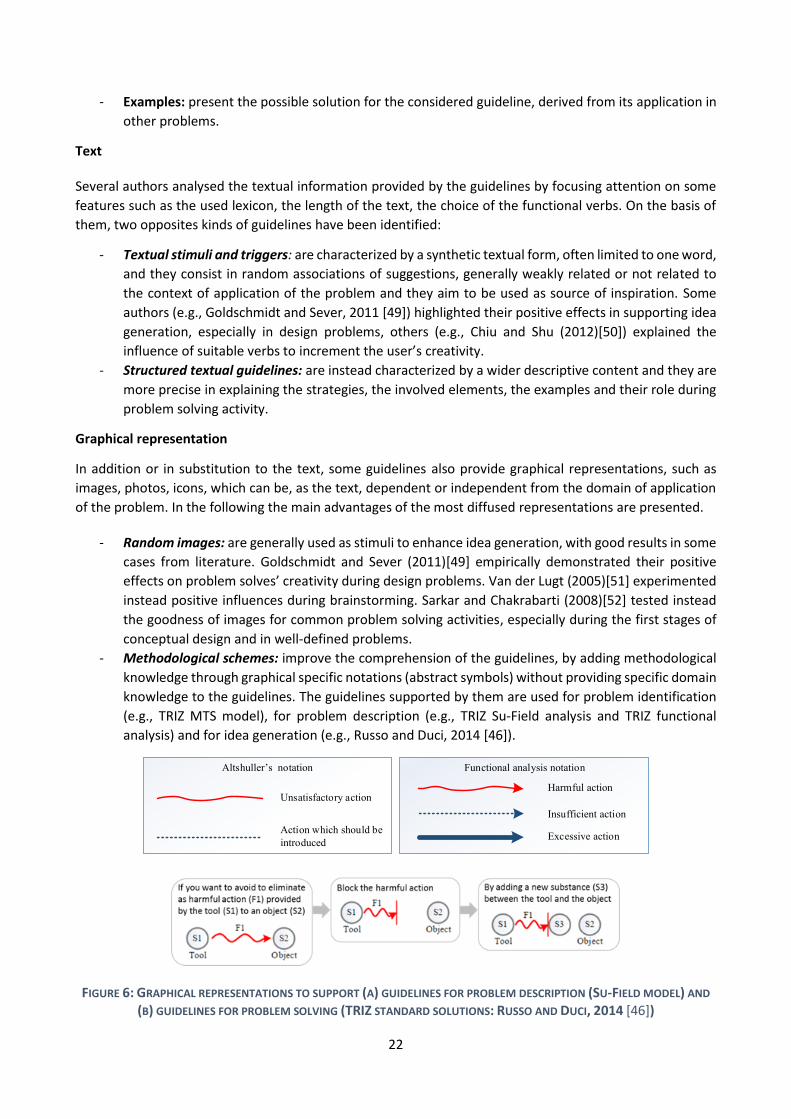
- Methodological schemes: improve the comprehension of the guidelines, by adding methodological
knowledge through graphical specific notations (abstract symbols) without providing specific domain
knowledge to the guidelines. The guidelines supported by them are used for problem identification
(e.g., TRIZ MTS model), for problem description (e.g., TRIZ Su-Field analysis and TRIZ functional
analysis) and for idea generation (e.g., Russo and Duci, 2014 [46]).
FIGURE 6: GRAPHICAL REPRESENTATIONS TO SUPPORT (A) GUIDELINES FOR PROBLEM DESCRIPTION (SU-FIELD MODEL) AND
(B) GUIDELINES FOR PROBLEM SOLVING (TRIZ STANDARD SOLUTIONS: RUSSO AND DUCI, 2014 [46])
Altshuller s notation Functional analysis notation
Unsatisfactory action
Action which should be
introduced
Harmful action
Insufficient action
Excessive action
23
- Specific images related to the domain of application: are used to better contextualize the guidelines
to the problem, by providing domain knowledge in addition or in substitution to the text. This
approach is particularly useful especially when the addressed problem is too specific and well-
defined, and if the space of the solutions is reduced.
Provided examples
On the basis of what found in literature, two kinds of examples have been identified, which aim to achieve
two specific objectives:
- Improving the comprehension of the guidelines: and in particular of their methodological content,
also for novice users, by showing how the guidelines have been previously applied in different
domains of application.
- Improving the application of the guidelines to solve specific domain problems: the examples
provided in these cases are generally more specific and they come from the same domain of
application of the faced problem. The numerous examples provided to TRIZ 40 inventive principles
(available on TRIZ journal, www.triz-journal.com) help the problem solver in apply them in specific
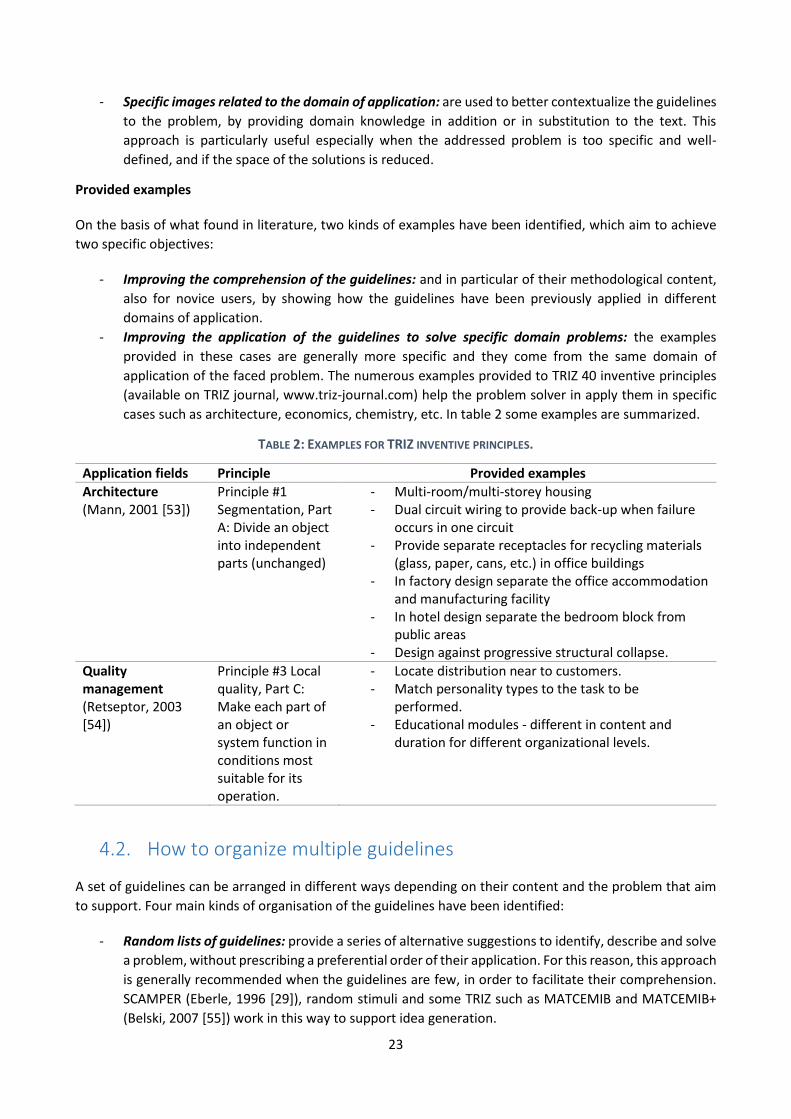
cases such as architecture, economics, chemistry, etc. In table 2 some examples are summarized.
TABLE 2: EXAMPLES FOR TRIZ INVENTIVE PRINCIPLES.
Application fields Principle Provided examples
Architecture (Mann, 2001 [53])
Principle #1 Segmentation, Part A: Divide an object into independent parts (unchanged)
- Multi-room/multi-storey housing - Dual circuit wiring to provide back-up when failure
occurs in one circuit - Provide separate receptacles for recycling materials
(glass, paper, cans, etc.) in office buildings - In factory design separate the office accommodation
and manufacturing facility - In hotel design separate the bedroom block from
public areas - Design against progressive structural collapse.
Quality management (Retseptor, 2003 [54])
Principle #3 Local quality, Part C: Make each part of an object or system function in conditions most suitable for its operation.
- Locate distribution near to customers. - Match personality types to the task to be
performed. - Educational modules - different in content and
duration for different organizational levels.
4.2. How to organize multiple guidelines
A set of guidelines can be arranged in different ways depending on their content and the problem that aim
to support. Four main kinds of organisation of the guidelines have been identified:
- Random lists of guidelines: provide a series of alternative suggestions to identify, describe and solve
a problem, without prescribing a preferential order of their application. For this reason, this approach
is generally recommended when the guidelines are few, in order to facilitate their comprehension.
SCAMPER (Eberle, 1996 [29]), random stimuli and some TRIZ such as MATCEMIB and MATCEMIB+
(Belski, 2007 [55]) work in this way to support idea generation.
24
- Ordered list of guidelines is instead generally used to present a strict procedure sequentially applied,
where each guideline can be applied after the previous ones, on the basis of their suggestions. The
guidelines contained in ARIZ methodology (Altshuller, 1985 [34]) are organized in this way.
- Hierarchical maps of guidelines are schematic representations where the relations between the
guidelines are constituted by one father with two or more sons. This organisation can be considered
as the combination of random list and ordered list of guidelines. In this case a guideline can suggest
other sub-guideline, typically more specific, and so on. The guidelines for eco-design (e.g.,
ECODESIGN online PILOT (www.ecodesign.at), Life-Cycle Design Strategy Wheel (LiDS) (Brezet and
Van Hemel, 1997 [56]), Eco-map (Russo et al, 2011 [48]) are generally organised in this way, by
providing various alternative suggestions (e.g., Reducing the raw material, reducing the packaging)
to refine more abstract guidelines (e.g., Reducing the product impact during manufacturing). In order
to be organized in this way, the guidelines have to be ascribable to precise categories.
- Matrices are generally used to organize the guidelines that depend on a combination of two or more
categories. TRIZ matrix (Altshuller, 1985 [34]) is an example of this kind of organization: in this case,
the problem solver selects two parameters in contradictions to improve among a list of 39 and the
matrix provides one or more guidelines (among the set of TRIZ 40 Inventive principles) for solving
the contradiction.
No one of the 4 organisational models of the guidelines is better than others, their choice depends by
multiple factors such as the kinds of problem, the context of application, the phase in problem solving
activity, etc. In the following chapter, different organisational models have been compared in relation to the
suggested strategies and tools by the guidelines and the faced problems.
4.3. Strategies and tools suggested by the guidelines
With the aim to investigate the most suitable strategies and tools suggested by the guidelines according to
the addressed problem, the context of application and the phase in problem solving activity, a literature
survey based on industrial case studies about inventive problem solving has been carried out as first
screening.
During the analysis, for each case study, the used approaches have been compared to the problem addressed
by the case study and to the phase during the problem solving activity. E.g., a certain author used
brainstorming (approach) to identify the limits (phase) of an already existing product that has to be improved
(problem). The considered problems are those selected in chapter 2, while the considered phases are
“Problem investigation” (i.e. Problem definition and formulation) and “Idea generation” (i.e., Generation of
alternative solutions) according to Chang et al. (2004)[19], which explain that the first one is responsible of
the identification of the problem and its reformulation in a more suitable way to be solved, while the second
one regards the research of the possible solutions to the problem.
In the following, the poll of paper is firstly introduced and then the identified approaches are presented in
relation to the considered phases. The most popular ones, based on the frequency of use, have then been
further investigated through dedicated surveys in order to highlight their main advantages and limitations.
Selected documents
During the analysis, 218 papers from TRIZ journal, ETRIA TRIZ Future Conference and other journals of
engineering design (Research in Engineering Design, International Journal of Product Design) have been
analysed. The criteria of selection have been: (1) The relevance of the considered journal and conference,
based on the impact factor and the number of published proceedings according to Scopus clustering
functions. (2) The presence of well explained case studies about inventive problem solving, which declare the
25
considered requirements and constraints, the used approaches, methods and tools and the achieved
outputs. The considered keywords were: innovative problem solving, innovations, technical problem solving,
etc.
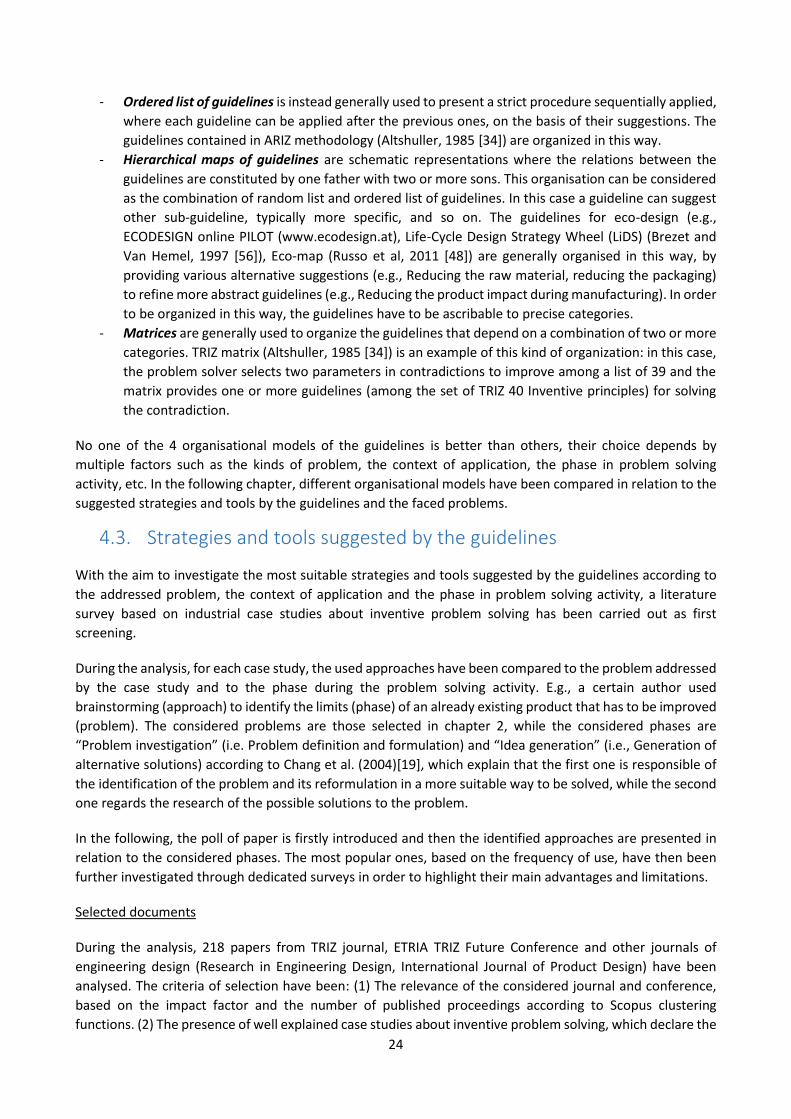
Figure 7 shows the time distribution of the considered documents during the years and the industrial fields
of application.
FIGURE 7: (A) TIME DISTRIBUTION AND (B) INDUSTRIAL SECTORS DISTRIBUTION OF THE CONSIDERED PAPERS.
4.3.1. Approaches to support problem investigation
The most common methods and approaches used in the case studies to support problem investigation have
been classified according to the following two categories:
- Models: they support the description of the initial situation of the problem in a qualitative way by
summarizing only the main elements involved (the object, the user, the environment, and other main
elements) and their relations. The most popular identified models are: Substance-Field (Su-Field)
model, MTS model, Function Behaviour Structure (FBS) model of design, Energy Material Signal
(EMS) model.
- Analytical methods: they describe the problem in a more structured way through quantitative
parameters and they support the analysis of the problem through strict procedure. The most
common identified analytical methods are: Qualitative Function Deployment (QFD), Fault Tree
Analysis (FTA), Failure Modes and Effects Analysis (FMEA).
In some case studies, the models and the analytical methods are used both during problem investigation: the
first ones are used to identify the key factors and the second ones to analyse them.
Table 3 summarizes the frequencies of use of models and analytical methods to support problem
investigation in the considered documents.
TABLE 3: MODELS AND ANALYTICAL METHODS USED TO SUPPORT THE CONSIDERED INVENTIVE PROBLEMS.
Kinds of problems Only models Only analytical methods
Models and analytical methods
Product improvement 51 59% 32 37% 4 5%
New product design 30 75% 6 15% 4 10%
Eliminate undesired effect 15 79% 2 11% 2 11%
Anticipatory failure analysis 0 0% 16 76% 5 24%
Total 96 40 15
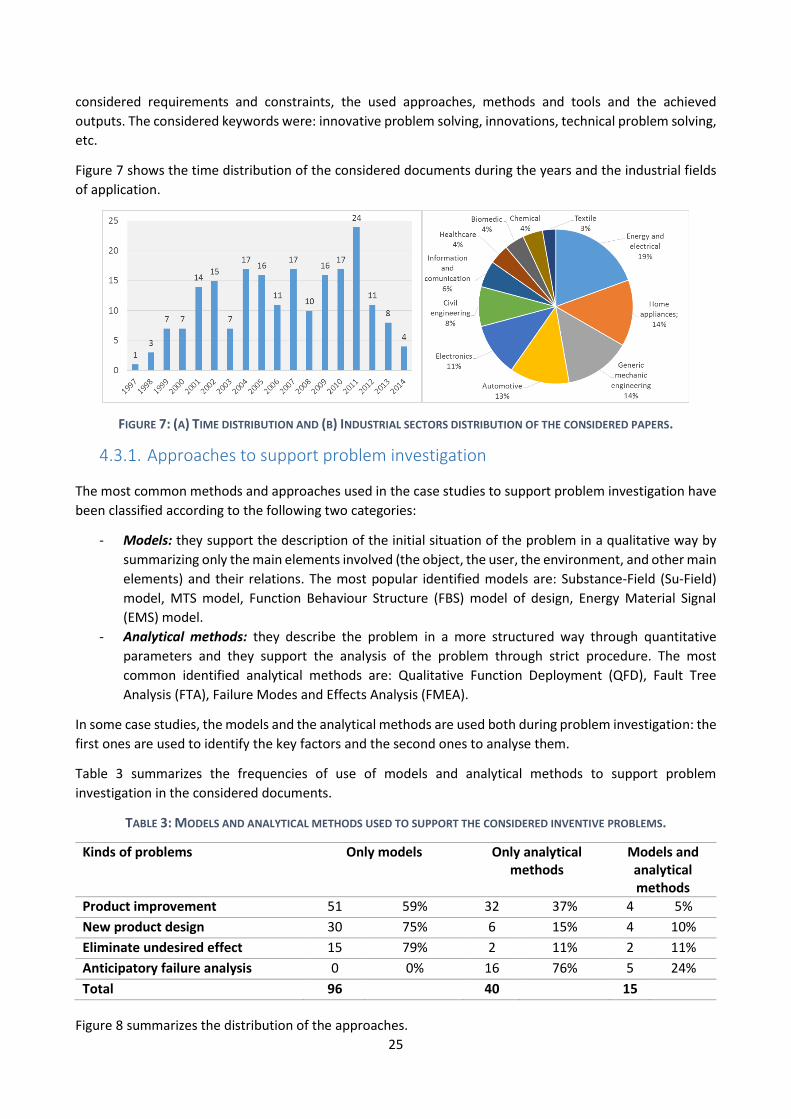
Figure 8 summarizes the distribution of the approaches.
26
FIGURE 8: DISTRIBUTION OF THE MOST POPULAR APPROACHES TO SUPPORT PROBLEM INVESTIGATION PHASE IN THE
CONSIDERED INVENTIVE PROBLEMS (PRODUCT IMPROVEMENT, NEW PRODUCT DESIGN, ELIMINATE UNDESIRED EFFECT, ANTICIPATORY FAILURE INVESTIGATION).
On the basis of the achieved results emerged that models are generally used in New Product Design and in
the Elimination of undesired effects, while Anticipatory failure analysis is supported by analytical methods.
In product improvement, models and analytical methods are instead more uniformly distributed.
For this reason, product improvement has been divided into two more specific categories:
- Re-design: in case product improvement involved to reconsideration about product functionalities
and the physical effects.
- Quality improvement: in case product improvement involved minimal modifications related to
technological aspects (i.e. the structure).
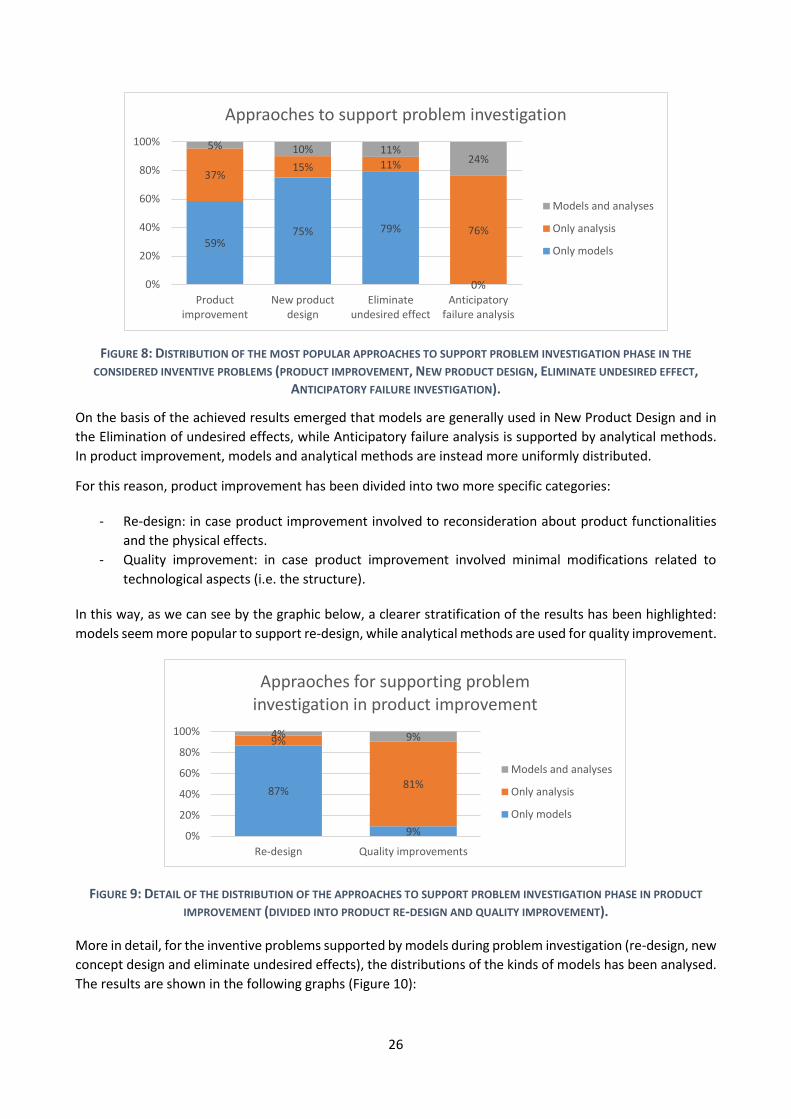
In this way, as we can see by the graphic below, a clearer stratification of the results has been highlighted:
models seem more popular to support re-design, while analytical methods are used for quality improvement.
FIGURE 9: DETAIL OF THE DISTRIBUTION OF THE APPROACHES TO SUPPORT PROBLEM INVESTIGATION PHASE IN PRODUCT
IMPROVEMENT (DIVIDED INTO PRODUCT RE-DESIGN AND QUALITY IMPROVEMENT).
More in detail, for the inventive problems supported by models during problem investigation (re-design, new
concept design and eliminate undesired effects), the distributions of the kinds of models has been analysed.
The results are shown in the following graphs (Figure 10):
59%75% 79%
0%
37%15% 11%
76%
5% 10% 11%24%
0%
20%
40%
60%
80%
100%
Productimprovement
New productdesign
Eliminateundesired effect
Anticipatoryfailure analysis
Appraoches to support problem investigation
Models and analyses
Only analysis
Only models
87%
9%
9%
81%
4% 9%
0%
20%
40%
60%
80%
100%
Re-design Quality improvements
Appraoches for supporting problem investigation in product improvement
Models and analyses
Only analysis
Only models
27
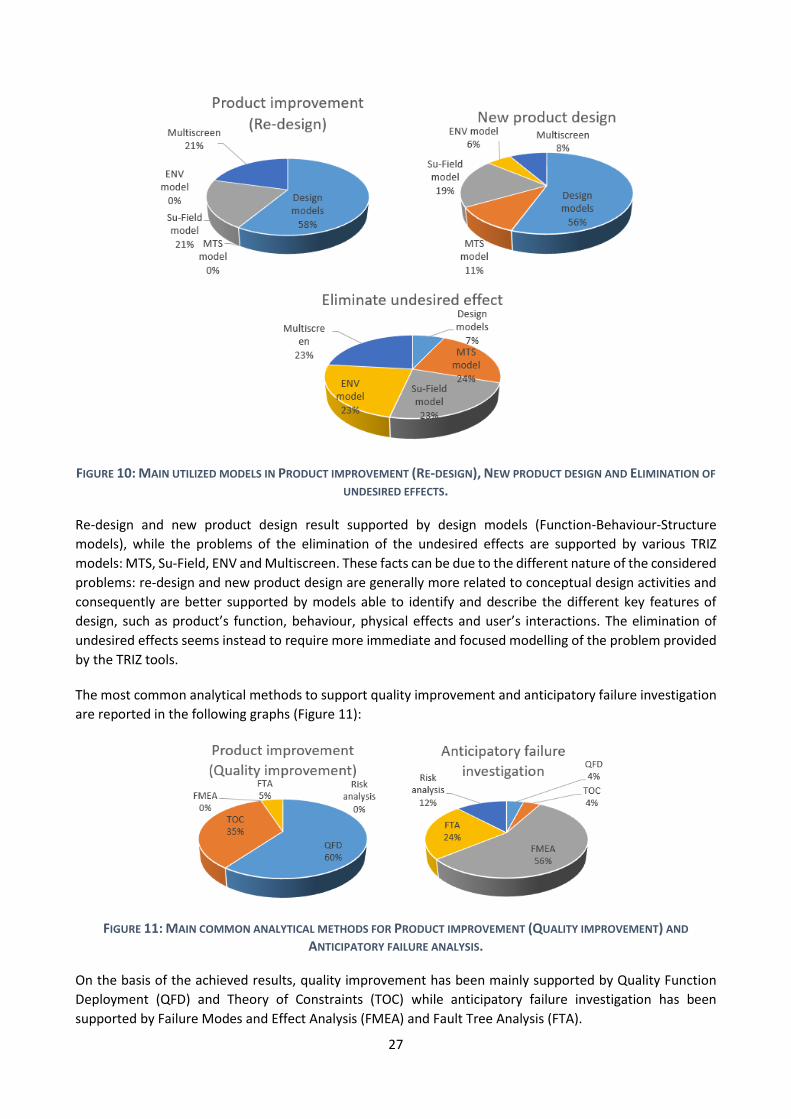
FIGURE 10: MAIN UTILIZED MODELS IN PRODUCT IMPROVEMENT (RE-DESIGN), NEW PRODUCT DESIGN AND ELIMINATION OF
UNDESIRED EFFECTS.
Re-design and new product design result supported by design models (Function-Behaviour-Structure
models), while the problems of the elimination of the undesired effects are supported by various TRIZ
models: MTS, Su-Field, ENV and Multiscreen. These facts can be due to the different nature of the considered
problems: re-design and new product design are generally more related to conceptual design activities and
consequently are better supported by models able to identify and describe the different key features of
design, such as product’s function, behaviour, physical effects and user’s interactions. The elimination of
undesired effects seems instead to require more immediate and focused modelling of the problem provided
by the TRIZ tools.
The most common analytical methods to support quality improvement and anticipatory failure investigation
are reported in the following graphs (Figure 11):
FIGURE 11: MAIN COMMON ANALYTICAL METHODS FOR PRODUCT IMPROVEMENT (QUALITY IMPROVEMENT) AND
ANTICIPATORY FAILURE ANALYSIS.
On the basis of the achieved results, quality improvement has been mainly supported by Quality Function
Deployment (QFD) and Theory of Constraints (TOC) while anticipatory failure investigation has been
supported by Failure Modes and Effect Analysis (FMEA) and Fault Tree Analysis (FTA).
28
The achieved results provided an indicative framework about them methods and the approaches for problem
investigation. From it, specific analyses, presented in the following, have been carried out with the aim to
better investigate their specific use, their limitations and the integrations.
Design models to support re-design and new product design
Among the reasoning schema that support new concept design and product re-design, Function-Behaviour-
Structure (FBS) model, proposed by Gero (1990)[57], and its numerous evolutions, is one of the most popular.
In synthesis, the following table (Table 4) summarizes the design entities and relations used by the original
Gero’s approach to schematize the design process.
TABLE 4: DESIGN ENTITIES AND RELATIONS IN GERO’S SCHEME (1990)[57].
Design entities Design relations
- Function (F): The design intentions or purposes.
- Behaviour (B): How the structure of an artefact achieves its functions. Divided into Expected behaviour (Be) and Actual behaviour (Bs).
- Structure (S): The components which make up an artefact and their relationships.
- Design description (D): is graphically, numerically, and/or textually representation to transfer sufficient information about the designed artefact so that it can be manufactured, fabricated or constructed.
- Formulation: is the process of transformation of the function into expected behaviour. (STEP 1)
- Synthesis: transformation of the expected behaviour into a structure that is intended to exhibit this behaviour. (STEP 2)
- Analysis: derivation of the actual behaviour of the structure. (STEP 3)
- Evaluation: comparison of the actual and expected behaviour (STEP 4). If positive, the design process is ended, if negative
- Documentation: production of the design description (STEP 5)
- Reformulation of the structure: choice of new structure. (STEP 6)
- Reformulation of the behaviour: choice of new expected behaviour. (STEP 7)
- Reformulation of the structure: choice of new functions. (STEP 8)
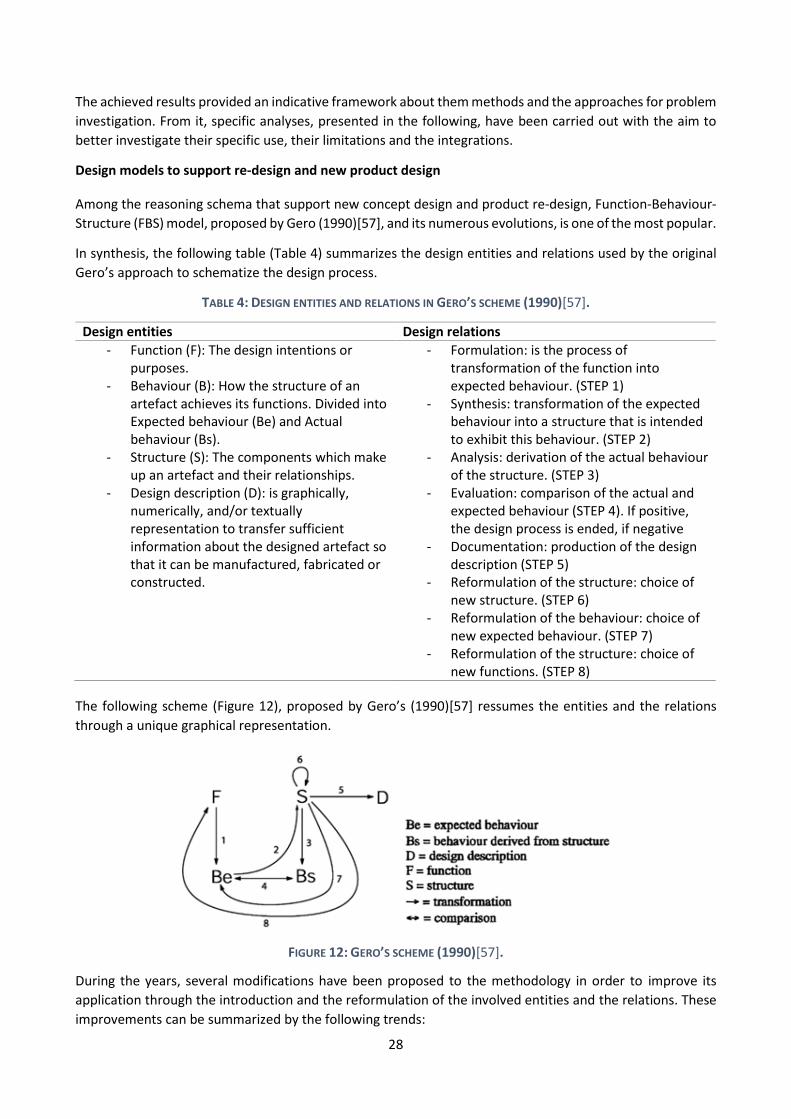
The following scheme (Figure 12), proposed by Gero’s (1990)[57] ressumes the entities and the relations
through a unique graphical representation.
FIGURE 12: GERO’S SCHEME (1990)[57].
During the years, several modifications have been proposed to the methodology in order to improve its
application through the introduction and the reformulation of the involved entities and the relations. These
improvements can be summarized by the following trends:
29
- Redefinition of the FBS ontology: (Rosenmann and Gero 1998 [58], Vermaas and Doorst 2007 [59],
Galle 2009 [60]).
- Redefinition and integrations of the behaviour of the device: Cao and Tan (2007)[61] explicitly dealt
with Physical effects, and Del Frate et al. (2010)[62] that introduced the possible faults of the device.
- Investigating about the relation with user and device: Brown and Blessing (2005)[63] discusses the
affordances, focused on the possible user’s actions on the device, Cascini et al. (2010)[64]
reformulated the interactions between the user and the FBS model.
- Investigating about the role of the requirements: Cascini et al. (2013)[65] reconciled the FBS
introducing needs and better describing their links with product requirements.
- Reformulation of the entities of the design process as functions and flows: Hirtz et al. (2002)[5],
Ahmed et al. (2003)[66], Bonaccorsi et al. (2007)[67], Borgo et al. (2009)[68] described them with
hierarchical taxonomies. Pailhès et al. (2011)[69] approached the problem by using a minimalistic
taxonomy to describe both functions and flows in terms of material, signal and energy. The flows of
the design process have also been formalized in mathematical terms by Komoto (2011)[70], while
Sasajima (1995)[71] modelled Functions and flows by using models belonging to Artificial
Intelligence, like Sapphire (Chakrabarti et al., 2009)[72] that proposed structured methodology to
better decompose abstract functions in more detailed sub-functions.
All the proposed models, tools, methods, theories and new ontologies are very interesting because they
introduce new concepts and clarifications of the original Gero’s model and the design process. However,
each of them focuses only on certain aspects of the methodology and no one proposes a unique and practical
comprehensive framework to support conceptual design.
In the following, the main features and the improvements for each element of the design process are
presented in detail.
- Designer’s actions. Gero (1990)[73] describe the phases of a conceptual design project that followed
by the designer without specifying his intentions regarding the features that she/he implements on
the product. In fact, the designer is not always able to put on the product all she/he wants:
sometimes forgets something, sometimes makes mistakes, other times introduces on the product
what should not. Gabelloni and Fantoni (2013)[74] identified three results of the designer activity
regard the implementation of a feature on the product:
o Designed (d): when the feature is if the designer deliberately implemented on the product by the
designer.
o Designed not to be (�̅�): if the designer deliberately avoids to implement a certain feature on the
device. For instance, a designer chooses to not design features “safety for children” in an
industrial power outlet: the children can insert objects into the holes because the cover is not
present;
o Not designed (𝑑): when the designer not deliberately implemented a feature on the product but
the features will also be present. For instance, when a designer insert an airtight cover on an
outlet, she/he does not want to implement the features “safety for children” but the features
“impermeability”, however, also the first feature is present on the device.
- Goals and functions. During the years, several authors have providing definitions about the concept
of goal and function in design theory. According to Umeda et al. (1990)[25], and referring to
Sasajima’s formulation, the function is the objective that a user sees in a behaviour (B) while the goal
derives from the final state of a structure that evolves through a finite number of states S(t1), …, S(tf).
𝐹 = 𝐹(𝐵, 𝐺)
30
𝐺 = 𝑆(𝑡𝑓)
Gero and Kannengiesser (2004)[75] describe instead the goal as the simulation (Sim) of the product
expected behaviour made by a user (U) by observing the structure of product (and in particular its
affordances) and the environment around the product in certain instance of time (t1).
𝐺 = 𝑆𝑖𝑚(𝑈, 𝑆(𝑡1), 𝐸(𝑡1), 𝑡1)
- Affordances. Brown and Blessing (2005)[63] define the affordances of a product as the set of all
potential operations that the product communicate the user that is be able to make. For instance, a
car with a spoiler suggest to the user a better road grip. Mayer and Fadel (2009)[76] and Gaver
(1991)[77] address the problem with other definitions. Cascini et al. (2010)[78] divide the affordances
into designer’s affordances (Ad), user’s affordances (Au), true intended affordances and false
intended affordances. In this way the authors explain how the user can misunderstand certain
affordances or do not consider them.
- Expected behaviour. Gero (1990)[73] introduces the concepts of the expected behaviour as the
theoretical behaviour of the product postulated by the designer to accomplish the function, before
to design and realize the structure of the product, without specifying the different perspectives of
user and designer. As done by Cascini et al. (2010)[78] for the decomposition of the actual behaviour
(Bs) into user actual behaviour (Bsu) and designer actual behaviour (Bsd), in the proposed scheme
also the expected behaviour (Be) has been divided into user expected behaviour (Beu) and designer
expected behaviour (Bed). The difference between the two kinds of expected behaviour depends by
the different point of view about the product of the user and the designer, in turn caused by different
level of knowledge of the product and by different background and level of experience and by the
different capability of the user in understanding the affordances putted on the product by the
designer. In fact, the user imagines the expected behaviour of the product on the basis of the
comprehension of the affordances. The designer knows also better the product and in particular the
internal components.
- Manipulation. Differently to the expected behaviour, that is strictly related to the functioning of the
product, the manipulation involves directly the user by summarizing his sequence of interactions
with the product. According to Cascini (2010)[79] the term manipulation includes both direct physical
manipulation and indirect actions of the user.
For the proposed scheme, the manipulation has been divided into user manipulation (Mu) and
designer manipulation (Md), in order to describe the two possible ways of interaction of the user and
the designer with the product that depend of the user and designer’s ideas about the structure and
its behaviour. In particular, the user manipulation can be seen as a process of simulation provided
on the user on the basis of its idea of the goal of the structure, the user affordances derived by the
structure and the user expected behaviour in turn derived by the user affordance).
𝑆𝑖𝑚(𝐺, 𝑆 → 𝐴 → 𝐵𝑒𝑢) → 𝑀𝑢
For instance, if a user wants to sit (G) and do not has a chair, she/he can search an alternative
structure to sit (e.g., a bin paint (S)). By observing the geometry of the bin paint the user sees the
superior flat cover (Au) and interpret as a possible seat. Then, the user thinks how to sit on the bin
and if the bin can withstand her/his weight (Beu) and she/he sits on the bin (Mu).
Despite the simplicity of the problem we can see that the user’s affordances are different compared
to the designer’s affordances (the designer does not the designed the cover as seat), the user
expected behaviour is different respect the designer expected behaviour and the user manipulation
is different respect the designer manipulation.
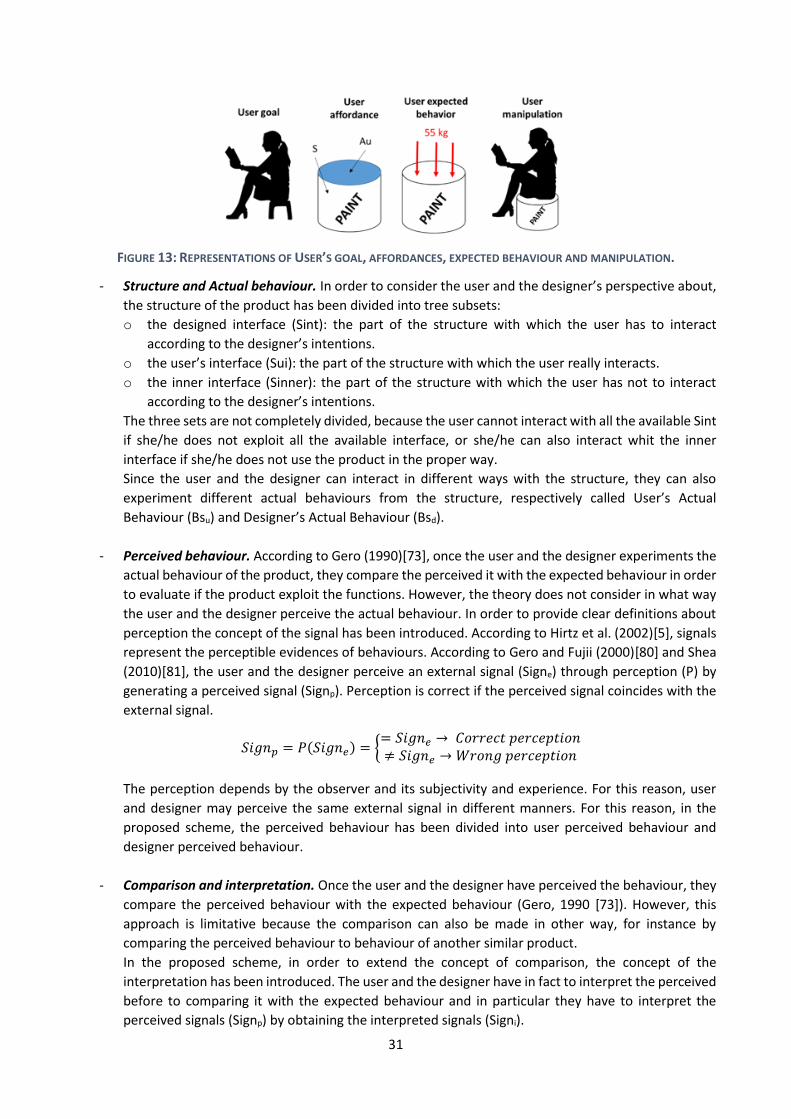
31
FIGURE 13: REPRESENTATIONS OF USER’S GOAL, AFFORDANCES, EXPECTED BEHAVIOUR AND MANIPULATION.
- Structure and Actual behaviour. In order to consider the user and the designer’s perspective about,
the structure of the product has been divided into tree subsets:
o the designed interface (Sint): the part of the structure with which the user has to interact
according to the designer’s intentions.
o the user’s interface (Sui): the part of the structure with which the user really interacts.
o the inner interface (Sinner): the part of the structure with which the user has not to interact
according to the designer’s intentions.
The three sets are not completely divided, because the user cannot interact with all the available Sint
if she/he does not exploit all the available interface, or she/he can also interact whit the inner
interface if she/he does not use the product in the proper way.
Since the user and the designer can interact in different ways with the structure, they can also
experiment different actual behaviours from the structure, respectively called User’s Actual
Behaviour (Bsu) and Designer’s Actual Behaviour (Bsd).
- Perceived behaviour. According to Gero (1990)[73], once the user and the designer experiments the
actual behaviour of the product, they compare the perceived it with the expected behaviour in order
to evaluate if the product exploit the functions. However, the theory does not consider in what way
the user and the designer perceive the actual behaviour. In order to provide clear definitions about
perception the concept of the signal has been introduced. According to Hirtz et al. (2002)[5], signals
represent the perceptible evidences of behaviours. According to Gero and Fujii (2000)[80] and Shea
(2010)[81], the user and the designer perceive an external signal (Signe) through perception (P) by
generating a perceived signal (Signp). Perception is correct if the perceived signal coincides with the
external signal.
𝑆𝑖𝑔𝑛𝑝 = 𝑃(𝑆𝑖𝑔𝑛𝑒) = {= 𝑆𝑖𝑔𝑛𝑒 → 𝐶𝑜𝑟𝑟𝑒𝑐𝑡 𝑝𝑒𝑟𝑐𝑒𝑝𝑡𝑖𝑜𝑛≠ 𝑆𝑖𝑔𝑛𝑒 → 𝑊𝑟𝑜𝑛𝑔 𝑝𝑒𝑟𝑐𝑒𝑝𝑡𝑖𝑜𝑛
The perception depends by the observer and its subjectivity and experience. For this reason, user
and designer may perceive the same external signal in different manners. For this reason, in the
proposed scheme, the perceived behaviour has been divided into user perceived behaviour and
designer perceived behaviour.
- Comparison and interpretation. Once the user and the designer have perceived the behaviour, they
compare the perceived behaviour with the expected behaviour (Gero, 1990 [73]). However, this
approach is limitative because the comparison can also be made in other way, for instance by
comparing the perceived behaviour to behaviour of another similar product.
In the proposed scheme, in order to extend the concept of comparison, the concept of the
interpretation has been introduced. The user and the designer have in fact to interpret the perceived
before to comparing it with the expected behaviour and in particular they have to interpret the
perceived signals (Signp) by obtaining the interpreted signals (Signi).
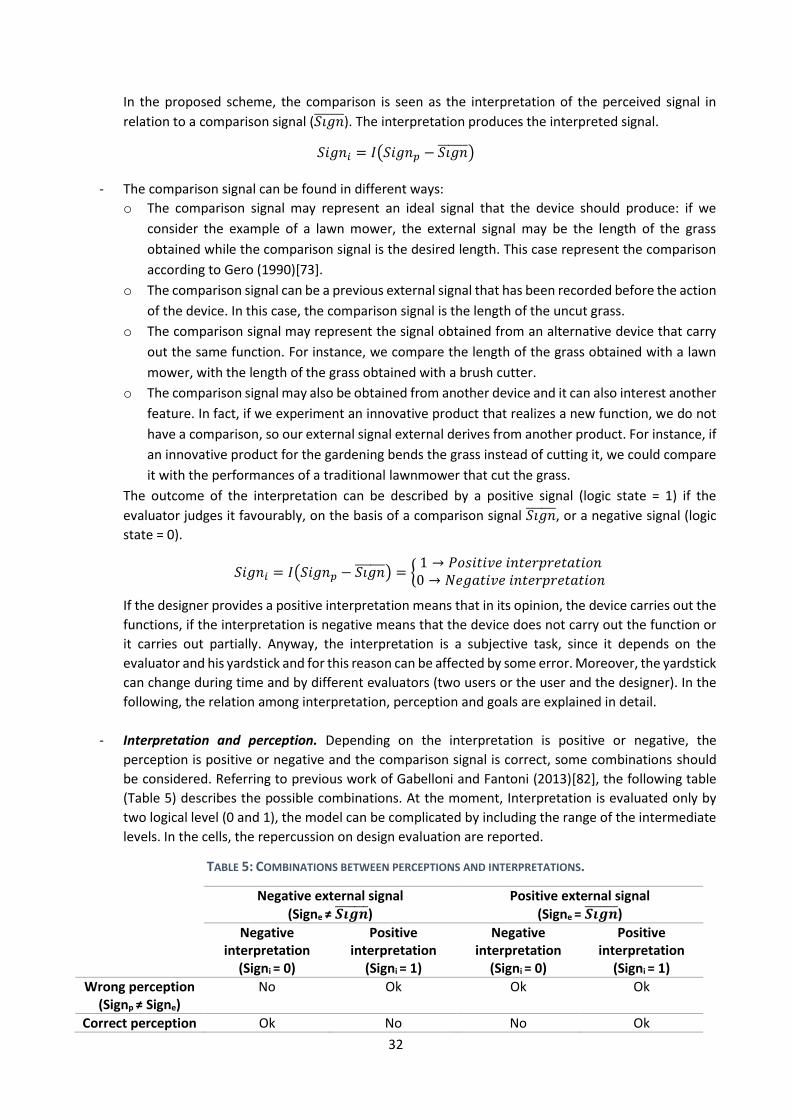
32
In the proposed scheme, the comparison is seen as the interpretation of the perceived signal in
relation to a comparison signal (𝑆𝑖𝑔𝑛̅̅ ̅̅ ̅̅ ). The interpretation produces the interpreted signal.
𝑆𝑖𝑔𝑛𝑖 = 𝐼(𝑆𝑖𝑔𝑛𝑝 − 𝑆𝑖𝑔𝑛̅̅ ̅̅ ̅̅ )
- The comparison signal can be found in different ways:
o The comparison signal may represent an ideal signal that the device should produce: if we
consider the example of a lawn mower, the external signal may be the length of the grass
obtained while the comparison signal is the desired length. This case represent the comparison
according to Gero (1990)[73].
o The comparison signal can be a previous external signal that has been recorded before the action
of the device. In this case, the comparison signal is the length of the uncut grass.
o The comparison signal may represent the signal obtained from an alternative device that carry
out the same function. For instance, we compare the length of the grass obtained with a lawn
mower, with the length of the grass obtained with a brush cutter.
o The comparison signal may also be obtained from another device and it can also interest another
feature. In fact, if we experiment an innovative product that realizes a new function, we do not
have a comparison, so our external signal external derives from another product. For instance, if
an innovative product for the gardening bends the grass instead of cutting it, we could compare
it with the performances of a traditional lawnmower that cut the grass.
The outcome of the interpretation can be described by a positive signal (logic state = 1) if the
evaluator judges it favourably, on the basis of a comparison signal 𝑆𝑖𝑔𝑛̅̅ ̅̅ ̅̅ , or a negative signal (logic
state = 0).
𝑆𝑖𝑔𝑛𝑖 = 𝐼(𝑆𝑖𝑔𝑛𝑝 − 𝑆𝑖𝑔𝑛̅̅ ̅̅ ̅̅ ) = {1 → 𝑃𝑜𝑠𝑖𝑡𝑖𝑣𝑒 𝑖𝑛𝑡𝑒𝑟𝑝𝑟𝑒𝑡𝑎𝑡𝑖𝑜𝑛
0 → 𝑁𝑒𝑔𝑎𝑡𝑖𝑣𝑒 𝑖𝑛𝑡𝑒𝑟𝑝𝑟𝑒𝑡𝑎𝑡𝑖𝑜𝑛
If the designer provides a positive interpretation means that in its opinion, the device carries out the
functions, if the interpretation is negative means that the device does not carry out the function or
it carries out partially. Anyway, the interpretation is a subjective task, since it depends on the
evaluator and his yardstick and for this reason can be affected by some error. Moreover, the yardstick
can change during time and by different evaluators (two users or the user and the designer). In the
following, the relation among interpretation, perception and goals are explained in detail.
- Interpretation and perception. Depending on the interpretation is positive or negative, the
perception is positive or negative and the comparison signal is correct, some combinations should
be considered. Referring to previous work of Gabelloni and Fantoni (2013)[82], the following table
(Table 5) describes the possible combinations. At the moment, Interpretation is evaluated only by
two logical level (0 and 1), the model can be complicated by including the range of the intermediate
levels. In the cells, the repercussion on design evaluation are reported.
TABLE 5: COMBINATIONS BETWEEN PERCEPTIONS AND INTERPRETATIONS.
Negative external signal
(Signe ≠ 𝑺𝒊𝒈𝒏̅̅ ̅̅ ̅̅ ̅)
Positive external signal
(Signe = 𝑺𝒊𝒈𝒏̅̅ ̅̅ ̅̅ ̅)
Negative interpretation
(Signi = 0)
Positive interpretation
(Signi = 1)
Negative interpretation
(Signi = 0)
Positive interpretation
(Signi = 1)
Wrong perception (Signp ≠ Signe)
No Ok Ok Ok
Correct perception Ok No No Ok
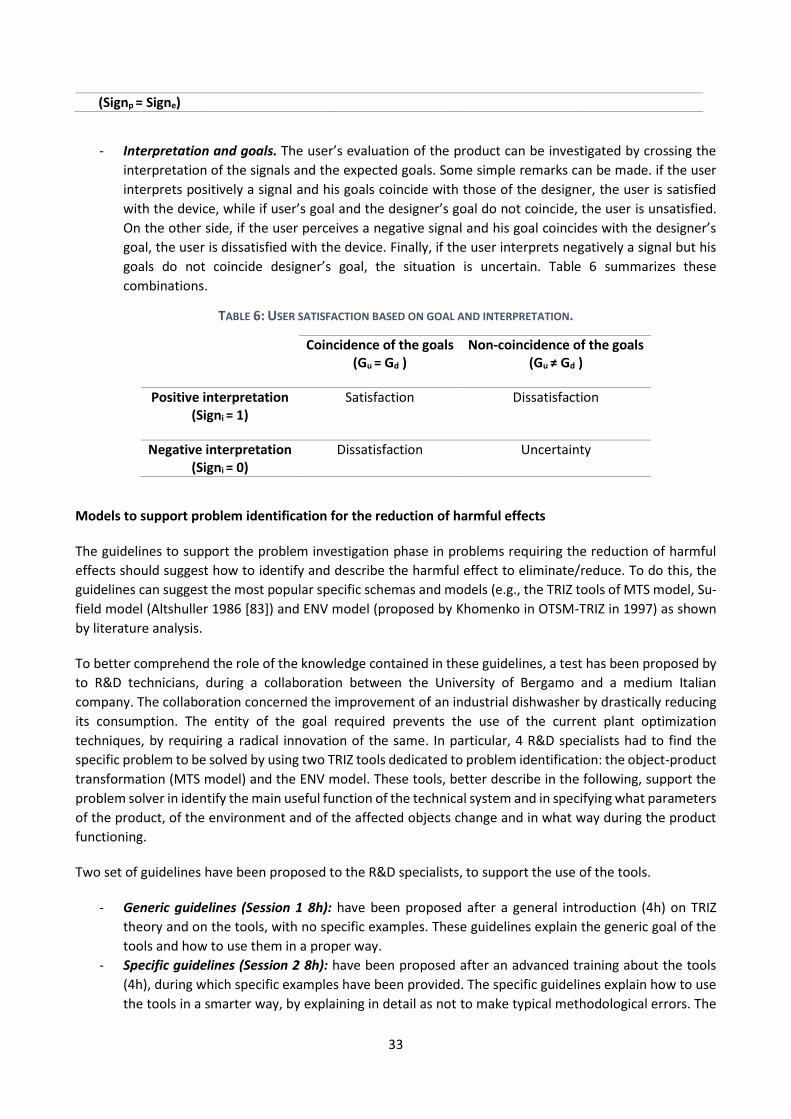
33
(Signp = Signe)
- Interpretation and goals. The user’s evaluation of the product can be investigated by crossing the
interpretation of the signals and the expected goals. Some simple remarks can be made. if the user
interprets positively a signal and his goals coincide with those of the designer, the user is satisfied
with the device, while if user’s goal and the designer’s goal do not coincide, the user is unsatisfied.
On the other side, if the user perceives a negative signal and his goal coincides with the designer’s
goal, the user is dissatisfied with the device. Finally, if the user interprets negatively a signal but his
goals do not coincide designer’s goal, the situation is uncertain. Table 6 summarizes these
combinations.
TABLE 6: USER SATISFACTION BASED ON GOAL AND INTERPRETATION.
Coincidence of the goals (Gu = Gd )
Non-coincidence of the goals (Gu ≠ Gd )
Positive interpretation (Signi = 1)
Satisfaction Dissatisfaction
Negative interpretation (Signi = 0)
Dissatisfaction Uncertainty
Models to support problem identification for the reduction of harmful effects
The guidelines to support the problem investigation phase in problems requiring the reduction of harmful
effects should suggest how to identify and describe the harmful effect to eliminate/reduce. To do this, the
guidelines can suggest the most popular specific schemas and models (e.g., the TRIZ tools of MTS model, Su-
field model (Altshuller 1986 [83]) and ENV model (proposed by Khomenko in OTSM-TRIZ in 1997) as shown
by literature analysis.
To better comprehend the role of the knowledge contained in these guidelines, a test has been proposed by
to R&D technicians, during a collaboration between the University of Bergamo and a medium Italian
company. The collaboration concerned the improvement of an industrial dishwasher by drastically reducing
its consumption. The entity of the goal required prevents the use of the current plant optimization
techniques, by requiring a radical innovation of the same. In particular, 4 R&D specialists had to find the
specific problem to be solved by using two TRIZ tools dedicated to problem identification: the object-product
transformation (MTS model) and the ENV model. These tools, better describe in the following, support the
problem solver in identify the main useful function of the technical system and in specifying what parameters
of the product, of the environment and of the affected objects change and in what way during the product
functioning.
Two set of guidelines have been proposed to the R&D specialists, to support the use of the tools.
- Generic guidelines (Session 1 8h): have been proposed after a general introduction (4h) on TRIZ
theory and on the tools, with no specific examples. These guidelines explain the generic goal of the
tools and how to use them in a proper way.
- Specific guidelines (Session 2 8h): have been proposed after an advanced training about the tools
(4h), during which specific examples have been provided. The specific guidelines explain how to use
the tools in a smarter way, by explaining in detail as not to make typical methodological errors. The

34
application of these guidelines requires a greater knowledge about the method, especially cause of
the more researched terminology used by the guidelines.
During the two sessions, no specific domain knowledge about the field of application has been added in the
guidelines.
The results, obtained by using the proposed tools whit the help of the guidelines in the two phases, have
been evaluated by providing a ranking from 0 to 2 points for each of the 9 identified key features, divided as
follow:
- object-product transformation (4 features): identification of Object, Product, and the two main
operative functions of the system (Function 1 and Function 2);
- ENV model: identification and description of 5 strategic features regarding the process, regarding
safety, reliability and other industrial parameters.
Table 7 summarizes the obtained results:
TABLE 7: RESULTS OF THE TEST.
Generic guidelines (+
basic training) Average results
Specific guidelines (+ advanced
training) Average results
Object|product transformation
Object 1 2
Product 1 2
Function 1 0 1
Function 2 1 2
Total (max 8 points) 3 7
ENV model Feature 1 1 2
Feature 2 2 2
Feature 3 0 1
Feature 4 0 2
Feature 5 1 2
Total (max 10 points) 4 9
As we can see by the proposed table, the proposed results significantly improve after the introduction of the
specific guidelines, both for the object-product transformation and for the ENV model. On the basis of what
emerged from phase 1, the professionals have described the assigned problem in an insufficient manner by
using the object-product transformation tool (3/8 points) and the ENV model (4/9).
This test seems to confirm the necessity of proposing guidelines with high methodological content to
specialists in the domain of the problem. This fact can be due to the major attention of the specialists on the
product structure and components rather than on the on the research of unexploited resources, physical
effects and the functionalities. The features identified by the professionals, by using the generic guidelines
are in fact the most known by the such as the heat exchange towards the environment and they are described
in detail, while the crucial aspects such as the evaporation mechanism of the water drop on the dishes, are
just mentioned or not even identified.

35
For these reasons, the use of guidelines with more structured un-domain methodology, achieved for instance
by improving their terminology or by adding more detailed explanations about the followed methodology
seems to ameliorate the achieved results and to provide more exhaustive descriptions of the problem.
Anticipatory failure analysis techniques
Among the approaches to support anticipatory failure investigation, FMEA seems the most used. However,
FMEA has not a shared and accepted framework and several modifications have been proposed during the
years. Through a detailed literature analysis has been performed, the main problems and limitations and the
improvements have been studied.
Research methodology
First, the similar surveys of other authors have been considered. Sutrisno and Lee (2011)[84] studied service
reliability assessment using FMEA, analysing papers from 1994 to 2010 from literature databases. Liu et al.
(2013)[85] concentrated their attention on risk evaluation approaches in FMEA, reviewing 75 FMEA papers
published, evaluating the research trends and the popularity of the proposed approaches in term of citations.
Tixier et al. (2002)[86] reviewed 62 Risk Analysis techniques, classifying methodologies through input and
output data and providing the mechanism for risk evaluation.
Despite FMEA has been accepted successfully in a lot of different fields, nowadays there are again many
doubts about the methodology. Kmenta et al. (1998)[87] highlighted the subjectivity of FMEA that it is linked
to experience of those who use it. Moreover, the application of the method is too boring and not creative.
The software that have automatized FMEA may help, but not when the user is called to contribute with an
active role. Moreover, traditional FMEA does not support the conceptual design phase since it is used to
improve an existing product and not a prototype, where the problem solving phase can be surely more
helpful and effectiveness, having at this time major margins of modification.
Previous surveys considered only scientific bibliography, leaving out the most part of contributions provided
by industries. In this analysis both scientific contributions and published applications (granted patents and
utility models) from 1978 to 2016 have been considered.
FMEA literature is really huge. The fields of application are various (mechanical, electronic, medical, etc.) and
the jargon changes according to the area of application (e.g., DFMEA, FMECA, AFMEA, etc.). Our analysis
includes scientific publications, books, conference proceedings, normative and patents; the sources are many
and sometimes not available, such as internal standards developed by companies.
To identify the set of scientific papers, Scopus database has been considered. A combination of terms like
“FMEA, FMECA, DFMEA, AFMEA, RFMEA, Failure Modes and Effects Analysis, Risk Analysis, Failure Analysis”
was used to set the search query. The final list of journals has been identified by applying Scopus clustering
function and then manually selecting the most relevant journals according to their impact factor and the
number of published proceedings and citation.
Table 8 summarises the most relevant selected international journals.
TABLE 8: SELECTED INTERNATIONAL JOURNALS, IN BRACKETS THE NUMBER OF PAPERS
- Expert Systems with Applications - International Journal of Quality and
Reliability Management
- Journal of Loss Prevention in The Process Industries
- International Journal of Production Research
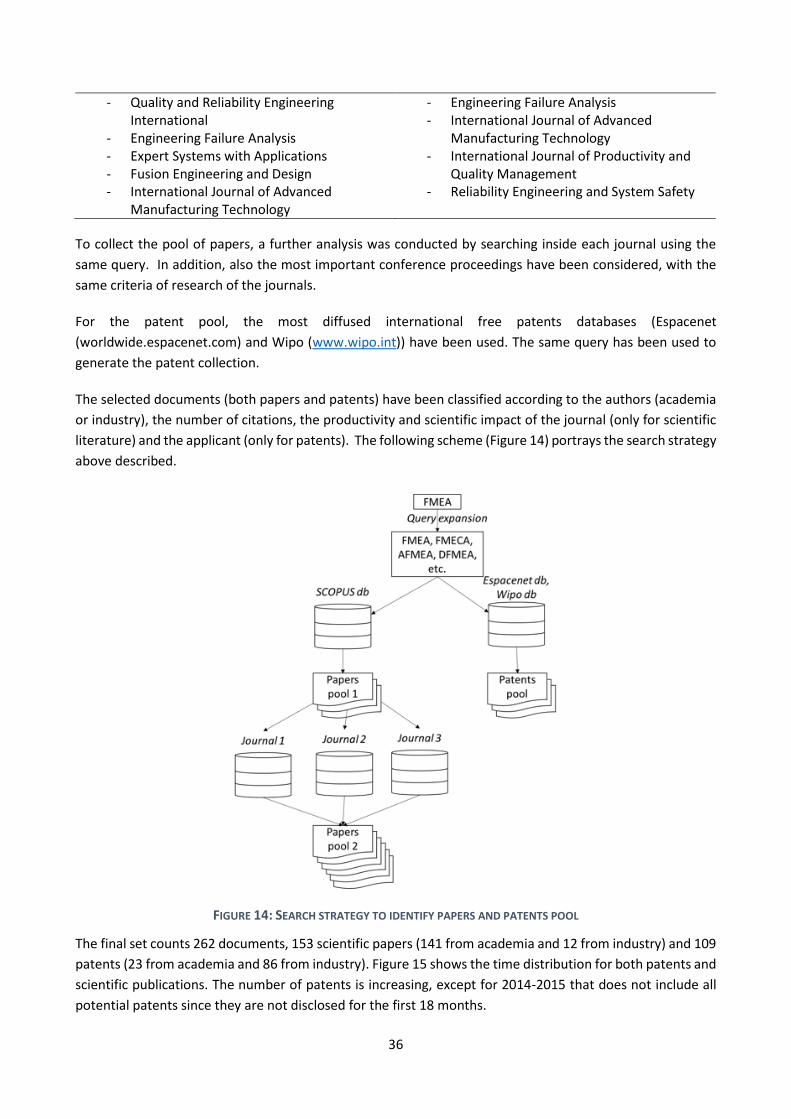
36
- Quality and Reliability Engineering International
- Engineering Failure Analysis - Expert Systems with Applications - Fusion Engineering and Design - International Journal of Advanced
Manufacturing Technology
- Engineering Failure Analysis - International Journal of Advanced
Manufacturing Technology - International Journal of Productivity and
Quality Management - Reliability Engineering and System Safety
To collect the pool of papers, a further analysis was conducted by searching inside each journal using the
same query. In addition, also the most important conference proceedings have been considered, with the
same criteria of research of the journals.
For the patent pool, the most diffused international free patents databases (Espacenet
(worldwide.espacenet.com) and Wipo (www.wipo.int)) have been used. The same query has been used to
generate the patent collection.
The selected documents (both papers and patents) have been classified according to the authors (academia
or industry), the number of citations, the productivity and scientific impact of the journal (only for scientific
literature) and the applicant (only for patents). The following scheme (Figure 14) portrays the search strategy
above described.
FIGURE 14: SEARCH STRATEGY TO IDENTIFY PAPERS AND PATENTS POOL
The final set counts 262 documents, 153 scientific papers (141 from academia and 12 from industry) and 109
patents (23 from academia and 86 from industry). Figure 15 shows the time distribution for both patents and
scientific publications. The number of patents is increasing, except for 2014-2015 that does not include all
potential patents since they are not disclosed for the first 18 months.
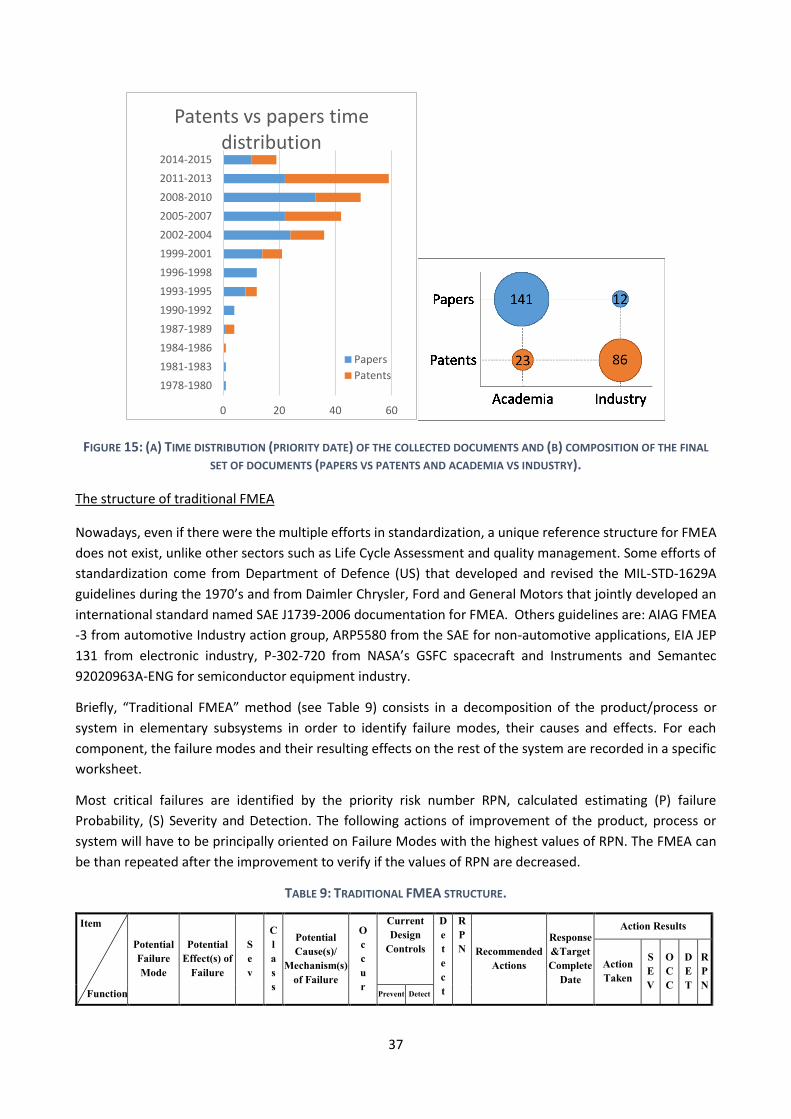
37
FIGURE 15: (A) TIME DISTRIBUTION (PRIORITY DATE) OF THE COLLECTED DOCUMENTS AND (B) COMPOSITION OF THE FINAL
SET OF DOCUMENTS (PAPERS VS PATENTS AND ACADEMIA VS INDUSTRY).
The structure of traditional FMEA
Nowadays, even if there were the multiple efforts in standardization, a unique reference structure for FMEA
does not exist, unlike other sectors such as Life Cycle Assessment and quality management. Some efforts of
standardization come from Department of Defence (US) that developed and revised the MIL-STD-1629A
guidelines during the 1970’s and from Daimler Chrysler, Ford and General Motors that jointly developed an
international standard named SAE J1739-2006 documentation for FMEA. Others guidelines are: AIAG FMEA
-3 from automotive Industry action group, ARP5580 from the SAE for non-automotive applications, EIA JEP
131 from electronic industry, P-302-720 from NASA’s GSFC spacecraft and Instruments and Semantec
92020963A-ENG for semiconductor equipment industry.
Briefly, “Traditional FMEA” method (see Table 9) consists in a decomposition of the product/process or
system in elementary subsystems in order to identify failure modes, their causes and effects. For each
component, the failure modes and their resulting effects on the rest of the system are recorded in a specific
worksheet.
Most critical failures are identified by the priority risk number RPN, calculated estimating (P) failure
Probability, (S) Severity and Detection. The following actions of improvement of the product, process or
system will have to be principally oriented on Failure Modes with the highest values of RPN. The FMEA can
be than repeated after the improvement to verify if the values of RPN are decreased.
TABLE 9: TRADITIONAL FMEA STRUCTURE.
Item
Function
Potential
Failure
Mode
Potential
Effect(s) of
Failure
S
e
v
C
l
a
s
s
Potential
Cause(s)/
Mechanism(s)
of Failure
O
c
c
u
r
Current
Design
Controls
D
e
t
e
c
t
R
P
N Recommended
Actions
Response
&Target
Complete
Date
Action Results
Action
Taken
S
E
V
O
C
C
D
E
T
R
P
N
Prevent Detect
0 20 40 60
1978-1980
1981-1983
1984-1986
1987-1989
1990-1992
1993-1995
1996-1998
1999-2001
2002-2004
2005-2007
2008-2010
2011-2013
2014-2015
Patents vs papers time distribution
Papers
Patents
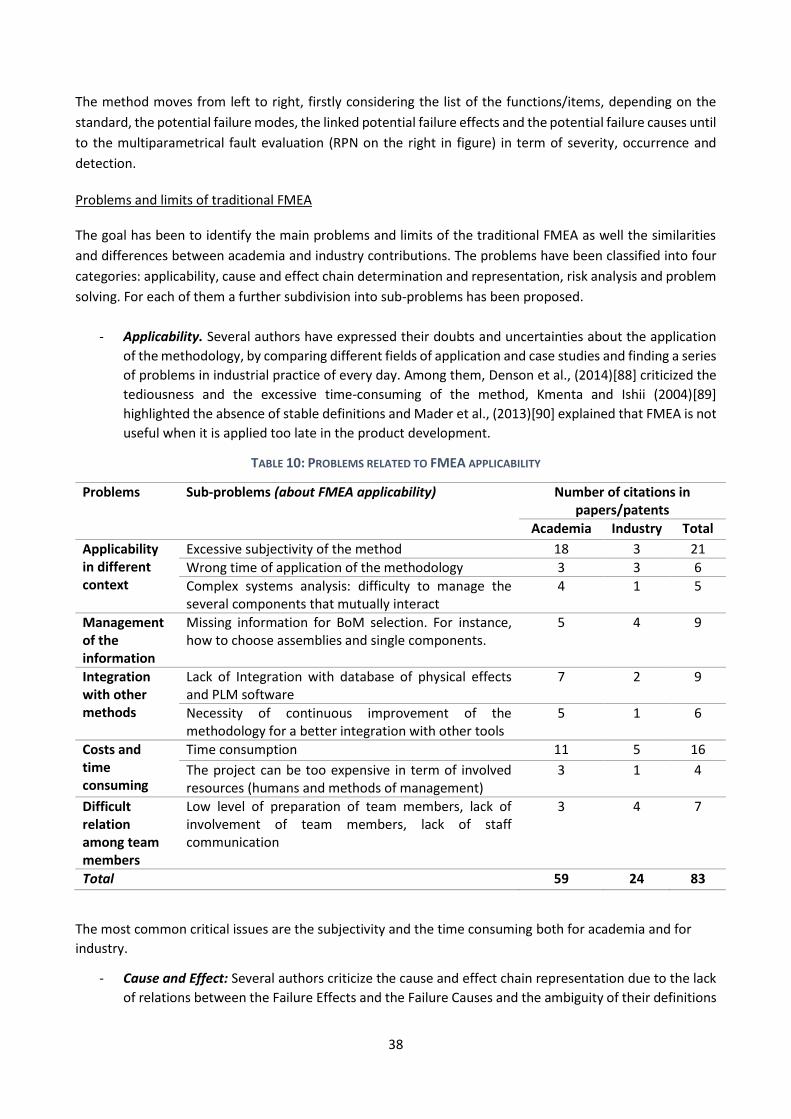
38
The method moves from left to right, firstly considering the list of the functions/items, depending on the
standard, the potential failure modes, the linked potential failure effects and the potential failure causes until
to the multiparametrical fault evaluation (RPN on the right in figure) in term of severity, occurrence and
detection.
Problems and limits of traditional FMEA
The goal has been to identify the main problems and limits of the traditional FMEA as well the similarities
and differences between academia and industry contributions. The problems have been classified into four
categories: applicability, cause and effect chain determination and representation, risk analysis and problem
solving. For each of them a further subdivision into sub-problems has been proposed.
- Applicability. Several authors have expressed their doubts and uncertainties about the application
of the methodology, by comparing different fields of application and case studies and finding a series
of problems in industrial practice of every day. Among them, Denson et al., (2014)[88] criticized the
tediousness and the excessive time-consuming of the method, Kmenta and Ishii (2004)[89]
highlighted the absence of stable definitions and Mader et al., (2013)[90] explained that FMEA is not
useful when it is applied too late in the product development.
TABLE 10: PROBLEMS RELATED TO FMEA APPLICABILITY
Problems Sub-problems (about FMEA applicability) Number of citations in papers/patents
Academia Industry Total
Applicability in different context
Excessive subjectivity of the method 18 3 21
Wrong time of application of the methodology 3 3 6
Complex systems analysis: difficulty to manage the several components that mutually interact
4 1 5
Management of the information
Missing information for BoM selection. For instance, how to choose assemblies and single components.
5 4 9
Integration with other methods
Lack of Integration with database of physical effects and PLM software
7 2 9
Necessity of continuous improvement of the methodology for a better integration with other tools
5 1 6
Costs and time consuming
Time consumption 11 5 16
The project can be too expensive in term of involved resources (humans and methods of management)
3 1 4
Difficult relation among team members
Low level of preparation of team members, lack of involvement of team members, lack of staff communication
3 4 7
Total 59 24 83
The most common critical issues are the subjectivity and the time consuming both for academia and for
industry.
- Cause and Effect: Several authors criticize the cause and effect chain representation due to the lack
of relations between the Failure Effects and the Failure Causes and the ambiguity of their definitions
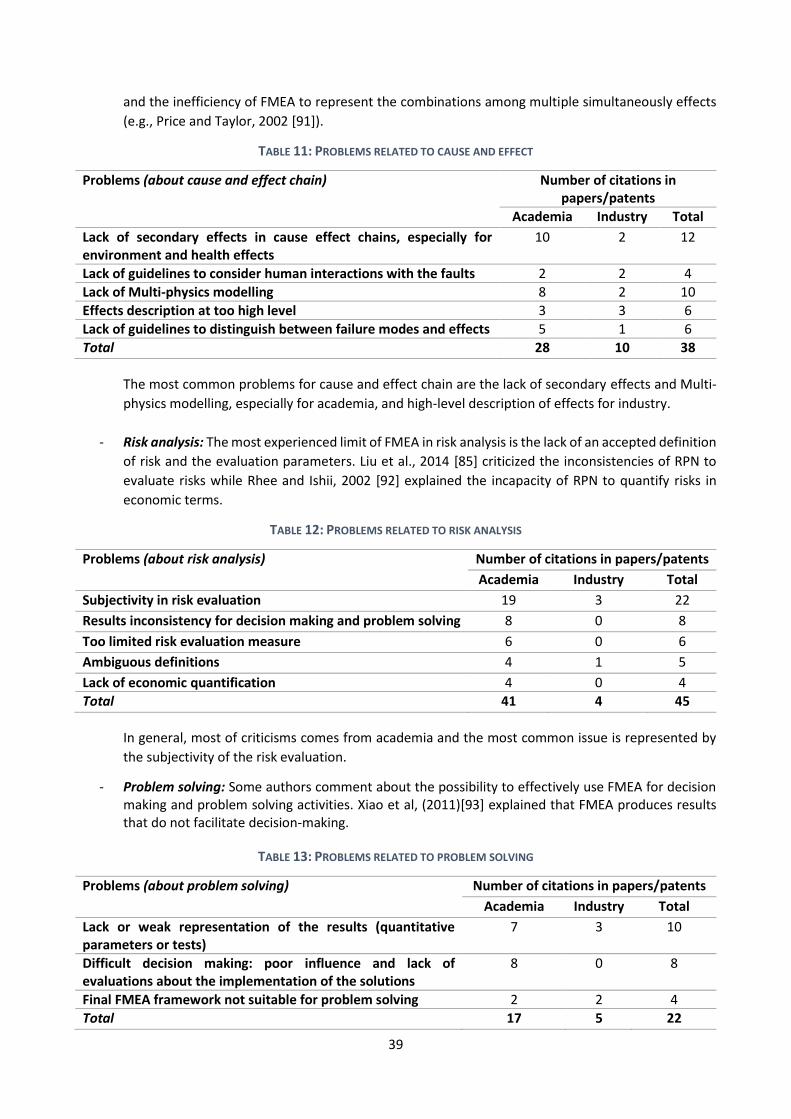
39
and the inefficiency of FMEA to represent the combinations among multiple simultaneously effects
(e.g., Price and Taylor, 2002 [91]).
TABLE 11: PROBLEMS RELATED TO CAUSE AND EFFECT
Problems (about cause and effect chain) Number of citations in papers/patents
Academia Industry Total
Lack of secondary effects in cause effect chains, especially for environment and health effects
10 2 12
Lack of guidelines to consider human interactions with the faults 2 2 4
Lack of Multi-physics modelling 8 2 10
Effects description at too high level 3 3 6
Lack of guidelines to distinguish between failure modes and effects 5 1 6
Total 28 10 38
The most common problems for cause and effect chain are the lack of secondary effects and Multi-
physics modelling, especially for academia, and high-level description of effects for industry.
- Risk analysis: The most experienced limit of FMEA in risk analysis is the lack of an accepted definition
of risk and the evaluation parameters. Liu et al., 2014 [85] criticized the inconsistencies of RPN to
evaluate risks while Rhee and Ishii, 2002 [92] explained the incapacity of RPN to quantify risks in
economic terms.
TABLE 12: PROBLEMS RELATED TO RISK ANALYSIS
Problems (about risk analysis) Number of citations in papers/patents
Academia Industry Total
Subjectivity in risk evaluation 19 3 22
Results inconsistency for decision making and problem solving 8 0 8
Too limited risk evaluation measure 6 0 6
Ambiguous definitions 4 1 5
Lack of economic quantification 4 0 4
Total 41 4 45
In general, most of criticisms comes from academia and the most common issue is represented by
the subjectivity of the risk evaluation.
- Problem solving: Some authors comment about the possibility to effectively use FMEA for decision making and problem solving activities. Xiao et al, (2011)[93] explained that FMEA produces results that do not facilitate decision-making.
TABLE 13: PROBLEMS RELATED TO PROBLEM SOLVING
Problems (about problem solving) Number of citations in papers/patents
Academia Industry Total
Lack or weak representation of the results (quantitative parameters or tests)
7 3 10
Difficult decision making: poor influence and lack of evaluations about the implementation of the solutions
8 0 8
Final FMEA framework not suitable for problem solving 2 2 4
Total 17 5 22
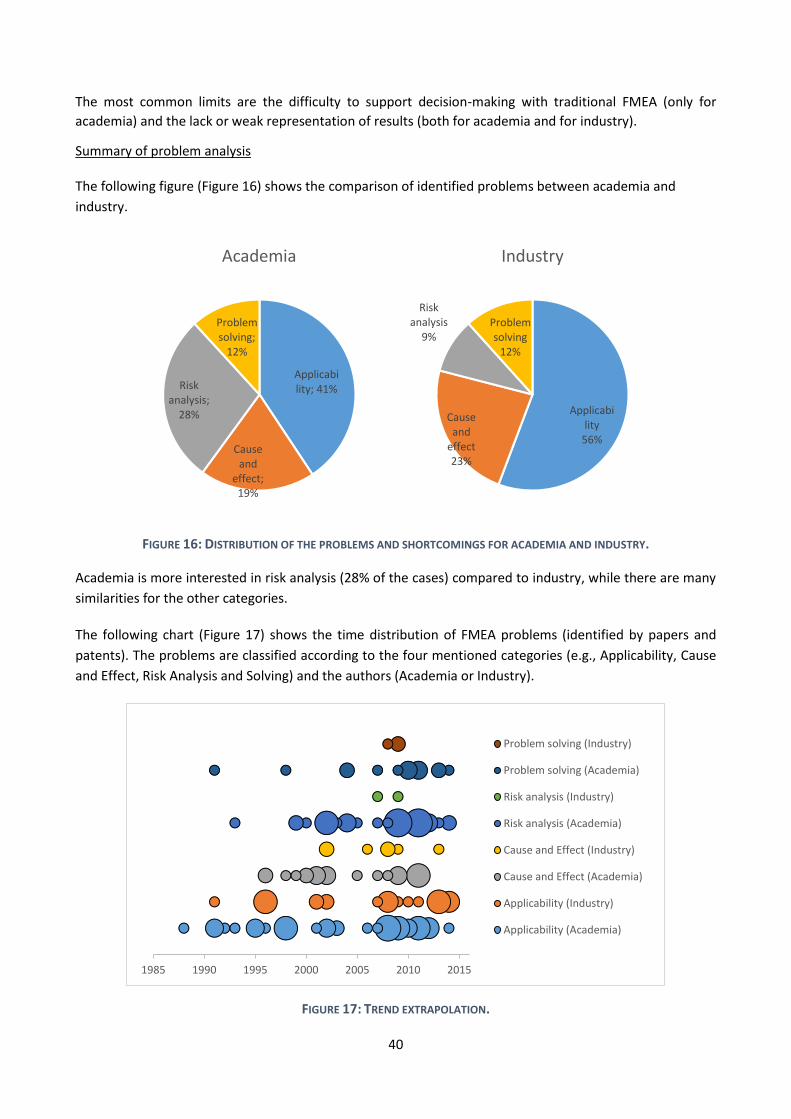
40
The most common limits are the difficulty to support decision-making with traditional FMEA (only for
academia) and the lack or weak representation of results (both for academia and for industry).
Summary of problem analysis
The following figure (Figure 16) shows the comparison of identified problems between academia and
industry.
FIGURE 16: DISTRIBUTION OF THE PROBLEMS AND SHORTCOMINGS FOR ACADEMIA AND INDUSTRY.
Academia is more interested in risk analysis (28% of the cases) compared to industry, while there are many
similarities for the other categories.
The following chart (Figure 17) shows the time distribution of FMEA problems (identified by papers and
patents). The problems are classified according to the four mentioned categories (e.g., Applicability, Cause
and Effect, Risk Analysis and Solving) and the authors (Academia or Industry).
FIGURE 17: TREND EXTRAPOLATION.
Applicability; 41%
Cause and
effect; 19%
Risk analysis;
28%
Problem solving;
12%
Academia
Applicability
56%
Cause and
effect23%
Risk analysis
9%Problem solving
12%
Industry
1985 1990 1995 2000 2005 2010 2015
Problem solving (Industry)
Problem solving (Academia)
Risk analysis (Industry)
Risk analysis (Academia)
Cause and Effect (Industry)
Cause and Effect (Academia)
Applicability (Industry)
Applicability (Academia)
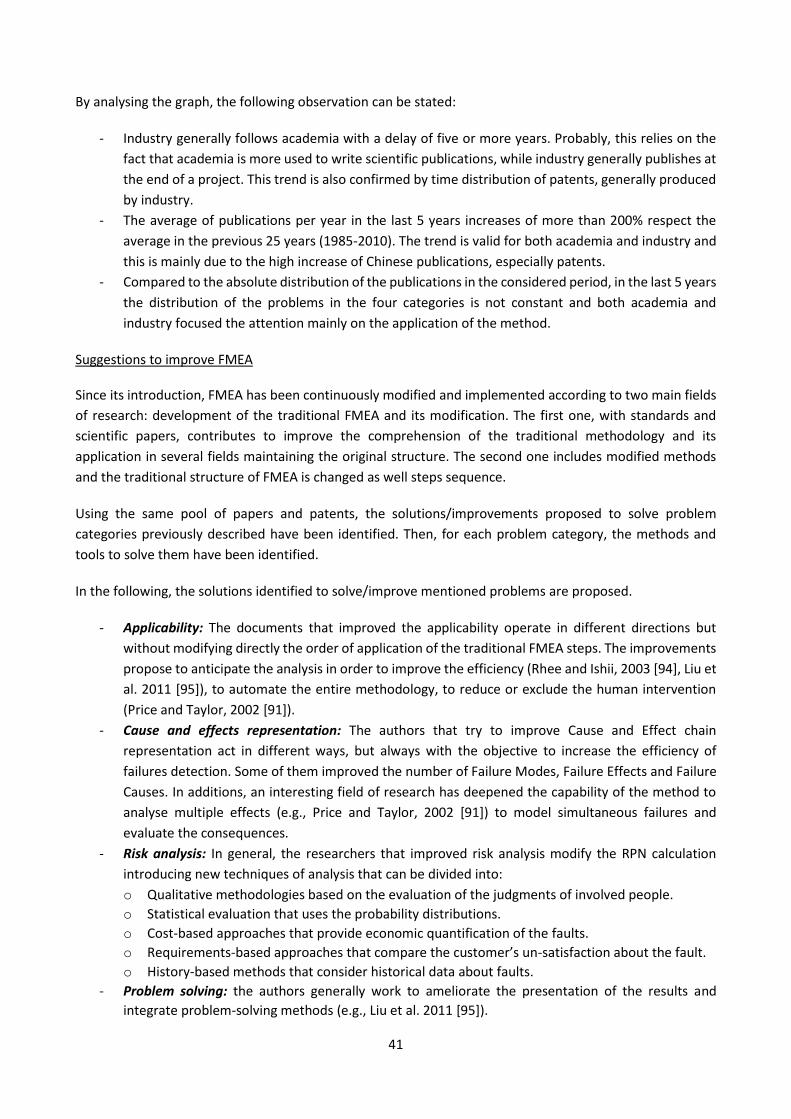
41
By analysing the graph, the following observation can be stated:
- Industry generally follows academia with a delay of five or more years. Probably, this relies on the
fact that academia is more used to write scientific publications, while industry generally publishes at
the end of a project. This trend is also confirmed by time distribution of patents, generally produced
by industry.
- The average of publications per year in the last 5 years increases of more than 200% respect the
average in the previous 25 years (1985-2010). The trend is valid for both academia and industry and
this is mainly due to the high increase of Chinese publications, especially patents.
- Compared to the absolute distribution of the publications in the considered period, in the last 5 years
the distribution of the problems in the four categories is not constant and both academia and
industry focused the attention mainly on the application of the method.
Suggestions to improve FMEA
Since its introduction, FMEA has been continuously modified and implemented according to two main fields
of research: development of the traditional FMEA and its modification. The first one, with standards and
scientific papers, contributes to improve the comprehension of the traditional methodology and its
application in several fields maintaining the original structure. The second one includes modified methods
and the traditional structure of FMEA is changed as well steps sequence.
Using the same pool of papers and patents, the solutions/improvements proposed to solve problem
categories previously described have been identified. Then, for each problem category, the methods and
tools to solve them have been identified.
In the following, the solutions identified to solve/improve mentioned problems are proposed.
- Applicability: The documents that improved the applicability operate in different directions but
without modifying directly the order of application of the traditional FMEA steps. The improvements
propose to anticipate the analysis in order to improve the efficiency (Rhee and Ishii, 2003 [94], Liu et
al. 2011 [95]), to automate the entire methodology, to reduce or exclude the human intervention
(Price and Taylor, 2002 [91]).
- Cause and effects representation: The authors that try to improve Cause and Effect chain
representation act in different ways, but always with the objective to increase the efficiency of
failures detection. Some of them improved the number of Failure Modes, Failure Effects and Failure
Causes. In additions, an interesting field of research has deepened the capability of the method to
analyse multiple effects (e.g., Price and Taylor, 2002 [91]) to model simultaneous failures and
evaluate the consequences.
- Risk analysis: In general, the researchers that improved risk analysis modify the RPN calculation
introducing new techniques of analysis that can be divided into:
o Qualitative methodologies based on the evaluation of the judgments of involved people.
o Statistical evaluation that uses the probability distributions.
o Cost-based approaches that provide economic quantification of the faults.
o Requirements-based approaches that compare the customer’s un-satisfaction about the fault.
o History-based methods that consider historical data about faults.
- Problem solving: the authors generally work to ameliorate the presentation of the results and
integrate problem-solving methods (e.g., Liu et al. 2011 [95]).
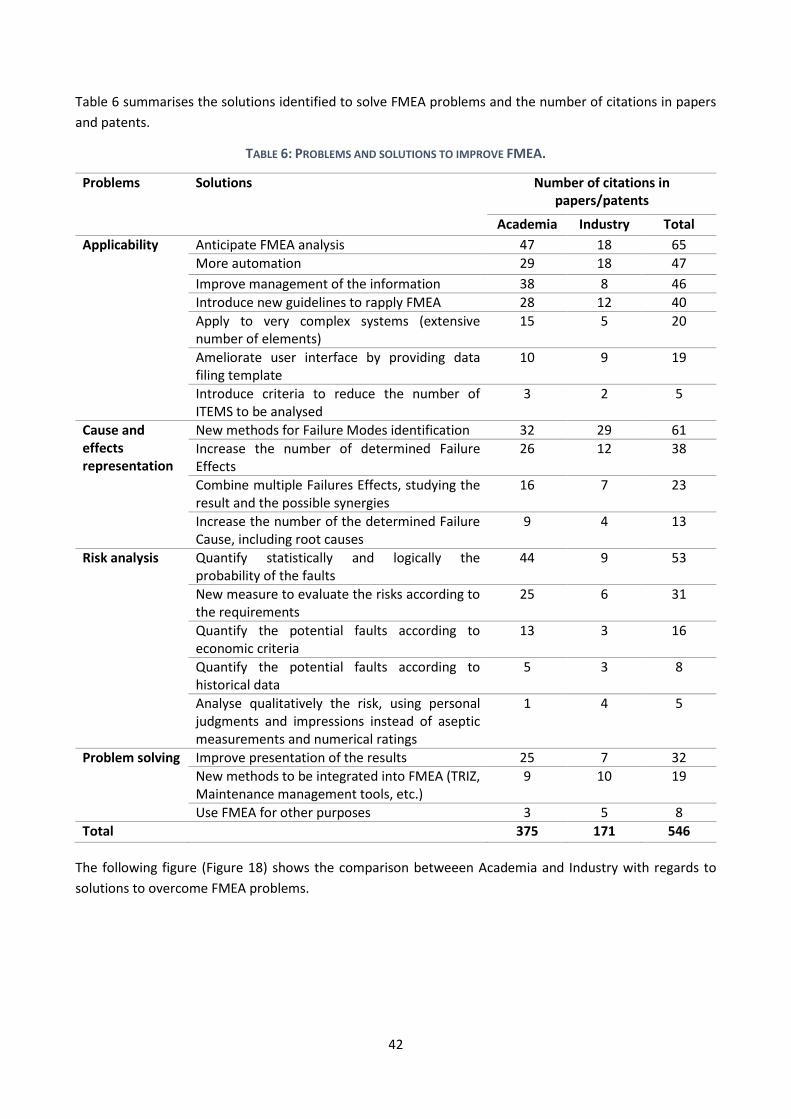
42
Table 6 summarises the solutions identified to solve FMEA problems and the number of citations in papers
and patents.
TABLE 6: PROBLEMS AND SOLUTIONS TO IMPROVE FMEA.
Problems Solutions Number of citations in papers/patents
Academia Industry Total
Applicability Anticipate FMEA analysis 47 18 65
More automation 29 18 47
Improve management of the information 38 8 46
Introduce new guidelines to rapply FMEA 28 12 40
Apply to very complex systems (extensive number of elements)
15 5 20
Ameliorate user interface by providing data filing template
10 9 19
Introduce criteria to reduce the number of ITEMS to be analysed
3 2 5
Cause and effects representation
New methods for Failure Modes identification 32 29 61
Increase the number of determined Failure Effects
26 12 38
Combine multiple Failures Effects, studying the result and the possible synergies
16 7 23
Increase the number of the determined Failure Cause, including root causes
9 4 13
Risk analysis Quantify statistically and logically the probability of the faults
44 9 53
New measure to evaluate the risks according to the requirements
25 6 31
Quantify the potential faults according to economic criteria
13 3 16
Quantify the potential faults according to historical data
5 3 8
Analyse qualitatively the risk, using personal judgments and impressions instead of aseptic measurements and numerical ratings
1 4 5
Problem solving Improve presentation of the results 25 7 32
New methods to be integrated into FMEA (TRIZ, Maintenance management tools, etc.)
9 10 19
Use FMEA for other purposes 3 5 8
Total 375 171 546
The following figure (Figure 18) shows the comparison betweeen Academia and Industry with regards to
solutions to overcome FMEA problems.
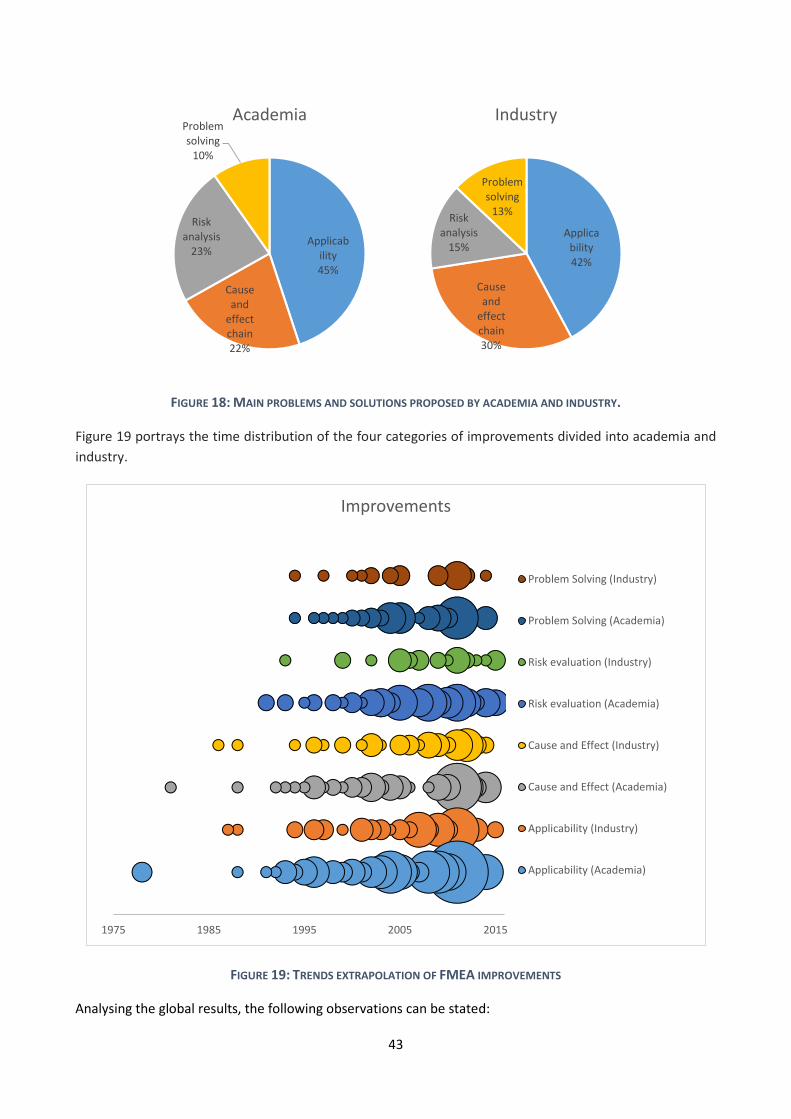
43
FIGURE 18: MAIN PROBLEMS AND SOLUTIONS PROPOSED BY ACADEMIA AND INDUSTRY.
Figure 19 portrays the time distribution of the four categories of improvements divided into academia and
industry.
FIGURE 19: TRENDS EXTRAPOLATION OF FMEA IMPROVEMENTS
Analysing the global results, the following observations can be stated:
Applicability45%
Cause and
effect chain22%
Risk analysis
23%
Problem solving
10%
Academia
Applicability42%
Cause and
effect chain30%
Risk analysis
15%
Problem solving
13%
Industry
1975 1985 1995 2005 2015
Improvements
Problem Solving (Industry)
Problem Solving (Academia)
Risk evaluation (Industry)
Risk evaluation (Academia)
Cause and Effect (Industry)
Cause and Effect (Academia)
Applicability (Industry)
Applicability (Academia)
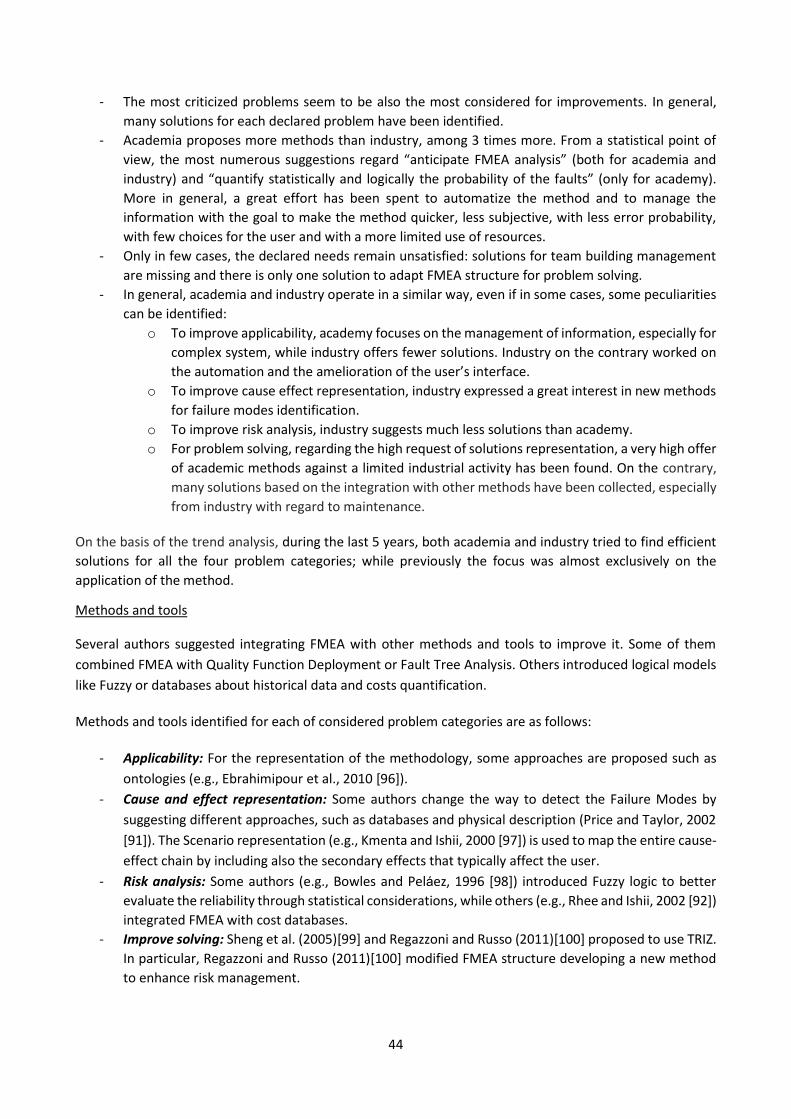
44
- The most criticized problems seem to be also the most considered for improvements. In general,
many solutions for each declared problem have been identified.
- Academia proposes more methods than industry, among 3 times more. From a statistical point of
view, the most numerous suggestions regard “anticipate FMEA analysis” (both for academia and
industry) and “quantify statistically and logically the probability of the faults” (only for academy).
More in general, a great effort has been spent to automatize the method and to manage the
information with the goal to make the method quicker, less subjective, with less error probability,
with few choices for the user and with a more limited use of resources.
- Only in few cases, the declared needs remain unsatisfied: solutions for team building management
are missing and there is only one solution to adapt FMEA structure for problem solving.
- In general, academia and industry operate in a similar way, even if in some cases, some peculiarities
can be identified:
o To improve applicability, academy focuses on the management of information, especially for
complex system, while industry offers fewer solutions. Industry on the contrary worked on
the automation and the amelioration of the user’s interface.
o To improve cause effect representation, industry expressed a great interest in new methods
for failure modes identification.
o To improve risk analysis, industry suggests much less solutions than academy.
o For problem solving, regarding the high request of solutions representation, a very high offer
of academic methods against a limited industrial activity has been found. On the contrary,
many solutions based on the integration with other methods have been collected, especially
from industry with regard to maintenance.
On the basis of the trend analysis, during the last 5 years, both academia and industry tried to find efficient
solutions for all the four problem categories; while previously the focus was almost exclusively on the
application of the method.
Methods and tools
Several authors suggested integrating FMEA with other methods and tools to improve it. Some of them
combined FMEA with Quality Function Deployment or Fault Tree Analysis. Others introduced logical models
like Fuzzy or databases about historical data and costs quantification.
Methods and tools identified for each of considered problem categories are as follows:
- Applicability: For the representation of the methodology, some approaches are proposed such as
ontologies (e.g., Ebrahimipour et al., 2010 [96]).
- Cause and effect representation: Some authors change the way to detect the Failure Modes by
suggesting different approaches, such as databases and physical description (Price and Taylor, 2002
[91]). The Scenario representation (e.g., Kmenta and Ishii, 2000 [97]) is used to map the entire cause-
effect chain by including also the secondary effects that typically affect the user.
- Risk analysis: Some authors (e.g., Bowles and Peláez, 1996 [98]) introduced Fuzzy logic to better
evaluate the reliability through statistical considerations, while others (e.g., Rhee and Ishii, 2002 [92])
integrated FMEA with cost databases.
- Improve solving: Sheng et al. (2005)[99] and Regazzoni and Russo (2011)[100] proposed to use TRIZ.
In particular, Regazzoni and Russo (2011)[100] modified FMEA structure developing a new method
to enhance risk management.
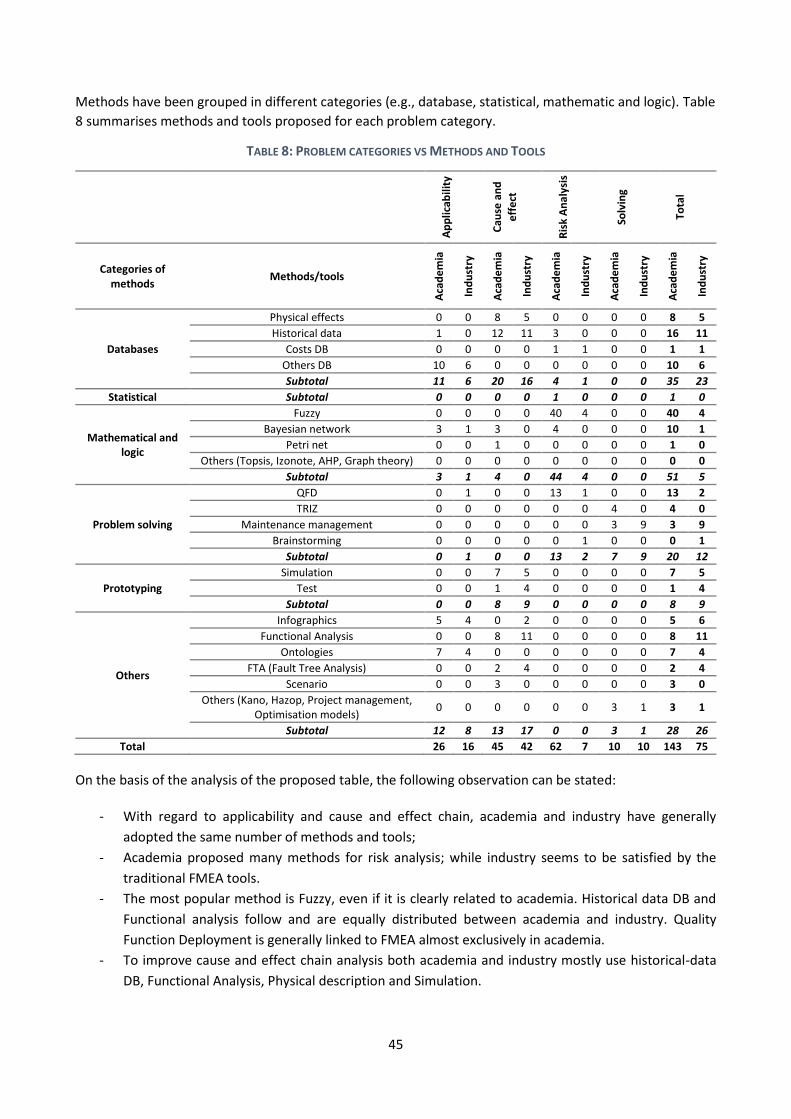
45
Methods have been grouped in different categories (e.g., database, statistical, mathematic and logic). Table
8 summarises methods and tools proposed for each problem category.
TABLE 8: PROBLEM CATEGORIES VS METHODS AND TOOLS
Ap
plic
abili
ty
Cau
se a
nd
eff
ect
Ris
k A
na
lysi
s
Solv
ing
Tota
l
Categories of methods
Methods/tools
Aca
de
mia
Ind
ust
ry
Aca
de
mia
Ind
ust
ry
Aca
de
mia
Ind
ust
ry
Aca
de
mia
Ind
ust
ry
Aca
de
mia
Ind
ust
ry
Databases
Physical effects 0 0 8 5 0 0 0 0 8 5
Historical data 1 0 12 11 3 0 0 0 16 11
Costs DB 0 0 0 0 1 1 0 0 1 1
Others DB 10 6 0 0 0 0 0 0 10 6
Subtotal 11 6 20 16 4 1 0 0 35 23
Statistical Subtotal 0 0 0 0 1 0 0 0 1 0
Mathematical and logic
Fuzzy 0 0 0 0 40 4 0 0 40 4
Bayesian network 3 1 3 0 4 0 0 0 10 1
Petri net 0 0 1 0 0 0 0 0 1 0
Others (Topsis, Izonote, AHP, Graph theory) 0 0 0 0 0 0 0 0 0 0
Subtotal 3 1 4 0 44 4 0 0 51 5
Problem solving
QFD 0 1 0 0 13 1 0 0 13 2
TRIZ 0 0 0 0 0 0 4 0 4 0
Maintenance management 0 0 0 0 0 0 3 9 3 9
Brainstorming 0 0 0 0 0 1 0 0 0 1
Subtotal 0 1 0 0 13 2 7 9 20 12
Prototyping
Simulation 0 0 7 5 0 0 0 0 7 5
Test 0 0 1 4 0 0 0 0 1 4
Subtotal 0 0 8 9 0 0 0 0 8 9
Others
Infographics 5 4 0 2 0 0 0 0 5 6
Functional Analysis 0 0 8 11 0 0 0 0 8 11
Ontologies 7 4 0 0 0 0 0 0 7 4
FTA (Fault Tree Analysis) 0 0 2 4 0 0 0 0 2 4
Scenario 0 0 3 0 0 0 0 0 3 0
Others (Kano, Hazop, Project management, Optimisation models)
0 0 0 0 0 0 3 1 3 1
Subtotal 12 8 13 17 0 0 3 1 28 26
Total 26 16 45 42 62 7 10 10 143 75
On the basis of the analysis of the proposed table, the following observation can be stated:
- With regard to applicability and cause and effect chain, academia and industry have generally
adopted the same number of methods and tools;
- Academia proposed many methods for risk analysis; while industry seems to be satisfied by the
traditional FMEA tools.
- The most popular method is Fuzzy, even if it is clearly related to academia. Historical data DB and
Functional analysis follow and are equally distributed between academia and industry. Quality
Function Deployment is generally linked to FMEA almost exclusively in academia.
- To improve cause and effect chain analysis both academia and industry mostly use historical-data
DB, Functional Analysis, Physical description and Simulation.
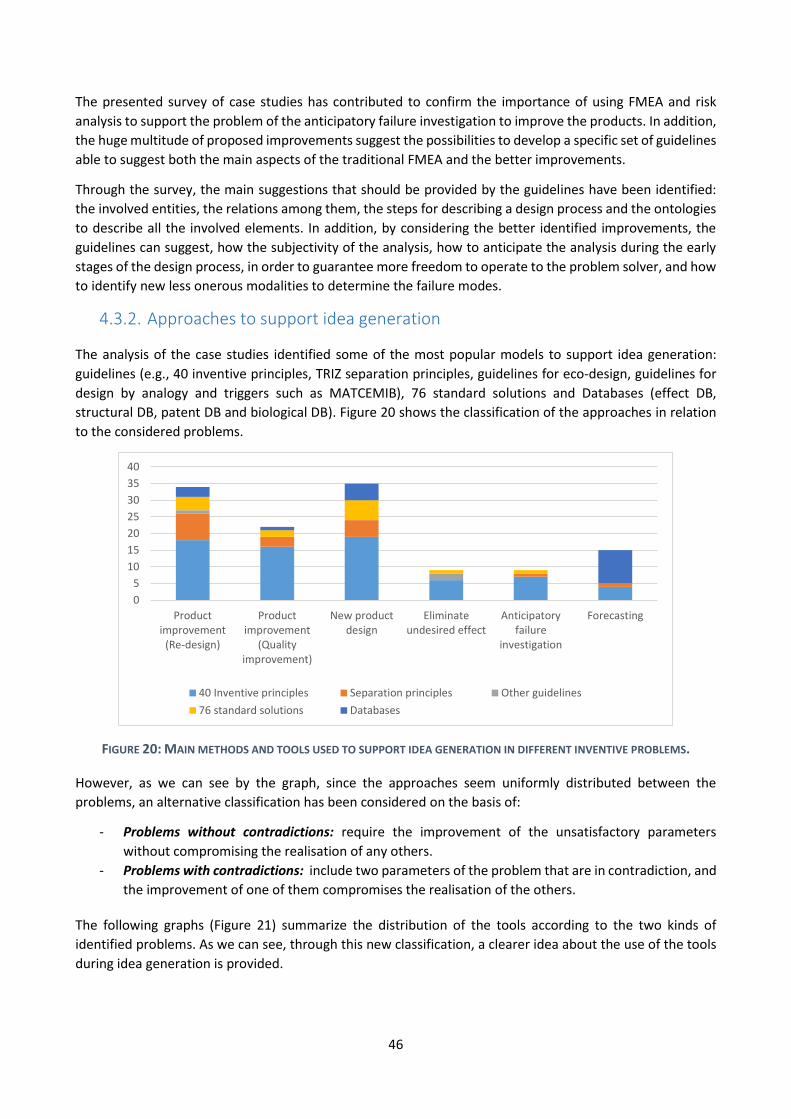
46
The presented survey of case studies has contributed to confirm the importance of using FMEA and risk
analysis to support the problem of the anticipatory failure investigation to improve the products. In addition,
the huge multitude of proposed improvements suggest the possibilities to develop a specific set of guidelines
able to suggest both the main aspects of the traditional FMEA and the better improvements.
Through the survey, the main suggestions that should be provided by the guidelines have been identified:
the involved entities, the relations among them, the steps for describing a design process and the ontologies
to describe all the involved elements. In addition, by considering the better identified improvements, the
guidelines can suggest, how the subjectivity of the analysis, how to anticipate the analysis during the early
stages of the design process, in order to guarantee more freedom to operate to the problem solver, and how
to identify new less onerous modalities to determine the failure modes.
4.3.2. Approaches to support idea generation
The analysis of the case studies identified some of the most popular models to support idea generation:
guidelines (e.g., 40 inventive principles, TRIZ separation principles, guidelines for eco-design, guidelines for
design by analogy and triggers such as MATCEMIB), 76 standard solutions and Databases (effect DB,
structural DB, patent DB and biological DB). Figure 20 shows the classification of the approaches in relation
to the considered problems.
FIGURE 20: MAIN METHODS AND TOOLS USED TO SUPPORT IDEA GENERATION IN DIFFERENT INVENTIVE PROBLEMS.
However, as we can see by the graph, since the approaches seem uniformly distributed between the
problems, an alternative classification has been considered on the basis of:
- Problems without contradictions: require the improvement of the unsatisfactory parameters
without compromising the realisation of any others.
- Problems with contradictions: include two parameters of the problem that are in contradiction, and
the improvement of one of them compromises the realisation of the others.
The following graphs (Figure 21) summarize the distribution of the tools according to the two kinds of
identified problems. As we can see, through this new classification, a clearer idea about the use of the tools
during idea generation is provided.
0
5
10
15
20
25
30
35
40
Productimprovement
(Re-design)
Productimprovement
(Qualityimprovement)
New productdesign
Eliminateundesired effect
Anticipatoryfailure
investigation
Forecasting
40 Inventive principles Separation principles Other guidelines
76 standard solutions Databases

47
FIGURE 21: MAIN METHODS AND TOOLS USED TO SUPPORT IDEA GENERATION IN PROBLEMS WITH AND WITHOUT
CONTRADICTIONS.
In referring to the proposed graphs, 40 inventive principles result the most used tool to support idea
generation in problems with contradictions, followed by the separation principles. 76 standard solutions are
instead exclusively employed in problems without contradictions, where they are the most diffused tool for
the idea generation. This distribution can be attributed to the tools themselves: separation principles are
strictly related to the contradictions; 40 inventive principles can be used in both the contexts even if are more
effective in solving contradictions while 76 standard solutions are generally used to improve positive features
and to reduce/eliminate negative effects not specifically in contractions with other parameters.
In order to provide a more detailed overview about the use of the methods and the tools to enhance idea
generation in the two identified problems, literature analyses and tests are proposed in the following.
Approaches to support idea generation in problems without contradictions
As reported in literature, and confirmed by the presented survey, problems without contradictions are
generally supported by suggestions (e.g., 76 standard solutions), triggers (e.g., SCAMPER and MATCEMIB)
and other more specific guidelines (e.g., eco-design). To discriminate these approaches, two sub-problems
have been investigated: un-domain problems and specific domain problems.
Un-domain problems
A test proposed by Belski et al. (2015)[101] to engineering students in different universities around the world,
and replicated at the University of Bergamo, investigated the role of guidelines and triggers in supporting
idea generation for generic un-domain problems (e.g., “Eliminate the lime from the pipes”), which not require
a particular domain knowledge to be solved in an inventive way.
During the tests, the students were divided into 4 groups and they used different approaches to solve the
same assigned problems in the same time (16 minutes for each problem). The organisation of the rest is as
follow:
- Group A (Control group): no suggestion;
- Group B: 8 random words;
- Group C: the 8 suggestions of the field of MATCEMIB (Mechanical, Acoustic, Thermal, Chemical,
Electrical, Magnetic, Intermolecular and Biological);
- Group D: MATCEMIB+: a more extended MATCEMIB classification, called MATCEMIB+ (Belski et al.
2007 [55]) involving more than 50 terms divided into the 8 fields of MATCEMIB classification.
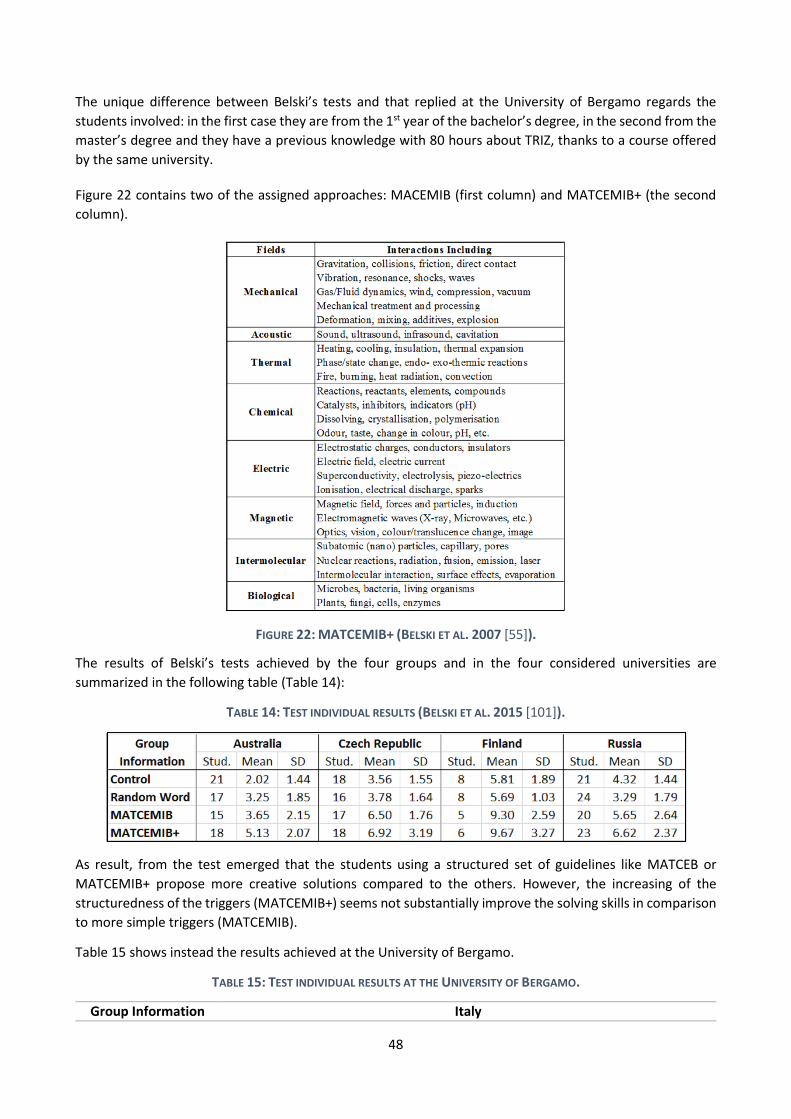
48
The unique difference between Belski’s tests and that replied at the University of Bergamo regards the
students involved: in the first case they are from the 1st year of the bachelor’s degree, in the second from the
master’s degree and they have a previous knowledge with 80 hours about TRIZ, thanks to a course offered
by the same university.
Figure 22 contains two of the assigned approaches: MACEMIB (first column) and MATCEMIB+ (the second
column).
FIGURE 22: MATCEMIB+ (BELSKI ET AL. 2007 [55]).
The results of Belski’s tests achieved by the four groups and in the four considered universities are
summarized in the following table (Table 14):
TABLE 14: TEST INDIVIDUAL RESULTS (BELSKI ET AL. 2015 [101]).
As result, from the test emerged that the students using a structured set of guidelines like MATCEB or
MATCEMIB+ propose more creative solutions compared to the others. However, the increasing of the
structuredness of the triggers (MATCEMIB+) seems not substantially improve the solving skills in comparison
to more simple triggers (MATCEMIB).
Table 15 shows instead the results achieved at the University of Bergamo.
TABLE 15: TEST INDIVIDUAL RESULTS AT THE UNIVERSITY OF BERGAMO.
Group Information Italy
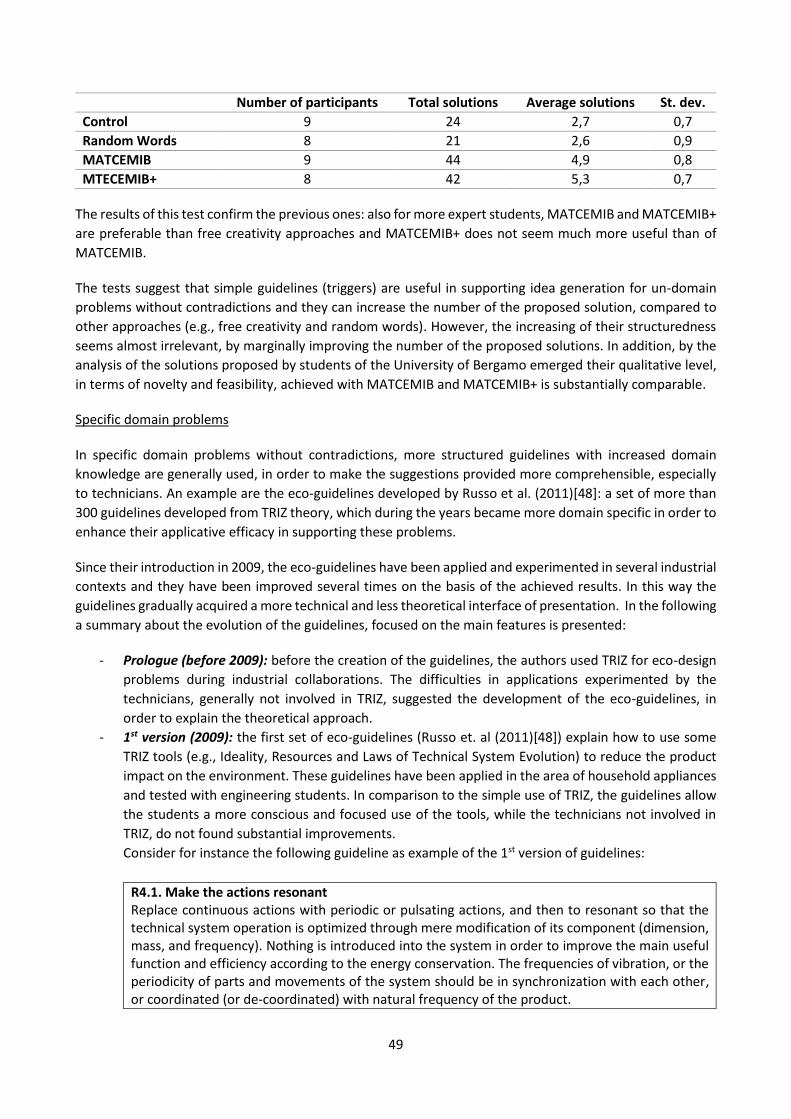
49
Number of participants Total solutions Average solutions St. dev.
Control 9 24 2,7 0,7
Random Words 8 21 2,6 0,9
MATCEMIB 9 44 4,9 0,8
MTECEMIB+ 8 42 5,3 0,7
The results of this test confirm the previous ones: also for more expert students, MATCEMIB and MATCEMIB+
are preferable than free creativity approaches and MATCEMIB+ does not seem much more useful than of
MATCEMIB.
The tests suggest that simple guidelines (triggers) are useful in supporting idea generation for un-domain
problems without contradictions and they can increase the number of the proposed solution, compared to
other approaches (e.g., free creativity and random words). However, the increasing of their structuredness
seems almost irrelevant, by marginally improving the number of the proposed solutions. In addition, by the
analysis of the solutions proposed by students of the University of Bergamo emerged their qualitative level,
in terms of novelty and feasibility, achieved with MATCEMIB and MATCEMIB+ is substantially comparable.
Specific domain problems
In specific domain problems without contradictions, more structured guidelines with increased domain
knowledge are generally used, in order to make the suggestions provided more comprehensible, especially
to technicians. An example are the eco-guidelines developed by Russo et al. (2011)[48]: a set of more than
300 guidelines developed from TRIZ theory, which during the years became more domain specific in order to
enhance their applicative efficacy in supporting these problems.
Since their introduction in 2009, the eco-guidelines have been applied and experimented in several industrial
contexts and they have been improved several times on the basis of the achieved results. In this way the
guidelines gradually acquired a more technical and less theoretical interface of presentation. In the following
a summary about the evolution of the guidelines, focused on the main features is presented:
- Prologue (before 2009): before the creation of the guidelines, the authors used TRIZ for eco-design
problems during industrial collaborations. The difficulties in applications experimented by the
technicians, generally not involved in TRIZ, suggested the development of the eco-guidelines, in
order to explain the theoretical approach.
- 1st version (2009): the first set of eco-guidelines (Russo et. al (2011)[48]) explain how to use some
TRIZ tools (e.g., Ideality, Resources and Laws of Technical System Evolution) to reduce the product
impact on the environment. These guidelines have been applied in the area of household appliances
and tested with engineering students. In comparison to the simple use of TRIZ, the guidelines allow
the students a more conscious and focused use of the tools, while the technicians not involved in
TRIZ, do not found substantial improvements.
Consider for instance the following guideline as example of the 1st version of guidelines:
R4.1. Make the actions resonant Replace continuous actions with periodic or pulsating actions, and then to resonant so that the technical system operation is optimized through mere modification of its component (dimension, mass, and frequency). Nothing is introduced into the system in order to improve the main useful function and efficiency according to the energy conservation. The frequencies of vibration, or the periodicity of parts and movements of the system should be in synchronization with each other, or coordinated (or de-coordinated) with natural frequency of the product.
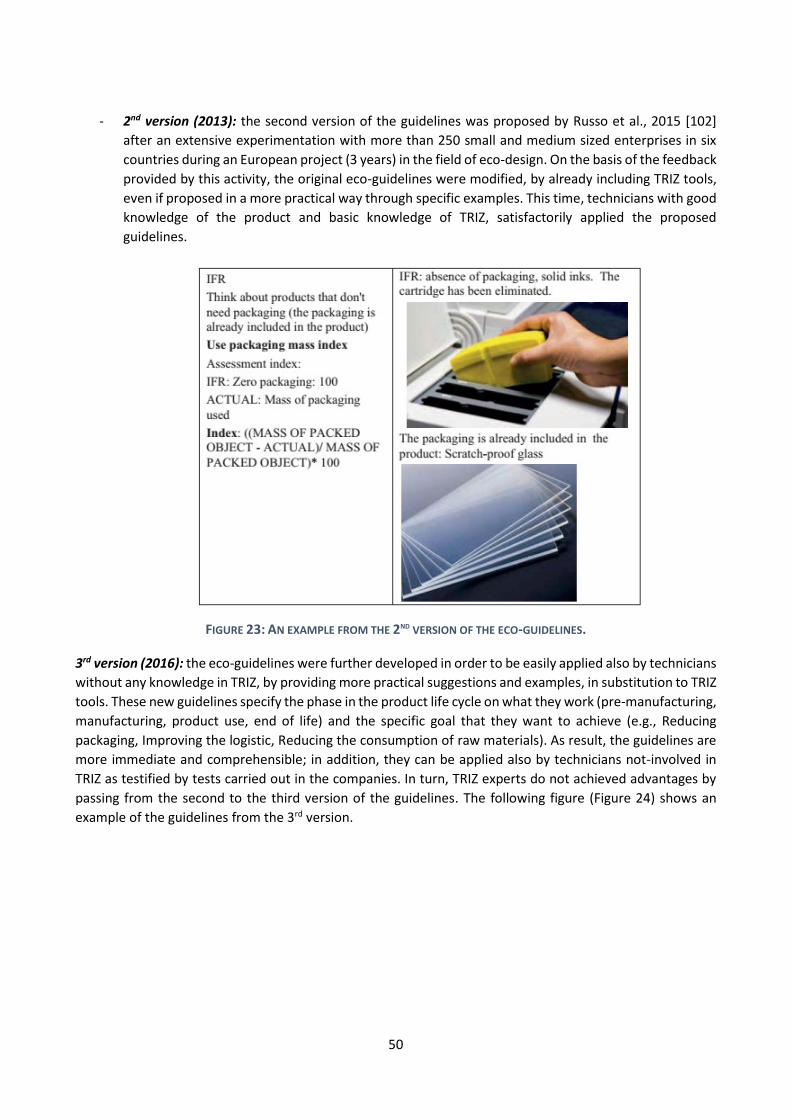
50
- 2nd version (2013): the second version of the guidelines was proposed by Russo et al., 2015 [102]
after an extensive experimentation with more than 250 small and medium sized enterprises in six
countries during an European project (3 years) in the field of eco-design. On the basis of the feedback
provided by this activity, the original eco-guidelines were modified, by already including TRIZ tools,
even if proposed in a more practical way through specific examples. This time, technicians with good
knowledge of the product and basic knowledge of TRIZ, satisfactorily applied the proposed
guidelines.
FIGURE 23: AN EXAMPLE FROM THE 2ND VERSION OF THE ECO-GUIDELINES.
3rd version (2016): the eco-guidelines were further developed in order to be easily applied also by technicians
without any knowledge in TRIZ, by providing more practical suggestions and examples, in substitution to TRIZ
tools. These new guidelines specify the phase in the product life cycle on what they work (pre-manufacturing,
manufacturing, product use, end of life) and the specific goal that they want to achieve (e.g., Reducing
packaging, Improving the logistic, Reducing the consumption of raw materials). As result, the guidelines are
more immediate and comprehensible; in addition, they can be applied also by technicians not-involved in
TRIZ as testified by tests carried out in the companies. In turn, TRIZ experts do not achieved advantages by
passing from the second to the third version of the guidelines. The following figure (Figure 24) shows an
example of the guidelines from the 3rd version.
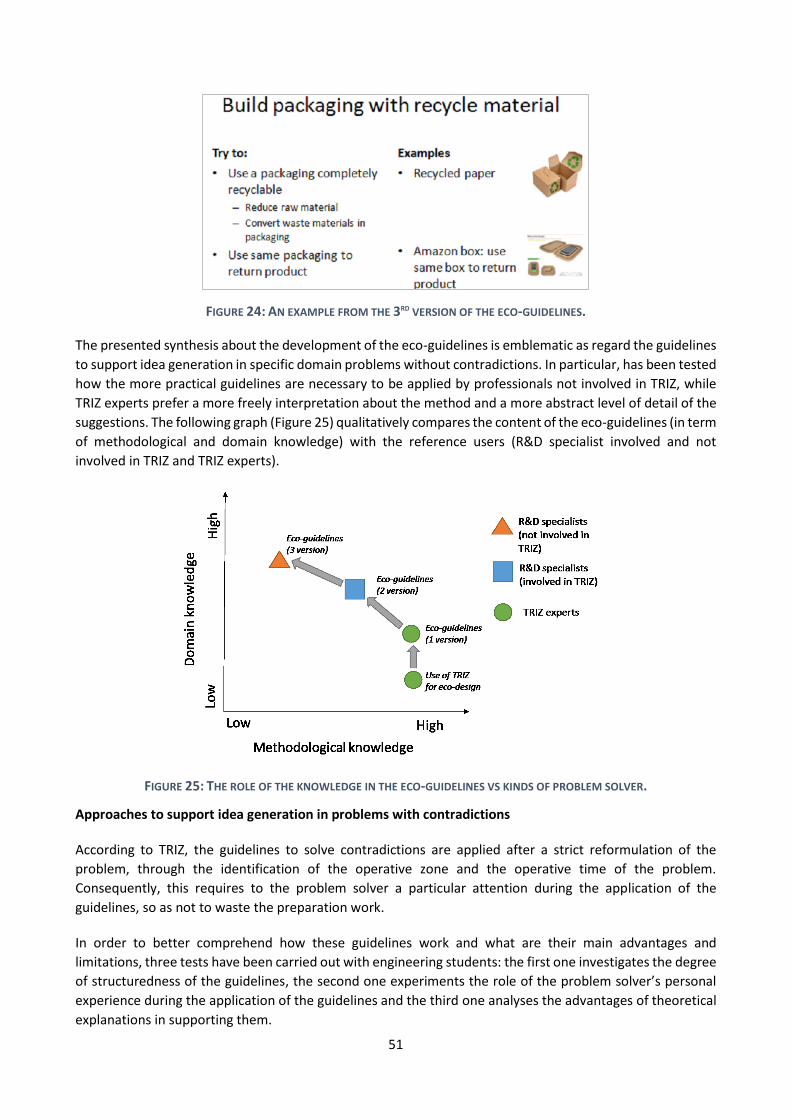
51
FIGURE 24: AN EXAMPLE FROM THE 3RD VERSION OF THE ECO-GUIDELINES.
The presented synthesis about the development of the eco-guidelines is emblematic as regard the guidelines
to support idea generation in specific domain problems without contradictions. In particular, has been tested
how the more practical guidelines are necessary to be applied by professionals not involved in TRIZ, while
TRIZ experts prefer a more freely interpretation about the method and a more abstract level of detail of the
suggestions. The following graph (Figure 25) qualitatively compares the content of the eco-guidelines (in term
of methodological and domain knowledge) with the reference users (R&D specialist involved and not
involved in TRIZ and TRIZ experts).
FIGURE 25: THE ROLE OF THE KNOWLEDGE IN THE ECO-GUIDELINES VS KINDS OF PROBLEM SOLVER.
Approaches to support idea generation in problems with contradictions
According to TRIZ, the guidelines to solve contradictions are applied after a strict reformulation of the
problem, through the identification of the operative zone and the operative time of the problem.
Consequently, this requires to the problem solver a particular attention during the application of the
guidelines, so as not to waste the preparation work.
In order to better comprehend how these guidelines work and what are their main advantages and
limitations, three tests have been carried out with engineering students: the first one investigates the degree
of structuredness of the guidelines, the second one experiments the role of the problem solver’s personal
experience during the application of the guidelines and the third one analyses the advantages of theoretical
explanations in supporting them.
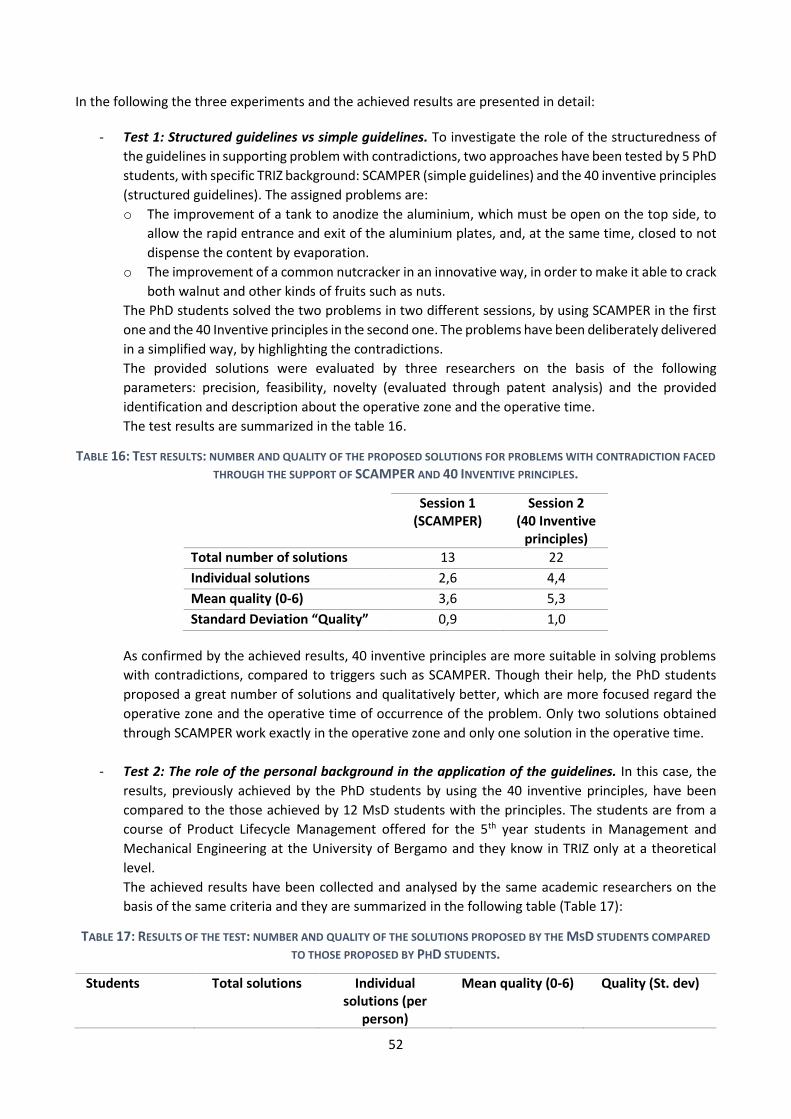
52
In the following the three experiments and the achieved results are presented in detail:
- Test 1: Structured guidelines vs simple guidelines. To investigate the role of the structuredness of
the guidelines in supporting problem with contradictions, two approaches have been tested by 5 PhD
students, with specific TRIZ background: SCAMPER (simple guidelines) and the 40 inventive principles
(structured guidelines). The assigned problems are:
o The improvement of a tank to anodize the aluminium, which must be open on the top side, to
allow the rapid entrance and exit of the aluminium plates, and, at the same time, closed to not
dispense the content by evaporation.
o The improvement of a common nutcracker in an innovative way, in order to make it able to crack
both walnut and other kinds of fruits such as nuts.
The PhD students solved the two problems in two different sessions, by using SCAMPER in the first
one and the 40 Inventive principles in the second one. The problems have been deliberately delivered
in a simplified way, by highlighting the contradictions.
The provided solutions were evaluated by three researchers on the basis of the following
parameters: precision, feasibility, novelty (evaluated through patent analysis) and the provided
identification and description about the operative zone and the operative time.
The test results are summarized in the table 16.
TABLE 16: TEST RESULTS: NUMBER AND QUALITY OF THE PROPOSED SOLUTIONS FOR PROBLEMS WITH CONTRADICTION FACED
THROUGH THE SUPPORT OF SCAMPER AND 40 INVENTIVE PRINCIPLES.
Session 1 (SCAMPER)
Session 2 (40 Inventive
principles)
Total number of solutions 13 22
Individual solutions 2,6 4,4
Mean quality (0-6) 3,6 5,3
Standard Deviation “Quality” 0,9 1,0
As confirmed by the achieved results, 40 inventive principles are more suitable in solving problems
with contradictions, compared to triggers such as SCAMPER. Though their help, the PhD students
proposed a great number of solutions and qualitatively better, which are more focused regard the
operative zone and the operative time of occurrence of the problem. Only two solutions obtained
through SCAMPER work exactly in the operative zone and only one solution in the operative time.
- Test 2: The role of the personal background in the application of the guidelines. In this case, the
results, previously achieved by the PhD students by using the 40 inventive principles, have been
compared to the those achieved by 12 MsD students with the principles. The students are from a
course of Product Lifecycle Management offered for the 5th year students in Management and
Mechanical Engineering at the University of Bergamo and they know in TRIZ only at a theoretical
level.
The achieved results have been collected and analysed by the same academic researchers on the
basis of the same criteria and they are summarized in the following table (Table 17):
TABLE 17: RESULTS OF THE TEST: NUMBER AND QUALITY OF THE SOLUTIONS PROPOSED BY THE MSD STUDENTS COMPARED
TO THOSE PROPOSED BY PHD STUDENTS.
Students Total solutions Individual solutions (per
person)
Mean quality (0-6) Quality (St. dev)
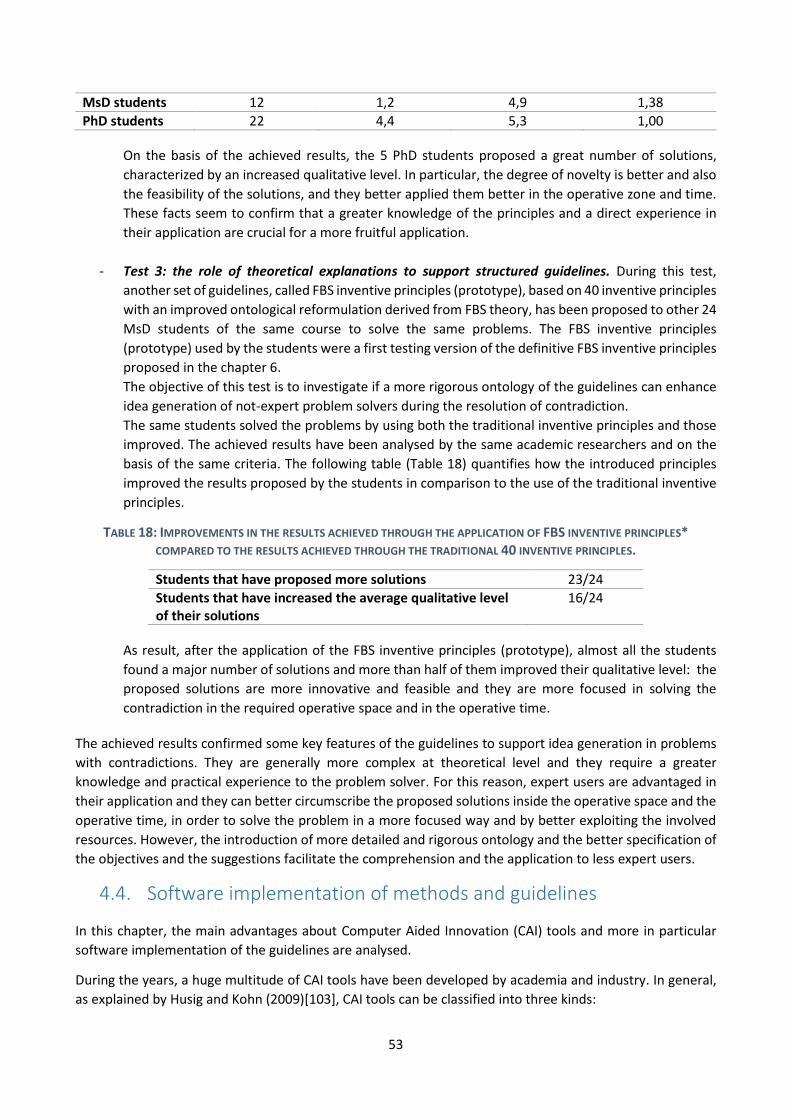
53
MsD students 12 1,2 4,9 1,38
PhD students 22 4,4 5,3 1,00
On the basis of the achieved results, the 5 PhD students proposed a great number of solutions,
characterized by an increased qualitative level. In particular, the degree of novelty is better and also
the feasibility of the solutions, and they better applied them better in the operative zone and time.
These facts seem to confirm that a greater knowledge of the principles and a direct experience in
their application are crucial for a more fruitful application.
- Test 3: the role of theoretical explanations to support structured guidelines. During this test,
another set of guidelines, called FBS inventive principles (prototype), based on 40 inventive principles
with an improved ontological reformulation derived from FBS theory, has been proposed to other 24
MsD students of the same course to solve the same problems. The FBS inventive principles
(prototype) used by the students were a first testing version of the definitive FBS inventive principles
proposed in the chapter 6.
The objective of this test is to investigate if a more rigorous ontology of the guidelines can enhance
idea generation of not-expert problem solvers during the resolution of contradiction.
The same students solved the problems by using both the traditional inventive principles and those
improved. The achieved results have been analysed by the same academic researchers and on the
basis of the same criteria. The following table (Table 18) quantifies how the introduced principles
improved the results proposed by the students in comparison to the use of the traditional inventive
principles.
TABLE 18: IMPROVEMENTS IN THE RESULTS ACHIEVED THROUGH THE APPLICATION OF FBS INVENTIVE PRINCIPLES*
COMPARED TO THE RESULTS ACHIEVED THROUGH THE TRADITIONAL 40 INVENTIVE PRINCIPLES.
Students that have proposed more solutions 23/24
Students that have increased the average qualitative level of their solutions
16/24
As result, after the application of the FBS inventive principles (prototype), almost all the students
found a major number of solutions and more than half of them improved their qualitative level: the
proposed solutions are more innovative and feasible and they are more focused in solving the
contradiction in the required operative space and in the operative time.
The achieved results confirmed some key features of the guidelines to support idea generation in problems
with contradictions. They are generally more complex at theoretical level and they require a greater
knowledge and practical experience to the problem solver. For this reason, expert users are advantaged in
their application and they can better circumscribe the proposed solutions inside the operative space and the
operative time, in order to solve the problem in a more focused way and by better exploiting the involved
resources. However, the introduction of more detailed and rigorous ontology and the better specification of
the objectives and the suggestions facilitate the comprehension and the application to less expert users.
4.4. Software implementation of methods and guidelines
In this chapter, the main advantages about Computer Aided Innovation (CAI) tools and more in particular
software implementation of the guidelines are analysed.
During the years, a huge multitude of CAI tools have been developed by academia and industry. In general,
as explained by Husig and Kohn (2009)[103], CAI tools can be classified into three kinds:
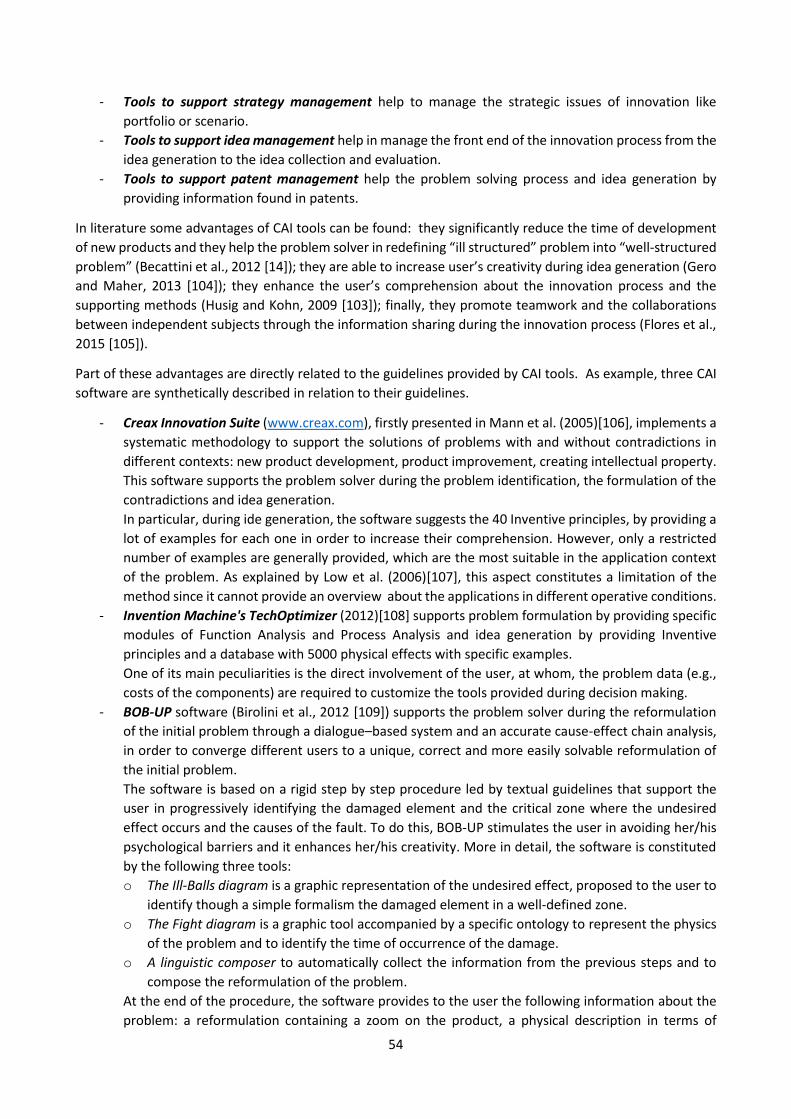
54
- Tools to support strategy management help to manage the strategic issues of innovation like
portfolio or scenario.
- Tools to support idea management help in manage the front end of the innovation process from the
idea generation to the idea collection and evaluation.
- Tools to support patent management help the problem solving process and idea generation by
providing information found in patents.
In literature some advantages of CAI tools can be found: they significantly reduce the time of development
of new products and they help the problem solver in redefining “ill structured” problem into “well-structured
problem” (Becattini et al., 2012 [14]); they are able to increase user’s creativity during idea generation (Gero
and Maher, 2013 [104]); they enhance the user’s comprehension about the innovation process and the
supporting methods (Husig and Kohn, 2009 [103]); finally, they promote teamwork and the collaborations
between independent subjects through the information sharing during the innovation process (Flores et al.,
2015 [105]).
Part of these advantages are directly related to the guidelines provided by CAI tools. As example, three CAI
software are synthetically described in relation to their guidelines.
- Creax Innovation Suite (www.creax.com), firstly presented in Mann et al. (2005)[106], implements a
systematic methodology to support the solutions of problems with and without contradictions in
different contexts: new product development, product improvement, creating intellectual property.
This software supports the problem solver during the problem identification, the formulation of the
contradictions and idea generation.
In particular, during ide generation, the software suggests the 40 Inventive principles, by providing a
lot of examples for each one in order to increase their comprehension. However, only a restricted
number of examples are generally provided, which are the most suitable in the application context
of the problem. As explained by Low et al. (2006)[107], this aspect constitutes a limitation of the
method since it cannot provide an overview about the applications in different operative conditions.
- Invention Machine's TechOptimizer (2012)[108] supports problem formulation by providing specific
modules of Function Analysis and Process Analysis and idea generation by providing Inventive
principles and a database with 5000 physical effects with specific examples.
One of its main peculiarities is the direct involvement of the user, at whom, the problem data (e.g.,
costs of the components) are required to customize the tools provided during decision making.
- BOB-UP software (Birolini et al., 2012 [109]) supports the problem solver during the reformulation
of the initial problem through a dialogue–based system and an accurate cause-effect chain analysis,
in order to converge different users to a unique, correct and more easily solvable reformulation of
the initial problem.
The software is based on a rigid step by step procedure led by textual guidelines that support the
user in progressively identifying the damaged element and the critical zone where the undesired
effect occurs and the causes of the fault. To do this, BOB-UP stimulates the user in avoiding her/his
psychological barriers and it enhances her/his creativity. More in detail, the software is constituted
by the following three tools:
o The Ill-Balls diagram is a graphic representation of the undesired effect, proposed to the user to
identify though a simple formalism the damaged element in a well-defined zone.
o The Fight diagram is a graphic tool accompanied by a specific ontology to represent the physics
of the problem and to identify the time of occurrence of the damage.
o A linguistic composer to automatically collect the information from the previous steps and to
compose the reformulation of the problem.
At the end of the procedure, the software provides to the user the following information about the
problem: a reformulation containing a zoom on the product, a physical description in terms of
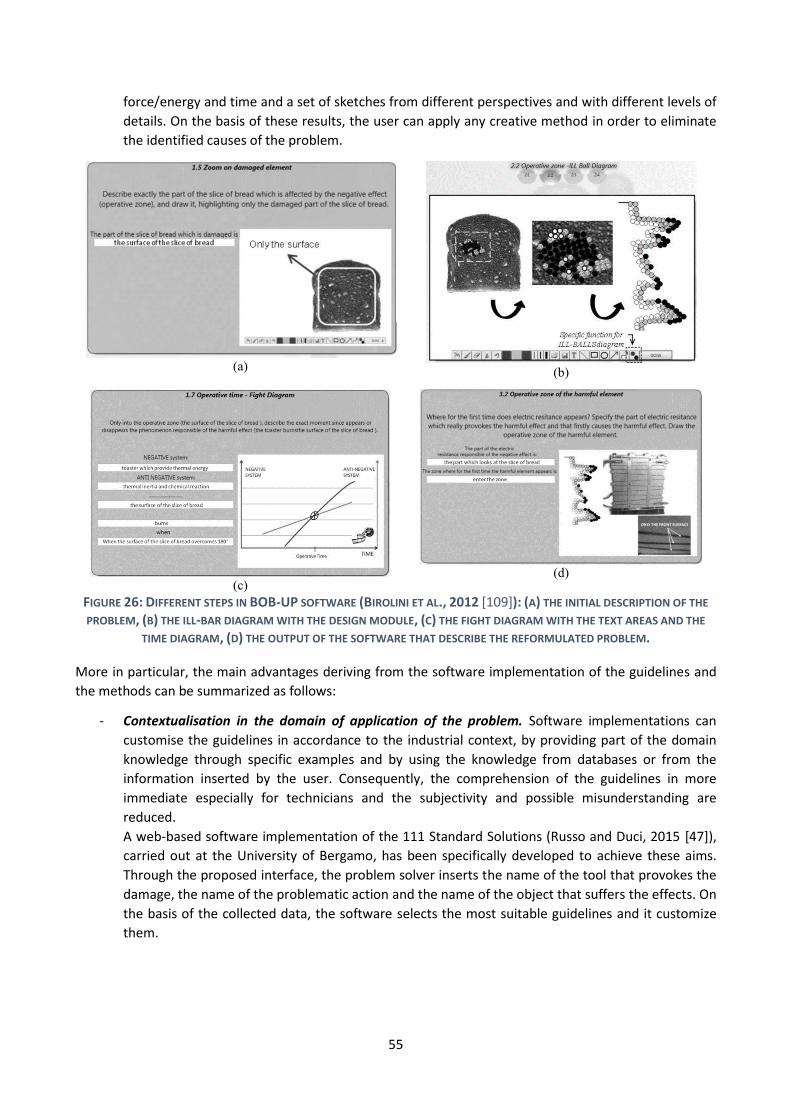
55
force/energy and time and a set of sketches from different perspectives and with different levels of
details. On the basis of these results, the user can apply any creative method in order to eliminate
the identified causes of the problem.
(a)
(b)
(c)
(d)
FIGURE 26: DIFFERENT STEPS IN BOB-UP SOFTWARE (BIROLINI ET AL., 2012 [109]): (A) THE INITIAL DESCRIPTION OF THE
PROBLEM, (B) THE ILL-BAR DIAGRAM WITH THE DESIGN MODULE, (C) THE FIGHT DIAGRAM WITH THE TEXT AREAS AND THE
TIME DIAGRAM, (D) THE OUTPUT OF THE SOFTWARE THAT DESCRIBE THE REFORMULATED PROBLEM.
More in particular, the main advantages deriving from the software implementation of the guidelines and
the methods can be summarized as follows:
- Contextualisation in the domain of application of the problem. Software implementations can
customise the guidelines in accordance to the industrial context, by providing part of the domain
knowledge through specific examples and by using the knowledge from databases or from the
information inserted by the user. Consequently, the comprehension of the guidelines in more
immediate especially for technicians and the subjectivity and possible misunderstanding are
reduced.
A web-based software implementation of the 111 Standard Solutions (Russo and Duci, 2015 [47]),
carried out at the University of Bergamo, has been specifically developed to achieve these aims.
Through the proposed interface, the problem solver inserts the name of the tool that provokes the
damage, the name of the problematic action and the name of the object that suffers the effects. On
the basis of the collected data, the software selects the most suitable guidelines and it customize
them.
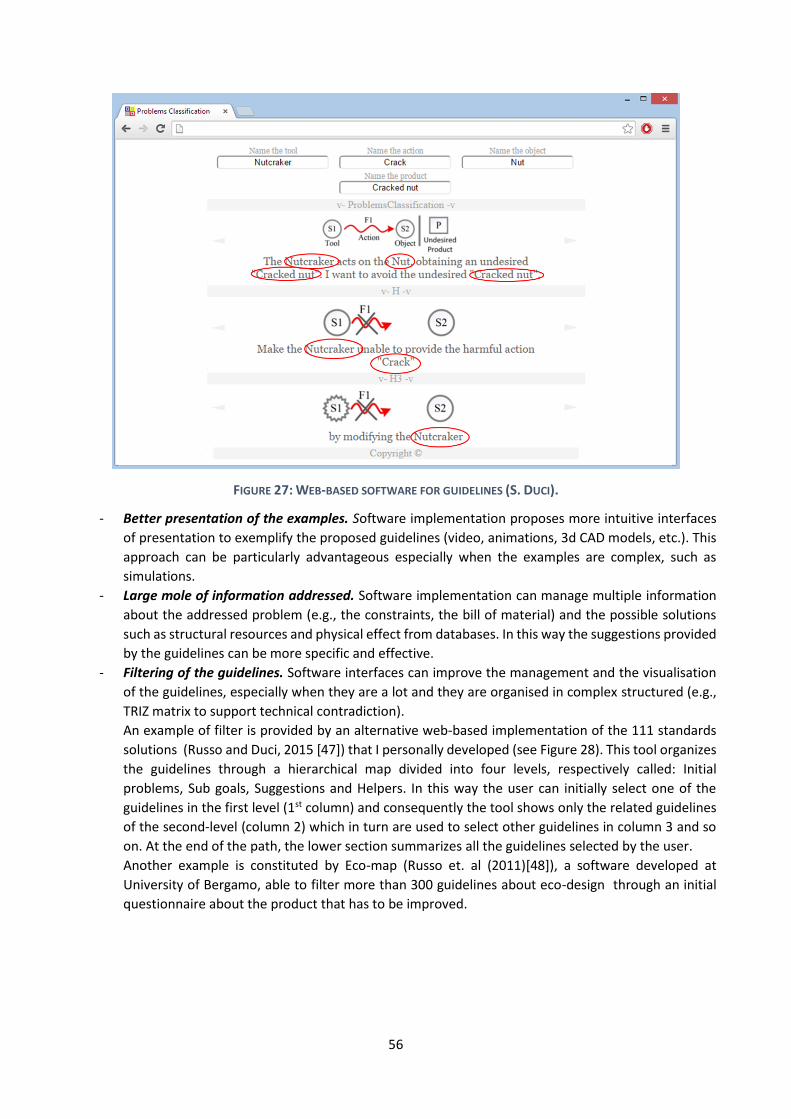
56
FIGURE 27: WEB-BASED SOFTWARE FOR GUIDELINES (S. DUCI).
- Better presentation of the examples. Software implementation proposes more intuitive interfaces
of presentation to exemplify the proposed guidelines (video, animations, 3d CAD models, etc.). This
approach can be particularly advantageous especially when the examples are complex, such as
simulations.
- Large mole of information addressed. Software implementation can manage multiple information
about the addressed problem (e.g., the constraints, the bill of material) and the possible solutions
such as structural resources and physical effect from databases. In this way the suggestions provided
by the guidelines can be more specific and effective.
- Filtering of the guidelines. Software interfaces can improve the management and the visualisation
of the guidelines, especially when they are a lot and they are organised in complex structured (e.g.,
TRIZ matrix to support technical contradiction).
An example of filter is provided by an alternative web-based implementation of the 111 standards
solutions (Russo and Duci, 2015 [47]) that I personally developed (see Figure 28). This tool organizes
the guidelines through a hierarchical map divided into four levels, respectively called: Initial
problems, Sub goals, Suggestions and Helpers. In this way the user can initially select one of the
guidelines in the first level (1st column) and consequently the tool shows only the related guidelines
of the second-level (column 2) which in turn are used to select other guidelines in column 3 and so
on. At the end of the path, the lower section summarizes all the guidelines selected by the user.
Another example is constituted by Eco-map (Russo et. al (2011)[48]), a software developed at
University of Bergamo, able to filter more than 300 guidelines about eco-design through an initial
questionnaire about the product that has to be improved.
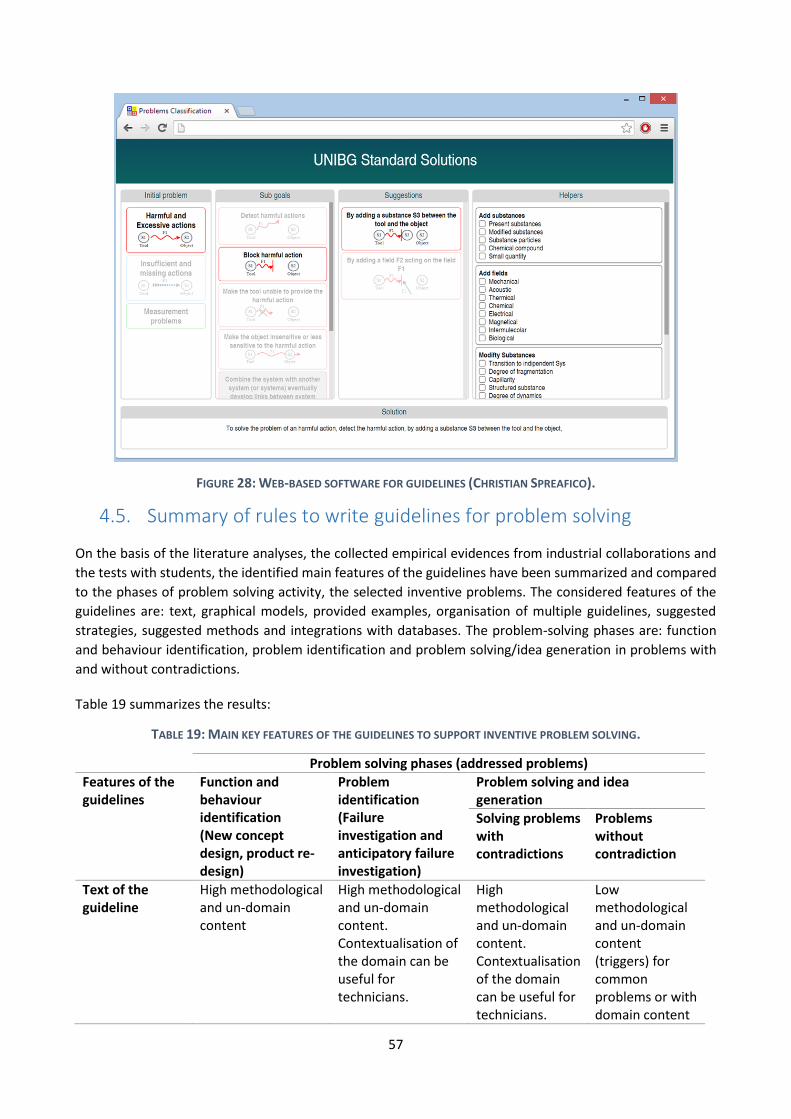
57
FIGURE 28: WEB-BASED SOFTWARE FOR GUIDELINES (CHRISTIAN SPREAFICO).
4.5. Summary of rules to write guidelines for problem solving
On the basis of the literature analyses, the collected empirical evidences from industrial collaborations and
the tests with students, the identified main features of the guidelines have been summarized and compared
to the phases of problem solving activity, the selected inventive problems. The considered features of the
guidelines are: text, graphical models, provided examples, organisation of multiple guidelines, suggested
strategies, suggested methods and integrations with databases. The problem-solving phases are: function
and behaviour identification, problem identification and problem solving/idea generation in problems with
and without contradictions.
Table 19 summarizes the results:
TABLE 19: MAIN KEY FEATURES OF THE GUIDELINES TO SUPPORT INVENTIVE PROBLEM SOLVING.
Problem solving phases (addressed problems)
Features of the guidelines
Function and behaviour identification (New concept design, product re-design)
Problem identification (Failure investigation and anticipatory failure investigation)
Problem solving and idea generation
Solving problems with contradictions
Problems without contradiction
Text of the guideline
High methodological and un-domain content
High methodological and un-domain content. Contextualisation of the domain can be useful for technicians.
High methodological and un-domain content. Contextualisation of the domain can be useful for technicians.
Low methodological and un-domain content (triggers) for common problems or with domain content
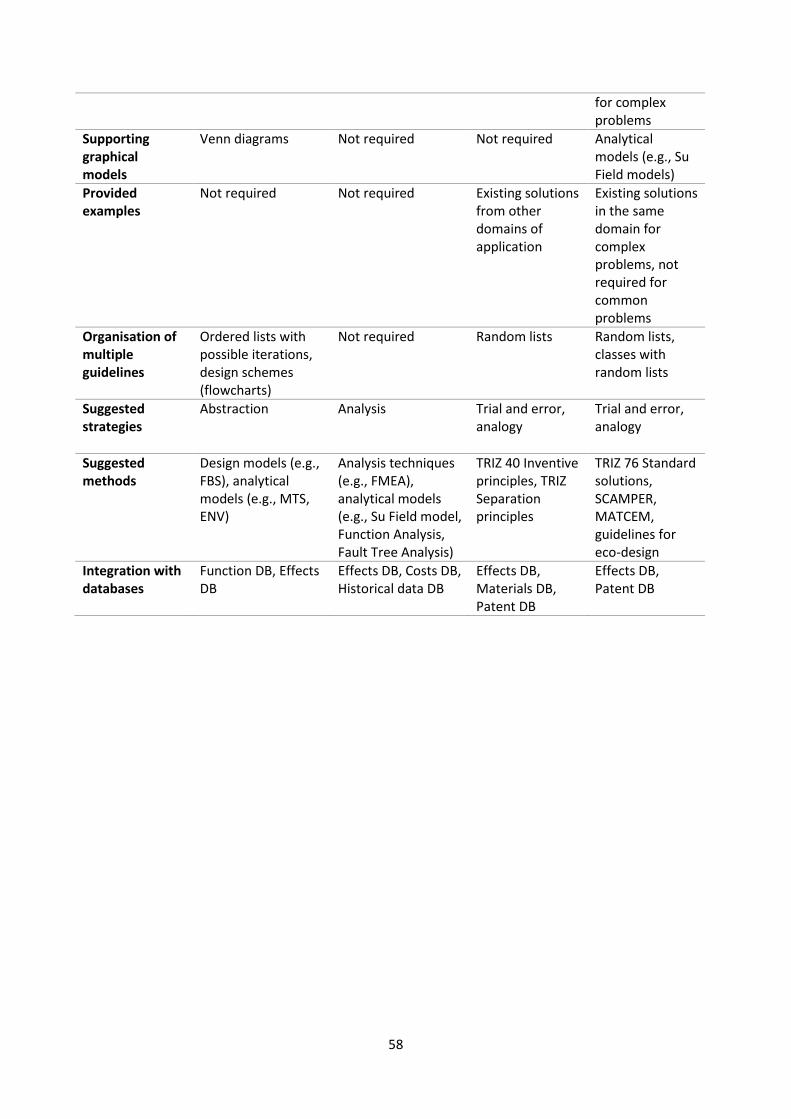
58
for complex problems
Supporting graphical models
Venn diagrams Not required Not required Analytical models (e.g., Su Field models)
Provided examples
Not required Not required Existing solutions from other domains of application
Existing solutions in the same domain for complex problems, not required for common problems
Organisation of multiple guidelines
Ordered lists with possible iterations, design schemes (flowcharts)
Not required Random lists Random lists, classes with random lists
Suggested strategies
Abstraction Analysis Trial and error, analogy
Trial and error, analogy
Suggested methods
Design models (e.g., FBS), analytical models (e.g., MTS, ENV)
Analysis techniques (e.g., FMEA), analytical models (e.g., Su Field model, Function Analysis, Fault Tree Analysis)
TRIZ 40 Inventive principles, TRIZ Separation principles
TRIZ 76 Standard solutions, SCAMPER, MATCEM, guidelines for eco-design
Integration with databases
Function DB, Effects DB
Effects DB, Costs DB, Historical data DB
Effects DB, Materials DB, Patent DB
Effects DB, Patent DB
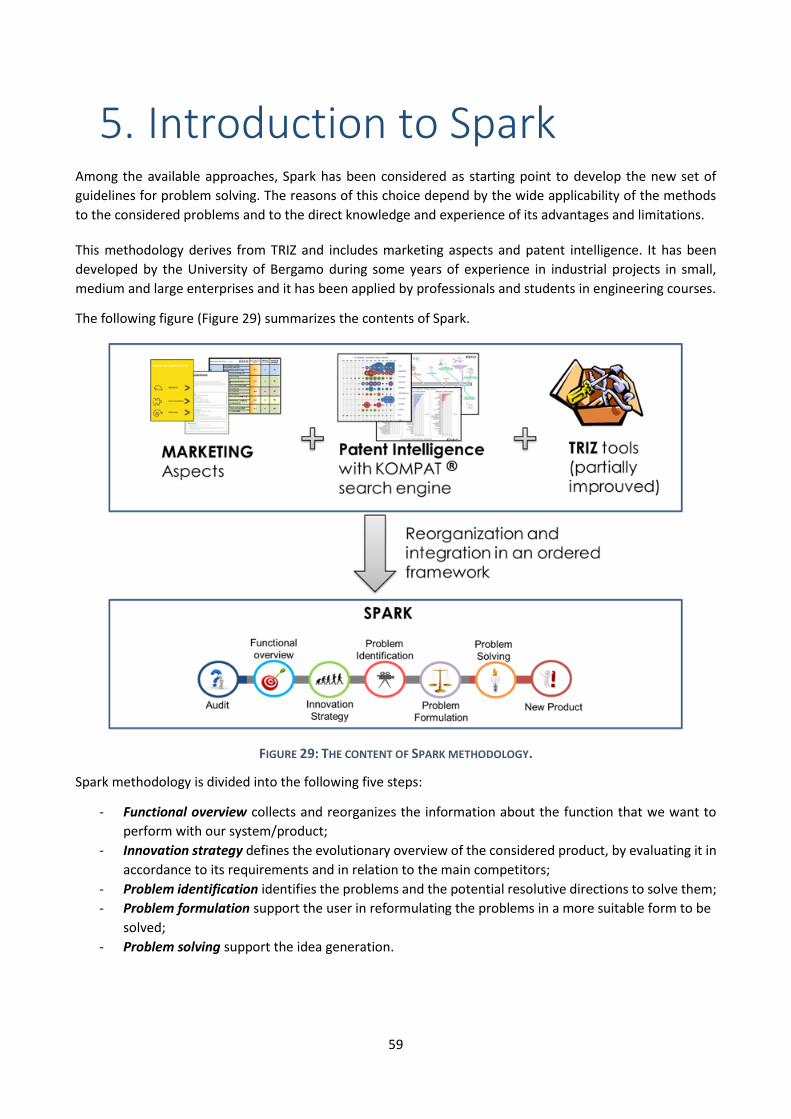
59
5. Introduction to Spark Among the available approaches, Spark has been considered as starting point to develop the new set of
guidelines for problem solving. The reasons of this choice depend by the wide applicability of the methods
to the considered problems and to the direct knowledge and experience of its advantages and limitations.
This methodology derives from TRIZ and includes marketing aspects and patent intelligence. It has been
developed by the University of Bergamo during some years of experience in industrial projects in small,
medium and large enterprises and it has been applied by professionals and students in engineering courses.
The following figure (Figure 29) summarizes the contents of Spark.
FIGURE 29: THE CONTENT OF SPARK METHODOLOGY.
Spark methodology is divided into the following five steps:
- Functional overview collects and reorganizes the information about the function that we want to
perform with our system/product;
- Innovation strategy defines the evolutionary overview of the considered product, by evaluating it in
accordance to its requirements and in relation to the main competitors;
- Problem identification identifies the problems and the potential resolutive directions to solve them;
- Problem formulation support the user in reformulating the problems in a more suitable form to be
solved;
- Problem solving support the idea generation.
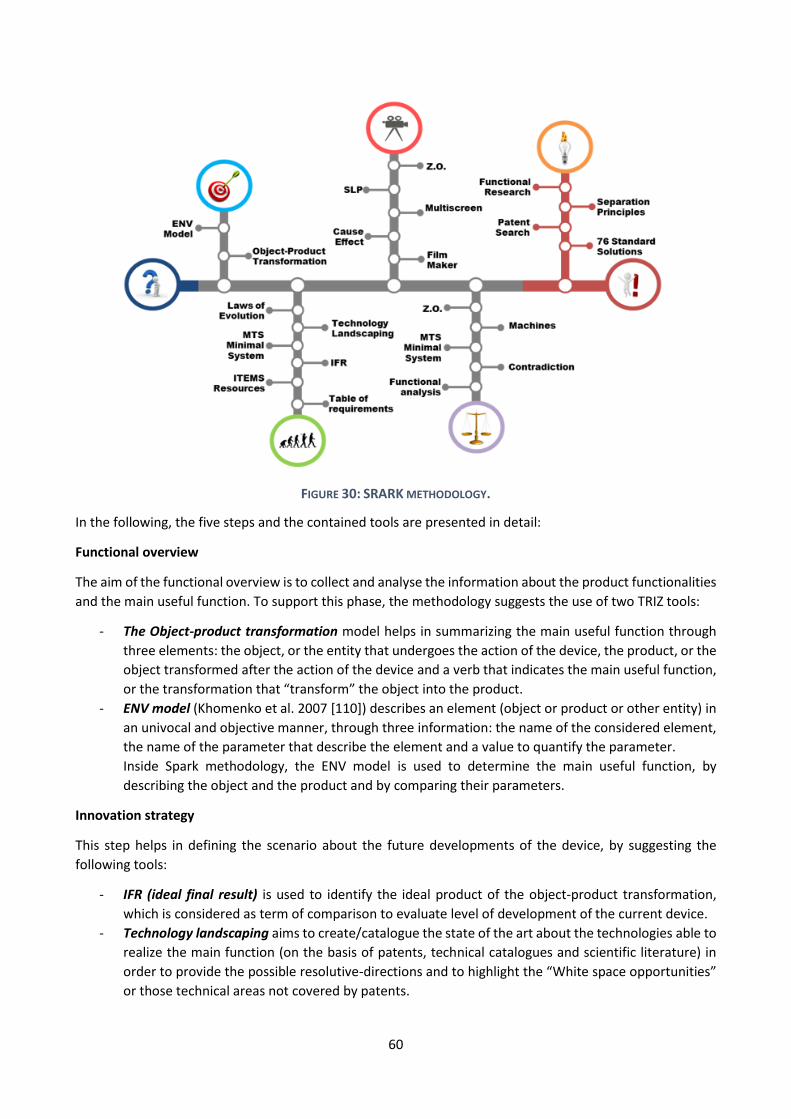
60
FIGURE 30: SRARK METHODOLOGY.
In the following, the five steps and the contained tools are presented in detail:
Functional overview
The aim of the functional overview is to collect and analyse the information about the product functionalities
and the main useful function. To support this phase, the methodology suggests the use of two TRIZ tools:
- The Object-product transformation model helps in summarizing the main useful function through
three elements: the object, or the entity that undergoes the action of the device, the product, or the
object transformed after the action of the device and a verb that indicates the main useful function,
or the transformation that “transform” the object into the product.
- ENV model (Khomenko et al. 2007 [110]) describes an element (object or product or other entity) in
an univocal and objective manner, through three information: the name of the considered element,
the name of the parameter that describe the element and a value to quantify the parameter.
Inside Spark methodology, the ENV model is used to determine the main useful function, by
describing the object and the product and by comparing their parameters.
Innovation strategy
This step helps in defining the scenario about the future developments of the device, by suggesting the
following tools:
- IFR (ideal final result) is used to identify the ideal product of the object-product transformation,
which is considered as term of comparison to evaluate level of development of the current device.
- Technology landscaping aims to create/catalogue the state of the art about the technologies able to
realize the main function (on the basis of patents, technical catalogues and scientific literature) in
order to provide the possible resolutive-directions and to highlight the “White space opportunities”
or those technical areas not covered by patents.
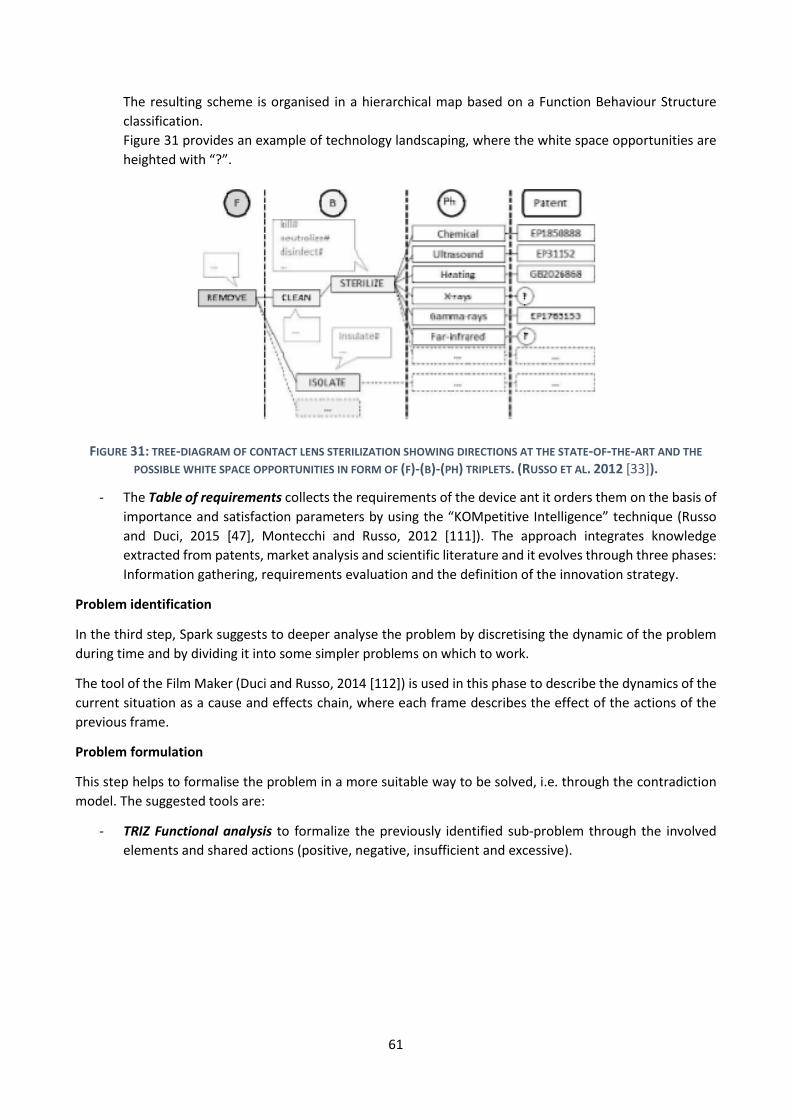
61
The resulting scheme is organised in a hierarchical map based on a Function Behaviour Structure
classification.
Figure 31 provides an example of technology landscaping, where the white space opportunities are
heighted with “?”.
FIGURE 31: TREE-DIAGRAM OF CONTACT LENS STERILIZATION SHOWING DIRECTIONS AT THE STATE-OF-THE-ART AND THE
POSSIBLE WHITE SPACE OPPORTUNITIES IN FORM OF (F)-(B)-(PH) TRIPLETS. (RUSSO ET AL. 2012 [33]).
- The Table of requirements collects the requirements of the device ant it orders them on the basis of
importance and satisfaction parameters by using the “KOMpetitive Intelligence” technique (Russo
and Duci, 2015 [47], Montecchi and Russo, 2012 [111]). The approach integrates knowledge
extracted from patents, market analysis and scientific literature and it evolves through three phases:
Information gathering, requirements evaluation and the definition of the innovation strategy.
Problem identification
In the third step, Spark suggests to deeper analyse the problem by discretising the dynamic of the problem
during time and by dividing it into some simpler problems on which to work.
The tool of the Film Maker (Duci and Russo, 2014 [112]) is used in this phase to describe the dynamics of the
current situation as a cause and effects chain, where each frame describes the effect of the actions of the
previous frame.
Problem formulation
This step helps to formalise the problem in a more suitable way to be solved, i.e. through the contradiction
model. The suggested tools are:
- TRIZ Functional analysis to formalize the previously identified sub-problem through the involved
elements and shared actions (positive, negative, insufficient and excessive).
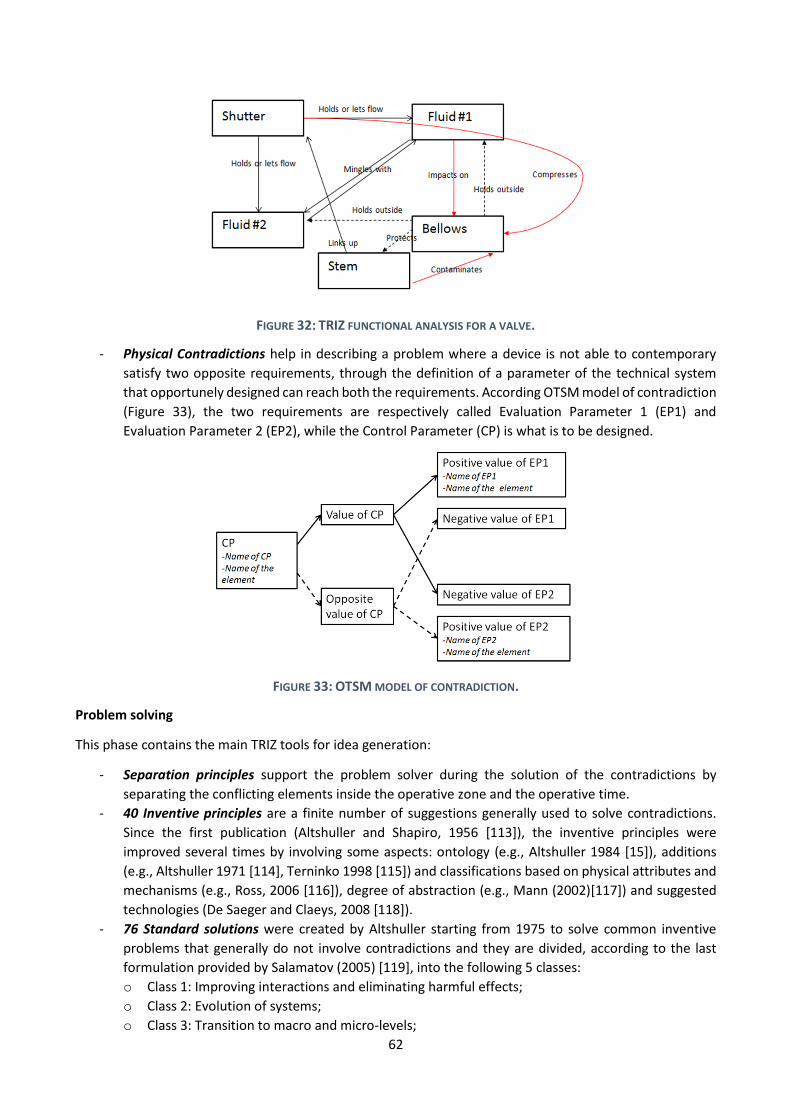
62
FIGURE 32: TRIZ FUNCTIONAL ANALYSIS FOR A VALVE.
- Physical Contradictions help in describing a problem where a device is not able to contemporary
satisfy two opposite requirements, through the definition of a parameter of the technical system
that opportunely designed can reach both the requirements. According OTSM model of contradiction
(Figure 33), the two requirements are respectively called Evaluation Parameter 1 (EP1) and
Evaluation Parameter 2 (EP2), while the Control Parameter (CP) is what is to be designed.
FIGURE 33: OTSM MODEL OF CONTRADICTION.
Problem solving
This phase contains the main TRIZ tools for idea generation:
- Separation principles support the problem solver during the solution of the contradictions by
separating the conflicting elements inside the operative zone and the operative time.
- 40 Inventive principles are a finite number of suggestions generally used to solve contradictions.
Since the first publication (Altshuller and Shapiro, 1956 [113]), the inventive principles were
improved several times by involving some aspects: ontology (e.g., Altshuller 1984 [15]), additions
(e.g., Altshuller 1971 [114], Terninko 1998 [115]) and classifications based on physical attributes and
mechanisms (e.g., Ross, 2006 [116]), degree of abstraction (e.g., Mann (2002)[117]) and suggested
technologies (De Saeger and Claeys, 2008 [118]).
- 76 Standard solutions were created by Altshuller starting from 1975 to solve common inventive
problems that generally do not involve contradictions and they are divided, according to the last
formulation provided by Salamatov (2005) [119], into the following 5 classes:
o Class 1: Improving interactions and eliminating harmful effects;
o Class 2: Evolution of systems;
o Class 3: Transition to macro and micro-levels;

63
o Class 4: Measurement and Detection problems;
o Class 5: Helpers.
Spark limitations
The results deriving from Spark application during the years allowed to evaluate to identify the main
advantages and limitations and to improve it. However, nowadays, the methodology already contains some
shortcomings that can be summarized as follow:
- Method application: differently to TRIZ, Spark classifies all the contained tools into 5 fundamental
steps. However, no suggestions about the order of application of the tools inside the steps is already
missing.
- Application of the contained tools: the success of Spark depends also by the proper application of
its tools, which is in part affected by the level of knowledge of the problem solver. In particular, un-
expert users could not fully comprehend their essence, especially in the case of the 40 inventive
principles and the 76 standard solutions, by compromising the success of the method.
- Addressed problems: Spark can support a huge multitude of different technical problems: product
improvement, requirements evaluation, solving contradictions, physical investigation, etc. However,
in some applications, such as new concept design, the methodology does not provide adequate
support.
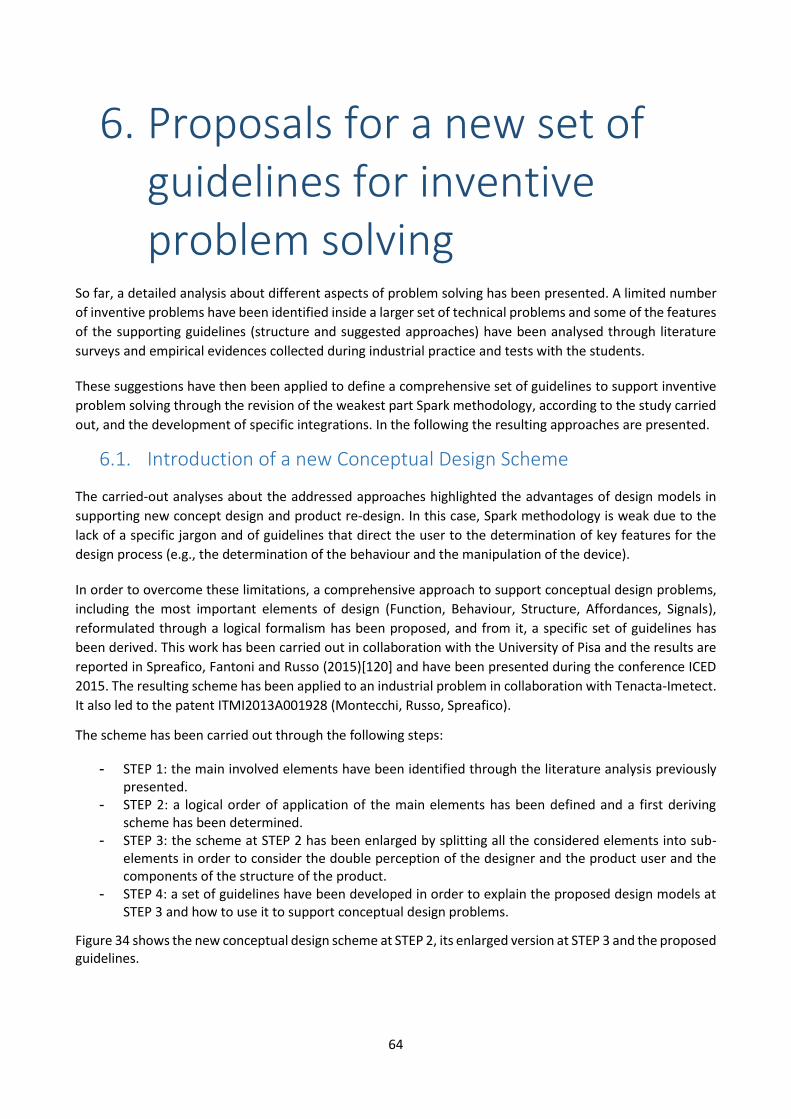
64
6. Proposals for a new set of guidelines for inventive problem solving
So far, a detailed analysis about different aspects of problem solving has been presented. A limited number
of inventive problems have been identified inside a larger set of technical problems and some of the features
of the supporting guidelines (structure and suggested approaches) have been analysed through literature
surveys and empirical evidences collected during industrial practice and tests with the students.
These suggestions have then been applied to define a comprehensive set of guidelines to support inventive
problem solving through the revision of the weakest part Spark methodology, according to the study carried
out, and the development of specific integrations. In the following the resulting approaches are presented.
6.1. Introduction of a new Conceptual Design Scheme
The carried-out analyses about the addressed approaches highlighted the advantages of design models in
supporting new concept design and product re-design. In this case, Spark methodology is weak due to the
lack of a specific jargon and of guidelines that direct the user to the determination of key features for the
design process (e.g., the determination of the behaviour and the manipulation of the device).
In order to overcome these limitations, a comprehensive approach to support conceptual design problems,
including the most important elements of design (Function, Behaviour, Structure, Affordances, Signals),
reformulated through a logical formalism has been proposed, and from it, a specific set of guidelines has
been derived. This work has been carried out in collaboration with the University of Pisa and the results are
reported in Spreafico, Fantoni and Russo (2015)[120] and have been presented during the conference ICED
2015. The resulting scheme has been applied to an industrial problem in collaboration with Tenacta-Imetect.
It also led to the patent ITMI2013A001928 (Montecchi, Russo, Spreafico).
The scheme has been carried out through the following steps:
- STEP 1: the main involved elements have been identified through the literature analysis previously presented.
- STEP 2: a logical order of application of the main elements has been defined and a first deriving scheme has been determined.
- STEP 3: the scheme at STEP 2 has been enlarged by splitting all the considered elements into sub-elements in order to consider the double perception of the designer and the product user and the components of the structure of the product.
- STEP 4: a set of guidelines have been developed in order to explain the proposed design models at STEP 3 and how to use it to support conceptual design problems.
Figure 34 shows the new conceptual design scheme at STEP 2, its enlarged version at STEP 3 and the proposed guidelines.
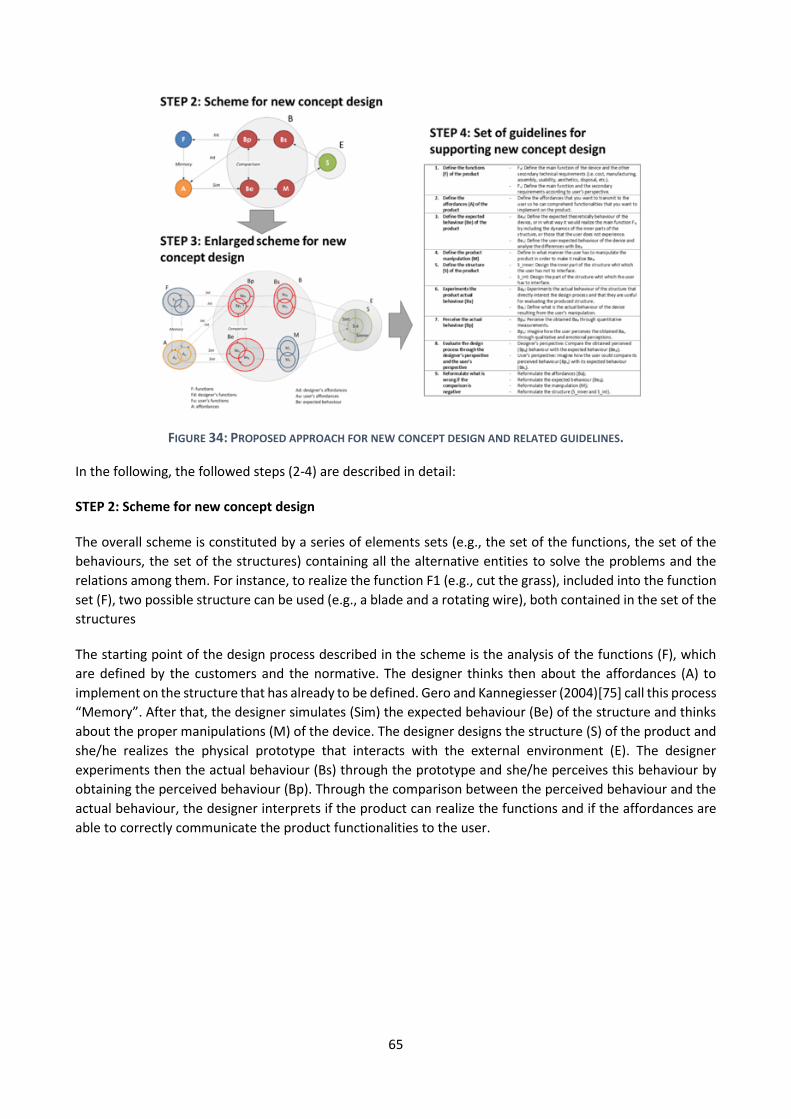
65
FIGURE 34: PROPOSED APPROACH FOR NEW CONCEPT DESIGN AND RELATED GUIDELINES.
In the following, the followed steps (2-4) are described in detail:
STEP 2: Scheme for new concept design
The overall scheme is constituted by a series of elements sets (e.g., the set of the functions, the set of the
behaviours, the set of the structures) containing all the alternative entities to solve the problems and the
relations among them. For instance, to realize the function F1 (e.g., cut the grass), included into the function
set (F), two possible structure can be used (e.g., a blade and a rotating wire), both contained in the set of the
structures
The starting point of the design process described in the scheme is the analysis of the functions (F), which
are defined by the customers and the normative. The designer thinks then about the affordances (A) to
implement on the structure that has already to be defined. Gero and Kannegiesser (2004)[75] call this process
“Memory”. After that, the designer simulates (Sim) the expected behaviour (Be) of the structure and thinks
about the proper manipulations (M) of the device. The designer designs the structure (S) of the product and
she/he realizes the physical prototype that interacts with the external environment (E). The designer
experiments then the actual behaviour (Bs) through the prototype and she/he perceives this behaviour by
obtaining the perceived behaviour (Bp). Through the comparison between the perceived behaviour and the
actual behaviour, the designer interprets if the product can realize the functions and if the affordances are
able to correctly communicate the product functionalities to the user.
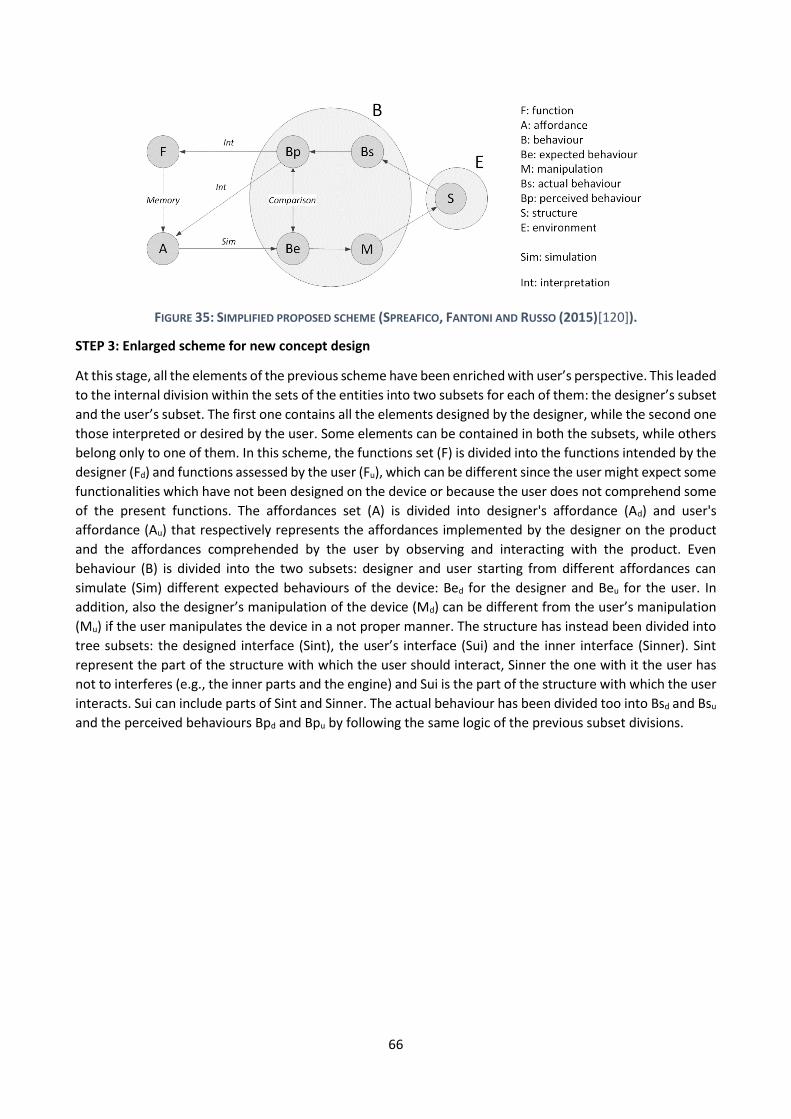
66
FIGURE 35: SIMPLIFIED PROPOSED SCHEME (SPREAFICO, FANTONI AND RUSSO (2015)[120]).
STEP 3: Enlarged scheme for new concept design
At this stage, all the elements of the previous scheme have been enriched with user’s perspective. This leaded
to the internal division within the sets of the entities into two subsets for each of them: the designer’s subset
and the user’s subset. The first one contains all the elements designed by the designer, while the second one
those interpreted or desired by the user. Some elements can be contained in both the subsets, while others
belong only to one of them. In this scheme, the functions set (F) is divided into the functions intended by the
designer (Fd) and functions assessed by the user (Fu), which can be different since the user might expect some
functionalities which have not been designed on the device or because the user does not comprehend some
of the present functions. The affordances set (A) is divided into designer's affordance (Ad) and user's
affordance (Au) that respectively represents the affordances implemented by the designer on the product
and the affordances comprehended by the user by observing and interacting with the product. Even
behaviour (B) is divided into the two subsets: designer and user starting from different affordances can
simulate (Sim) different expected behaviours of the device: Bed for the designer and Beu for the user. In
addition, also the designer’s manipulation of the device (Md) can be different from the user’s manipulation
(Mu) if the user manipulates the device in a not proper manner. The structure has instead been divided into
tree subsets: the designed interface (Sint), the user’s interface (Sui) and the inner interface (Sinner). Sint
represent the part of the structure with which the user should interact, Sinner the one with it the user has
not to interferes (e.g., the inner parts and the engine) and Sui is the part of the structure with which the user
interacts. Sui can include parts of Sint and Sinner. The actual behaviour has been divided too into Bsd and Bsu
and the perceived behaviours Bpd and Bpu by following the same logic of the previous subset divisions.
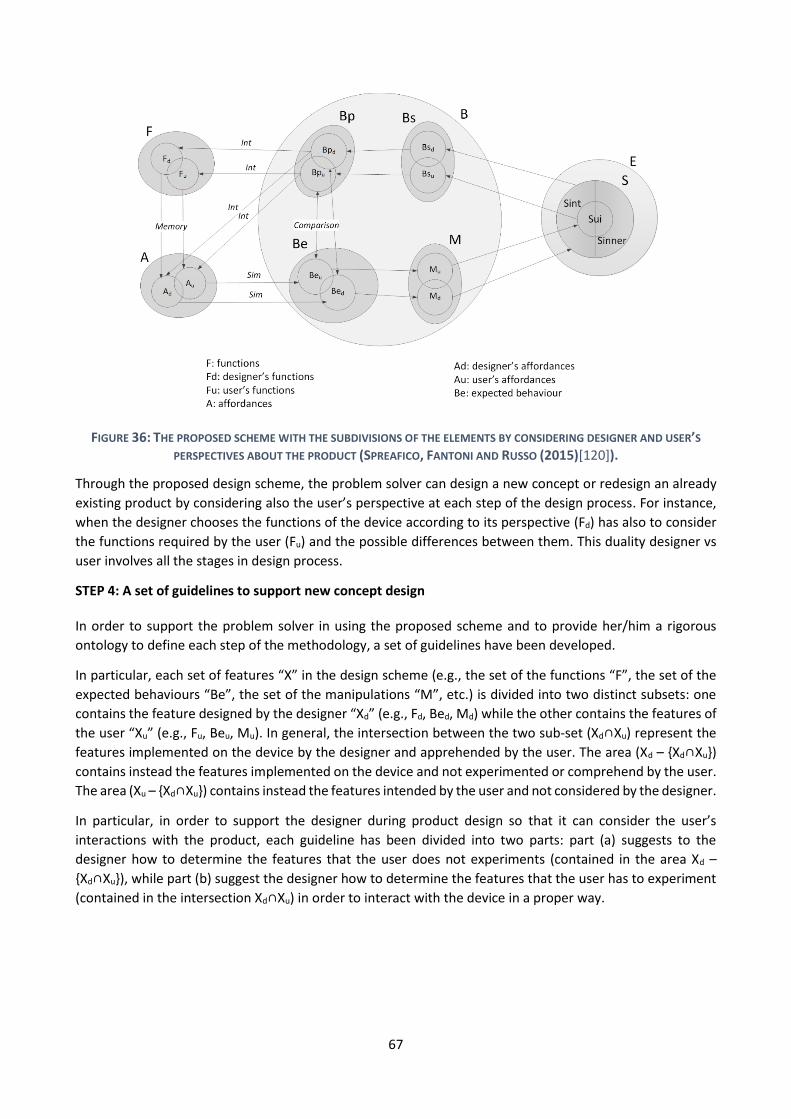
67
FIGURE 36: THE PROPOSED SCHEME WITH THE SUBDIVISIONS OF THE ELEMENTS BY CONSIDERING DESIGNER AND USER’S
PERSPECTIVES ABOUT THE PRODUCT (SPREAFICO, FANTONI AND RUSSO (2015)[120]).
Through the proposed design scheme, the problem solver can design a new concept or redesign an already
existing product by considering also the user’s perspective at each step of the design process. For instance,
when the designer chooses the functions of the device according to its perspective (Fd) has also to consider
the functions required by the user (Fu) and the possible differences between them. This duality designer vs
user involves all the stages in design process.
STEP 4: A set of guidelines to support new concept design
In order to support the problem solver in using the proposed scheme and to provide her/him a rigorous
ontology to define each step of the methodology, a set of guidelines have been developed.
In particular, each set of features “X” in the design scheme (e.g., the set of the functions “F”, the set of the
expected behaviours “Be”, the set of the manipulations “M”, etc.) is divided into two distinct subsets: one
contains the feature designed by the designer “Xd” (e.g., Fd, Bed, Md) while the other contains the features of
the user “Xu” (e.g., Fu, Beu, Mu). In general, the intersection between the two sub-set (Xd∩Xu) represent the
features implemented on the device by the designer and apprehended by the user. The area (Xd – {Xd∩Xu})
contains instead the features implemented on the device and not experimented or comprehend by the user.
The area (Xu – {Xd∩Xu}) contains instead the features intended by the user and not considered by the designer.
In particular, in order to support the designer during product design so that it can consider the user’s
interactions with the product, each guideline has been divided into two parts: part (a) suggests to the
designer how to determine the features that the user does not experiments (contained in the area Xd –
{Xd∩Xu}), while part (b) suggest the designer how to determine the features that the user has to experiment
(contained in the intersection Xd∩Xu) in order to interact with the device in a proper way.
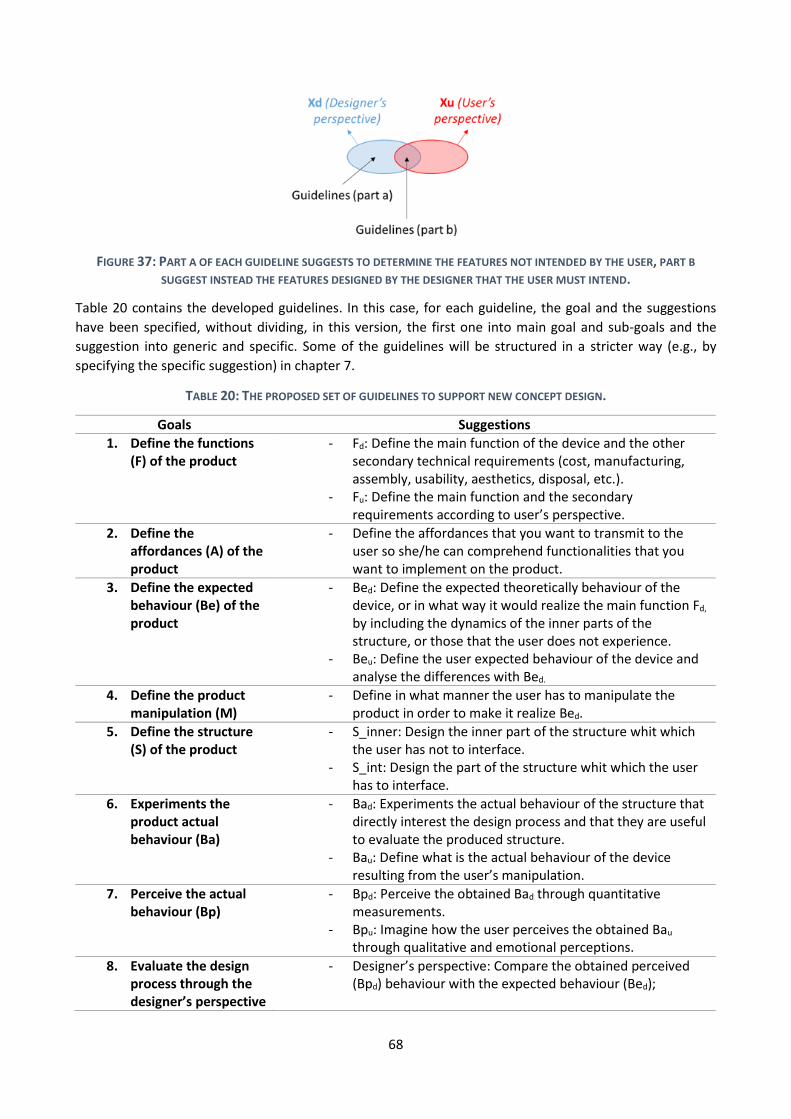
68
FIGURE 37: PART A OF EACH GUIDELINE SUGGESTS TO DETERMINE THE FEATURES NOT INTENDED BY THE USER, PART B
SUGGEST INSTEAD THE FEATURES DESIGNED BY THE DESIGNER THAT THE USER MUST INTEND.
Table 20 contains the developed guidelines. In this case, for each guideline, the goal and the suggestions
have been specified, without dividing, in this version, the first one into main goal and sub-goals and the
suggestion into generic and specific. Some of the guidelines will be structured in a stricter way (e.g., by
specifying the specific suggestion) in chapter 7.
TABLE 20: THE PROPOSED SET OF GUIDELINES TO SUPPORT NEW CONCEPT DESIGN.
Goals Suggestions
1. Define the functions (F) of the product
- Fd: Define the main function of the device and the other secondary technical requirements (cost, manufacturing, assembly, usability, aesthetics, disposal, etc.).
- Fu: Define the main function and the secondary requirements according to user’s perspective.
2. Define the affordances (A) of the product
- Define the affordances that you want to transmit to the user so she/he can comprehend functionalities that you want to implement on the product.
3. Define the expected behaviour (Be) of the product
- Bed: Define the expected theoretically behaviour of the device, or in what way it would realize the main function Fd,
by including the dynamics of the inner parts of the structure, or those that the user does not experience.
- Beu: Define the user expected behaviour of the device and analyse the differences with Bed.
4. Define the product manipulation (M)
- Define in what manner the user has to manipulate the product in order to make it realize Bed.
5. Define the structure (S) of the product
- S_inner: Design the inner part of the structure whit which the user has not to interface.
- S_int: Design the part of the structure whit which the user has to interface.
6. Experiments the product actual behaviour (Ba)
- Bad: Experiments the actual behaviour of the structure that directly interest the design process and that they are useful to evaluate the produced structure.
- Bau: Define what is the actual behaviour of the device resulting from the user’s manipulation.
7. Perceive the actual behaviour (Bp)
- Bpd: Perceive the obtained Bad through quantitative measurements.
- Bpu: Imagine how the user perceives the obtained Bau
through qualitative and emotional perceptions.
8. Evaluate the design process through the designer’s perspective
- Designer’s perspective: Compare the obtained perceived (Bpd) behaviour with the expected behaviour (Bed);
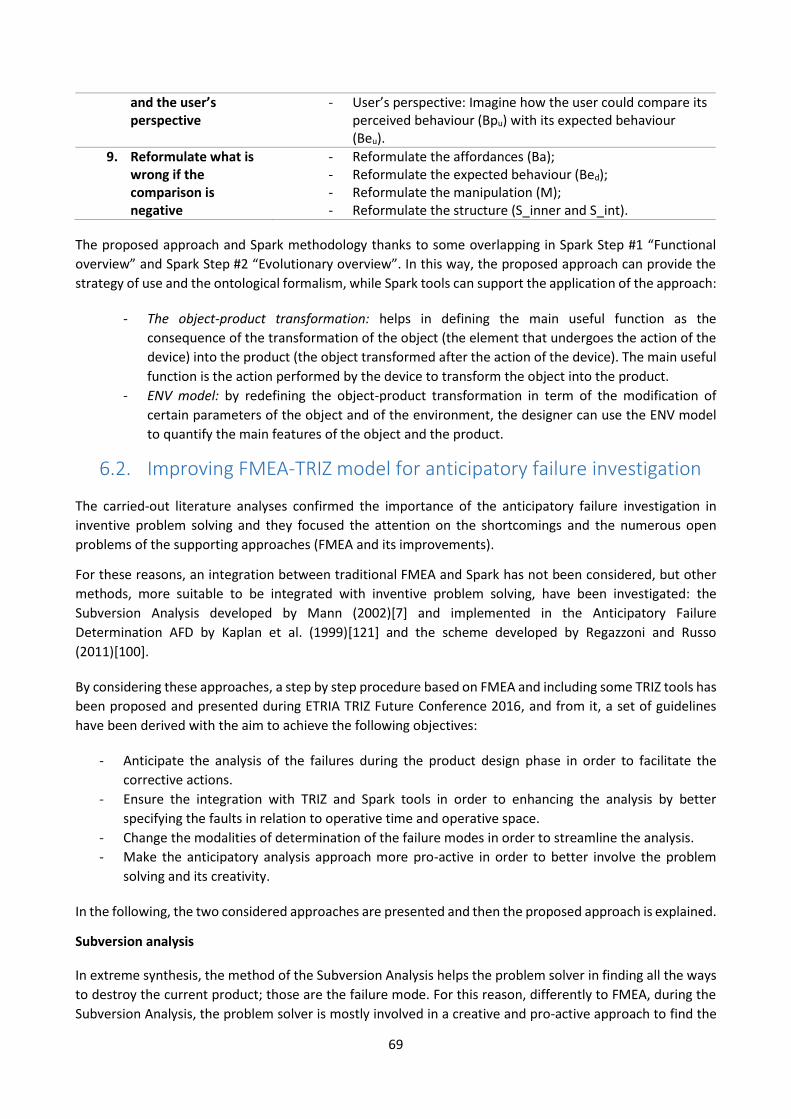
69
and the user’s perspective
- User’s perspective: Imagine how the user could compare its perceived behaviour (Bpu) with its expected behaviour (Beu).
9. Reformulate what is wrong if the comparison is negative
- Reformulate the affordances (Ba); - Reformulate the expected behaviour (Bed); - Reformulate the manipulation (M); - Reformulate the structure (S_inner and S_int).
The proposed approach and Spark methodology thanks to some overlapping in Spark Step #1 “Functional
overview” and Spark Step #2 “Evolutionary overview”. In this way, the proposed approach can provide the
strategy of use and the ontological formalism, while Spark tools can support the application of the approach:
- The object-product transformation: helps in defining the main useful function as the
consequence of the transformation of the object (the element that undergoes the action of the
device) into the product (the object transformed after the action of the device). The main useful
function is the action performed by the device to transform the object into the product.
- ENV model: by redefining the object-product transformation in term of the modification of
certain parameters of the object and of the environment, the designer can use the ENV model
to quantify the main features of the object and the product.
6.2. Improving FMEA-TRIZ model for anticipatory failure investigation
The carried-out literature analyses confirmed the importance of the anticipatory failure investigation in
inventive problem solving and they focused the attention on the shortcomings and the numerous open
problems of the supporting approaches (FMEA and its improvements).
For these reasons, an integration between traditional FMEA and Spark has not been considered, but other
methods, more suitable to be integrated with inventive problem solving, have been investigated: the
Subversion Analysis developed by Mann (2002)[7] and implemented in the Anticipatory Failure
Determination AFD by Kaplan et al. (1999)[121] and the scheme developed by Regazzoni and Russo
(2011)[100].
By considering these approaches, a step by step procedure based on FMEA and including some TRIZ tools has
been proposed and presented during ETRIA TRIZ Future Conference 2016, and from it, a set of guidelines
have been derived with the aim to achieve the following objectives:
- Anticipate the analysis of the failures during the product design phase in order to facilitate the
corrective actions.
- Ensure the integration with TRIZ and Spark tools in order to enhancing the analysis by better
specifying the faults in relation to operative time and operative space.
- Change the modalities of determination of the failure modes in order to streamline the analysis.
- Make the anticipatory analysis approach more pro-active in order to better involve the problem
solving and its creativity.
In the following, the two considered approaches are presented and then the proposed approach is explained.
Subversion analysis
In extreme synthesis, the method of the Subversion Analysis helps the problem solver in finding all the ways
to destroy the current product; those are the failure mode. For this reason, differently to FMEA, during the
Subversion Analysis, the problem solver is mostly involved in a creative and pro-active approach to find the
70
failures: she/he uses TRIZ method not to invent a new system, but to provoke a damage, by using TRIZ tools,
suggestions and resources. Once the failures have been determined, the approach suggest the use of TRIZ to
solve them. The main steps of the subversion analysis are the following:
1) problem definition;
2) formulation of the inverted problem;
3) definition of the function;
4) identification of the failure modes;
5) description of the effect;
6) determination of the causes;
7) identification of the failure hypothesis;
8) research of the solutions.
Regazzoni and Russo’s approach
Regazzoni and Russo (2011)[100] proposed a new paradigm to enhance risk management by integrating parts
of FEMA and TRIZ and by adopting the logic of the Subversion Analysis. In this approach, some TRIZ tools
helps not only in solving the identified failures but also in determining them. The main steps of the subversion
analysis are the following:
1) Identification of the primary function of the product is carried out through the traditional TRIZ tools
Energy Material Signal (EMS) model and Element Name Value (ENV) model.
2) Definition of elements and failure effects. In this phase a selection of the most important
components and the possible related failure effects of the technical system and of the environment
are determined and analysed through experts’ interrogations and by using the proposed Element
and negative effects tree.
3) Effects modelling with ENV model. In this phase the ENV model is used to identify the failure modes
by increasing and decreasing the nominal values of the features of the described parameters in order
to the realise the previously determined failure effects.
4) Assess risk via RPN. The risks of the failure modes are evaluated according to FMEA criteria for the
calculation of the Risk Priority Number.
5) Subversion analysis. For the most critical failures, the possible failure causes are investigated by
using the Substance-Field model to map the failures and the standard solutions to determine the
possible causes.
6) Problem solving. The identified problems are solved by using TRIZ.
6.2.1. The proposed approach
In the following, the main steps of the proposed approach are explained in detail:
Main useful function determination
The starting point of the proposed approach is the determination of the main useful function. This because
it helps in better defining the product and in determining in what way the Failure Effects affect its realisation.
Step 1 of Spark methodology is specifically addressed in supporting the problem solver in this phase.
Failure effects determination
In order to determine the Failure Effects without using the entire bill of material, TRIZ functional analysis can
be used in two ways: firstly, the analysis aims to mapping the main elements of the system by highlighting
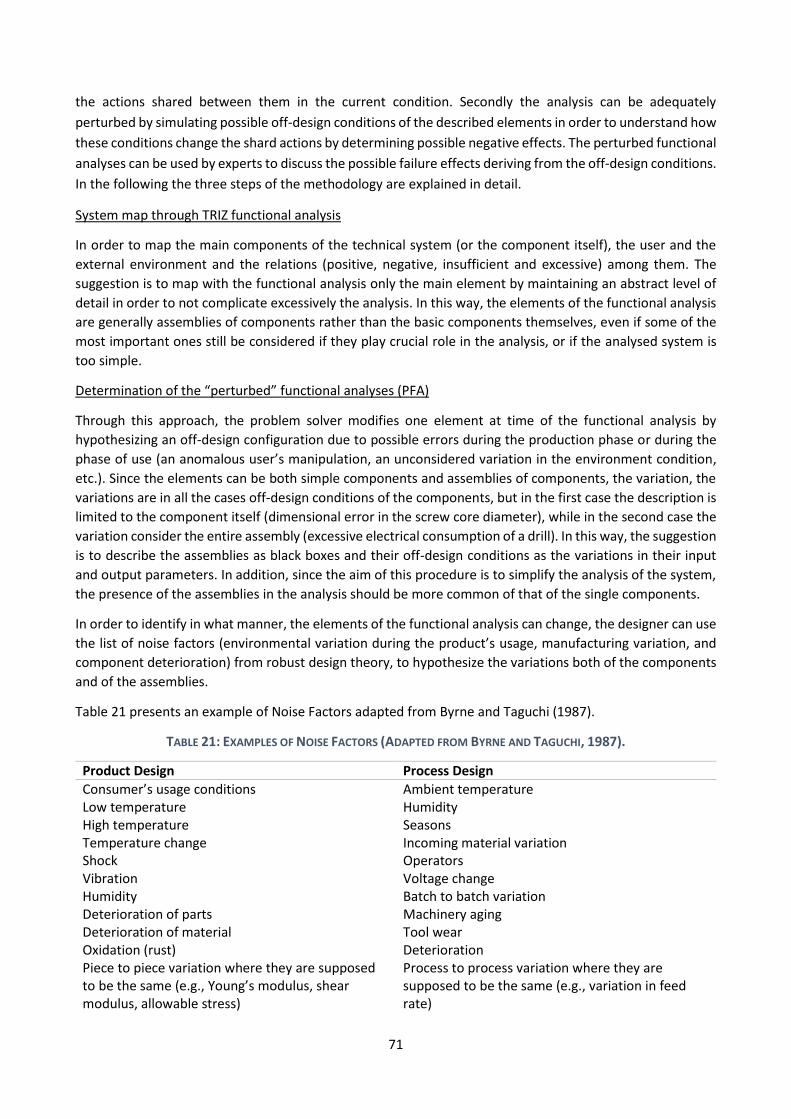
71
the actions shared between them in the current condition. Secondly the analysis can be adequately
perturbed by simulating possible off-design conditions of the described elements in order to understand how
these conditions change the shard actions by determining possible negative effects. The perturbed functional
analyses can be used by experts to discuss the possible failure effects deriving from the off-design conditions.
In the following the three steps of the methodology are explained in detail.
System map through TRIZ functional analysis
In order to map the main components of the technical system (or the component itself), the user and the
external environment and the relations (positive, negative, insufficient and excessive) among them. The
suggestion is to map with the functional analysis only the main element by maintaining an abstract level of
detail in order to not complicate excessively the analysis. In this way, the elements of the functional analysis
are generally assemblies of components rather than the basic components themselves, even if some of the
most important ones still be considered if they play crucial role in the analysis, or if the analysed system is
too simple.
Determination of the “perturbed” functional analyses (PFA)
Through this approach, the problem solver modifies one element at time of the functional analysis by
hypothesizing an off-design configuration due to possible errors during the production phase or during the
phase of use (an anomalous user’s manipulation, an unconsidered variation in the environment condition,
etc.). Since the elements can be both simple components and assemblies of components, the variation, the
variations are in all the cases off-design conditions of the components, but in the first case the description is
limited to the component itself (dimensional error in the screw core diameter), while in the second case the
variation consider the entire assembly (excessive electrical consumption of a drill). In this way, the suggestion
is to describe the assemblies as black boxes and their off-design conditions as the variations in their input
and output parameters. In addition, since the aim of this procedure is to simplify the analysis of the system,
the presence of the assemblies in the analysis should be more common of that of the single components.
In order to identify in what manner, the elements of the functional analysis can change, the designer can use
the list of noise factors (environmental variation during the product’s usage, manufacturing variation, and
component deterioration) from robust design theory, to hypothesize the variations both of the components
and of the assemblies.
Table 21 presents an example of Noise Factors adapted from Byrne and Taguchi (1987).
TABLE 21: EXAMPLES OF NOISE FACTORS (ADAPTED FROM BYRNE AND TAGUCHI, 1987).
Product Design Process Design
Consumer’s usage conditions Ambient temperature Low temperature Humidity High temperature Seasons Temperature change Incoming material variation Shock Operators Vibration Voltage change Humidity Batch to batch variation Deterioration of parts Machinery aging Deterioration of material Tool wear Oxidation (rust) Deterioration Piece to piece variation where they are supposed to be the same (e.g., Young’s modulus, shear modulus, allowable stress)
Process to process variation where they are supposed to be the same (e.g., variation in feed rate)
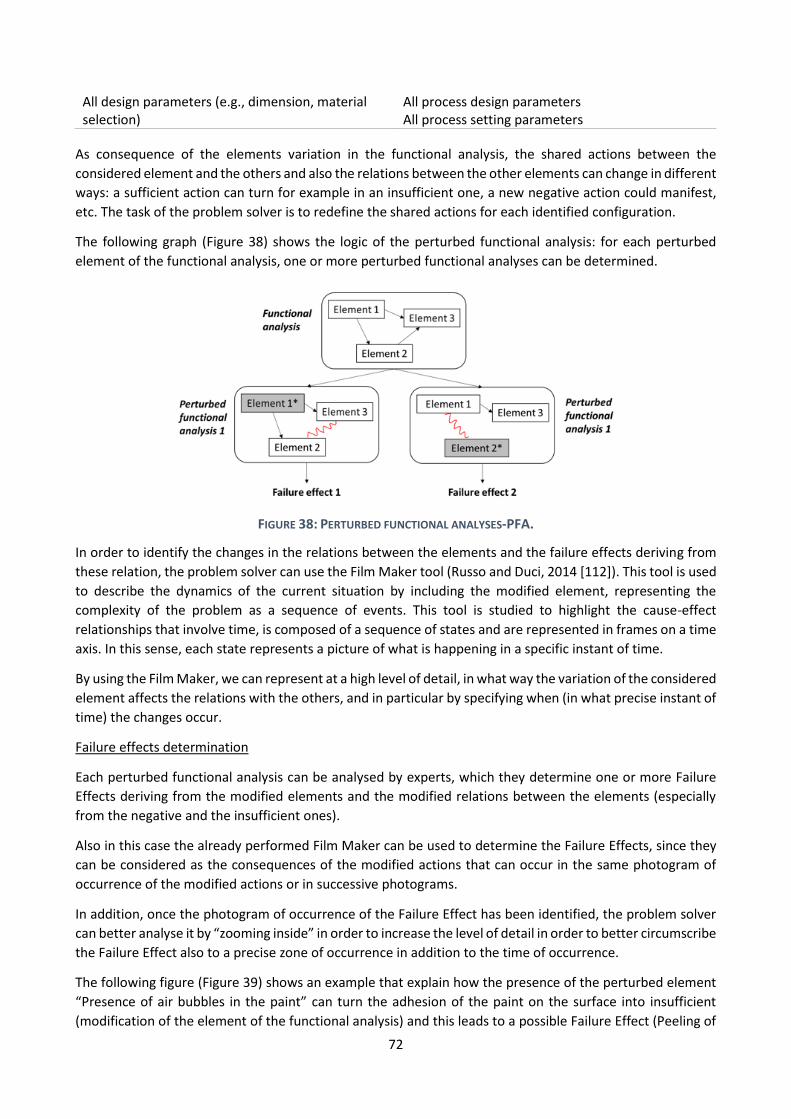
72
All design parameters (e.g., dimension, material selection)
All process design parameters All process setting parameters
As consequence of the elements variation in the functional analysis, the shared actions between the
considered element and the others and also the relations between the other elements can change in different
ways: a sufficient action can turn for example in an insufficient one, a new negative action could manifest,
etc. The task of the problem solver is to redefine the shared actions for each identified configuration.
The following graph (Figure 38) shows the logic of the perturbed functional analysis: for each perturbed
element of the functional analysis, one or more perturbed functional analyses can be determined.
FIGURE 38: PERTURBED FUNCTIONAL ANALYSES-PFA.
In order to identify the changes in the relations between the elements and the failure effects deriving from
these relation, the problem solver can use the Film Maker tool (Russo and Duci, 2014 [112]). This tool is used
to describe the dynamics of the current situation by including the modified element, representing the
complexity of the problem as a sequence of events. This tool is studied to highlight the cause-effect
relationships that involve time, is composed of a sequence of states and are represented in frames on a time
axis. In this sense, each state represents a picture of what is happening in a specific instant of time.
By using the Film Maker, we can represent at a high level of detail, in what way the variation of the considered
element affects the relations with the others, and in particular by specifying when (in what precise instant of
time) the changes occur.
Failure effects determination
Each perturbed functional analysis can be analysed by experts, which they determine one or more Failure
Effects deriving from the modified elements and the modified relations between the elements (especially
from the negative and the insufficient ones).
Also in this case the already performed Film Maker can be used to determine the Failure Effects, since they
can be considered as the consequences of the modified actions that can occur in the same photogram of
occurrence of the modified actions or in successive photograms.
In addition, once the photogram of occurrence of the Failure Effect has been identified, the problem solver
can better analyse it by “zooming inside” in order to increase the level of detail in order to better circumscribe
the Failure Effect also to a precise zone of occurrence in addition to the time of occurrence.
The following figure (Figure 39) shows an example that explain how the presence of the perturbed element
“Presence of air bubbles in the paint” can turn the adhesion of the paint on the surface into insufficient
(modification of the element of the functional analysis) and this leads to a possible Failure Effect (Peeling of
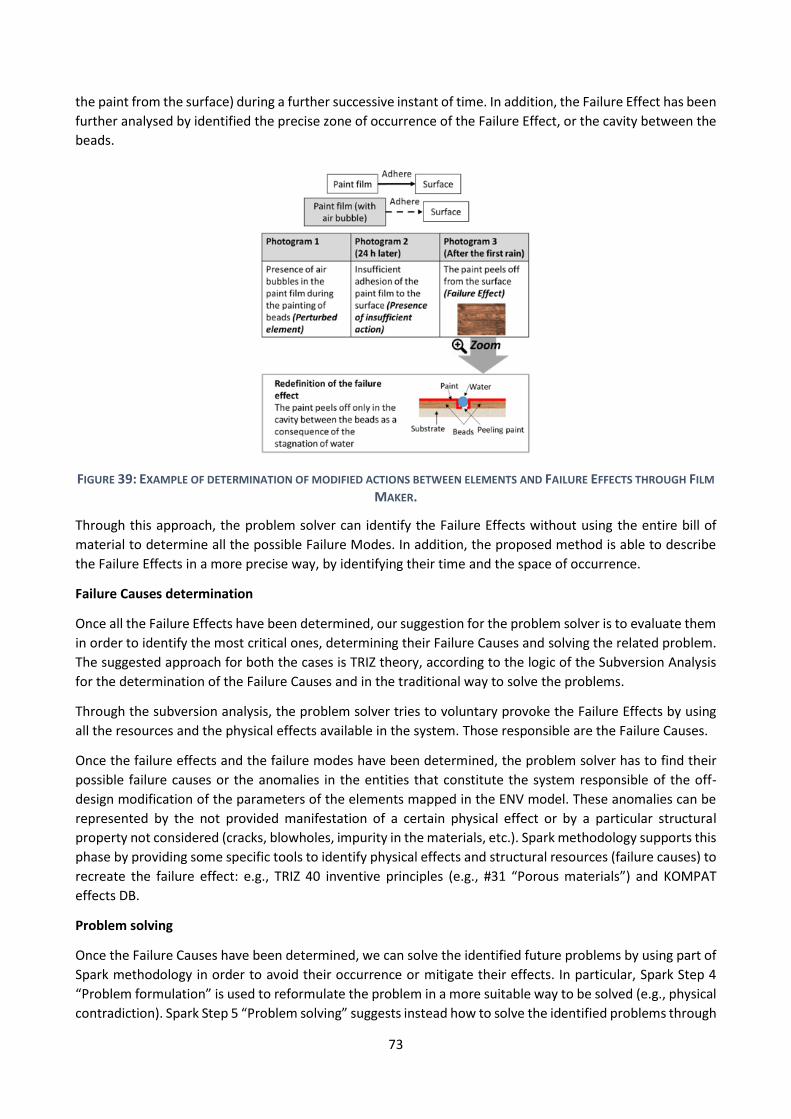
73
the paint from the surface) during a further successive instant of time. In addition, the Failure Effect has been
further analysed by identified the precise zone of occurrence of the Failure Effect, or the cavity between the
beads.
FIGURE 39: EXAMPLE OF DETERMINATION OF MODIFIED ACTIONS BETWEEN ELEMENTS AND FAILURE EFFECTS THROUGH FILM
MAKER.
Through this approach, the problem solver can identify the Failure Effects without using the entire bill of
material to determine all the possible Failure Modes. In addition, the proposed method is able to describe
the Failure Effects in a more precise way, by identifying their time and the space of occurrence.
Failure Causes determination
Once all the Failure Effects have been determined, our suggestion for the problem solver is to evaluate them
in order to identify the most critical ones, determining their Failure Causes and solving the related problem.
The suggested approach for both the cases is TRIZ theory, according to the logic of the Subversion Analysis
for the determination of the Failure Causes and in the traditional way to solve the problems.
Through the subversion analysis, the problem solver tries to voluntary provoke the Failure Effects by using
all the resources and the physical effects available in the system. Those responsible are the Failure Causes.
Once the failure effects and the failure modes have been determined, the problem solver has to find their
possible failure causes or the anomalies in the entities that constitute the system responsible of the off-
design modification of the parameters of the elements mapped in the ENV model. These anomalies can be
represented by the not provided manifestation of a certain physical effect or by a particular structural
property not considered (cracks, blowholes, impurity in the materials, etc.). Spark methodology supports this
phase by providing some specific tools to identify physical effects and structural resources (failure causes) to
recreate the failure effect: e.g., TRIZ 40 inventive principles (e.g., #31 “Porous materials”) and KOMPAT
effects DB.
Problem solving
Once the Failure Causes have been determined, we can solve the identified future problems by using part of
Spark methodology in order to avoid their occurrence or mitigate their effects. In particular, Spark Step 4
“Problem formulation” is used to reformulate the problem in a more suitable way to be solved (e.g., physical
contradiction). Spark Step 5 “Problem solving” suggests instead how to solve the identified problems through
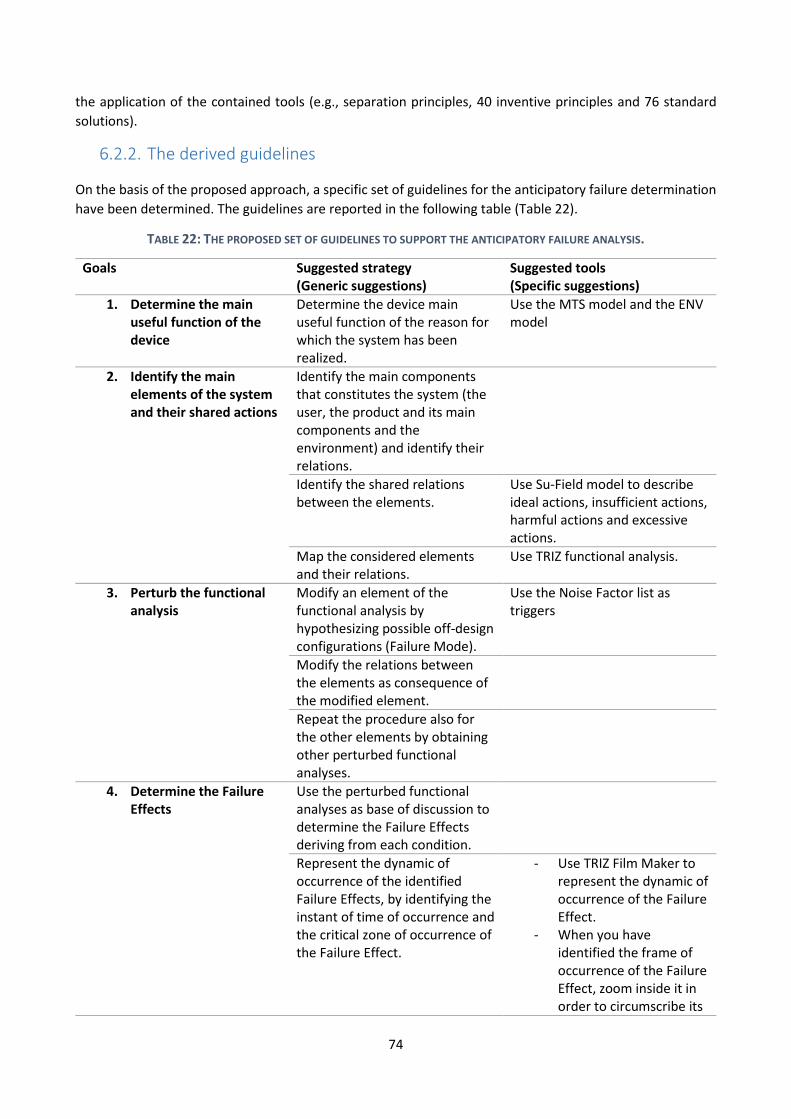
74
the application of the contained tools (e.g., separation principles, 40 inventive principles and 76 standard
solutions).
6.2.2. The derived guidelines
On the basis of the proposed approach, a specific set of guidelines for the anticipatory failure determination
have been determined. The guidelines are reported in the following table (Table 22).
TABLE 22: THE PROPOSED SET OF GUIDELINES TO SUPPORT THE ANTICIPATORY FAILURE ANALYSIS.
Goals Suggested strategy (Generic suggestions)
Suggested tools (Specific suggestions)
1. Determine the main useful function of the device
Determine the device main useful function of the reason for which the system has been realized.
Use the MTS model and the ENV model
2. Identify the main elements of the system and their shared actions
Identify the main components that constitutes the system (the user, the product and its main components and the environment) and identify their relations.
Identify the shared relations between the elements.
Use Su-Field model to describe ideal actions, insufficient actions, harmful actions and excessive actions.
Map the considered elements and their relations.
Use TRIZ functional analysis.
3. Perturb the functional analysis
Modify an element of the functional analysis by hypothesizing possible off-design configurations (Failure Mode).
Use the Noise Factor list as triggers
Modify the relations between the elements as consequence of the modified element.
Repeat the procedure also for the other elements by obtaining other perturbed functional analyses.
4. Determine the Failure Effects
Use the perturbed functional analyses as base of discussion to determine the Failure Effects deriving from each condition.
Represent the dynamic of occurrence of the identified Failure Effects, by identifying the instant of time of occurrence and the critical zone of occurrence of the Failure Effect.
- Use TRIZ Film Maker to represent the dynamic of occurrence of the Failure Effect.
- When you have identified the frame of occurrence of the Failure Effect, zoom inside it in order to circumscribe its
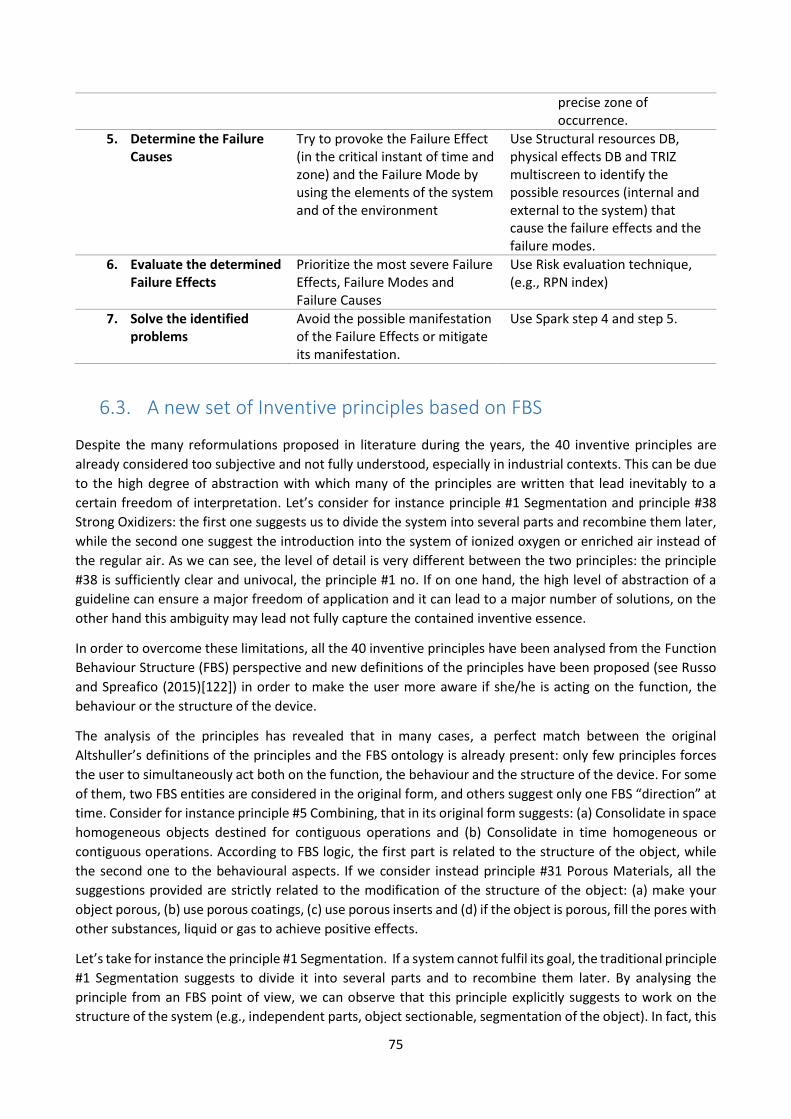
75
precise zone of occurrence.
5. Determine the Failure Causes
Try to provoke the Failure Effect (in the critical instant of time and zone) and the Failure Mode by using the elements of the system and of the environment
Use Structural resources DB, physical effects DB and TRIZ multiscreen to identify the possible resources (internal and external to the system) that cause the failure effects and the failure modes.
6. Evaluate the determined Failure Effects
Prioritize the most severe Failure Effects, Failure Modes and Failure Causes
Use Risk evaluation technique, (e.g., RPN index)
7. Solve the identified problems
Avoid the possible manifestation of the Failure Effects or mitigate its manifestation.
Use Spark step 4 and step 5.
6.3. A new set of Inventive principles based on FBS
Despite the many reformulations proposed in literature during the years, the 40 inventive principles are
already considered too subjective and not fully understood, especially in industrial contexts. This can be due
to the high degree of abstraction with which many of the principles are written that lead inevitably to a
certain freedom of interpretation. Let’s consider for instance principle #1 Segmentation and principle #38
Strong Oxidizers: the first one suggests us to divide the system into several parts and recombine them later,
while the second one suggest the introduction into the system of ionized oxygen or enriched air instead of
the regular air. As we can see, the level of detail is very different between the two principles: the principle
#38 is sufficiently clear and univocal, the principle #1 no. If on one hand, the high level of abstraction of a
guideline can ensure a major freedom of application and it can lead to a major number of solutions, on the
other hand this ambiguity may lead not fully capture the contained inventive essence.
In order to overcome these limitations, all the 40 inventive principles have been analysed from the Function
Behaviour Structure (FBS) perspective and new definitions of the principles have been proposed (see Russo
and Spreafico (2015)[122]) in order to make the user more aware if she/he is acting on the function, the
behaviour or the structure of the device.
The analysis of the principles has revealed that in many cases, a perfect match between the original
Altshuller’s definitions of the principles and the FBS ontology is already present: only few principles forces
the user to simultaneously act both on the function, the behaviour and the structure of the device. For some
of them, two FBS entities are considered in the original form, and others suggest only one FBS “direction” at
time. Consider for instance principle #5 Combining, that in its original form suggests: (a) Consolidate in space
homogeneous objects destined for contiguous operations and (b) Consolidate in time homogeneous or
contiguous operations. According to FBS logic, the first part is related to the structure of the object, while
the second one to the behavioural aspects. If we consider instead principle #31 Porous Materials, all the
suggestions provided are strictly related to the modification of the structure of the object: (a) make your
object porous, (b) use porous coatings, (c) use porous inserts and (d) if the object is porous, fill the pores with
other substances, liquid or gas to achieve positive effects.
Let’s take for instance the principle #1 Segmentation. If a system cannot fulfil its goal, the traditional principle
#1 Segmentation suggests to divide it into several parts and to recombine them later. By analysing the
principle from an FBS point of view, we can observe that this principle explicitly suggests to work on the
structure of the system (e.g., independent parts, object sectionable, segmentation of the object). In fact, this
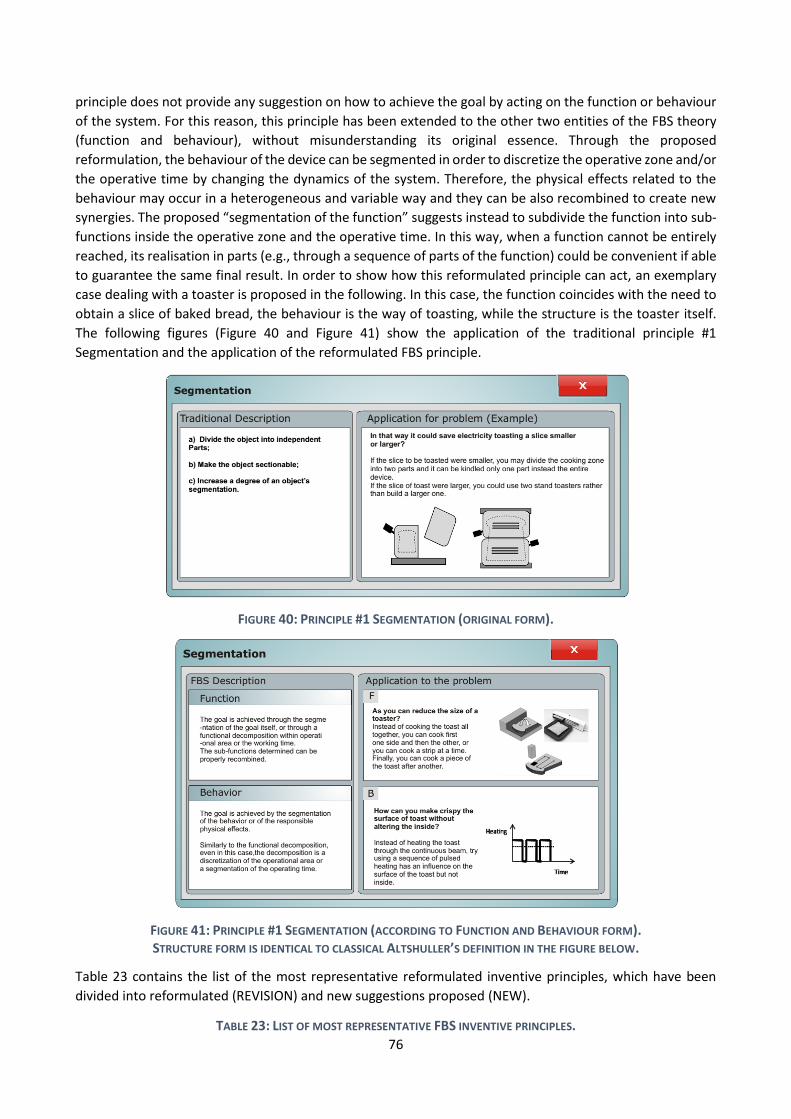
76
principle does not provide any suggestion on how to achieve the goal by acting on the function or behaviour
of the system. For this reason, this principle has been extended to the other two entities of the FBS theory
(function and behaviour), without misunderstanding its original essence. Through the proposed
reformulation, the behaviour of the device can be segmented in order to discretize the operative zone and/or
the operative time by changing the dynamics of the system. Therefore, the physical effects related to the
behaviour may occur in a heterogeneous and variable way and they can be also recombined to create new
synergies. The proposed “segmentation of the function” suggests instead to subdivide the function into sub-
functions inside the operative zone and the operative time. In this way, when a function cannot be entirely
reached, its realisation in parts (e.g., through a sequence of parts of the function) could be convenient if able
to guarantee the same final result. In order to show how this reformulated principle can act, an exemplary
case dealing with a toaster is proposed in the following. In this case, the function coincides with the need to
obtain a slice of baked bread, the behaviour is the way of toasting, while the structure is the toaster itself.
The following figures (Figure 40 and Figure 41) show the application of the traditional principle #1
Segmentation and the application of the reformulated FBS principle.
FIGURE 40: PRINCIPLE #1 SEGMENTATION (ORIGINAL FORM).
FIGURE 41: PRINCIPLE #1 SEGMENTATION (ACCORDING TO FUNCTION AND BEHAVIOUR FORM). STRUCTURE FORM IS IDENTICAL TO CLASSICAL ALTSHULLER’S DEFINITION IN THE FIGURE BELOW.
Table 23 contains the list of the most representative reformulated inventive principles, which have been
divided into reformulated (REVISION) and new suggestions proposed (NEW).
TABLE 23: LIST OF MOST REPRESENTATIVE FBS INVENTIVE PRINCIPLES.
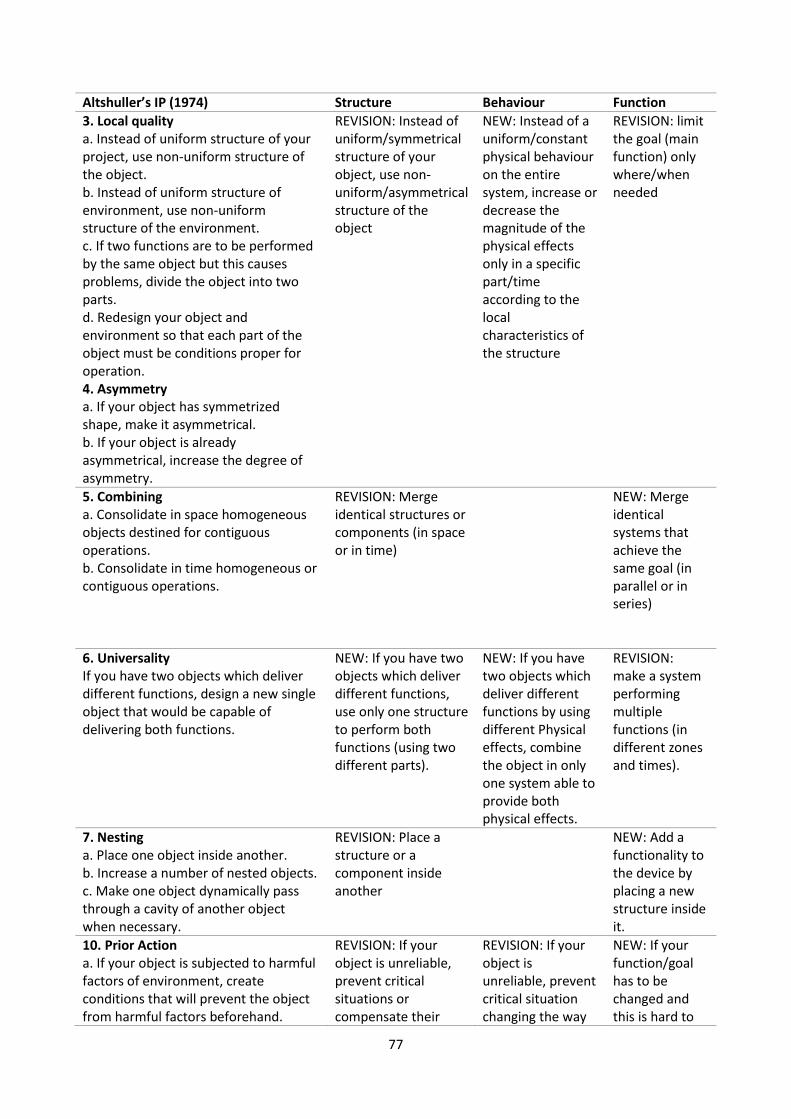
77
Altshuller’s IP (1974) Structure Behaviour Function
3. Local quality a. Instead of uniform structure of your project, use non-uniform structure of the object. b. Instead of uniform structure of environment, use non-uniform structure of the environment. c. If two functions are to be performed by the same object but this causes problems, divide the object into two parts. d. Redesign your object and environment so that each part of the object must be conditions proper for operation. 4. Asymmetry a. If your object has symmetrized shape, make it asymmetrical. b. If your object is already asymmetrical, increase the degree of asymmetry.
REVISION: Instead of uniform/symmetrical structure of your object, use non-uniform/asymmetrical structure of the object
NEW: Instead of a uniform/constant physical behaviour on the entire system, increase or decrease the magnitude of the physical effects only in a specific part/time according to the local characteristics of the structure
REVISION: limit the goal (main function) only where/when needed
5. Combining a. Consolidate in space homogeneous objects destined for contiguous operations. b. Consolidate in time homogeneous or contiguous operations.
REVISION: Merge identical structures or components (in space or in time)
NEW: Merge identical systems that achieve the same goal (in parallel or in series)
6. Universality If you have two objects which deliver different functions, design a new single object that would be capable of delivering both functions.
NEW: If you have two objects which deliver different functions, use only one structure to perform both functions (using two different parts).
NEW: If you have two objects which deliver different functions by using different Physical effects, combine the object in only one system able to provide both physical effects.
REVISION: make a system performing multiple functions (in different zones and times).
7. Nesting a. Place one object inside another. b. Increase a number of nested objects. c. Make one object dynamically pass through a cavity of another object when necessary.
REVISION: Place a structure or a component inside another
NEW: Add a functionality to the device by placing a new structure inside it.
10. Prior Action a. If your object is subjected to harmful factors of environment, create conditions that will prevent the object from harmful factors beforehand.
REVISION: If your object is unreliable, prevent critical situations or compensate their
REVISION: If your object is unreliable, prevent critical situation changing the way
NEW: If your function/goal has to be changed and this is hard to
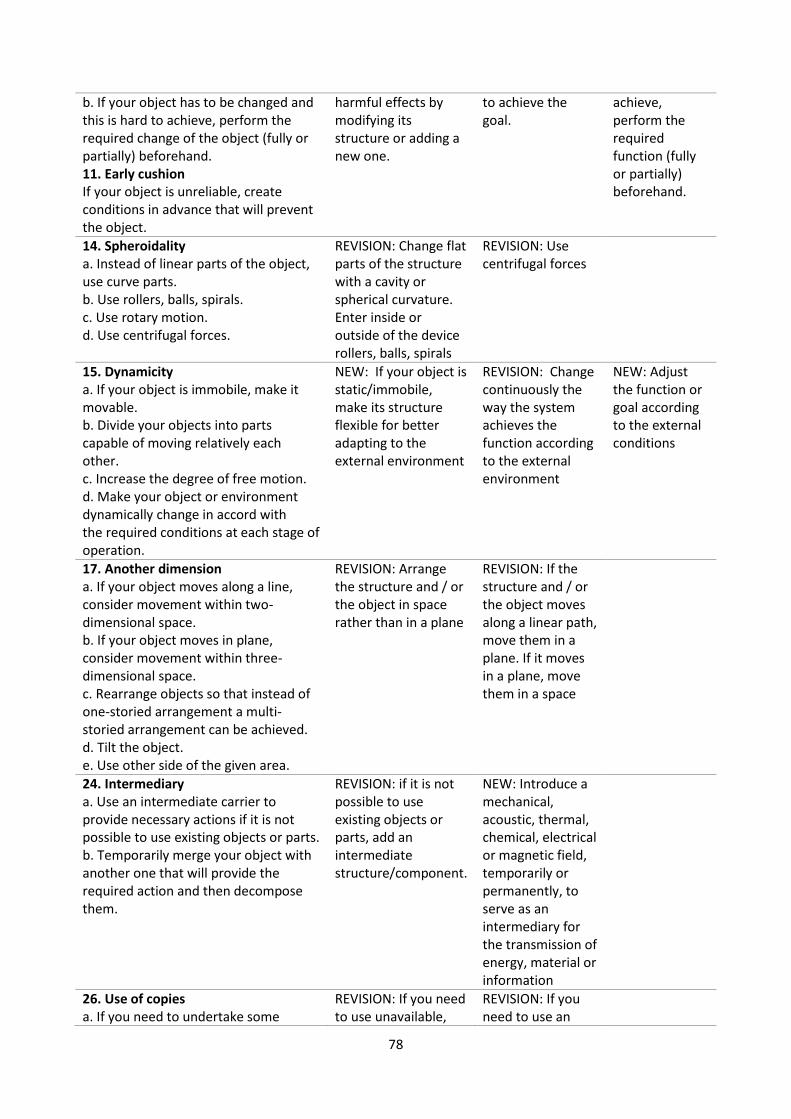
78
b. If your object has to be changed and this is hard to achieve, perform the required change of the object (fully or partially) beforehand. 11. Early cushion If your object is unreliable, create conditions in advance that will prevent the object.
harmful effects by modifying its structure or adding a new one.
to achieve the goal.
achieve, perform the required function (fully or partially) beforehand.
14. Spheroidality a. Instead of linear parts of the object, use curve parts. b. Use rollers, balls, spirals. c. Use rotary motion. d. Use centrifugal forces.
REVISION: Change flat parts of the structure with a cavity or spherical curvature. Enter inside or outside of the device rollers, balls, spirals
REVISION: Use centrifugal forces
15. Dynamicity a. If your object is immobile, make it movable. b. Divide your objects into parts capable of moving relatively each other. c. Increase the degree of free motion. d. Make your object or environment dynamically change in accord with the required conditions at each stage of operation.
NEW: If your object is static/immobile, make its structure flexible for better adapting to the external environment
REVISION: Change continuously the way the system achieves the function according to the external environment
NEW: Adjust the function or goal according to the external conditions
17. Another dimension a. If your object moves along a line, consider movement within two-dimensional space. b. If your object moves in plane, consider movement within three-dimensional space. c. Rearrange objects so that instead of one-storied arrangement a multi-storied arrangement can be achieved. d. Tilt the object. e. Use other side of the given area.
REVISION: Arrange the structure and / or the object in space rather than in a plane
REVISION: If the structure and / or the object moves along a linear path, move them in a plane. If it moves in a plane, move them in a space
24. Intermediary a. Use an intermediate carrier to provide necessary actions if it is not possible to use existing objects or parts. b. Temporarily merge your object with another one that will provide the required action and then decompose them.
REVISION: if it is not possible to use existing objects or parts, add an intermediate structure/component.
NEW: Introduce a mechanical, acoustic, thermal, chemical, electrical or magnetic field, temporarily or permanently, to serve as an intermediary for the transmission of energy, material or information
26. Use of copies a. If you need to undertake some
REVISION: If you need to use unavailable,
REVISION: If you need to use an
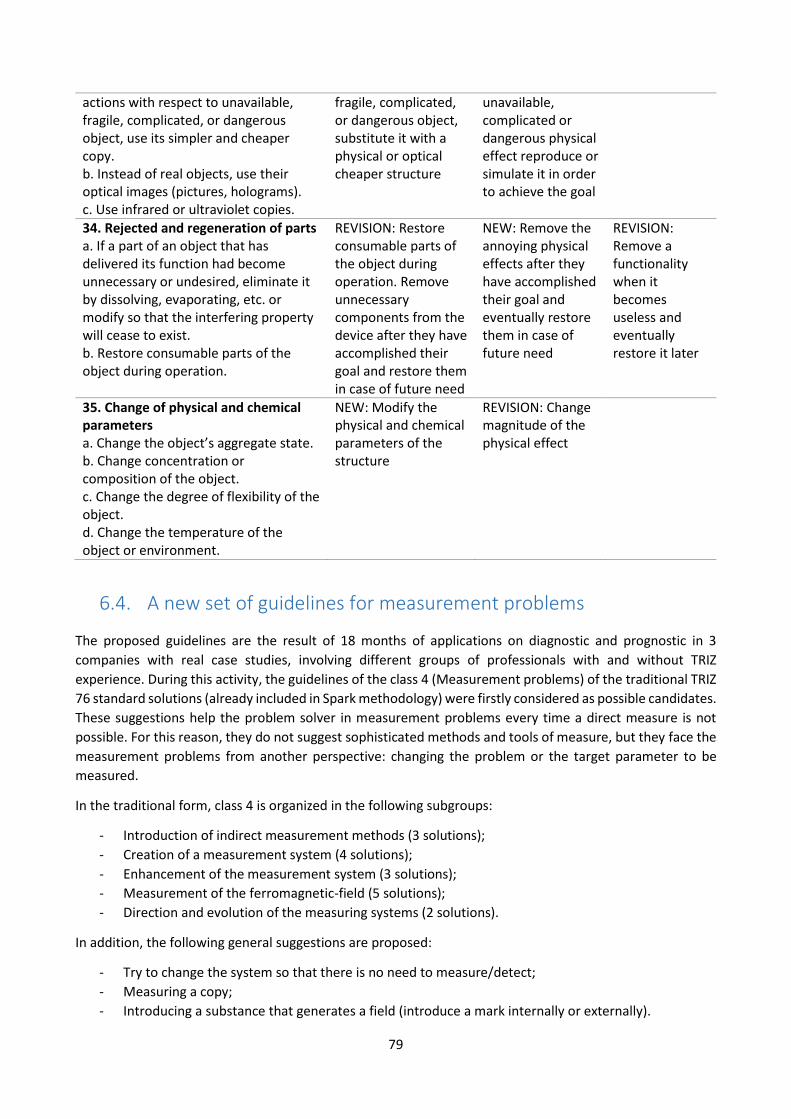
79
actions with respect to unavailable, fragile, complicated, or dangerous object, use its simpler and cheaper copy. b. Instead of real objects, use their optical images (pictures, holograms). c. Use infrared or ultraviolet copies.
fragile, complicated, or dangerous object, substitute it with a physical or optical cheaper structure
unavailable, complicated or dangerous physical effect reproduce or simulate it in order to achieve the goal
34. Rejected and regeneration of parts a. If a part of an object that has delivered its function had become unnecessary or undesired, eliminate it by dissolving, evaporating, etc. or modify so that the interfering property will cease to exist. b. Restore consumable parts of the object during operation.
REVISION: Restore consumable parts of the object during operation. Remove unnecessary components from the device after they have accomplished their goal and restore them in case of future need
NEW: Remove the annoying physical effects after they have accomplished their goal and eventually restore them in case of future need
REVISION: Remove a functionality when it becomes useless and eventually restore it later
35. Change of physical and chemical parameters a. Change the object’s aggregate state. b. Change concentration or composition of the object. c. Change the degree of flexibility of the object. d. Change the temperature of the object or environment.
NEW: Modify the physical and chemical parameters of the structure
REVISION: Change magnitude of the physical effect
6.4. A new set of guidelines for measurement problems
The proposed guidelines are the result of 18 months of applications on diagnostic and prognostic in 3
companies with real case studies, involving different groups of professionals with and without TRIZ
experience. During this activity, the guidelines of the class 4 (Measurement problems) of the traditional TRIZ
76 standard solutions (already included in Spark methodology) were firstly considered as possible candidates.
These suggestions help the problem solver in measurement problems every time a direct measure is not
possible. For this reason, they do not suggest sophisticated methods and tools of measure, but they face the
measurement problems from another perspective: changing the problem or the target parameter to be
measured.
In the traditional form, class 4 is organized in the following subgroups:
- Introduction of indirect measurement methods (3 solutions);
- Creation of a measurement system (4 solutions);
- Enhancement of the measurement system (3 solutions);
- Measurement of the ferromagnetic-field (5 solutions);
- Direction and evolution of the measuring systems (2 solutions).
In addition, the following general suggestions are proposed:
- Try to change the system so that there is no need to measure/detect;
- Measuring a copy;
- Introducing a substance that generates a field (introduce a mark internally or externally).

80
However, since their introduction, several efforts have been spent to improve them in order to overcome
the difficulties in their application. Some authors (e.g., Khomenko, 2002 [123] and Souchkov, 1997 [124])
proposed new suggestions with the aim to facilitate their use. Other authors reformulated the standards by
providing new notations (e.g., Kim, 2012 [125]) and new classifications (e.g., Mann, 2002 [7]). Several efforts
have been spent in reducing the number of standards and the classes: Soderlin (2003)[126] proposed three
main classes: improving the system with little or no change; improving the system by changing the solution;
detection and measurement. However, despite the improvements proposed during the years, the standards
solutions still struggle in the application of everyday engineering practice. Moreover, these works have only
marginally interested the fourth class of the standards that still have the following limitations:
- the standards of these group acts at different levels of detail: some are too general (#4.1.1. Changing
the measurement problem), others too specific (#4.3.2 Excite resonance oscillations).
- They do not have a hierarchical structure constituted by levels and sub-levels but they are all
contained in the same class.
- They suggest only to use of certain resources for solving the measurement problems (#4.4.3.
Introduce ferromagnetic additives in the substance), missing all the others.
- They do not integrate well with database of resources, physical effects and results from information
retrieval (e.g., patent analysis).
For these reasons, a new set of guidelines for the measure problems has been developed. On the basis of
what learned about the various contexts of application, the new guidelines are constituted by a less rigorous
methodological formalism in favor of a leaner and more practical structure. In this way, they can be more
easily applied, especially in industrial contexts. In particular, for achieving these aims the following sub-goals
have been considered:
- Research of a schematic representation of the guidelines.
- Possibility of customizing the guidelines with a specific domain jargon.
- Integrating the standards with the databases of the resources (Physical effects DB and Structures
DB).
To do this, the proposed schema, firstly presented in Russo and Spreafico (2016)[127], reorganizes all the
suggestions into three main groups that express in what way a measurement can be performed:
1) Changing the problem in order to NOT measure the desired parameter (Altshuller’s classes 4.1.1).
2) Maintain the technical parameter and measure it.
3) Measure a copy of the object (Altshuller’s classes 4.1.2). Use substance database for selecting it.
In turn, if we maintain the technical parameter we can directly measure the interesting parameter X on it or
performing and indirect measure (suggestion implicitly contained in the traditional standards) or the
measure of a parameter Y influenced by X. In particular, the indirect measure contains all the other standards
that have been revised.
Firstly, we must understand the meaning of relation between the parameters and the indirect measure. In
logical-mathematical language, two parameters X and Y are related if Y=f(X) or X=g(Y), where the first one is
named “dependent” parameter, the second one is “independent” and “f” is an expression that explains the
linkage between them. While we perform a measure on a certain physical phenomenon (the degree of
vacuum) or a physical object, X is a parameter that describe it and that we want to measure (the pressure of
the gas inside an ampoule). Y is instead another parameter of the same phenomenon/object that we really
measure because is more detachable than X. Given Y, we can obtain X through the expression Y=f(X). The
nature of the relation f(X) depends on the degree of correspondence of the measure on X. The function f can
be an analytical or a numerical expression that in case introduce a certain error on the derivative measure;
other errors are introduced during the direct measure of X and Y.

81
Another clarification about the nature of X and Y regards the measured quantities. If we are interested on
the absolute quantity (“measuring the value of the pressure of a gas”) we have to entirely consider both X
and Y; while if we are interested in a variation of the standard state (“measure the overpressure caused
by …”) we consider ∆X and ∆Y and the relation between them is ∆Y=g(∆X), where the relation g is not
necessary equal to f. This second situation is more used for detecting the anomalies in technical systems. For
the explanation of the proposed method and for its use, the differences between X and ∆X are not important;
on the contrary, this difference has to be considered during the evaluation of the measurement tools.
On the basis of these observations, the group of the guidelines for the indirect measure has been divided
into two guidelines that suggest how to perform an indirect measure at a first level: (I) measure a field (F1)
or (II) a substance (S1) directly influenced by the technical system, instead of the technical system itself.
In addition to these guidelines (that work at the step 1 of the indirect measure), other ones have been
proposed for developing the suggestions provided by those already consider. The new guideless (step 2 of
the indirect measure) can be used when the first-step guidelines cannot be applied due to insufficient
magnitude of the field for performing the measure of the variation of the parameter or the substance cannot
be detected. Two other guidelines suggest how to make an indirect measure at a second level: (I) measure a
substance (S2) influenced by the field (F1), in turn influenced by the technical system and (II) measure a field
(F2) influence by the substance (S1). The guidelines of the step 2 are a novelty respect the traditional standard
solutions that they do not explicitly provided suggestions that work in this way.
FIGURE 42: LOGIC SCHEME OF THE INDIRECT MEASURES (STEP 1 AND STEP 2).
Fields and substances can be already present in the technical system or they have to be introduced
(activated). For their selection the effects DB and structure DB can be used.
Figure 43 represents the proposed scheme of guidelines for supporting measurement problems.
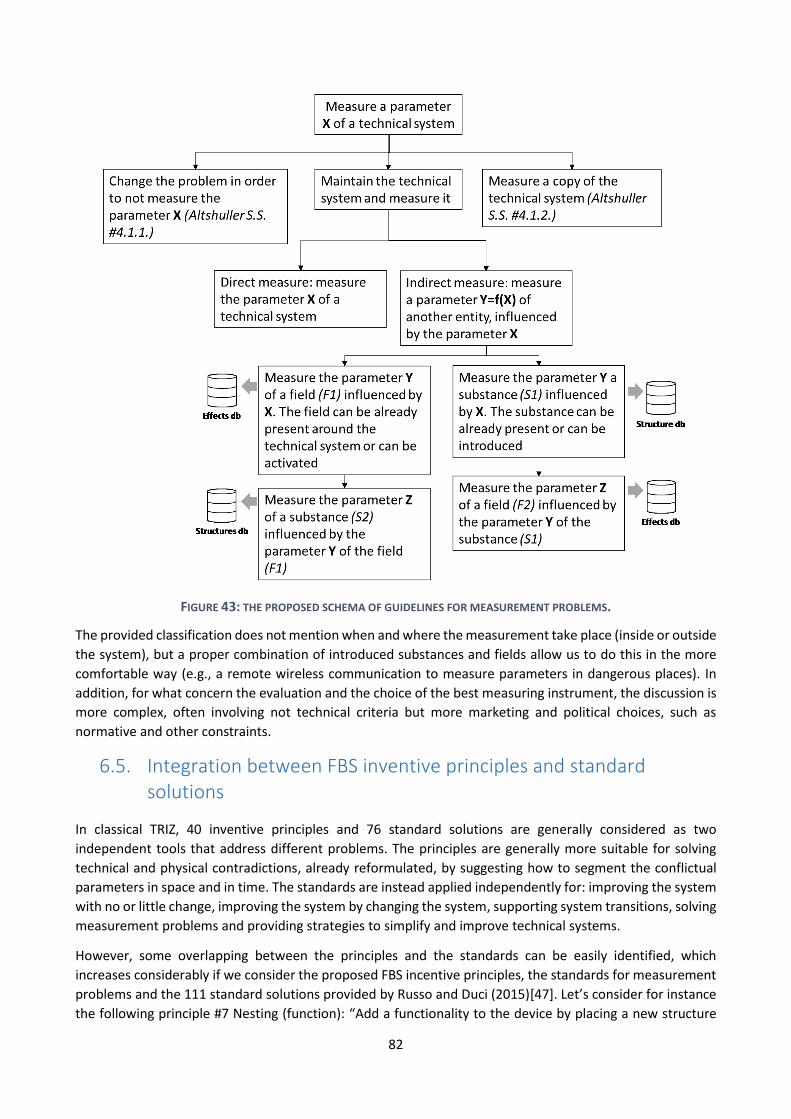
82
FIGURE 43: THE PROPOSED SCHEMA OF GUIDELINES FOR MEASUREMENT PROBLEMS.
The provided classification does not mention when and where the measurement take place (inside or outside
the system), but a proper combination of introduced substances and fields allow us to do this in the more
comfortable way (e.g., a remote wireless communication to measure parameters in dangerous places). In
addition, for what concern the evaluation and the choice of the best measuring instrument, the discussion is
more complex, often involving not technical criteria but more marketing and political choices, such as
normative and other constraints.
6.5. Integration between FBS inventive principles and standard solutions
In classical TRIZ, 40 inventive principles and 76 standard solutions are generally considered as two
independent tools that address different problems. The principles are generally more suitable for solving
technical and physical contradictions, already reformulated, by suggesting how to segment the conflictual
parameters in space and in time. The standards are instead applied independently for: improving the system
with no or little change, improving the system by changing the system, supporting system transitions, solving
measurement problems and providing strategies to simplify and improve technical systems.
However, some overlapping between the principles and the standards can be easily identified, which
increases considerably if we consider the proposed FBS incentive principles, the standards for measurement
problems and the 111 standard solutions provided by Russo and Duci (2015)[47]. Let’s consider for instance
the following principle #7 Nesting (function): “Add a functionality to the device by placing a new structure

83
inside it” with this revised standard: “(H) If you have a missing action, (H4) Combine the system with another
system”.
Consequently, a unique and complete representation for the guidelines that support idea generation has
been proposed. The resulting scheme is based on hierarchical structure proposed by Russo and Duci
(2015)[47], enlarged with new groups for facing contradictions and measurement problems, and includes all
the considered guidelines, specifically divided, recombined and redistributed. The suggestions provided for
each group have also been distributed according to the level of detail according in line with what has been
learned from the study on the structure of the guidelines: level 0 (4 faced problems/goal), level 1 (generic
suggestion), level 2 (specific suggestion), level 3 (examples and results). In this way, the more abstract
guidelines provide strategic suggestions for facing the problems while the more specific ones suggesting
specific solutions at an operative level by integrating the “Helpers”, already proposed by the 111 standard
solutions. The helpers are specific suggestion regarding the adding and the modifications of substances and
physical effects in the technical system. Let’s consider for instance the helper “Add a substance” that suggest
more abstract triggers such as “Add a present substance” or “Introduce chemical compound”, derived by the
standards and more detailed suggestions deriving from the principles, e.g., “Change flat parts of the structure
with a cavity or spherical curvature. Enter inside or outside of the device rollers, balls, spirals”.
The resulting scheme of guidelines addresses four kinds of problems (main goals): (1) Solving a contradiction,
(2) Eliminating a harmful action or reducing an excessive action, (3) Improve an insufficient action and
Replace a missing action and (4) Solving measurement problems. The goals suggest the sub-goals or directly
the generic suggestions, that in turn can be applied through specific suggestions: some FBS inventive
principles (e.g., “IP7: Nesting-Function”) and the helpers (figure 45) that in turn contain other FBS principles.
In particular, for solving a contradiction also TRIZ separation principles have been added to the scheme in
order to better organize the guidelines contained in this group. The guidelines provided in the scheme specify
the resolutive directions for solving the problems and they suggest what helper can be used for developing
them in the various cases. The helpers are divided into four sub-groups (F+: “activate a field”, S+: “add a
substance”, F*: “modify a field” and S*: “modify a substance”).
Figure 44 shows the proposed scheme of the guidelines for supporting idea generation:
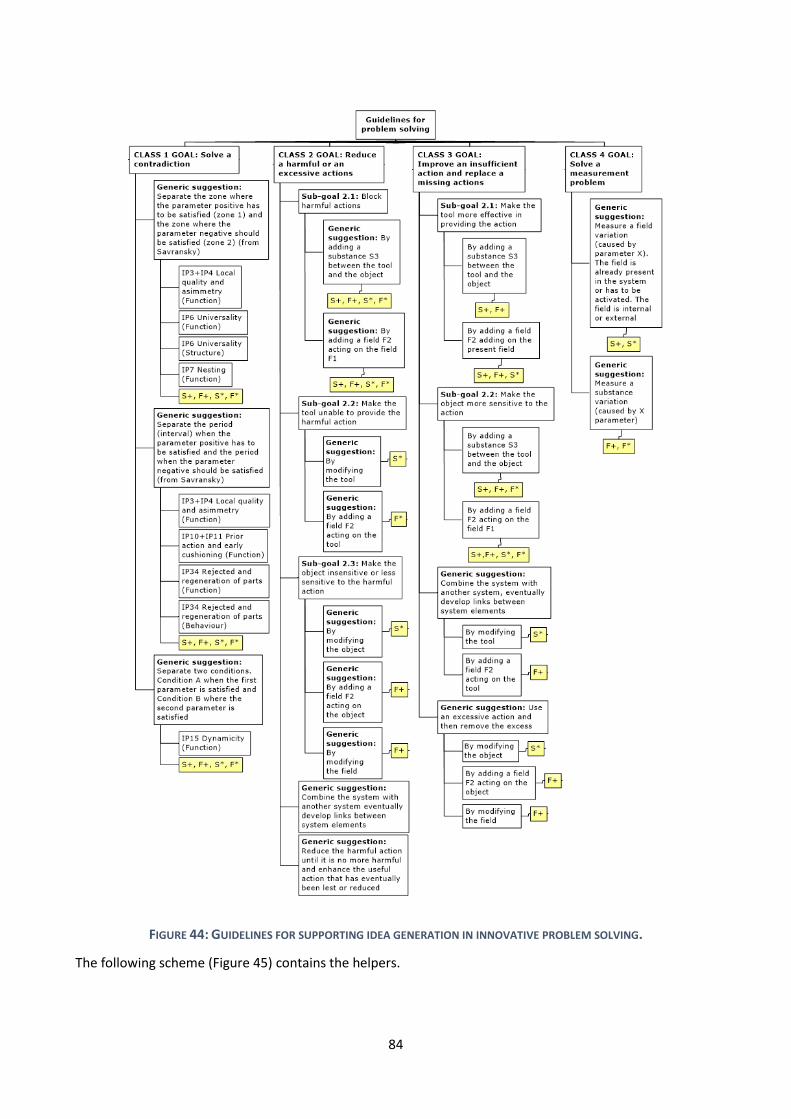
84
FIGURE 44: GUIDELINES FOR SUPPORTING IDEA GENERATION IN INNOVATIVE PROBLEM SOLVING.
The following scheme (Figure 45) contains the helpers.
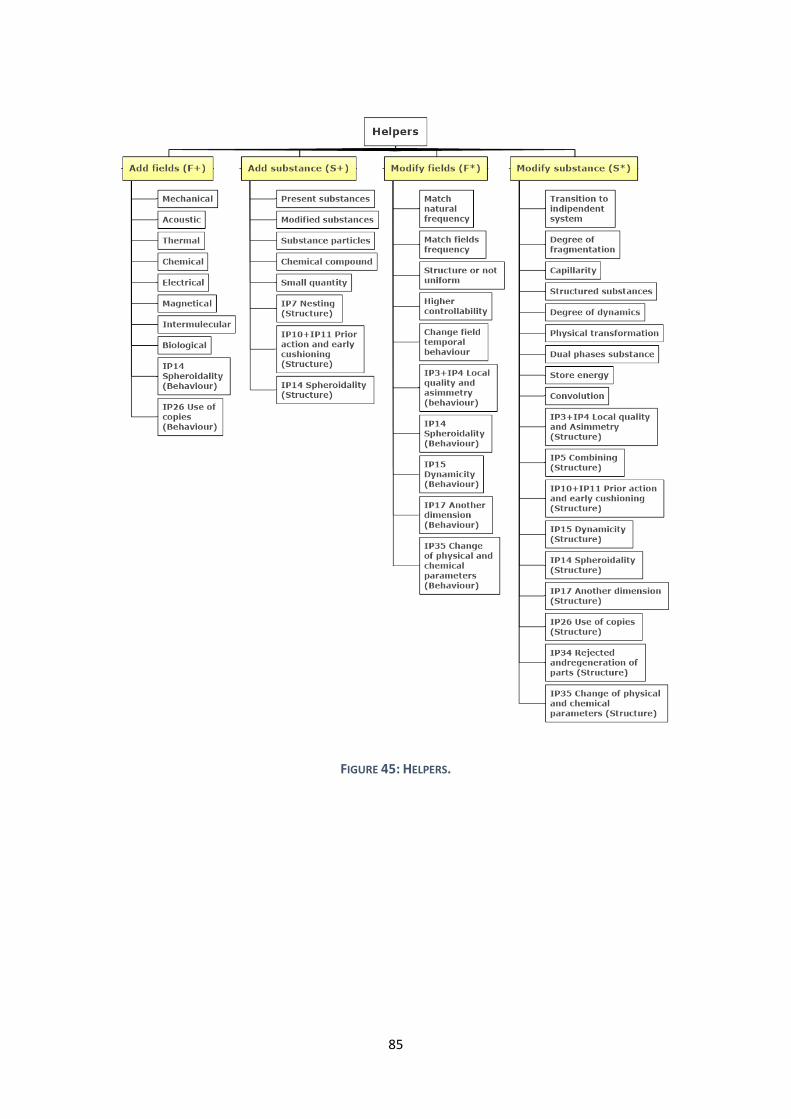
85
FIGURE 45: HELPERS.
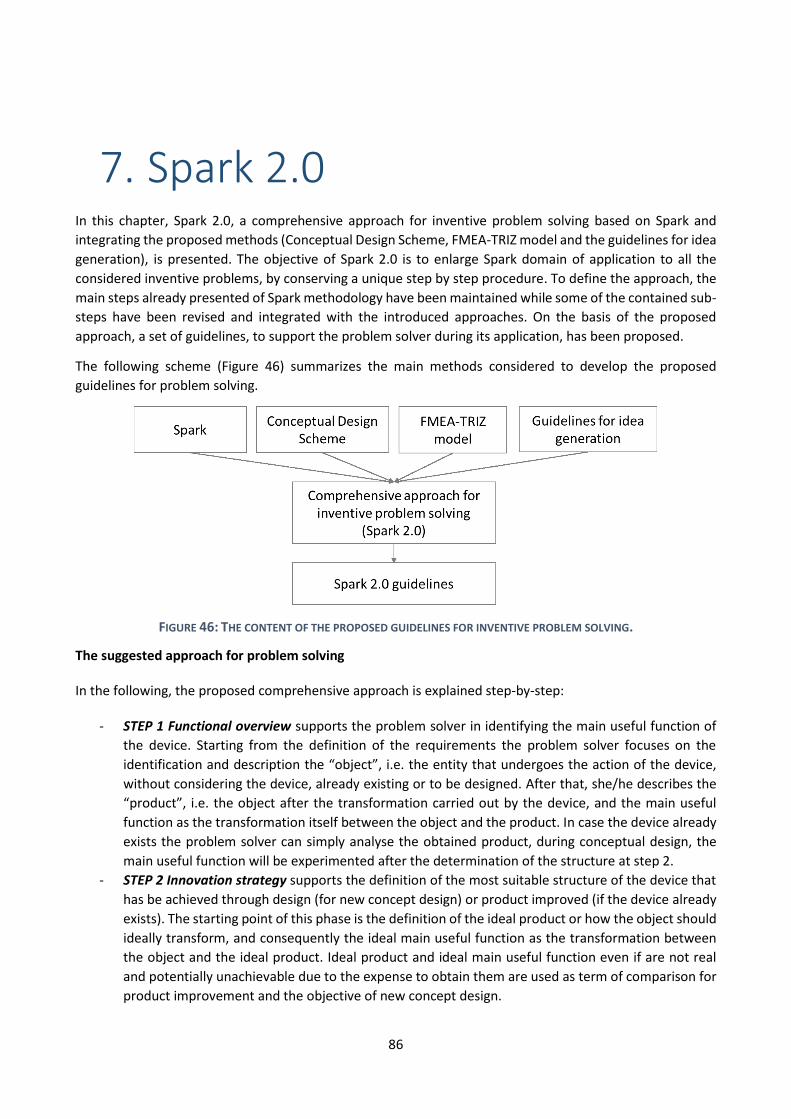
86
7. Spark 2.0 In this chapter, Spark 2.0, a comprehensive approach for inventive problem solving based on Spark and
integrating the proposed methods (Conceptual Design Scheme, FMEA-TRIZ model and the guidelines for idea
generation), is presented. The objective of Spark 2.0 is to enlarge Spark domain of application to all the
considered inventive problems, by conserving a unique step by step procedure. To define the approach, the
main steps already presented of Spark methodology have been maintained while some of the contained sub-
steps have been revised and integrated with the introduced approaches. On the basis of the proposed
approach, a set of guidelines, to support the problem solver during its application, has been proposed.
The following scheme (Figure 46) summarizes the main methods considered to develop the proposed
guidelines for problem solving.
FIGURE 46: THE CONTENT OF THE PROPOSED GUIDELINES FOR INVENTIVE PROBLEM SOLVING.
The suggested approach for problem solving
In the following, the proposed comprehensive approach is explained step-by-step:
- STEP 1 Functional overview supports the problem solver in identifying the main useful function of
the device. Starting from the definition of the requirements the problem solver focuses on the
identification and description the “object”, i.e. the entity that undergoes the action of the device,
without considering the device, already existing or to be designed. After that, she/he describes the
“product”, i.e. the object after the transformation carried out by the device, and the main useful
function as the transformation itself between the object and the product. In case the device already
exists the problem solver can simply analyse the obtained product, during conceptual design, the
main useful function will be experimented after the determination of the structure at step 2.
- STEP 2 Innovation strategy supports the definition of the most suitable structure of the device that
has be achieved through design (for new concept design) or product improved (if the device already
exists). The starting point of this phase is the definition of the ideal product or how the object should
ideally transform, and consequently the ideal main useful function as the transformation between
the object and the ideal product. Ideal product and ideal main useful function even if are not real
and potentially unachievable due to the expense to obtain them are used as term of comparison for
product improvement and the objective of new concept design.
87
In addition, during this step, the problem solver identifies where and when the ideal main useful
function should be realized. This aspect provides the strategy for reducing the consumption of the
involved resources.
Once the ideal product has been defined, the problem solver determines the expected behaviour of
the device, or the most suitable sequence of states, among some possibilities, that describe the
theoretical transformation of the object into the ideal product. At this point, the structure of the
device for realising the ideal function according to the expected behaviour can be determined and
produced. In new concept design, through the realisation of the structure and its testing we obtain
the actual behaviour of the device. The comparison of the actual behaviour and the expected
behaviour provide an evaluation about the current of ideality of the device.
- STEP 3 Problem identification supports the problem solver to find the possible problems of the
current device on the basis of the actual behaviour or to identify possible future failures, if the
comparison is currently satisfying.
- After that, the problem solver better describes the identified problems, by specifying the operative
time and the operative zone of occurrence, she/he divides them into simpler sub-problems and
she/he chooses one of them to be solved.
- STEP 4 Problem formulation helps in translating the selected sub-problem in a more suitable way to
be solved, by providing a specific formalism based on the following main categories:
o Presence of contradiction;
o Presence of insufficient or missing action;
o Presence of harmful or excessive action;
o Presence of measurement problem.
- STEP 5 Idea generation supports the problem solver during the generation of the possible ideas for solving the reformulated sub-problems through the series of proposed guidelines, suggestions and triggers, organized according to the formulated problems.
Figure 47 shows the proposed approach:
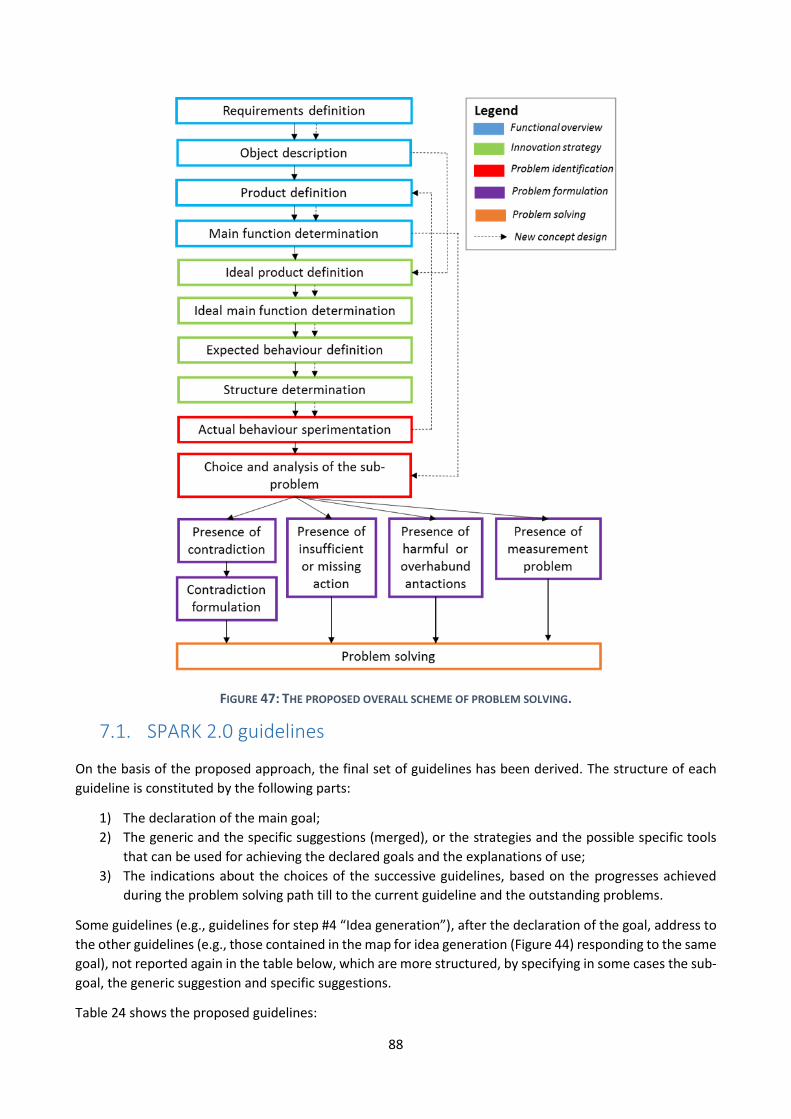
88
FIGURE 47: THE PROPOSED OVERALL SCHEME OF PROBLEM SOLVING.
7.1. SPARK 2.0 guidelines
On the basis of the proposed approach, the final set of guidelines has been derived. The structure of each
guideline is constituted by the following parts:
1) The declaration of the main goal;
2) The generic and the specific suggestions (merged), or the strategies and the possible specific tools
that can be used for achieving the declared goals and the explanations of use;
3) The indications about the choices of the successive guidelines, based on the progresses achieved
during the problem solving path till to the current guideline and the outstanding problems.
Some guidelines (e.g., guidelines for step #4 “Idea generation”), after the declaration of the goal, address to
the other guidelines (e.g., those contained in the map for idea generation (Figure 44) responding to the same
goal), not reported again in the table below, which are more structured, by specifying in some cases the sub-
goal, the generic suggestion and specific suggestions.
Table 24 shows the proposed guidelines:
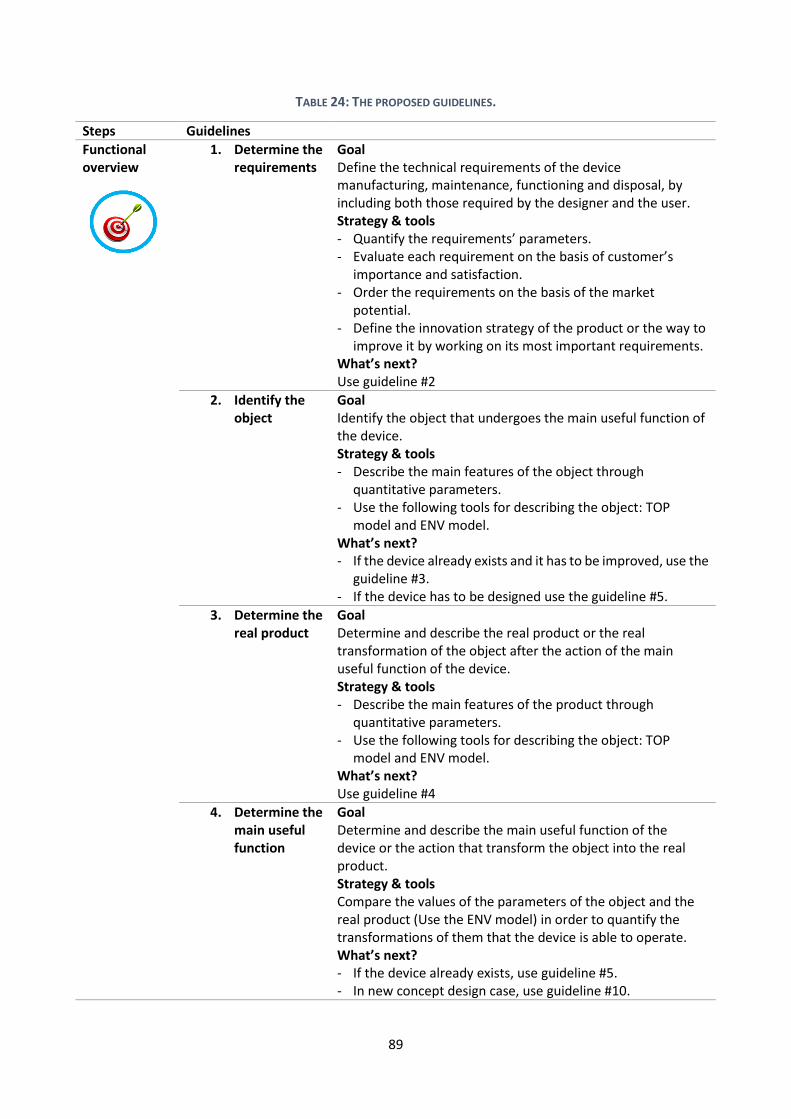
89
TABLE 24: THE PROPOSED GUIDELINES.
Steps Guidelines
Functional overview
1. Determine the requirements
Goal Define the technical requirements of the device manufacturing, maintenance, functioning and disposal, by including both those required by the designer and the user. Strategy & tools - Quantify the requirements’ parameters. - Evaluate each requirement on the basis of customer’s
importance and satisfaction. - Order the requirements on the basis of the market
potential. - Define the innovation strategy of the product or the way to
improve it by working on its most important requirements. What’s next? Use guideline #2
2. Identify the object
Goal Identify the object that undergoes the main useful function of the device. Strategy & tools - Describe the main features of the object through
quantitative parameters. - Use the following tools for describing the object: TOP
model and ENV model. What’s next? - If the device already exists and it has to be improved, use the
guideline #3. - If the device has to be designed use the guideline #5.
3. Determine the real product
Goal Determine and describe the real product or the real transformation of the object after the action of the main useful function of the device. Strategy & tools - Describe the main features of the product through
quantitative parameters. - Use the following tools for describing the object: TOP
model and ENV model. What’s next? Use guideline #4
4. Determine the main useful function
Goal Determine and describe the main useful function of the device or the action that transform the object into the real product. Strategy & tools Compare the values of the parameters of the object and the real product (Use the ENV model) in order to quantify the transformations of them that the device is able to operate. What’s next? - If the device already exists, use guideline #5. - In new concept design case, use guideline #10.
90
Innovation strategy
5. Determine the ideal product
Goal Determine the ideal product or the ideal transformation of the object able to fully satisfy all the requirements. Strategy & tools - Determine how the ideal product could be by using
forecasting scenarios (Laws of Technical System Evolution) and quantify the features through parameters (use ENV model).
What’s next? Use guideline #6
6. Determine the ideal main useful function
Goal Determine and describe the ideal main useful function of the device according to designer and user’s perspectives. Strategy & tools - Compare the features of the object and of the ideal
product and determine the ideal main useful function that transform the object into the ideal product. (Use ENV model).
- Determine the operative zone and the operative time of occurrence of the ideal main useful function on the object.
- Determine the affordances of the device according to designer and user’s perspectives (See Guideline for NCD #2).
What’s next? Use guideline #7
7. Determine the expected behaviour
Goal Determine the expected behaviour of the device or the sequence of states that describe the transformation of the object into the ideal product, without including the device in the description. Strategy & tools - Determine the kinematic and the dynamic of the
transformation by including the morphological aspects (deformations) and the involved stress and forces.
- Determine the required physical effects: use physical effects DB.
- Determine the user’s expected manipulation without defining the structure of the device, by defining the most suitable ergonomic aspects (posture and energy required).
Evaluate the best expected behaviours and manipulations among those hypothesized: use Laws of Technical System Evolution and take advantage on practical evidences. What’s next? Use guideline #8
8. Determine the structure of the device
Goal - If the device does not exist, design the structure of the
device that realize the main useful function according to the expected behaviour (See Guideline for NCD #5).
- If the device already exists, describe the structure of the device.
Strategy & tools
91
- Define the interference part of the structure and the inner part of the structure.
- Use MTS model in order to understand the degree of completeness of the system for summarising the elements of the system and comprehend its degree of completeness.
- Use structure DB, patent DB and catalogues for identify and modify the component.
What’s next? Use guideline #9
Problem identification and reformulation
9. Determine the actual behaviour
Goal Describe the actual behaviour of the device or the sequence of states that carry the transform the object into the real product. Strategy & tools - Test the structure of the device in its real functioning for
producing the real product. - In case of new concept design, realize a prototype of the
structure and test it. What’s next? - In case of new concept design, use guideline #3 - If the device already exists, use guideline #10
10. Evaluate the device and analyse of the sub-problems
Goal Evaluate the device by comparing the actual behaviour and the real obtained product with the expected behaviour and the ideal product respectively. If the comparison is not satisfying, identify the sub-problem to solve. Strategy & tools By analysing the chain of states of the actual behaviour, identify the photogram of occurrence of the fault and: - Find a sub-problem before the occurrence of the fault if
you want to anticipate it. - Find a sub-problem contemporary to the fault for solving
the problem when it occurs. - Find a sub-problem successive to the occurrence of the
fault for mitigating the problem. - If the sub-problem does not contain the fault, choose
another sub-problem and analyse it. Analyse the selected sub-problem through TRIZ functional analysis. What’s next? - If the selected sub-problem contains: o An insufficient action that can be improved without
contradictions, use guideline #12. o A harmful action, whose improvement implicates a
contradiction, use guideline #13. o A measurement problem, use guideline #14.
- If the sub-problem does not contain the fault, find a possible future failure effect, by using guideline #11.
11. Find failure effects, failure
Goal
92
modes and failure causes
- Perturb the current situation of the sub-problem for determining the possible failure modes of the identified elements and the modified shared actions.
- Determine the failure effects deriving from the modified situation of the sub-problem.
- Determine the failure causes of the failure modes and failure effects.
Strategy & tools Use guideline #3, #4, #5 for anticipatory failure investigation. What’s next? If the identified failure causes are provoked by: - An insufficient, missing, harmful or excessive action, whose
modification generate a contradiction with other parameters, use guideline #12 for formulating the contradiction.
- A harmful or an excessive action that can be eliminated or reduced without a contradiction, use guideline #14.
- An insufficient or a missing action that can be improved without a contradiction, use guideline #15.
- A measurement problem, use guideline #16.
12. Reformulate the problem as contradiction
Goal Reformulate the problem as contradiction by identifying two features of the device in contradiction, in which as result of the improvement of one of them, the other get worse. Strategy & tools - Reformulate the problem as technical contradiction:
identify the two features as two engineering parameters (e.g., mass, length). o Consider the list of the 39 Engineering parameters).
- Reformulate the problem as physical contradiction: identify a control parameter of the device that opportunely set leads to the improvement of one feature and the worsening of the other and vice-versa. In this case, the two features are two requirements of the device.
What’s next? Use Guideline #13.
Idea generation
13. Solve a contradiction
Goal Find a solution able to solve the contradiction or to realise the two features at the same time. Strategy & tools - For solving technical contradiction: use contradiction
matrix. - For solving physical contradiction: use class 1 (Solve a
contradiction) of the guidelines for problem solving. What’s next? Use Guideline #16 to evaluate if the problem has been solved, and find other possible problems.
14. Reduce a harmful or an excessive action
Strategy & tools Use class 2 (Reduce a harmful or an excessive action) of the guidelines for problem solving. What’s next?
93
Use Guideline #16 to evaluate if the problem has been solved, and find other possible problems.
15. Improve an insufficient action or add a missing action
Strategy & tools Use class 3 (Improve an insufficient action and replace a missing actions) of the guidelines for problem solving. What’s next? Use Guideline #16 to evaluate if the problem has been solved, and find other possible problems.
16. Solve a measurement problem
Strategy & tools Use class 4 (Measurement problems) of the guidelines for problem solving. What’s next? Use Guideline #16 to evaluate if the problem has been solved, and find other possible problems.
7.2. Integration of Spark 2.0 guidelines with patent databases
The integration of the proposed guidelines with patent databases provides useful information for their
application (e.g., behaviour, physical effects, technologies, structures and components) and it shows if
someone has already found results compatible with the selected guideline. In order to achieve this aim, a
semiautomatic built system for the compilation of the queries for each guideline has been studied, which are
based on the suggestion provided and the information about the problem and the context of application,
previously inserted by the user.
The queries are constituted by three fields: verb, object and a third additional field. The first one generally
directly derive from the suggestion provided by the guidelines, the second one can contain information about
the problem and the third one regards the context of application. Let’s consider for instance the guideline
#13.1.1 Solve a contradiction problem/Segment the structure, applied to the operative zone (e.g., the
porthole) of a washing machine. The resulting query is: “SEGMENT” + “PORTHOLE” + “WAHSING MACHINE”.
Table 25 summarizes the queries derived from some guidelines and information researched in databases:
TABLE 25: QUERIES DERIVED FROM SOME GUIDELINES.
Guideline Generated query Results from patent DB Verb Object 3rd field
#7 Determine the expected behaviour
Name of the main useful function (Inserted by the user)
Name of the object (Inserted by the user in guideline #2 Identify the object)
/ List of physical effects and field
#8 Determine the structure of the device
Name of the main useful function (Inserted by the user)
Name of the object (Inserted by the user in guideline #2 Identify the object)
Physical effect (selected by the user from the results of guideline #7)
List of structures
#9 Determine the actual behaviour
Measure OR Detect
Name of the Parameter or the requirement to be evaluated (Inserted by the user in guideline #1
/ List of tools for testing the parameters of the actual behaviour
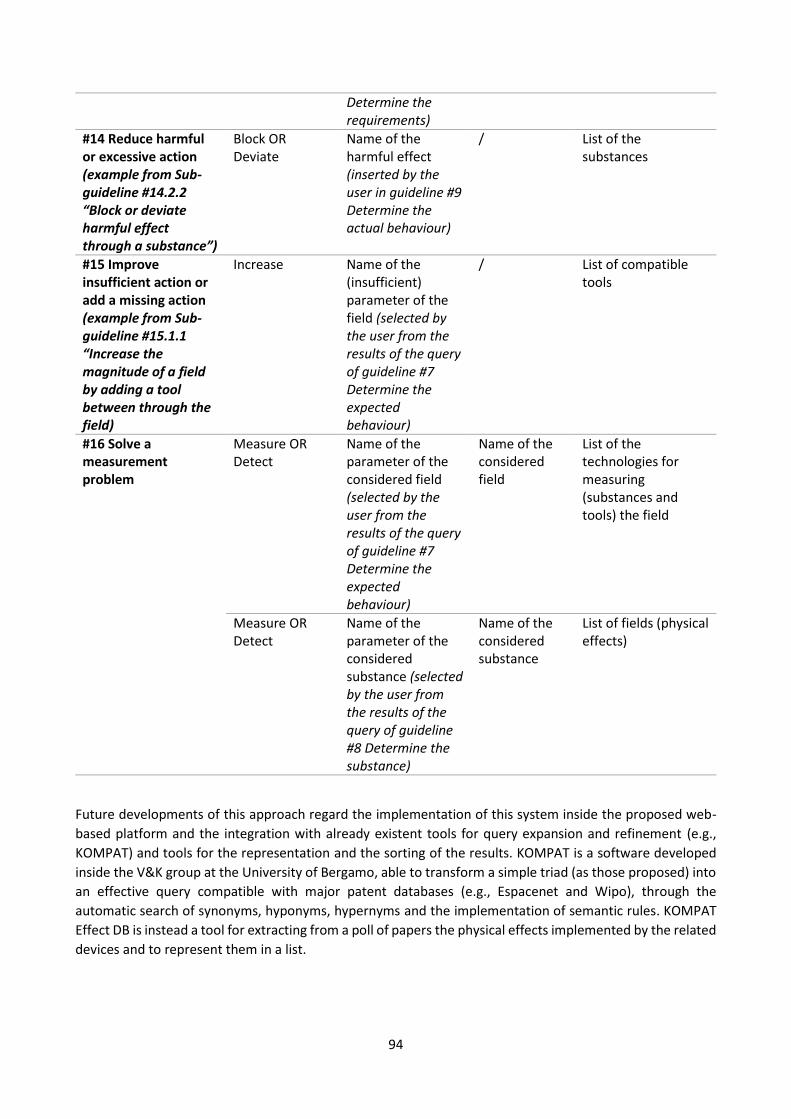
94
Determine the requirements)
#14 Reduce harmful or excessive action (example from Sub-guideline #14.2.2 “Block or deviate harmful effect through a substance”)
Block OR Deviate
Name of the harmful effect (inserted by the user in guideline #9 Determine the actual behaviour)
/ List of the substances
#15 Improve insufficient action or add a missing action (example from Sub-guideline #15.1.1 “Increase the magnitude of a field by adding a tool between through the field)
Increase Name of the (insufficient) parameter of the field (selected by the user from the results of the query of guideline #7 Determine the expected behaviour)
/ List of compatible tools
#16 Solve a measurement problem
Measure OR Detect
Name of the parameter of the considered field (selected by the user from the results of the query of guideline #7 Determine the expected behaviour)
Name of the considered field
List of the technologies for measuring (substances and tools) the field
Measure OR Detect
Name of the parameter of the considered substance (selected by the user from the results of the query of guideline #8 Determine the substance)
Name of the considered substance
List of fields (physical effects)
Future developments of this approach regard the implementation of this system inside the proposed web-
based platform and the integration with already existent tools for query expansion and refinement (e.g.,
KOMPAT) and tools for the representation and the sorting of the results. KOMPAT is a software developed
inside the V&K group at the University of Bergamo, able to transform a simple triad (as those proposed) into
an effective query compatible with major patent databases (e.g., Espacenet and Wipo), through the
automatic search of synonyms, hyponyms, hypernyms and the implementation of semantic rules. KOMPAT
Effect DB is instead a tool for extracting from a poll of papers the physical effects implemented by the related
devices and to represent them in a list.
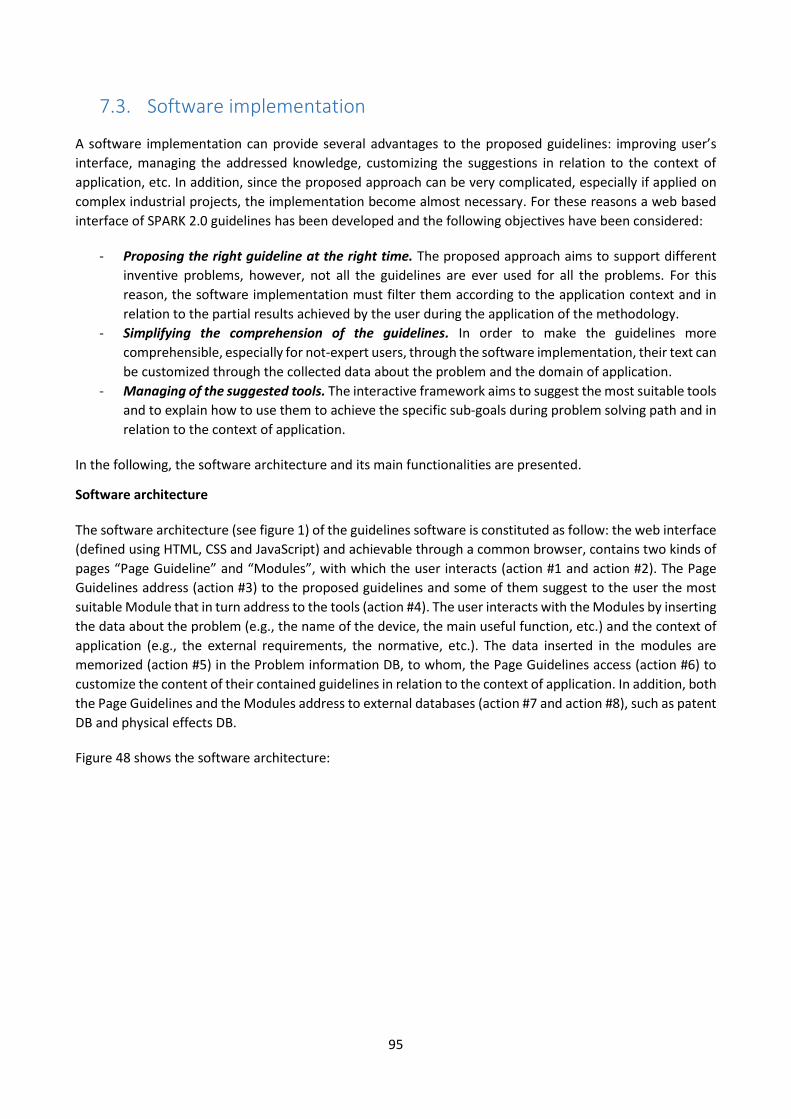
95
7.3. Software implementation
A software implementation can provide several advantages to the proposed guidelines: improving user’s
interface, managing the addressed knowledge, customizing the suggestions in relation to the context of
application, etc. In addition, since the proposed approach can be very complicated, especially if applied on
complex industrial projects, the implementation become almost necessary. For these reasons a web based
interface of SPARK 2.0 guidelines has been developed and the following objectives have been considered:
- Proposing the right guideline at the right time. The proposed approach aims to support different
inventive problems, however, not all the guidelines are ever used for all the problems. For this
reason, the software implementation must filter them according to the application context and in
relation to the partial results achieved by the user during the application of the methodology.
- Simplifying the comprehension of the guidelines. In order to make the guidelines more
comprehensible, especially for not-expert users, through the software implementation, their text can
be customized through the collected data about the problem and the domain of application.
- Managing of the suggested tools. The interactive framework aims to suggest the most suitable tools
and to explain how to use them to achieve the specific sub-goals during problem solving path and in
relation to the context of application.
In the following, the software architecture and its main functionalities are presented.
Software architecture
The software architecture (see figure 1) of the guidelines software is constituted as follow: the web interface
(defined using HTML, CSS and JavaScript) and achievable through a common browser, contains two kinds of
pages “Page Guideline” and “Modules”, with which the user interacts (action #1 and action #2). The Page
Guidelines address (action #3) to the proposed guidelines and some of them suggest to the user the most
suitable Module that in turn address to the tools (action #4). The user interacts with the Modules by inserting
the data about the problem (e.g., the name of the device, the main useful function, etc.) and the context of
application (e.g., the external requirements, the normative, etc.). The data inserted in the modules are
memorized (action #5) in the Problem information DB, to whom, the Page Guidelines access (action #6) to
customize the content of their contained guidelines in relation to the context of application. In addition, both
the Page Guidelines and the Modules address to external databases (action #7 and action #8), such as patent
DB and physical effects DB.
Figure 48 shows the software architecture:
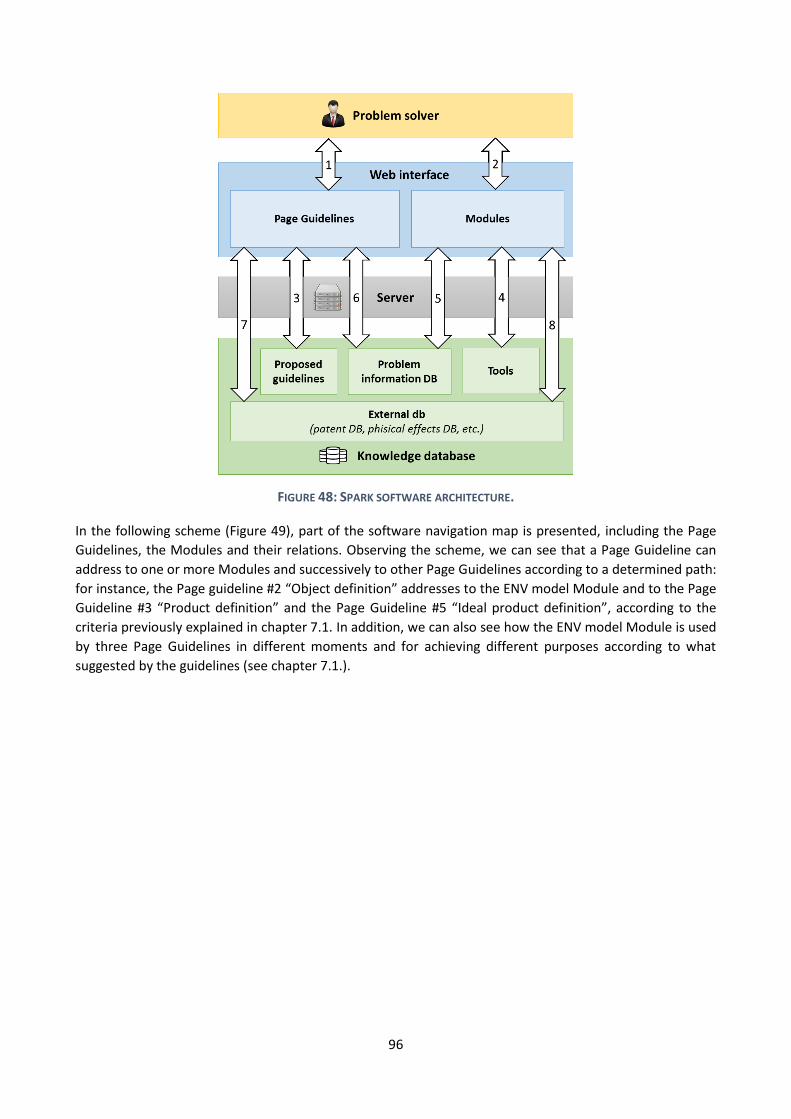
96
FIGURE 48: SPARK SOFTWARE ARCHITECTURE.
In the following scheme (Figure 49), part of the software navigation map is presented, including the Page
Guidelines, the Modules and their relations. Observing the scheme, we can see that a Page Guideline can
address to one or more Modules and successively to other Page Guidelines according to a determined path:
for instance, the Page guideline #2 “Object definition” addresses to the ENV model Module and to the Page
Guideline #3 “Product definition” and the Page Guideline #5 “Ideal product definition”, according to the
criteria previously explained in chapter 7.1. In addition, we can also see how the ENV model Module is used
by three Page Guidelines in different moments and for achieving different purposes according to what
suggested by the guidelines (see chapter 7.1.).
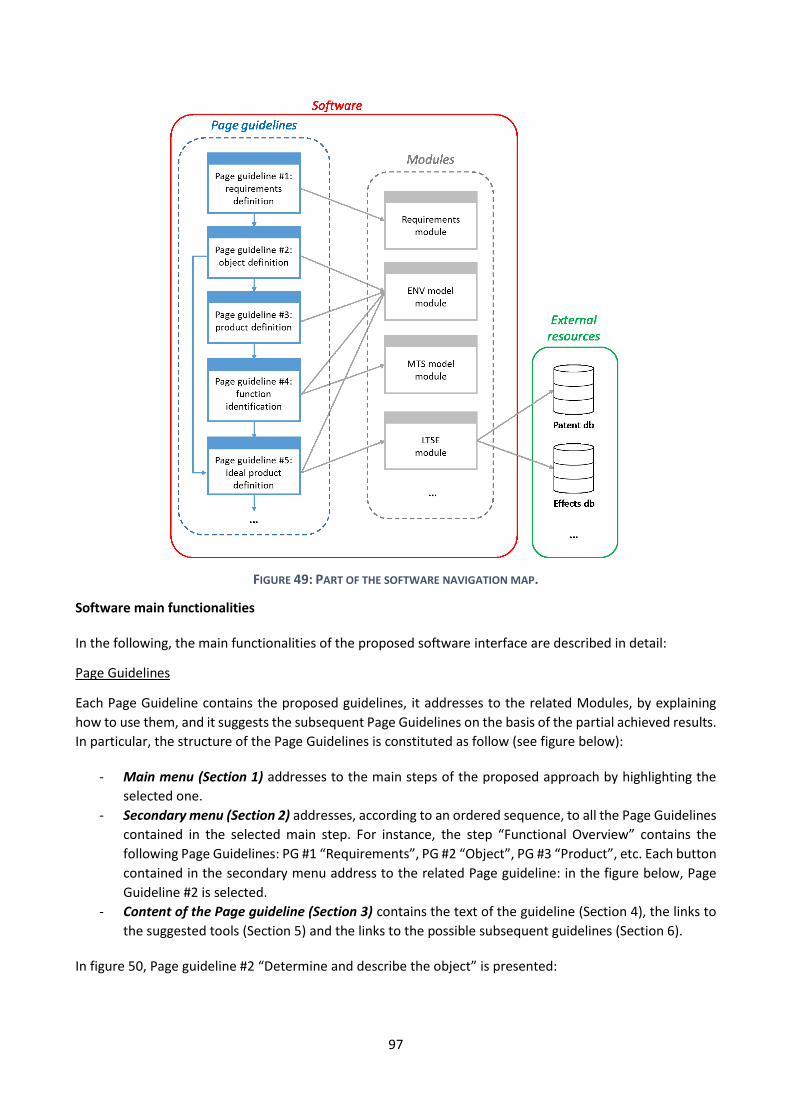
97
FIGURE 49: PART OF THE SOFTWARE NAVIGATION MAP.
Software main functionalities
In the following, the main functionalities of the proposed software interface are described in detail:
Page Guidelines
Each Page Guideline contains the proposed guidelines, it addresses to the related Modules, by explaining
how to use them, and it suggests the subsequent Page Guidelines on the basis of the partial achieved results.
In particular, the structure of the Page Guidelines is constituted as follow (see figure below):
- Main menu (Section 1) addresses to the main steps of the proposed approach by highlighting the
selected one.
- Secondary menu (Section 2) addresses, according to an ordered sequence, to all the Page Guidelines
contained in the selected main step. For instance, the step “Functional Overview” contains the
following Page Guidelines: PG #1 “Requirements”, PG #2 “Object”, PG #3 “Product”, etc. Each button
contained in the secondary menu address to the related Page guideline: in the figure below, Page
Guideline #2 is selected.
- Content of the Page guideline (Section 3) contains the text of the guideline (Section 4), the links to
the suggested tools (Section 5) and the links to the possible subsequent guidelines (Section 6).
In figure 50, Page guideline #2 “Determine and describe the object” is presented:
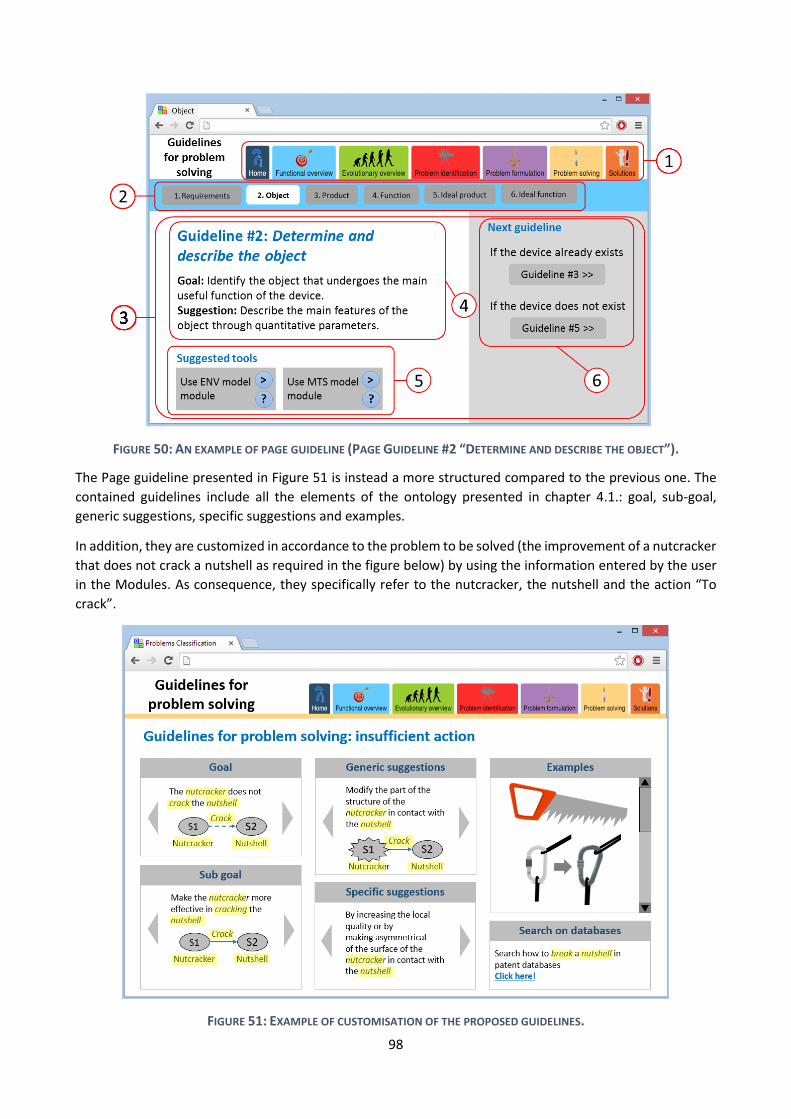
98
FIGURE 50: AN EXAMPLE OF PAGE GUIDELINE (PAGE GUIDELINE #2 “DETERMINE AND DESCRIBE THE OBJECT”).
The Page guideline presented in Figure 51 is instead a more structured compared to the previous one. The
contained guidelines include all the elements of the ontology presented in chapter 4.1.: goal, sub-goal,
generic suggestions, specific suggestions and examples.
In addition, they are customized in accordance to the problem to be solved (the improvement of a nutcracker
that does not crack a nutshell as required in the figure below) by using the information entered by the user
in the Modules. As consequence, they specifically refer to the nutcracker, the nutshell and the action “To
crack”.
FIGURE 51: EXAMPLE OF CUSTOMISATION OF THE PROPOSED GUIDELINES.
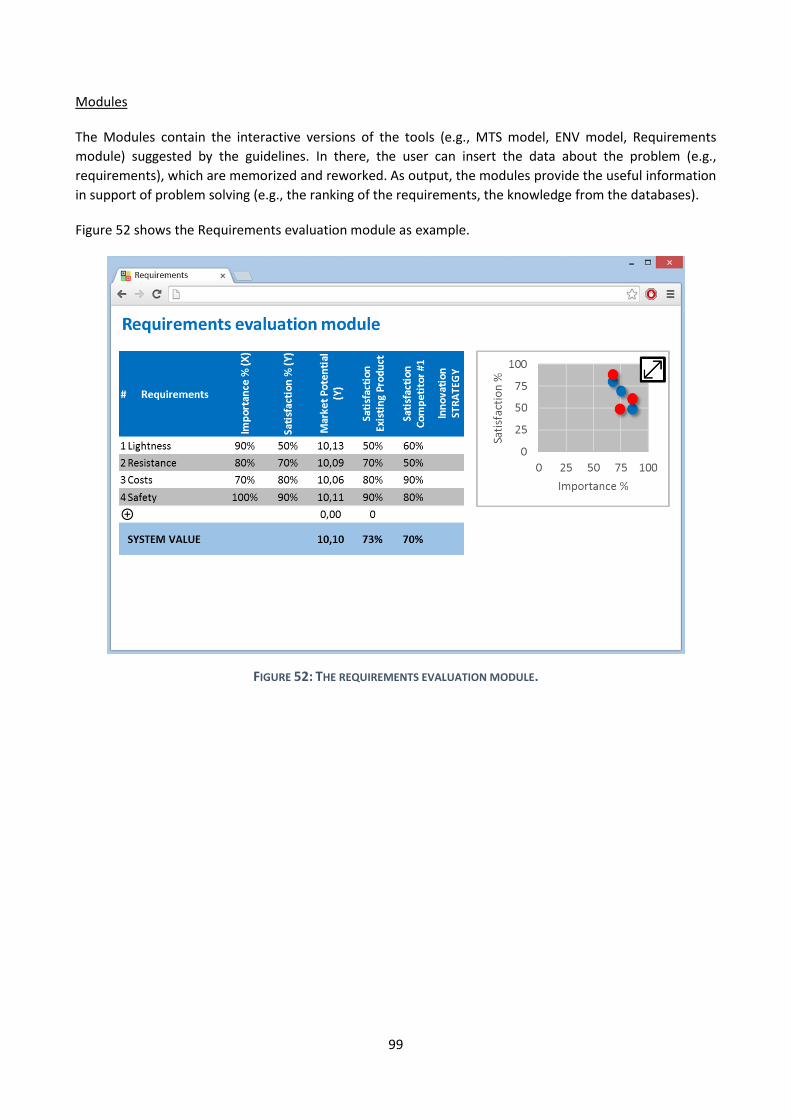
99
Modules
The Modules contain the interactive versions of the tools (e.g., MTS model, ENV model, Requirements
module) suggested by the guidelines. In there, the user can insert the data about the problem (e.g.,
requirements), which are memorized and reworked. As output, the modules provide the useful information
in support of problem solving (e.g., the ranking of the requirements, the knowledge from the databases).
Figure 52 shows the Requirements evaluation module as example.
FIGURE 52: THE REQUIREMENTS EVALUATION MODULE.
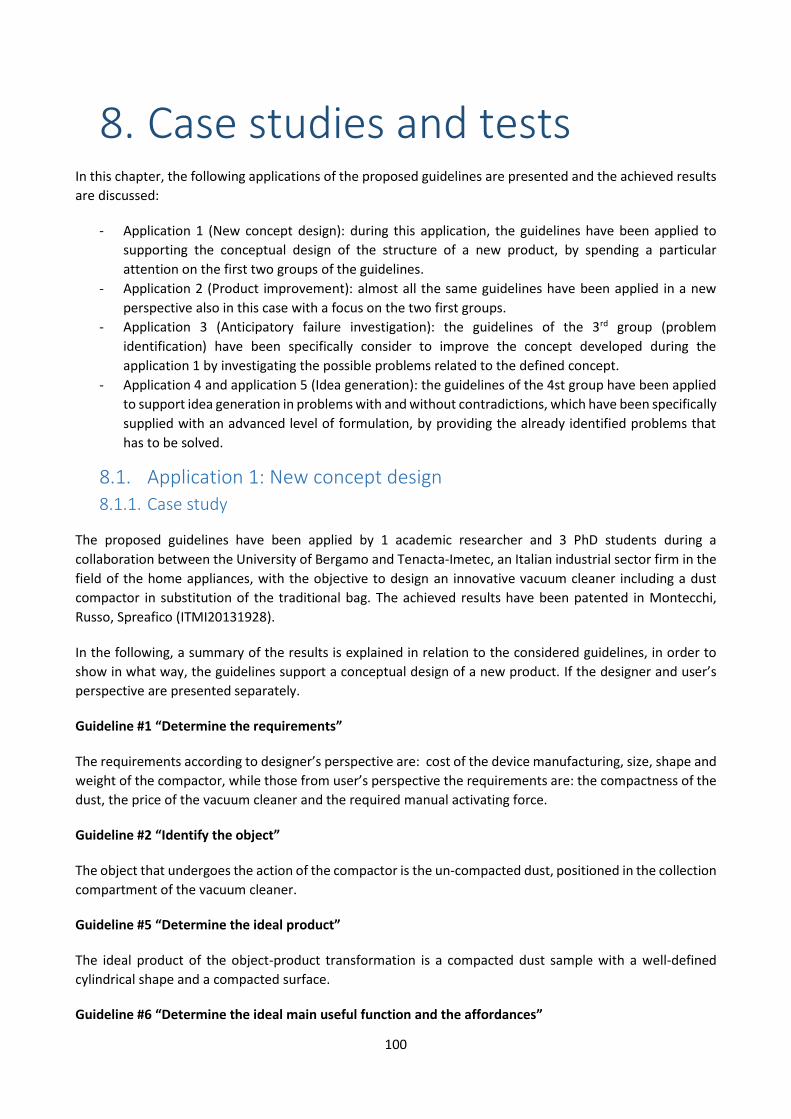
100
8. Case studies and tests In this chapter, the following applications of the proposed guidelines are presented and the achieved results
are discussed:
- Application 1 (New concept design): during this application, the guidelines have been applied to
supporting the conceptual design of the structure of a new product, by spending a particular
attention on the first two groups of the guidelines.
- Application 2 (Product improvement): almost all the same guidelines have been applied in a new
perspective also in this case with a focus on the two first groups.
- Application 3 (Anticipatory failure investigation): the guidelines of the 3rd group (problem
identification) have been specifically consider to improve the concept developed during the
application 1 by investigating the possible problems related to the defined concept.
- Application 4 and application 5 (Idea generation): the guidelines of the 4st group have been applied
to support idea generation in problems with and without contradictions, which have been specifically
supplied with an advanced level of formulation, by providing the already identified problems that
has to be solved.
8.1. Application 1: New concept design 8.1.1. Case study
The proposed guidelines have been applied by 1 academic researcher and 3 PhD students during a
collaboration between the University of Bergamo and Tenacta-Imetec, an Italian industrial sector firm in the
field of the home appliances, with the objective to design an innovative vacuum cleaner including a dust
compactor in substitution of the traditional bag. The achieved results have been patented in Montecchi,
Russo, Spreafico (ITMI20131928).
In the following, a summary of the results is explained in relation to the considered guidelines, in order to
show in what way, the guidelines support a conceptual design of a new product. If the designer and user’s
perspective are presented separately.
Guideline #1 “Determine the requirements”
The requirements according to designer’s perspective are: cost of the device manufacturing, size, shape and
weight of the compactor, while those from user’s perspective the requirements are: the compactness of the
dust, the price of the vacuum cleaner and the required manual activating force.
Guideline #2 “Identify the object”
The object that undergoes the action of the compactor is the un-compacted dust, positioned in the collection
compartment of the vacuum cleaner.
Guideline #5 “Determine the ideal product”
The ideal product of the object-product transformation is a compacted dust sample with a well-defined
cylindrical shape and a compacted surface.
Guideline #6 “Determine the ideal main useful function and the affordances”
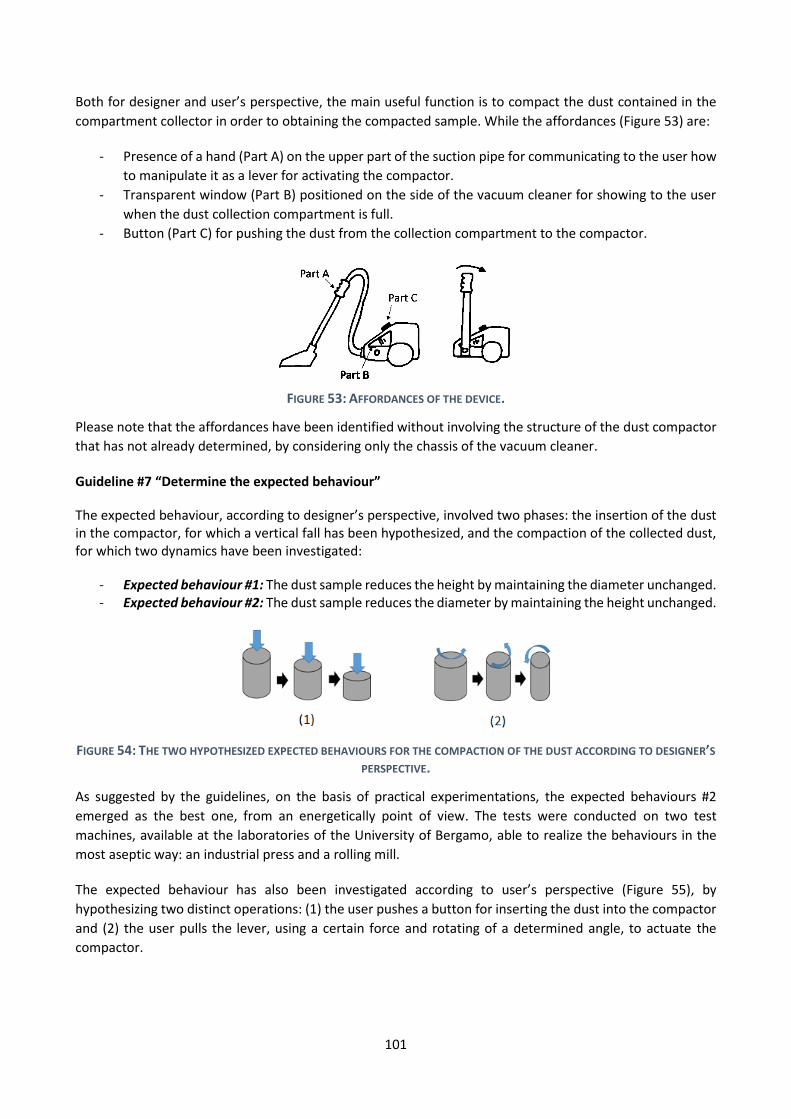
101
Both for designer and user’s perspective, the main useful function is to compact the dust contained in the
compartment collector in order to obtaining the compacted sample. While the affordances (Figure 53) are:
- Presence of a hand (Part A) on the upper part of the suction pipe for communicating to the user how
to manipulate it as a lever for activating the compactor.
- Transparent window (Part B) positioned on the side of the vacuum cleaner for showing to the user
when the dust collection compartment is full.
- Button (Part C) for pushing the dust from the collection compartment to the compactor.
FIGURE 53: AFFORDANCES OF THE DEVICE.
Please note that the affordances have been identified without involving the structure of the dust compactor
that has not already determined, by considering only the chassis of the vacuum cleaner.
Guideline #7 “Determine the expected behaviour”
The expected behaviour, according to designer’s perspective, involved two phases: the insertion of the dust in the compactor, for which a vertical fall has been hypothesized, and the compaction of the collected dust, for which two dynamics have been investigated:
- Expected behaviour #1: The dust sample reduces the height by maintaining the diameter unchanged. - Expected behaviour #2: The dust sample reduces the diameter by maintaining the height unchanged.
FIGURE 54: THE TWO HYPOTHESIZED EXPECTED BEHAVIOURS FOR THE COMPACTION OF THE DUST ACCORDING TO DESIGNER’S
PERSPECTIVE.
As suggested by the guidelines, on the basis of practical experimentations, the expected behaviours #2
emerged as the best one, from an energetically point of view. The tests were conducted on two test
machines, available at the laboratories of the University of Bergamo, able to realize the behaviours in the
most aseptic way: an industrial press and a rolling mill.
The expected behaviour has also been investigated according to user’s perspective (Figure 55), by
hypothesizing two distinct operations: (1) the user pushes a button for inserting the dust into the compactor
and (2) the user pulls the lever, using a certain force and rotating of a determined angle, to actuate the
compactor.
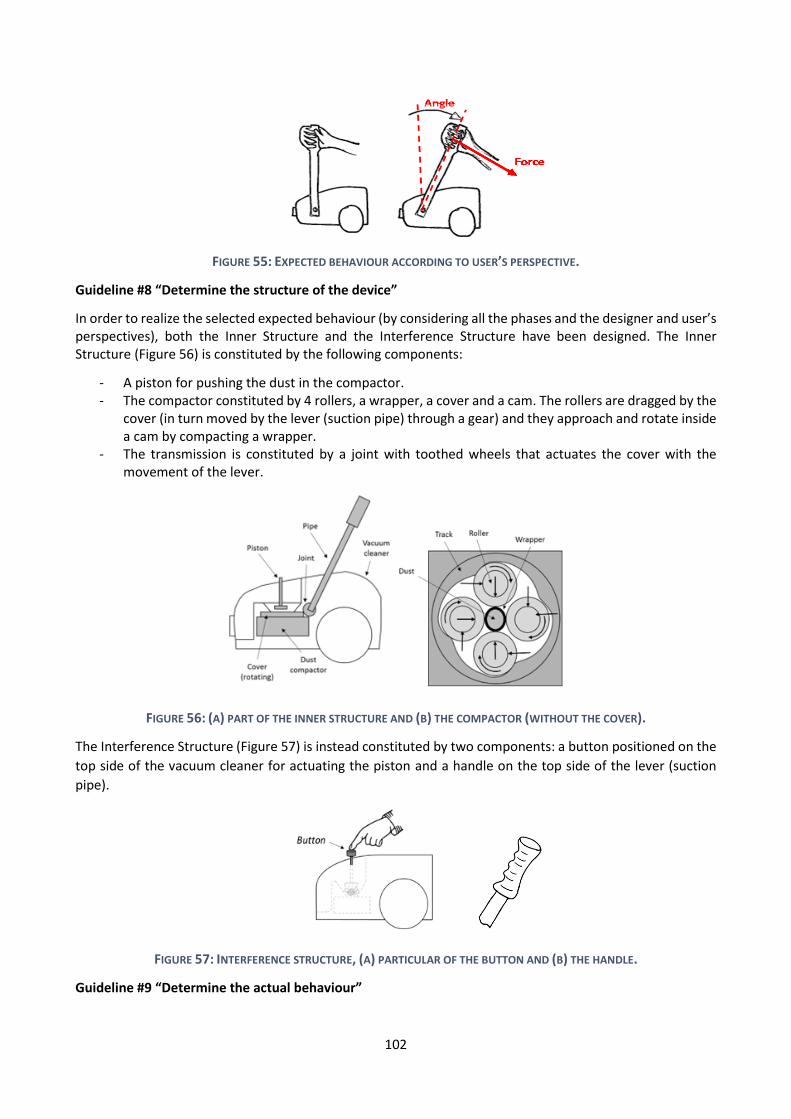
102
FIGURE 55: EXPECTED BEHAVIOUR ACCORDING TO USER’S PERSPECTIVE.
Guideline #8 “Determine the structure of the device”
In order to realize the selected expected behaviour (by considering all the phases and the designer and user’s perspectives), both the Inner Structure and the Interference Structure have been designed. The Inner Structure (Figure 56) is constituted by the following components:
- A piston for pushing the dust in the compactor. - The compactor constituted by 4 rollers, a wrapper, a cover and a cam. The rollers are dragged by the
cover (in turn moved by the lever (suction pipe) through a gear) and they approach and rotate inside a cam by compacting a wrapper.
- The transmission is constituted by a joint with toothed wheels that actuates the cover with the movement of the lever.
FIGURE 56: (A) PART OF THE INNER STRUCTURE AND (B) THE COMPACTOR (WITHOUT THE COVER).
The Interference Structure (Figure 57) is instead constituted by two components: a button positioned on the
top side of the vacuum cleaner for actuating the piston and a handle on the top side of the lever (suction
pipe).
FIGURE 57: INTERFERENCE STRUCTURE, (A) PARTICULAR OF THE BUTTON AND (B) THE HANDLE.
Guideline #9 “Determine the actual behaviour”
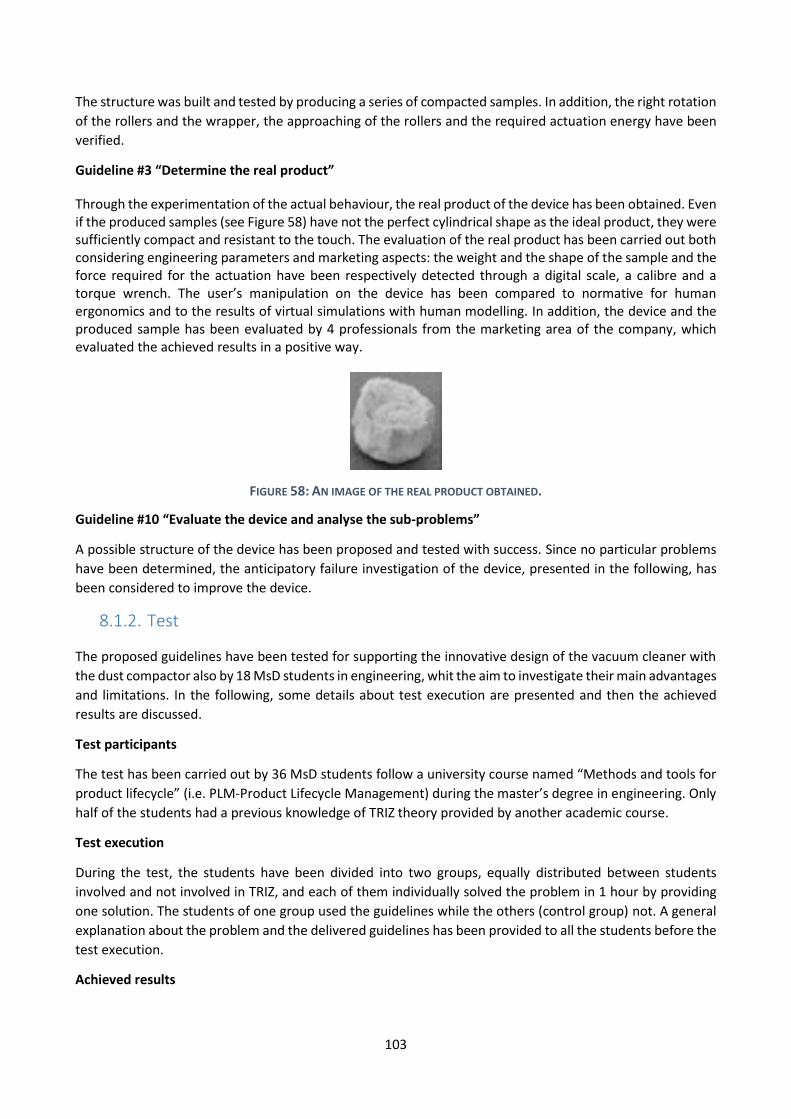
103
The structure was built and tested by producing a series of compacted samples. In addition, the right rotation
of the rollers and the wrapper, the approaching of the rollers and the required actuation energy have been
verified.
Guideline #3 “Determine the real product”
Through the experimentation of the actual behaviour, the real product of the device has been obtained. Even if the produced samples (see Figure 58) have not the perfect cylindrical shape as the ideal product, they were sufficiently compact and resistant to the touch. The evaluation of the real product has been carried out both considering engineering parameters and marketing aspects: the weight and the shape of the sample and the force required for the actuation have been respectively detected through a digital scale, a calibre and a torque wrench. The user’s manipulation on the device has been compared to normative for human ergonomics and to the results of virtual simulations with human modelling. In addition, the device and the produced sample has been evaluated by 4 professionals from the marketing area of the company, which evaluated the achieved results in a positive way.
FIGURE 58: AN IMAGE OF THE REAL PRODUCT OBTAINED.
Guideline #10 “Evaluate the device and analyse the sub-problems”
A possible structure of the device has been proposed and tested with success. Since no particular problems
have been determined, the anticipatory failure investigation of the device, presented in the following, has
been considered to improve the device.
8.1.2. Test
The proposed guidelines have been tested for supporting the innovative design of the vacuum cleaner with
the dust compactor also by 18 MsD students in engineering, whit the aim to investigate their main advantages
and limitations. In the following, some details about test execution are presented and then the achieved
results are discussed.
Test participants
The test has been carried out by 36 MsD students follow a university course named “Methods and tools for
product lifecycle” (i.e. PLM-Product Lifecycle Management) during the master’s degree in engineering. Only
half of the students had a previous knowledge of TRIZ theory provided by another academic course.
Test execution
During the test, the students have been divided into two groups, equally distributed between students
involved and not involved in TRIZ, and each of them individually solved the problem in 1 hour by providing
one solution. The students of one group used the guidelines while the others (control group) not. A general
explanation about the problem and the delivered guidelines has been provided to all the students before the
test execution.
Achieved results
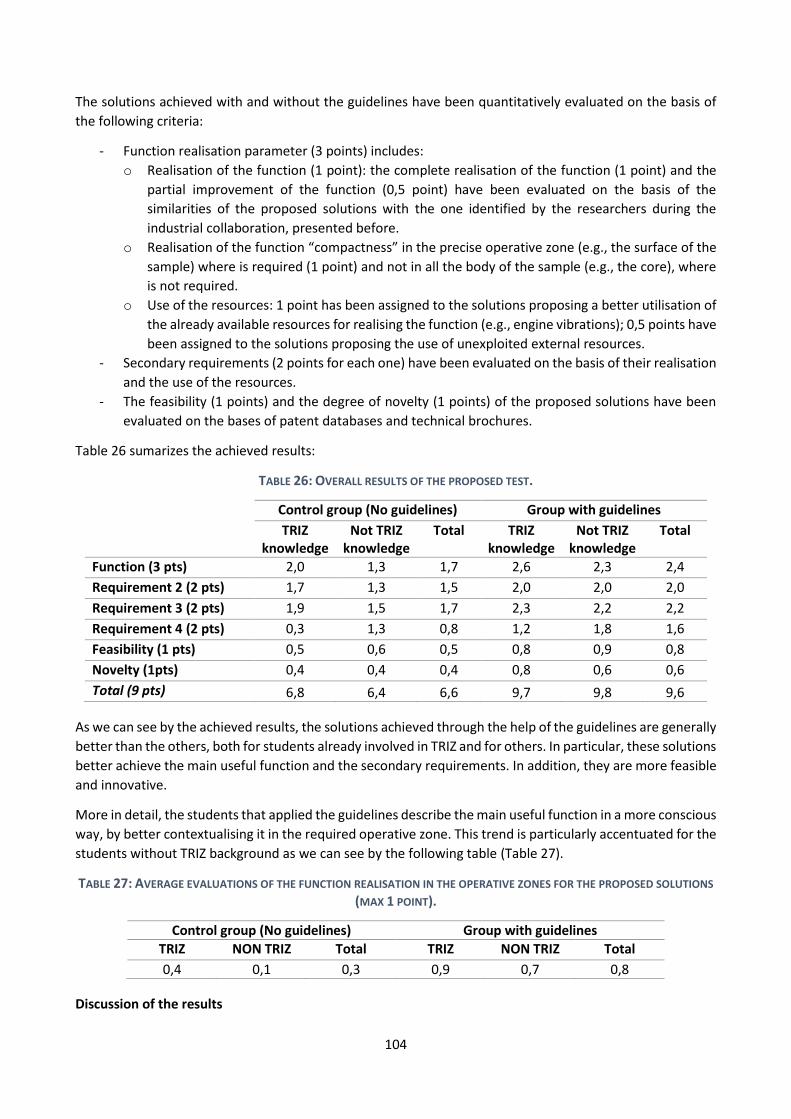
104
The solutions achieved with and without the guidelines have been quantitatively evaluated on the basis of
the following criteria:
- Function realisation parameter (3 points) includes:
o Realisation of the function (1 point): the complete realisation of the function (1 point) and the
partial improvement of the function (0,5 point) have been evaluated on the basis of the
similarities of the proposed solutions with the one identified by the researchers during the
industrial collaboration, presented before.
o Realisation of the function “compactness” in the precise operative zone (e.g., the surface of the
sample) where is required (1 point) and not in all the body of the sample (e.g., the core), where
is not required.
o Use of the resources: 1 point has been assigned to the solutions proposing a better utilisation of
the already available resources for realising the function (e.g., engine vibrations); 0,5 points have
been assigned to the solutions proposing the use of unexploited external resources.
- Secondary requirements (2 points for each one) have been evaluated on the basis of their realisation
and the use of the resources.
- The feasibility (1 points) and the degree of novelty (1 points) of the proposed solutions have been
evaluated on the bases of patent databases and technical brochures.
Table 26 sumarizes the achieved results:
TABLE 26: OVERALL RESULTS OF THE PROPOSED TEST.
Control group (No guidelines) Group with guidelines
TRIZ knowledge
Not TRIZ knowledge
Total TRIZ knowledge
Not TRIZ knowledge
Total
Function (3 pts) 2,0 1,3 1,7 2,6 2,3 2,4
Requirement 2 (2 pts) 1,7 1,3 1,5 2,0 2,0 2,0
Requirement 3 (2 pts) 1,9 1,5 1,7 2,3 2,2 2,2
Requirement 4 (2 pts) 0,3 1,3 0,8 1,2 1,8 1,6
Feasibility (1 pts) 0,5 0,6 0,5 0,8 0,9 0,8
Novelty (1pts) 0,4 0,4 0,4 0,8 0,6 0,6
Total (9 pts) 6,8 6,4 6,6 9,7 9,8 9,6
As we can see by the achieved results, the solutions achieved through the help of the guidelines are generally
better than the others, both for students already involved in TRIZ and for others. In particular, these solutions
better achieve the main useful function and the secondary requirements. In addition, they are more feasible
and innovative.
More in detail, the students that applied the guidelines describe the main useful function in a more conscious
way, by better contextualising it in the required operative zone. This trend is particularly accentuated for the
students without TRIZ background as we can see by the following table (Table 27).
TABLE 27: AVERAGE EVALUATIONS OF THE FUNCTION REALISATION IN THE OPERATIVE ZONES FOR THE PROPOSED SOLUTIONS
(MAX 1 POINT).
Control group (No guidelines) Group with guidelines
TRIZ NON TRIZ Total TRIZ NON TRIZ Total
0,4 0,1 0,3 0,9 0,7 0,8
Discussion of the results
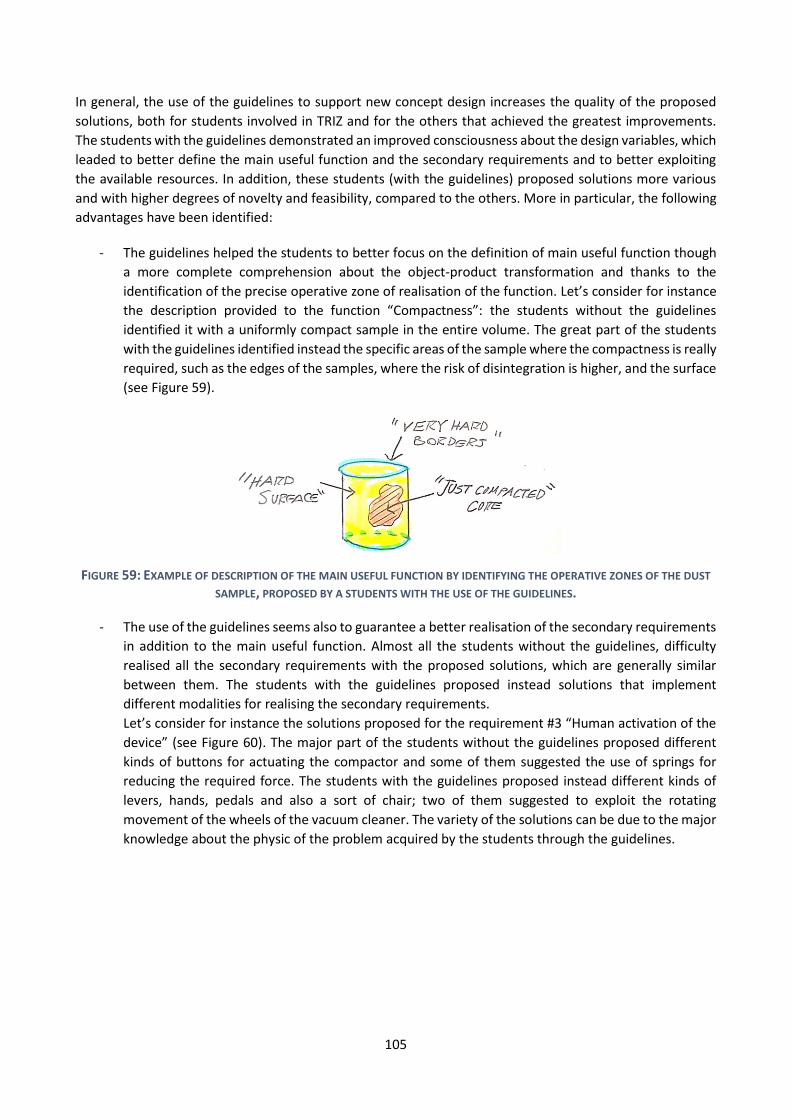
105
In general, the use of the guidelines to support new concept design increases the quality of the proposed
solutions, both for students involved in TRIZ and for the others that achieved the greatest improvements.
The students with the guidelines demonstrated an improved consciousness about the design variables, which
leaded to better define the main useful function and the secondary requirements and to better exploiting
the available resources. In addition, these students (with the guidelines) proposed solutions more various
and with higher degrees of novelty and feasibility, compared to the others. More in particular, the following
advantages have been identified:
- The guidelines helped the students to better focus on the definition of main useful function though
a more complete comprehension about the object-product transformation and thanks to the
identification of the precise operative zone of realisation of the function. Let’s consider for instance
the description provided to the function “Compactness”: the students without the guidelines
identified it with a uniformly compact sample in the entire volume. The great part of the students
with the guidelines identified instead the specific areas of the sample where the compactness is really
required, such as the edges of the samples, where the risk of disintegration is higher, and the surface
(see Figure 59).
FIGURE 59: EXAMPLE OF DESCRIPTION OF THE MAIN USEFUL FUNCTION BY IDENTIFYING THE OPERATIVE ZONES OF THE DUST
SAMPLE, PROPOSED BY A STUDENTS WITH THE USE OF THE GUIDELINES.
- The use of the guidelines seems also to guarantee a better realisation of the secondary requirements
in addition to the main useful function. Almost all the students without the guidelines, difficulty
realised all the secondary requirements with the proposed solutions, which are generally similar
between them. The students with the guidelines proposed instead solutions that implement
different modalities for realising the secondary requirements.
Let’s consider for instance the solutions proposed for the requirement #3 “Human activation of the
device” (see Figure 60). The major part of the students without the guidelines proposed different
kinds of buttons for actuating the compactor and some of them suggested the use of springs for
reducing the required force. The students with the guidelines proposed instead different kinds of
levers, hands, pedals and also a sort of chair; two of them suggested to exploit the rotating
movement of the wheels of the vacuum cleaner. The variety of the solutions can be due to the major
knowledge about the physic of the problem acquired by the students through the guidelines.
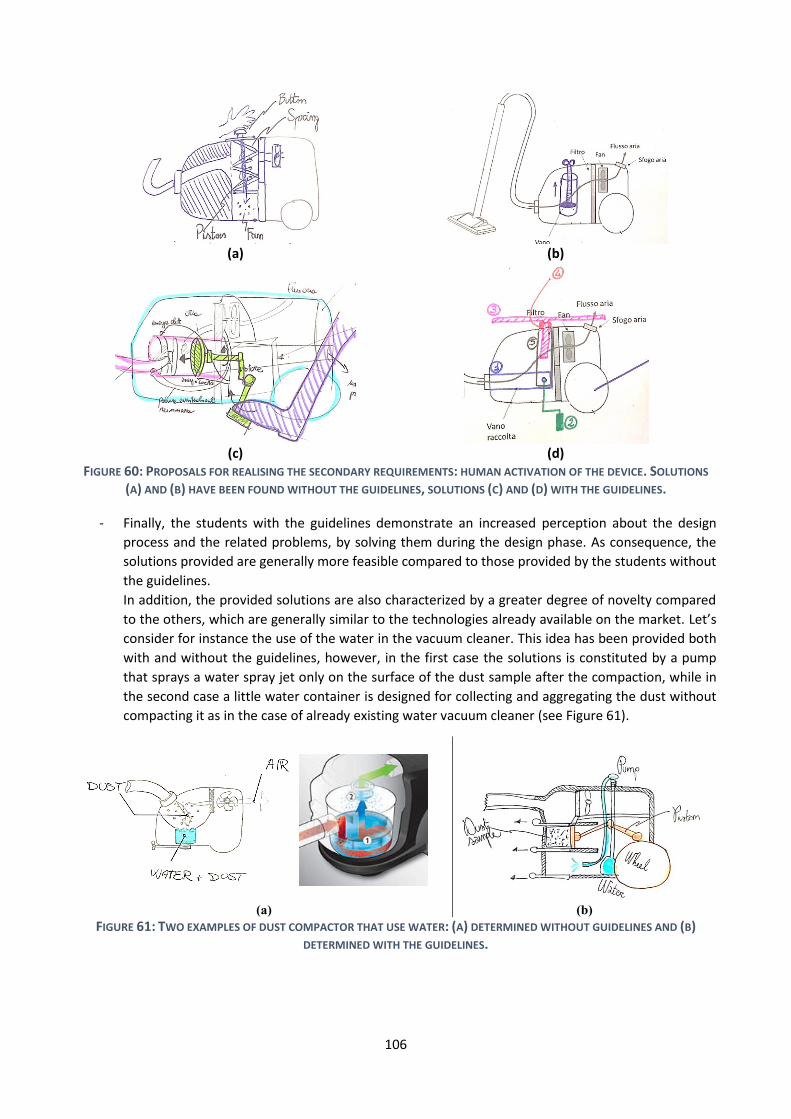
106
(a)
(b)
(c)
(d)
FIGURE 60: PROPOSALS FOR REALISING THE SECONDARY REQUIREMENTS: HUMAN ACTIVATION OF THE DEVICE. SOLUTIONS
(A) AND (B) HAVE BEEN FOUND WITHOUT THE GUIDELINES, SOLUTIONS (C) AND (D) WITH THE GUIDELINES.
- Finally, the students with the guidelines demonstrate an increased perception about the design
process and the related problems, by solving them during the design phase. As consequence, the
solutions provided are generally more feasible compared to those provided by the students without
the guidelines.
In addition, the provided solutions are also characterized by a greater degree of novelty compared
to the others, which are generally similar to the technologies already available on the market. Let’s
consider for instance the use of the water in the vacuum cleaner. This idea has been provided both
with and without the guidelines, however, in the first case the solutions is constituted by a pump
that sprays a water spray jet only on the surface of the dust sample after the compaction, while in
the second case a little water container is designed for collecting and aggregating the dust without
compacting it as in the case of already existing water vacuum cleaner (see Figure 61).
(a) (b)
FIGURE 61: TWO EXAMPLES OF DUST COMPACTOR THAT USE WATER: (A) DETERMINED WITHOUT GUIDELINES AND (B)
DETERMINED WITH THE GUIDELINES.
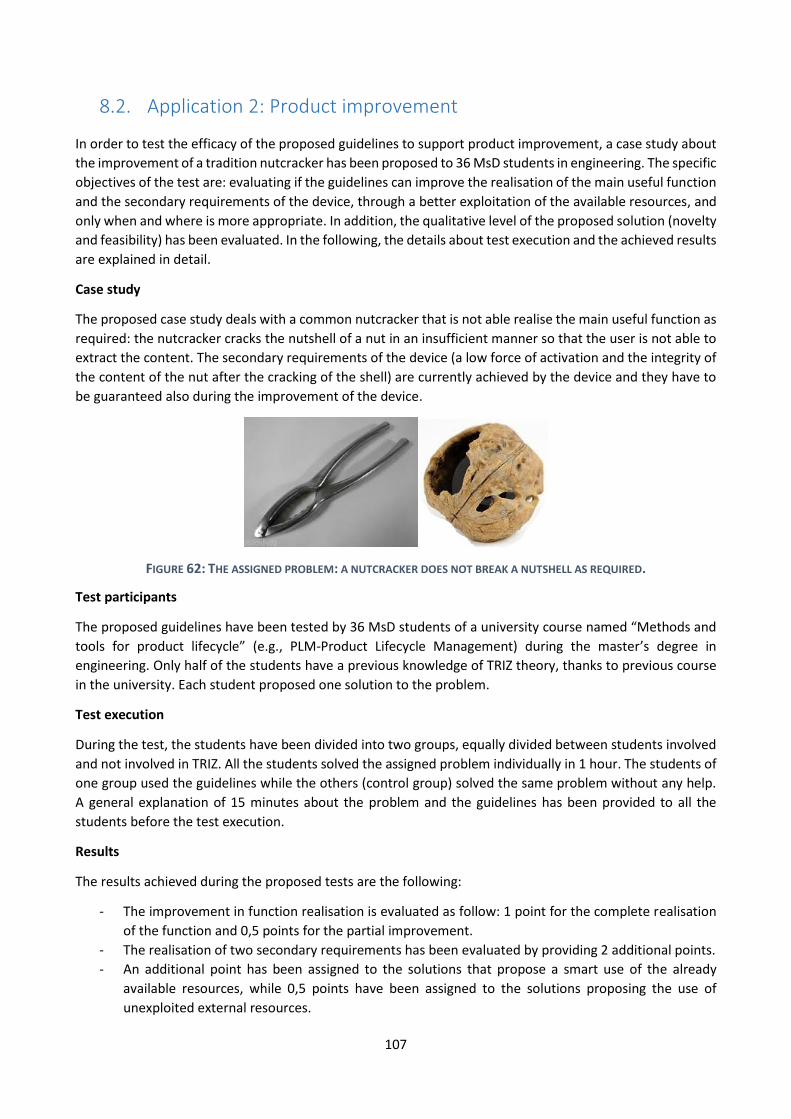
107
8.2. Application 2: Product improvement
In order to test the efficacy of the proposed guidelines to support product improvement, a case study about
the improvement of a tradition nutcracker has been proposed to 36 MsD students in engineering. The specific
objectives of the test are: evaluating if the guidelines can improve the realisation of the main useful function
and the secondary requirements of the device, through a better exploitation of the available resources, and
only when and where is more appropriate. In addition, the qualitative level of the proposed solution (novelty
and feasibility) has been evaluated. In the following, the details about test execution and the achieved results
are explained in detail.
Case study
The proposed case study deals with a common nutcracker that is not able realise the main useful function as
required: the nutcracker cracks the nutshell of a nut in an insufficient manner so that the user is not able to
extract the content. The secondary requirements of the device (a low force of activation and the integrity of
the content of the nut after the cracking of the shell) are currently achieved by the device and they have to
be guaranteed also during the improvement of the device.
FIGURE 62: THE ASSIGNED PROBLEM: A NUTCRACKER DOES NOT BREAK A NUTSHELL AS REQUIRED.
Test participants
The proposed guidelines have been tested by 36 MsD students of a university course named “Methods and
tools for product lifecycle” (e.g., PLM-Product Lifecycle Management) during the master’s degree in
engineering. Only half of the students have a previous knowledge of TRIZ theory, thanks to previous course
in the university. Each student proposed one solution to the problem.
Test execution
During the test, the students have been divided into two groups, equally divided between students involved
and not involved in TRIZ. All the students solved the assigned problem individually in 1 hour. The students of
one group used the guidelines while the others (control group) solved the same problem without any help.
A general explanation of 15 minutes about the problem and the guidelines has been provided to all the
students before the test execution.
Results
The results achieved during the proposed tests are the following:
- The improvement in function realisation is evaluated as follow: 1 point for the complete realisation
of the function and 0,5 points for the partial improvement.
- The realisation of two secondary requirements has been evaluated by providing 2 additional points.
- An additional point has been assigned to the solutions that propose a smart use of the already
available resources, while 0,5 points have been assigned to the solutions proposing the use of
unexploited external resources.
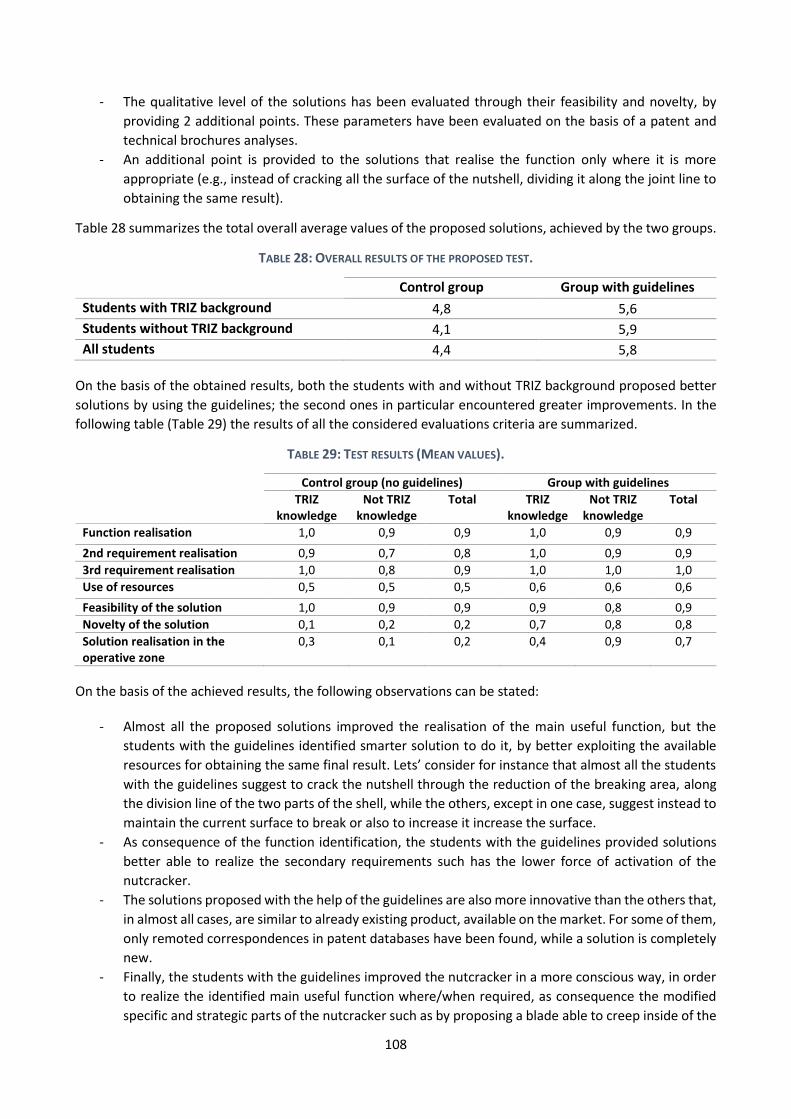
108
- The qualitative level of the solutions has been evaluated through their feasibility and novelty, by
providing 2 additional points. These parameters have been evaluated on the basis of a patent and
technical brochures analyses.
- An additional point is provided to the solutions that realise the function only where it is more
appropriate (e.g., instead of cracking all the surface of the nutshell, dividing it along the joint line to
obtaining the same result).
Table 28 summarizes the total overall average values of the proposed solutions, achieved by the two groups.
TABLE 28: OVERALL RESULTS OF THE PROPOSED TEST.
Control group Group with guidelines
Students with TRIZ background 4,8 5,6
Students without TRIZ background 4,1 5,9
All students 4,4 5,8
On the basis of the obtained results, both the students with and without TRIZ background proposed better
solutions by using the guidelines; the second ones in particular encountered greater improvements. In the
following table (Table 29) the results of all the considered evaluations criteria are summarized.
TABLE 29: TEST RESULTS (MEAN VALUES).
Control group (no guidelines) Group with guidelines
TRIZ knowledge
Not TRIZ knowledge
Total TRIZ knowledge
Not TRIZ knowledge
Total
Function realisation 1,0 0,9 0,9 1,0 0,9 0,9
2nd requirement realisation 0,9 0,7 0,8 1,0 0,9 0,9
3rd requirement realisation 1,0 0,8 0,9 1,0 1,0 1,0
Use of resources 0,5 0,5 0,5 0,6 0,6 0,6
Feasibility of the solution 1,0 0,9 0,9 0,9 0,8 0,9
Novelty of the solution 0,1 0,2 0,2 0,7 0,8 0,8
Solution realisation in the operative zone
0,3 0,1 0,2 0,4 0,9 0,7
On the basis of the achieved results, the following observations can be stated:
- Almost all the proposed solutions improved the realisation of the main useful function, but the
students with the guidelines identified smarter solution to do it, by better exploiting the available
resources for obtaining the same final result. Lets’ consider for instance that almost all the students
with the guidelines suggest to crack the nutshell through the reduction of the breaking area, along
the division line of the two parts of the shell, while the others, except in one case, suggest instead to
maintain the current surface to break or also to increase it increase the surface.
- As consequence of the function identification, the students with the guidelines provided solutions
better able to realize the secondary requirements such has the lower force of activation of the
nutcracker.
- The solutions proposed with the help of the guidelines are also more innovative than the others that,
in almost all cases, are similar to already existing product, available on the market. For some of them,
only remoted correspondences in patent databases have been found, while a solution is completely
new.
- Finally, the students with the guidelines improved the nutcracker in a more conscious way, in order
to realize the identified main useful function where/when required, as consequence the modified
specific and strategic parts of the nutcracker such as by proposing a blade able to creep inside of the
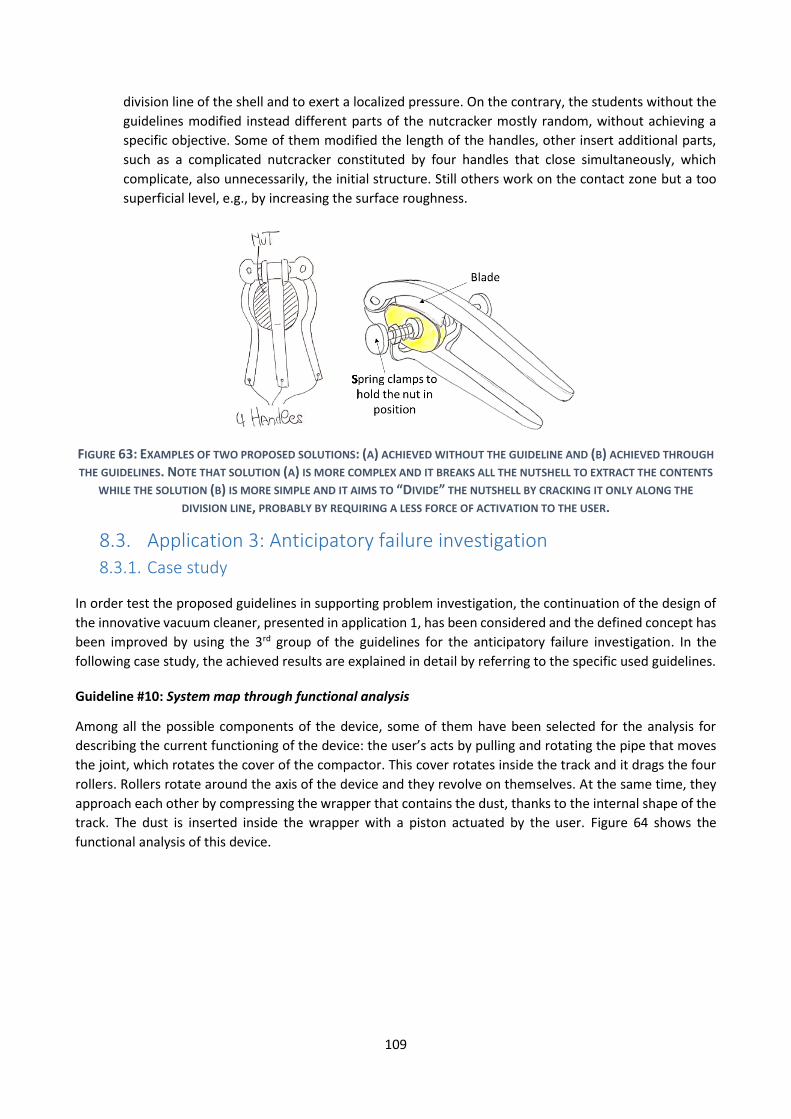
109
division line of the shell and to exert a localized pressure. On the contrary, the students without the
guidelines modified instead different parts of the nutcracker mostly random, without achieving a
specific objective. Some of them modified the length of the handles, other insert additional parts,
such as a complicated nutcracker constituted by four handles that close simultaneously, which
complicate, also unnecessarily, the initial structure. Still others work on the contact zone but a too
superficial level, e.g., by increasing the surface roughness.
FIGURE 63: EXAMPLES OF TWO PROPOSED SOLUTIONS: (A) ACHIEVED WITHOUT THE GUIDELINE AND (B) ACHIEVED THROUGH
THE GUIDELINES. NOTE THAT SOLUTION (A) IS MORE COMPLEX AND IT BREAKS ALL THE NUTSHELL TO EXTRACT THE CONTENTS
WHILE THE SOLUTION (B) IS MORE SIMPLE AND IT AIMS TO “DIVIDE” THE NUTSHELL BY CRACKING IT ONLY ALONG THE
DIVISION LINE, PROBABLY BY REQUIRING A LESS FORCE OF ACTIVATION TO THE USER.
8.3. Application 3: Anticipatory failure investigation 8.3.1. Case study
In order test the proposed guidelines in supporting problem investigation, the continuation of the design of
the innovative vacuum cleaner, presented in application 1, has been considered and the defined concept has
been improved by using the 3rd group of the guidelines for the anticipatory failure investigation. In the
following case study, the achieved results are explained in detail by referring to the specific used guidelines.
Guideline #10: System map through functional analysis
Among all the possible components of the device, some of them have been selected for the analysis for
describing the current functioning of the device: the user’s acts by pulling and rotating the pipe that moves
the joint, which rotates the cover of the compactor. This cover rotates inside the track and it drags the four
rollers. Rollers rotate around the axis of the device and they revolve on themselves. At the same time, they
approach each other by compressing the wrapper that contains the dust, thanks to the internal shape of the
track. The dust is inserted inside the wrapper with a piston actuated by the user. Figure 64 shows the
functional analysis of this device.
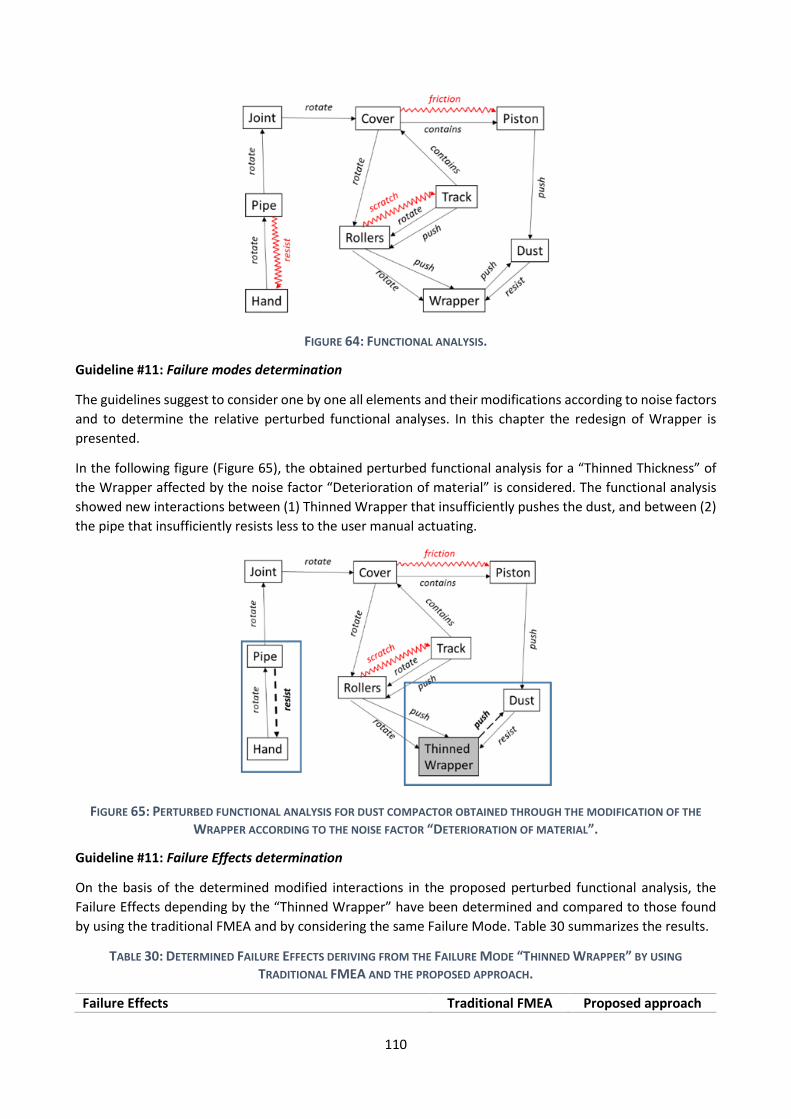
110
FIGURE 64: FUNCTIONAL ANALYSIS.
Guideline #11: Failure modes determination
The guidelines suggest to consider one by one all elements and their modifications according to noise factors
and to determine the relative perturbed functional analyses. In this chapter the redesign of Wrapper is
presented.
In the following figure (Figure 65), the obtained perturbed functional analysis for a “Thinned Thickness” of
the Wrapper affected by the noise factor “Deterioration of material” is considered. The functional analysis
showed new interactions between (1) Thinned Wrapper that insufficiently pushes the dust, and between (2)
the pipe that insufficiently resists less to the user manual actuating.
FIGURE 65: PERTURBED FUNCTIONAL ANALYSIS FOR DUST COMPACTOR OBTAINED THROUGH THE MODIFICATION OF THE
WRAPPER ACCORDING TO THE NOISE FACTOR “DETERIORATION OF MATERIAL”.
Guideline #11: Failure Effects determination
On the basis of the determined modified interactions in the proposed perturbed functional analysis, the
Failure Effects depending by the “Thinned Wrapper” have been determined and compared to those found
by using the traditional FMEA and by considering the same Failure Mode. Table 30 summarizes the results.
TABLE 30: DETERMINED FAILURE EFFECTS DERIVING FROM THE FAILURE MODE “THINNED WRAPPER” BY USING
TRADITIONAL FMEA AND THE PROPOSED APPROACH.
Failure Effects Traditional FMEA Proposed approach
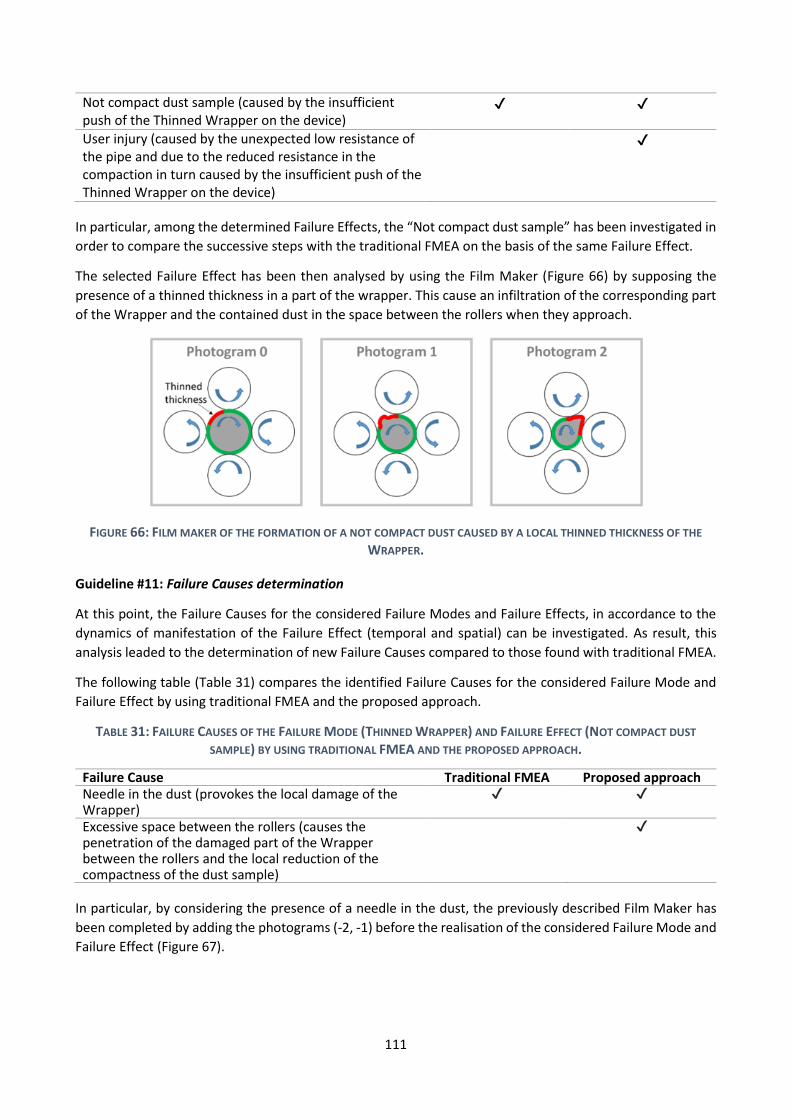
111
Not compact dust sample (caused by the insufficient push of the Thinned Wrapper on the device)
✔ ✔
User injury (caused by the unexpected low resistance of the pipe and due to the reduced resistance in the compaction in turn caused by the insufficient push of the Thinned Wrapper on the device)
✔
In particular, among the determined Failure Effects, the “Not compact dust sample” has been investigated in
order to compare the successive steps with the traditional FMEA on the basis of the same Failure Effect.
The selected Failure Effect has been then analysed by using the Film Maker (Figure 66) by supposing the
presence of a thinned thickness in a part of the wrapper. This cause an infiltration of the corresponding part
of the Wrapper and the contained dust in the space between the rollers when they approach.
FIGURE 66: FILM MAKER OF THE FORMATION OF A NOT COMPACT DUST CAUSED BY A LOCAL THINNED THICKNESS OF THE
WRAPPER.
Guideline #11: Failure Causes determination
At this point, the Failure Causes for the considered Failure Modes and Failure Effects, in accordance to the
dynamics of manifestation of the Failure Effect (temporal and spatial) can be investigated. As result, this
analysis leaded to the determination of new Failure Causes compared to those found with traditional FMEA.
The following table (Table 31) compares the identified Failure Causes for the considered Failure Mode and
Failure Effect by using traditional FMEA and the proposed approach.
TABLE 31: FAILURE CAUSES OF THE FAILURE MODE (THINNED WRAPPER) AND FAILURE EFFECT (NOT COMPACT DUST
SAMPLE) BY USING TRADITIONAL FMEA AND THE PROPOSED APPROACH.
Failure Cause Traditional FMEA Proposed approach Needle in the dust (provokes the local damage of the Wrapper)
✔ ✔
Excessive space between the rollers (causes the penetration of the damaged part of the Wrapper between the rollers and the local reduction of the compactness of the dust sample)
✔
In particular, by considering the presence of a needle in the dust, the previously described Film Maker has
been completed by adding the photograms (-2, -1) before the realisation of the considered Failure Mode and
Failure Effect (Figure 67).
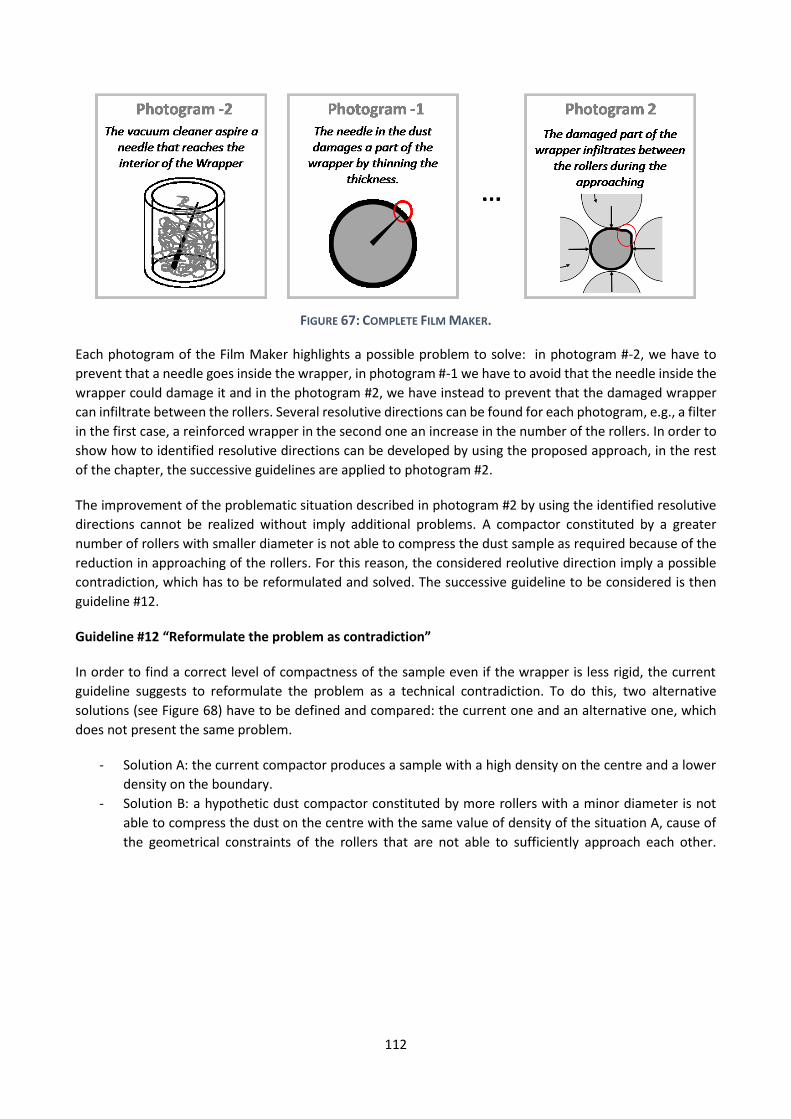
112
FIGURE 67: COMPLETE FILM MAKER.
Each photogram of the Film Maker highlights a possible problem to solve: in photogram #-2, we have to
prevent that a needle goes inside the wrapper, in photogram #-1 we have to avoid that the needle inside the
wrapper could damage it and in the photogram #2, we have instead to prevent that the damaged wrapper
can infiltrate between the rollers. Several resolutive directions can be found for each photogram, e.g., a filter
in the first case, a reinforced wrapper in the second one an increase in the number of the rollers. In order to
show how to identified resolutive directions can be developed by using the proposed approach, in the rest
of the chapter, the successive guidelines are applied to photogram #2.
The improvement of the problematic situation described in photogram #2 by using the identified resolutive
directions cannot be realized without imply additional problems. A compactor constituted by a greater
number of rollers with smaller diameter is not able to compress the dust sample as required because of the
reduction in approaching of the rollers. For this reason, the considered reolutive direction imply a possible
contradiction, which has to be reformulated and solved. The successive guideline to be considered is then
guideline #12.
Guideline #12 “Reformulate the problem as contradiction”
In order to find a correct level of compactness of the sample even if the wrapper is less rigid, the current
guideline suggests to reformulate the problem as a technical contradiction. To do this, two alternative
solutions (see Figure 68) have to be defined and compared: the current one and an alternative one, which
does not present the same problem.
- Solution A: the current compactor produces a sample with a high density on the centre and a lower
density on the boundary.
- Solution B: a hypothetic dust compactor constituted by more rollers with a minor diameter is not
able to compress the dust on the centre with the same value of density of the situation A, cause of
the geometrical constraints of the rollers that are not able to sufficiently approach each other.
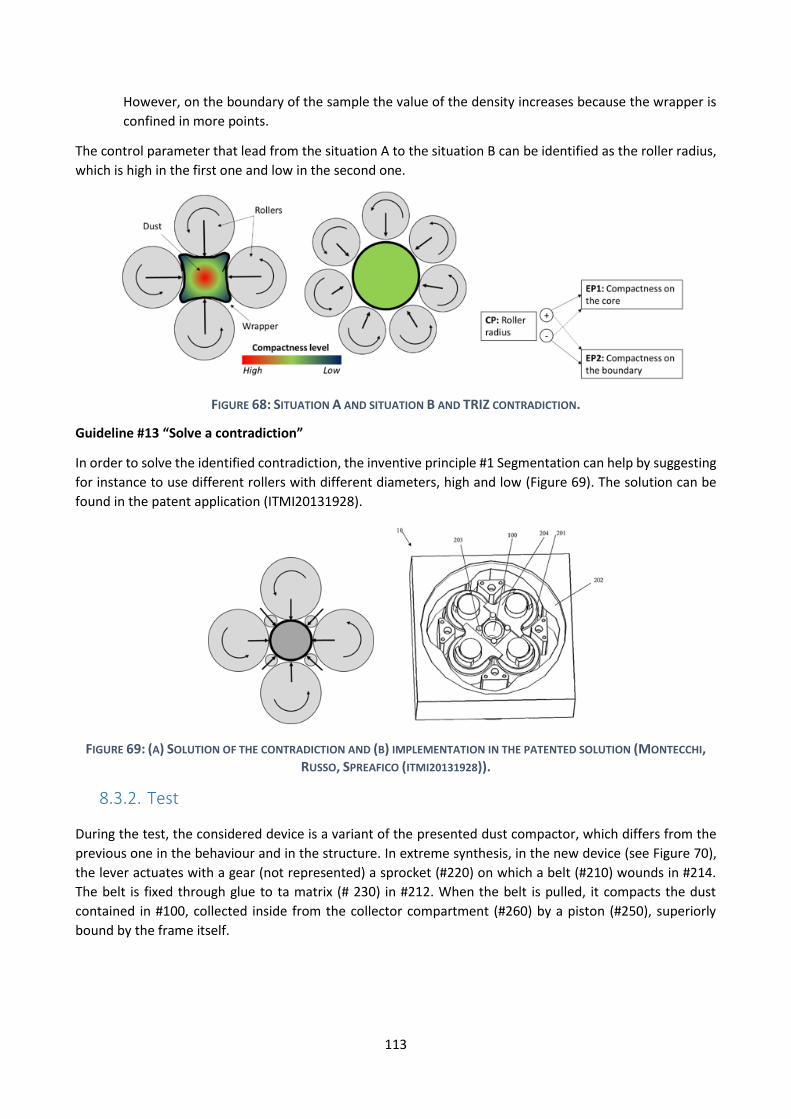
113
However, on the boundary of the sample the value of the density increases because the wrapper is
confined in more points.
The control parameter that lead from the situation A to the situation B can be identified as the roller radius,
which is high in the first one and low in the second one.
FIGURE 68: SITUATION A AND SITUATION B AND TRIZ CONTRADICTION.
Guideline #13 “Solve a contradiction”
In order to solve the identified contradiction, the inventive principle #1 Segmentation can help by suggesting
for instance to use different rollers with different diameters, high and low (Figure 69). The solution can be
found in the patent application (ITMI20131928).
FIGURE 69: (A) SOLUTION OF THE CONTRADICTION AND (B) IMPLEMENTATION IN THE PATENTED SOLUTION (MONTECCHI, RUSSO, SPREAFICO (ITMI20131928)).
8.3.2. Test
During the test, the considered device is a variant of the presented dust compactor, which differs from the
previous one in the behaviour and in the structure. In extreme synthesis, in the new device (see Figure 70),
the lever actuates with a gear (not represented) a sprocket (#220) on which a belt (#210) wounds in #214.
The belt is fixed through glue to ta matrix (# 230) in #212. When the belt is pulled, it compacts the dust
contained in #100, collected inside from the collector compartment (#260) by a piston (#250), superiorly
bound by the frame itself.
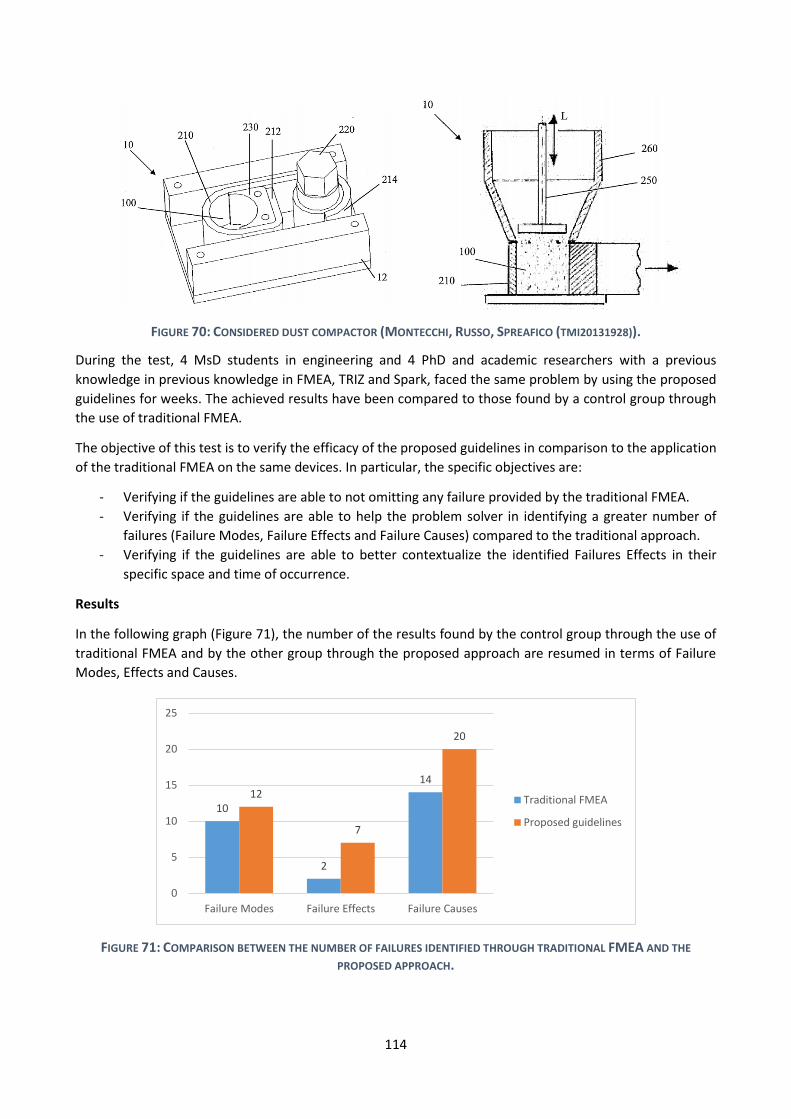
114
FIGURE 70: CONSIDERED DUST COMPACTOR (MONTECCHI, RUSSO, SPREAFICO (TMI20131928)).
During the test, 4 MsD students in engineering and 4 PhD and academic researchers with a previous
knowledge in previous knowledge in FMEA, TRIZ and Spark, faced the same problem by using the proposed
guidelines for weeks. The achieved results have been compared to those found by a control group through
the use of traditional FMEA.
The objective of this test is to verify the efficacy of the proposed guidelines in comparison to the application
of the traditional FMEA on the same devices. In particular, the specific objectives are:
- Verifying if the guidelines are able to not omitting any failure provided by the traditional FMEA.
- Verifying if the guidelines are able to help the problem solver in identifying a greater number of
failures (Failure Modes, Failure Effects and Failure Causes) compared to the traditional approach.
- Verifying if the guidelines are able to better contextualize the identified Failures Effects in their
specific space and time of occurrence.
Results
In the following graph (Figure 71), the number of the results found by the control group through the use of
traditional FMEA and by the other group through the proposed approach are resumed in terms of Failure
Modes, Effects and Causes.
FIGURE 71: COMPARISON BETWEEN THE NUMBER OF FAILURES IDENTIFIED THROUGH TRADITIONAL FMEA AND THE
PROPOSED APPROACH.
10
2
1412
7
20
0
5
10
15
20
25
Failure Modes Failure Effects Failure Causes
Traditional FMEA
Proposed guidelines
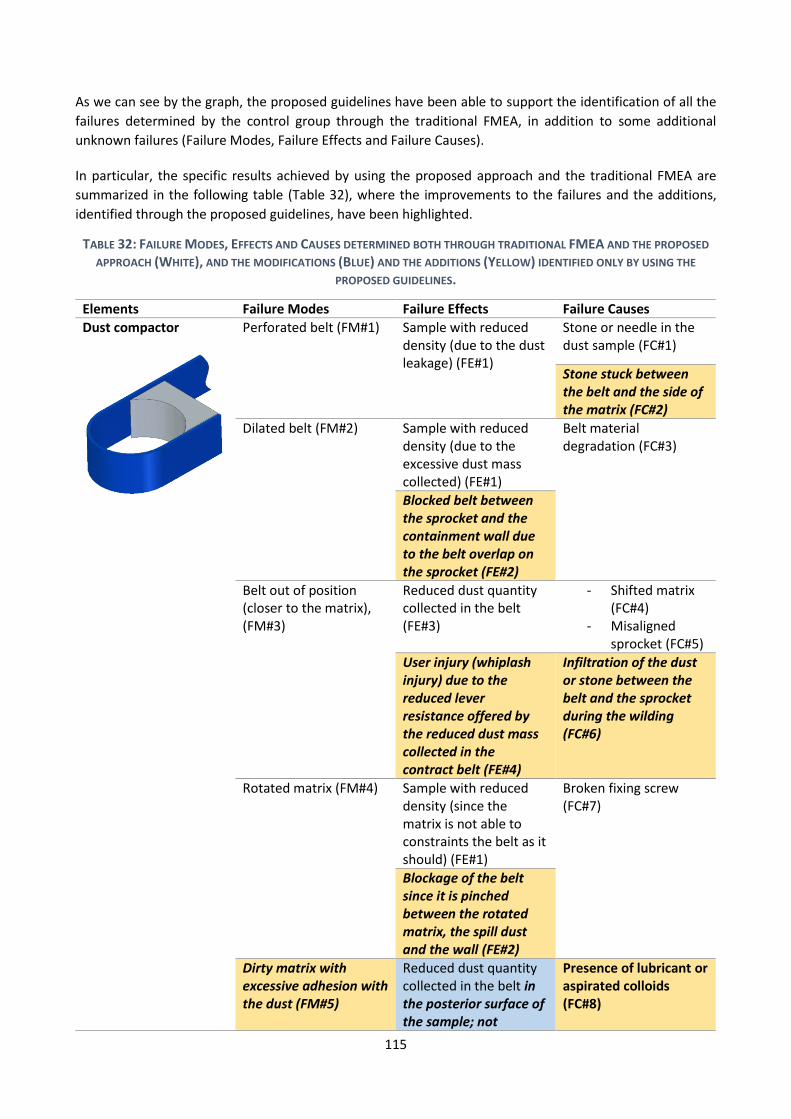
115
As we can see by the graph, the proposed guidelines have been able to support the identification of all the
failures determined by the control group through the traditional FMEA, in addition to some additional
unknown failures (Failure Modes, Failure Effects and Failure Causes).
In particular, the specific results achieved by using the proposed approach and the traditional FMEA are
summarized in the following table (Table 32), where the improvements to the failures and the additions,
identified through the proposed guidelines, have been highlighted.
TABLE 32: FAILURE MODES, EFFECTS AND CAUSES DETERMINED BOTH THROUGH TRADITIONAL FMEA AND THE PROPOSED
APPROACH (WHITE), AND THE MODIFICATIONS (BLUE) AND THE ADDITIONS (YELLOW) IDENTIFIED ONLY BY USING THE
PROPOSED GUIDELINES.
Elements Failure Modes Failure Effects Failure Causes
Dust compactor
Perforated belt (FM#1) Sample with reduced density (due to the dust leakage) (FE#1)
Stone or needle in the dust sample (FC#1)
Stone stuck between the belt and the side of the matrix (FC#2)
Dilated belt (FM#2) Sample with reduced density (due to the excessive dust mass collected) (FE#1)
Belt material degradation (FC#3)
Blocked belt between the sprocket and the containment wall due to the belt overlap on the sprocket (FE#2)
Belt out of position (closer to the matrix), (FM#3)
Reduced dust quantity collected in the belt (FE#3)
- Shifted matrix (FC#4)
- Misaligned sprocket (FC#5)
User injury (whiplash injury) due to the reduced lever resistance offered by the reduced dust mass collected in the contract belt (FE#4)
Infiltration of the dust or stone between the belt and the sprocket during the wilding (FC#6)
Rotated matrix (FM#4) Sample with reduced density (since the matrix is not able to constraints the belt as it should) (FE#1)
Broken fixing screw (FC#7)
Blockage of the belt since it is pinched between the rotated matrix, the spill dust and the wall (FE#2)
Dirty matrix with excessive adhesion with the dust (FM#5)
Reduced dust quantity collected in the belt in the posterior surface of the sample; not
Presence of lubricant or aspirated colloids (FC#8)
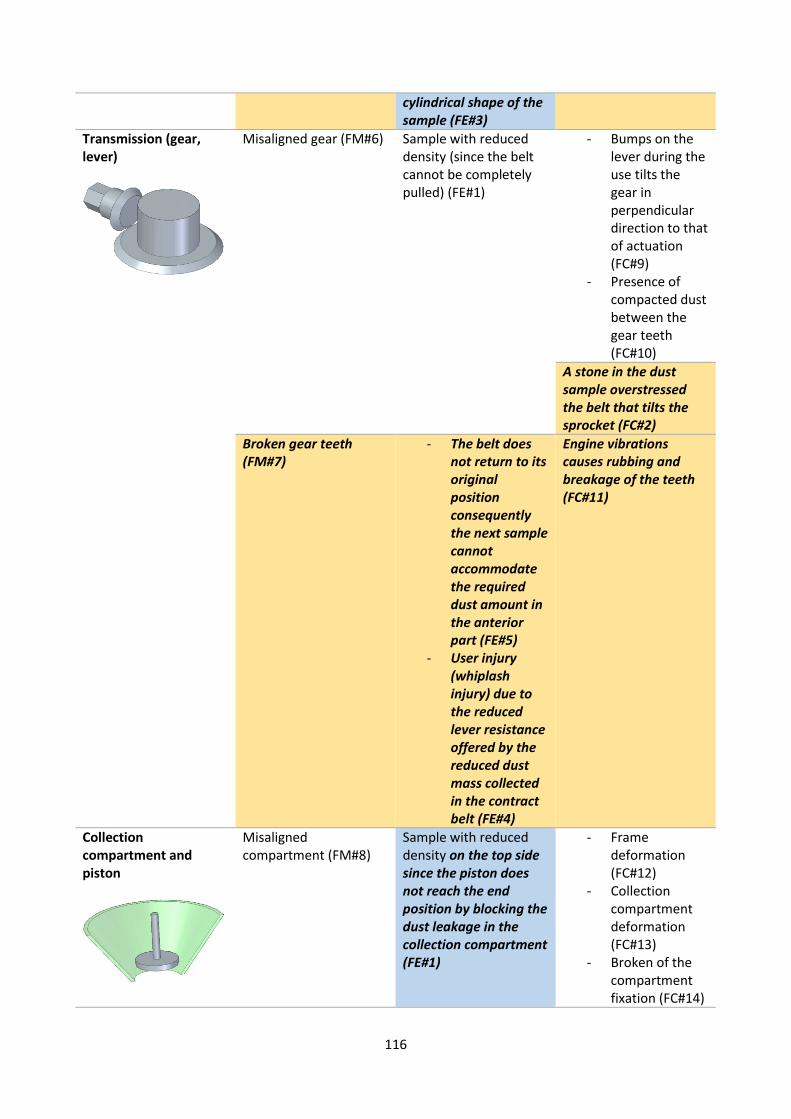
116
cylindrical shape of the sample (FE#3)
Transmission (gear, lever)
Misaligned gear (FM#6) Sample with reduced density (since the belt cannot be completely pulled) (FE#1)
- Bumps on the lever during the use tilts the gear in perpendicular direction to that of actuation (FC#9)
- Presence of compacted dust between the gear teeth (FC#10)
A stone in the dust sample overstressed the belt that tilts the sprocket (FC#2)
Broken gear teeth (FM#7)
- The belt does not return to its original position consequently the next sample cannot accommodate the required dust amount in the anterior part (FE#5)
- User injury (whiplash injury) due to the reduced lever resistance offered by the reduced dust mass collected in the contract belt (FE#4)
Engine vibrations causes rubbing and breakage of the teeth (FC#11)
Collection compartment and piston
Misaligned compartment (FM#8)
Sample with reduced density on the top side since the piston does not reach the end position by blocking the dust leakage in the collection compartment (FE#1)
- Frame deformation (FC#12)
- Collection compartment deformation (FC#13)
- Broken of the compartment fixation (FC#14)
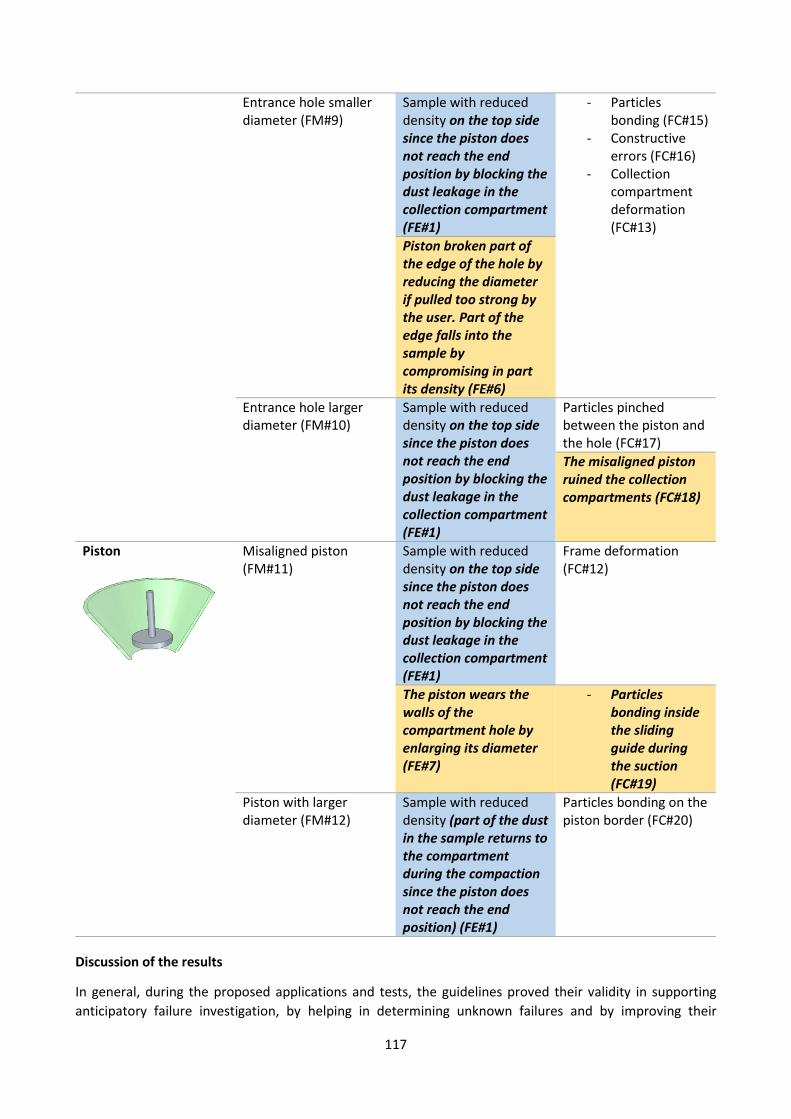
117
Entrance hole smaller diameter (FM#9)
Sample with reduced density on the top side since the piston does not reach the end position by blocking the dust leakage in the collection compartment (FE#1)
- Particles bonding (FC#15)
- Constructive errors (FC#16)
- Collection compartment deformation (FC#13)
Piston broken part of the edge of the hole by reducing the diameter if pulled too strong by the user. Part of the edge falls into the sample by compromising in part its density (FE#6)
Entrance hole larger diameter (FM#10)
Sample with reduced density on the top side since the piston does not reach the end position by blocking the dust leakage in the collection compartment (FE#1)
Particles pinched between the piston and the hole (FC#17)
The misaligned piston ruined the collection compartments (FC#18)
Piston
Misaligned piston (FM#11)
Sample with reduced density on the top side since the piston does not reach the end position by blocking the dust leakage in the collection compartment (FE#1)
Frame deformation (FC#12)
The piston wears the walls of the compartment hole by enlarging its diameter (FE#7)
- Particles bonding inside the sliding guide during the suction (FC#19)
Piston with larger diameter (FM#12)
Sample with reduced density (part of the dust in the sample returns to the compartment during the compaction since the piston does not reach the end position) (FE#1)
Particles bonding on the piston border (FC#20)
Discussion of the results
In general, during the proposed applications and tests, the guidelines proved their validity in supporting
anticipatory failure investigation, by helping in determining unknown failures and by improving their
118
description in comparison to traditional FMEA. In particular, by specifically referring to the specific achieved
results, the following specifically considerations can be stated:
- Failure Modes determination: The additional determined Failure Modes are circumscribed to more
precise areas e.g., “Broken gear teeth” by exploring different possibilities of failures than the
traditional ones, typically more related to morphological aspects (misalignments, larger/smaller
dimensions) and macroscopically damages (e.g., broken belt).
- Failure Effects determination: The new determined Failure Effects are referred to the new
determined Failure Modes or to the already determined ones, even if they hypothesize unexpected
related damages, such as the user’s injury, e.g., “Whiplash injury due to the unexpected less
resistance offered by the lever to the actuation, in turn caused by the less dust amount contained in
the belt out of position”. In particular, the second aspect can be due to the ability of TRIZ functional
analysis to better define the cause and effect chains, especially those afflicting the user, which is
considered an integrant part of the analysis.
In addition, the new identified Failure Effects are generally described in a more precise way, by better
specifying the zone of occurrence; let’s consider for instance the following effect: “Reduced dust
quantity in the posterior surface of the sample”.
- Failure Causes determination: The use of the guidelines increased the number of the determined
Failure Causes, both for the already determined Failure Effects and for the new ones. In particular,
the identified Failure Causes highlighted how possible not previously considered dangerous physical
effects, such as the vibration of the engine, could affect the technical system (e.g., broking the gear
teeth). In addition, some of the determined causes are not specifically related to the elements of the
technical system, as in the traditional FMEA, e.g., collected external particles and liquids. Also in this
case, the guidelines helped in describing the Failure Causes with a deeper level of analysis, by better
circumscribing the zone and the time of occurrence (e.g., the presence of colloids and lubricants on
the inner part of the matrix increases the adhesion of the dust). Finally, some of the identified causes
seem generally less obvious than those determined through traditional FMEA, predominantly related
to deformation and wear.
8.4. Application 4: Idea generation in problems with contradiction
In order to test the efficacy of the guidelines for enhancing idea generation in problems with contradictions,
the last group of them, whit a particular focus on “FBS inventive principles”, has been tested by involving
students and researchers. The two addressed problems have been deliberately supplied in a sufficiently
abstract way in order to allow multiple directions of intervention on different levels of detail (function,
behaviour, physical effects and structure). For this reason, the problems have been formulated at the
functional level, focusing on a description of how to meet the customer’s requirements.
Test participants
In order to identify how the personal background and the level of experience of the problem solver can
influence the application of the method, the test have been proposed to two kinds of students:
- 10 MsD students follow a university course named “Methods and tools for product lifecycle” (i.e.
PLM-Product Lifecycle Management) during the master degree in Mechanical Engineering and
Management Engineering. Only half of them, have a previous knowledge of TRIZ theory, thanks to
previous course in the university background.
- 5 PhD students involved in TRIZ and dealing with product and process innovation through
engineering design, problem solving and CAE methods.
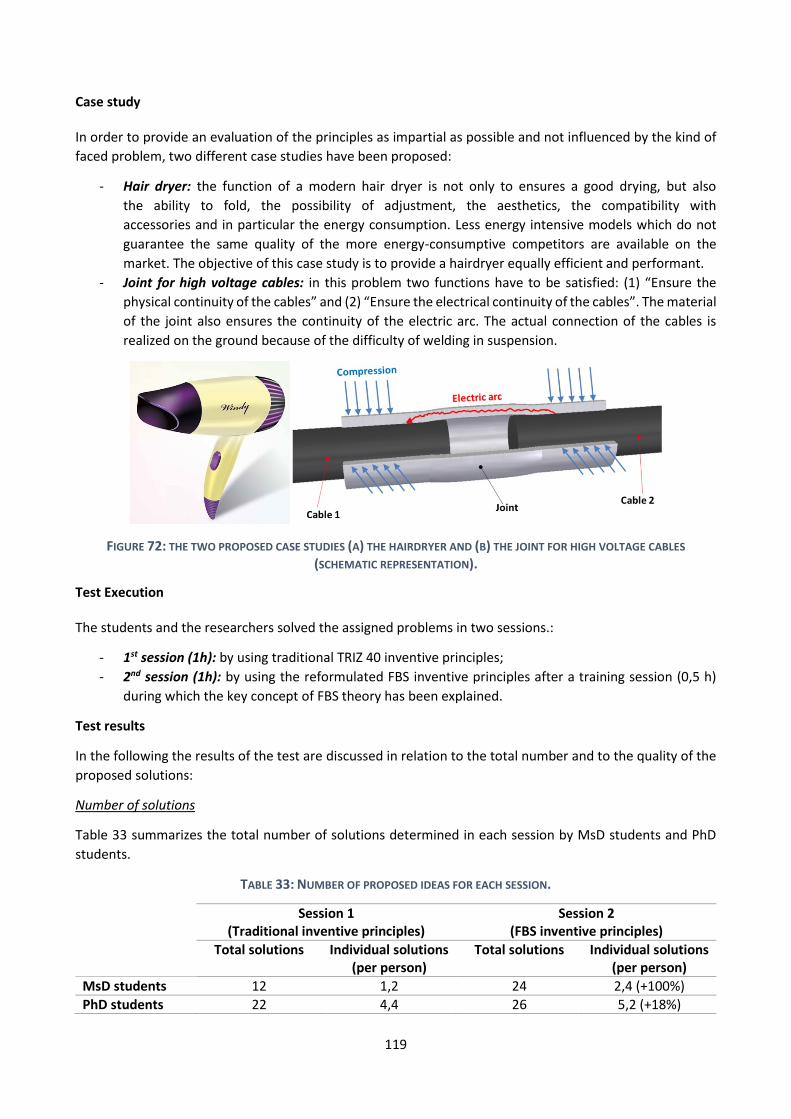
119
Case study
In order to provide an evaluation of the principles as impartial as possible and not influenced by the kind of
faced problem, two different case studies have been proposed:
- Hair dryer: the function of a modern hair dryer is not only to ensures a good drying, but also
the ability to fold, the possibility of adjustment, the aesthetics, the compatibility with
accessories and in particular the energy consumption. Less energy intensive models which do not
guarantee the same quality of the more energy-consumptive competitors are available on the
market. The objective of this case study is to provide a hairdryer equally efficient and performant.
- Joint for high voltage cables: in this problem two functions have to be satisfied: (1) “Ensure the
physical continuity of the cables” and (2) “Ensure the electrical continuity of the cables”. The material
of the joint also ensures the continuity of the electric arc. The actual connection of the cables is
realized on the ground because of the difficulty of welding in suspension.
FIGURE 72: THE TWO PROPOSED CASE STUDIES (A) THE HAIRDRYER AND (B) THE JOINT FOR HIGH VOLTAGE CABLES
(SCHEMATIC REPRESENTATION).
Test Execution
The students and the researchers solved the assigned problems in two sessions.:
- 1st session (1h): by using traditional TRIZ 40 inventive principles;
- 2nd session (1h): by using the reformulated FBS inventive principles after a training session (0,5 h)
during which the key concept of FBS theory has been explained.
Test results
In the following the results of the test are discussed in relation to the total number and to the quality of the
proposed solutions:
Number of solutions
Table 33 summarizes the total number of solutions determined in each session by MsD students and PhD
students.
TABLE 33: NUMBER OF PROPOSED IDEAS FOR EACH SESSION.
Session 1 (Traditional inventive principles)
Session 2 (FBS inventive principles)
Total solutions Individual solutions (per person)
Total solutions Individual solutions (per person)
MsD students 12 1,2 24 2,4 (+100%)
PhD students 22 4,4 26 5,2 (+18%)
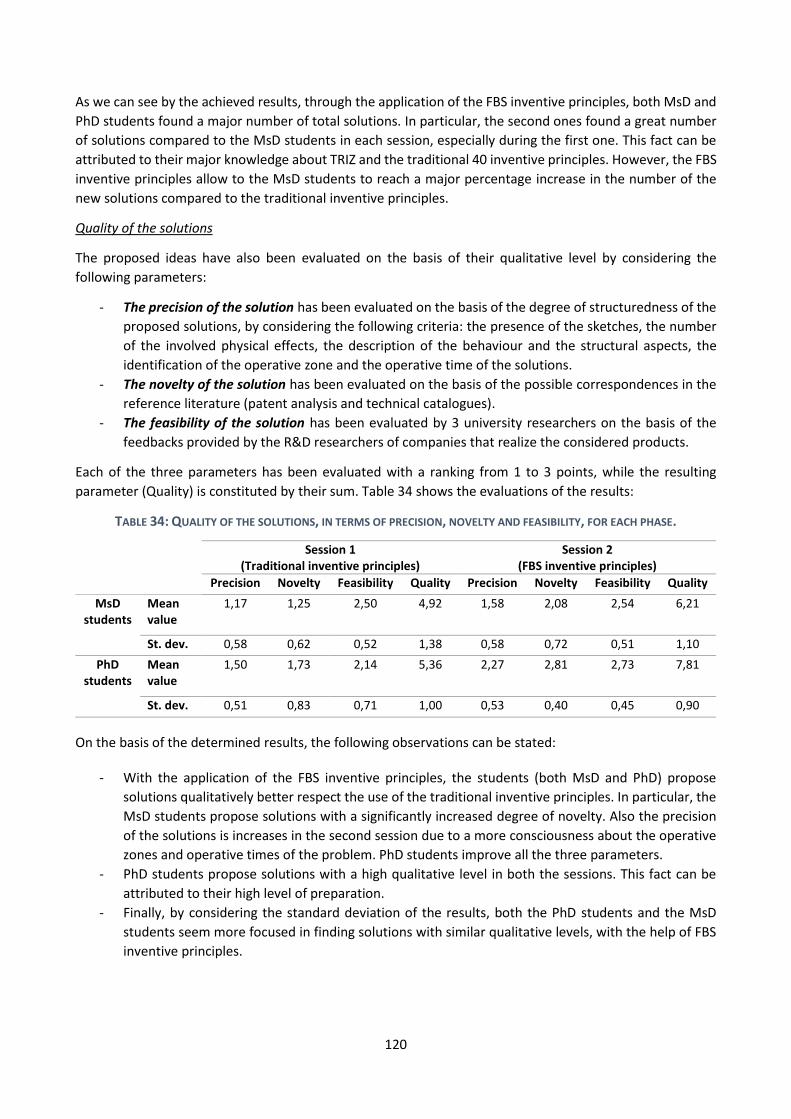
120
As we can see by the achieved results, through the application of the FBS inventive principles, both MsD and
PhD students found a major number of total solutions. In particular, the second ones found a great number
of solutions compared to the MsD students in each session, especially during the first one. This fact can be
attributed to their major knowledge about TRIZ and the traditional 40 inventive principles. However, the FBS
inventive principles allow to the MsD students to reach a major percentage increase in the number of the
new solutions compared to the traditional inventive principles.
Quality of the solutions
The proposed ideas have also been evaluated on the basis of their qualitative level by considering the
following parameters:
- The precision of the solution has been evaluated on the basis of the degree of structuredness of the
proposed solutions, by considering the following criteria: the presence of the sketches, the number
of the involved physical effects, the description of the behaviour and the structural aspects, the
identification of the operative zone and the operative time of the solutions.
- The novelty of the solution has been evaluated on the basis of the possible correspondences in the
reference literature (patent analysis and technical catalogues).
- The feasibility of the solution has been evaluated by 3 university researchers on the basis of the
feedbacks provided by the R&D researchers of companies that realize the considered products.
Each of the three parameters has been evaluated with a ranking from 1 to 3 points, while the resulting
parameter (Quality) is constituted by their sum. Table 34 shows the evaluations of the results:
TABLE 34: QUALITY OF THE SOLUTIONS, IN TERMS OF PRECISION, NOVELTY AND FEASIBILITY, FOR EACH PHASE.
Session 1 (Traditional inventive principles)
Session 2 (FBS inventive principles)
Precision Novelty Feasibility Quality Precision Novelty Feasibility Quality
MsD students
Mean value
1,17 1,25 2,50 4,92 1,58 2,08 2,54 6,21
St. dev. 0,58 0,62 0,52 1,38 0,58 0,72 0,51 1,10
PhD students
Mean value
1,50 1,73 2,14 5,36 2,27 2,81 2,73 7,81
St. dev. 0,51 0,83 0,71 1,00 0,53 0,40 0,45 0,90
On the basis of the determined results, the following observations can be stated:
- With the application of the FBS inventive principles, the students (both MsD and PhD) propose
solutions qualitatively better respect the use of the traditional inventive principles. In particular, the
MsD students propose solutions with a significantly increased degree of novelty. Also the precision
of the solutions is increases in the second session due to a more consciousness about the operative
zones and operative times of the problem. PhD students improve all the three parameters.
- PhD students propose solutions with a high qualitative level in both the sessions. This fact can be
attributed to their high level of preparation.
- Finally, by considering the standard deviation of the results, both the PhD students and the MsD
students seem more focused in finding solutions with similar qualitative levels, with the help of FBS
inventive principles.
121
8.5. Application 5: Idea generation for Measurement problems
The last part of the guidelines, regarding idea generation for problems without contradictions, has been
applied during an industrial collaboration for solving measurement problems for several interesting
parameters of a circuit breaker (see Figure 73). All the achieved solutions come from the guideline #16 “Solve
a measurement problem” and in particular from the Step 1 (“Measure the parameter Y of a field F1” and
“Measure the parameter Y of a substance S1”) and the Step 2 (“Measure the parameter Z of a substance S2”
and “Measure the parameter Z of a field F2”). This because these guidelines are the more suitable for the
considered application.
FIGURE 73: SCHEMATIC REPRESENTATION OF A CIRCUIT BREAKER (ONE PHASE).
Test participants are 7 PhD students in mechanical engineering with TRIZ background. The scheme of the
guidelines has been applied (for 1 week) by each researcher after a detailed common literature analysis on
patents, scientific contributions and catalogues in the field of the circuit breaker. Each of them used the
scheme of the guidelines for solving a specific measurement problem (e.g., measure of the vacuum degree
inside the ampoule, measure of the energy consumption of the motor, measure of the spring condition, etc.)
of the circuit breaker.
Evaluation of the results
Total number of the solutions
The solutions suggested by the guidelines have been divided into two kinds: (1) new solutions with no
correspondence in literature and (2) solutions patented or applied in other industrial fields (not circuit
breaker); and they have been compared with the solutions achieved through the information retrieval.
Table 35 shows the results:
TABLE 35: TEST RESULTS (NUMBER OF PROPOSED IDEAS).
Phase 1: information
retrieval
Phase 2: application of the scheme of the guidelines for measure problems
Addressed problems Total solutions
New solutions Solutions patented in other
fields
Total solutions
Problem 1 9 9 0 9
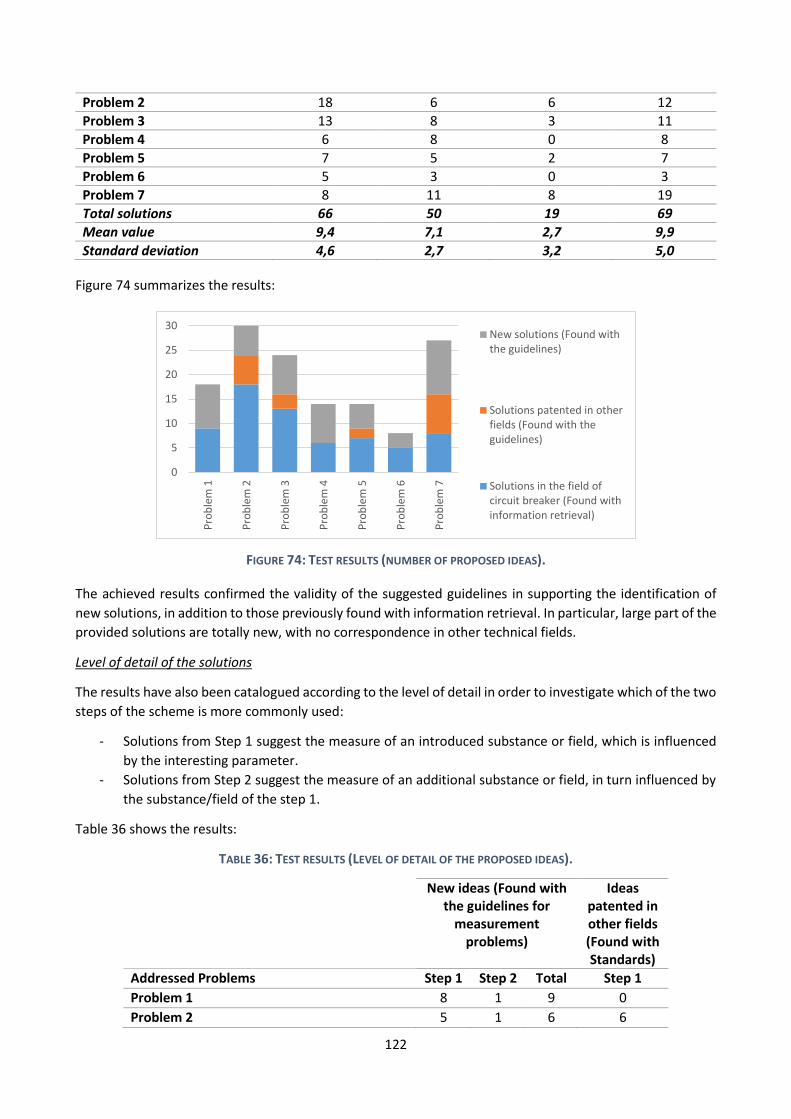
122
Problem 2 18 6 6 12
Problem 3 13 8 3 11
Problem 4 6 8 0 8
Problem 5 7 5 2 7
Problem 6 5 3 0 3
Problem 7 8 11 8 19
Total solutions 66 50 19 69
Mean value 9,4 7,1 2,7 9,9
Standard deviation 4,6 2,7 3,2 5,0
Figure 74 summarizes the results:
FIGURE 74: TEST RESULTS (NUMBER OF PROPOSED IDEAS).
The achieved results confirmed the validity of the suggested guidelines in supporting the identification of
new solutions, in addition to those previously found with information retrieval. In particular, large part of the
provided solutions are totally new, with no correspondence in other technical fields.
Level of detail of the solutions
The results have also been catalogued according to the level of detail in order to investigate which of the two
steps of the scheme is more commonly used:
- Solutions from Step 1 suggest the measure of an introduced substance or field, which is influenced
by the interesting parameter.
- Solutions from Step 2 suggest the measure of an additional substance or field, in turn influenced by
the substance/field of the step 1.
Table 36 shows the results:
TABLE 36: TEST RESULTS (LEVEL OF DETAIL OF THE PROPOSED IDEAS).
New ideas (Found with the guidelines for
measurement problems)
Ideas patented in other fields (Found with Standards)
Addressed Problems Step 1 Step 2 Total Step 1
Problem 1 8 1 9 0
Problem 2 5 1 6 6
0
5
10
15
20
25
30
Pro
ble
m 1
Pro
ble
m 2
Pro
ble
m 3
Pro
ble
m 4
Pro
ble
m 5
Pro
ble
m 6
Pro
ble
m 7
New solutions (Found withthe guidelines)
Solutions patented in otherfields (Found with theguidelines)
Solutions in the field ofcircuit breaker (Found withinformation retrieval)
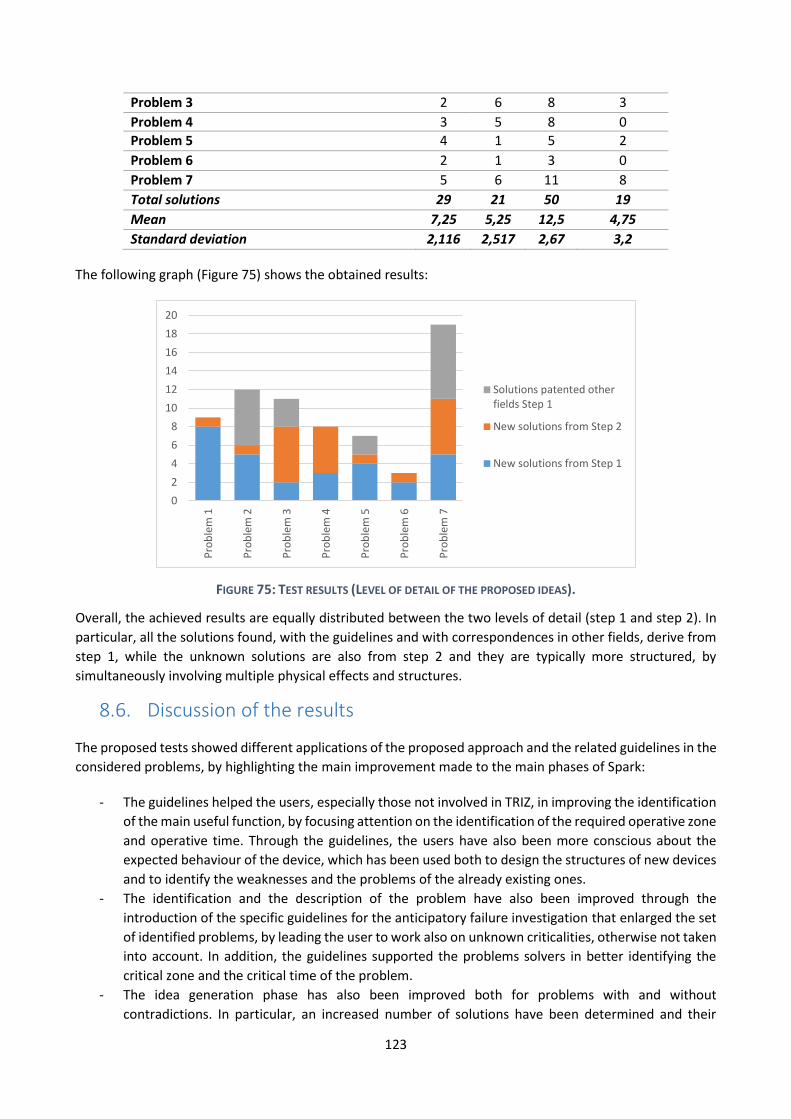
123
Problem 3 2 6 8 3
Problem 4 3 5 8 0
Problem 5 4 1 5 2
Problem 6 2 1 3 0
Problem 7 5 6 11 8
Total solutions 29 21 50 19
Mean 7,25 5,25 12,5 4,75
Standard deviation 2,116 2,517 2,67 3,2
The following graph (Figure 75) shows the obtained results:
FIGURE 75: TEST RESULTS (LEVEL OF DETAIL OF THE PROPOSED IDEAS).
Overall, the achieved results are equally distributed between the two levels of detail (step 1 and step 2). In
particular, all the solutions found, with the guidelines and with correspondences in other fields, derive from
step 1, while the unknown solutions are also from step 2 and they are typically more structured, by
simultaneously involving multiple physical effects and structures.
8.6. Discussion of the results
The proposed tests showed different applications of the proposed approach and the related guidelines in the
considered problems, by highlighting the main improvement made to the main phases of Spark:
- The guidelines helped the users, especially those not involved in TRIZ, in improving the identification
of the main useful function, by focusing attention on the identification of the required operative zone
and operative time. Through the guidelines, the users have also been more conscious about the
expected behaviour of the device, which has been used both to design the structures of new devices
and to identify the weaknesses and the problems of the already existing ones.
- The identification and the description of the problem have also been improved through the
introduction of the specific guidelines for the anticipatory failure investigation that enlarged the set
of identified problems, by leading the user to work also on unknown criticalities, otherwise not taken
into account. In addition, the guidelines supported the problems solvers in better identifying the
critical zone and the critical time of the problem.
- The idea generation phase has also been improved both for problems with and without
contradictions. In particular, an increased number of solutions have been determined and their
0
2
4
6
8
10
12
14
16
18
20
Pro
ble
m 1
Pro
ble
m 2
Pro
ble
m 3
Pro
ble
m 4
Pro
ble
m 5
Pro
ble
m 6
Pro
ble
m 7
Solutions patented otherfields Step 1
New solutions from Step 2
New solutions from Step 1

124
qualitative level has been improved through the identification of unknown resources and the better
exploitation of the already considered ones. In addition, the proposed solutions have been
characterized by increased novelty and feasibility.
125
9. Conclusions In this Ph.D. thesis, the key features to create good guidelines have been investigated on the basis of
literature review, empirical evidences collected during the collaborations in industrial projects and tests with
students. The identified features have been applied to develop specific guidelines with the aim to improve
Spark methodology.
During this activity, first of all, a restricted number of inventive problems, including new concept design,
anticipatory failure investigation/robust design, elimination of harmful effects and product improvement,
have been identified within a broader set of technical problems, and have been considered as domain of
application.
Then, the main features of the guidelines for problem solving have been analysed. They are: the structure of
single guidelines (order of the provided suggestions, text, examples and graphical representations), the
organisation of multiple guidelines (e.g., hierarchical maps, random lists), the advantages of software
implementation (e.g., text customisation, interactive examples) and the most suitable strategies and tools
suggested by the guidelines (e.g., use of models, database interrogation). In particular, specific literature
surveys, involving papers and patents, have been carried out on Design models (e.g., FBS), anticipatory failure
techniques (FMEA) and problem solving techniques (TRIZ), with a focus on the presented case studies. During
the analysis I focused attention to comprehend how the structure and the content of the guidelines change
in relation to: (1) the kinds of addressed problems by analysing the correspondence with the considered
problem domain; (2) the different phases of the problem solving activity (problem identification, problem
formulation, idea generation, etc.) and (3) the kinds of users (professionals and students) with regard to their
specific methodological and technical background.
After that, a set of guidelines have been defined in order to improve Spark methodology by integrating two
proposed models (the comprehensive design scheme and the FMEA-TRIZ model) and reviewing some steps,
with the aim to ameliorate the comprehension and the efficacy and enlarge its domain of application to all
the considered inventive problems.
The proposed integrations have been: (1) the comprehensive conceptual design scheme to improve function
identification in Spark through the identification of the most important elements of design activities
(function, behaviour, affordances, manipulations, structures, signals) and the relations among them; (2) the
FMEA-TRIZ model that enlarges the efficacy of problem investigation in Spark by adding the possible future
failures of the device, through a step divided procedure based on traditional FMEA and involving some TRIZ
tools (e.g., function analysis, resources and subversion analysis).
The revisions have been: (1) FBS inventive principles, or a new version of the traditional TRIZ 40 inventive
principles revised through a rigorous FBS ontology, which have been divided into sub-principles specifically
acting on the function, the behaviour and the structure of the device; (2) a scheme of guidelines based on 76
standards solutions, revised through a less rigorous methodological formalism (Su-Field model) and
organized in a more practical structure.
The resulting comprehensive set of guidelines has been organised into four main groups (i.e., Functional
overview, Innovation strategy, Problem identification and formulation and Idea generation) and all the
guidelines have been built with the same structure including: goal declaration, suggestions, tools, examples
and reference to the subsequent guidelines.
126
Subsequently I studied the integration between information retrieval techniques and some modules of
modified Spark (e.g., idea generation) and I proposed a method that automatically translates the suggestions
provided by the guidelines into functions and it creates queries containing the information provided by the
user (e.g., the name of the product to innovate) for databases interrogation. The result is a list of suggestions
(e.g., physical effects and technologies) to innovate the product.
The guidelines have been embedded in the software platform I developed as a web application through
HTML, CSS and JavaScript languages. The platform is based on a direct interaction with the user, through
data entry about the problem (e.g., name of the device, description of the negative effects) and the context
of application (e.g., the requirements), the selection of the guidelines, through navigation menu, and the
customisation of the visualized guidelines according to the collected data. In addition, the software platform
directly addresses to the databases for the research of information. These features made the guidelines more
comprehensible, especially for R&D technicians, and more practical.
Finally, the proposed guidelines have been tested with some real industrial case studies, by involving students
in engineering, with encouraging results: (1) Function identification has been improved through a more
precise description (e.g., including functional verbs) and the identification of the required operative zone and
time; (2) Problem identification has been improved with an increased user’s awareness about the dynamic
of occurrence, the critical zone and the critical time and through the determination of the possible future
failures of the device; (3) Idea generation has been improved through the determination of a greater number
of solutions, characterized by an increased qualitative level in terms of novelty, feasibility, and resource
exploitation.
Future developments
Future developments will regard the continuation of the ontological analysis of the guidelines, a further
development of the proposed guidelines and an enlarged test campaign. In particular, the following activities
have been planned for the next months:
Developing a set of rules to write good guidelines
The analysis of the features of guidelines will be enlarged to a wider pool of considered documents from
literature and from practical evidences. The collected features of the guidelines will be formalized within a
rigorous set of rules.
Continuing the development of the proposed guidelines
The proposed guidelines will be improved through the development of the linguistic formulation and the
identification of specific examples with the aim to facilitate their comprehension especially for novice users
and with different scientific and technical backgrounds. In addition, the software platform will be updated in
order to improve the integration with knowledge databases and the user interface providing a more intuitive
interaction style.
Massive application of the guidelines
So far, the proposed guidelines have been tested on a restricted number of industrial case studies for limited
periods of time and involving almost exclusively students. In the next months, they will be applied on more
complex industrial projects, including all the stages of product development, and by professionals, with the
aim to investigate all the advantages and limitations of the guidelines not yet highlighted.
127
Bibliography
[1] D. H. Jonassen and W. Hung, “All Problems are Not Equal: Implications for Problem-Based Learning,” Interdiscip. J. Probl. Learn., vol. 2, no. 2, 2008.
[2] G. Ivanov and M. Barkan, “Process Management Using Systemic Thought Process: Identification and Formulation of Creative Tasks.” 2006.
[3] A. Roggel, “TRIZ Development at Intel Corporation,” in Japan TRIZ Symposium, 2008.
[4] V. Krasnoslobodtsev and R. Langevin, “Applied TRIZ in high-tech industry,” Proc. TRIZCON2006, Milwaukee, USA, 2006.
[5] J. Hirtz, R. B. Stone, D. A. Mcadams, S. Szykman, and K. L. Wood, “A Functional Basis for Engineering Deisgn: Reconciling and Evolving Previous Efforts,” Res. Eng. Des., vol. 13, pp. 65–82, 2002.
[6] A. M. Pinyayev, “A Method for Inventive Problem Analysis and Solution Based On Why-Why Analysis and Functional Clues,” St. Petersburg, Russ. Int. TRIZ Assoc. TRIZ Master Thesis, 2007.
[7] D. Mann, “Hands on systematic innovation,” 2002.
[8] N. F. O. Evbuomwan, S. Sivaloganathan, and A. Jebb, “A survey of design philosophies, models, methods and systems,” Proc. Inst. Mech. Eng. Part B J. Eng. Manuf., vol. 210, no. 4, pp. 301–320, 1996.
[9] R. Coyne, “Wicked problems revisited,” Des. Stud., vol. 26, no. 1, pp. 5–17, 2005.
[10] R. E. Mayer and M. C. Wittrock, “Problem Solving ,” in Handbook of Educational Psychology, 2006, pp. 287–304.
[11] D. H. Jonassen, “Toward a design theory of problem solving,” Educ. Technol. Res. Dev., vol. 48, no. 4, pp. 63–85, 2000.
[12] D. H. Jonassen and W. Hung, “All problems are not equal: implications for problem-based learning,” Essent. readings Probl. Learn. Explor. extending Leg. Howard S. Barrows, pp. 17–41, 2015.
[13] P. A. Frensch and J. Funke, Complex problem solving: The European perspective. Psychology Press, 2014.
[14] N. Becattini, Y. Borgianni, G. Cascini, and F. Rotini, “Model and algorithm for computer-aided inventive problem analysis,” Comput. Des., vol. 44, no. 10, pp. 961–986, Oct. 2012.
[15] G. S. Altshuller, “Creativity as an exact science: The Theory of the Solution of Inventive Problems. 1984,” Gordon Breach Sci. Publ. New York, 1984.
[16] C. L. Lynch, S. K. Wolcott, and G. E. Huber, “Tutorial for optimizing and documenting open-ended problem solving skills.” 2000.
[17] A. Hatchuel and B. Weil, “A New Approach of Innovative Design : an Introduction To C-K Theory,” Int. Conf. Eng. Des., pp. 1–15, 2003.
[18] T. J. D’Zurilla and M. R. Goldfried, “Problem solving and behavior modification.,” J. Abnorm. Psychol., vol. 78, no. 1, p. 107, 1971.
[19] E. C. Chang, T. J. D’Zurilla, and L. J. Sanna, Social problem solving: Theory, research, and training. American Psychological Association, 2004.
[20] W. J. Clancey, “Heuristic classification,” Artif. Intell., vol. 27, no. 3, pp. 289–350, 1985.
[21] R. Benjamins, D. Fensel, R. Straatman, “Assumptions of problem-solving methods and their role in knowledge engineering,” in ECAI, 1996, pp. 408–412.
[22] D. P. Moreno, A. A. Hernandez, M. C. Yang, K. N. Otto, K. Hölttä-Otto, J. S. Linsey, K. L. Wood, and A. Linden, “Fundamental studies in Design-by-Analogy: A focus on domain-knowledge experts and applications to transactional design problems,” Des. Stud., vol. 35, no. 3, pp. 232–272, 2014.

128
[23] K. Fu, D. Moreno, M. Yang, and K. L. Wood, “Bio-Inspired Design: An Overview Investigating Open Questions From the Broader Field of Design-by-Analogy,” J. Mech. Des., vol. 136, no. 11, Oct. 2014.
[24] Y. Wang and V. Chiew, “On the cognitive process of human problem solving,” Cogn. Syst. Res., vol. 11, no. 1, pp. 81–92, 2010.
[25] Y. Umeda and H. Takeda, “Function, behaviour, and structure,” Applications of artificial …, vol. V, no. 1. pp. 177–194, 1990.
[26] T. Tomiyama, P. Gu, Y. Jin, D. Lutters, C. Kind, and F. Kimura, “Design methodologies: Industrial and educational applications,” CIRP Ann. Technol., vol. 58, no. 2, pp. 543–565, 2009.
[27] J. J. Shah, S. V Kulkarni, and N. Vargas-Hernandez, “Evaluation of idea generation methods for conceptual design: effectiveness metrics and design of experiments,” J. Mech. Des., vol. 122, no. 4, pp. 377–384, 2000.
[28] M. Orloff, Inventive thinking through TRIZ: a practical guide. Springer-Verlag, 2003.
[29] B. Eberle, Scamper on: Games for imagination development. Prufrock Press Inc., 1996.
[30] G. Pahl and W. Beitz, “Konstruktionslehre Springer Verlag,” Berlin, Heidelberg, New York, London, Tokyo, 1977.
[31] V. Fey and E. Rivin, Innovation on demand: New product development using TRIZ. Cambridge University Press, 2005.
[32] T. Montecchi and D. Russo, “FBOS: function/behaviour--oriented search,” Procedia Eng., vol. 131, pp. 140–149, 2015.
[33] D. Russo, T. Montecchi, and Y. Liu, “Functional-based search for patent technology transfer,” in ASME 2012 International Design Engineering Technical Conferences and Computers and Information in Engineering Conference, 2012, pp. 529–539.
[34] G. S. Altshuller and A. M. Victory, “Algorithm of Inventive Problem Solving (ARIZ-85C),” in Methodological materials for trainees of the seminar“ Methods of solving scientific and engineering problems”-L.: Leningrad Metal Works, 1985.
[35] A. L. Porter, “Technology foresight: types and methods,” International Journal of Foresight and Innovation Policy, vol. 6. p. 36, 2010.
[36] J. P. Bagian, J. Gosbee, C. Z. Lee, L. Williams, S. D. McKnight, and D. M. Mannos, “The Veterans Affairs root cause analysis system in action.,” Jt. Comm. J. Qual. Improv., vol. 28, no. 10, pp. 531–45, Oct. 2002.
[37] D. Cavallucci and N. Khomenko, “From TRIZ to OTSM-TRIZ: addressing complexity challenges in inventive design,” Int. J. Prod. Dev., vol. 4, no. 1–2, pp. 4–21, 2006.
[38] G. Altshuller, L. Shulyak, and S. Rodman, 40 Principles: TRIZ keys to innovation, vol. 1. Technical Innovation Center, Inc., 1997.
[39] C. Spreafico and D. Russo, “TRIZ Industrial Case Studies: A Critical Survey,” Procedia CIRP, vol. 39, pp. 51–56, 2016.
[40] I. M. Ilevbare, D. Probert, and R. Phaal, “A review of TRIZ, and its benefits and challenges in practice,” Technovation, vol. 33, no. 2–3, pp. 30–37, Feb. 2013.
[41] D. Cavallucci, “World Wide status of TRIZ perceptions and uses a survey of results,” 2009.
[42] E. Sickafus, Unified structured inventive thinking: How to invent. Ntelleck, 1997.
[43] T. Nakagawa, “USIT--creative problem solving procedure with simplified TRIZ,” J. Japan Soc. Des. Eng., vol. 35, no. 4, pp. 111–118, 2000.
[44] R. Horowitz, “From TRIZ to ASIT in 4 Steps,” TRIZ journal, http//www. triz-journal. com/archives/2001/08/c/index. htm, 2001.
129
[45] J. Anderson, “Cognitive psychology and its implications,” 2009.
[46] D. Russo and S. Duci, “Developing Guidelines for Problem Solving,” DESIGN, 2014.
[47] D. Russo and S. Duci, “From Altshuller ’ s 76 Standard Solutions to a new Set of 111 Standards,” Procedia Eng., vol. 131, pp. 747–756, 2015.
[48] D. Russo, D. Regazzoni, and T. Montecchi, “Eco-design with TRIZ laws of evolution,” Procedia Eng., vol. 9, pp. 311–322, Jan. 2011.
[49] G. Goldschmidt and A. L. Sever, “Inspiring design ideas with texts,” Des. Stud., vol. 32, no. 2, pp. 139–155, Mar. 2011.
[50] I. Chiu and L. Shu, “Investigating effects of oppositely related semantic stimuli on design concept creativity,” J. Eng. Des., pp. 37–41, 2012.
[51] R. van der Lugt, “How sketching can affect the idea generation process in design group meetings,” Des. Stud., vol. 26, no. 2, pp. 101–122, Mar. 2005.
[52] P. Sarkar and A. Chakrabarti, “The effect of representation of triggers on design outcomes,” AI EDAM, 2008.
[53] D. Mann, “40 Inventive ( Architecture ) Principles With Examples,” TRIZ J., pp. 1–22, 2001.
[54] G. Retseptor, “40 Inventive Principles in Quality Management,” TRIZ J., 2003.
[55] I. Belski, Improve your thinking: substance-field analysis. TRIZ4U, 2007.
[56] H. Brezet, C. Van Hemel, H. Böttcher, R. Clarke, U. N. E. P. Industry, E. (Paris)., R. I. (# T. Hague)., and D. U. of Technology (Delft)., Ecodesign: a promising approach to sustainable production and consumption. UNEP, 1997.
[57] J. S. Gero, “Design prototypes: a knowledge representation schema for design,” AI Mag., vol. 11, no. 4, p. 26, 1990.
[58] M. A. Rosenman and J. S. Gero, “Purpose and function in design: from the socio-cultural to the techno-physical,” Des. Stud., vol. 19, no. 2, pp. 161–186, 1998.
[59] P. E. Vermaas and K. Dorst, “On the conceptual framework of John Gero’s FBS-model and the prescriptive aims of design methodology,” Des. Stud., vol. 28, no. 2, pp. 133–157, Mar. 2007.
[60] P. Galle, “The ontology of Gero’s FBS model of designing,” Des. Stud., vol. 30, no. 4, pp. 321–339, Jul. 2009.
[61] G. Cao and R. Tan, “FBES model for product conceptual design,” Int. J. Prod. Dev., vol. 4, no. 1–2, pp. 22–36, 2006.
[62] L. Del Frate, M. Franssen, and P. E. Vermaas, “Towards defining technical failure for integrated product development,” in Proceedings of the Eighth International Symposium on Tools and Methods of Competitive Engineering--TMCE, 2010, pp. 12–16.
[63] D. C. Brown and L. Blessing, “The relationship between function and affordance,” in ASME 2005 International Design Engineering Technical Conferences and Computers and Information in Engineering Conference, 2005, pp. 155–160.
[64] G. Cascini, L. Del Frate, G. Fantoni, and F. Montagna, “Beyond the design perspective of Gero’s FBS framework,” in Design computing and cognition’10, Springer, 2011, pp. 77–96.
[65] G. Cascini, G. Fantoni, and F. Montagna, “Situating needs and requirements in the FBS framework,” Des. Stud., vol. 34, no. 5, pp. 636–662, 2013.
[66] S. Ahmed and K. Wallace, “Evaluating a functional basis,” in ASME 2003 International Design Engineering Technical Conferences and Computers and Information in Engineering Conference, 2003, pp. 901–907.
[67] A. Bonaccorsi and G. Fantoni, “Expanding the functional ontology in conceptual design, International
130
Conference on Engineering Design, Iced’07, Paris, France,” 2007.
[68] S. Borgo, M. Carrara, P. Garbacz, and P. E. Vermaas, “A formal ontological perspective on the behaviors and functions of technical artifacts,” Artif. Intell. Eng. Des. Anal. Manuf., vol. 23, no. 01, pp. 3–21, 2009.
[69] J. Pailhès, M. Sallaou, J.-P. Nadeau, and G. M. Fadel, “Energy based functional decomposition in preliminary design,” J. Mech. Des., vol. 133, no. 5, p. 51011, 2011.
[70] H. Komoto and T. Tomiyama, “Multi-disciplinary system decomposition of complex mechatronics systems,” CIRP Ann. Technol., vol. 60, no. 1, pp. 191–194, 2011.
[71] M. Sasajima, Y. Kitamura, M. Ikeda, and R. Mizoguchi, “FBRL: A function and behavior representation language,” in IJCAI, 1995, vol. 95, pp. 1830–1836.
[72] A. Chakrabarti, “SAPPhIRE--an approach to analysis and synthesis,” in DS 58-2: Proceedings of ICED 09, the 17th International Conference on Engineering Design, Vol. 2, Design Theory and Research Methodology, Palo Alto, CA, USA, 24.-27.08. 2009, 2009.
[73] J. S. Gero, “Design Prototypes : A Knowledge Representation Schema for Design,” vol. 11, no. 4, 1990.
[74] D. Gabelloni and G. Fantoni, “DESIGNERS ’ PROMISES OR USERS ’ EXPECTATIONS ?,” no. August, pp. 1–10, 2013.
[75] J. S. Gero and U. Kannengiesser, “The situated function–behaviour–structure framework,” Des. Stud., vol. 25, no. 4, pp. 373–391, Jul. 2004.
[76] J. R. a. Maier and G. M. Fadel, “Affordance-based design methods for innovative design, redesign and reverse engineering,” Res. Eng. Des., vol. 20, no. 4, pp. 225–239, Mar. 2009.
[77] W. W. Gaver, “Technology affordances,” in Proceedings of the SIGCHI conference on Human factors in computing systems, 1991, pp. 79–84.
[78] G. Cascini, G. Fantoni, F. Montagna, “Reflections on the FBS model: proposal for an extension to needs and requirements modeling,” in DS 60: Proceedings of DESIGN 2010, the 11th International Design Conference, Dubrovnik, Croatia, 2010.
[79] G. Cascini, L. Del Frate, and G. Fantoni, “Beyond the Design Perspective of Gero ’ s FBS Framework,” Des. Comput. Cogn., pp. 77–96, 2010.
[80] J. S. Gero and H. Fujii, “A computational framework for concept formation for a situated design agent,” Knowledge-Based Syst., vol. 13, no. 6, pp. 361–368, 2000.
[81] K. Shea, C. Ertelt, T. Gmeiner, and F. Ameri, “Design-to-fabrication automation for the cognitive machine shop,” Adv. Eng. Informatics, vol. 24, no. 3, pp. 251–268, Aug. 2010.
[82] G. Fantoni, D. Gabelloni, and J. Tilli, “Concept design of new grippers using abstraction and analogy,” Proc. Inst. Mech. Eng. Part B J. Eng. Manuf., vol. 227, no. 10, pp. 1521–1532, Jun. 2013.
[83] G. S. Altshuller, “To find an idea: introduction to the Theory of Inventive Problem Solving.” Novosibirsk, Nauka, 1986.
[84] A. Sutrisno and T. R. J. Lee, “Service reliability assessment using failure mode and effect analysis ( FMEA ): survey and opportunity roadmap,” vol. 3, no. 7, pp. 25–38, 2011.
[85] H.-C. Liu, L. Liu, and N. Liu, “Risk evaluation approaches in failure mode and effects analysis: A literature review,” Expert Syst. Appl., vol. 40, no. 2, pp. 828–838, Feb. 2013.
[86] J. Tixier, G. Dusserre, O. Salvi, and D. Gaston, “Review of 62 risk analysis methodologies of industrial plants,” J. Loss Prev. Process Ind., vol. 15, no. 4, pp. 291–303, Jul. 2002.
[87] S. Kmenta and I. Kosuke, “Advanced FMEA using meta behavior modeling for concurrent design of products and controls,” pp. 1–9, 1998.
131
[88] B. Denson, S. Y. Tang, K. Gerber, and V. Blaignan, “An effective and systematic design FMEA approach,” in 2014 Reliability and Maintainability Symposium, 2014, pp. 1–6.
[89] S. Kmenta and K. Ishii, “Scenario-Based Failure Modes and Effects Analysis Using Expected Cost,” J. Mech. Des., vol. 126, no. 6, p. 1027, 2004.
[90] R. Mader, E. Armengaud, G. Grießnig, C. Kreiner, C. Steger, and R. Weiß, “OASIS: An automotive analysis and safety engineering instrument,” Reliab. Eng. Syst. Saf., vol. 120, pp. 150–162, 2013.
[91] C. J. Price and N. S. Taylor, “Automated multiple failure FMEA,” Reliab. Eng. Syst. Saf., vol. 76, no. 1, pp. 1–10, Apr. 2002.
[92] S. J. Rhee, K. Ishii, and D. Division, “Life Cost-Based FMEA Incorporating Data Uncertainty,” 2002.
[93] N. Xiao, H.-Z. Huang, Y. Li, L. He, and T. Jin, “Multiple failure modes analysis and weighted risk priority number evaluation in FMEA,” Eng. Fail. Anal., vol. 18, no. 4, pp. 1162–1170, Jun. 2011.
[94] S. J. Rhee and K. Ishii, “Using cost based FMEA to enhance reliability and serviceability,” Adv. Eng. Informatics, vol. 17, no. 3–4, pp. 179–188, Jul. 2003.
[95] H. Liu, L. Liu, Q. Bian, Q. Lin, N. Dong, and P. Xu, “Expert Systems with Applications Failure mode and effects analysis using fuzzy evidential reasoning approach and grey theory,” Expert Syst. Appl., vol. 38, no. 4, pp. 4403–4415, 2011.
[96] V. Ebrahimipour, K. Rezaie, and S. Shokravi, “An ontology approach to support FMEA studies,” Expert Syst. Appl., vol. 37, no. 1, pp. 671–677, Jan. 2010.
[97] S. Kmenta and K. Ishii, “Scenario-based FMEA: a life cycle cost perspective,” in Submitted to Proceedings of DETC 2000 2000 ASME Design Engineering Technical Conferences September 10 - 14, 2000, Baltimore, Maryland, 2000.
[98] C. E. Pelaez and J. B. Bowles, “Using Fuzzy Cognitive Maps as a System Model for Failure Modes and Effects Analysis,” vol. 199, pp. 177–199, 1996.
[99] S.-B. Yen and J. L. Chen, “An Eco-Innovative tool by Integrating FMEA and TRIZ methods,” in Environmentally Conscious Design and Inverse Manufacturing, 2005. Eco Design 2005. Fourth International Symposium on, 2005, pp. 678–683.
[100] D. Regazzoni and D. Russo, “TRIZ tools to enhance risk management,” Procedia Eng., vol. 9, pp. 40–51, Jan. 2011.
[101] T. N. Belski Iouri, Belski Anne, Berdonosov Victor, Busov Bohuslav, Bartlova Milada, Malashevskaya Elena, Kässi Tuomo, Kutvonen Antero, “Can simple ideation techniques influence idea generation: comparing results from Australia, Czech Republic, Finland and Russian Federation,” 2015.
[102] D. Russo, M. Schöfer, and G. Bersano, “Supporting ECO-innovation in SMEs by TRIZ Eco-guidelines,” Procedia Eng., vol. 131, pp. 831–839, 2015.
[103] S. Hüsig and S. Kohn, “Computer aided innovation-State of the art from a new product development perspective,” Comput. Ind., vol. 60, no. 8, pp. 551–562, 2009.
[104] J. S. Gero and M. Lou Maher, Modeling creativity and knowledge-based creative design. Psychology Press, 2013.
[105] R. L. Flores, J.-P. Belaud, J.-M. Le Lann, and S. Negny, “Using the Collective Intelligence for inventive problem solving: A contribution for Open Computer Aided Innovation,” Expert Syst. Appl., vol. 42, no. 23, pp. 9340–9352, 2015.
[106] D. Mann, M. Driver, J. Poon, W. Lam, R. Wong, C. Wai, A. Cheung, and C. Tang, “Results Of A Multi-Company Scale TRIZ Deployment In Hong Kong,” TRIZ Journal, December, 2005.
[107] H. T. Loh, C. He, and L. Shen, “Automatic classification of patent documents for TRIZ users,” World Pat. Inf., vol. 28, no. 1, pp. 6–13, Mar. 2006.
[108] I. M. Goldfire, “Invention machine goldfire: unleashing the power of research,” Retrieved, vol. 19, p.
132
12, 2012.
[109] V. Birolini, C. Rizzi, and D. Russo, “Teaching students to structure engineering problems with CAI tools,” Int. J. Eng. Educ., vol. 29, no. 2, pp. 334–345, 2013.
[110] N. Khomenko, R. De Guio, L. Lelait, and I. Kaikov, “A framework for OTSM? TRIZ-based computer support to be used in complex problem management,” Int. J. Comput. Appl. Technol., vol. 30, no. 1–2, pp. 88–104, 2007.
[111] T. Montecchi and D. Russo, “Knowledge based approach for formulating TRIZ contradictions,” 2012.
[112] D. Russo and S. Duci, “How to exploit Standard Solutions in problem definition,” TRIZ Futur. Conf., 2014.
[113] G. Altshuller and R. Shapiro, “About technical creativity,” J. Quest. Psychol., vol. 6, pp. 37–49, 1956.
[114] G. Altshuller, “An Additional List of Inventive Principles.” 1971.
[115] J. Terninko, A. Zusman, and B. Zlotin, Systematic innovation: an introduction to TRIZ (theory of inventive problem solving). CRC press, 1998.
[116] V. E. Ross, “A Comparison of Tools Based on the 40 Inventive Principles of TRIZ,” no. November 2006.
[117] D. Mann, “Evolving the Inventive Principles,” pp. 1–5, 2002.
[118] I. De Saeger and E. Claeys, “Strengthening the 40 Inventive Principles,” pp. 2–7.
[119] Y. Salamatov, TRIZ : the right solution at the right time: A Guide to Innovative Problem Solving. 2005.
[120] C. Spreafico, G. Fantoni, D. Russo, “FBS models: an attempt at reconciliation towards a common representation,” in DS 80-2 Proceedings of the 20th International Conference on Engineering Design (ICED 15) Vol 2: Design Theory and Research Methodology Design Processes, Milan, Italy, 27-30.07. 15, 2015.
[121] S. Kaplan, B. Zlotin, A. Zusman, and S. Visnepolschi, New tools for failure and risk analysis: an introduction to anticipatory failure determination (AFD) and the theory of scenario structuring. Ideation International, 1999.
[122] D. Russo and C. Spreafico, “TRIZ 40 Inventive principles classification through FBS ontology,” Procedia Eng., vol. 131, pp. 737–746, 2015.
[123] N. Khomenko, “How to use Standard Solution,” Triz.ko, 2002. .
[124] V. Souchkov, “Accelerate innovation with TRIZ,” Available from(accessed 30.11. 11), 1997.
[125] S. Kim, “Conceptual Design Based on Substance-Field Model in Theory of Inventive Problem Solving,” Int. J. Innov. Manag. Technol., vol. 3, no. 4, pp. 306–309, 2012.
[126] P. Soderlin, “Thoughts on Substance-Field Models and 76 Standards Do we need all of the Standards ?,” TRIZ Journal, 2003. .
[127] D. Russo and C. Spreafico, “A New set of Measurement Standards for a Circuit Breaker Application,” Procedia CIRP, vol. 39, pp. 45–50, 2016.