Embed Size (px)
Citation preview

RIGHT:
URL:
CITATION:
AUTHOR(S):
ISSUE DATE:
TITLE:
A Potent and Site-Selective Agonistof TRPA1( Dissertation_全文 )
Takaya, Junichiro
Takaya, Junichiro. A Potent and Site-Selective Agonist of TRPA1. 京都大学, 2016, 博士(医学)
2016-03-23
https://doi.org/10.14989/doctor.k19611
許諾条件により本文は2017-03-23に公開

A Potent and Site-Selective Agonist of TRPA1
Junichiro Takaya†‡, Kazuhiro Mio∥, Takuya Shiraishi#, Tatsuki Kurokawa#, Shinya Otsuka§, Ya‐
suo Mori#⊥, and Motonari Uesugi*‡§
†Graduate School of Medicine, Kyoto University, Kyoto, Kyoto 606‐8501, Japan ‡Institute for Chemical Research and §Institute for Integrated Cell‐Material Sciences (WPI‐iCeMS), Kyoto University, Uji, Kyoto 611‐0011, Japan ∥Molecu‐lar Profiling Research Center for Drug Discovery, National Institute for Advanced Industrial Science and Technol‐ogy, Koto‐ku, Tokyo 135‐0064, Japan #Department of Synthetic Chemistry and Biological Chemistry, Graduate
School of Engineering and ⊥Department of Technology and Ecology, Hall of Global Environment Studies, Kyoto University, Nishikyo‐ku, Kyoto 615‐8510, Japan
TRPA1, cation channel, chemical biology, chemical library, electron microscopy
ABSTRACT: TRPA1 is a member of the transient receptor potential (TRP) cation channel family that is expressed primarily on sensory neurons. This chemo‐sensor is activated through covalent modification of multiple cysteine residues with a wide range of reactive compounds including allyl isothiocyanate (AITC), a spicy component of wasabi. The present study reports on potent and selective agonists of TRPA1, discovered through screening 1,657 electrophilic molecules. In an effort to vali‐date the mode of action of hit molecules, we noted a new TRPA1‐selective agonist, JT010 (molecule 1), which opens the TRPA1 channel by covalently and site‐selectively binding to Cys621 (EC50 = 0.65 nM). The results suggest that a single mod‐ification of Cys621 is sufficient to open the TRPA1 channel. The TRPA1‐selective probe described herein might be useful for further mechanistic studies of TRPA1 activation.
■ INTRODUCTION
The transient receptor potential (TRP) channel super‐family comprises a diverse group of cation channels that mediate a variety of physiological processes.1,2 Among the members, the TRPV1 and TRPA1 channels sense endoge‐nous algesic substances and environmental irritants, evok‐ing defensive responses, such as pain, coughing, and changes in respiration pattern.3‐6 Due to their involvement in nociception, TRPV1 and TRPA1 have been targets for the development of novel pain reducers.7,8
TRPA1 senses broader environmental stimuli than TRPV1, including cold,9 abnormal pH,10‐13 zinc,14 and reac‐tive irritants.15‐17 The best recognized agonist of TRPA1 is allyl isothiocyanate (AITC), a spicy component of wasabi.18 Electrophilic molecules, including AITC, react covalently with multiple cysteine residues of TRPA1, causing confor‐mational change that opens the channel.15,16 Site‐directed mutagenesis studies have identified three cysteines within the cytoplasmic NH2‐terminus of human TRPA1 (Cys621, Cys641, and Cys665), whose simultaneous mutation ne‐gates the channel‐activating effects of several electrophilic reagents.15 On the other hand, mass spectrometric analysis has revealed three cysteines on mouse TRPA1 (Cys415, Cys422, and Cys622) as target sites for electrophilic ago‐nists.16 Those target sites are conserved in the human hom‐olog of TRPA1 (Cys414, Cys421, and Cys621).
Despite these insights, it remains unclear how the mod‐ification of multiple cysteine residues leads to the activa‐tion of TRPA1. The present study reports the discovery and analysis of a new potent, TRPA1‐selective agonist. JT010
(molecule 1), a thiazole derivative equipped with a chloro‐acetyl group, binds covalently and selectively to a single cysteine, Cys621, to open the TRPA1 channel (EC50 = 0.65 nM). The site‐selective chemical probe described herein might serve as a tool for further mechanistic studies of TRPA1 activation.
■ RESULTS
Screening of electrophilic molecules. TRPA1 is gener‐ally thought to be activated by reactive molecules, includ‐ing electrophilic compounds. To identify potent, selective agonists of TRPA1, we screened a chemical library of 1,657 moderately electrophilic molecules that contain chloroa‐cetyl, bromoacetyl, or epoxide groups (Figure S1A‐D). The molecules were screened to identify agonists that cause a calcium influx in TRPA1‐transfected HEK293 cells. The cal‐cium influx was estimated by measuring signals from Fluo‐8, a fluorescent Ca2+‐indicator dye. Three structurally‐re‐lated molecules induced a calcium influx at half maximal effective concentrations (EC50) less than 1 nM (Figure S1E). These hit molecules share a 2‐chloro‐N‐(thiazol‐2‐yl)acet‐amide structure (Figure S1F). We selected one of the three molecules, 2‐chloro‐N‐(4‐(4‐ethoxyphenyl)thiazol‐2‐yl)‐N‐(3‐methoxypropyl)acetamide (JT010; molecule 1 in Fig‐ure 1A) for further investigation.

2
Molecule 1 as a potent electrophilic agonist of TRPA1. The chemical structure of molecule 1 was con‐firmed by its chemical synthesis (Scheme S1) and TRPA1 activity (Figure 1A‐C). Calcium imaging assays demon‐strated that 1 nM of synthesized molecule 1 caused calcium influx at comparable levels to 100 µM AITC in cells overex‐pressing TRPA1, but caused no detectable activity in the mock‐transfected cells (Figure 1B). The effect of molecule 1 is dose‐dependent, with an EC50 value of 0.65 nM (Figure 1C). In contrast, JT010‐H (2), a derivative of molecule 1 in which Cl is replaced with H, displayed activity ~1000 times weaker (EC50 > 100 nM), indicating the importance of the electrophilic functional group of molecule 1. It is likely that molecule 1 reacts with cysteine residues in TRPA1, similarly to other electrophilic agonists, including AITC.
To confirm that the calcium influx activity of molecule 1 is TRPA1‐dependent, we examined the effects of AP‐18 and HC‐030031, selective antagonists of TRPA1,19,20 on the activ‐ity of molecule 1. As expected, AP‐18 (10 µM) suppressed calcium influx stimulated by molecule 1 in cells overex‐pressing TRPA1 (Figure 1D). The inhibitory effect of AP‐18 and HC‐030031 was dose‐dependent, with IC50 values of 9.1 and 10.3 µM, respectively (Figure S2).
Selectivity of molecule 1 among TRP channels. Known TRPA1 agonists often activate TRP channels other than TRPA1. For example, SNAP, an NO donor, potentiates TRPA1, TRPV1, TRPV3, TRPV4, and TRPC5;21,22 H2O2 stim‐ulates TRPA1, TRPM2, and TRPC5;23,24 L‐menthol evokes TRPA1, TRPV3 and TRPM8;25 and isothiocyanates, includ‐ing AITC, activate TRPA1 and TRPV1.26‐28 Calcium imaging assays with HEK293 cells that express all seven of the se‐lected TRP channels showed that molecule 1 is highly se‐lective for TRPA1 (Figure 2). TRPV1, TRPV3, TRPV4, TRPM2, TRPM8, and TRPC5 were not activated, even with 1 µM of molecule 1.
Covalent interaction of molecule 1 with TRPA1. To confirm the covalent interaction of molecule 1 with TRPA1, we chemically synthesized molecule 3, a biotinylated ana‐log of molecule 1 (Figure 3A, Scheme S2). Molecule 3 re‐tained a nM‐range activity (EC50 = 30 nM), although its ac‐tivity was ~50 times weaker than that of molecule 1 (Figure 3B).
Figure 1. Molecule 1 stimulates calcium influx through the TRPA1 channel. (A) Chemical structures of JT010 (1) and its non‐electrophilic derivative, JT010‐H (2). (B) Representa‐tive calcium images analyzed for response of Fluo‐8‐loaded TRPA1‐ or mock‐transfected HEK293 cells to mole‐cule 1 or AITC. (C) Dose‐response curve of Fluo‐8 fluores‐cence changes induced by molecule 1 or 2 in TRPA1‐ or mock‐transfected cells. Fluorescence changes (ΔFmax/F0) were normalized to the maximum response induced by molecule 1. The plots were fitted to a four‐parameter lo‐gistic model, using Image J. An EC50 of 0.65 nM was calcu‐lated from the fitted curve. Data points are mean ± s.e.m. (n = 3). (D) The inhibitory effect of AP‐18 on Fluo‐8 fluo‐rescence changes induced by molecule 1 in TRPA1‐transfected HEK293 cells. 10 µM AP‐18 or DMSO (control) were added to the cells prior to activation of TRPA1 by mol‐ecule 1 at the various concentrations. Data points are mean ± s.d. (n = 2).
Figure 2. Among TRP channels, molecule 1 selectively af‐fects TRPA1. Fluo‐8 fluorescence changes stimulated by 1 µM molecule 1 or DMSO (control) in TRPA1‐, TRPV1‐, TRPV3‐, TRPV4‐, TRPM2‐, TRPM8‐, or TRPC5‐transfected HEK293 cells. Fluorescence changes were normalized to the following positive controls: TRPA1 to 100 µM AITC; TRPV1 to 10 µM capsaicin; TRPV3 and TRPV4 to 50 µM 2‐APB; TRPM2 to 1 mM H
2O
2; TRPM8 to 100 µM L‐menthol;
TRPC5 to 30 µM DTNP. Data points are mean ± s.e.m. (n = 3).
-10
0
10
20
30
40
50
60
70
80
90
TR
PA
1
TR
PV
1
TR
PV
3
TR
PV
4
TR
PM
2
TR
PM
8
TR
PC
5
Nom
aliz
edΔ
Fm
ax/F
0to
pos
itive
con
trol
s (%
)
1 μM JT010
DMSO
1 µM 1
DMSO

3
Molecule 3 was incubated for 10 min with cells overex‐pressing TRPA1 fused with EGFP at the NH2 terminus. Af‐ter extensive wash, the cells were lysed, and the proteins that reacted with molecule 3 were purified using avidin agarose beads. Western blot analysis with an EGFP anti‐body visualized the biotinylated EGFP‐TRPA1 in a dose‐de‐pendent manner (Figure 3C). When mock‐transfected cells were used, no bands were detected. Moreover, competition
with excess amounts of molecule 1 impaired the biotinyla‐tion of EGFP‐TRPA1 (Figure 3D). When similar experi‐ments were performed with an antibody against TRPA1 in‐stead of the EGFP antibody, essentially the same results were obtained (Figure S3).
An aliquot of the samples was also analyzed by SDS‐PAGE analysis, and the proteins in the gel were visualized
Figure 4. A TRPA1 C621S mutant resists both biotinylation and channel opening induced by molecule 3. (A) Effect of Cys to Ser mutations. EGFP‐TRPA1 wild type‐ (WT) or mu‐tant‐transfected (C414S, C421S, C540S, C621S, C641S or C665S) HEK293 cells were incubated with molecule 3 (500 nM), and biotinylated proteins were purified using avidin beads and analyzed by western blot analysis. (B) Repre‐sentative calcium imaging for response analysis of Fluo‐8‐loaded WT‐, C621S‐, or mock‐transfected HEK293 cells to molecule 3 or AITC. (C) Effect of the mutations on channel responses to molecule 3, DMSO control, or AITC. Data points are mean ± s.e.m. (n = 3‐20). (D) Representative cal‐cium imaging for response analysis of Fluo‐8‐loaded WT‐ or C621S‐transfectd HEK293 cells to molecule 1. (E) Effect of the C621S mutant on channel responses to molecule 1, DMSO control, or AITC. Data points are mean ± s.e.m. (n = 3‐4).
Figure 3. Selective biotinylation of TRPA1 by molecule 3. (A) Chemical structure of molecule 3 (JT010‐B), a biotinylated derivative of molecule 1. (B) Dose‐response curve for mole‐cule 3‐induced Fluo‐8 fluorescence changes in TRPA1‐ or mock‐transfected cells. Fluorescence changes were normal‐ized to the maximum response induced by molecule 3. The plots were fitted to a four‐parameter logistic model, using Image J. An EC50 value of 30 nM was calculated from the fitted curve. Data points are mean ± s.e.m. (n = 6‐15). (C) Dose‐dependent biotinylation of EGFP‐TRPA1 by molecule 3. EGFP‐TRPA1‐transfected HEK293 cells were incubated for 10 min with molecule 3 or DMSO (control) at various concentrations, and biotinylated proteins were purified us‐ing avidin beads. Purified samples (Bound) and cell lysate (Input) were analyzed by Western blot analysis with EGFP antibody. (D) Molecule 1 prevents biotinylation of EGFP‐TRPA1 by molecule 3. EGFP‐TRPA1‐ or mock(EGFP)‐transfected cells were treated with molecule 1 and/or 3 at the various conditions, and biotinylated proteins were puri‐fied and analyzed by Western blot analysis. (E) SDS‐PAGE analysis with silver staining of an aliquot of the samples in D. Arrow indicates a single band at ~160 kDa that is depend‐ent on molecule 3.

4
by silver staining (Figure 3E). Many bands were detected on the gel, possibly due to the presence of endogenous bi‐otinylated proteins and non‐specific proteins. However, we observed a single band at ~160 kDa that is dependent on molecule 3, consistent with the size of the EGFP‐TRPA1 fusion protein. The intensity of this band was reduced, when the cells were co‐incubated with excess amounts of molecule 1, or when mock‐transfected cells were used.
To confirm the irreversible reaction of molecule 3 with TRPA1, we carried out another biotinylation experiment. Cells overexpressing EGFP‐TRPA1 were pretreated with molecule 1 (50 nM) for 10 min. After extensive wash, the cells were incubated with molecule 3 (500 nM). Pretreat‐ment with molecule 1 impaired the ability of molecule 3 to form a covalent bond with EGFP‐TRPA1 (Figure S4). Pre‐treatment with molecule 2, a non‐electrophilic analog of molecule 1, failed to do so, even at concentrations up to 5 µM (Figure S5). Furthermore, when the cells were pre‐treated with molecule 3 for 10 min and subsequently incu‐bated with molecule 1, we observed no detectable effects on the ability of molecule 3 to form a covalent bond with EGFP‐TRPA1 (Figure S4). These results support our hy‐pothesis that molecules 1 and 3 form irreversible bonds with EGFP‐TRPA1.
The binding site of molecule 3. Pretreatment of cells overexpressing EGFP‐TRPA1 with AITC, a TRPA1 agonist found in wasabi, also impaired the ability of molecule 3 to form a covalent bond with EGFP‐TRPA1, although high concentrations (>25 µM) of AITC were required (Figure S6). This result suggests that the modification sites of molecule 3 overlap those of AITC.
The modification sites of electrophilic agonists, includ‐ing AITC, have been identified as six cysteine residues in the NH2 terminal cytosolic segment of TRPA1: Cys414, Cys421, Cys540, Cys621, Cys641, and Cys665.15,16,21 Cells overexpressing EGFP fusions of TRPA1 mutants, in which one of the six cysteines was replaced with a serine, were incubated with molecule 3 (500 nM), and the effects were analyzed using western blots. The C621S mutant of TRPA1 was resistant to the modification; all other mutants reacted with molecule 3 at levels comparable to the wild type (Fig‐ure 4A). These results suggest that Cys621 is the major binding site of molecule 3.
To confirm that Cys621 mediates the channel opening in‐duced by molecule 3, HEK293 cells overexpressing a C621S mutant of TRPA1 were treated with molecule 3. As ex‐pected, the C621S mutant cells were almost completely nonresponsive to molecule 3, even at 500 nM, while wild type cells exhibited calcium influx in the presence of the same concentration of molecule 3 (Figure 4B and S7). In contrast, the response of the C621S mutant cells to AICT was similar to that of the wild type cells.
Ser mutants of the five other cysteine residues were also examined in a cellular context (Figure 4C). Point muta‐tions at Cys414 or Cys621 exhibited the most pronounced effects on channel opening induced by molecule 3. Calcium
influx levels of the C414S and C621S mutants in the pres‐ence of molecule 3 were as low as levels with DMSO, indi‐cating that these two mutants were essentially nonrespon‐sive to molecule 3. However, the C414S mutant also exhib‐ited little response to AITC. Presumably, Cys414 is gener‐ally required for opening the TRPA1 channel. In fact, Cys414 mutants have been shown to be nonresponsive even to 2‐APB, a non‐covalent TRPA1 agonist.13,15,21
When molecule 1 was similarly tested in the C621S mu‐tant cells, molecule 1 (10 nM) failed to stimulate calcium influx in the C621S mutant cells, but induced calcium in‐flux in the wild type cells (Figure 4D, E, and Figure S8). These results confirm that molecule 1 and 3 activates TRPA1 primarily through covalent modification at Cys621.
Direct observation of molecule 3 in TRPA1. Reactive TRPA1 agonists usually stimulate channel opening through modification of multiple cysteine residues.16 The present study found that molecule 3 is a nM‐range agonistic probe that opens the TRPA1 channel by binding covalently and selectively to a single cysteine, Cys621. The biotinylated chemical probe can be used as a tool for mechanistic stud‐ies of TRPA1.
Figure 5. Electron microscopic observation of TRPA1 te‐tramer biotinylated by molecule 3. (A) Representative neg‐atively stained images of biotinylated FLAG‐TRPA1 te‐tramer labeled with streptavidin‐gold nanoparticle (SA‐gold). Purified FLAG‐TRPA1 tetramer was incubated with 5 µM molecule 3 for 1h and then labeled with SA‐gold. (B) Estimated orientation of FLAG‐TRPA1. The FLAG‐tagged COOH terminal end of FLAG‐TRPA1 is known to be cyto‐plasmic. The locations of the FLAG tags were estimated by adding an anti‐FLAG antibody to the samples of (A).

5
To demonstrate its utility, we carried out electron micro‐scopic visualization of the interaction between TRPA1 and molecule 3. TRPA1 tagged with FLAG at the COOH termi‐nus was overexpressed in FreeStyleTM 293‐F cells, and puri‐fied through FLAG‐affinity chromatography, wheat germ agglutinin (WGA) affinity chromatography, and size‐ex‐clusion chromatography (Figure S9A). Blue native‐PAGE analysis showed a broad single band at ~560 kDa (Figure S9B), suggesting that purified FLAG‐TRPA1 forms a te‐tramer, consistent with previously proposed models.29,30
The purified FLAG‐TRPA1 tetramers were incubated with molecule 3 (5 µM) and streptavidin‐gold conjugates (SA‐gold). After removal of unreacted molecule 3 and SA‐gold by FLAG‐affinity chromatography, the biotinylation status of FLAG‐TRPA1 was confirmed by avidin blot analy‐sis, using streptavidin‐HRP (Figure S10A). Electron micro‐scopic observation of the negatively stained sample showed snowman‐shaped images comprising two parti‐cles: a larger particle (FLAG‐TRPA1) and a smaller particle (SA‐gold). Comparison of the FLAG‐TRPA1‐particle images in the presence or absence of molecule 3 (Figure S10B) de‐tected no obvious conformational transition of TRPA1 te‐tramers due to the relatively low resolution of the images. Based on the size of the black dots resulting from gold na‐noparticles (5 nm), the FLAG‐TRPA1 tetramer was esti‐mated to be ~15 nm in diameter (Figure 5A, S10B), which agrees with previously proposed models.30 Most of the SA‐gold particles were located close to the end of the longer axis of the TRPA1 protein particles, suggesting the location of biotinylated sites in the particles.
To examine the orientation of FLAG‐TRPA1 in the im‐ages, we treated the sample with an anti‐FLAG antibody, which detects a FLAG tag at the cytoplasmic COOH termi‐nus of FLAG‐TRPA1 (Figure 5B). Preferred binding of anti‐FLAG antibodies to the gold‐labeled sides of particles sug‐gested that the biotinylation sites are located in the cyto‐plasmic component of TRPA1. This observation is con‐sistent with the proposed cytoplasmic location of Cys621.29,30
■ DISCUSSION
Results of the present study indicate that the chloroa‐cetamide moiety of molecules 1 and 3 binds covalently and selectively to a single cysteine, Cys621, in TRPA1. The chlo‐roacetamide group is generally known to be a moderately electrophilic functional group.31 In fact, as high as >100 mM of dithiothreitol was required to prevent molecule 3 from reacting with TRPA1 in cells (Figure S11), and only 10% of molecule 1 reacted with 2‐mercaptoethanol when incu‐bated at the concentrations of 1 mM for 2 h (data not shown). Molecules 1 and 3 have a mechanism by which they react with Cys621 in TRPA1, in the presence of the abundant thiols and amines in cells.
During the course of our study, Paulsen et al. described a cryo‐electron microscopic (Cryo‐EM) structure of a
TRPA1 tetramer, in which Cys621 is located at the NH2 ter‐minus of an α‐helix and adjacent to a lysine.30 The dipolar moment of the helix and the basicity of the lysine might reduce the pKa of the thiol moiety of Cys621, rendering Cys621 more nucleophilic than other cysteine residues. Furthermore, Cys621 is located in a pocket between an ankyrin repeat and an overlying helix‐turn‐helix. Presum‐ably, the size and shape of the pocket are complementary to molecule 1, increasing the reactivity of molecule 1 with Cys621 through proximity effects. In fact, the activity of molecule 1 is highly sensitive to modification. For example, screening of the chemical library revealed 73 molecules with a 2‐chloro‐N‐(thiazol‐2‐yl)acetamide structure (Fig‐ure S1F), while only three of those molecules exhibited sub‐nanomolar activity.
Three‐dimensional structural analysis of a ligand‐TRPA1 complex is needed for molecular understanding of how the modification of Cys621 with molecule 1 leads to opening of the TRPA1 channel. Such analysis was not possible in the recent Cryo‐EM study, due to insufficient resolution of AITC‐adducted TRPA1 and instability/inefficiency of the AITC adduct formation.30 Molecule 1 (EC50 = 0.65 nM) is >3000‐fold more potent than AITC (EC50 = 2 µM; Figure S6A). Molecule 1 might prove to be useful for future struc‐tural studies of a ligand–channel complex.
Our results suggest that Cys621 is important in channel opening. However, previous studies reported mixed results on the importance of Cys621. NNO‐ABBH, a TRPA1‐selective NO donor, retained its agonist activity in the C621S mutant,21 while 15d‐PGJ2, an anti‐inflammatory me‐diator known as the TRPA1 agonist,32,33 exhibited sup‐pressed channel opening and reduced binding with the C621S mutant.13 Surprisingly, Moparthi et al. reported that
a deletion mutant (Δ1‐688 hTRPA1), lacking most of the
cysteine residues that are important for electrophilic ago‐nists, maintained its cold‐ and chemosensitivities.34 Thus, modification of Cys621 is likely to be sufficient, but not necessary, for opening TRPA1 channel.
■ EXPERIMENTAL SECTION
Cell culture. Human embryonic kidney 293 (HEK293) cells were cultured in Dulbecco’s modified Eagles’ medium (Thermo Fisher Scientific Inc., Massachusetts, USA), con‐taining 10% fetal bovine serum, 100 units/ml penicillin, 100 µg/ml streptomycin, and 0.25 µg/ml amphotericin B, at 37 °C under 5% CO2.
Fluorescent calcium imaging with Fluo‐8. Trans‐fected cells were trypsinized, diluted with DMEM, and plated on poly‐D‐lysine‐coated glass‐bottom viewplate‐96 F (PerkinElmer Inc., Waltham, MA, USA) at a density of 25,000‐30,000 cells/well. Three to nine hours after plating, the medium was changed to flesh DMEM, containing 4 µM Fluo‐8 AM (AAT Bioquest, Inc., Sunnyvale, CA, USA), and the cells were incubated at 37 °C under 5% CO2 for 1 h. The medium containing Fluo‐8 AM was replaced with 200 µL HEPES‐buffered saline, containing the following: 107 mM

6
NaCl, 6 mM KCl, 1.2 mM MgSO4, 2 mM CaCl2, 11.5 mM glu‐cose and 20 mM HEPES (pH 7.4, adjusted with NaOH). The Fluo‐8 fluorescence images were recorded every 5 min, us‐ing Cell Voyager CV1000 (Yokogawa Electric Corporation, Tokyo, Japan), a confocal microscope system, with excita‐tion by Ar laser (wavelength, 488 nm) and a 525/50 band‐pass filter. Recorded images were analyzed using Image J (NIH, Bethesda, MD, USA)
Biotinylation assay. Transfected cells (3 × 10⁶ cells plated on a 100 mm diameter dish) were collected by scrap‐ing and washed twice with PBS. The cells were divided into 8 tubes and mixed with or without molecule 3 and other chemicals at various concentrations. After extensive wash with PBS, the cell pellets were suspended in 1 mL RIPA buffer, containing the following: 150 mM NaCl, 1% Nonidet P‐40, 1% sodium deoxycholate, 0.1% SDS in 25 mM Tris‐HCl (pH 7.5), and 10 mM DTT with 1× protease inhibitor cocktail (Nacalai Tesque, Inc., Kyoto, Japan). The cell sus‐pensions were sonicated using an ASTRASON W‐385 ul‐trasonic processor (Heat Systems ‐ Ultrasonics, Inc., New‐town, CT, USA) for 10 sec, and incubated on ice for 30 min. Lysates were centrifuged at 20,000 ×g for 20 min, and small portions of supernatants were collected as input fractions. Remaining supernatants were mixed with 25 µL of High Capacity NeutrAvidin Agarose Resin (Pierce Biotechnology, Waltham, MA, USA) or SoftLink™ Soft Release Avidin Resin (Promega Corp., Madison, WI, USA), and incubated at 4°C for 2‐4 h. The resin was washed at least four times with RIPA buffer, and biotinylated samples were eluted from the beads. The High Capacity NeutrAvidin Agarose Resin was incubated with 1× SDS sample buffer, containing 100 mM DTT, at room temperature (RT) for 30 min. The SoftLink™ Soft Release Avidin Resin was incubated with RIPA buffer, containing 5 mM biotin at RT for 30 min. Eluted samples were collected as the bound fractions and examined by SDS‐PAGE analysis in a 4‐20% gradient gel (Cosmo Bio, Inc., Tokyo, Japan), and western blot analysis with Living Colors® EGFP Monoclonal Antibody (Clontech Laboratories, Inc., Palo Alto, CA, USA) or an anti‐TRPA1 antibody (NB110‐40763; Novus Biologicals, LLC, Littleton, CO, USA) diluted with Can Get Signal® Immunoreaction Enhancer Solution (Toyobo, Osaka, Japan). The blotted membranes were visualized with ECL Prime Western Blot‐ting Detection Reagent and recorded using ImageQuant LAS500 (GE Healthcare, Little Chalfont, UK).
Electron Microscopic Analysis. Purified FLAG‐TRPA1 tetramer was incubated with 5 µM molecule 3 at 4°C for 1 h. The sample was then incubated with 20 µL of anti‐FLAG affinity beads (Sigma‐Aldrich) for 1 h. After extensive wash, the beads were incubated with 4 µl of streptavidin‐gold na‐noparticle conjugate (BBInternational) at 4°C for 20 min. Unbound SA‐gold conjugates were removed by washing the gel. The TRPA1‐molecule 3‐SA‐gold complex was eluted from the gel with 40 µl of 100 µg/ml FLAG peptide (Sigma‐Aldrich). Peptide was removed by Superdex 200 gel filtration chromatography (GE Healthcare) prior to conju‐gation with anti‐FLAG antibodies.
The eluate containing gold‐labeled TRPA1 was adsorbed onto thin carbon films supported by copper mesh grids, which were rendered hydrophilic in advance by glow‐dis‐charge under low air pressure. Samples were washed with five drops of double‐distilled water, negatively stained with 2% uranyl acetate solution for 30 sec twice, blotted, and dried in air. Samples were observed using a JEM1230 trans‐mission electron microscope (JEOL, Tokyo, Japan) at × 60,000 magnification with 100 kV acceleration voltages. Images were recorded using a TVIPS F114T CCD camera (TVIPS, Oslo, Norway).
ASSOCIATED CONTENT Supplemental information includes details on construction
of recombinant plasmids, overexpression of recombinant pro‐teins, chemical screening, quantification of Fluo8 fluores‐cence images, protein purification, synthesis schemes, and molecule characterization data including 1H‐NMR spectra. This material is available free of charge via the Internet at
http://pubs.acs.org.
AUTHOR INFORMATION
Corresponding Author
*[email protected]‐u.ac.jp
Notes The authors declare no competing financial interest.
ACKNOWLEDGMENT We thank N. Takahashi and D. Kozai for experimental support. This work was supported in part by JSPS KAKENHI Grant Number 26102728 and 26220206 (M.U.). iCeMS is supported by World Premier International Research Center Initiative (WPI), MEXT, Japan. This work was inspired by the interna‐tional and interdisciplinary environments of the iCeMS and JSPS Asian CORE Program, “Asian Chemical Biology Initiative.”
ABBREVIATIONS AITC, Allyl isothiocyanate; AP‐18, 4‐(4‐chlorophenyl)‐3‐methylbut‐3‐en‐2‐one oxime; 2‐APB, 2‐aminoethoxydiphenyl borate; DMSO, Dimethyl sulfoxide; DTNP, 2,2’‐dithiobis(5‐ni‐tropyridine); HC‐030031, 2‐(1,3‐dimethyl‐2,6‐dioxo‐1,2,3,6‐tet‐rahydro‐7H‐purin‐7‐yl)‐N‐(4‐isopropylphenyl)acetamide; SNAP, S‐nitroso‐N‐acetylpenicillamine; TRP, Transient recep‐tor potential
REFERENCES (1) Clapham, D. Nature 2003, 426 (6966), 517‐24. (2) Nilius, B.; Owsianik, G.; Voets, T.; Peters, J. Physiol.
Rev. 2007, 87 (1), 165‐217. (3) Benemei, S.; Patacchini, R.; Trevisani, M.; Geppetti, P. Curr.
Opin. Pharmacol. 2015, 22, 18‐23. (4) Bessac, B. F.; Sivula, M.; Hehn, C. A. von; Escalera, J.; Cohn,
L.; Jordt, S.‐E. E. J. Clin. Invest. 2008, 118 (5), 1899‐910. (5) Bessac, B. F.; Jordt, S.‐E. E. Physiology (Bethesda) 2008, 23,
360‐70. (6) Caterina, M. J.; Schumacher, M. A.; Tominaga, M.; Rosen, T.
A.; Levine, J. D.; Julius, D. Nature 1997, 389 (6653), 816‐24. (7) Moran, M.; McAlexander, M.; Bíró, T.; Szallasi, A. Nat. Rev.
Drug Discovery 2011, 10, 601‐620.

7
(8) Julius, D. Annu. Rev. Cell Dev. Biol. 2013. 29: 355–84. (9) Story, G. M.; Peier, A. M.; Reeve, A. J.; Eid, S. R.; Mosbacher,
J.; Hricik, T. R.; Earley, T. J.; Hergarden, A. C.; Andersson, D. A.; Hwang, S. W.; McIntyre, P.; Jegla, T.; Bevan, S.; Pata‐poutian, A. Cell 2003, 112 (6), 819‐29.
(10) Wang, Y.; Chang, R.; Allgood, S.; Silver, W.; Liman, E. J. Gen. Physiol. 2011, 137 (6), 493‐505.
(11) Fujita, F.; Uchida, K.; Moriyama, T.; Shima, A.; Shibasaki, K.; Inada, H.; Sokabe, T.; Tominaga, M. J. Clin. In‐vest. 2008, 118 (12), 4049‐4057.
(12) Roche, J. de la; Eberhardt, M.; Klinger, A.; Stanslowsky, N.; Wegner, F.; Koppert, W.; Reeh, P.; Lampert, A.; Fischer, M.; Leffler, A. J. Biol. Chem. 2013, 288 (28), 20280‐20292.
(13) Takahashi, N.; Mizuno, Y.; Kozai, D.; Yamamoto, S.; Kiyo‐naka, S.; Shibata, T.; Uchida, K.; Mori, Y. Chan‐nels 2008, 2 (4), 287‐98.
(14) Hu, H.; Bandell, M.; Petrus, M.; Zhu, M.; Patapoutian, A. Nat. Chem. Biol. 2009, 5 (3), 183‐90.
(15) Hinman, A.; Chuang, H.; Bautista, D.; Julius, D. Proc. Natl. Acad. Sci. U. S. A. 2006, 103 (51), 19564‐19568.
(16) Macpherson, L.; Dubin, A.; Evans, M.; Marr, F.; Schultz, P.; Cravatt, B.; Patapoutian, A. Nature 2007, 445 (7127), 541‐5.
(17) Bautista, D.; Movahed, P.; Hinman, A.; Axelsson, H.; Sterner, O.; Högestätt, E.; Julius, D.; Jordt, S.‐E.; Zygmunt, P. Proc. Natl. Acad. Sci. U. S. A. 2005, 102 (34), 12248‐12252.
(18) Jordt, S.‐E. E.; Bautista, D. M.; Chuang, H.‐H. H.; McKemy, D. D.; Zygmunt, P. M.; Högestätt, E. D.; Meng, I. D.; Julius, D. Nature 2004, 427 (6971), 260‐5.
(19) Petrus, M.; Peier, A.; Bandell, M.; Hwang, S.; Huynh, T.; Olney, N.; Jegla, T.; Patapoutian, A. Mol. Pain 2007, 3, 40.
(20) McNamara, C.; Mandel‐Brehm, J.; Bautista, D.; Siemens, J.; Deranian, K.; Zhao, M.; Hayward, N.; Chong, J.; Julius, D.; Moran, M. Proc. Natl. Acad. Sci. U. S. A. 2007, 104 (33), 13525‐13530.
(21) Kozai, D.; Kabasawa, Y.; Ebert, M.; Kiyonaka, S.; Firman; Otani, Y.; Numata, T.; Takahashi, N.; Mori, Y.; Ohwada, T. Mol. Pharmacol. 2014, 85, 175‐185.
(22) Yoshida, T.; Inoue, R.; Morii, T.; Takahashi, N.; Yamamoto, S.; Hara, Y.; Tominaga, M.; Shimizu, S.; Sato, Y.; Mori, Y. Nat. Chem. Biol. 2006, 2 (11), 596‐607.
(23) Sawada, Y.; Hosokawa, H.; Matsumura, K.; Kobayashi, S. Eur. J. Neurosci. 2008, 27 (5), 1131‐42.
(24) Hara, Y.; Wakamori, M.; Ishii, M.; Maeno, E.; Nishida, M.; Yoshida, T.; Yamada, H.; Shimizu, S.; Mori, E.; Kudoh, J.; Shimizu, N.; Kurose, H.; Okada, Y.; Imoto, K.; Mori, Y. Mol. Cell 2002, 9 (1), 163‐173.
(25) Macpherson, L. J.; Hwang, S. W.; Miyamoto, T.; Dubin, A. E.; Patapoutian, A.; Story, G. M. Mol. Cell. Neurosci. 2006, 32 (4), 335‐43.
(26) Everaerts, W.; Gees, M.; Alpizar, Y.; Farre, R.; Leten, C.; Apetrei, A.; Dewachter, I.; Leuven, F. van; Vennekens, R.; Ridder, D.; Nilius, B.; Voets, T.; Talavera, K. Curr. Biol. 2011, 21 (4), 316‐321.
(27) Uchida, K.; Miura, Y.; Nagai, M.; Tominaga, M. Chem. Senses 2012, 37 (9), 809‐818.
(28) Terada, Y.; Masuda, H.; Watanabe, T. J. Nat. Prod. 2015, 78 (8), 1937‐41.
(29) Cvetkov, T.; Huynh, K.; Cohen, M.; Moiseenkova‐Bell, V. J. Biol. Chem. 2011, 286 (44), 38168‐38176.
(30) Paulsen, C. E.; Armache, J.‐P. P.; Gao, Y.; Cheng, Y.; Julius, D. Nature 2015, 520 (7548), 511‐7.
(31) Weerapana, E.; Simon, G.; Cravatt, B. Nat. Chem. Biol. 2008, 4, 405‐407.
(32) Taylor‐Clark, T.; Undem, B.; Macglashan, D.; Ghatta, S.; Carr, M.; McAlexander, M. Mol. Pharmacol. 2007, 73 (2), 274‐281.
(33) Cruz‐Orengo, L.; Dhaka, A.; Heuermann, R.; Young, T.; Mon‐tana, M.; Cavanaugh, E.; Kim, D.; Story, G. Mol. Pain 2008, 4, 30.
(34) Moparthi, L.; Survery, S.; Kreir, M.; Simonsen, C.; Kjellbom, P.; Högestätt, E.; Johanson, U.; Zygmunt, P. Proc. Natl. Acad. Sci. U. S. A. 2014, 111 (47), 16901‐16906.

8
For Table of Contents Only

S1
Supporting information
A Potent and Site-Selective Agonist of TRPA1 Junichiro Takaya, Kazuhiro Mio, Takuya Shiraishi, Tatsuki Kurokawa, Shinya Otsuka, Yasuo Mori and Motonari Uesugi* The chemical library and the experimental reagents.
All compounds in the chemical library were purchased from the following sources; AMRI hungary, ASINEX, AnalytiCon Discovery, BIONET, Butt Park, Labotest, Life chemicals, Peakdale, Princeton, MDD, OTAVA, Pharmeks, Enamine, Scientific Exchange, TOSLab, Vitas‐M, and TimTec. Other chemicals which used in the experiments were purchased from the follow‐ing sources: 2‐aminoethoxydiphenyl borate (2‐APB) and 2,2’‐dithiobis(5‐nitropyridine) (DTNP) were purchased from Sigma‐Aldrich Co. LLC. (St. Louis, MO, USA). Allyl isothiocyanate (AITC), capsaicin, and H2O2 were purchased from Wako Pure Chemical Industries Ltd. (Osaka, Japan). L‐menthol and dithiothreitol (DTT) were purchased from Nacalai Tesque, Inc. (Kyoto, Japan). 4‐(4‐chlorophenyl)‐3‐methylbut‐3‐en‐2‐one oxime (AP‐18) was purchased from R&D systems Inc. (Min‐neapolis, MN, USA). 2‐(1,3‐dimethyl‐2,6‐dioxo‐1,2,3,6‐tetrahydro‐7H‐purin‐7‐yl)‐N‐(4‐isopropylphenyl)acetamide (HC‐030031) was purchased from FOCUS biomolecules (Plymouth Meeting, PA, USA). 1‐Acetoxy‐3chloroacetone was purchased from Tokyo Chemical Industry Co., Ltd. (Tokyo, Japan). Fluo‐8 AM was purchased from AAT Bioquest (Sunnyvale, CA, USA).
Construction of recombinant plasmids
The cDNA of human TRPA1 was inserted in pCI‐neo (Promega Corp., Madison, WI, USA), pEGFP‐C (Clontech Labor‐atories, Palo Alto, CA, USA), and pCMV‐Tag 4 (Stratagene, La Jolla, CA, USA). Cys to Ser mutants of TRPA1, C414S, C421S, C540S, C621S, C641S, and C665S, were constructed using site‐directed mutagenesis as previously reported.1 As an exception, EGFP‐C621S mutant was produced from a pEGFP‐C construct of wildtype TRPA1 using a PrimeSTAR™ mutagenesis basal kit (Takara Bio, Inc., Shiga, Japan) with the following primers: 5’‐AATAAAAGTCCAATTACAGAAATGATA‐3’ and 5’‐AATTGGACTTTTATTGCCTGGAGAATT‐3’. The sequence of the EGFP‐C621S mutant was verified by sequencing (Data not shown), with two different primers: 5’‐GCTTCTTCTGAGCCACAATG‐3’ and 5’‐CACACAGGATGATTGAGAAGC‐3’. Plas‐mids carrying TRPV1, TRPV3, TRPV4, TRPM2 and TRPC5 cDNAs were used as previously described.2 Human TRPM8 was cloned from Human fetal lung, whole Marathon‐Ready cDNA (Clontech Laboratories, Palo Alto, CA, USA) by applying a PCR‐based approach. The TRP cDNAs were inserted in pCI‐neo.
Overexpression of recombinant proteins.
HEK293 cells were transfected with recombinant plasmids using SuperFect Transfection Reagent (QIAGEN, Valencia, CA, USA) or polyethyleneimine (MW 40,000; Polysciences, Inc., Warrington, PA, USA). The SuperFect reagent was used according to the manufacturer’s instructions. Polyethyleneimine was used at the concentration of 1.5 µg/mL in 10 mL DMEM with 5 µg plasmid DNA. Transfected cells were incubated at 37 °C under 5% CO2 for 24‐48 hours before used for the exper‐iments.
Screening.
The chemical library of 1,657 electrophiles was screened with TRPA1‐overexpressigng HEK293 cells by monitoring flu‐orescence signals from Fluo‐8. The initial screening was carried out at the concentration of 100 nM of the chemical library members. Hit compounds were subsequently tested at lower concentrations (10 or 1 nM). The maximum fluorescence changes were normalized to the positive control, 1‐acetoxy‐3‐chloroacetate (SI1; 1 µM).
S2
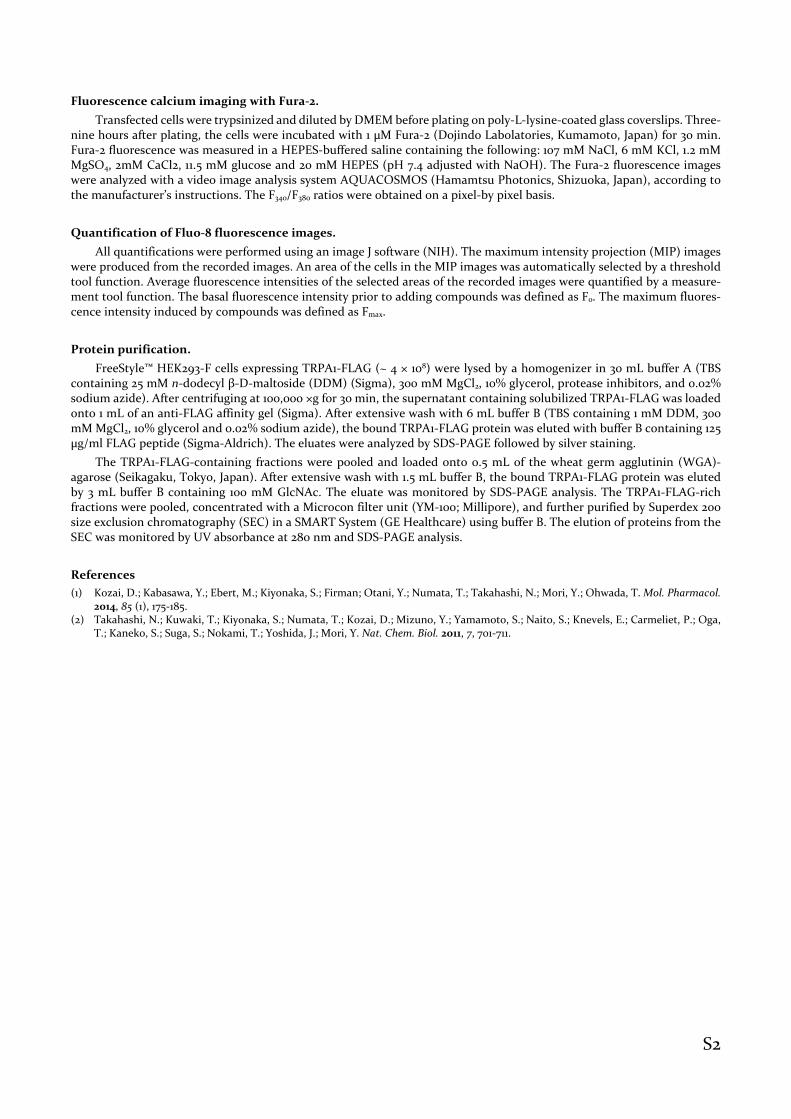
Fluorescence calcium imaging with Fura‐2.
Transfected cells were trypsinized and diluted by DMEM before plating on poly‐L‐lysine‐coated glass coverslips. Three‐nine hours after plating, the cells were incubated with 1 µM Fura‐2 (Dojindo Labolatories, Kumamoto, Japan) for 30 min. Fura‐2 fluorescence was measured in a HEPES‐buffered saline containing the following: 107 mM NaCl, 6 mM KCl, 1.2 mM MgSO4, 2mM CaCl2, 11.5 mM glucose and 20 mM HEPES (pH 7.4 adjusted with NaOH). The Fura‐2 fluorescence images were analyzed with a video image analysis system AQUACOSMOS (Hamamtsu Photonics, Shizuoka, Japan), according to the manufacturer’s instructions. The F340/F380 ratios were obtained on a pixel‐by pixel basis.
Quantification of Fluo‐8 fluorescence images.
All quantifications were performed using an image J software (NIH). The maximum intensity projection (MIP) images were produced from the recorded images. An area of the cells in the MIP images was automatically selected by a threshold tool function. Average fluorescence intensities of the selected areas of the recorded images were quantified by a measure‐ment tool function. The basal fluorescence intensity prior to adding compounds was defined as F0. The maximum fluores‐cence intensity induced by compounds was defined as Fmax.
Protein purification.
FreeStyle™ HEK293‐F cells expressing TRPA1‐FLAG (~ 4 × 10⁸) were lysed by a homogenizer in 30 mL buffer A (TBS containing 25 mM n‐dodecyl β‐D‐maltoside (DDM) (Sigma), 300 mM MgCl2, 10% glycerol, protease inhibitors, and 0.02% sodium azide). After centrifuging at 100,000 ×g for 30 min, the supernatant containing solubilized TRPA1‐FLAG was loaded onto 1 mL of an anti‐FLAG affinity gel (Sigma). After extensive wash with 6 mL buffer B (TBS containing 1 mM DDM, 300 mM MgCl2, 10% glycerol and 0.02% sodium azide), the bound TRPA1‐FLAG protein was eluted with buffer B containing 125 µg/ml FLAG peptide (Sigma‐Aldrich). The eluates were analyzed by SDS‐PAGE followed by silver staining.
The TRPA1‐FLAG‐containing fractions were pooled and loaded onto 0.5 mL of the wheat germ agglutinin (WGA)‐agarose (Seikagaku, Tokyo, Japan). After extensive wash with 1.5 mL buffer B, the bound TRPA1‐FLAG protein was eluted by 3 mL buffer B containing 100 mM GlcNAc. The eluate was monitored by SDS‐PAGE analysis. The TRPA1‐FLAG‐rich fractions were pooled, concentrated with a Microcon filter unit (YM‐100; Millipore), and further purified by Superdex 200 size exclusion chromatography (SEC) in a SMART System (GE Healthcare) using buffer B. The elution of proteins from the SEC was monitored by UV absorbance at 280 nm and SDS‐PAGE analysis.
References
(1) Kozai, D.; Kabasawa, Y.; Ebert, M.; Kiyonaka, S.; Firman; Otani, Y.; Numata, T.; Takahashi, N.; Mori, Y.; Ohwada, T. Mol. Pharmacol. 2014, 85 (1), 175‐185.
(2) Takahashi, N.; Kuwaki, T.; Kiyonaka, S.; Numata, T.; Kozai, D.; Mizuno, Y.; Yamamoto, S.; Naito, S.; Knevels, E.; Carmeliet, P.; Oga, T.; Kaneko, S.; Suga, S.; Nokami, T.; Yoshida, J.; Mori, Y. Nat. Chem. Biol. 2011, 7, 701‐711.

S3
Figure S1. Screening for TRPA1 agonists. (A) Dose‐response curves for Fura‐2 fluorescence ratio changes (ΔF340/F380) induced by 1‐acetoxy‐3‐chloroacetone (SI‐1) in TRPA1‐ or mock‐transfected HEK293 cells. Data points are mean ± s.e.m. (n = 23‐42). (B‐D) Fluo‐8 fluorescence changes in TRPA1‐transfected cells evoked by compounds in the chemical library at the concentrations of 100, 10, 1 nM. Fluorescence changes were normalized to the response evoked by 1 µM SI‐1. Molecules with values over 0.75 (red bar) were selected as hit molecules. Data points in D are mean ± s.e.m. (n = 3). (E) Chemical structures of structurally related hit molecules, JT010 (1), JT102 and JT105. (F) Shared structure of the hit molecules.
0
0.5
1
1.5
2
2.5
ΔF
340/
F38
0
[SI-1] (µM)
系列2
系列1-0.5
0
0.5
1
1.5
2
2.5
3
0 500 1000 1500Nor
mal
ized
fluo
resc
ence
cha
nges
Screen well num.
-0.5
0
0.5
1
1.5
2
0 50 100 150 200Nor
mal
ized
fluo
resc
ence
cha
nges
Screen well num.
-0.25
0
0.25
0.5
0.75
1
1.25
0 10 20 30 40Nor
mal
ized
fluo
resc
ence
cha
nges
Screen well num.
B
C D
1-acetoxy-3-chloroacetone (SI-1)
A
Mock
TRPA1
JT102 JT105
E
JT010 (1)
F
@100 nM
@10 nM @1 nM

S4
Figure S2. Dose‐dependent inhibitory effects of AP‐18 and HC‐030031 on Fura‐2 fluorescence ratio changes (ΔF340/F380) induced by 30 nM molecule 1 in TRPA1‐transfected HEK293 cells. The antagonists were added at the various concentrations to the cells prior to the activation of TRPA1 by molecule 1 (30 nM). The plots were fitted to a four parameter logistic model using Kalei‐daGraph. IC50 values of AP‐18 and HC‐030031 were calculated to be 9.1 and 10.3 µM, respectively. Data points are mean ± s.e.m. (n = 95‐121).

S5
Figure S3. Detection of biotinylated EGFP‐TRPA1 using anti‐TRPA1 antibody. EGFP‐TRPA1 transfected HEK293 cells were pre‐treated with molecule 1 (50 nM) or DMSO for 10 min. Subsequently, the cells were incubated with molecule 3 (500 nM) or DMSO for 10 min. Unreacted molecules were washed out and the biotinylated proteins were purified from the cells by avidin beads. The purified samples (Bound) and the cell lysate (Input) were analyzed by western blotting with a TRPA1 antibody or an EGFP antibody.

S6
Figure S6. AITC prevents the biotinylation of TRPA1 by molecule 3 at high concentrations. (A) A dose‐response curve for AITC‐induced Fluo‐8 fluorescence changes. Fluorescence changes were normalized to the response evoked by 100 µM AITC. The plots were fitted to a four parameter logistic model using an Image J software. The EC50 value was calculated to be 2 µM. The data points are mean ± s.e.m. (n = 5‐6). (B) EGFP‐TRPA1 transfected HEK293 cells were pretreated with AITC at the various concentrations for 10 min, and the cells were subsequently incubated with molecule 3 for 10 min. After extensive wash, the cells were lysed and biotinylated proteins were purified from the supernatants by avidin beads. The purified samples (Bound) and the supernatants (Input) were analyzed by western blot analysis with an EGFP antibody.
Figure S5. Pretreatments with molecule 2 had no impacts on the biotinylation of TRPA1 by molecule 3. EGFP‐TRPA1 transfected HEK293 cells were incubated with molecule 2 at the various concentrations or DMSO control for 10 min. The cells were subse‐quently incubated with 100 nM molecule 3. After extensive wash, the cells were lysed and biotinylated proteins were purified from the centrifuged supernatants by avidin beads. The purified samples (Bound) and the supernatants (Input) were analyzed by western blot analysis with an EGFP antibody.
Figure S4. Subsequent treatment with molecule 1 had no detectable impacts on the biotinylation of TRPA1 by molecule 3. EGFP‐TRPA1 transfected HEK293 cells were pretreated with 1st compounds for 10 min. After extensive wash by PBS, the cells were incubated with 2nd compounds for 10 min. Unreacted molecules were washed out and the biotinylated proteins were purified from the cells by avidin beads. The purified samples (Bound) and the cell lysate (Input) were analyzed by western blotting with an EGFP antibody. 50 nM molecule 1, 500 nM molecule 3, or DMSO control were used.

S7
Figure S8. TRPA1 C621S mutant has a low sensitivity to molecule 1. Dose‐response curves for molecule 1‐induced Fluo‐8 fluo‐rescence changes in TRPA1 wild type (WT)‐, C621S mutant‐ or mock‐transfected HEK293 cells. The data points are mean ± s.e.m. (n = 3).
-0.1
0
0.1
0.2
0.3
0.4
0.5
0.6
0.7
0.01 0.1 1 10 100
ΔF
max
/F0
[1] (nM)
系列1
系列2
系列3C621
Mock
WT
Figure S9. Analysis of purified FLAG‐TRPA1. (A) Purified FLAG‐TRPA1 was analyzed by silver staining or western blotting with an anti‐FLAG antibody. FLAG‐TRPA1 was purified with immunoaffinity chromatography followed by SEC. The purified FLAG‐TRPA1 was detected at ~150 kDa, as indicated by an arrow. (B) Blue native PAGE analysis of the purified FLAG‐TRPA1. The purified FLAG‐TRPA1 was detected at ~560 kDa, as indicated by an arrow.
Figure S7. Dose‐response curves for molecule 3‐induced Fluo‐8 fluorescence changes in TRPA1 wild type (WT)‐, C621S mutant‐ or mock‐transfected HEK293 cells. The data points are mean ± s.e.m. (n = 6‐20).
-0.1
0
0.1
0.2
0.3
0.4
0.5
0.6
0.7
0.8
0.9
0.001 0.01 0.1 1
ΔF
max
/F0
[3] (µM)
WT
Mock
C621S

S8
Figure S10. Visualization of negatively stained gold‐nanoparticle‐labeled molecule 3 and FLAG‐TRPA1 by electron microscopy. (A) FLAG‐TRPA1 was treated with molecule 3 (5 µM) for 1h. The sample was mixed with an anti‐FLAG affinity gel (Sigma). Unreacted molecule 3 was washed out with a wash buffer (TBS containing 1 mM DDM, 300 mM MgCl2, 0.02% sodium azide). Molecule 3‐treated FLAG‐TRPA1 was eluted with a wash buffer containing FLAG peptide. Eluate was analyzed by affinity/west‐ern blotting with streptavidin‐HPR (SA‐HRP) or FLAG antibodies. (B) FLAG‐TRPA1 was treated with/without molecule 3 under the same conditions as A. After extensive wash, streptavidin‐gold conjugate (SA‐gold) was added to the sample. Unbound SA‐gold was removed with the wash buffer, and FLAG‐TRPA1 was eluted with a wash buffer containing a FLAG peptide. Eluates were visualized by electron microscopy with negative staining.
Figure S11. Limited effects of DTT on the ability of molecule 3 to bind EGFP‐TRPA1. EGFP‐TRPA1 transfected HEK293 cells were incubated with molecule 3 (100 nM) for 10 min in the presence of DTT at the various concentrations. After extensive wash, the cells were lysed, and the biotinylated proteins were purified by avidin beads. The samples were analyzed by western blot analysis with an anti‐EGFP antibody.

S9
Chemical synthesis
General. Unless otherwise noted all solvents and chemicals for chemical synthesis were purchased used without further purification. 2‐Bromo‐4’‐methoxyacetophenone was purchased from Sigma‐Aldrich Co. LLC. (St. Louis, MO, USA). Thiou‐rea, 3‐methoxypropionic acid, lithium aluminium hydride, chloroacetyl chloride, acetic anhydride, 1,6‐dibromohexane and boron tribromide (1.0 M in dicloromethane) were purchased from Wako Pure Chemical Industries Ltd. (Osaka, Japan). O‐(6‐Chloro‐1H‐benzotriazol‐1‐yl)‐N,N,N’,N’‐tetramethyluronium hexafluorophosphate (HCTU) and di‐tert‐butyl dicar‐bonate (Boc2O) were purchased from Watanabe Chemical Industries, Ltd. (Hiroshima, Japan). Biotin‐NHS were purchased from Molecular Biosciences, Inc. (Colorado, USA). Amino‐functionalized silica gel NH‐DM1020 was purchased from Fuji Silysia chemical Ltd. (Aichi, Japan). All other solvents and chemicals for chemical synthesis were purchased from Tokyo Chemical Industry Co., Ltd. (Tokyo, Japan) or Nacalai Tesque, Inc. (Kyoto, Japan). Some synthetic compounds were purified using a flash column system Shoko Scientific Purif‐α2. High performance liquid chromatography (HPLC) was performed with combined system of Shimadzu DGU‐20A3 (degasser), LC‐20AD (pump ×2), CTO‐20AC (column oven), SPD‐20A (de‐tector) and CBM‐20Alite (controller). HPLC conditions were as follows: Shimadzu Shim‐pack XR‐ODS column (2.2 µm, 3.0 × 50 mm); solvent gradient, A, 0.1% trifluoroacetic acid (TFA) in H2O; B, acetonitrile with gradient (0–3.5 min: B, 10–100%; 3.5–5 min: B, 100% at 40 °C); flow rate, 0.7 mL/min; detector, 254 nm. Low‐resolution mass spectra were obtained using a Shimadzu LCMS‐2010EV in ESI mode. High‐resolution mass spectra (HRMS) were obtained using a JEOL MStation JMS‐700 in FAB mode. Solution 1H‐NMR spectra were collected by JEOL JNM‐ECP 300 MHz. Chemical shifts were reported in δ (ppm) relative to tetramethylsilane.
Scheme S1. Chemical synthesis of 1 and 2
Conditions and reagents: (a) thiourea, EtOH, reflux, 2 h, quant. (b) 3‐methoxypropanoic acid, DIPEA, HCTU, DMF, rt, 96 h, 59% (c) LiAlH4, THF, 0 °C, 6 h, 97% (d) chloroacetyl chloride, TEA, AcOEt, 0 °C, 4 h, 43% (e) acetic anhydride, pyridine, rt, 18 h, 75%
4‐(4‐Methoxyphenyl)thiazol‐2‐amine (4)
To a solution of 2‐bromo‐4’‐methoxyacetophenone (2.5 g, 10.9 mmol) in ethanol (EtOH) (20 mL) was added thiourea (0.86 g, 11.3 mmol) and the mixture was refluxed for 2 h. After the solvent was removed, the resulting white precipitate was suspended and washed in water/saturated aqueous NaHCO3 (30/70, 10 mL) for 1 h. The precipitate was collected by filtration, and azeotroped with toluene in vacuo to give 4 (2.55 g, 10.9 mmol, quant.) as a white powder, which was used without further purification. 1H‐NMR (300 MHz, DMSO‐d6): δ 8.11 (2H, br s), 7.68 (2H, d, J = 9.1 Hz), 7.01 (2H, d, J = 9.1 Hz), 6.98 (1H, s), 3.79 (3H, s); ESI‐MS m/z: 207 [M+H]+.
3‐Methoxy‐N‐(4‐(4‐methoxyphenyl)thiazol‐2‐yl)propanamide (5)
To a solution of 4 (1.76 g, 8.53 mmol), 3‐methoxypropionic acid (1.23 mL, 12.8 mmol) and N,N‐diisopropylethylamine (DIPEA) (2.23 mL, 12.8 mmol) in N,N‐dimethylformamide (DMF) (30 mL) was added HCTU (5.29 g, 12.8 mmol) and the mixture was stirred at room temperature for 96 h. The reaction mixture was diluted with ethyl acetate (AcOEt) and washed with saturated aqueous NaHCO3, hydrochloric acid (0.5 M), water and brine. The organic layer was dried over Na2SO4 and concentrated in vacuo. The resulting precipitate was suspended and washed in AcOEt/hexane (50/50, 50 mL) for 1 h. The precipitate was collected by filtration to give 5 (1.46 g, 5.00 mmol, 59%) as a white powder, which was used without further purification. 1H‐NMR (300 MHz, DMSO‐d6): δ 12.23 (1H, s), 7.82 (2H, d, J = 8.6 Hz), 7.44 (1H, s), 6.99 (2H, d, J = 8.6 Hz), 3.79 (3H, s), 3.64 (2H, t, J = 6.0 Hz), 3.24 (3H, s), 2.69 (2H, t, J = 6.0 Hz); ESI‐MS m/z: 293 [M+H]+.

S10
4‐(4‐Methoxyphenyl)‐N‐(3‐methoxypropyl)thiazol‐2‐amine (6)
To a suspension of lithium aluminium hydride (350 mg, 9.22 mmol) in anhydrous tetrahydrofuran (THF) (5 mL) was added a solution of 5 (703 mg, 2.40 mmol) in anhydrous THF (5 mL) dropwise over 30 min and the mixture was stirred at 0 °C for 6 h under an argon atmosphere. To the reaction mixture were added water (0.35 mL), aqueous NaOH (15%w/v, 0.35 mL) and extra water (1.05 mL) in order. The resulting mixture was filtered through a pad of celite with AcOEt. The filtrate was washed with saturated aqueous NaHCO3 twice, saturated aqueous NH4Cl and brine. The organic layer was dried over Na2SO4 and concentrated in vacuo to give 6 (650 mg, 2.34 mmol, 97%) as a yellow oil, which was used without further
purification. 1H‐NMR (300 MHz, CDCl3): δ7.73 (2H, d, J = 8.8 Hz), 6.90 (2H, d, J = 8.8 Hz), 6.55 (1H, s), 5.57‐5.48 (1H, m), 3.83 (3H, s), 3.53 (2H, t, J = 5.7 Hz), 3.41 (2H, m), 3.36 (3H, s), 1.94 (2H, m); ESI‐MS m/z: 279 [M+H]+.
2‐Chloro‐N‐(4‐(4‐methoxyphenyl)thiazol‐2‐yl)‐N‐(3‐methoxypropyl)acetamide (1)
To a solution of 6 (227 mg, 0.815 mmol) and triethylamine (TEA) (115 µL, 0.818 mmol) in AcOEt (5 mL) was added chlo‐roacetyl chloride (168.3 µL, 1.06 mmol) dropwise over 30 min at 0 °C and the mixture was stirred at 0 °C for 4 h. The reaction mixture was diluted with AcOEt and washed with saturated aqueous NaHCO3, saturated aqueous NH4Cl and brine. The organic layer was concentrated in vacuo, and the resulting residue was purified by silica gel column chromatography to give
1 (124.44 mg, 0.351 mmol, 43%) as a pale yellow crystal. 1H‐NMR (300 MHz, CDCl3): δ7.81 (2H, d, J = 8.6 Hz), 7.10 (1H, s), 6.95 (2H, d, J = 8.6 Hz), 4.53 (2H, s), 4.45‐4.29 (2H, m), 3.85 (3H, s), 3.44 (2H, t, J = 5.5 Hz), 3.36 (3H, s), 2.26‐2.12 (2H, m); ESI‐MS m/z: 355 [M+H]+; FAB‐MS calcd for C16H19ClN2O3S [M+]: 354.0805; found: 354.0804.
N‐(4‐(4‐Methoxyphenyl)thiazol‐2‐yl)‐N‐(3‐methoxypropyl)acetamide (2)
To a solution of 6 (80 mg, 0.28 mmol) in pyridine (2 mL) was added acetic anhydride (32 µL, 0.34 mmol) and the mixture was stirred at room temperature for 18 h. The reaction mixture was diluted with AcOEt and washed with saturated aqueous NaHCO3 and brine. The organic layer was dried over Na2SO4 and concentrated in vacuo. The resulting residue was purified by amino‐functionalized silica gel column chromatography (10% AcOEt in hexane) to give 2 (67.2 mg, 0.210 mmol, 75%) as
a white powder. 1H‐NMR (300 MHz, CDCl3): δ7.82 (2H, d, J = 8.4 Hz), 7.04 (1H, s), 6.94 (2H, d, J = 8.4 Hz), 4.36 (2H, t, J = 6.6 Hz), 3.85 (3H, s), 3.48 (2H, t, J = 5.7 Hz), 3.36 (3H, s), 2.46 (3H, s), 2.15 (2H, m); ESI‐MS m/z: 321 [M+H]+; FAB‐MS calcd for C16H20N2O3S [M+]: 320.1195; found: 320.1196.

S11
Scheme S2. Chemical synthesis of 3
Conditions and reagents: (a) BBr3, CH2Cl2, 0 °C‐rt, 48 h, 61% (b) 1,6‐dibromohexane, K2CO3, acetone, reflux, 20 h, 65% (c) NaN3, DMSO, rt, 12 h, 34% (d) 3‐methoxypropionic acid, HCTU, DIPEA, DMF, rt, 14 h, 87% (e) LiAlH4, THF, 0 °C, 2 h, 83% (f) Boc2O, MeOH, rt, 1 h, 73% (g) Chloroacetyl chloride, TEA, AcOEt, 0 °C, 6 h, 40% (h) (i) TFA, CHCl3, rt, 30 min; (ii) Biotin‐NHS, TEA, DMSO, rt, 30 min, 72%
4-(2-Aminothiazol-4-yl)phenol (7)
To a solution of 4 (4.5 g, 21.8 mmol) in dichloromethane (116 mL) was added a solution of boron tribromide in dichloro‐methane (1.0 M, 64 mL) dropwise over 30 min at 0 °C and the mixture was stirred at room temperature for 48 h under an argon atmosphere. After dilution with AcOEt, the resulting mixture was neutralized with saturated aqueous NaHCO3 and washed with brine. The organic layer was dried over Na2SO4 and concentrated in vacuo. The resulting precipitate was col‐lected by filtration to give 7 (2.57 g, 13.4 mmol, 61%) as a brown powder, which was used without further purification. 1H‐
NMR (300 MHz, DMSO‐d6): δ9.44 (1H, s), 7.59 (2H, d, J = 8.8 Hz), 6.95 (2H, s), 6.76‐6.70 (3H, m).
4‐(4‐((6‐Bromohexyl)oxy)phenyl)thiazol‐2‐amine (8)
To a mixture of 7 (2.57 g, 13.4 mmol) and potassium carbonate (2 g, 14.5 mmol) in acetone (200 mL) was added 1,6‐

S12
dibromohexane (4.29 mL, 28.2 mmol) and the mixture was refluxed for 20 h. The reaction mixture was diluted with water and the aqueous layer was extracted with AcOEt four times. The combined organic layers were washed with brine, dried over Na2SO4 and concentrated in vacuo. The resulting residue was purified by silica gel column chromatography (33% Ac‐OEt in hexane) to give 8 (3.1 g, 8.73 mmol, 65%) as a white powder. 1H‐NMR (300 MHz, DMSO‐d6): δ 7.70 (2H, d, J = 8.8 Hz), 6.98 (2H, s), 6.90 (2H, d, J = 8.8 Hz), 6.81 (1H, s), 3.97 (2H, t, J = 6.3 Hz), 3.54 (2H, t, J = 6.6 Hz), 1.88‐1.77 (2H, m), 1.76‐1.67 (2H, m) 1.49‐1.40 (4H, m).
4‐(4‐((6‐Azidohexyl)oxy)phenyl)thiazol‐2‐amine (9)
To a mixture of 8 (3.1 g, 8.7 mmol) in DMSO (80 mL) was added sodium azide (851 mg, 13.1 mmol) and the mixture was stirred at room temperature for 12 h under an argon atmosphere. The reaction mixture was diluted with water and the aqueous layer was extracted with ether twice. The combined organic layers were washed with water, brine, dried over Na2SO4 and concentrated in vacuo. The resulting precipitate was collected by filtration to give 9 (951.2 mg, 3.0 mmol, 34%), which was used without further purification. 1H‐NMR (300 MHz, DMSO‐d6): δ 7.70 (2H, d, J = 8.8 Hz), 6.98 (2H, s), 6.90 (2H, d, J = 8.8 Hz), 6.81 (1H, s), 3.97 (2H, t, J = 6.5 Hz), 3.33 (2H, t, J = 6.9 Hz), 1.77‐1.66 (2H, m), 1.62‐1.51 (2H, m), 1.50‐1.33 (4H, m); ESI‐MS m/z: 318 [M+H]+.
N‐(4‐(4‐((6‐Azidohexyl)oxy)phenyl)thiazol‐2‐yl)‐3‐methoxypropanamide (10)
To a mixture of 9 (900 mg, 2.84 mmol), 3‐methoxypropionic acid (408 µL, 4.3 mmol) and DIPEA (750 µL, 4.3 mmol) in DMF (10 mL) was added HCTU (1.76 g, 4.3 mmol) and the mixture was stirred at room temperature for 14 h. The reaction mixture was diluted with AcOEt and washed with saturated aqueous NaHCO3, water and brine. The organic layer was dried over Na2SO4 and concentrated in vacuo. The resulting precipitate was collected to give 10 (1.00 g, 2.47 mmol, 87%), which was used without further purification. 1H‐NMR (300 MHz, DMSO‐d6): δ 12.22 (1H, s), 7.80 (2H, d, J = 8.8 Hz), 7.43 (1H, s), 6.97 (2H, d, J = 8.8 Hz), 3.99 (2H, t, J = 6.5 Hz), 3.64 (2H, t, J = 6.1 Hz), 3.37‐3.30 (2H, m), 3.24 (3H, s), 2.69 (2H, t, J = 6.2 Hz), 1.79‐1.66 (2H, m), 1.62‐1.51 (2H, m), 1.50‐1.34 (4H, m); ESI‐MS m/z: 404 [M+H]+.
4‐(4‐((6‐Aminohexyl)oxy)phenyl)‐N‐(3‐methoxypropyl)thiazol‐2‐amine (11)
To a suspension of lithium aluminium hydride (468.8 mg, 12.4 mmol) in anhydrous THF (5 mL) was added a solution of 10 (1 g, 2.47 mmol) in anhydrous THF (5 mL) dropwise over 30 min and the mixture was stirred at 0 °C for 1 h under an argon atmosphere. To the reaction mixture were added water (0.47 mL), aqueous NaOH (15%w/v, 0.47 mL) and extra water (1.4 mL) in order. The resulting mixture was filtered through a pad of celite with AcOEt. The filtrate was washed with saturated aqueous NaHCO3 twice, saturated aqueous NH4Cl and brine. The organic layer was dried over Na2SO4 and con‐centrated in vacuo to give 11 (740.6, 2.04 mmol, 83%), which was used without further purification. 1H‐NMR (300 MHz, DMSO‐d6): δ 7.72 (2H, d, J = 8.8 Hz), 7.63‐7.54 (1H, m), 6.91 (2H, d, J = 8.8 Hz), 6.85 (1H, s), 3.96 (2H, t, J = 6.5 Hz), 3.41 (2H, t, J = 6.3 Hz), 3.33‐3.25 (2H, m), 3.24 (3H, s), 3.20‐2.80 (2H, br s), 2.57‐2.50 (2H, m), 1.87‐1.76 (2H, m), 1.76‐1.65 (2H, m), 1.47‐1.30 (6H, m); ESI‐MS m/z: 364 [M+H]+.
tert‐Butyl (6‐(4‐(2‐((3‐methoxypropyl)amino)thiazol‐4‐yl)phenoxy)hexyl)carbamate (12)
To a solution of 11 (717 mg, 1.97 mmol) in methanol (MeOH) (1.5 mL) was added Boc2O (480 mg, 2.2 mmol) in MeOH (0.6 mL) dropwise and the mixture was stirred at room temperature for 1 h. The reaction mixture was concentrated in vacuo and the resulting residue was purified by silica gel column chromatography to give 12 (669.6 mg, 1.44 mmol, 73%) as a yellow oil. 1H‐NMR (300 MHz, CDCl3): δ 7.71 (2H, d, J = 8.8 Hz), 6.88 (2H, d, J = 8.8 Hz), 6.54 (1H, s), 5.78 (1H, br s), 4.51 (1H, br s), 3.96 (2H, t, J = 6.6 Hz), 3.53 (2H, t, J = 5.8 Hz), 3.44‐3.38 (2H, m), 3.36 (3H, s), 3.17‐3.06 (2H, m), 1.99‐1.89 (2H, m), 1.84‐1.73 (2H, m), 1.56‐1.32 (15H, m); ESI‐MS m/z: 464 [M+H]+.
tert‐Butyl (6‐(4‐(2‐(2‐chloro‐N‐(3‐methoxypropyl)acetamido)thiazol‐4‐yl)phenoxy)hexyl)carbamate (13)
To a solution of 12 (95.4 mg, 0.206 mmol) and TEA (34.7 µL, 0.247 mmol) was added chloroacetyl chloride (17.8 µL, 0.222 mmol) dropwise and stirred at 0 °C for 6 h. The reaction mixture was diluted with AcOEt and washed with saturated aque‐ous NaHCO3 and brine. The organic layer was dried over Na2SO4 and concentrated in vacuo. The resulting residue was purified by silica gel column chromatography (20% AcOEt in hexane) to give 13 (44.6 mg, 0.0826 mmol, 40%) as a yellow oil. 1H‐NMR (300 MHz, CDCl3): δ 7.79 (2H, d, J = 8.9 Hz), 7.09 (1H, s), 6.92 (2H, d, J = 8.9 Hz), 4.57‐4.46 (3H, m), 4.45‐4.32 (2H, m), 3.99 (2H, t, J = 6.5 Hz), 3.44 (2H, t, J = 5.5 Hz), 3.36 (3H, s), 3.18‐3.07 (2H, m), 2.25‐2.14 (2H, m), 1.86‐1.75 (2H, m), 1.58‐1.38 (15H, m).
N‐(6‐(4‐(2‐(2‐Chloro‐N‐(3‐methoxypropyl)acetamido)thiazol‐4‐yl)phenoxy)hexyl)‐5‐((3aS,4S,6aR)‐2‐oxohexa‐hydro‐1H‐thieno[3,4‐d]imidazol‐4‐yl)pentanamide (3)
To a solution of 13 (15.0 mg, 27.8 µmol) in chloroform (750 µL) was added TFA (250 µL) and the mixture was stirred at room temperature for 30 min. The reaction mixture was concentrated in vacuo. To a solution of the resulting oil in DMSO

S13
(500 µL) were added a solution of biotin‐NHS (17.4 mg, 51 µmol) and TEA (19.1 µL, 136 µmol) in DMSO (500 µL) and the mixture was stirred at room temperature for 30 min. The reaction mixture was lyophilized and the resulting residue was purified by PTLC (12.5% MeOH in CHCl3) to give 3 (13.3 mg, 20.0 µmol, 72%) as a white solid. 1H‐NMR (300 MHz, DMSO‐d6): δ 7.85 (2H, d, J = 7.4 Hz), 7.76 (1H, t, J = 5.1 Hz), 7.58 (1H, s), 6.99 (2H, d, J = 7.4 Hz), 6.43 (1H, s), 6.36 (1H, s), 4.87 (2H, s), 4.33‐4.20 (3H, m), 4.17‐4.08 (1H, m), 3.99 (2H, t, J =6.3 Hz), 3.44 (2H, t, J = 5.8 Hz), 3.27 (3H, s), 3.13‐2.98 (3H, m), 2.81 (1H, dd, J = 12.5, 4.7 Hz), 2.57 (1H, d, J = 12.5 Hz), 2.12‐2.00 (4H, m), 1.77‐1.67 (2H, m), 1.54‐1.22 (12H, m); ESI‐MS m/z: 666 [M+H]+; FAB‐MS calcd for [C31H44ClN5O5S2 + H]+: 666.2551; found: 666.2552.

S14
1H-NMR spectrum of 1 in CDCl3
1H-NMR spectrum of 2 in CDCl3.
PPM
11 10 9 8 7 6 5 4 3 2 1 0
DFILE Takaya121011-S1-8(10).alsCOMNT Single Pulse ExperimentDATIM 11-10-2012 21:01:56OBNUC 1HEXMOD single_pulse.expOBFRQ 300.53 MHzOBSET 1.15 KHzOBFIN 8.57 HzPOINT 16384FREQU 6013.23 HzSCANS 8ACQTM 2.7247 secPD 2.0000 secPW1 6.75 usecIRNUCCTEMP 23.3 cSLVNT CDCL3EXREF 0.00 ppmBF 0.16 HzRGAIN 18
1H-NMR (CDCl3) δ: 7.81 (2.0H, d, J = 8.62 Hz), 7.10 (0.9H, s), 6.95 (2.1H, d, J = 8.62 Hz), 4.53 (1.9H, s), 4.45-4.29 (2.1H, m), 3.85 (3.2H, s), 3.44 (2.0H, t, J = 5.51 Hz), 3.36 (2.7H, s), 2.26-2.12 (2.0H, m).
G:\NMR\Takaya\Takaya121011-S1-8(10).als
1.9
7
0.93
2.0
7
1.91 2.06
3.2
0
2.0
02.7
2
2.00
7.8
220
7.7
927
7.2
615
7.0
978
6.9
598
6.9
317
4.5
345
4.3
733
3.8
481
3.4
549
3.4
366
3.4
182
3.3
596
2.1
860
PPM
11 10 9 8 7 6 5 4 3 2 1 0
DFILE Takaya121016-S1-9(10H).alsCOMNT Single Pulse ExperimentDATIM 16-10-2012 16:55:54OBNUC 1HEXMOD single_pulse.expOBFRQ 300.53 MHzOBSET 1.15 KHzOBFIN 8.57 HzPOINT 16384FREQU 6013.23 HzSCANS 8ACQTM 2.7247 secPD 2.0000 secPW1 6.75 usecIRNUCCTEMP 23.1 cSLVNT CDCL3EXREF 0.00 ppmBF 0.16 HzRGAIN 25
1H-NMR (CDCl3) δ: 7.82 (2.0H, d, J = 8.44 Hz), 7.04 (0.9H, s), 6.94 (2.0H, d, J = 8.44 Hz), 4.36 (1.9H, t, J = 6.61 Hz), 3.85 (3.1H, s), 3.48 (2.0H, t, J = 5.69 Hz), 3.36 (3.0H, s), 2.46 (3.1H, s), 2.15 (2.1H, tt, J = 6.61, 5.69 Hz).
G:\NMR\Takaya\Takaya121016-S1-9(10H).als
2.00
0.93
2.04
1.92
3.05
2.05
3.0
0
3.0
7
2.06
7.833
07.
804
9
7.036
86.
956
26.
928
1
4.378
14.
356
24.
334
2
3.848
13.
496
43.
478
13.
458
53.
363
3
2.458
42.
194
62.
173
82.
150
62.
129
82.
111
5
N
N
O
S
O
O
2

S15
1H-NMR spectrum of 3 in DMSO-d6.
1H-NMR spectrum of 4 in DMSO-d6
PPM
10 8 6 4 2 0
DFILE Takaya-JT010-B-256.alsCOMNT Single Pulse ExperimentDATIM 18-08-2015 16:34:34OBNUC 1HEXMOD single_pulse.expOBFRQ 300.53 MHzOBSET 1.15 KHzOBFIN 8.57 HzPOINT 16384FREQU 4508.57 HzSCANS 256ACQTM 3.6340 secPD 2.0000 secPW1 7.50 usecIRNUCCTEMP 21.4 cSLVNT DMSOEXREF 0.00 ppmBF 0.16 HzRGAIN 19
1H-NMR (DMSO-d6) δ: 7.85 (2.0H, d, J = 7.43 Hz), 7.76 (1.0H, t, J = 5.09 Hz), 7.58 (0.8H, s), 6.99 (2.0H, d, J = 7.43 Hz), 6.43 (1.0H, s), 6.36 (0.9H, s), 4.87 (1.7H, s), 4.33-4.20 (2.7H, m), 4.17-4.08 (1.2H, m), 3.99 (2.0H, t, J = 6.33 Hz), 3.44 (2.3H, t, J = 5.78 Hz), 3.27 (3.2H, s), 3.13-2.98 (3.1H, m), 2.81 (1.1H, dd, J = 12.52, 4.68 Hz), 2.57 (1.2H, d, J = 12.52 Hz), 2.12-2.00 (3.8H, m), 1.77-1.67 (2.1H, m), 1.54-1.22 (12.3H, m).
G:\NMR\JT010-B\Takaya-JT010-B-256.als
2.00
0.98
0.82 2.
01
0.97
0.94
1.67 2.68
1.22 1.99
2.33 3.20
3.12
1.07
1.24
3.8
4
2.07
12.2
6
7.867
37.
842
67.
776
67.
760
27.
742
87.
575
2
7.000
26.
975
46.
429
76.
362
04.
868
54.
311
84.
289
84.
270
64.
136
04.
121
44.
014
23.
993
23.
972
13.
463
93.
444
73.
425
53.
408
13.
398
93.
298
23.
268
03.
112
33.
068
43.
046
43.
026
22.
837
62.
822
02.
795
52.
779
92.
589
52.
548
32.
068
52.
046
52.
022
71.
721
41.
698
51.
498
91.
473
31.
440
31.
418
31.
396
41.
318
51.
238
0
PPM
11 10 9 8 7 6 5 4 3 2 1 0
DFILE Takaya121213-S11-1.alsCOMNT Single Pulse ExperimentDATIM 06-12-2012 12:46:09OBNUC 1HEXMOD single_pulse.expOBFRQ 300.53 MHzOBSET 1.15 KHzOBFIN 8.57 HzPOINT 16384FREQU 4508.57 HzSCANS 64ACQTM 3.6340 secPD 2.0000 secPW1 6.75 usecIRNUCCTEMP 23.4 cSLVNT DMSOEXREF 0.00 ppmBF 0.16 HzRGAIN 25
1H-NMR (DMSO-d6) δ: 8.11 (0.8H, br s), 7.68 (2.0H, d, J = 9.08 Hz), 7.01 (1.9H, d, J = 9.08 Hz), 6.98 (1.1H, s), 3.79 (3.0H, s).
G:\NMR\Takaya\Takaya121213-S11-1.als
0.80
2.0
0
1.92
1.0
8
3.04
8.1
145
7.6
933
7.6
631
7.0
221
6.9
919
6.9
809
3.7
926

S16
1H-NMR spectrum of 5 in DMSO-d6
1H-NMR spectrum of 6 in CDCl3
PPM
13 12 11 10 9 8 7 6 5 4 3 2 1 0
DFILE Takaya121009-S1-5.alsCOMNT Single Pulse ExperimentDATIM 09-10-2012 14:10:53OBNUC 1HEXMOD single_pulse.expOBFRQ 300.53 MHzOBSET 1.15 KHzOBFIN 8.57 HzPOINT 16384FREQU 6013.23 HzSCANS 8ACQTM 2.7247 secPD 4.0000 secPW1 6.75 usecIRNUCCTEMP 23.0 cSLVNT DMSOEXREF 0.00 ppmBF 0.16 HzRGAIN 26
1H-NMR (DMSO-d6) δ: 7.82 (2.0H, d, J = 8.62 Hz), 7.44 (1.0H, s), 6.99 (2.0H, d, J = 8.62 Hz), 3.79 (3.1H, s), 3.64 (2.0H, t, J = 6.06 Hz), 3.24 (3.0H, s), 2.69 (2.0H, t, J = 6.06 Hz).
G:\NMR\Takaya\Takaya121009-S1-5.als
0.91
1.9
7
0.99
2.02
3.07
2.00
3.00
2.03
12.2
307
7.8
355
7.8
062
7.4
398
7.0
014
6.9
733
3.7
871
3.6
576
3.6
381
3.6
173
3.2
375
2.7
087
2.6
892
2.6
684
PPM
11 10 9 8 7 6 5 4 3 2 1 0
DFILE Takaya121009-S1-6.alsCOMNT Single Pulse ExperimentDATIM 09-10-2012 21:09:28OBNUC 1HEXMOD single_pulse.expOBFRQ 300.53 MHzOBSET 1.15 KHzOBFIN 8.57 HzPOINT 16384FREQU 6013.23 HzSCANS 8ACQTM 2.7247 secPD 2.0000 secPW1 6.75 usecIRNUCCTEMP 23.2 cSLVNT CDCL3EXREF 0.00 ppmBF 0.16 HzRGAIN 21
1H-NMR (CDCl3) δ: 7.73 (2.0H, d, J = 8.81 Hz), 6.90 (2.1H, d, J = 8.81 Hz), 6.55 (0.9H, s), 5.57-5.48 (0.9H, m), 3.83 (3.3H, s), 3.53 (2.0H, t, J = 5.69 Hz), 3.41 (2.1H, td, J = 6.41, 5.49 Hz), 3.36 (2.8H, s), 1.94 (2.1H, tt, J = 6.41, 5.69 Hz).
G:\NMR\Takaya\Takaya121009-S1-6.als
2.00
2.07
0.9
2
0.88
3.29
2.00
2.10 2.83
2.05
7.7
427
7.7
133
6.9
159
6.8
866
6.5
519
5.5
249
3.8
286
3.5
514
3.5
330
3.5
135
3.4
451
3.4
244
3.4
048
3.3
841
3.3
645
1.9
808
1.9
601
1.9
405
1.9
210
1.9
002
12.23 (1H, s)
HN
N
O
S
O
6

S17
1H-NMR spectrum of 7 in DMSO-d6
1H-NMR spectrum of 8 in DMSO-d6
PPM
11 10 9 8 7 6 5 4 3 2 1 0
DFILE Takaya121212-S11-2.alsCOMNT Single Pulse ExperimentDATIM 05-12-2012 10:34:36OBNUC 1HEXMOD single_pulse.expOBFRQ 300.53 MHzOBSET 1.15 KHzOBFIN 8.57 HzPOINT 16384FREQU 4508.57 HzSCANS 64ACQTM 3.6340 secPD 2.0000 secPW1 6.75 usecIRNUCCTEMP 23.7 cSLVNT DMSOEXREF 0.00 ppmBF 0.16 HzRGAIN 25
1H-NMR (DMSO-d6) δ: 9.44 (1.0H, s), 7.59 (2.0H, d, J = 8.81 Hz), 6.95 (2.0H, s), 6.76-6.70 (3.1H, m).
G:\NMR\Takaya\Takaya121212-S11-2.als
1.00
2.0
3
1.98
3.06
9.4
395
7.6
082
7.5
789
6.9
471
6.7
456
6.7
163
PPM
10 8 6 4 2 0
DFILE Takaya121213-S11-3.alsCOMNT Single Pulse ExperimentDATIM 06-12-2012 12:34:21OBNUC 1HEXMOD single_pulse.expOBFRQ 300.53 MHzOBSET 1.15 KHzOBFIN 8.57 HzPOINT 16384FREQU 4508.57 HzSCANS 64ACQTM 3.6340 secPD 2.0000 secPW1 6.75 usecIRNUCCTEMP 23.2 cSLVNT DMSOEXREF 0.00 ppmBF 0.16 HzRGAIN 26
1H-NMR (DMSO-d6) δ: 7.70 (2.0H, d, J = 8.81 Hz), 6.98 (1.9H, s), 6.90 (2.1H, d, J = 8.81 Hz), 6.81 (1.1H, s), 3.97 (2.0H, t, J = 6.33 Hz), 3.54 (2.1H, t, J = 6.60 Hz), 1.88-1.77 (2.0H, m), 1.76-1.67 (2.1H, m), 1.49-1.40 (4.1H, m).
G:\NMR\Takaya\Takaya121213-S11-3.als
2.00
1.9
22.
13
1.09
1.98
2.05
2.02
2.06
4.08
7.7
116
7.6
823
6.9
828
6.9
168
6.8
875
6.8
125
3.9
913
3.9
703
3.9
492
3.5
665
3.5
445
3.5
225
1.8
515
1.8
276
1.8
057
1.7
388
1.7
178
1.6
967
1.4
678
1.4
559
1.4
440
1.4
330
1.4
202

S18
1H-NMR spectrum of 9 in DMSO-d6
1H-NMR spectrum of 10 in DMSO-d6
PPM
11 10 9 8 7 6 5 4 3 2 1 0
DFILE Takaya121214-S11-4.alsCOMNT Single Pulse ExperimentDATIM 07-12-2012 03:26:53OBNUC 1HEXMOD single_pulse.expOBFRQ 300.53 MHzOBSET 1.15 KHzOBFIN 8.57 HzPOINT 16384FREQU 4508.57 HzSCANS 8ACQTM 3.6340 secPD 2.0000 secPW1 6.75 usecIRNUCCTEMP 23.1 cSLVNT DMSOEXREF 0.00 ppmBF 0.16 HzRGAIN 24
1H-NMR (DMSO-d6) δ: 7.70 (2.0H, d, J = 8.81 Hz), 6.98 (1.9H, s), 6.90 (2.0H, d, J = 8.81 Hz), 6.81 (1.0H, s), 3.97 (1.9H, t, J = 6.47 Hz), 3.33 (2.0H, t, J = 6.88 Hz), 1.77-1.66 (1.9H, m), 1.62-1.51 (2.0H, m), 1.50-1.33 (4.0H, m).
G:\NMR\Takaya\Takaya121214-S11-4.als
2.00
1.8
9 2.04
0.99
1.93
1.9
6 1.91
1.97
4.05
7.711
67.
682
3
6.983
76.
916
86.
887
56.
812
5
3.991
33.
970
33.
948
33.
357
73.
334
83.
312
82.
513
52.
508
02.
501
62.
495
22.
489
71.
742
51.
719
61.
694
91.
610
61.
586
81.
563
01.
540
11.
517
21.
411
91.
400
01.
379
91.
355
2
0.011
00.
000
0-0
.011
0
PPM
12 11 10 9 8 7 6 5 4 3 2 1 0
DFILE Takaya121220-S11-5.alsCOMNT Single Pulse ExperimentDATIM 13-12-2012 09:40:09OBNUC 1HEXMOD single_pulse.expOBFRQ 300.53 MHzOBSET 1.15 KHzOBFIN 8.57 HzPOINT 16384FREQU 4508.57 HzSCANS 8ACQTM 3.6340 secPD 2.0000 secPW1 6.75 usecIRNUCCTEMP 23.5 cSLVNT DMSOEXREF 0.00 ppmBF 0.16 HzRGAIN 23
1H-NMR (DMSO-d6) δ: 12.22 (0.7H, s), 7.80 (2.0H, d, J = 8.81 Hz), 7.43 (1.1H, s), 6.97 (2.0H, d, J = 8.81 Hz), 3.99 (1.9H, t, J = 6.47 Hz), 3.64 (2.0H, t, J = 6.05 Hz), 3.37-3.30 (2.0H, m), 3.24 (2.9H, s), 2.69 (2.0H, t, J = 6.19 Hz), 1.79-1.66 (2.0H, m), 1.62-1.51 (2.0H, m), 1.50-1.34 (3.9H, m).
G:\NMR\Takaya\Takaya121220-S11-5.als
0.71
2.00
1.05
2.01
1.95
1.9
62.
02
2.93
2.01
2.00
2.02
3.93
12.2
176
7.8
151
7.7
858
7.4
269
6.9
855
6.9
562
4.0
151
3.9
941
3.9
721
3.6
571
3.6
370
3.6
168
3.3
595
3.3
366
3.2
368
2.7
085
2.6
893
2.6
673
1.7
535
1.7
297
1.7
068
1.6
848
1.6
125
1.5
896
1.5
658
1.5
429
1.5
209
1.4
165
1.4
055
1.3
845

S19
1H-NMR spectrum of 11 in DMSO-d6
1H-NMR spectrum of 12 in CDCl3
PPM
11 10 9 8 7 6 5 4 3 2 1 0
DFILE Takaya121221-S11-6.alsCOMNT Single Pulse ExperimentDATIM 14-12-2012 05:11:53OBNUC 1HEXMOD single_pulse.expOBFRQ 300.53 MHzOBSET 1.15 KHzOBFIN 8.57 HzPOINT 16384FREQU 4508.57 HzSCANS 8ACQTM 3.6340 secPD 2.0000 secPW1 6.75 usecIRNUCCTEMP 23.2 cSLVNT DMSOEXREF 0.00 ppmBF 0.16 HzRGAIN 20
1H-NMR (DMSO-d6) δ: 7.72 (1.8H, d, J = 8.81 Hz), 7.63-7.54 (0.8H, m), 6.91 (1.8H, d, J = 8.81 Hz), 6.85 (0.8H, s), 3.96 (2.0H, t, J = 6.47 Hz), 3.41 (2.2H, t, J = 6.33 Hz), 3.33-3.25 (2.1H, m), 3.24 (2.6H, s), 2.57-2.50 (1.7H, m), 1.87-1.76 (1.9H, m), 1.76-1.65 (1.8H, m), 1.47-1.30 (5.7H, m).
G:\NMR\Takaya\Takaya121221-S11-6.als
1.77
0.8
4
1.83
0.82
2.00 2.
17
2.1
32.
60
2.59
1.72 1
.86
1.82
5.72
7.739
17.
709
87.
580
7
6.923
36.
894
06.
849
1
3.984
93.
963
93.
941
93.
428
23.
407
13.
386
13.
321
13.
298
23.
280
83.
257
03.
243
22.
530
02.
508
02.
501
62.
496
12.
489
71.
861
51.
839
51.
816
71.
794
71.
773
61.
731
51.
708
61.
684
81.
427
51.
356
1
PPM
11 10 9 8 7 6 5 4 3 2 1 0
DFILE Takaya121225-S11-7.alsCOMNT Single Pulse ExperimentDATIM 18-12-2012 11:17:39OBNUC 1HEXMOD single_pulse.expOBFRQ 300.53 MHzOBSET 1.15 KHzOBFIN 8.57 HzPOINT 16384FREQU 4508.57 HzSCANS 64ACQTM 3.6340 secPD 2.0000 secPW1 6.75 usecIRNUCCTEMP 23.2 cSLVNT CDCL3EXREF 0.00 ppmBF 0.16 HzRGAIN 19
1H-NMR (CDCl3) δ: 7.71 (2.0H, d, J = 8.81 Hz), 6.88 (2.2H, d, J = 8.81 Hz), 6.54 (0.9H, s), 5.78 (1.1H, br s), 4.51 (0.9H, br s), 3.96 (2.2H, t, J = 6.60 Hz), 3.53 (2.0H, t, J = 5.78 Hz), 3.44-3.38 (2.2H, m), 3.36 (2.9H, s), 3.17-3.06 (2.2H, m), 1.99-1.89 (1.8H, m), 1.84-1.73 (2.0H, m), 1.56-1.32 (15.6H, m).
G:\NMR\Takaya\Takaya121225-S11-7.als
2.00
2.1
6
0.90
1.1
2
0.94 2.
21
2.01
2.1
6 2.90
2.1
6
1.85
1.98
15.6
2
7.719
97.
690
6
7.262
0
6.894
06.
864
7
6.535
0
5.781
4
4.512
33.
986
83.
964
83.
942
83.
547
23.
528
03.
508
83.
439
23.
418
13.
399
83.
393
43.
379
73.
359
53.
134
33.
113
21.
981
51.
960
41.
940
31.
921
01.
900
01.
829
51.
807
51.
785
51.
759
91.
737
91.
556
61.
532
81.
509
91.
487
01.
443
11.
413
81.
400
01.
378
11.
347
81.
324
0
3.20-2.80 (2H, br s)

S20
1H-NMR spectrum of 13 in CDCl3
LC chart of 1
PPM
11 10 9 8 7 6 5 4 3 2 1 0
DFILE Takaya121227-S11-8.alsCOMNT Single Pulse ExperimentDATIM 20-12-2012 13:28:47OBNUC 1HEXMOD single_pulse.expOBFRQ 300.53 MHzOBSET 1.15 KHzOBFIN 8.57 HzPOINT 16384FREQU 4508.57 HzSCANS 8ACQTM 3.6340 secPD 2.0000 secPW1 6.75 usecIRNUCCTEMP 23.3 cSLVNT CDCL3EXREF 0.00 ppmBF 0.16 HzRGAIN 25
1H-NMR (CDCl3) δ: 7.79 (2.0H, d, J = 8.94 Hz), 7.09 (0.9H, s), 6.92 (2.3H, d, J = 8.94 Hz), 4.57-4.46 (2.9H, m), 4.45-4.32 (1.8H, m), 3.99 (2.3H, t, J = 6.47 Hz), 3.44 (2.1H, t, J = 5.50 Hz), 3.36 (3.0H, s), 3.18-3.07 (2.3H, m), 2.25-2.14 (1.9H, m), 1.86-1.75 (2.4H, m), 1.58-1.38 (15.9H, m).
G:\NMR\Takaya\Takaya121227-S11-8.als
2.00
0.89 2.
26
2.90
1.8
2
2.29
2.0
6 3.01
2.29
1.90
2.38
15.8
8
7.804
17.
774
8
7.091
76.
939
76.
909
5
4.535
24.
383
24.
011
53.
990
43.
968
43.
455
73.
437
43.
419
13.
359
53.
142
53.
121
5
2.187
51.
828
61.
806
61.
779
11.
759
91.
520
91.
498
01.
445
81.
412
91.
390
0
N
N
O
S
HN
O
Boc
Cl
O
13

S21
LC chart of 2
LC chart of 3