Embed Size (px)
Citation preview
sensors
Article
A Preliminary Experimental Analysis of In-PipeImage Transmission Based on Visible LightRelay Communication
Wen Zhao 1,*, Mitsuhiro Kamezaki 1, Kaoru Yamaguchi 1, Minoru Konno 2, Akihiko Onuki 2 andShigeki Sugano 1
1 Graduate School of Creative Science and Engineering, Waseda University, Tokyo 169-8050, Japan;[email protected] (M.K.); [email protected] (K.Y.);[email protected] (S.S.)
2 Tokyo Gas Co. Ltd., Tokyo 105-8527, Japan; [email protected] (M.K.);[email protected] (A.O.)
* Correspondence: [email protected]; Tel.: +81-80-9157-6556
Received: 28 September 2019; Accepted: 30 October 2019; Published: 1 November 2019�����������������
Abstract: The regular inspection of underground facilities such as pipelines is absolutely essential.Pipeline leakage caused by corrosion and deformation must be detected in time, otherwise, it maycause fatal disasters for human beings. In our previous research, a robot chain system (RCS) basedon visible light relay communication (VLRC) for pipe inspection has been developed. This systemcan basically realize the light-based transmission of control command signals and illuminance-basedcoordinated movement, whereas the collection and transmission approach of the pipe leakage imagehave not been studied. Compared with former in-pipe wireless communication techniques, VLRC cannot only overcome the instability and inefficiency of in-pipe data transmission but also extend thecommunication range with high transmission rates. The most important feature is that it can provide astable illumination and high-quality communication for pipe inspection robot and finally improve theenergy efficiency. Hence, the aim of this article is to analyze the performance of VLRC-based imagetransmission in the pipe and in the future provide a high-quality, long-range, and high-efficiencyimage transmission for complex infrastructure inspection with RCS. The transmission systems basedon two signal transmission modes analog image signal relay transmission (AISRT) and digital imageframe relay transmission (DIFRT) have been proposed. Multiple experiments including the waveformtest, the test of transmission features with different bit error rate (BER), and in the different mediumswere conducted between these two systems. The experiment revealed that DIFRT was superiorto the AISRT in terms of the relatively high-quality image transmission and reconstruction quality.It could better overcome the attenuation brought by the absorption and scattering effects and finallyincreased the transmission range than former communication methods. The DIFRT system could alsooperate at 50 kbps with relatively low BER whether in the air or water. The technique in this researchcould potentially provide a new strategy for implementations in the stable, effective, high-speed,and long-range image transmission of the robots in some other special environments such as tunnel,mine, and underwater, etc.
Keywords: visible light relay communication (VLRC); image quality; pipe inspection
1. Introduction
As important components of underground infrastructure, pipelines are designed for collectingand transporting resources such as oil, gas, water, etc. However, the pipeline network is vulnerableto losing its functionality due to internal corrosion, cracking, deformation, and manufacturing flaws.
Sensors 2019, 19, 4760; doi:10.3390/s19214760 www.mdpi.com/journal/sensors
Sensors 2019, 19, 4760 2 of 21
Around the world, accidents and damage resulting from pipeline leakage are often reported by themedia. If the accident happens with a water pipeline, it is a waste of resources and may cause a slightenvironmental pollution [1]. However, if a pipeline which transports oil, gas or chemical liquids leaksit not only wastes resources, but also leads to more severe environmental pollution and possible humaninjury. Hence, for the safe operation and stable supply of the resource, periodic pipeline inspectionand maintenance are urgently required.
Pipeline inspection tasks mostly rely on two important techniques: leakage pre-localizationand localization methods. The pre-localization method refers to a preliminary external detectionsystem based on pressure or acoustic sensors, fiber optic networks, ground-penetrating radar, etc.This method can quickly estimate the approximate location of a leakage, however, the detectionaccuracy is limited. In order to obtain precise leakage information, localization methods based onmobile in-pipe inspection systems are required. These systems can further detect, classify, and localizethe leakages in pipelines [2–5].
Recently, several in-pipe visual inspection approaches have been widely utilized for undergroundpipeline network inspection and maintenance. The entire visual inspection system is usually composedof a mobile device (e.g., robot), a camera, and a lighting device mounted around the camera. When thesystem moves along the pipe, it can transmit the detection image to the external monitor outside thepipe. During the inspection, the captured images can be identified, classified, and located by theoperator. Although this method is time-consuming and labor-intensive, most of the internal corrosion,cracking, and deformation inside the pipe can be accurately diagnosed [6–8].
The accurate acquisition and efficient transmission of pipeline internal image information withwireless approaches are extremely crucial for pipeline detection. However, there are still difficultiesin realizing the above requirements due to the complexity of the underground pipeline environmentand the attenuation effect of the transmitted signal. As the analysis in our former research, the visiblelight communication technique has exhibited some advantages in pipeline inspection. This articleconcentrates on the analysis of the in-pipe image transmission system based on visible light relaycommunication (VLRC) technology in order to realize reliable image transmission [9]. The transmissionis carried out with two methods: analog image signal relay transmission (AISRT) and digital imageframe relay transmission (DIFRT). Among them, discrete cosine transform (DCT) and inverse discretecosine transform (IDCT) method are adopted for DIFRT. Moreover, the data frame and modulationapproaches are specifically designed and implemented to increase the precision and efficiency of imagetransmission. The DIFRT can assist the system to reconstruct the in-pipe image information withsmaller image information distortion and higher image transmission quality. It can basically satisfyVLRC-based image transmission for the pipe inspection [10].
The rest of this article is organized as follows: Section 2 introduces the related works andSection 3 analyzes the image transmission channel and quality evaluation. Sections 4 and 5 explainthe analog image signal and digital image frame relay transmission, respectively. Section 6 describesthe experimental results and discussion, including the waveform test on analog/digital image signal,test of image transmission with different bit error rate (BER) or in the different mediums. In Section 7,we summarize the results and propose future works.
2. Related Works
Currently, signal transmission technologies based on radio frequency (RF) from the 900 MHzto 2.4 GHz and are widely used in pipe inspection. However, the signal is not stable and the mostimportant feature is the limited signal transmission distance due to the huge attenuation in the smalldiameter pipe. Apart from this, some other wireless solutions based on laser techniques have beeninvestigated, as the laser beam possesses a special feature which can be described as point-to-pointtransmission. For stable communication in a pipe, the high directivity of the laser transmitter andreceiver is important, however, it is difficult to realize with a mobile robot system. Moreover, the sizeof the laser generator and the heat sink is another critical factor which limits application in small
Sensors 2019, 19, 4760 3 of 21
diameter pipes. Iinfrared radiation (IR) is also commonly used as a communication approach for pipeinspection robots, but it cannot avoid drawbacks such as a low transmission rate, low anti-interferencecapability, etc. [11].
As one type of 5G communication technique, visible light communication (VLC), has been regardedas an alternative communication method to challenge existing wireless communication, especially incomplex environments such as underground, underwater, and air. The utilization of the visiblelight band can drastically increase the available bandwidth for wireless communication. The otheradvantages such as high transmission rate, high energy efficiency, and strong anti-inference capabilitywill also make this technology more competitive than the common wireless transmission strategies.
In previous research, a robot chain system (RCS) based on VLRC and illuminated assessment forpipe inspection has been proposed. The robot system can not only achieve high-quality and low-losscommunication with the external controller through the “light signal relay”, but also can detect theadjacent distance by the illuminance-based evaluation approach [12]. However, the transmission ofessential information such as image through the visible light has not been realized.
There are many related studies on image transmission based on visible light. In 2013, Png et al.developed an integrated audio, video, and data transceiver system based on VLC. The real-time analogclosed circuit television (CCTV) video signals and pulse-position modulated stereo audio signals couldbe transmitted by a white light emitting diode (LED) between a tablet and an android smartphone.Through VLC, the mobile equipment which installed visible light transceiver could access to the internetvery easily [13]. In 2013, Doniec et al. developed a high-bandwidth wireless optical communicationdevice called AquaOptical II. This system could transmit digital 1288 × 964 pixels images reliablythrough a unidirectional underwater channel of 50 m length. Besides, the excellent performanceof real-time image acquisition and high-quality displaying under 200 m depth of water made itpossible to have a wide range of applications such as underwater robot tele-operation and interactiveremote seabed monitoring [14]. In 2016, Narmanlioglu et al. demonstrated their research results usingon-board camera video transmission through a vehicle lamp. With the support of direct current biasedoptical orthogonal frequency division multiplexing (DCO-OFDM) technique, Narmanlioglu et al.finally realized the line of sight (LOS) inter-vehicular video transmission based on VLC with thedata rate of 6.42 Mbps and lower latency than 32 ms in the experiments [15]. In 2018, Han et al.proposed and implemented an optical-acoustic hybrid network. In this network, optics providedgood quality real-time video streaming while acoustic maintains a channel for the network topologyand transmission control. The acoustic channel was also used for frame video delivery when theoptical channel fails. Han et al. had also demonstrated robust multi-point, low power omnidirectionaloptical 128× 96 pixels image transmission over range of 25 m at data rates up to 9600 bps between theunderwater transmitter and receiver [16].
3. Analysis of Image Transmission Channel and Quality Evaluation
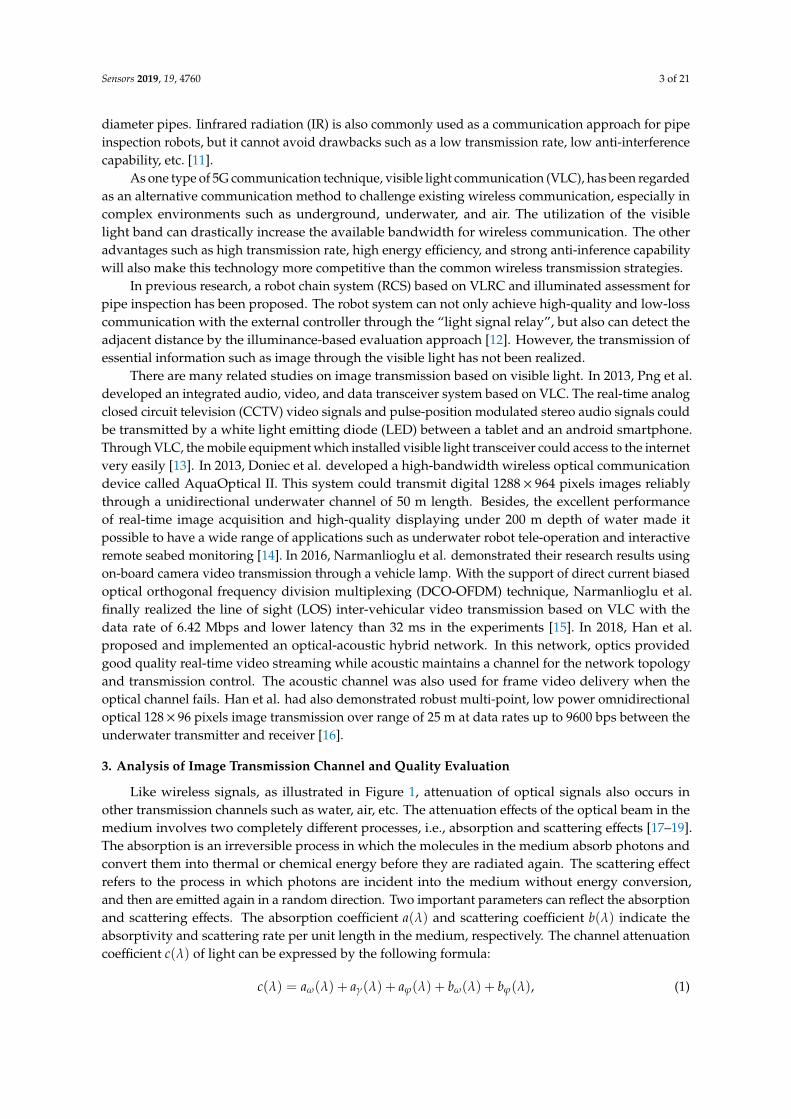
Like wireless signals, as illustrated in Figure 1, attenuation of optical signals also occurs inother transmission channels such as water, air, etc. The attenuation effects of the optical beam in themedium involves two completely different processes, i.e., absorption and scattering effects [17–19].The absorption is an irreversible process in which the molecules in the medium absorb photons andconvert them into thermal or chemical energy before they are radiated again. The scattering effectrefers to the process in which photons are incident into the medium without energy conversion,and then are emitted again in a random direction. Two important parameters can reflect the absorptionand scattering effects. The absorption coefficient a(λ) and scattering coefficient b(λ) indicate theabsorptivity and scattering rate per unit length in the medium, respectively. The channel attenuationcoefficient c(λ) of light can be expressed by the following formula:
c(λ) = aω(λ) + aγ(λ) + aϕ(λ) + bω(λ) + bϕ(λ), (1)
Sensors 2019, 19, 4760 4 of 21
where aω(λ), aγ(λ) , and aϕ(λ) represent the absorption coefficient of main medium particles(e.g., water, air), metal pipe wall, and other suspended particles, respectively, bω(λ) and bϕ(λ)denote the scattering coefficient of main medium and other suspended particles, and λ indicates thewavelength of visible light [20–22].
Figure 1. Structure of image transmission channel based on VLRC.
Here, in Figure 1, the image transmission channel based on VLRC in the pipe is composed of atransmitter, a receiver, and several relay nodes. For each transmitter of the nodes, the light transmissionwill be influenced by factors such as the optical design of the convex lens and the design of thetransmitter circuit [23]. Also, for each receiver of the nodes, the sensitivity of the light detector,the selection of filter and optical design of the convex lens can affect the transmission of the light.After considering the above factors, the image transmission channel based on VLRC can be describedas the following equation:
Pn(r) = Pn−1(t)ψn−1(t)ψn(r)exp[−c(λ)D] ×πR2
π(Dtanθ2
)2 , (2)
where Pn(r) indicates the n th received optical power, Pn−1(t) represents the ( n− 1 ) th transmittedoptical power, ψn−1(t) is the optical efficiency of ( n − 1 ) th transmitter, ψn(r) indicates the opticalefficiency of n th receiver, R denotes the convex lens radius of the receiver, and D and θ represent thetransmission distance and divergence angle of the light, respectively.
In this research, to evaluate the VLRC-based image transmission performance within thepipe, an image quality evaluation framework is built based on the comparison between the finalreceived images and original images. This framework focuses on evaluating image transmissionperformance through some typical image quality assessment algorithms such as mean square error(MSE), peak signal-to-noise ratio (PSNR), mean absolute error (MAE), and structural similarity indexmeasure (SSIM), etc [24].
Here, we assume that the original two-dimensional gray image is I = F(i, j), the size of image isM×N pixels, the received gray image is I′ = F′(i, j), and then the MSE and MAE can be describedas follows:
MSE =1
M×N×
M∑i=1
N∑j=1
[ f (i, j) − f ′(i, j)]2, (3)
MAE =1
M×N×
M∑i=1
N∑j=1
∣∣∣ f (i, j) − f ′(i, j)∣∣∣, (4)
where 1 ≤ i ≤M, 1 ≤ j ≤ N, f (i, j) and f ′(i, j) represent the pixel value of the original image and thefinal image at the pixel point of (i, j), respectively, M and N denote the width and height, respectively.MAE and MSE can reveal the pixel error between the original and final image. Besides, the PSNR canbe defined as the following equation:
PSNR = 10lg(L− 1)2
MSE, (5)
Sensors 2019, 19, 4760 5 of 21
where L is the maximum gray level of the image. For 8-bit images of 256 gray level, the value ofL is considered as 256. The larger the PSNR value, the lower the signal loss rate during the signaltransmission, the higher the image quality. Besides, as an image quality evaluation model for structuralinformation measurement, the SSIM model can deal with the structure information of the image fromthree aspects: the brightness, contrast, and structure information of the image, and then synthesizesthese three parameters to form the image quality evaluation index. The calculation formula is listedas follows:
SSIM(I, I′) = l(I, I′) × c(I, I′) × s(I, I′), (6)
l(I, I′) =2µIµI′ + K1
µ2I + µ2
I′ + K1, (7)
c(I, I′) =2σIσI′ + K2
σ2I + σ2
I′ + K2, (8)
s(I, I′) =σII′ + K3
σIσI′ + K3, (9)
where l(I, I′) , c(I, I′) , and s(I, I′) refer to the function of brightness, contrast, and structure informationrespectively, µI and µI′ denote the average brightness of the original image and the received image,σI , σI′ and σII′ indicate the brightness standard deviation and covariance of the original and receivedimage, respectively, and K1, K2 and K3 are the constants. Usually, the larger the SSIM value, the higherthe quality of the final image. This also means that the final image is more similar to the original image.In this article, the experiments on image transmission performance and image quality are based onthese four evaluation models [25].
4. Analog Image Signal Relay Transmission (AISRT)
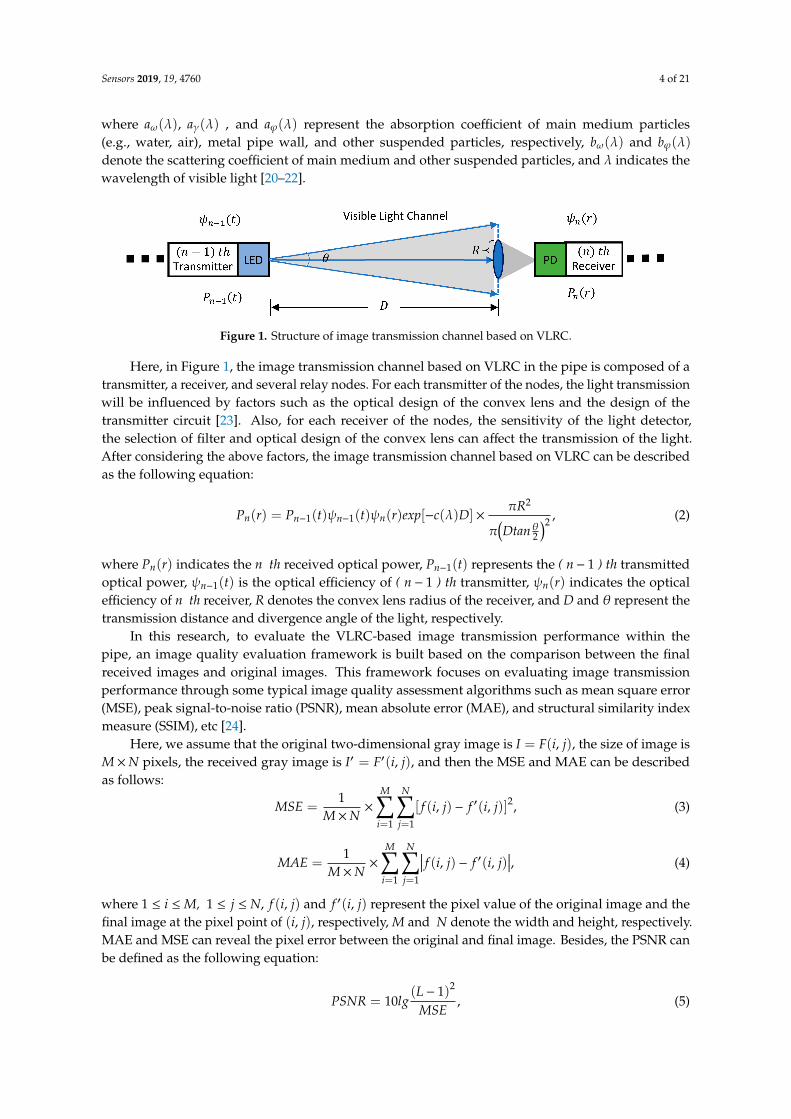
The analog video/image has been commonly applied in TV broadcast systems and surveillanceequipment since it has some advantages such as more precise resolution and much easier realization.In this section, firstly, a fundamental composite video/image signal format is explained, then a basicoptical system for AISRT has been established. The system for AISRT is demonstrated in Figure 2.The experimental verification on this system has been conducted which will be discussed in Section 6.
Figure 2. Entire architecture of AISRT system.
4.1. Composite Video/Image Signal
Currently, there are three major analog video signal standards in the world, including phasealternating line (PAL), national television system committee (NTSC), and séquentiel couleur à mémoire(SECAM) standards [26,27]. Among them, PAL is a color encoding system for analog television used
Sensors 2019, 19, 4760 6 of 21
in broadcast television systems in some regions such as Europe, Australia, and China. It can work atusually 625-line 50 fields (25 frames) per second. Another common color encoding system is NTSC.It has been mainly adopted by North America, South America, and Japan. It can work at 525-line 60fields (29 frames) per second. The SECAM standard consists of three forms: SECAM-L, SECAM-B/G,and SECAM-D/K, which are mainly used in France, the Middle East, and Russia. Due to the relativelyhigher scanning rate (50 fields per second) of NTSC, in this research, a type of NTSC camera was usedfor the composite video analog signal transmission.
Composite video, also known as baseband video, is a traditional image data transmission methodfor the NTSC television signal. It can be transferred through a single analog waveform. The compositevideo contains color difference (hue and saturation of video), brightness, and synchronization signal.Especially, the synchronization signal can control the scanning of signals on the display including fieldsync signals, line sync signals, and line blanking signals.
In the waveform of the composite video signal, the brightness signal, and the synchronizationsignal are added together, which is called the luminance signal (Y). The hue and color saturation areconverted into chromatic aberration signal through a certain conversion and then modulated on a colorsubcarrier. These modulated chromatic aberration signals can be considered as the chrominance signal(C), and its phase represents the color whereas its amplitude represents the color saturation.
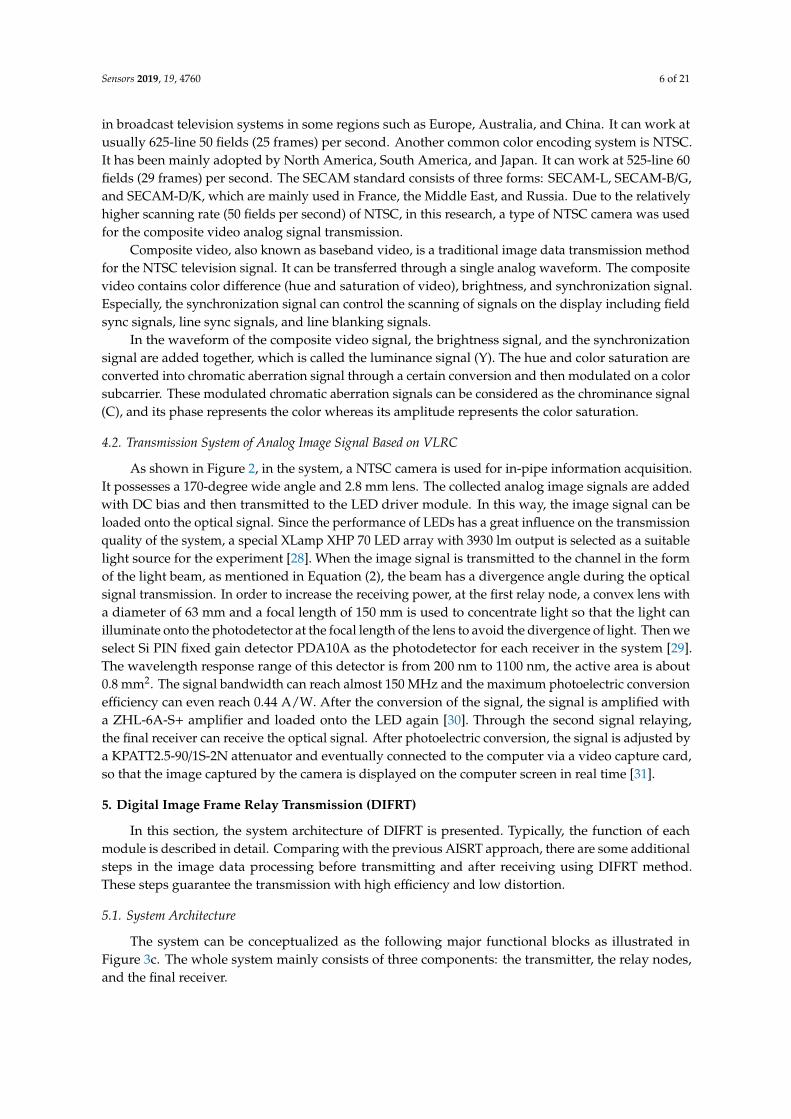
4.2. Transmission System of Analog Image Signal Based on VLRC
As shown in Figure 2, in the system, a NTSC camera is used for in-pipe information acquisition.It possesses a 170-degree wide angle and 2.8 mm lens. The collected analog image signals are addedwith DC bias and then transmitted to the LED driver module. In this way, the image signal can beloaded onto the optical signal. Since the performance of LEDs has a great influence on the transmissionquality of the system, a special XLamp XHP 70 LED array with 3930 lm output is selected as a suitablelight source for the experiment [28]. When the image signal is transmitted to the channel in the formof the light beam, as mentioned in Equation (2), the beam has a divergence angle during the opticalsignal transmission. In order to increase the receiving power, at the first relay node, a convex lens witha diameter of 63 mm and a focal length of 150 mm is used to concentrate light so that the light canilluminate onto the photodetector at the focal length of the lens to avoid the divergence of light. Then weselect Si PIN fixed gain detector PDA10A as the photodetector for each receiver in the system [29].The wavelength response range of this detector is from 200 nm to 1100 nm, the active area is about0.8 mm2. The signal bandwidth can reach almost 150 MHz and the maximum photoelectric conversionefficiency can even reach 0.44 A/W. After the conversion of the signal, the signal is amplified witha ZHL-6A-S+ amplifier and loaded onto the LED again [30]. Through the second signal relaying,the final receiver can receive the optical signal. After photoelectric conversion, the signal is adjusted bya KPATT2.5-90/1S-2N attenuator and eventually connected to the computer via a video capture card,so that the image captured by the camera is displayed on the computer screen in real time [31].
5. Digital Image Frame Relay Transmission (DIFRT)
In this section, the system architecture of DIFRT is presented. Typically, the function of eachmodule is described in detail. Comparing with the previous AISRT approach, there are some additionalsteps in the image data processing before transmitting and after receiving using DIFRT method.These steps guarantee the transmission with high efficiency and low distortion.
5.1. System Architecture
The system can be conceptualized as the following major functional blocks as illustrated inFigure 3c. The whole system mainly consists of three components: the transmitter, the relay nodes,and the final receiver.
Sensors 2019, 19, 4760 7 of 21
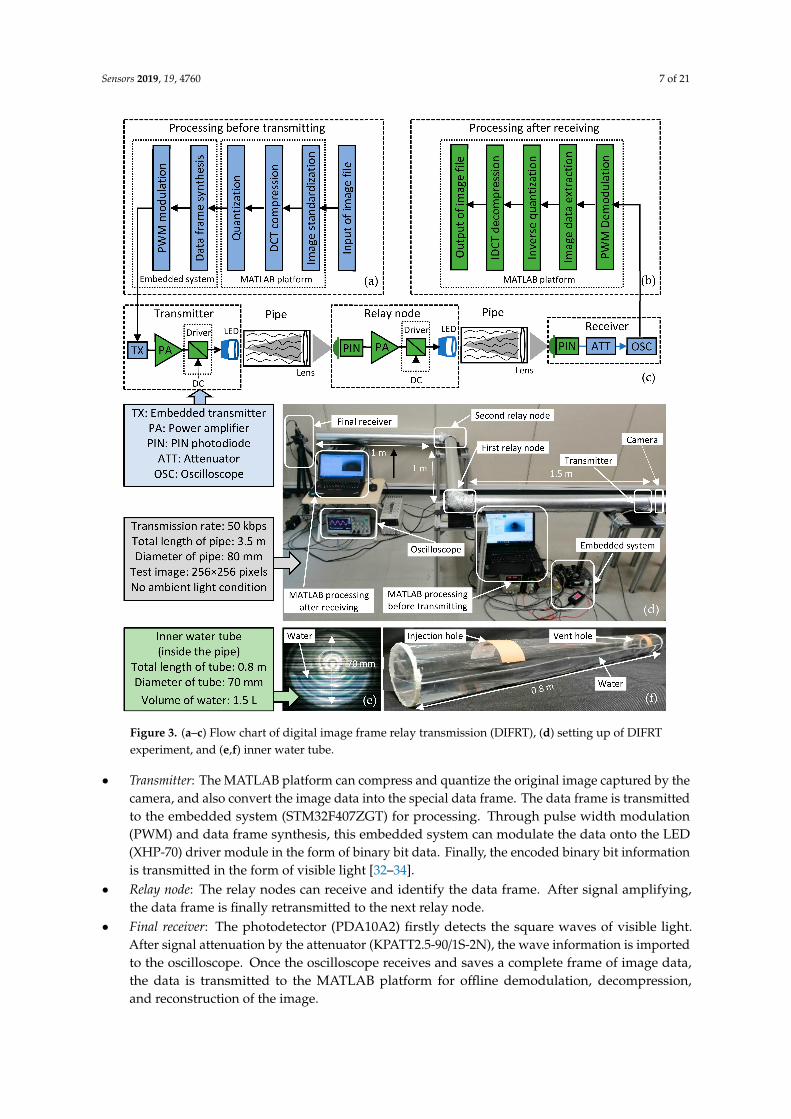
Figure 3. (a–c) Flow chart of digital image frame relay transmission (DIFRT), (d) setting up of DIFRTexperiment, and (e,f) inner water tube.
• Transmitter: The MATLAB platform can compress and quantize the original image captured by thecamera, and also convert the image data into the special data frame. The data frame is transmittedto the embedded system (STM32F407ZGT) for processing. Through pulse width modulation(PWM) and data frame synthesis, this embedded system can modulate the data onto the LED(XHP-70) driver module in the form of binary bit data. Finally, the encoded binary bit informationis transmitted in the form of visible light [32–34].
• Relay node: The relay nodes can receive and identify the data frame. After signal amplifying,the data frame is finally retransmitted to the next relay node.
• Final receiver: The photodetector (PDA10A2) firstly detects the square waves of visible light.After signal attenuation by the attenuator (KPATT2.5-90/1S-2N), the wave information is importedto the oscilloscope. Once the oscilloscope receives and saves a complete frame of image data,the data is transmitted to the MATLAB platform for offline demodulation, decompression,and reconstruction of the image.
Sensors 2019, 19, 4760 8 of 21
Figure 3a,b also illustrate the flow chart of data processing before transmitting and after receiving.Before the image transmission in the pipe, the image data should be processed by MATLAB and
embedded system. Firstly, the image file captured by the camera is imported to MATLAB for imagestandardization. After this operation, the image can be converted to the standard grayscale image witha size of 256× 256 pixels and a bit depth of 8 bits. Then this image is encoded and simplified by theDCT and quantization approach. Through data frame synthesis and modulation by the embeddedsystem, the signal is sent out to the pipe channel by the transmitter. The processing after receivingcan be roughly considered as the inverse method of the processing before transmitting. It includesdemodulation, image data extraction, inverse quantization, and IDCT decompression. Figure 3ddemonstrates the setting up of the experiment environment. This experiment will be described furtherin Section 6.3 and 6.4.
5.2. Image Compression and Decompression
The image compression and decompression are essential in digital image transmission. Because alarge amount of uncompressed raw image data will take a lot of transmission time and even causesevere channel congestion. Therefore the image compression is necessary. In the research, the image iscompressed and decompressed by the MATLAB platform. Moreover, the discrete cosine transform(DCT) and inverse discrete cosine transform (IDCT) methods are applied in image compression anddecompression. DCT is suitable to compress data or images, and it can convert the spatial domain ofsignals into the frequency domain with good de-correlation performance. Generally, in the spatialdomain, the correlation of image data is large. If the image data signal is converted from spatialdomain to frequency domain, it will not affect the phase. Whereas the distribution of energy changesobviously from a relatively uniform distribution to concentration on a few low-frequency components.Some small components can be discarded directly without the degradation of image quality for efficientcompression [35–37].
In MATLAB, image compression is processed with DCT function DCTMTX. The direct calculationof DCT is very complicated, hence we use the function BLKPROC to divide the original imageinto 4 × 4 pixel blocks in order to improve the conversion efficiency of DCT. Since the coefficientmatrix of the DCT output owns a large frequency range, however, this frequency range does notsubstantially contain any image information. Therefore, the frequency coefficient can be simplified byquantization. Here, we adopt a 4× 4 mask matrix to quantize the DCT frequency coefficient. At thereceiver, the original image information can be finally reconstructed by inverse quantization andIDCT decompression.
5.3. Image Frame Realization
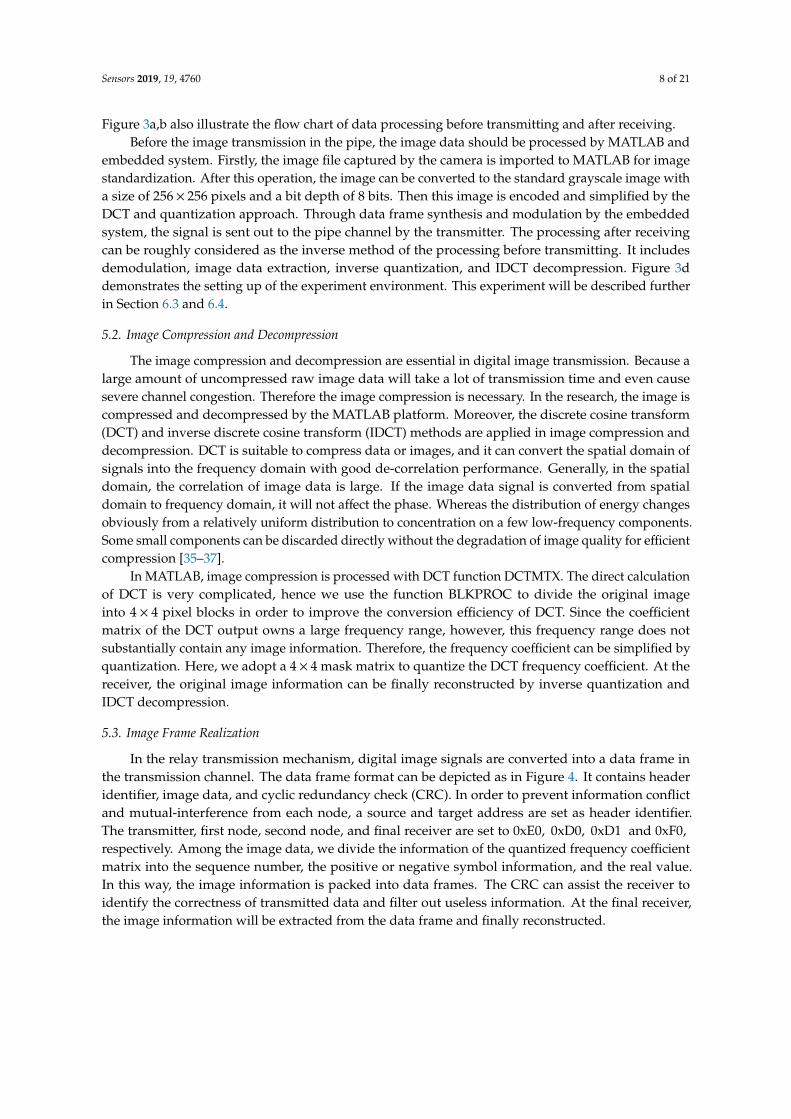
In the relay transmission mechanism, digital image signals are converted into a data frame inthe transmission channel. The data frame format can be depicted as in Figure 4. It contains headeridentifier, image data, and cyclic redundancy check (CRC). In order to prevent information conflictand mutual-interference from each node, a source and target address are set as header identifier.The transmitter, first node, second node, and final receiver are set to 0xE0, 0xD0, 0xD1 and 0xF0,respectively. Among the image data, we divide the information of the quantized frequency coefficientmatrix into the sequence number, the positive or negative symbol information, and the real value.In this way, the image information is packed into data frames. The CRC can assist the receiver toidentify the correctness of transmitted data and filter out useless information. At the final receiver,the image information will be extracted from the data frame and finally reconstructed.
Sensors 2019, 19, 4760 9 of 21
Figure 4. The structure of image data frame.
In addition, due to the attenuation phenomenon resulted from absorption and scattering effectsof the optical beam in the transmission channel, data error and loss of each frame are particularlycommon and inevitable. This effect can influence the quality of the reconstructed image. In this case,we will discuss in detail in Section 6.4.
6. Experimental Results and Discussion
To effectively analyze the image transmission characteristics of VLRC in the pipe, a series ofexperiments have been carried out in a pipe with two elbows (total length 3.5 m and 80 mm in diameter).The camera was mounted at a position 0.5 m from the end of the 1.5 m length straight branch pipe.The two VLRC nodes have been installed at the elbows of the pipe. Three convex lenses were placedat a distance of 150 mm from the receiver of each node. Moreover, we have designed two types oftest environments. Usually, in order to safely enter the gas pipeline to detect damage, the pipe has tobe opened in advance to release the gas to avoid accidents. In this research, we considered the gaspipeline as the empty pipe. For the water pipe, before being inspected by the mobile inspection system,valves were also cut off and even drained. However, some water was still inside the pipe. As depictedin Figure 3e,f, this research designed three 70 mm diameter 0.8 m length transparent sealed inner tubeswhich were filled with half of the water (nearly 1.5 L ). Then we placed them inside the experimentalpipe. We considered them as the water pipe environment. In these two scenarios, waveform tests ontwo signal transmission methods AISRT and DIFRT have been conducted. Four important coefficientsMAE, MSE, PSNR, and SSIM which can describe the transmission efficiency, image transmissionquality, and error were also recorded through the experiments. Furthermore, for DIFRT, the relationshipbetween the BER and image quality has also been compared and analyzed. In particular, to guaranteethe accuracy of experiments, the interference from ambient light has been strictly avoided [38–40].
6.1. Waveform Test on AISRT
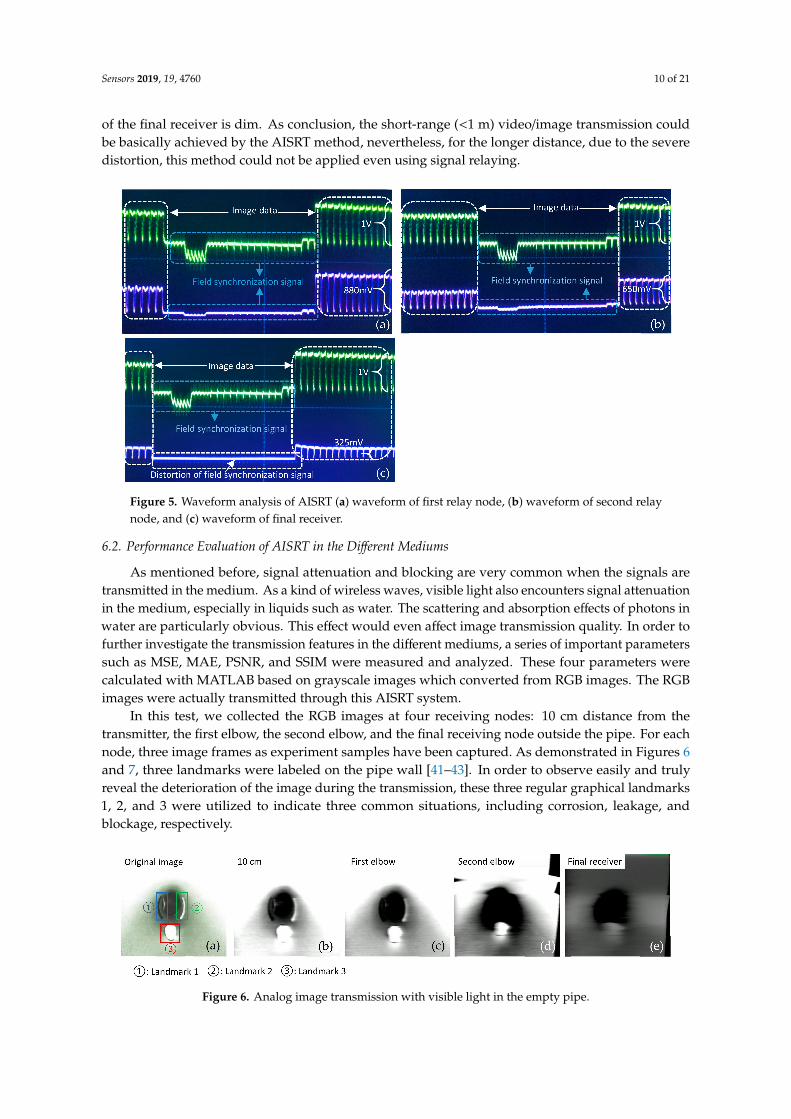
In this experiment, after signal amplification, the analog image signals were firstly loaded ontothe LED driver and then transmitted through optical signals. After the relay transmission by two relaynodes, these optical signals were detected by the PIN photodiode of the final receiver. The digitalsignals were finally restored to images in the PC after photoelectric conversion by the photodiodeand power adjustment by the attenuator. Figure 5 illustrated the waveform test on the AISRT inthe water pipe. The purple wave in Figure 5a,b,c indicated the waveform of the video/image signalreceived by the first relay node, second relay node, and final receiver respectively. The green wavein each figure demonstrated the waveform of the original video/image signal sent by the transmitter.Generally, the analog video/image signal contained two components the field synchronization signaland image data. The signal could only be detected if the field synchronization signal was correctlyjudged. In Figure 5a,b, these field synchronization signals of first and second relay nodes could basicallymaintain synchronization with the original image signal from the transmitter, whereas sometimesthe severe distortion of these signals could be observed just as depicted in Figure 5c. At this time,the distortion could induce the failure to recover from the video/image signal. Furthermore, the voltagepeak-to-peak amplitude value of the original image signal was 1 V, however, this value decreaseddrastically during the transmission in the 3 m water channel. In the final receiver, the value reachedan averagely 325 mV caused by the channel attenuation. This was also the reason why the image
Sensors 2019, 19, 4760 10 of 21
of the final receiver is dim. As conclusion, the short-range (<1 m) video/image transmission couldbe basically achieved by the AISRT method, nevertheless, for the longer distance, due to the severedistortion, this method could not be applied even using signal relaying.
Figure 5. Waveform analysis of AISRT (a) waveform of first relay node, (b) waveform of second relaynode, and (c) waveform of final receiver.
6.2. Performance Evaluation of AISRT in the Different Mediums
As mentioned before, signal attenuation and blocking are very common when the signals aretransmitted in the medium. As a kind of wireless waves, visible light also encounters signal attenuationin the medium, especially in liquids such as water. The scattering and absorption effects of photons inwater are particularly obvious. This effect would even affect image transmission quality. In order tofurther investigate the transmission features in the different mediums, a series of important parameterssuch as MSE, MAE, PSNR, and SSIM were measured and analyzed. These four parameters werecalculated with MATLAB based on grayscale images which converted from RGB images. The RGBimages were actually transmitted through this AISRT system.
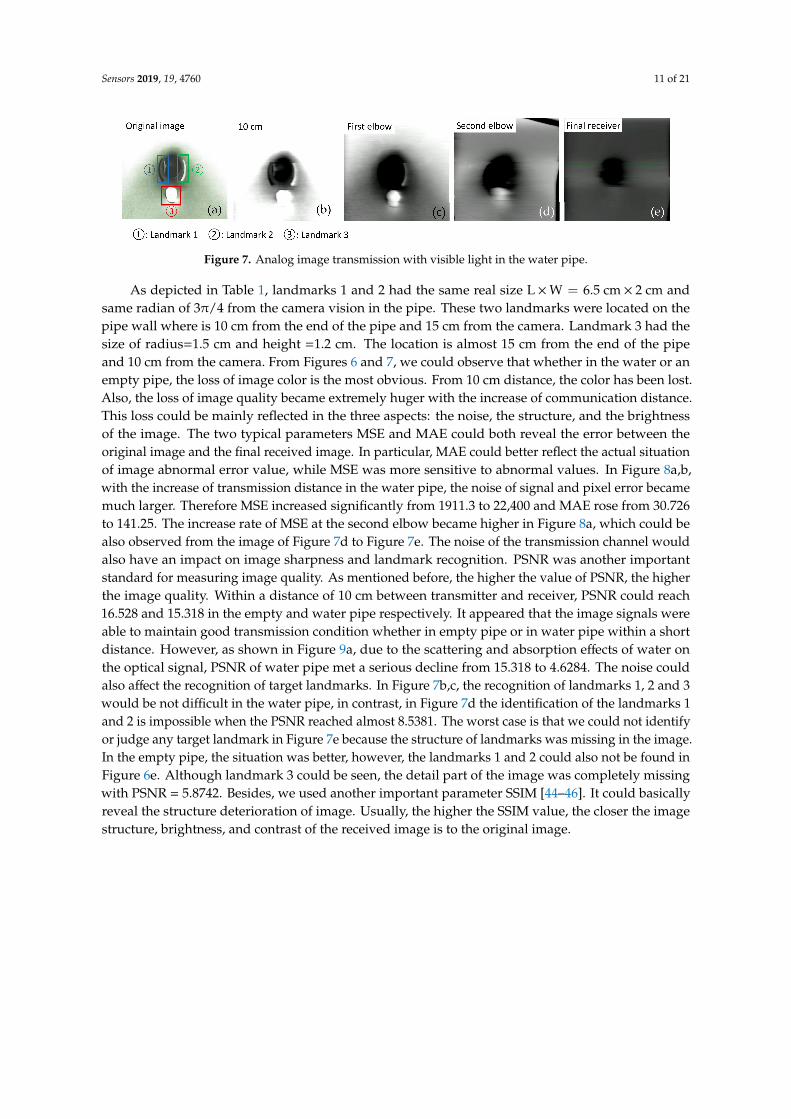
In this test, we collected the RGB images at four receiving nodes: 10 cm distance from thetransmitter, the first elbow, the second elbow, and the final receiving node outside the pipe. For eachnode, three image frames as experiment samples have been captured. As demonstrated in Figures 6and 7, three landmarks were labeled on the pipe wall [41–43]. In order to observe easily and trulyreveal the deterioration of the image during the transmission, these three regular graphical landmarks1, 2, and 3 were utilized to indicate three common situations, including corrosion, leakage, andblockage, respectively.
Figure 6. Analog image transmission with visible light in the empty pipe.
Sensors 2019, 19, 4760 11 of 21
Figure 7. Analog image transmission with visible light in the water pipe.
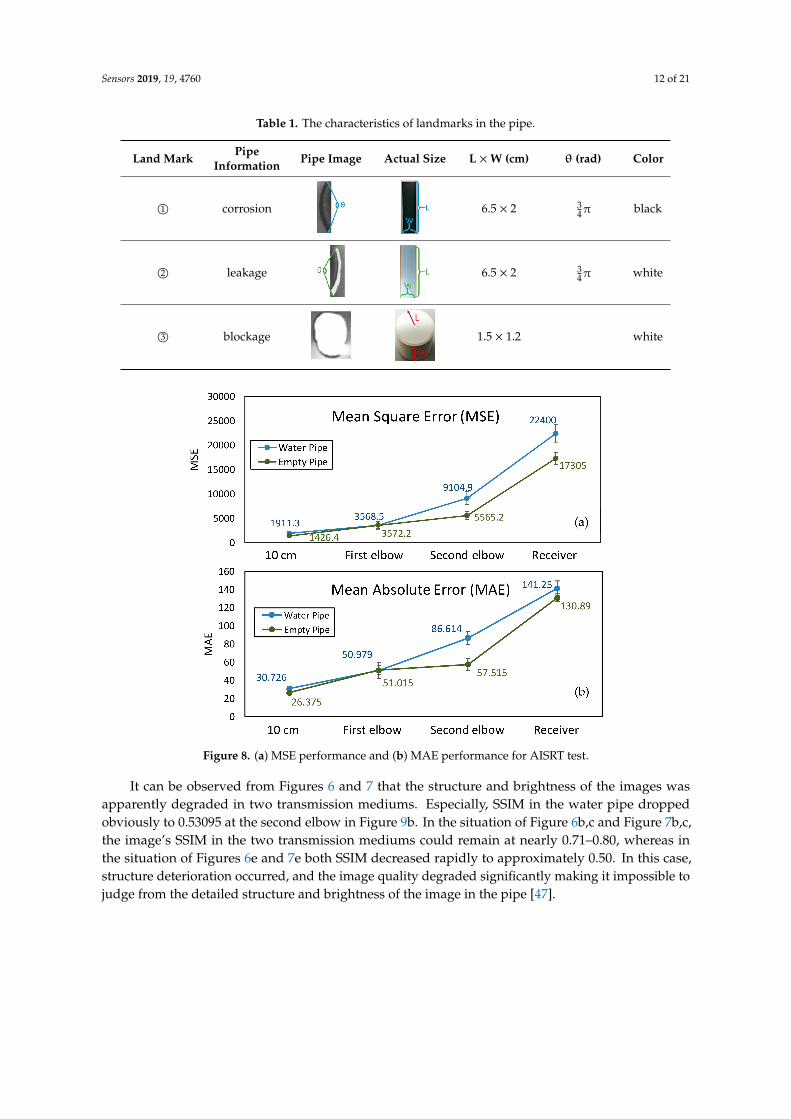
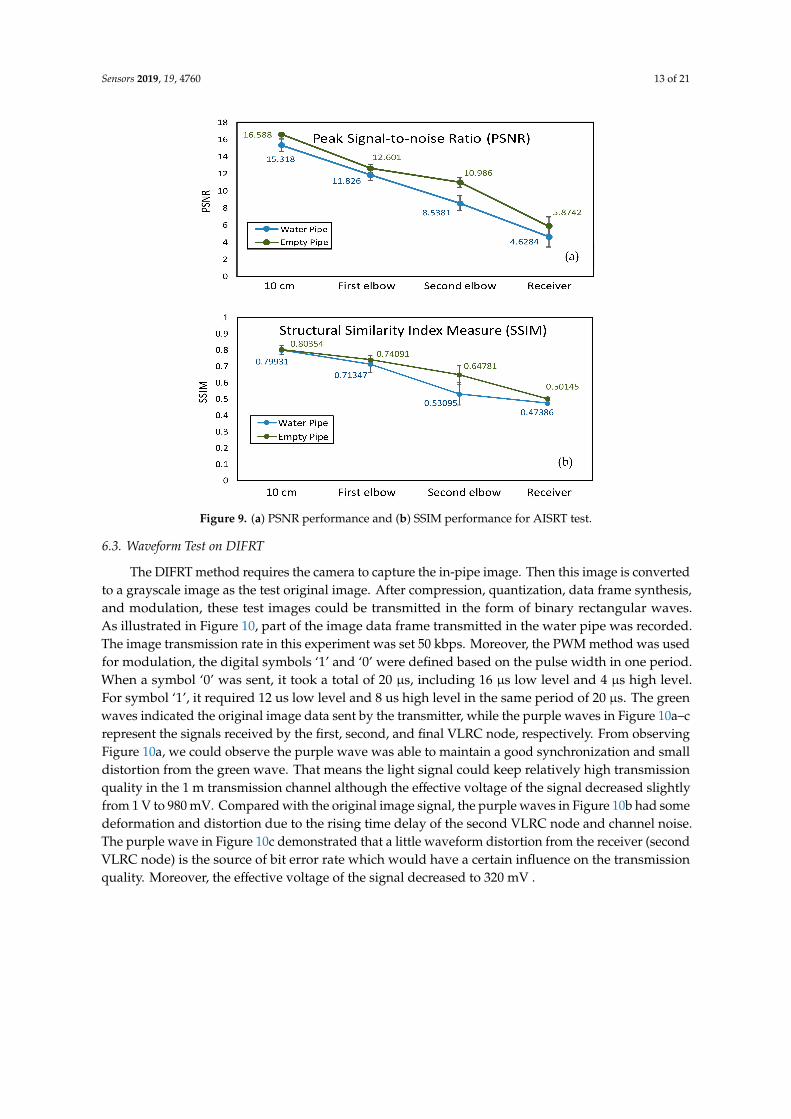
As depicted in Table 1, landmarks 1 and 2 had the same real size L ×W = 6.5 cm × 2 cm andsame radian of 3π/4 from the camera vision in the pipe. These two landmarks were located on thepipe wall where is 10 cm from the end of the pipe and 15 cm from the camera. Landmark 3 had thesize of radius=1.5 cm and height =1.2 cm. The location is almost 15 cm from the end of the pipeand 10 cm from the camera. From Figures 6 and 7, we could observe that whether in the water or anempty pipe, the loss of image color is the most obvious. From 10 cm distance, the color has been lost.Also, the loss of image quality became extremely huger with the increase of communication distance.This loss could be mainly reflected in the three aspects: the noise, the structure, and the brightnessof the image. The two typical parameters MSE and MAE could both reveal the error between theoriginal image and the final received image. In particular, MAE could better reflect the actual situationof image abnormal error value, while MSE was more sensitive to abnormal values. In Figure 8a,b,with the increase of transmission distance in the water pipe, the noise of signal and pixel error becamemuch larger. Therefore MSE increased significantly from 1911.3 to 22,400 and MAE rose from 30.726to 141.25. The increase rate of MSE at the second elbow became higher in Figure 8a, which could bealso observed from the image of Figure 7d to Figure 7e. The noise of the transmission channel wouldalso have an impact on image sharpness and landmark recognition. PSNR was another importantstandard for measuring image quality. As mentioned before, the higher the value of PSNR, the higherthe image quality. Within a distance of 10 cm between transmitter and receiver, PSNR could reach16.528 and 15.318 in the empty and water pipe respectively. It appeared that the image signals wereable to maintain good transmission condition whether in empty pipe or in water pipe within a shortdistance. However, as shown in Figure 9a, due to the scattering and absorption effects of water onthe optical signal, PSNR of water pipe met a serious decline from 15.318 to 4.6284. The noise couldalso affect the recognition of target landmarks. In Figure 7b,c, the recognition of landmarks 1, 2 and 3would be not difficult in the water pipe, in contrast, in Figure 7d the identification of the landmarks 1and 2 is impossible when the PSNR reached almost 8.5381. The worst case is that we could not identifyor judge any target landmark in Figure 7e because the structure of landmarks was missing in the image.In the empty pipe, the situation was better, however, the landmarks 1 and 2 could also not be found inFigure 6e. Although landmark 3 could be seen, the detail part of the image was completely missingwith PSNR = 5.8742. Besides, we used another important parameter SSIM [44–46]. It could basicallyreveal the structure deterioration of image. Usually, the higher the SSIM value, the closer the imagestructure, brightness, and contrast of the received image is to the original image.
Sensors 2019, 19, 4760 12 of 21
Table 1. The characteristics of landmarks in the pipe.
Land Mark PipeInformation Pipe Image Actual Size L ×W (cm) θ (rad) Color
1O corrosion 6.5 × 2 34π black
2O leakage 6.5 × 2 34π white
3O blockage 1.5 × 1.2 white
Figure 8. (a) MSE performance and (b) MAE performance for AISRT test.
It can be observed from Figures 6 and 7 that the structure and brightness of the images wasapparently degraded in two transmission mediums. Especially, SSIM in the water pipe droppedobviously to 0.53095 at the second elbow in Figure 9b. In the situation of Figure 6b,c and Figure 7b,c,the image’s SSIM in the two transmission mediums could remain at nearly 0.71–0.80, whereas inthe situation of Figures 6e and 7e both SSIM decreased rapidly to approximately 0.50. In this case,structure deterioration occurred, and the image quality degraded significantly making it impossible tojudge from the detailed structure and brightness of the image in the pipe [47].
Sensors 2019, 19, 4760 13 of 21
Figure 9. (a) PSNR performance and (b) SSIM performance for AISRT test.
6.3. Waveform Test on DIFRT
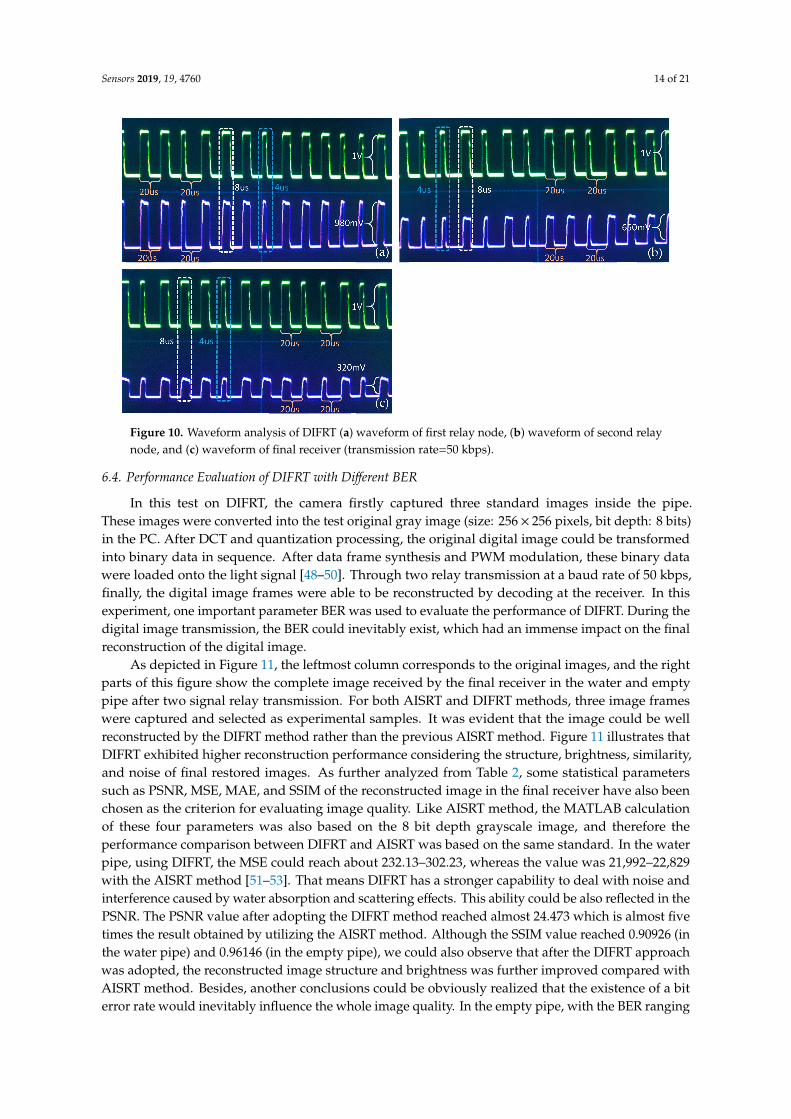
The DIFRT method requires the camera to capture the in-pipe image. Then this image is convertedto a grayscale image as the test original image. After compression, quantization, data frame synthesis,and modulation, these test images could be transmitted in the form of binary rectangular waves.As illustrated in Figure 10, part of the image data frame transmitted in the water pipe was recorded.The image transmission rate in this experiment was set 50 kbps. Moreover, the PWM method was usedfor modulation, the digital symbols ‘1’ and ‘0’ were defined based on the pulse width in one period.When a symbol ‘0’ was sent, it took a total of 20 µs, including 16 µs low level and 4 µs high level.For symbol ‘1’, it required 12 us low level and 8 us high level in the same period of 20 µs. The greenwaves indicated the original image data sent by the transmitter, while the purple waves in Figure 10a–crepresent the signals received by the first, second, and final VLRC node, respectively. From observingFigure 10a, we could observe the purple wave was able to maintain a good synchronization and smalldistortion from the green wave. That means the light signal could keep relatively high transmissionquality in the 1 m transmission channel although the effective voltage of the signal decreased slightlyfrom 1 V to 980 mV. Compared with the original image signal, the purple waves in Figure 10b had somedeformation and distortion due to the rising time delay of the second VLRC node and channel noise.The purple wave in Figure 10c demonstrated that a little waveform distortion from the receiver (secondVLRC node) is the source of bit error rate which would have a certain influence on the transmissionquality. Moreover, the effective voltage of the signal decreased to 320 mV .
Sensors 2019, 19, 4760 14 of 21
Figure 10. Waveform analysis of DIFRT (a) waveform of first relay node, (b) waveform of second relaynode, and (c) waveform of final receiver (transmission rate=50 kbps).
6.4. Performance Evaluation of DIFRT with Different BER
In this test on DIFRT, the camera firstly captured three standard images inside the pipe.These images were converted into the test original gray image (size: 256× 256 pixels, bit depth: 8 bits)in the PC. After DCT and quantization processing, the original digital image could be transformedinto binary data in sequence. After data frame synthesis and PWM modulation, these binary datawere loaded onto the light signal [48–50]. Through two relay transmission at a baud rate of 50 kbps,finally, the digital image frames were able to be reconstructed by decoding at the receiver. In thisexperiment, one important parameter BER was used to evaluate the performance of DIFRT. During thedigital image transmission, the BER could inevitably exist, which had an immense impact on the finalreconstruction of the digital image.
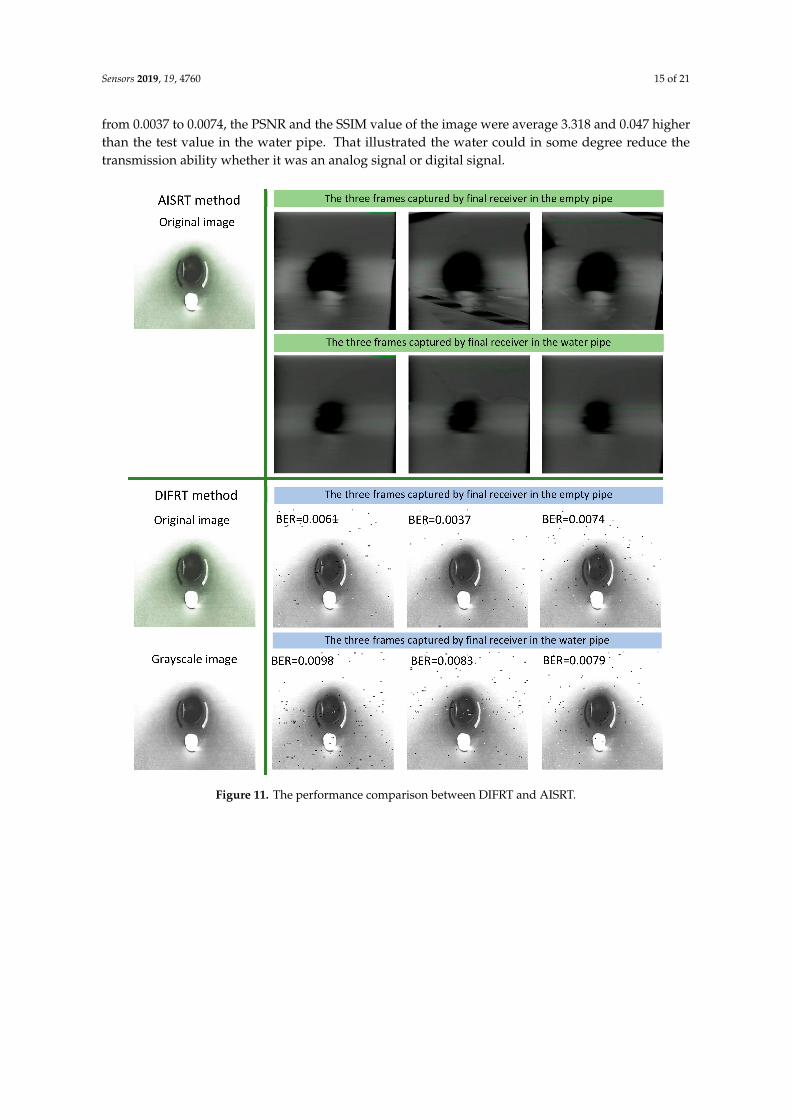
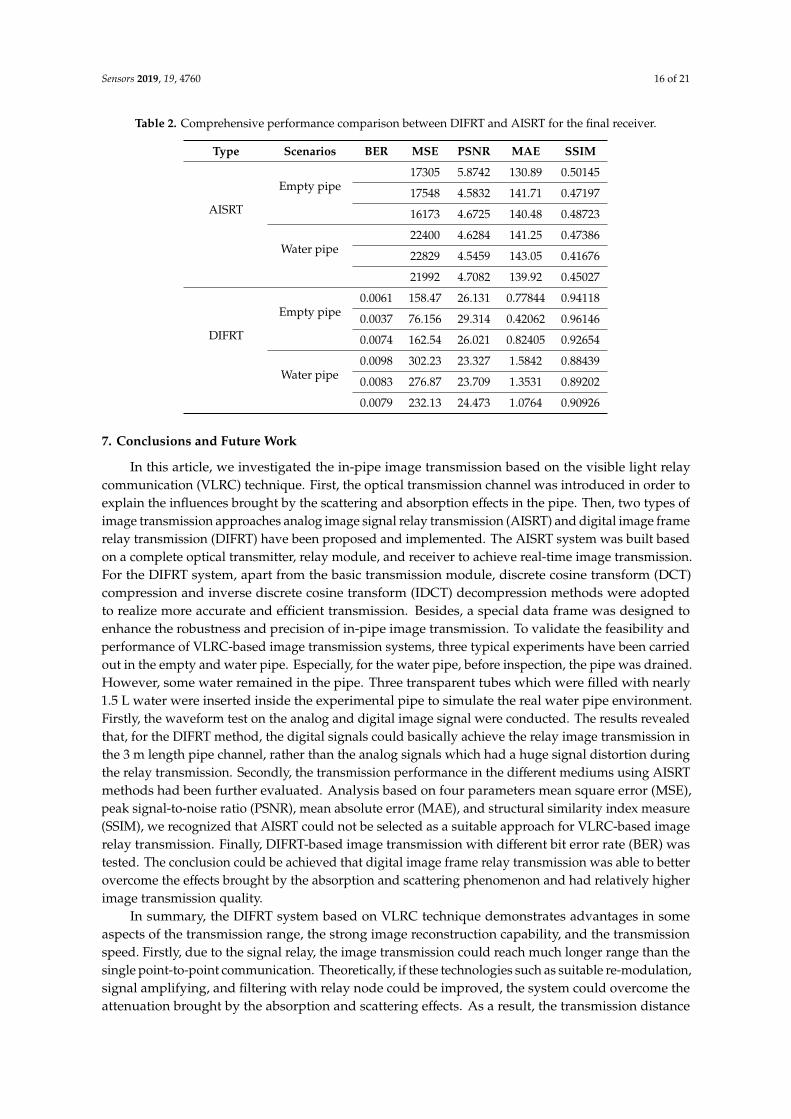
As depicted in Figure 11, the leftmost column corresponds to the original images, and the rightparts of this figure show the complete image received by the final receiver in the water and emptypipe after two signal relay transmission. For both AISRT and DIFRT methods, three image frameswere captured and selected as experimental samples. It was evident that the image could be wellreconstructed by the DIFRT method rather than the previous AISRT method. Figure 11 illustrates thatDIFRT exhibited higher reconstruction performance considering the structure, brightness, similarity,and noise of final restored images. As further analyzed from Table 2, some statistical parameterssuch as PSNR, MSE, MAE, and SSIM of the reconstructed image in the final receiver have also beenchosen as the criterion for evaluating image quality. Like AISRT method, the MATLAB calculationof these four parameters was also based on the 8 bit depth grayscale image, and therefore theperformance comparison between DIFRT and AISRT was based on the same standard. In the waterpipe, using DIFRT, the MSE could reach about 232.13–302.23, whereas the value was 21,992–22,829with the AISRT method [51–53]. That means DIFRT has a stronger capability to deal with noise andinterference caused by water absorption and scattering effects. This ability could be also reflected in thePSNR. The PSNR value after adopting the DIFRT method reached almost 24.473 which is almost fivetimes the result obtained by utilizing the AISRT method. Although the SSIM value reached 0.90926 (inthe water pipe) and 0.96146 (in the empty pipe), we could also observe that after the DIFRT approachwas adopted, the reconstructed image structure and brightness was further improved compared withAISRT method. Besides, another conclusions could be obviously realized that the existence of a biterror rate would inevitably influence the whole image quality. In the empty pipe, with the BER ranging
Sensors 2019, 19, 4760 15 of 21
from 0.0037 to 0.0074, the PSNR and the SSIM value of the image were average 3.318 and 0.047 higherthan the test value in the water pipe. That illustrated the water could in some degree reduce thetransmission ability whether it was an analog signal or digital signal.
Figure 11. The performance comparison between DIFRT and AISRT.
Sensors 2019, 19, 4760 16 of 21
Table 2. Comprehensive performance comparison between DIFRT and AISRT for the final receiver.
Type Scenarios BER MSE PSNR MAE SSIM
AISRT
Empty pipe17305 5.8742 130.89 0.50145
17548 4.5832 141.71 0.47197
16173 4.6725 140.48 0.48723
Water pipe22400 4.6284 141.25 0.47386
22829 4.5459 143.05 0.41676
21992 4.7082 139.92 0.45027
DIFRT
Empty pipe0.0061 158.47 26.131 0.77844 0.94118
0.0037 76.156 29.314 0.42062 0.96146
0.0074 162.54 26.021 0.82405 0.92654
Water pipe0.0098 302.23 23.327 1.5842 0.88439
0.0083 276.87 23.709 1.3531 0.89202
0.0079 232.13 24.473 1.0764 0.90926
7. Conclusions and Future Work
In this article, we investigated the in-pipe image transmission based on the visible light relaycommunication (VLRC) technique. First, the optical transmission channel was introduced in order toexplain the influences brought by the scattering and absorption effects in the pipe. Then, two types ofimage transmission approaches analog image signal relay transmission (AISRT) and digital image framerelay transmission (DIFRT) have been proposed and implemented. The AISRT system was built basedon a complete optical transmitter, relay module, and receiver to achieve real-time image transmission.For the DIFRT system, apart from the basic transmission module, discrete cosine transform (DCT)compression and inverse discrete cosine transform (IDCT) decompression methods were adoptedto realize more accurate and efficient transmission. Besides, a special data frame was designed toenhance the robustness and precision of in-pipe image transmission. To validate the feasibility andperformance of VLRC-based image transmission systems, three typical experiments have been carriedout in the empty and water pipe. Especially, for the water pipe, before inspection, the pipe was drained.However, some water remained in the pipe. Three transparent tubes which were filled with nearly1.5 L water were inserted inside the experimental pipe to simulate the real water pipe environment.Firstly, the waveform test on the analog and digital image signal were conducted. The results revealedthat, for the DIFRT method, the digital signals could basically achieve the relay image transmission inthe 3 m length pipe channel, rather than the analog signals which had a huge signal distortion duringthe relay transmission. Secondly, the transmission performance in the different mediums using AISRTmethods had been further evaluated. Analysis based on four parameters mean square error (MSE),peak signal-to-noise ratio (PSNR), mean absolute error (MAE), and structural similarity index measure(SSIM), we recognized that AISRT could not be selected as a suitable approach for VLRC-based imagerelay transmission. Finally, DIFRT-based image transmission with different bit error rate (BER) wastested. The conclusion could be achieved that digital image frame relay transmission was able to betterovercome the effects brought by the absorption and scattering phenomenon and had relatively higherimage transmission quality.
In summary, the DIFRT system based on VLRC technique demonstrates advantages in someaspects of the transmission range, the strong image reconstruction capability, and the transmissionspeed. Firstly, due to the signal relay, the image transmission could reach much longer range than thesingle point-to-point communication. Theoretically, if these technologies such as suitable re-modulation,signal amplifying, and filtering with relay node could be improved, the system could overcome theattenuation brought by the absorption and scattering effects. As a result, the transmission distance
Sensors 2019, 19, 4760 17 of 21
would become much longer. Besides, because of the relay node, the VLC system could be used in thenon-line-of-sight (NLOS) transmission environment. Secondly, considering the image reconstructionability, the image could be received by the final receiver and processed by MATLAB with less noise,more clear structure, and higher brightness. During the experiments, these three elements for evaluatingin-pipe image quality could show a good image transmission performance when the DIFRT wasadopted. Thirdly, in terms of transmission speed, due to the limitations of the transmitter hardwareand pulse width modulation (PWM) method, the system transmission rate was set only 50 kbps in thisresearch. This speed could basically satisfy the image transmission in the pipe. The transmission ratecould be further improved by using other modulation methods or transmitters. Finally, in differentmediums, the system was well verified. That means the system could be used in water or open air.
Although convincing results have been realized, this method still possesses some deficiencies thatshould be overcome in future work. These deficiencies are highlighted below:
• At present, the biggest and most difficult problem is the light alignment technology.Although visible light communication does not require high alignment requirements like lasercommunication, the alignment technology can severely affect the intensity of received opticalpower and finally influence the communication efficiency of the whole system. Currently, due tothe difficulty in the light alignment, this system is unable to apply in the mobile robot system.
• During the transmission tests, the selection of the DIFRT method in this research has notbeen appropriately justified. Since the BER still exists during the transmission, some othermodulation/demodulation should be also sufficiently considered. In addition, currently, the offlineprocess of image compression and decompression make the system unable to be used in thesmall pipe.
• Currently, this DIFRT system cannot transmit and receive RGB images. There are mainly twoimportant reasons for this: (1) The calculation of MSE, MAE, SSIM, and especially PSNR is basedon 8 bit depth grayscale image. In order to compare transmission performance between the DIFRTand AISRT methods based on these four parameters, a standard grayscale image is required.(2) RGB images are considered as 24 bit depth images, which means that each pixel from theimage has a maximum 224 value, whereas each pixel of a grayscale image has a 28 value. This bigdata scale of RGB pixels will increase the transmission task even if these data are compressedand transformed into a binary data. In the future, the effective transmission of RGB images usingVLRC technique requires more in-depth research.
• To realize efficient image transmission within a pipe over a much longer distance is still a difficulttask. Currently, the maximum point-to-point transmission distance achievable by the DIFRTmethod is almost 1.7 m, therefore, the maximum distance can reach a total of 5.1 m with tworelay nodes in the pipe. In theory, the transmission range can be expanded by increasing thenumber of relay nodes (follower robots). However, as the BER increases, the DIFRT system willbe restricted in a certain distance. The limiting number of relay nodes should be further furtherinvestigated. In addition, increasing the number of relay nodes will enhance the risk of forming arobot chain system. Since optical signal distortion and attenuation such as signal amplitude andnoise occur during the transmission, the utilization of the suitable wave-shaping module andsignal amplifier for each relay node can assist the whole system to achieve longer transmissionwith fewer follower robots.
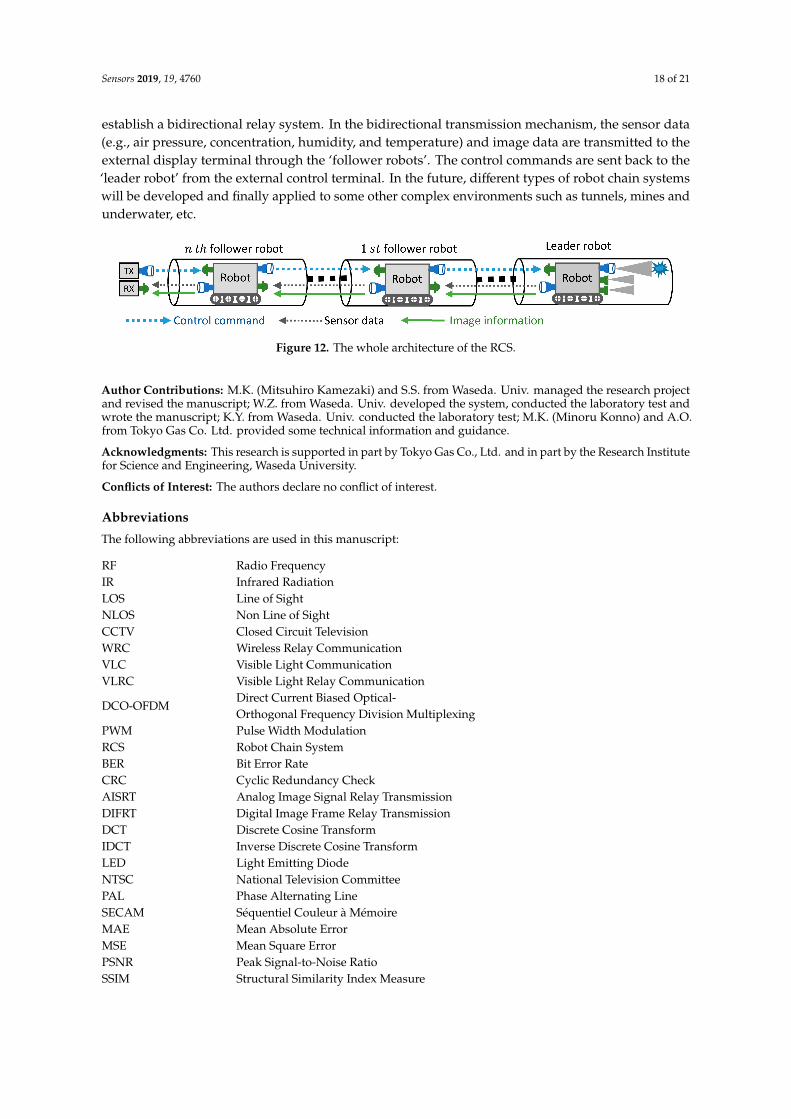
If the above deficiencies can be solved, a high-quality, long-range, high-efficiency imagetransmission technique can be implemented on pipe inspection robots. The RCS is capable of operatingat much longer distances and sending back much higher quality image information from the pipes.This image information will help operators analyze the internal damage of the pipeline. It will bealso conducive to pipes’ timely maintenance, repair, and other regular operations. Combined withthe previous technique, the possible architecture of RCS is illustrated in Figure 12, in which multiplerelay nodes (from to ‘1 st follower robot’ to ‘n th follower robot’) are connected in a ‘chain’ and
Sensors 2019, 19, 4760 18 of 21
establish a bidirectional relay system. In the bidirectional transmission mechanism, the sensor data(e.g., air pressure, concentration, humidity, and temperature) and image data are transmitted to theexternal display terminal through the ‘follower robots’. The control commands are sent back to the‘leader robot’ from the external control terminal. In the future, different types of robot chain systemswill be developed and finally applied to some other complex environments such as tunnels, mines andunderwater, etc.
Figure 12. The whole architecture of the RCS.
Author Contributions: M.K. (Mitsuhiro Kamezaki) and S.S. from Waseda. Univ. managed the research projectand revised the manuscript; W.Z. from Waseda. Univ. developed the system, conducted the laboratory test andwrote the manuscript; K.Y. from Waseda. Univ. conducted the laboratory test; M.K. (Minoru Konno) and A.O.from Tokyo Gas Co. Ltd. provided some technical information and guidance.
Acknowledgments: This research is supported in part by Tokyo Gas Co., Ltd. and in part by the Research Institutefor Science and Engineering, Waseda University.
Conflicts of Interest: The authors declare no conflict of interest.
Abbreviations
The following abbreviations are used in this manuscript:
RF Radio FrequencyIR Infrared RadiationLOS Line of SightNLOS Non Line of SightCCTV Closed Circuit TelevisionWRC Wireless Relay CommunicationVLC Visible Light CommunicationVLRC Visible Light Relay Communication
DCO-OFDMDirect Current Biased Optical-Orthogonal Frequency Division Multiplexing
PWM Pulse Width ModulationRCS Robot Chain SystemBER Bit Error RateCRC Cyclic Redundancy CheckAISRT Analog Image Signal Relay TransmissionDIFRT Digital Image Frame Relay TransmissionDCT Discrete Cosine TransformIDCT Inverse Discrete Cosine TransformLED Light Emitting DiodeNTSC National Television CommitteePAL Phase Alternating LineSECAM Séquentiel Couleur à MémoireMAE Mean Absolute ErrorMSE Mean Square ErrorPSNR Peak Signal-to-Noise RatioSSIM Structural Similarity Index Measure

Sensors 2019, 19, 4760 19 of 21
References
1. Mills, G.H.; Jackson, A.E.; Richardson., R.C. Advances in the inspection of unpiggable pipelines. Robotics2017, 6, 36. [CrossRef]
2. Meniconi, S.; Brunone, B.; Ferrante, M.; Capponi, C.; Carrettini, C.A.; Chiesa, C.; Segalini, D.; Lanfranchi, E.A.Anomaly pre-localization in distribution–transmission mains by pump trip: Preliminary field tests in theMilan pipe system. J. Hydro. Infor. 2015, 17, 3. [CrossRef]
3. Colombo, A.F.; Lee, P.; Karney, B.W. A selective literature review of transient-based leak detection methods.J. Hydro. Envir. Res. 2009, 2, 212–227. [CrossRef]
4. Haddar, M.; Bartelmus, W.; Chaari, F.; Zimroz, R. Modeling and Monitoring of Pipelines and Networks; SpringerNature: Cham, Switzerland, 2016; pp. 191–213.
5. Lah, A.A.A.; Dziyauddin, R.A.; Yusoff, N.M. Localization techniques for water pipeline leakages: A review.Int. J. Integr. Eng. 2018, 7, 302–319.
6. Du, Y.; Zhu, Q.; Ghauri, S.; Zhai, J.; Jia, H.; Nouri, H. Progresses in study of pipeline robot. In Proceedingsof the IEEE International Conference on Modelling, Identification, and Control (ICMIC), Wuhan, China,24–26 June 2012; pp. 808–813.
7. Rostami, J.; Tse, P.W.T.; Fang, Z. Sparse and dispersion-based matching pursuit for minimizing the dispersioneffect occurring when using guided wave for pipe inspection. Materials 2017, 10, 622. [CrossRef]
8. Masuta, H.; Watanabe, H.; Sato, K.; Lim, H. Recognition of branch pipe for pipe inspection robot usingfiber grating vision sensor. In Proceedings of the IEEE International Conference on Ubiquitous Robots andAmbient Intelligence (URAI), Jeju, Korea, 31 October–2 November 2013; pp. 633–638.
9. Mashford, J.; Rahilly, M.; Davis, P.; Burn, S. A morphological approach to pipe image interpretation based onsegmentation by support vector machine. Autom. Constr. 2010, 19, 875–883. [CrossRef]
10. Muthannaa, B.G.N.; Amaraa, M.; Meliania, M.H.; Mettaib, B.; Bozicc, Z.; Suleimand, R.; Sorourd, A.A.Inspection of internal erosion-corrosion of elbow pipe in the desalination station. Eng. Fail. Anal. 2019, 102,293–302. [CrossRef]
11. Zhao, W.; Kamezaki, M.; Yoshida, K.; Konno, M.; Onuki, A.; Sugano, S. A preliminary experimental study oncontrol technology of pipeline robots based on visible light communication. In Proceedings of the IEEE/SICEInternational Symposium on System Integration (SII), Paris, France, 14–16 January 2019; pp. 22–27.
12. Zhao, W.; Kamezaki, M.; Yoshida., K.; Konno, M.; Onuki, A.; Sugano, S. A coordinated wheeled gas pipelinerobot chain system based on visible light relay communication and illuminance assessment. Sensors 2019, 19, 2322.[CrossRef]
13. Png, L.C. A fully integrated audio, video, and data VLC transceiver system for smartphones and tablets.In Proceedings of the IEEE International Symposium on Consumer Electronics (ISCE), Hsinchu, Taiwan,3–6 June 2013; pp. 249–250.
14. Doniec, M.; Xu, A.; Rus, D. Robust real-time underwater digital video streaming using optical communication.In Proceedings of the IEEE International Conference on Robotics and Automation (ICRA), Karlsruhe, Germany,6–10 May 2013; pp. 5117–5124.
15. Narmanlioglu, O.; Turan, B.; Kebapci, B.; Ergen, S.C.; Uysal, M. Poster: On-board camera video transmissionover vehicular VLC. In Proceedings of the IEEE Vehicular Networking Conference (VNC), Columbus, OH,USA, 8–10 December 2016; pp. 317–321.
16. Han, S.; Noh, Y.; Lee, U.; Gerla, M. Optical-acoustic hybrid network toward real-time video streaming formobile underwater sensors. Ad Hoc Netw. 2019, 19, 2322. [CrossRef]
17. Lea, N.T.; Hossainb, M.A.; Janga, Y.M. A survey of design and implementation for optical cameracommunication. Signal. Process. Image Commun. 2017, 53, 95–109. [CrossRef]
18. Mohamed, N.; Jaroodi, J.A.; Zhang., L. Sensor network architectures for monitoring underwater pipelines.Sensors 2011, 11, 10738–10764. [CrossRef]
19. Eren, F.; Peeri, S.; Thein, M.W.; Rzhanov, Y.; Celikkol, B.; Swift, M.R. Position, orientation and velocity detection ofunmanned underwater vehicles (UUVs) using an optical detector array. Sensors 2017, 17, 1741. [CrossRef]
20. Liu, Y.F.; Jiang, Z.H.; Wang, F.M.; Chi, N. 315 Mbps internet of vehicle communication system using carhead lamp based on weighted pre-distortion. In Proceedings of the IEEE International Conference onCommunication Technology, Chongqing, China, 1–2 November 2018; pp. 509–512.
Sensors 2019, 19, 4760 20 of 21
21. Sticklus, J.; Hieronymi, M.; Hoeher., P.A. Effects and constraints of optical filtering on ambient lightsuppression in LED-based underwater communications. Sensors 2018, 18, 3710. [CrossRef]
22. Sendra, S.; Lloret, J.; Gardel, A.; Jimenez, J.M.; Rodrigues, J.J.P.C. Underwater communications for videosurveillance systems at 2.4 GHz. Sensors 2016, 16, 1769. [CrossRef]
23. Lee, S.; Kim, H.; Chung, Y.; Park, D. Energy efficient image/video data transmission on commercial multi-coreprocessors. Sensors 2012, 12, 14647–14670. [CrossRef]
24. Al-Najjar, Y.A.Y.; Soong, D.C. Comparison of image quality assessment: PSNR, HVS, SSIM, UIQI. Inter. J. Sci.Eng. Res. 2012, 3, 5518.
25. Hore, A.; Ziou, D. Image quality metrics: PSNR vs SSIM. In Proceedings of the International Conference onPattern Recognition (ICPR), Istanbul, Turkey, 23–26 August 2010; pp. 2366–2368.
26. Dang, L.M.; Hassan, S.I.; Im, S.; Mehmood, I.; Moon, H. Utilizing text recognition for the defects extractionin sewers CCTV inspection videos. Comp. Indus. 2018, 99, 96–109. [CrossRef]
27. Yang, M.D.; Su, T.C. Segmenting ideal morphologies of sewer pipe defects on CCTV images for automateddiagnosis. Expert Sys. Appl. 2009, 36, 3562–3573. [CrossRef]
28. Cree Inc. Cree XLamp XHP70 LEDs, Product Family Data Sheet, CLD-DS114 Rev 1K, 2014—2018; Cree, Inc.:Durham, NC, USA, 2018.
29. Thorlabs, Inc. PDA10A(-EC) Si Amplified Fixed Gain Detector, User Guide; Thorlabs, Inc.: Newton, NJ, USA, 2016.30. Mini-Circuits, Inc. ZHL-6A-S+, Broadband AMPL/BNC, REV. HM162646 2018; Mini-Circuits, Inc.: New York,
NY, USA, 2018.31. Huaxin Tech Inc. KPATT2.5-90/1S-2N, Key-Press Attenuator 0-90 dB, Rev J, 2015; Huaxin Tech Inc.: Guangzhou,
China, 2015.32. Xu, Y.; Chen, Z.; Gong, Z.; Xia, Z.; Yuan, T.; Gu, Z.; Zhao, W.; Chen, J. Hybrid modulation scheme for visible
light communication using CMOS camera. Opt. Commun. 2019, 440, 89–94. [CrossRef]33. Fernandez, P.R.; Galilea, J.L.L.; Gardel., A.; Espinosa, F.; Bravo, I.; Cano, A. Differential binary encoding
method for calibrating image sensors based on IOFBs. Sensors 2012, 12, 4133–4155. [CrossRef]34. Zhao, D.F.; Tian, H.; Xue, R. Adaptive rate-compatible non-Binary LDPC coding scheme for the B5G mobile
system. Sensors 2019, 19, 1067. [CrossRef]35. Jridi, M.; Chapel, T.; Dorez, V.; Bougeant, G.L.; Botlan, A.L. SoC-based edge computing gateway in the context of
the internet of multimedia things: Experimental platform. J. Low Power Electron. Appl. 2018, 8, 1. [CrossRef]36. Pan, T.M.; Fan, K.C.; Wang., Y.K. Object-based approach for adaptive source coding of surveillance video.
Appl. Sci. 2019, 9, 2003. [CrossRef]37. Lin, Y.H.; Hsia, C.H.; Chen, B.Y.; Chen, Y.Y. Visual IoT security: Data hiding in AMBTC images using
block-wise embedding strategy. Sensors 2019, 19, 1972.38. Akamine, W.Y.L.; Freitas, P.G.; Farias, M.C.Q. A framework for computationally efficient video quality
assessment. Signal. Process. Image Commun. 2019, 70, 57–67. [CrossRef]39. Yang, J.; Zhu, Y.; Ma, C.; Lu, W.; Meng, Q. Stereoscopic video quality assessment based on 3D convolutional
neural networks. Neurocomputing 2018, 309, 83–93. [CrossRef]40. Chow, L.S.; Paramesran, R. Review of medical image quality assessment. Biomed. Signal Process. Control
2016, 27, 145–154. [CrossRef]41. Berg, A.; Ahlberg, J.; Felsberg, M. Enhanced analysis of thermographic images for monitoring of district heat
pipe networks. Lett. Pattern Recognit. 2016, 83, 215–223. [CrossRef]42. Sinh, S.K.; Fieguth, P.W. Segmentation of buried concrete pipe images. Autom. Constr. 2006, 15, 47–57. [CrossRef]43. Cheng, J.C.P.; Wang, M. Automated detection of sewer pipe defects in closed-circuit television images using
deep learning techniques. Autom. Constr. 2018, 95, 155–171. [CrossRef]44. Wang, Y.; Li, N.; Li, Z.; Gu, Z.; Zheng, H.; Zheng, B.; Sun, M. An imaging-inspired no-reference underwater
color image quality assessment metric. Comput. Electr. Eng. 2018, 70, 904–913. [CrossRef]45. Temel, D.; AlRegib, G. Perceptual image quality assessment through spectral analysis of error representations.
Signal Process. Image Commun. 2019, 70, 37–46. [CrossRef]46. Yu, J.; Li, G.; Wang, S.; Li, L. Employment of the appropriate range of sawtooth-shaped-function illumination
intensity to improve the image quality. Optik 2018, 175, 189–196. [CrossRef]47. Marin, A.R.C.; Borrego, J.A. Automatic focus and fusion image algorithm using nonlinear correlation: Image
quality evaluation. Optik 2018, 164, 224–242. [CrossRef]

Sensors 2019, 19, 4760 21 of 21
48. Zhang, W.; Zou, W.; Yang, F. Linking visual saliency deviation to image quality degradation: A saliencydeviation-based image quality index. Signal Process. Image Commun. 2019, 75, 168–177. [CrossRef]
49. Yang, X.; Sun, Q.; Wang, T. Image quality assessment via spatial structural analysis. Comp. Electr. Eng. 2018,70, 349–365. [CrossRef]
50. Wu, J.; Zeng, J.; Dong, W.; Shi, G.; Lin, W. Blind image quality assessment with hierarchy: Degradation fromlocal structure to deep semantics. J. Vis. Commun. Image Represent. 2019, 58, 353–362. [CrossRef]
51. Wu, S.; Chen, X.; Fu, J.; Chen, Z. Efficient VR video representation and quality assessment. J. Vis. Commun.Image Represent. 2018, 57, 107–117. [CrossRef]
52. Agarwal, S. Secure image transmission using fractal and 2D-chaotic map. Imaging 2018, 4, 17. [CrossRef]53. Thu, Q.H.; Ghanbari, M. Modelling of spatio–temporal interaction for video quality assessment. Signal
Process. Image Commun. 2010, 25, 535–546.
© 2019 by the authors. Licensee MDPI, Basel, Switzerland. This article is an open accessarticle distributed under the terms and conditions of the Creative Commons Attribution(CC BY) license (http://creativecommons.org/licenses/by/4.0/).
![Business...[90 Pipe] - 90 pipe section, with bend inner pipe spring supports and welded outer pipe. [Assembly of outer pipe] - When the inner pipe is welded finished and X-ray checked](https://img.pdfslide.tips/doc/110x75/5e3dfc284ee69b37c9083315/-90-pipe-90-pipe-section-with-bend-inner-pipe-spring-supports-and-welded.jpg)