Embed Size (px)
Citation preview
Ageism and age discrimination in secondary health care in the United Kingdom A review from the literature commissioned by the
Department of Health carried out by the
Centre for Policy on Ageing

2
Centre for Policy on Ageing December 2009 Initial review period: February – April 2009 Revised and updated: May – November 2009 Principal author: Nat Lievesley Review team: Ruth Hayes Kate Jones Angela Clark Director: Gillian Crosby © 2009 Centre for Policy on Ageing
Disclaimer:
The views in this report are those of the authors and do not necessarily represent the views of the Department of Health.

Contents
1 Context and Introduction 5
2 Ageism and age discrimination 9
3 Measuring ageism and age discrimination 11
4 Forms and levels of discrimination 12
5 Ageist attitudes in healthcare 15
5.1 Attitudes and views of older people 15
5.2 Attitudes of the general public 15
5.3 Attitudes of medical staff 16
6 Hospital care 19
6.1 The older patient’s experience 19
6.2 Interface with primary care 22
6.3 Indirect discrimination in hospital management 23
6.4 Surgery 26
6.5 Accident and emergency / Trauma care 28
6.6 High Dependency and Intensive Care Units 30
6.7 End‐of‐Life care / Palliative care 32
6.8 Resuscitation 34
6.9 Emergency readmission 35
7 Areas of discrimination in the treatment of particular conditions 36
7.1 Oncology (Cancer) 36
7.2 Cardiology 42
7.3 Transient Ischaemic Attack and Stroke 47
7.4 Diabetes 50
7.5 Osteoporosis 50
7.6 Osteoarthritis 51
7.7 Parkinson’s disease 52
8 Clinical trials 53
9 NICE guidelines and the use of QALYs 54
10 Education and training 58
11 Conclusion 59
12 Recommendations for further study 62
References 63
Appendix 1 – Methods
Appendix 2 ‐ Bibliography

4
This review is one of four reviews of ageism and age discrimination in health and social care available from http://www.cpa.org.uk/reviews

Ageism and age discrimination in secondary health Care in the United Kingdom 1. Context and Introduction
1.1. Context
1.1.1. The Department of Health has commissioned this review of evidence of ageism and age
discrimination in secondary health care in the United Kingdom in the context of the
European Commission Draft Directive (July 2008) – COM (2008) 426 and the introduction in
the UK parliament, in April 2009, of the Equality Bill and related secondary legislation that
will outlaw age discrimination in the provision of goods and services.
1.1.2. The review should be seen alongside other government initiatives to reduce inequalities in
health care for older people including the continuing implementation of the National
Service Framework for Older People, the Dignity in Care campaign, National Dementia
Strategy, Prevention Package for Older People, End‐of‐Life Care Strategy and the updated
and refreshed Ageing Strategy due in Summer 2009. This review from the literature has
also informed the 2009 review of how the NHS and local authorities can ‘tackle’
discrimination against older people, being carried out by Sir Ian Carruthers and Jan
Ormondroyd. That review, reporting in October 2009 and led by the NHS and adult social
care in the South West, takes into account the financial and planning framework within
which work to tackle age discrimination must take place (Carruthers and Ormondroyd,
2009, Review).
1.2. Introduction
1.2.1. This review, from the literature, will look at possible evidence of age discrimination in the
secondary health care setting in the United Kingdom. Companion reviews look at age
discrimination in primary care, mental health care and social care. Primary and secondary
health care are very much interlinked, with access to secondary care being, for the most
part, by referral from primary care. Many health care services, for example Palliative Care,
are provided at both the primary and secondary levels of health care and some of the
issues raised here may be applicable at both primary and secondary level. This review,
however, focuses on secondary health care and therefore excludes issues that are mainly
or exclusively associated with the primary care setting.
1.2.2. There are many specialist areas within secondary health care. Rather than look at all areas
irrespective of indications of the presence of age discrimination, this study will focus on

6
those areas of secondary health care where ageism and age discrimination have been
either evidenced or suspected.
1.2.3. This review is a rapid semi‐systematic literature based review. It is not a formal systematic
review. Details of the review process can be found in appendix 1.
To facilitate recognition of the different types of evidence presented in this review, a brief
and simple classification has been used. Category labels have been added to the reference
citations in the body of the text to provide an at‐a‐glance guide.
Large survey Sample survey of 800+ from a large population
Survey Sample survey of 120‐800 from a large population or 50%+ from a small population. We will use the generic term survey to include retrospective case audits.
Small survey Sample survey of less than 120 from a large population or less than 50% of a small population
Group study Focus group, panel or equivalent study
Study Individual research project, observational study or analysis not carried out as a group study or survey
Opinion Opinion of a respected authority, editorial etc.
Systematic review Systematic review, with or without meta analysis
Review Literature and other reviews not structured as a ‘systematic review’
Policy document Government or professional overview
Campaign document Document to promote a particular point of view
Guide Guide, information pack or toolkit
1.2.4. All the studies and evidence considered in this review are from within the United Kingdom,
except where, for example in the case of under representation of older people in drug
trials, a study may have a wider applicability than its original location.
1.2.5. A literature based review can only reflect ageism and age discrimination that has been
documented in the years covered by the review and located by the reviewers. No review
can claim to be totally exhaustive so any ageism and age discrimination identified in this
review is likely to be indicative of a wider problem.
1.2.6. This review does not provide an economic or cost‐benefit analysis of the removal of age
discrimination in secondary health services but does provide a starting point for such an
analysis.

7
1.2.7. Mental health services are outside the remit of this report and are covered by a separate
review. (Centre for Policy on Ageing, 2009, Review) Mental health services, organised as
separate services for older and younger people, are recognised by many as an example of
systemic or institutional age discrimination. According to the Royal College of Psychiatrists
‘… with mental health care … older people do not have access to the range of services
available to younger adults despite having the same, and often greater, need.’ (Anderson;
Royal College of Psychiatrists Faculty of Old Age Psychiatry, 2007, Policy document)
A 2006 joint report from the Healthcare Commission, Audit Commission and Commission
for Social Care Inspection found that older people reported a noticeable difference in their
experience of accessing mental health services as they reached and passed the age of 65,
that out of hours services for psychiatric advice and crisis management are much less
developed than for working age adults and older people with dementia experience
unacceptably long waits for specialist care. (Healthcare Commission et al, 2006, Review)
1.2.8. This report does not look at issues of multiple discrimination, for example in the
investigation and treatment of heart disease in older women who may experience
discrimination both as a result of their age and their gender. (Dudley et al, 2002)
Nor does it look at age discrimination in relation to the additional difficulties in access to
services experienced by older people living in rural areas, those resulting from regional
differences in ageist attitudes and discrimination, or the additional care needs of older
black and minority ethnic groups who may experience higher than usual levels of poor
health.
Self‐reported fair or bad/poor health by ethnicity and age (Nazroo, Jackson et al, 2007)

8
1.2.9. Ageism and age discrimination in the National Health Service is very likely to reflect ageism
and age discrimination in society at large. It is however beyond the scope of this report to
examine wider issues of ageism and age discrimination in United Kingdom society as a
whole.
1.2.10. “Whenever a clinical stone is turned over, ageism is revealed.” (Young, 2006, Opinion) This
may be an overly pessimistic view of the state of health care in the United Kingdom but
there is evidence of direct and indirect age discrimination in the provision of some services,
although in many cases the evidence is not clear‐cut. Different patterns of treatment for
patients of different ages does not, in itself, necessarily imply discrimination on the basis of
age. Variations in the treatment of patients of different ages may be confounded by the
presence of more than one condition (co‐morbidity), frailty, treatment with more than one
type of medication (polypharmacy) and the efficacy of a particular treatment at different
ages.
1.2.11. Lower investigation and treatment rates for specific conditions in older people may arise
for a number of reasons including different prevalence of the underlying condition in
different age groups. In general, however, the prevalence of most health problems
increases with increasing age hence older people may be expected to receive more care.
(Wood and Bain, 2001, Large survey)
1.2.12. The National Service Framework (NSF) for Older People (Department of Health, 2001,
Policy document) affirmed that ‘NHS services will be provided, regardless of age, on the
basis of clinical need alone. Social care services will not use age in their eligibility criteria or
policies, to restrict access to available services.’
1.2.13. The NSF for older people, rather than labelling people by chronological age, usefully
distinguished older people who are
• “Entering old age: These are people who have completed their career in paid employment
and/or child rearing. This is a socially constructed definition of old age, which, according to
different interpretations, includes people as young as 50, or from the official retirement ages
of 60 for women and 65 for men. These people are active and independent and many
remain so into late old age.”
• “Transient phase: This group of older people are in transition between healthy, active life
and frailty. This transition often occurs in the seventh or eight decades but can occur at any
stage of later life.”
• Frail older people: These people are often vulnerable as a result of health problems such as
stroke or dementia, social care needs or a combination of both.”

9
(Department of Health, 2001, Policy document)
1.2.14. Health care that is appropriate to the needs of the individual patient, but is blind to his or
her chronological age, cannot be considered age discriminatory even if it results in different
average treatment patterns for patients in different age groups.
2. Ageism and Age Discrimination
2.1. The terms ageism and age discrimination are often used interchangeably. Although they are
different in nature, the difference is not always observed.
2.2. Ageism, a term first used by Robert Butler in 1969, is an attitude of mind which may lead to
age discrimination. Age discrimination, on the other hand, is a set of actions with outcomes
that may be measured, assessed and compared.
2.3. ‘…ageism is used to describe stereotypes and prejudices held about older people on the
grounds of their age. Age discrimination is used to describe behaviour where older people
are treated unequally (directly or indirectly) on grounds of their age.’ (Ray, Sharp and
Abrams, 2006, Study)
2.4. ‘Ageism is a set of beliefs … relating to the ageing process. Ageism generates and reinforces
a fear and denigration of the ageing process, and stereotyping presumptions regarding
competence and the need for protection. In particular, ageism legitimates the use of
chronological age to mark out classes of people who are systematically denied resources and
opportunities that others enjoy, and who suffer the consequences of such denigration,
ranging from well‐meaning patronage to unambiguous vilification’. (Bytheway , 1995 ‐
referencing Bytheway and Johnson, 1990, Study)
2.5. Ageism is broader than age discrimination. It refers to deeply rooted negative beliefs about
older people and the ageing process, which may then give rise to age discrimination.
(McGlone and Fitzgerald, 2005, Study)

10
2.6. Some writers consider age discrimination to be a facet of ageism. (Ray, Sharp and Abrams,
2006, Study) Ageism may be seen as having an affective component (feelings), a cognitive
component (beliefs and stereotypes) and a behavioural component (discrimination).
(Nelson, 2002; Palmore, Branch and Harris, 2005) Ageism may be positive or negative. (Reed
et al, 2006, Study)
2.7. An alternative use of the term ageism is to describe any decision making on the basis of age.
Tsuchya, examining public attitudes to discrimination on the basis of age in health service
decision making, identifies
• Health maximisation (utilitarian) ageism – in which health units, eg quality adjusted
life years (QALYs), are given equal value. Other things being equal, younger people,
with greater life expectancy, will benefit from decisions made on this basis.
• Productivity ageism – gives priority to young adults because they are socially and
economically more productive. Health gains at different ages are weighted
accordingly.
• Fair innings ageism – in which an individual’s expected remaining healthy life years are
compared with an average and given a higher relative weighting if they fall below.
Other things being equal, younger people will again benefit from decisions made on
this basis. (Tsuchiya, Dolan and Shaw, 2003, Study)
2.8. Some authors distinguish ageism from age‐differentiated behaviour, considering ageism to
be based on stereotypes and prejudice whereas age‐differentiated behaviour is based on a
well‐developed understanding of age differences.
“Ageist behaviour grows out of stereotypes, prejudices and stigmatization. Age‐
differentiated behaviours are, however, an appropriate function of the age of the target
person, based on an understanding of development and thoughtful recognition of age
differences” (Hagestad and Uhlenberg, 2005, Study)
2.9. Age discrimination is an unjustifiable difference in treatment based solely on age. Age
discrimination may be direct or indirect in form.
2.10. Direct age discrimination occurs when a direct difference in treatment based on age cannot
be justified. A direct difference in treatment is a situation in which a person is, was or could
be treated in a less favourable manner than another person in a comparable situation based

11
on his/her age.
2.11. Indirect discrimination occurs when a seemingly neutral provision, measure or practice has
harmful repercussions on a person. (Belgium ‐ Discrimination Act of February 25, 2003;
Ireland ‐ Equal Status Act 2000‐2004) For example an older person who may need longer to
recover from hospital procedures, may be disadvantaged by an early hospital discharge
policy universally applied.
2.12. Direct age discrimination will occur if people with comparable needs are treated differently,
purely on the basis of their age. Indirect age discrimination will occur if people from
different age groups, with different needs, are treated in the same way, with the result that
the needs of the older person are not fully met.
2.13. The provision of a health service purely on the basis of need reflects the health equity
concepts of horizontal equity (the equal treatment of equals) and vertical equity (the
unequal, but fair, treatment of unequals) (Mooney and Jan, 1997, Study)
Summary
Ageism is an attitude of mind that gives rise to age discrimination, a set of actions that may
advantage (positive discrimination) or disadvantage (negative discrimination) an older
person. Age discrimination may be direct when an older person is treated differently solely
because on their age, or indirect when an older person is disproportionately disadvantaged
by a policy or set of actions equally and universally applied.
3. Measuring ageism and age discrimination
3.1. Ageism, as an attitude of mind, can be measured using psychometric tests, most notably the
Aging Semantic Differential (Rosencranz and McNevin, 1969, Study), the Fraboni Scale of
Ageism (Fraboni, Saltstone and Hughes, 1990, Study) and Kogan's Old People Scale (Kogan,
1961, Study). Measures of this type generally find that ageism gets less as people get older
and that men are more ageist than women. (Rupp, Vodanovich and Credé, 2005, Study)
3.2. Age discrimination, being a set of actions with associated outcomes, is, in principle, easier to
observe and measure. In practice age discrimination cannot be measured directly because

12
there are no agreed ideal levels of investigation, prescribing and treatment for patients in a
particular age group, with a particular condition living in a particular locality.
3.3. The Department of Health in England has developed benchmarking tools to measure and
monitor age discrimination in areas such as social care, acute hospital and primary care. ’
The benchmarking tool contains data on the number of procedures by age, and on the
population of the same age. This enables the generation of age‐specific rates of service
provision. If there were a simple, generally agreed, appropriate rate for each procedure at
each age then it would be sufficient to examine procedure rates for older people, and
consider whether they met the agreed appropriate rate. In practice, there is no such agreed
rate. … The Tool works by comparing across PCTs and SHAs the ratio of the procedure rates
for older adults to the procedure rate for younger adults (the ratio of the rates – the rate for
older adults divided by the rate for younger adults). The Tool also looks at the ratio of the
rate for people in advanced old age to the rate for people in earlier old age.’ (Department of
Health, 2002, Guide)
Summary
Ageism, an attitude of mind, can be measured by psychometric tests. Age differentiated
patterns of service provision can be observed and their measurement is important to help
identify where difference are beneficial (positive action), neutral or represent unfavourable
treatment and may be discriminatory. Age discrimination in health care cannot be measured
directly because there is no agreed standard or yardstick against which to measure
treatment levels or service provision.
4. Forms and levels of discrimination
4.1. Given that budgets are not unlimited, covert or overt health care rationing has always been
a feature of the National Health Service.
4.2. Ageism or age discrimination that follows directly from the policies, structures and systems
of the health service is said to be Institutional. Institutional age discrimination may occur in
policy at the political, national or overall level (Societal) or at the level of individual
institutions, SHAs, PCTs or health units (Systemic) (Levenson, 2003, Guide; Dey and Fraser,

13
2000, Study). Institutional or societal /systemic age discrimination includes the imposition of
explicit age limits for the provision of services or access to facilities. If the use, by the
National Institute for Health and Clinical Excellence (NICE), of Quality Adjusted Life Years
(QALYs) in the assessment of the relative cost‐effectiveness of health service treatments is
shown to be inherently age discriminatory (Taylor, 2007, Study) then this would be an
example of institutional age discrimination at the societal level (Dey and Fraser, 2000,
Study). Since 2001, when the government declared its intention to ‘root out’ age
discrimination in the health service (Department of Health, 2001, Policy document),
examples of institutional age discrimination are likely to have become less common,
although as recently as January 2008, following press publicity, North Yorkshire and York
Primary Care Trust agreed to a catheter ablation to treat atrial fibrillation in a 61 year old
grandmother, Dorothy Simpson, having initially refused the treatment, partly on the grounds
of her age. (Duffin, 2008, Opinion)
4.3. Much more difficult to identify and ‘root out’ is age discrimination at the individual, clinical,
level. Age discrimination at this level is much more likely to be covert and may even be
subconscious.
‘Precisely because clinical judgment is meant to involve a holistic assessment of individual
needs, it is no easy matter to assess the way age is used at the clinical level. If clinical
decisions involve age‐based rationing they are likely to be covert. Nevertheless research
suggests that covert discrimination by age is a pervasive feature of clinical practice. …Those
concerned to reduce rationing by age cannot take refuge in decision making at the clinical
level , where discrimination seems rife but hard to challenge’ (Dey and Fraser, 2000, Study)
4.4. Current examples of explicit institutional or systemic age discrimination, written into
secondary care policy in the NHS are likely to be rare.
Following the publication of the National Service Framework for Older People in 2001, the
Department of Health, through local NHS trusts, carried out, in 2001‐2, an audit of policies
across the NHS to identify which policies were explicitly ageist. An interim report in 2002,
identified the following areas of explicit negative discrimination in policy in secondary care.
• Resuscitation • Hospital admission policies • Access to day surgery • Gastroenterology screening • Osteoporosis screening
• Adverse clinical incident reporting • Transplant policy • Prescribing • Colorectal cancer screening • Anaesthesia guidelines

14
• Older people – specialist teams • Breast screening • Cervical cancer screening
• Coronary heart disease clinical guidelines
• Neurology • Immediate stroke care
(Department of Health, 2002, Policy document)
4.5. Excluding mental health services, the most obvious continuance of the use of age limits in
secondary care policy is in NHS screening programmes (see section X6.2.1 X)
4.6. A 2006 report from the Healthcare Commission, Audit Commission and Commission for
Social Care Inspection , assessing progress since publication of the National Service
Framework for Older People in 2001, noted that “Assessing whether services are provided
fairly between age groups is not straightforward, not least because many organisations
cannot provide detailed data on who uses their services. In addition, for many health
procedures used chiefly by older people, the comparison with younger age groups is unlikely
to be helpful”.
“Access to cardiac procedures and hip and knee replacements by people over 65 have
improved since the NSF was published. Information from the Department of Health’s
hospital episode statistics showed that between 1999 and 2004 the number of hip
replacements carried out on people aged between 65 and 74 years increased by 39% and for
people 75 years and older increased by 22%. The number of knee replacements carried out
on people aged between 65 and 74 increased by 58% and for people 75 years and older it
increased by 63%. There has been a general increase in hip and knee replacements for the
whole population as surgical procedures have increased to achieve the waiting time targets
for admission to hospital. However, despite this there were was a higher increase in access
to hip and knee replacements for older people. Social deprivation negatively affects the
access to treatment for older people. Nationally, there were fewer admissions of older
people to hospital for both hip and knee replacements in poorer areas.”
“...access to procedures relating to heart failure has increased for older people. Elective
(voluntary) admissions for people aged between 65 and 74 years have had a 54% increase,
while there has been an increase of 129% for people who are 75 years and older. This
indicates that, despite the general increase in the admissions of people of all ages to hospital
for elective procedures, access by older people to these procedures, had also increased. This
may be due to a revision of policies on age discrimination but this explanation is not
conclusive, as the demand by older people for these procedures has risen.” (Healthcare
Commission et al, 2006, Review)

15
Summary
Changes and increased awareness following the publication of the National Service
Framework for Older people in 2001, mean that explicit policy based age discrimination is
likely to be rare. Age discrimination, when it occurs is likely to be indirect, from under
provision of services and facilities required by older patients, as a result of commissioning
decisions, or as a result of conscious or subconscious ageist attitudes on the part of medical
staff.
5. Ageist attitudes in healthcare
5.1. Attitudes and views of older people
5.1.1. There is evidence that some older people believe that health care rationing on the basis of
age is acceptable in certain circumstances.
An ONS Omnibus survey of 339 people age 65+ carried out in 2000 with a follow up survey
of 242 people aged 65+ in 2001 revealed that 37% of respondents, hypothetically about to
receive cardiac surgery, would be willing to swap places with a younger person (aged 45) 6
months behind then on the waiting list and 34% would be willing to swap places with
someone 12 months behind. Fifty eight percent and 62% respectively felt it was not right to
do so. (Bowling, Mariotto and Evans, 2002, Survey)
The issue though is not whether an older person would be self‐sacrificing in these
circumstances but whether it is right for society as a whole to burden them with such a
choice.
5.1.2. Acting on behalf of Help the Aged, ICM interviewed a random sample of 1,321 adults aged
60+ from its telephone panel in August 2007. It found that just over half of older people (51
per cent) agree health professionals dismiss symptoms as just old age, while a similar
proportion (53 per cent) believe there is little dignity for older people in hospital or care
homes. (Help the Aged, 2007, Large survey)
5.2. Attitudes of the general public
5.2.1. In 2004 the National Institute for Health and Clinical Excellence (NICE) asked its citizens
panel to consider whether age should be taken into account when NICE is making decisions
about how treatments should be used in the NHS. The panel said “The age of a patient can
and should be used to inform the clinician of the most appropriate treatment so that each

16
person can be treated in the most beneficial way. Being more or less generous to a patient
simply on the basis of their age is as unacceptable as is the allocation of treatment simply
on the basis of their social role.”
5.2.2. A majority of the panel felt that it was valid to treat age groups more generously on the
basis of increased risk or increased likelihood to benefit from treatment but not on the
basis of the perceived social role of that age group. The panel did not discuss whether the
QALY is an appropriate way for NICE to differentiate treatments. (Citizens Council ‐ NICE,
2004, Group study)
5.2.3. An Omnibus poll of the general public, taken to supplement the panel’s findings found the
public divided on whether age should be a factor in decision making.
How important to you think age of the patient should be when deciding on what treatment can be given on the NHS?
10 (very) ‐ 8 7 ‐ 4 3 – 1 (not) 28% 29% 40%
5.2.4. A 2004 study of ageism in Ireland found that, for Northern Ireland, middle aged people
tend to be the most likely to perceive ageism by medical staff towards older people.
(Evason, Dowds and Devine, 2004, Large survey)
Do you think that health and social care workers treat older people differently with regard to...(Percentage saying ‘yes’)
Question \ Age 18‐24 25‐44 45‐49 50‐59 60‐64 65‐74 75+ All...their attitudes to them?
35 44 52 45 48 40 28 42
...the treatment of their illnesses?
39 42 52 47 44 37 24 42
... when placing them on waiting lists for tests and operations?
35 46 54 52 54 45 37 46
n=18,000 Northern Ireland Life and Times Survey, 2003
5.3. Attitudes of medical staff
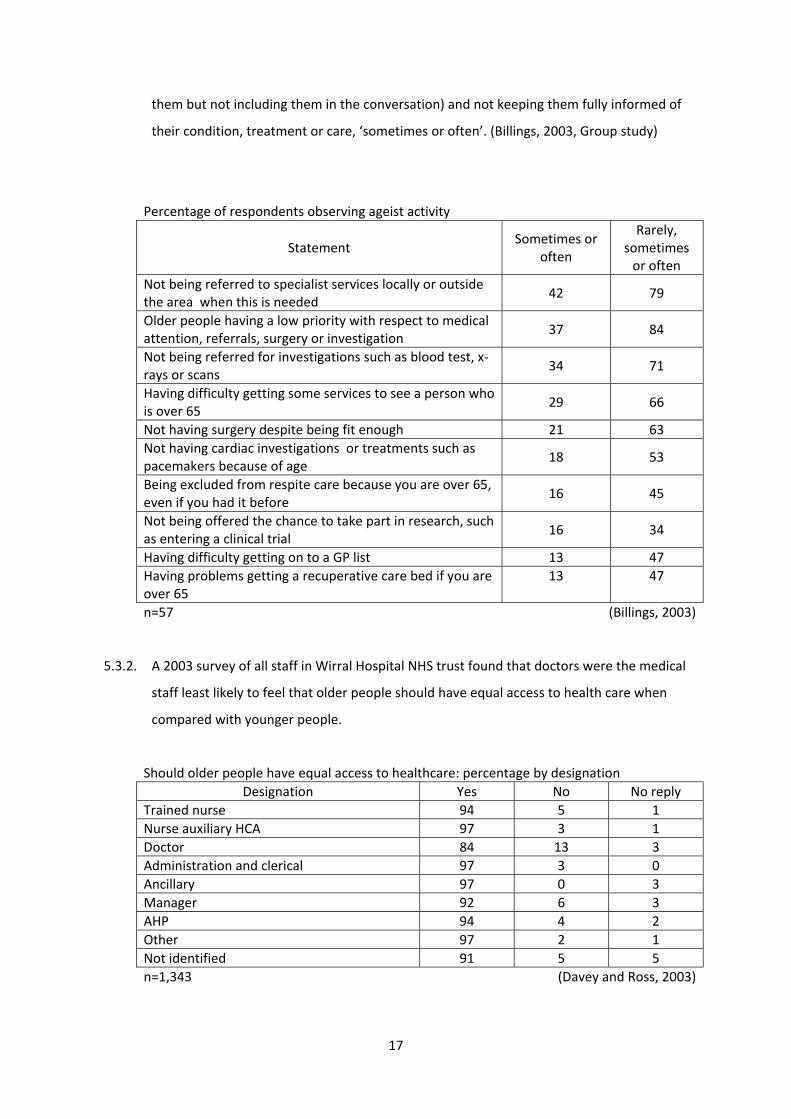
5.3.1. A 2003 focus group based study, of the experiences of NHS staff in the clinical setting,
found some evidence of the observation, by NHS staff, of ageist attitudes and activity by
other staff.
The study noted however that ageist activity and outcomes and age discrimination in
treatment, were less common than ageist behaviour with the older person. The majority
had observed staff being patronising, over familiar, speaking over a person (speaking about
17
them but not including them in the conversation) and not keeping them fully informed of
their condition, treatment or care, ‘sometimes or often’. (Billings, 2003, Group study)
Percentage of respondents observing ageist activity
Statement Sometimes or
often
Rarely, sometimes or often
Not being referred to specialist services locally or outside the area when this is needed
42 79
Older people having a low priority with respect to medical attention, referrals, surgery or investigation
37 84
Not being referred for investigations such as blood test, x‐rays or scans
34 71
Having difficulty getting some services to see a person who is over 65
29 66
Not having surgery despite being fit enough 21 63 Not having cardiac investigations or treatments such as pacemakers because of age
18 53
Being excluded from respite care because you are over 65, even if you had it before
16 45
Not being offered the chance to take part in research, such as entering a clinical trial
16 34
Having difficulty getting on to a GP list 13 47 Having problems getting a recuperative care bed if you are over 65
13 47
n=57 (Billings, 2003)
5.3.2. A 2003 survey of all staff in Wirral Hospital NHS trust found that doctors were the medical
staff least likely to feel that older people should have equal access to health care when
compared with younger people.
Should older people have equal access to healthcare: percentage by designation Designation Yes No No reply
Trained nurse 94 5 1 Nurse auxiliary HCA 97 3 1 Doctor 84 13 3 Administration and clerical 97 3 0 Ancillary 97 0 3 Manager 92 6 3 AHP 94 4 2 Other 97 2 1 Not identified 91 5 5 n=1,343 (Davey and Ross, 2003)

18
The reasoning behind the figures is illustrated by statements from doctors in the survey.
• ”Yes but not to the same care. This is crucial, care must be effective, available and
appropriate. The question as phrased is naive and meaningless”
• “No a judgment has to be made about quality and expectation of life. Therefore
older people should not be offered equal access. Fair access certainly”
• “I think it is a mistake to approach care for the elderly in this way. False directions
are created with these questions. There is a huge debate necessary about when high
tech medical and surgical interventions are most appropriate course of action and it
is obvious that life expectancy is part of the equation”
5.3.3. GPs, cardiologists and care of the elderly specialists took part in a study of their response
to hypothetical cases of individual patients presenting with symptoms of a heart or related
problem. Those most influenced by age gave the following reasoning
• Age a direct influence
“Age does come into it so only the oldest old are excluded. We would manage those
ourselves”
“If someone’s had two bypasses, they’re 95, they’re completely asymptomatic – sure
they’ve got heart disease but I’m not going to do anything.”
“If they are in their 90s with chest pain and angina I might be less likely to refer”
“Age. I would be less likely to prescribe for an older patient.”
“I agree with the policies, like try to avoid angiography over age of 75 and when the
policy came in we thought about 1 in 3 would get angiography but it was 1 in 2.”
“No age related policies here...one occasionally comes across unwritten practice which
may be construed as ageist.”
• Age as an indirect influence (co‐morbidity, patients’ demands, quality of life)
“Age has a definite influence. I’d be more likely to refer a 65 than a 95 year old
because they probably wouldn’t survive surgery at that age.”
“...once you start hitting 75, 80, 85 mark you then start getting put off because you
worry about complications”
“They wouldn’t want an angiogram if they were over 70.”
“I like to think I would treat the individual. I think generally you have to try and identify
from an individual what is in their best interests. I don’t think bypass surgery in an 87
year old is in their interests.”
“Not always young people, but people that you feel that the severity of their chest

19
pains is making their quality of life worse. Whereas if someone is elderly and sedentary
then sadly you have to sometimes forget these people.”
(Bowling et al, 2006, Group study)
5.3.4. A 2008 survey of 201 British Geriatrics Society members, carried out on behalf of Help the
Aged, found that over one half (55%) would be worried about how the NHS would treat
them in old age and nearly one half (47%) think that the NHS is institutionally ageist. Two
thirds (66%) think older people are less likely to have their symptoms fully investigated and
72% said older people were less likely to be considered and referred on for essential
treatments. (Help the Aged, 2009, Survey) Ironically a 2006 study of cardiologists, GPs and
elder care specialists found that care of the elderly specialists are much less likely than
cardiologists to refer a patient for an angiogram or revascularisation and less likely than a
GP to refer a patient to a cardiologist. (Bowling et al, 2006, Group study).
5.3.5. Secondary analysis of the 2004 NHS inpatient survey reveals that the oldest (and youngest)
hospital patients are more likely than those in middle age to feel that doctors and nurses
talk about them ‘as if they were not there’. (see section X6.1.5 X below)
Summary
There is evidence of the presence of ageist attitudes among medical staff in secondary
health care with indications that doctors may be more ageist than other staff. There is,
however, no evidence within the UK of the reasons for these attitudes, whether they reflect
wider societal views or are peculiar to the medical profession.
6. Hospital Care
6.1. The older patient experience
6.1.1. “We found that some older people experienced poor standards of care on general hospital
wards, including poorly managed discharges from hospitals, being repeatedly moved from
one ward to another for non‐clinical reasons, being cared for in mixed‐sex bays or wards
and having their meals taken away before they could eat them due to a lack of support at
meal times. All users of health and social care services need to be treated with dignity and
respect. However, some older people can be particularly vulnerable and it is essential that
extra attention is given to making sure that givers of care treat them with dignity at all
20
times and in all situations. To fail to do this is an infringement of their human rights.”
(Healthcare Commission et al, 2006, Review)
6.1.2. The large scale NHS inpatient surveys, carried out on behalf of the Care Quality
Commission (CQC) by the Picker Institute, have as their primary focus a comparison of the
performance of NHS trusts and do not, in general, in their published results, provide a
breakdown of patient experience for patients of different ages. Data from the 2004 survey
has, however, been lodged with the UK Data Archive (UKDA) and is available for secondary
analysis. The target sample of 850 consecutive discharged patients aged 16+ from each of
169 hospital trusts in England, with a typical response rate of 60%, generates a sample of
around 88,000 valid patient responses that can be used to examine variations in experience
by age and by region. The figures quoted in this report are from the raw data and have not
been weighted to take into account either variations in response rate or the variation in
size of the NHS trusts sampled.
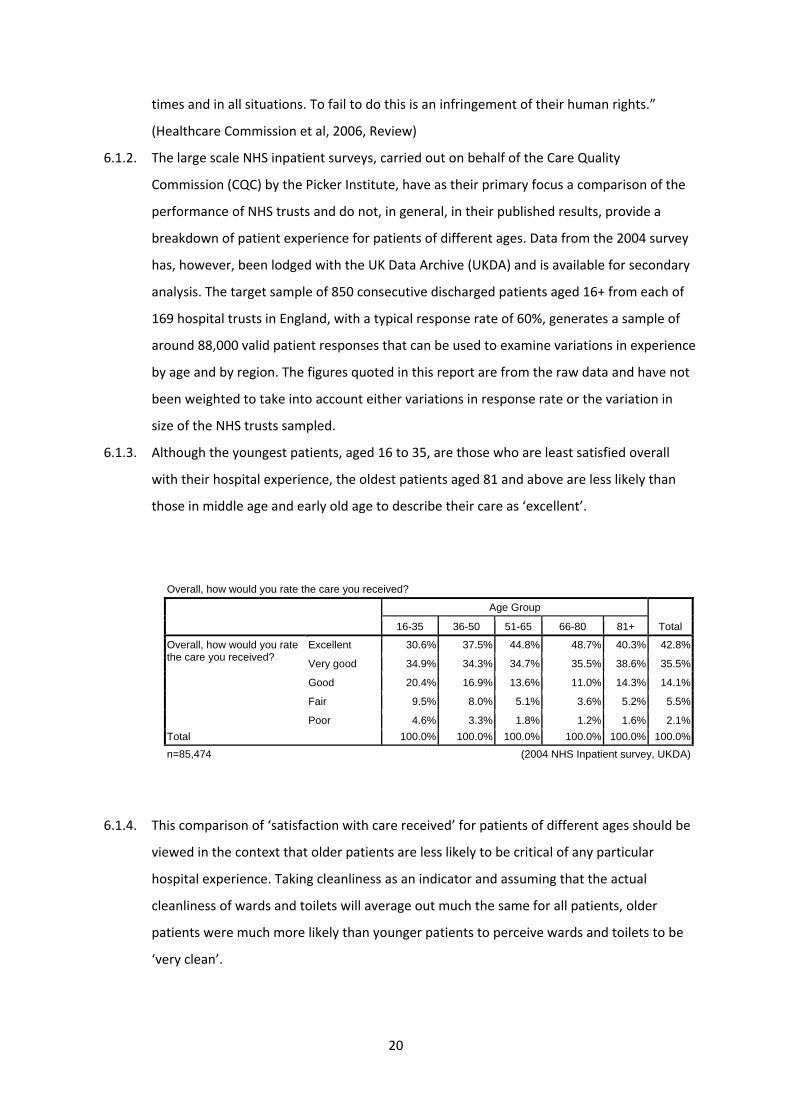
6.1.3. Although the youngest patients, aged 16 to 35, are those who are least satisfied overall
with their hospital experience, the oldest patients aged 81 and above are less likely than
those in middle age and early old age to describe their care as ‘excellent’.
6.1.4. This comparison of ‘satisfaction with care received’ for patients of different ages should be
viewed in the context that older patients are less likely to be critical of any particular
hospital experience. Taking cleanliness as an indicator and assuming that the actual
cleanliness of wards and toilets will average out much the same for all patients, older
patients were much more likely than younger patients to perceive wards and toilets to be
‘very clean’.
Overall, how would you rate the care you received?
Age Group
Total 16-35 36-50 51-65 66-80 81+
Overall, how would you rate the care you received?
Excellent 30.6% 37.5% 44.8% 48.7% 40.3% 42.8%
Very good 34.9% 34.3% 34.7% 35.5% 38.6% 35.5%
Good 20.4% 16.9% 13.6% 11.0% 14.3% 14.1%
Fair 9.5% 8.0% 5.1% 3.6% 5.2% 5.5%
Poor 4.6% 3.3% 1.8% 1.2% 1.6% 2.1%Total 100.0% 100.0% 100.0% 100.0% 100.0% 100.0%n=85,474 (2004 NHS Inpatient survey, UKDA)

21
6.1.5. Being treated with dignity and respect by medical staff is a key feature of a satisfactory
hospital stay for older people. Secondary analysis of the 2004 NHS inpatient survey data
reveals that the oldest patients, aged 81 and over, are those most likely to feel talked over
‘as if they weren’t there’ by medical staff sometimes or often. Doctors are worse offenders
than nurses in this respect.
In your opinion, how clean was the hospital room or ward that you were in?
Age Group
Total 16-35 36-50 51-65 66-80 81+
In your opinion, how clean was the hospital room or ward that you were in?
Very clean 49.3% 49.3% 50.9% 56.8% 61.2% 53.9%
Fairly clean 41.4% 40.8% 39.2% 36.3% 32.9% 37.8%
Not very clean 6.9% 7.4% 7.8% 5.7% 4.7% 6.5%
Not at all clean 2.4% 2.5% 2.1% 1.3% 1.2% 1.8%Total 100.0% 100.0% 100.0% 100.0% 100.0% 100.0%n=86,766 (2004 NHS Inpatient survey, UKDA)
How clean were the toilets and bathrooms that you used in hospital?
Age Group
Total 16-35 36-50 51-65 66-80 81+
How clean were the toilets and bathrooms that you used in hospital?
Very clean 40.4% 40.9% 44.6% 51.8% 55.3% 47.5%
Fairly clean 42.4% 41.7% 39.8% 36.2% 33.2% 38.3%
Not very 11.7% 11.4% 10.3% 7.7% 5.5% 9.1%
Not at all 4.2% 4.8% 3.9% 2.2% 2.0% 3.2%
I did not use a toilet or bathroom
1.2% 1.2% 1.3% 2.1% 3.9% 1.9%
Total 100.0% 100.0% 100.0% 100.0% 100.0% 100.0%
n=86,607 (2004 NHS Inpatient survey, UKDA)
Did doctors talk in front of you as if you weren't there?
Age Group
Total 16-35 36-50 51-65 66-80 81+
Did doctors talk in front of you as if you weren't there?
Yes, often 7.5% 5.9% 4.7% 5.1% 7.0% 5.7%
Yes, sometimes 23.5% 20.1% 19.6% 22.3% 27.5% 22.1%
No 69.0% 73.9% 75.6% 72.5% 65.5% 72.2%Total 100.0% 100.0% 100.0% 100.0% 100.0% 100.0%
n=86,093 (2004 NHS Inpatient survey, UKDA)

22
Summary
Patient satisfaction, based as it is on individual personal experience and expectations, is
not an objective neutral yardstick that can be used to positively identify age discrimination.
However, taking into account the evidence that the oldest patients are those least likely to
be critical of any particular hospital situation, it is particularly worrying that these same
patients are less likely than those in middle age and early old age to describe their hospital
care as ‘excellent’ and most likely to feel talked over ‘as though they were not there’ by
medical staff.
6.2. Interface with primary care
[See also Ageism and age discrimination in primary and community health care in the United
Kingdom (Centre for Policy on Ageing, 2009, Review)]
6.2.1. Screening programmes
One of the most explicit forms of age discrimination in healthcare in the NHS is the age
limits applied to screening programs by invitation. While some have a sound evidence base
and for others there is no available evidence, some are clearly discriminatory and are not
justifiable by disease prevalence or any other clinical indicator. As discussed later under
the treatment of cancer (Section X7.1.9 X), upper age limits currently exist of 69 for breast and
bowel screening and 64 for cervical cancer screening by routine invitation. The soon to be
introduced vascular screening programme currently has an upper age limit of 74 years,
despite vascular diseases being highly prevalent above that age. “...the vascular checks
programme has a cut‐off at the age of 74, and most strokes occur in people over 75. To
prevent stroke, it is important to ensure that hypertension is controlled in this age group.”
(Xavier, 2009)
6.2.2. Late diagnosis and referral / the gate‐keeper role
Early diagnosis and referral from primary to specialist secondary care is key in the
treatment of certain conditions. Some GPs and other primary care agencies, however, see
Did nurses talk in front of you as if you weren't there?
Age Group
Total 16-35 36-50 51-65 66-80 81+
Did nurses talk in front of you as if you weren't there?
Yes, often 5.8% 4.5% 3.4% 3.7% 5.2% 4.2%
Yes, sometimes 17.7% 14.8% 13.6% 14.9% 20.5% 15.6%
No 76.5% 80.7% 83.0% 81.5% 74.4% 80.2%Total 100.0% 100.0% 100.0% 100.0% 100.0% 100.0%
n=86,487 (2004 NHS Inpatient survey, UKDA)

23
it as part of their role to act as a gatekeeper to prevent unnecessary use of secondary care
services. For example Somerset GP Acute Care Services state their primary aim as being to
“Gate keep emergency admissions, avoiding those who do not need to be admitted coming
into hospital”. Early referral and the gate‐keeping role seem to be opposing forces. Gate‐
keeping, coupled with ageist attitudes, may disadvantage older people but there is no firm
evidence to indicate that this is happening.
A Kings Fund survey of health managers, looking at age discrimination in healthcare found
that managers rarely mentioned the gate‐keeping role. (Roberts and Seymour, 2002, Survey)
There is however evidence that late referral is associated with patient age. For example in
referral for dialysis following chronic renal failure to Bristol and Portsmouth renal units,
avoidable late referrals were, on average, 5 years older than early referrals. (Roderick, Jones,
Tomson and Mason, 2002, Survey)
Summary
At the interface with primary care, evidence of age discrimination is mixed. Some screening
programmes provide one of the clearest remaining examples of institutional and explicit age
discrimination and there is some clear evidence of the later referral of older patients but it is
not clear that this late referral results from ageist attitudes or a gatekeeper role adopted by
GPs and other primary care staff.
6.3. Indirect discrimination in hospital management
6.3.1. Older people, particularly frail older people, in hospital may have additional special needs.
If there is not adequate provision and these needs are not properly met this may be viewed
as a form of indirect discrimination against the older person.
6.3.2. Ward management, privacy and single sex wards
‘The 2006 NHS inpatient survey shows that only 76% of respondents were always given
enough privacy when discussing their condition and treatment, 18% were given this facility
sometimes and 5.5% did not get enough privacy in this situation.’ ‘Being in single sex
accommodation and having access to single sex bathing, washing and toilet facilities is one
of the most important considerations for older patients in maintaining their privacy and
dignity.’ ‘ According to the 2006 survey of NHS inpatients just under 23% of older
respondents reported they had shared a room or bay with patients from the opposite sex.’
(Healthcare Commission, 2007b, Large survey)
24
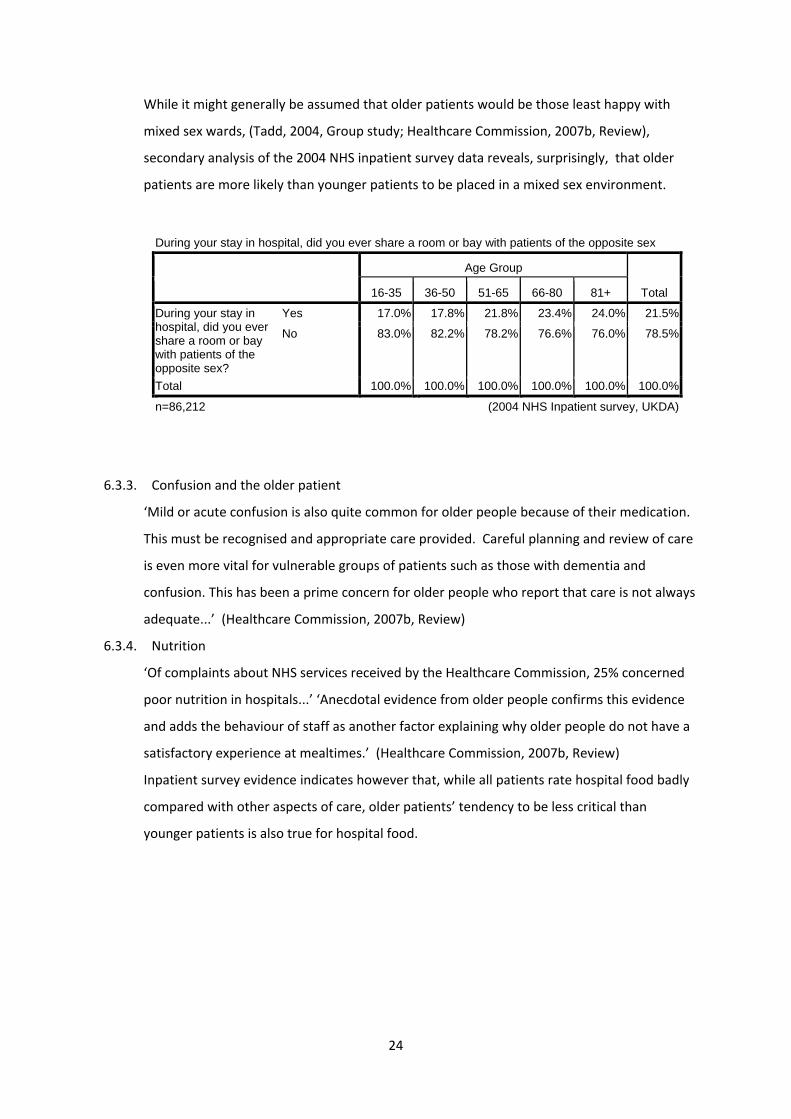
While it might generally be assumed that older patients would be those least happy with
mixed sex wards, (Tadd, 2004, Group study; Healthcare Commission, 2007b, Review),
secondary analysis of the 2004 NHS inpatient survey data reveals, surprisingly, that older
patients are more likely than younger patients to be placed in a mixed sex environment.
6.3.3. Confusion and the older patient
‘Mild or acute confusion is also quite common for older people because of their medication.
This must be recognised and appropriate care provided. Careful planning and review of care
is even more vital for vulnerable groups of patients such as those with dementia and
confusion. This has been a prime concern for older people who report that care is not always
adequate...’ (Healthcare Commission, 2007b, Review)
6.3.4. Nutrition
‘Of complaints about NHS services received by the Healthcare Commission, 25% concerned
poor nutrition in hospitals...’ ‘Anecdotal evidence from older people confirms this evidence
and adds the behaviour of staff as another factor explaining why older people do not have a
satisfactory experience at mealtimes.’ (Healthcare Commission, 2007b, Review)
Inpatient survey evidence indicates however that, while all patients rate hospital food badly
compared with other aspects of care, older patients’ tendency to be less critical than
younger patients is also true for hospital food.
During your stay in hospital, did you ever share a room or bay with patients of the opposite sex
Age Group
Total 16-35 36-50 51-65 66-80 81+
During your stay in hospital, did you ever share a room or bay with patients of the opposite sex?
Yes 17.0% 17.8% 21.8% 23.4% 24.0% 21.5%
No 83.0% 82.2% 78.2% 76.6% 76.0% 78.5%
Total 100.0% 100.0% 100.0% 100.0% 100.0% 100.0%
n=86,212 (2004 NHS Inpatient survey, UKDA)

25
6.3.5. Assessment and discharge
‘The assistance received by older people upon discharge from hospital elderly care units
often depends upon who they see and where they live... [a] review of 456 patients in three
hospital elderly care units found that virtually all patients were assessed, and over 90 per
cent received nursing or social care upon discharge from hospital. These were vulnerable
older people aged 75 years and over. Most were widows who lived alone, had some physical
difficulties and also multiple medical conditions. But the researchers cautioned that these
results cannot be generalised to all hospitals, as medicine for the elderly wards are more
likely to follow ‘best practice’ in multidisciplinary assessment than other hospital wards.
...Nearly 90 per cent of social workers (in the 54 hospital elderly care units) said that care
assessment had improved in recent years.’ (Healy, Thomas, Seargeant and Victor, 2000,
Survey)
Older patients, aged 81 and over, are much less likely than younger patients to feel they
have been given adequate information about what to do if they are worried about their
condition after leaving hospital.
How would you rate the hospital food?
Age Group
Total 16-35 36-50 51-65 66-80 81+
How would you rate the hospital food?
Very good 9.6% 13.1% 16.5% 21.0% 24.3% 17.9%
Good 28.2% 30.3% 33.6% 37.9% 39.6% 34.8%
Fair 33.0% 32.2% 30.8% 27.5% 25.4% 29.4%
Poor 20.9% 18.9% 15.3% 11.0% 8.7% 14.1%
I did not have any hospital food
8.4% 5.5% 3.8% 2.5% 1.9% 3.8%
Total 100.0% 100.0% 100.0% 100.0% 100.0% 100.0%
n=86,550 (2004 NHS Inpatient survey, UKDA)
Did hospital staff tell you who to contact if you were worried about your condition or treatment after you left hospital
Age Group
Total 16-35 36-50 51-65 66-80 81+
Did hospital staff tell you who to contact if you were worried about your condition or treatment after you left hospital?
Yes 67.2% 70.9% 75.5% 72.4% 58.6% 70.5%
No 22.7% 22.0% 18.5% 20.0% 27.1% 21.2%
Don't know - Can't remember
10.1% 7.1% 6.0% 7.5% 14.3% 8.3%
Total 100.0% 100.0% 100.0% 100.0% 100.0% 100.0%
n=83,904 (2004 NHS Inpatient survey, UKDA)

26
Problems with discharge procedures for older patients are reflected in the high and
increasing rates of emergency readmission for older people within 28 days of hospital
discharge (see section X6.9 X ). Interventions provided both in the hospital and at home are the
most effective in reducing readmission rates (Parker et al, 2002, Systematic review).
Summary
There is a body of anecdotal evidence, supported in part by inpatient surveys, that older
patients are particularly affected by hospital management issues such as privacy, continence
management, the availability of single sex accommodation and the provision and serving of
adequate and nutritional food.
6.4. Surgery
6.4.1. As we will see later in section 7, older patients are less likely than younger patients to be
referred for surgical interventions for cancer, heart disease and stroke. This may, at least in
part, be a function of perceptions of how the older patient will cope with a surgical
procedure.
6.4.2. Major elective [non urgent] cardiac, vascular, oncological and orthopaedic surgery can be
performed on patients over 75 years old with good outcomes and adverse event rates
similar to younger patients. For carotid endarterectomy “...the contribution of age to
operative mortality is less than that of gender – the risks for older people over 75 are lower
than those for women as a group.” (Preston et al, 2008, Study)
6.4.3. Unlike elective operations, emergency surgery in older people carries disproportionately
high risk, as patients tend to present later, are often harder to diagnose and have poorer
functional reserve. (Preston et al, 2008, Study)
6.4.4. A social view of older people recognises diversity and that older people are just older
‘people’.
From a medical point of view the reverse is true. Older people experience physiological
change which must be recognised in treatment to meet need appropriately and avoid
indirect discrimination.

27
6.4.5. Age related changes in human physiology
System Age related changes Effect Cardiovascular Heart and vessels stiffen
Left ventricular hypertrophy Loss of responsiveness to catecholamines
Diastolic dysfunction Cardiac output by 1% per year from age 30 Cardiac output by enlarging end diastolic volume Blunted tachycardia response
Respiratory Loss of elasticity Muscle atrophy Increased chest wall stiffness Impaired gas exchange Reduced response to hypercapnia and hypoxia
Loss of 50% ‘ breathing capacity’ by age 70 resting pO2
Closing volume* towards maximal chest expansion, particularly in supine position
Renal Reduced renal blood flow Lower glomerular filtration rate Impaired tubular function Asymptomatic urinary tract infection
glomerular filtration rate by 1ml min‐1 per year Impaired salt and water homeostasis makes fluid management difficult sensitivity to pharmacological insults
Drugs and metabolites accumulate Risk of endoprosthesis infection
Locomotor Reduced muscle bulk Osteoporosis Ligament laxity Arthritis
Risk of fractures, dislocation and exacerbation or arthritis when moving anaesthetised patient
Immune Solid organ atrophy T,B‐cell and macrophage function
Blunted response to infection (lack of fever and leukocytosis)
Liver Impaired oxidative function with normal glucuronidation
metabolism of some drugs
Gastrointestinal gut motility Gastro‐oesophageal reflux Constipation
Neurological Reduction in neuronal size and connectivity Neuronal loss, including spine and autonomic nervous system
Grey and white matter loss Impaired processing of information Cognitive impairment Reduced homeostatic autonomic responses
Sensory Presbyacusis Presbyopia Cataract Reduced sensory acuity
Deafness 35% Blindness 30% Impaired balance Pressure sores
Skin Atrophy, loss of collagen Bruising Tears, especially with adhesive dressings Pressure sores
*Thoracic volume at which small airways close
(Preston et al, 2008, Study)
6.4.6. Close attention to handling, temperature and fluid management can reduce the risks of
surgery in older people. Older people are also at increased risk of postoperative cognitive
dysfunction (POCD) and isolation in a dim room following surgery is particularly hazardous.
(Preston et al, 2008, Study)

28
Summary
There are clear examples of differential access to surgery by age and these differences are
not always justifiable. In some areas, older patients could sustain higher levels of surgical
intervention than is currently the case but, for this to be successful, the physiological
changes and special needs of older patients must be recognised. We have found no evidence
of the common occurrence of ‘heroic interventions’ surgical treatment that is inappropriate
given the age and frailty of the patient.
6.5. Accident and Emergency / Trauma care
6.5.1. Evidence of age discrimination in the provision of hospital accident and emergency services
is unclear. Older people complain of long waits in A&E and a survey carried out by the
Association of Community Health Councils for England and Wales (ACHCEW), reporting in
2001, confirmed that, on average patients 60 years and over waited longer than patients in
other age groups and that there was a tendency for the average wait to increase with age.
Older patients are much more likely than younger patients to be admitted to hospital from
A&E and the wait for a bed may account for some or all of the longer waiting times.
Studies report 46‐48% of over 65s admitted to hospital compared with 14‐20% of younger
patients (Alberti,2004, Review; Downing and Wilson, 2005, Large survey; British Geriatrics
Society, 2008, Guide)
Age Group Count Average wait
hrs:mins
% in group
Not Known 45 3:33 1.2%
<16 506 1:40 13.0%
16 ‐ 39 1063 2:50 27.3%
40 ‐ 59 747 3:41 19.2%
60 ‐ 69 383 4:53 9.8%
70 ‐ 79 546 4:22 14.0%
80+ 603 4:34 15.5%
Total 3893 3.35
(ACHCEW, 2001)

29
6.5.2. The perception is that older people form a high proportion of Accident and Emergency
cases but in reality, over 65s make up 15‐18% of A&E admissions.(Downing and Wilson,
2005; British Geriatrics Society, 2008) However, in relation to the numbers of older people
in the population the picture is very different. The attendance rate per 1,000 population is
much higher for those aged 80 and over.
Age‐specific rates of new A&E attendance with 95% confidence intervals
Downing and Wilson, 2005
6.5.3. Individual, high profile examples of poor care in Accident and Emergency departments,
particularly affecting older people and resulting in the deaths of patients, can and do occur.
A 2009 Healthcare Commission report into the treatment of patients at Stafford Hospital
between 2005 and 2008 found that 400 more people died than would be expected. The
report found that unqualified receptionists carried out initial checks on patients arriving at
the accident and emergency department, heart monitors were turned off in the emergency
assessment unit because nurses did not know how to use them, there were not enough
nurses to provide proper care, patients were "dumped" into a ward near A&E without
nursing care so the four‐hour A&E waiting time could be met and there was often no
experienced surgeon in the hospital during the night. (Healthcare Commission, 2009,
Review)
6.5.4. A 2000 study of the management of elderly blunt trauma victims in Scotland found that
significantly more of the elderly died than would be predicted. Once admitted to A&E,
older patients were less likely to be admitted to intensive care, less likely to be managed in

30
a resuscitation room, and less likely to be transferred to a regional neurosurgical care
centre. Age appeared to be an independent factor in the process of trauma care in Scottish
hospitals. (Grant, Henry and McNaughton, 2000, Large survey)
6.5.5. The Commission for Health Improvement 2004 survey of patient experience, including
A&E, found that, in general patient satisfaction with A&E increased with age, except for
those aged 80 plus who were generally less satisfied than younger older people. The main
exception to this was in satisfaction with the provision of information by medical staff
which peaked with 50‐59 year olds and declined thereafter. (Raleigh et al, 2004, Large
survey) Patient satisfaction is not however, in itself, an indication of the presence or
absence of age discrimination since individual patients have no yardstick against which to
measure their own experiences.
6.5.6. The Care Quality Commission’s 2008 survey of 50,000 patients attending accident and
emergency departments in 151 acute trusts across the NHS, although recording the age of
the patient in the survey questionnaire, does not publish the results of patient experiences
sub‐divided by age group, so it is not possible from published results to compare the
experiences of older and younger patients. (Care Quality Commission, 2008, large survey)
Summary
Evidence of age discrimination in accident and emergency care is mixed. Older people wait
longer in A & E but are more likely to be admitted to hospital. Older trauma victims are less
likely to be taken from A & E to intensive care, be managed in a resuscitation room or
transferred to a regional neurosurgical care centre.
6.6. High Dependency and Intensive Care Units
6.6.1. “Critical care is recognised to be one of the key acute hospital services. Unfortunately, due
to the competing demands of emergency and elective admissions, patient flow through the
entire hospital can be constrained by inadequate critical care capacity. Such constraints are
usually manifest as postponed operations for elective admissions and non‐clinical transfers
for emergency patients. Although the number of critical care beds has increased since 2000
it is unclear, in the face of greater hospital activity, whether the extra critical care capacity
is sufficient to prevent critical care from being a ‘bottleneck’ within the hospital system.”
(The Intensive Care Society’s and Department of Health’s Working Group on Patient Flows
in Critical Care, 2007)

31
6.6.2. Given the recognised shortage of critical care beds in the United Kingdom, it is inevitable
that rationing of some sort will take place. Evidence on whether age‐based rationing of
critical care beds is occurring is mixed. A 2003 study of 4,058 cases sampled every 12 days
for one year in South Wales and assessed by an expert panel without knowledge of the
patient’s age, concluded that there was no evidence of age discrimination although the
panel assessed that 48.3% of patients aged under 55, treated on a general ward, should
have been in critical care, compared with 54.4% of those aged 55 and over and 56.6% of
those aged 85 and over. (Hubbard et al, 2003, Large survey)
6.6.3. A study of elderly blunt trauma victims in Scotland found, for severely injured patients,
that the odds of being transferred to an intensive care unit at age 70 were only three
quarters those of being transferred at age 30, resulting in a higher than expected rate of
mortality for the elderly trauma victim (Grant, Henry and McNaughton, 2000, Large survey)
6.6.4. Although not indicative of age discrimination in the UK, a Canadian systematic review of
the rationing of critical care beds concluded that patients refused intensive care unit
admission had a hospital mortality rate three times greater than those admitted and that
age was a factor in the refusal of critical care. (Sinuff et al, 2004, Systematic review)
The number of ICU beds (triangles), HDU beds (squares) and total critical care beds (diamonds) in England reported in the bi annual critical care bed KH03a census.
(The Intensive Care Society’s and Department of Health’s Working Group on Patient Flows in Critical Care, 2007)
32
6.6.5. Others acknowledge that age‐based rationing in intensive care is taking place in the UK but
feel that it is justified. Clare Clarke, writing in the Journal of Advanced Nursing in 2001
concludes that “If age is to be used as a criterion to ration limited resources explicit
national guidelines need to be developed and applied consistently to ensure that arbitrary
differences in the treatment older people receive does not occur.” (Clarke, 2001, Opinion)
Summary
There is a recognised shortage of intensive care beds in the UK for patients of all ages but
the proportion of patients on a general ward who should have been in intensive care
increases with the age of the patient. An older trauma victim is much less likely than a
younger patient to be transferred to intensive care.
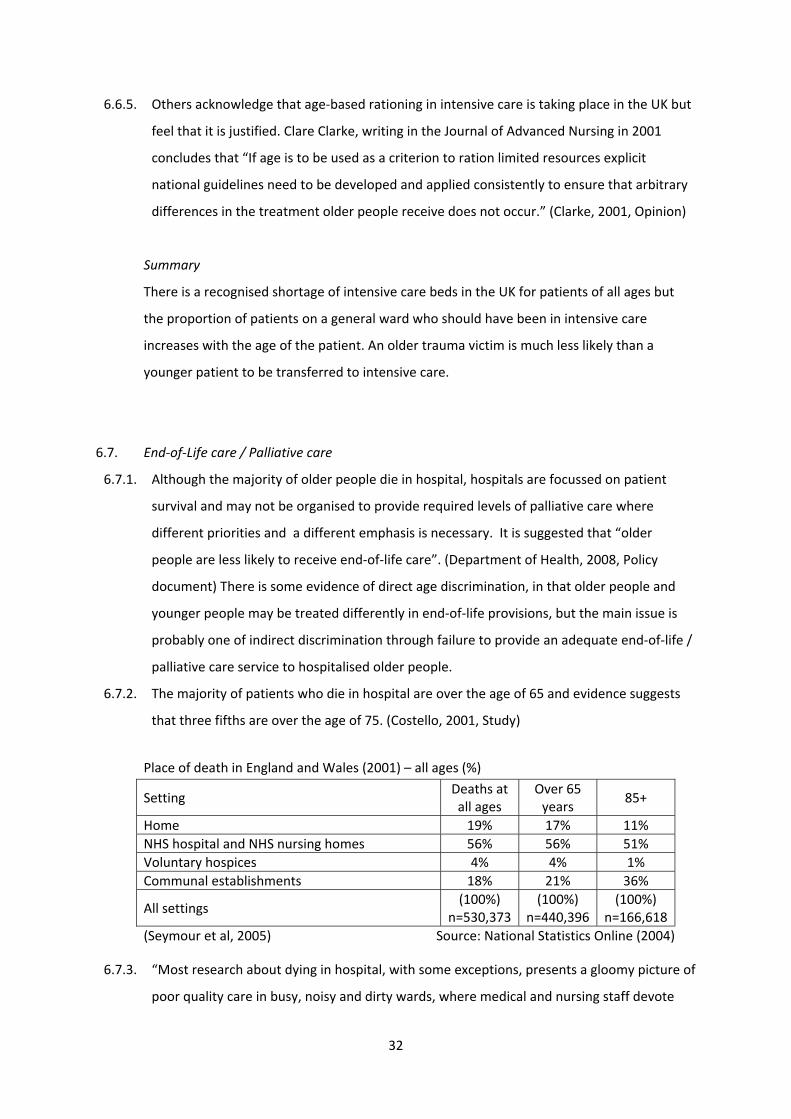
6.7. End‐of‐Life care / Palliative care
6.7.1. Although the majority of older people die in hospital, hospitals are focussed on patient
survival and may not be organised to provide required levels of palliative care where
different priorities and a different emphasis is necessary. It is suggested that “older
people are less likely to receive end‐of‐life care”. (Department of Health, 2008, Policy
document) There is some evidence of direct age discrimination, in that older people and
younger people may be treated differently in end‐of‐life provisions, but the main issue is
probably one of indirect discrimination through failure to provide an adequate end‐of‐life /
palliative care service to hospitalised older people.
6.7.2. The majority of patients who die in hospital are over the age of 65 and evidence suggests
that three fifths are over the age of 75. (Costello, 2001, Study)
Place of death in England and Wales (2001) – all ages (%)
Setting Deaths at all ages
Over 65 years
85+
Home 19% 17% 11% NHS hospital and NHS nursing homes 56% 56% 51% Voluntary hospices 4% 4% 1% Communal establishments 18% 21% 36%
All settings (100%)
n=530,373(100%)
n=440,396 (100%)
n=166,618(Seymour et al, 2005) Source: National Statistics Online (2004)
6.7.3. “Most research about dying in hospital, with some exceptions, presents a gloomy picture of
poor quality care in busy, noisy and dirty wards, where medical and nursing staff devote

33
little attention to the dying who are sometimes marginalised in side rooms” (Seymour et al,
2005, Study ‐ referencing Rogers et al, 2000, Study)
6.7.4. A 2001 end‐of‐life care survey of hospital patients, nurses and physicians found that “the
care of older dying patients was defined by a lack of 'emotional engagement' with the
patient and the institutionalized nondisclosure of information about death and dying.”
“Although nurses provide individual care to dying patients, much of this was aimed at
meeting patients' physical needs.” (Costello, 2001, Small survey)
6.7.5. “There is evidence that death in hospital is sometimes poorly managed with inadequate
symptom control, poor support for patient and carers and little clear and open
communication about prognosis and treatment.” (Seymour et al, 2005, Study – referencing
Costello, 2001, Small survey)
6.7.6. A 2005 study by researchers from the University of Sheffield, on behalf of Help the Aged,
looking at end‐of‐life care, reported earlier findings that, whereas most people die in
hospital, that is not the place in which most people want to die. “About half of all deaths
do not take place in the setting that the dying person prefers.” The study also highlighted
possible examples of direct age discrimination. “.. .across all regions in England, older
people with cancer are less like to die at home than younger people... only 8.5% of those
aged over 85 dying of cancer die in a hospice, compared with 20% of all cancer deaths”
(Seymour et al, 2005, Study)
6.7.7. These findings are confirmed by a national telephone survey carried out by the Cicely
Saunders Foundation in 2002 (Higginson, 2003, Survey) presented as evidence to the 2004
House of Commons Health Committee enquiry into hospice and palliative care. (National
Council for Hospice and Specialist Palliative Care Services, 2004, Review)
Preferences versus reality: Where patients want to be cared for and where they actually die
Place of death Preferred place of
death Actual place of death
– all causes
Actual place of death – cancer principal
cause Home 56% 20% 25% Hospice 24% 4% 17% Hospital 11% 56% 47%
Care Home 4% 20% 12% (National Council for Hospice and Specialist Palliative Care Services, 2004)
6.7.8. Palliative care services for cancer patients are generally recognised as more advanced than
those for other terminally ill patients, but cancer is not the main cause of death for the
oldest patients.

34
6.7.9. “The prevalence of symptoms in people with a non‐cancer diagnosis has many similarities
to that for people with cancer. But only 1% of those with a non‐cancer diagnosis have
access to specialist community teams in the last year of life compared with 40% of those
with cancer.” (National Council for Hospice and Specialist Palliative Care Services, 2004,
Review)
Major cause of death by sex and age, 2003
England and Wales Men Women
45‐64 65‐84 85+ 45‐64 65‐84 85+
Respiratory diseases 7% 14% 21% 8% 14% 18%Cancer 37% 32% 18% 53% 29% 11%Injury and poisoning 6% 1% 2% 4% 2% 2%Infectious diseases 1% 1% 1% 1% 1% 1%Circulatory diseases 35% 41% 42% 21% 40% 44% 644 4,316 18,803 404 3,122 16,219
Source: National Statistics Online (2009) 6.7.10. “Around 83% of all deaths are of people aged 65 and over and it might reasonably be
expected that a similar percentage of people of that age would gain access to specialist
palliative care services. However the percentages range from under 60% to 68%, well
under the 83%. It would be important to understand the reasons for that in order to be
able to discount any possibility of age discrimination.” (National Council for Hospice and
Specialist Palliative Care Services, 2004, Review)
Summary
Older patients do not receive equivalent levels of end‐of‐life care to those received by
younger patients. In part this is explained by the better end‐of‐life care received by cancer
patients who are, on average, younger, but age appears to be an independent factor both in
place of death and access to specialist care.
6.8. Resuscitation
6.8.1. ‘Do not resuscitate’ (DNR), ‘do not attempt resuscitation’ (DNAR), ‘not for resuscitation’
(NFR), and ‘allow natural death’ (AND) instructions on patient notes have been a cause for
concern by older people’s organisations with a suspicion that, because of ageist attitudes in
the NHS, older people are more likely to receive such orders, based solely on their age.
(Ebrahim, 2000, Opinion) There is also a suspicion that, once a DNR order has been
35
imposed, it affects not just the decision about whether or not to use cardiopulmonary
resuscitation but also the general level of care that a patient receives (Dangoor, 2001,
Opinion)
6.8.2. Concern was such that resuscitation gained a particular mention in the National Service
Framework for Older People. “Specific concerns have been raised about resuscitation
policies, and whether older people are more likely to be denied cardiopulmonary
resuscitation on the grounds of age alone. ... local resuscitation policies should be based
on the guidelines issued by the BMA, RCN and Resuscitation Council, and should be
regularly audited to prevent age discrimination.” (Department of Health, 2001, Policy
document)
6.8.3. Despite these concerns, firm evidence of age discrimination in the application of DNR /
DNAR orders is limited. A 2004 UK study of the application of DNAR orders following
cardiac surgery found that, while DNR orders appeared more than twice as frequently in
patients aged 70 or over, multiple organ failure scores were similar for DNR patients in the
two age groups suggesting that severity of illness was more important than age in
determining resuscitation status. (Mackay et al, 2004, Large survey)
6.8.4. Joint guidance on resuscitation has been issued by the British Medical Association, the
Resuscitation Council (UK) and the Royal College of Nursing which indicates that DNR
orders should only be issued by senior medical staff and should not normally be issued
without consulting the patient or their family. A 2005 study of 58 DNR cases found that
while all orders were issued by senior medical staff, in only 10% of cases had the patient
been consulted and the family were involved in only 36% of cases. In addition, only one
third of patient notes indicated clearly whether the order applied only to cardiopulmonary
resuscitation. (Harris and Linnane, 2005, Small survey)
Summary
Suspicion of ageism in the application of ‘Do Not Resuscitate’ order is widespread but,
although there is firm evidence that guidelines on consultation are often not being adhered
to, there is no firm evidence of age discrimination in their application.
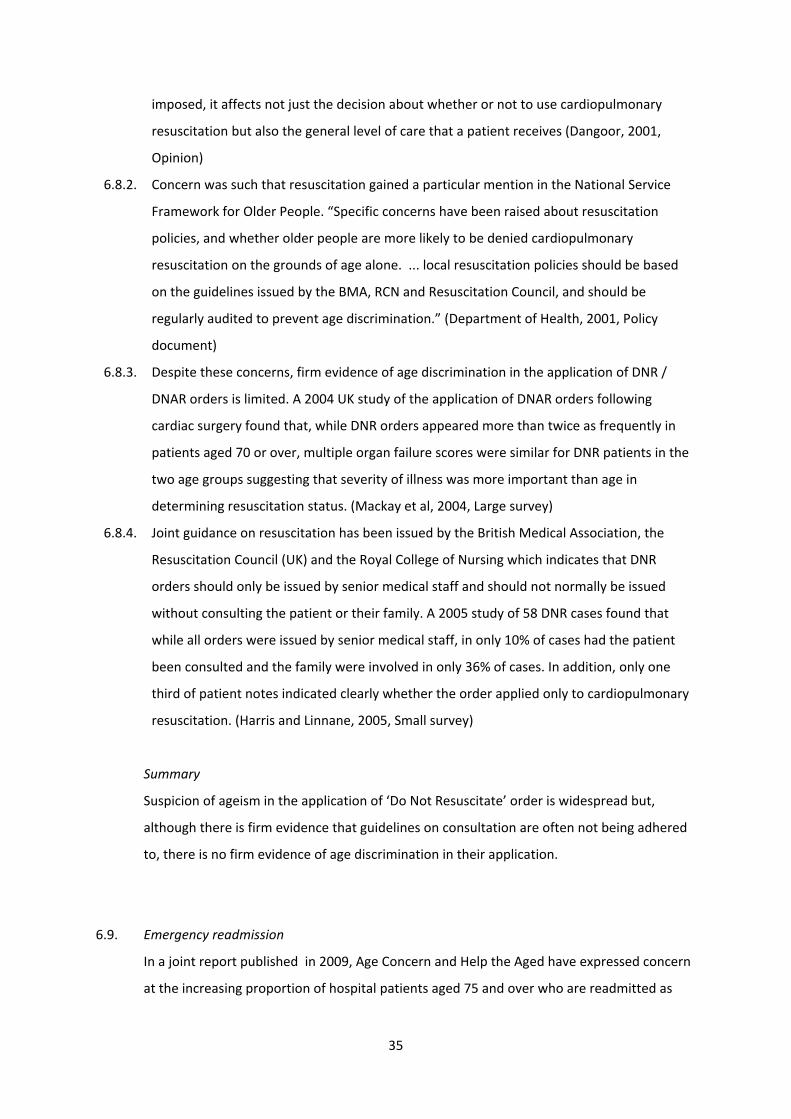
6.9. Emergency readmission
In a joint report published in 2009, Age Concern and Help the Aged have expressed concern
at the increasing proportion of hospital patients aged 75 and over who are readmitted as
36
emergency admissions within one month of discharge. (Harrop et al, 2009, Policy document)
It is not clear how much of the higher rate for older people results from increased frailty and
how much from poorer standards of care. Nor can we easily ascertain how much of the
increase in that rate (a 27% increase between 1998‐9 and 2006‐7) can be attributed to an
insufficiently high standard of hospital care or premature or insufficiently well planned
discharge.
Summary
The high, and increasing, rates of hospital readmission within 28 days of hospital discharge,
for older patients, is a clear indication of problems with the hospital care or discharge
procedures for this group. This would appear to be a case of indirect discrimination, where
universally applied policies are particularly disadvantageous to older people.
7. Areas of discrimination in the treatment of particular conditions
7.1. Oncology (Cancer)
7.1.1. Cancer is more common in later life. Around one‐third of all cancers are diagnosed in
people over 75 who form only around 7% of the population. (NHS Scotland, 2001, Review)
7.1.2. Oncology professionals may, on average, have negative attitudes towards older people. A
study carried out at a regional cancer centre in the UK in 1999, using Kogan’s Old People

37
Scale showed that all professionals tested, medical staff, nursing staff and radiographers,
male and female, had similar levels of negativity towards older people. (Kearney et al,
2000, Survey) The study did not, however, reveal how oncology professionals compare
with other groups of professionals or with the population in general.
Is this possible negative attitude towards older people reflected in service provision?
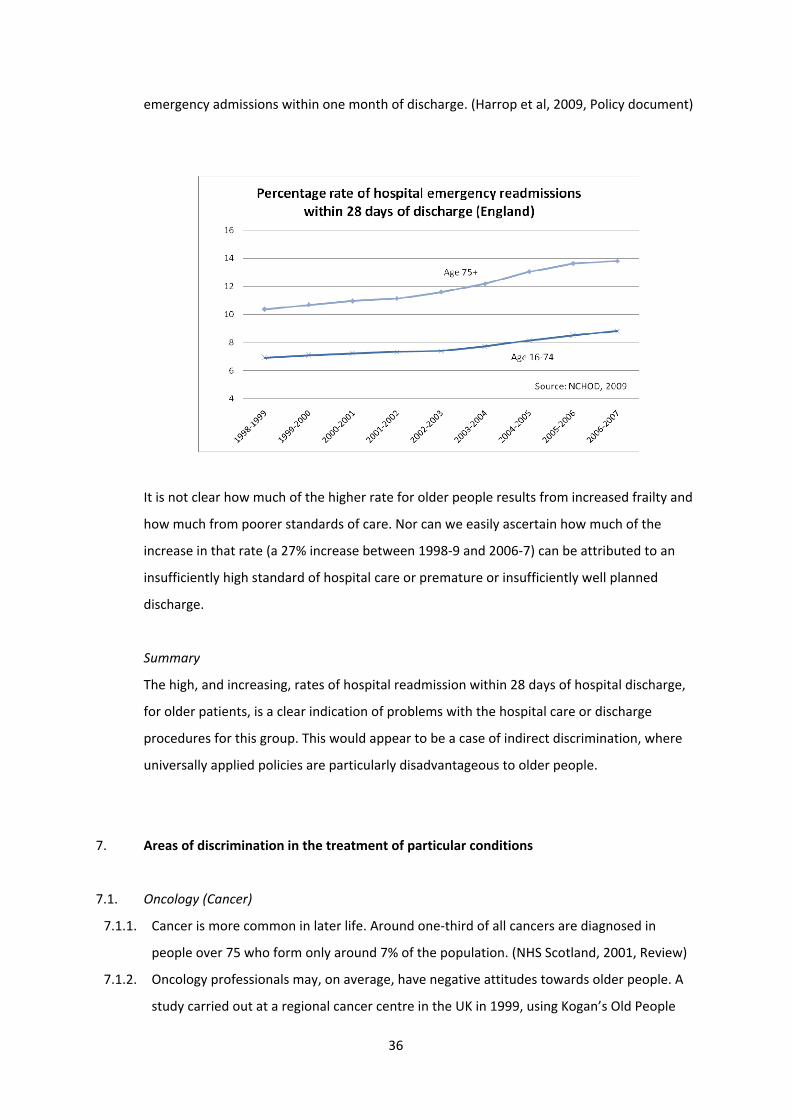
7.1.3. The following studies of cancer care in older patients show that fewer diagnostic and
staging procedures and less treatment is carried out with advancing age and that disease
specific survival rates decline with age.
7.1.4. Turner, Haward, Mulley and Selby used data from the Yorkshire Cancer Registry, covering a
population of 3.7 million, to illustrate the point using histological confirmation as a marker
for the adequacy of investigation.
Proportion (%) of cancers confirmed by histology, cancer patients with no definite treatment and cancer patients surviving five years, by age group, Yorkshire 1989‐93
Confirmed by histology No definite treatment Five year survival*
Site 0‐64 65‐74 75+ 0‐64 65‐74 75+ 0‐64 65‐74 75+
Breast 97 91 63 1 4 11 71 68 54
Colon 95 89 75 9 16 31 43 39 37
Lung 80 70 44 32 48 76 8 5 2
Prostate 94 91 78 6 8 15 46 46 42
Skin (non‐melanoma) 98 98 96 1 1 2 98 99 100
Stomach 90 86 70 32 44 66 16 11 9
*Excludes deaths from other causes
(Turner et al, 1999)
7.1.5. An analysis of all hospital treatment of colorectal cancer patients in Scotland between 1992
and 1996 revealed that, when all other factors have been controlled for, age is a significant
determining factor in both level of investigation and treatment received. Older patients are
less likely to receive a full investigation, as indicated by histology, and also less likely to
receive definitive surgery or chemotherapy.
75‐84 year olds were 2.7 times less likely and 85+ year olds 4.8 times less likely than the 17‐
54 age group to receive histological verification.
75‐84 year olds were 20% less likely to receive definitive surgery and those aged 85 and
over 55% less likely to receive definitive surgery than those in the 17‐54 age group.
About one third (32.8%) of 17‐54 year olds and one fifth (18.5%) of 55‐64 year olds
received chemotherapy. However in the oldest age groups only 47 patients aged 75‐84

38
(1.4%) and 1 patient aged 85+ (0.1%) received this treatment.
Number of patients within each age‐band and unadjusted results for each of the outcome variables (percentages are shown in brackets).
Age‐band
Patients Histological verification
Chemotherapy Definitive surgery
17‐54 1319 1260 (95.5) 433 (32.8) 1061 (80.4)
55‐64 2486 2348 (94.4) 459 (18.5) 2046 (82.3)
65‐74 4341 4012 (92.4) 411 (9.5) 3533 (81.4)
75‐84 3445 3036 (88.1) 47 (1.4) 2606 (75.6)
85+ 1185 925 (78.1) 1 (0.1) 729 (61.5)
Total 12776 11581 (90.6) 1351 (10.6) 9977 (78.1)
This study made efforts to correct for co‐morbidity [noting hospital admission in the
previous two years with a principal diagnosis of diabetes, hypertension, ischaemic heart
disease, other heart disease, cerebro‐vascular disease, respiratory disease or arthritis],
tumour sub‐site [known to vary with age], whether the admission was an emergency [known
to be associated with a poorer outcome], sex and an indicator of deprivation. (Austin and
Russell, 2003, Large survey)
Percentage of patients referred for histological confirmation
Type of patient Age <65 Age 65‐74 Age 75+
All patients 89 86 80
No COPD 93 87 81
Percentage of patients receiving treatment within 6 months of bronchoscopy
Type of treatment Age <65 Age 65‐74 Age 75+
All active treatments 78 67 49
NSCLC ‐ % Surgery 19 12 6
SCLC ‐ % Chemotherapy 77 66 48
% Radiotherapy 45 47 39
n=1,652 (Peake et al, 2003,Large survey)
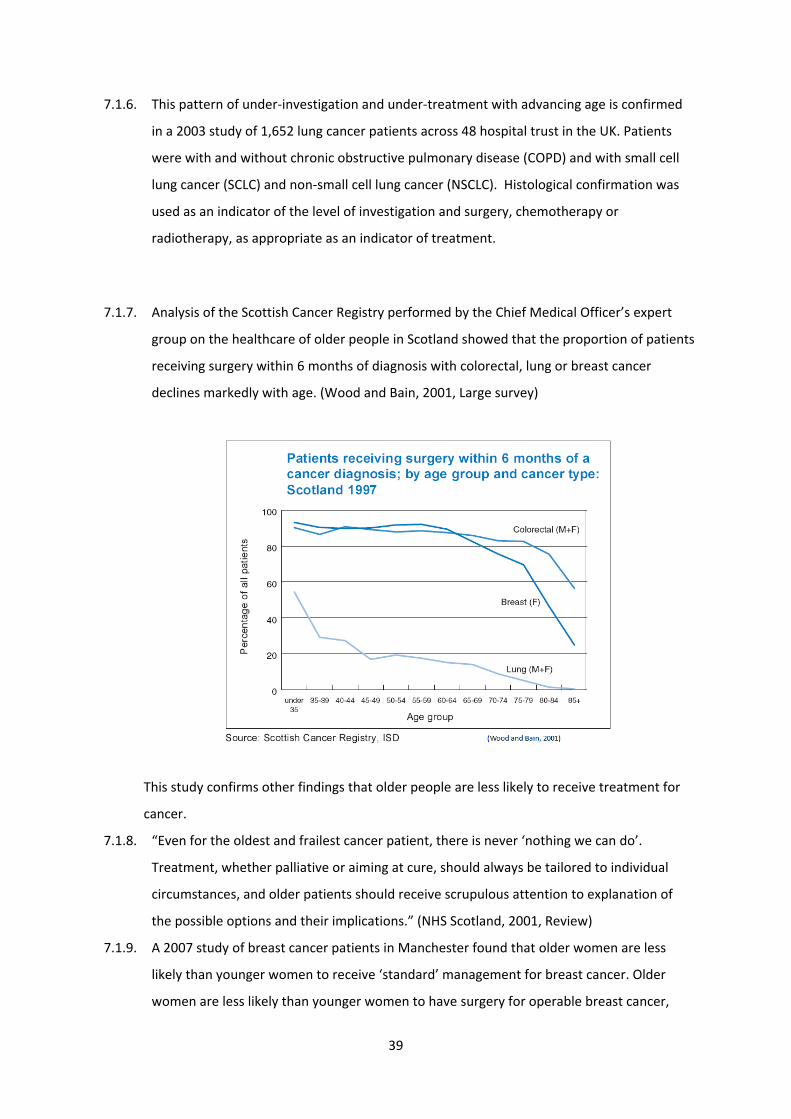
39
7.1.6. This pattern of under‐investigation and under‐treatment with advancing age is confirmed
in a 2003 study of 1,652 lung cancer patients across 48 hospital trust in the UK. Patients
were with and without chronic obstructive pulmonary disease (COPD) and with small cell
lung cancer (SCLC) and non‐small cell lung cancer (NSCLC). Histological confirmation was
used as an indicator of the level of investigation and surgery, chemotherapy or
radiotherapy, as appropriate as an indicator of treatment.
7.1.7. Analysis of the Scottish Cancer Registry performed by the Chief Medical Officer’s expert
group on the healthcare of older people in Scotland showed that the proportion of patients
receiving surgery within 6 months of diagnosis with colorectal, lung or breast cancer
declines markedly with age. (Wood and Bain, 2001, Large survey)
This study confirms other findings that older people are less likely to receive treatment for
cancer.
7.1.8. “Even for the oldest and frailest cancer patient, there is never ‘nothing we can do’.
Treatment, whether palliative or aiming at cure, should always be tailored to individual
circumstances, and older patients should receive scrupulous attention to explanation of
the possible options and their implications.” (NHS Scotland, 2001, Review)
7.1.9. A 2007 study of breast cancer patients in Manchester found that older women are less
likely than younger women to receive ‘standard’ management for breast cancer. Older
women are less likely than younger women to have surgery for operable breast cancer,
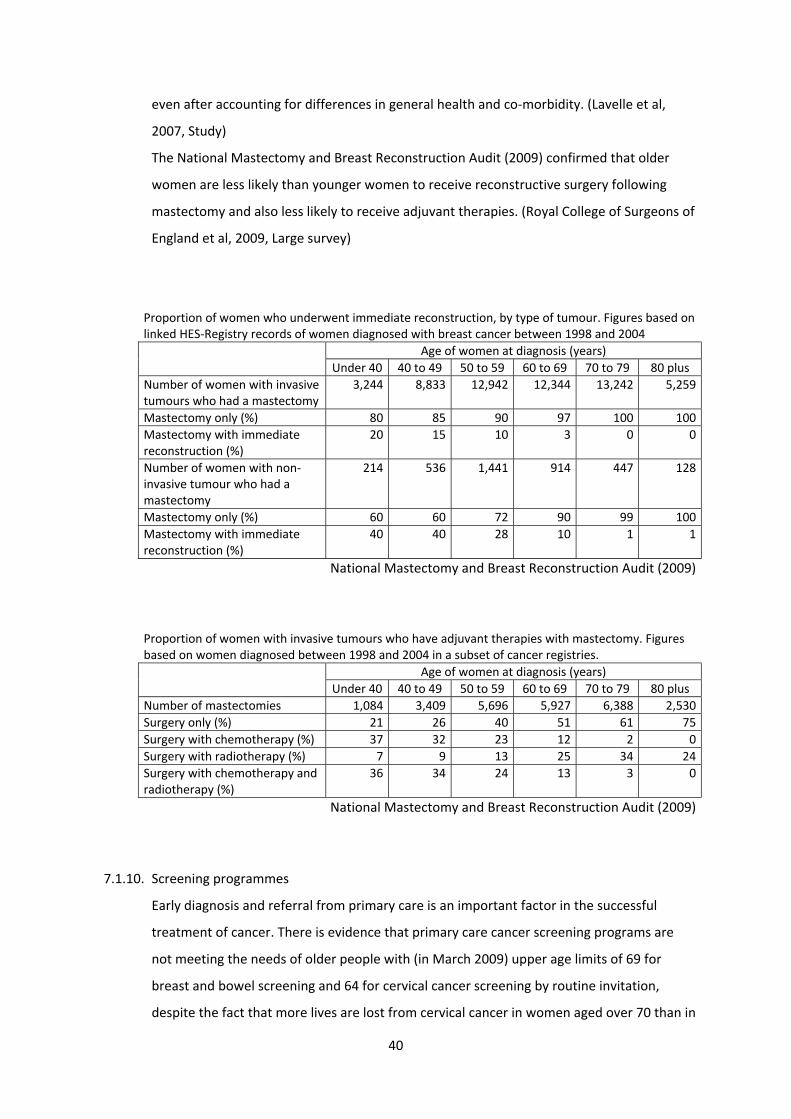
40
even after accounting for differences in general health and co‐morbidity. (Lavelle et al,
2007, Study)
The National Mastectomy and Breast Reconstruction Audit (2009) confirmed that older
women are less likely than younger women to receive reconstructive surgery following
mastectomy and also less likely to receive adjuvant therapies. (Royal College of Surgeons of
England et al, 2009, Large survey)
Proportion of women who underwent immediate reconstruction, by type of tumour. Figures based on linked HES‐Registry records of women diagnosed with breast cancer between 1998 and 2004 Age of women at diagnosis (years)
Under 40 40 to 49 50 to 59 60 to 69 70 to 79 80 plusNumber of women with invasive tumours who had a mastectomy
3,244 8,833 12,942 12,344 13,242 5,259
Mastectomy only (%) 80 85 90 97 100 100Mastectomy with immediate reconstruction (%)
20 15 10 3 0 0
Number of women with non‐invasive tumour who had a mastectomy
214 536 1,441 914 447 128
Mastectomy only (%) 60 60 72 90 99 100Mastectomy with immediate reconstruction (%)
40 40 28 10 1 1
National Mastectomy and Breast Reconstruction Audit (2009)
Proportion of women with invasive tumours who have adjuvant therapies with mastectomy. Figures based on women diagnosed between 1998 and 2004 in a subset of cancer registries. Age of women at diagnosis (years)
Under 40 40 to 49 50 to 59 60 to 69 70 to 79 80 plusNumber of mastectomies 1,084 3,409 5,696 5,927 6,388 2,530Surgery only (%) 21 26 40 51 61 75Surgery with chemotherapy (%) 37 32 23 12 2 0Surgery with radiotherapy (%) 7 9 13 25 34 24Surgery with chemotherapy and radiotherapy (%)
36 34 24 13 3 0
National Mastectomy and Breast Reconstruction Audit (2009)
7.1.10. Screening programmes
Early diagnosis and referral from primary care is an important factor in the successful
treatment of cancer. There is evidence that primary care cancer screening programs are
not meeting the needs of older people with (in March 2009) upper age limits of 69 for
breast and bowel screening and 64 for cervical cancer screening by routine invitation,
despite the fact that more lives are lost from cervical cancer in women aged over 70 than in
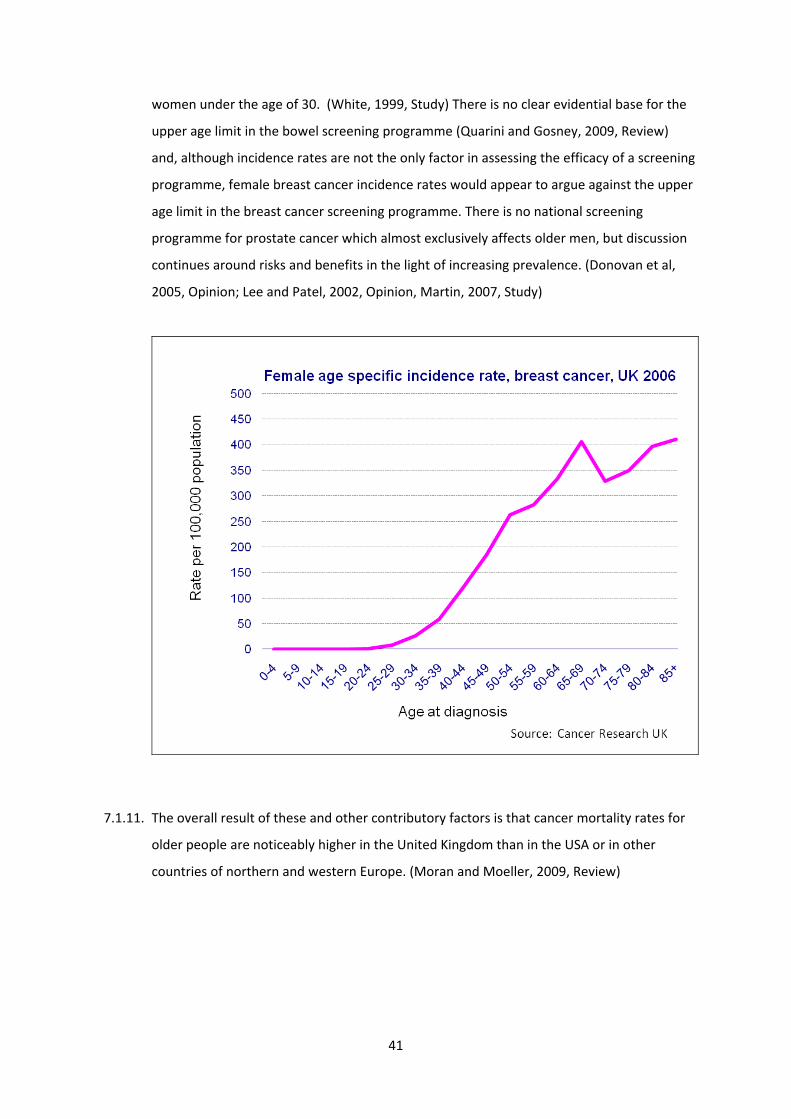
41
women under the age of 30. (White, 1999, Study) There is no clear evidential base for the
upper age limit in the bowel screening programme (Quarini and Gosney, 2009, Review)
and, although incidence rates are not the only factor in assessing the efficacy of a screening
programme, female breast cancer incidence rates would appear to argue against the upper
age limit in the breast cancer screening programme. There is no national screening
programme for prostate cancer which almost exclusively affects older men, but discussion
continues around risks and benefits in the light of increasing prevalence. (Donovan et al,
2005, Opinion; Lee and Patel, 2002, Opinion, Martin, 2007, Study)
7.1.11. The overall result of these and other contributory factors is that cancer mortality rates for
older people are noticeably higher in the United Kingdom than in the USA or in other
countries of northern and western Europe. (Moran and Moeller, 2009, Review)

42
Age specific cancer mortality rates, 2003‐2005
Northern Europe = Denmark. Finland, Iceland, Norway, SwedenWestern Europe = Austria, France, Germany, Luxembourg, Netherlands, Switzerland
Moran and Moeller, 2009
Summary
There is clear, multiple and widespread evidence of a reduction in the investigation and
treatment of cancers with the increasing age of the patient. The link with age appears to be
clear even when other factors such as co‐morbidity and tumour subsite are taken into
account. The net result is that age specific mortality rates for older people dying from cancer
are higher in the UK than in northern or western Europe or the USA.
7.2. Cardiology
7.2.1. There is a strong body of evidence that older people attending hospital with heart disease
are less likely to be fully investigated and less likely to receive treatment than younger
people. The differences are so marked that they are unlikely to be accounted for by co‐
morbidity or frailty in the older patient.

43
7.2.2. Although revascularisation rates increase with age up to the 65‐69 year age group the rate
declines in older age groups. For the period 1990‐2000, the percentage increase in
treatment has been most marked in the older age groups and the average age of patients
undergoing coronary revascularisation has increased. (Wood and Bain, 2001, Large survey)
7.2.3. Doctors may be reluctant to refer older patients for CABG because of the perceived risk but
risks are very dependent on the urgency of treatment. Coronary artery bypass grafting in
octogenarians carries a mortality of 33% for emergency surgery and 14% for urgent surgery
compared with 3% for elective surgery. (Preston et al, 2008, study ‐ referencing Alexander
and Peterson, 1997, Study)
7.2.4. The following two studies of the treatment of heart disease in district general hospitals in
England reveal similar patterns in the investigation and treatment of older patients. In the
first study of 1,790 patients with acute myocardial infarction (heart attack), those aged 75
and over are much less likely to have an echocardiogram, exercise tolerance tests or
cardiac catheterisation study. Excluding patients with contra‐indications, patients age 75
and over are much less likely to receive thrombolysis or secondary prevention treatment.
(Dudley et al, 2002, Large survey)
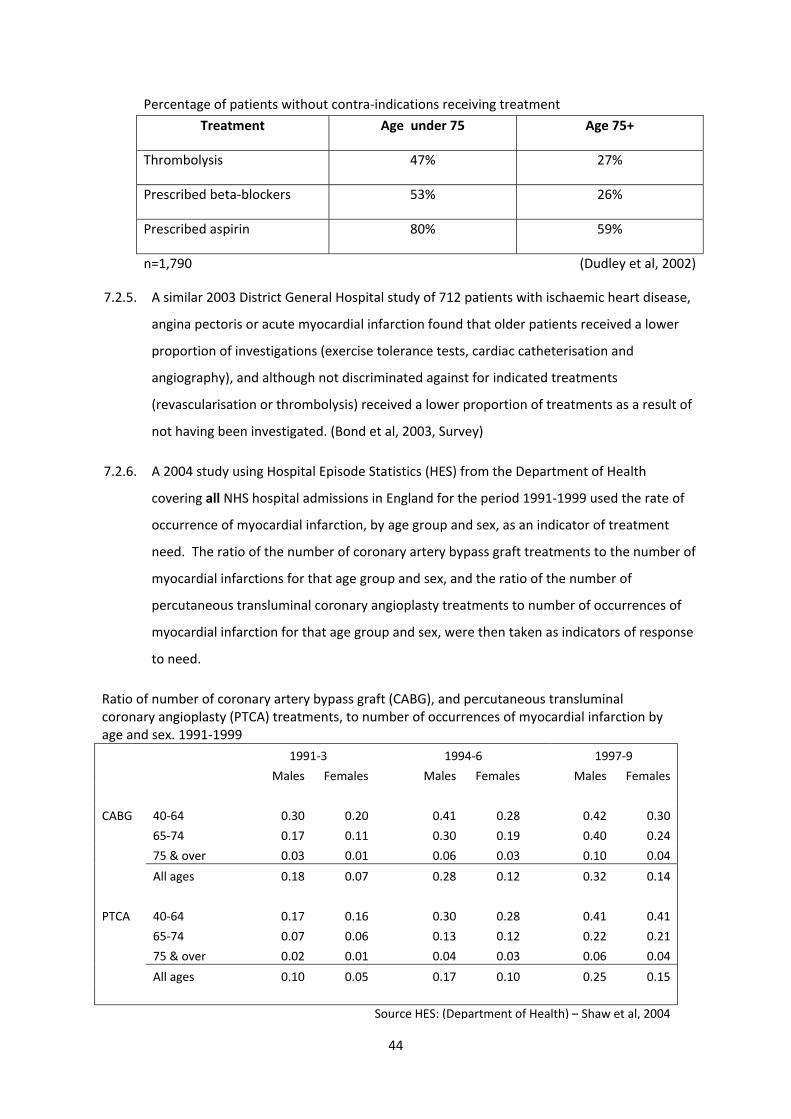
44
Percentage of patients without contra‐indications receiving treatment
Treatment Age under 75 Age 75+
Thrombolysis 47% 27%
Prescribed beta‐blockers 53% 26%
Prescribed aspirin 80% 59%
n=1,790 (Dudley et al, 2002)
7.2.5. A similar 2003 District General Hospital study of 712 patients with ischaemic heart disease,
angina pectoris or acute myocardial infarction found that older patients received a lower
proportion of investigations (exercise tolerance tests, cardiac catheterisation and
angiography), and although not discriminated against for indicated treatments
(revascularisation or thrombolysis) received a lower proportion of treatments as a result of
not having been investigated. (Bond et al, 2003, Survey)
7.2.6. A 2004 study using Hospital Episode Statistics (HES) from the Department of Health
covering all NHS hospital admissions in England for the period 1991‐1999 used the rate of
occurrence of myocardial infarction, by age group and sex, as an indicator of treatment
need. The ratio of the number of coronary artery bypass graft treatments to the number of
myocardial infarctions for that age group and sex, and the ratio of the number of
percutaneous transluminal coronary angioplasty treatments to number of occurrences of
myocardial infarction for that age group and sex, were then taken as indicators of response
to need.
Ratio of number of coronary artery bypass graft (CABG), and percutaneous transluminal coronary angioplasty (PTCA) treatments, to number of occurrences of myocardial infarction by age and sex. 1991‐1999
1991‐3 1994‐6 1997‐9
Males Females Males Females Males Females
CABG 40‐64 0.30 0.20 0.41 0.28 0.42 0.30
65‐74 0.17 0.11 0.30 0.19 0.40 0.24
75 & over 0.03 0.01 0.06 0.03 0.10 0.04
All ages 0.18 0.07 0.28 0.12 0.32 0.14
PTCA 40‐64 0.17 0.16 0.30 0.28 0.41 0.41
65‐74 0.07 0.06 0.13 0.12 0.22 0.21
75 & over 0.02 0.01 0.04 0.03 0.06 0.04
All ages 0.10 0.05 0.17 0.10 0.25 0.15
Source HES: (Department of Health) – Shaw et al, 2004
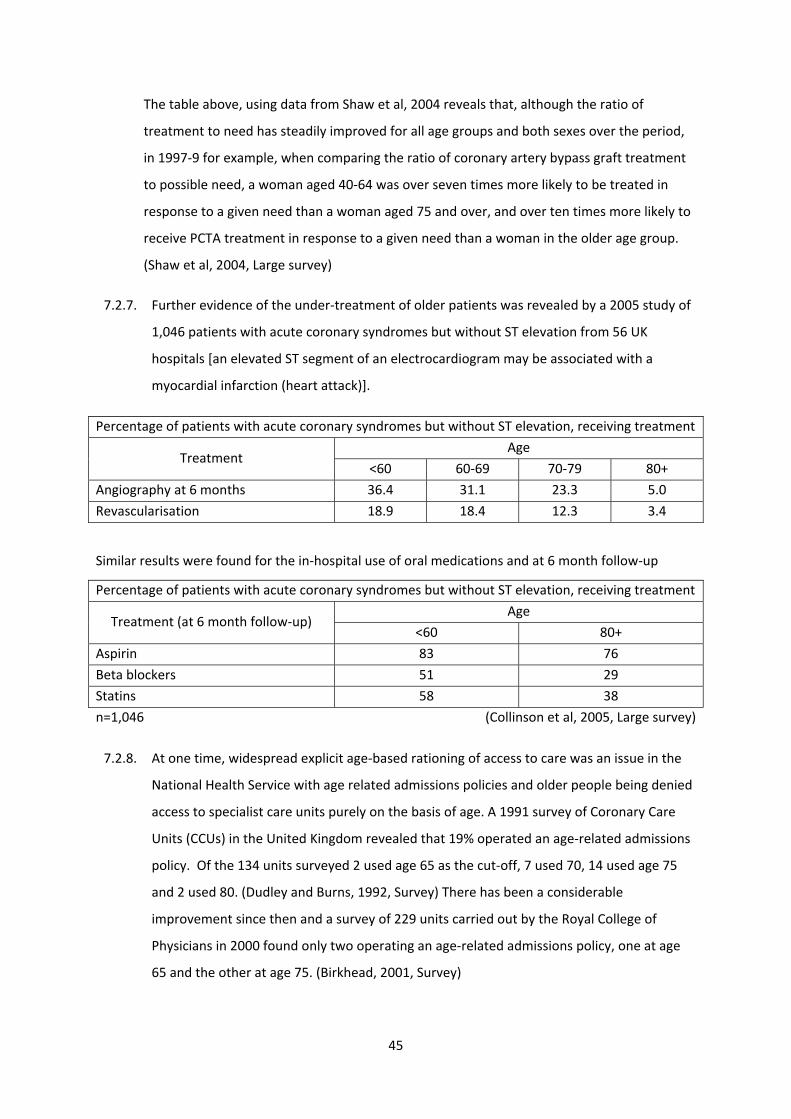
45
The table above, using data from Shaw et al, 2004 reveals that, although the ratio of
treatment to need has steadily improved for all age groups and both sexes over the period,
in 1997‐9 for example, when comparing the ratio of coronary artery bypass graft treatment
to possible need, a woman aged 40‐64 was over seven times more likely to be treated in
response to a given need than a woman aged 75 and over, and over ten times more likely to
receive PCTA treatment in response to a given need than a woman in the older age group.
(Shaw et al, 2004, Large survey)
7.2.7. Further evidence of the under‐treatment of older patients was revealed by a 2005 study of
1,046 patients with acute coronary syndromes but without ST elevation from 56 UK
hospitals [an elevated ST segment of an electrocardiogram may be associated with a
myocardial infarction (heart attack)].
Percentage of patients with acute coronary syndromes but without ST elevation, receiving treatment
Treatment Age
<60 60‐69 70‐79 80+
Angiography at 6 months 36.4 31.1 23.3 5.0
Revascularisation 18.9 18.4 12.3 3.4
Similar results were found for the in‐hospital use of oral medications and at 6 month follow‐up
Percentage of patients with acute coronary syndromes but without ST elevation, receiving treatment
Treatment (at 6 month follow‐up) Age
<60 80+
Aspirin 83 76
Beta blockers 51 29
Statins 58 38
n=1,046
(Collinson et al, 2005, Large survey)
7.2.8. At one time, widespread explicit age‐based rationing of access to care was an issue in the
National Health Service with age related admissions policies and older people being denied
access to specialist care units purely on the basis of age. A 1991 survey of Coronary Care
Units (CCUs) in the United Kingdom revealed that 19% operated an age‐related admissions
policy. Of the 134 units surveyed 2 used age 65 as the cut‐off, 7 used 70, 14 used age 75
and 2 used 80. (Dudley and Burns, 1992, Survey) There has been a considerable
improvement since then and a survey of 229 units carried out by the Royal College of
Physicians in 2000 found only two operating an age‐related admissions policy, one at age
65 and the other at age 75. (Birkhead, 2001, Survey)
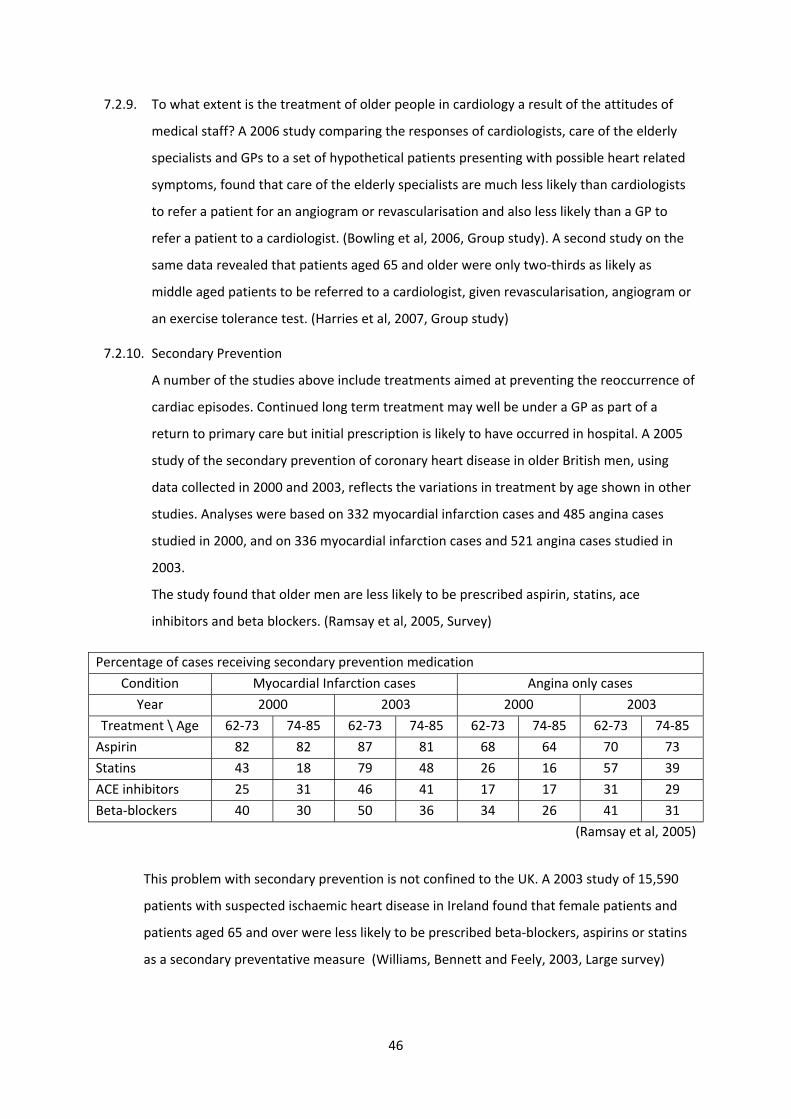
46
7.2.9. To what extent is the treatment of older people in cardiology a result of the attitudes of
medical staff? A 2006 study comparing the responses of cardiologists, care of the elderly
specialists and GPs to a set of hypothetical patients presenting with possible heart related
symptoms, found that care of the elderly specialists are much less likely than cardiologists
to refer a patient for an angiogram or revascularisation and also less likely than a GP to
refer a patient to a cardiologist. (Bowling et al, 2006, Group study). A second study on the
same data revealed that patients aged 65 and older were only two‐thirds as likely as
middle aged patients to be referred to a cardiologist, given revascularisation, angiogram or
an exercise tolerance test. (Harries et al, 2007, Group study)
7.2.10. Secondary Prevention
A number of the studies above include treatments aimed at preventing the reoccurrence of
cardiac episodes. Continued long term treatment may well be under a GP as part of a
return to primary care but initial prescription is likely to have occurred in hospital. A 2005
study of the secondary prevention of coronary heart disease in older British men, using
data collected in 2000 and 2003, reflects the variations in treatment by age shown in other
studies. Analyses were based on 332 myocardial infarction cases and 485 angina cases
studied in 2000, and on 336 myocardial infarction cases and 521 angina cases studied in
2003.
The study found that older men are less likely to be prescribed aspirin, statins, ace
inhibitors and beta blockers. (Ramsay et al, 2005, Survey)
Percentage of cases receiving secondary prevention medication
Condition Myocardial Infarction cases Angina only cases
Year 2000 2003 2000 2003
Treatment \ Age 62‐73 74‐85 62‐73 74‐85 62‐73 74‐85 62‐73 74‐85
Aspirin 82 82 87 81 68 64 70 73
Statins 43 18 79 48 26 16 57 39
ACE inhibitors 25 31 46 41 17 17 31 29
Beta‐blockers 40 30 50 36 34 26 41 31
(Ramsay et al, 2005)
This problem with secondary prevention is not confined to the UK. A 2003 study of 15,590
patients with suspected ischaemic heart disease in Ireland found that female patients and
patients aged 65 and over were less likely to be prescribed beta‐blockers, aspirins or statins
as a secondary preventative measure (Williams, Bennett and Feely, 2003, Large survey)
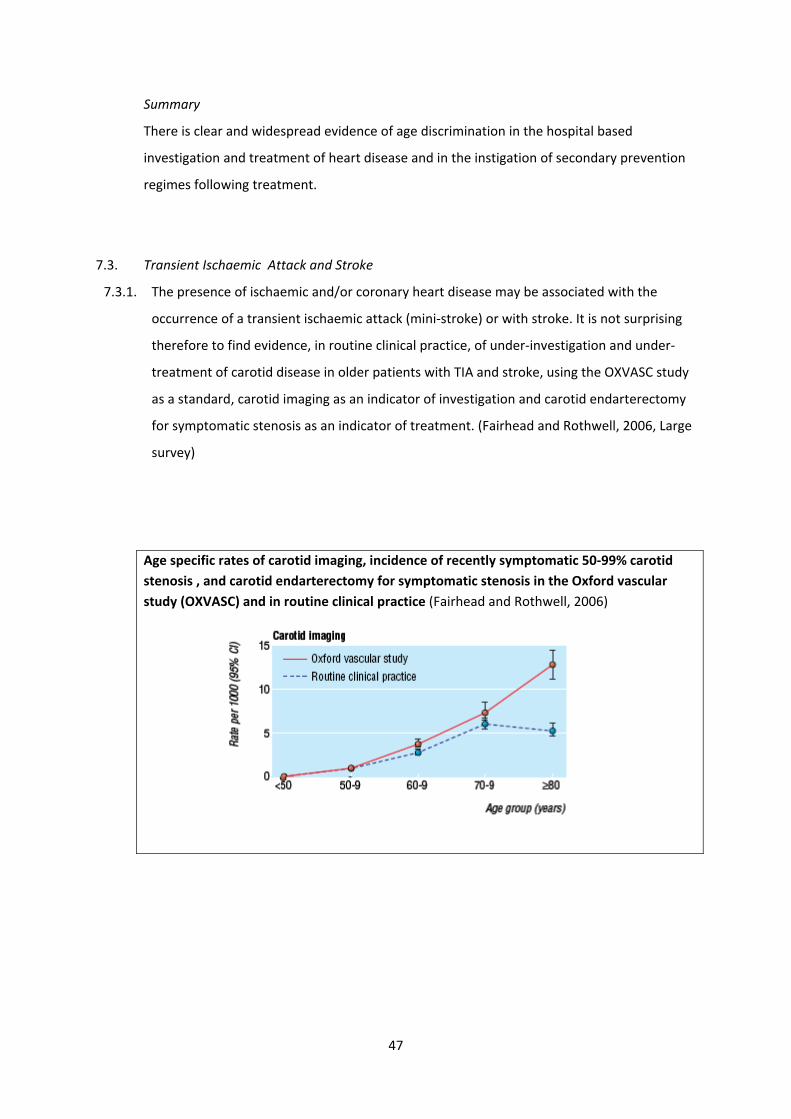
47
Summary
There is clear and widespread evidence of age discrimination in the hospital based
investigation and treatment of heart disease and in the instigation of secondary prevention
regimes following treatment.
7.3. Transient Ischaemic Attack and Stroke
7.3.1. The presence of ischaemic and/or coronary heart disease may be associated with the
occurrence of a transient ischaemic attack (mini‐stroke) or with stroke. It is not surprising
therefore to find evidence, in routine clinical practice, of under‐investigation and under‐
treatment of carotid disease in older patients with TIA and stroke, using the OXVASC study
as a standard, carotid imaging as an indicator of investigation and carotid endarterectomy
for symptomatic stenosis as an indicator of treatment. (Fairhead and Rothwell, 2006, Large
survey)
Age specific rates of carotid imaging, incidence of recently symptomatic 50‐99% carotid stenosis , and carotid endarterectomy for symptomatic stenosis in the Oxford vascular study (OXVASC) and in routine clinical practice (Fairhead and Rothwell, 2006)

48
7.3.2. Young and others argue that carotid endarterectomy ( a re‐bore of the carotid artery) as a
treatment for symptomatic carotid artery stenosis is more beneficial for older people than
for younger people because of their increases risk of future stroke. (Young, 2006, Opinion)
7.3.3. The impact of stroke is high in terms of mortality, morbidity and expenditure. It is the third
most common cause of death and a major cause of adult disability. Specialist care in stroke
units has been shown to reduce mortality and morbidity regardless of the age or gender of
the patient or severity of the stroke. The 2004 National Sentinel Audit of stroke, an audit
of 246 hospitals and 8,718 patients in England, Wales and Northern Ireland with a 100%
response rate, revealed that while 83% of hospitals have stroke units only 46% of all stroke
patients are treated in a specialist stroke unit. (Rudd et al, 2007, Large survey)

49
7.3.4. The audit also found that older stroke patients are less likely than younger patients to
receive treatment in a specialist stroke unit. This is particularly noticeable for patients aged
85 and over.
Percentage of stroke patients of each age group treated in a specialist stroke unit
Age Percentage treated in a stroke unit
<65 years 48.0
65 ‐ 74 48.9
75 ‐ 84 47.4
85+ 39.2
n=8,718 Rudd et al, 2007 7.3.5. The phenomenon of under treatment of older stroke patients is not confined to the United
Kingdom. A 2008 study of 29,549 patients in Denmark admitted with stroke between 2003
and 2005 found that for all forms of treatment, admission to a specialist stroke unit,
antiplatelet or anticoagulant therapy, CT/MRI scan, assessment by a physiotherapist or
occupational therapist or nutritional risk evaluation, the proportion of eligible patients that
received treatment declined consistently with the increased age of the patient. (Palnum et
al, 2008) Similar results were obtained from the audit of an Australian stroke unit, giving
rise to a call for further research. “Understanding what is happening is an important first
step in solving this issue of concern” (Luker and Grimmer‐Somers, 2008, Large survey)
7.3.6. Secondary prevention
A 2004 study of 235 hospitals providing care for acute stroke patients in England, Wales
and Northern Ireland (95% of all such hospitals), found that fifty‐four percent of patients
with known hyperlipidaemia and 21% of those with previous ischaemic heart disease were
on lipid lowering therapy on admission. Sixty‐four percent of patients had lipids measured
during their hospital stay and of those with high total cholesterol or LDL the rate of non‐
treatment was 36%. The study found that older patients (75+ years) were less likely to be
treated (54%) than those <65 years (71%). (Rudd et al, 2004, Large survey)
Summary
There is clear evidence of age discrimination in the treatment of Transient Ischaemic Attack
and Stroke. Older patients are less likely than younger patients to be referred to a specialist
stroke unit, or to receive appropriate investigation and treatment. They are also less likely
than younger patients to be prescribed secondary prevention measures.

50
7.4. Diabetes
7.4.1. Type‐2 diabetes is predominantly a condition experienced by people aged 40 and over and
is more likely among South Asian and African‐Caribbean people. Diabetes will most
commonly be treated in primary care but with possible referral to a hospital diabetes clinic.
A 1997 study found that nursing home residents with diabetes, particularly those in a home
specialising in mental health care, receive inadequate care for their diabetes (Benbow
Walsh and Gill, 1997, Survey) A 2000 study of seven Leicestershire general practices found
that older patients were less likely to be referred to a specialist hospital diabetes clinic and
more likely to receive a diabetes review in general practice. On the assumption that
reference to specialist care is beneficial and in the absence of clinical evidence to support
the variations in referral rates this might be an indication of covert age discrimination.
(Goyder, McNally and Botha, 2000, Survey)
7.4.2. Older patients attending hospital for other conditions have a greater risk of a co‐morbidity
of diabetes and therefore requiring special care and attention from the hospital diabetes
care team. Failure to provide an adequate service would be a form of indirect
discrimination against older people but we did not find firm evidence that this is the case.
However, as in other cases, ‘absence of evidence is not evidence of absence’. ( NHS
Scotland. Expert Group on Healthcare of Older People, 2001)
Summary
There is some evidence of lower rates of referral of diabetes patients to specialist diabetes
clinics, which may be an indicator of discrimination. There is however no firm evidence of
indirect discrimination through the inadequate provision of services to hospitalised diabetes
sufferers.
7.5. Osteoporosis
7.5.1. Like diabetes, osteoporosis is a condition affecting mainly older people and so inadequate
service provision would be a form of indirect age discrimination.
7.5.2. It is the most common bone disease in humans and the cost to the NHS of osteoporosis
and osteoporotic fracture care is estimated at almost £2 billion per annum with
osteoporotic fracture being the strongest risk factor for future fracture. Retrospective case
audits carried out in a UK hospital in 2004 and 2005, to assess the effectiveness of British
Orthopaedic Society guidelines and awareness raising in the hospital, found that, in the
51
first audit, out of 38 cases identified as fragility fractures that should have been assessed
or offered referral only 5 (13%) were referred. In the second audit a year later this had
improved to 23 out of 43 (53%) (Gidwani et al, 2007, Small survey)
7.5.3. Some authors recommend the introduction of a primary care osteoporosis screening
programmes to assess bone mineral density, because osteoporosis has a long preclinical
course (Mauck and Clarke, 2006, Review) while others emphasise the importance of falls
prevention programmes (Jarvinen et al, 2008, Opinion)
7.5.4. Recent NICE guidance on the treatment of osteoporosis suggest that women over the age
of 75 who suffers a fragility fracture be assumed to have osteoporosis and should not be
routinely assessed for osteoporosis using dual energy x‐ray absorptiometry (DEXA)
equipment. This may be viewed as discriminatory. It is argued that this recommendation
will lead to unnecessary treatment since only 50% of such cases actually have osteoporosis
(Ralston et al, 2009, Opinion)
Summary
Because osteoporosis mainly affects older people, inadequate service provision would be a
form of indirect discrimination. There is, however, as yet no firm evidence of age
discrimination in the treatment of this condition.
7.6. Osteoarthritis
7.6.1. Osteoarthritis is mainly treated in primary care and the National Institute for Health and
Clinical Excellence only recommend referral to specialist clinics for possible knee or hip
replacement therapy when the joint is infected, causing severe disability, or discomfort is
severe and causing other problems including mental health problems. (NICE, 2001, Policy
document) The disease is often seen as part of natural ageing (NICE, 2008, Guide) and
therefore not taken seriously.
7.6.2. A 2008 study from the English Longitudinal Study on Ageing (ELSA), comparing self
reported care received in comparison with 32 quality of care indicators for adults aged 50
or over in England, found osteoarthritis to be the least well cared for condition with only
29% of quality of care indicators being achieved. (Steel et al, 2008, Large survey) As is the
case for diabetes and osteoporosis, inadequate provision for osteoarthritis may be seen as
a form of indirect age discrimination.

52
Summary
NICE guidelines on referral for the treatment of osteoarthritis, which is primarily a disease of
older age, appear at first glance quite restrictive in their access to treatment with implied
rationing based on a points based system. These guidelines may be comparable in severity
to other NICE guidelines but, if not, would be a clear case of indirect institutional age
discrimination.
7.7. Parkinson’s disease
7.7.1. Parkinson’s disease is the most common neurological disease and affects one in 1,000 in
the UK. It is mainly a disease of older age with an average age of onset of around 60 years.
There is currently no cure for Parkinson’s. It is a long‐term condition that can be managed
and ameliorated with the help of carefully controlled medication. Treatment is mainly in
primary care or as a hospital out‐patient at a specialist clinic. Parkinson’s sufferers may
however become hospital in‐patients for other reasons and under these circumstances
there is evidence that the Parkinson’s disease is often worsened by a hospital stay, as a
result of a failure to keep to the medication regime. A 2004 survey of Parkinson’s in‐
patients in a Sheffield hospital found that 70% experienced a delay in their medication and
81% experienced one or more dose omissions. (Elphick, 2005, Survey) A 2006 survey of
Parkinson’s disease nurse specialists by the Parkinson’s Disease Society confirmed these
findings with 9 out of 10 indicating that patients with Parkinson’s disease experience
clinical problems or unnecessarily long hospital stays as a result of missed medication.
(BBC News, 2006 – referencing Parkinson’s Disease Society, 2006, Small Survey)
7.7.2. Direct age discrimination in the treatment of Parkinson’s disease occurs mainly in primary
care with a 2001 Parkinson’s Disease Society survey of GPs showing that 55% make a
decision about whether or not to refer to a specialist on the basis of age. Older patients
with Parkinson’s disease are more likely to be prescribed the cheaper levodopa despite its
long‐term irreversible side effects. (Turner, 2006, Study) A more recent PDS member
survey has shown widespread failings in service provision with 46% of patients never
referred to physiotherapy, 63% not receiving speech and language therapy and 66% not
being referred to an occupational therapist. (Parkinson’s Disease Society, 2008, Large
survey)
53
[See also Ageism and age discrimination in primary and community health care in the
United Kingdom (Centre for Policy on Ageing, 2009, Review)]
Summary
There is evidence of age discrimination in the referral of Parkinson ‘s Disease patients to
specialist care but, although Parkinson’s Disease sufferers often receive inadequate hospital
care, it is not clear that this is a form of age related discrimination.
8. Clinical trials
8.1. A large number of studies have shown that one of the problems in prescribing for older
people is that older people with a changed physiology and often with co‐morbidity and
associated polypharmacy have, in the past been excluded from drug trials. It has been
common for drug trials to exclude people over 65 or 70. Many of the drugs which are
successfully tested are then registered and become available for use. Healthcare
professionals either do not prescribe the medications to those in the excluded age groups
because of the lack of age‐relevant data, or they prescribe off‐label.
(Rajapakse, Rajapakse and Playfer, 2008, Review; Birmingham, 2008, Study; Milton, Hill‐
Smith and Jackson, 2008, Study; Habicht, Witham and McMurdo, 2008, Study; Siu, 2007,
Small survey; Butler, 2007, Review; Binns, Morkane and O’Mahoney, 2006,Review; Townsley
et al, 2006, Survey; Rehwagen,2005, Opinion; Crome and Natarajan, 2004, Opinion;
Godlovitch, 2003, Opinion; Bayer and Fish, 2003, Opinion)
8.2. The situation has been improving. For example “The number of published randomized
control trials (RCTs) with explicit age exclusions declined from 58% during 1966‐1990 to 40%
during 1991‐2000. Trial enrolment of patients aged 75 years or older increased from 2% for
studies published during 1996‐1990 to 9% during 1991‐2000 but remains well below their
representation among all patients with myocardial infarction (37%) in the United States. “
(Lee et al, 2001, Review)
8.3. The reasons for exclusion are increased cost (resulting from increased sample sizes to cope
with the increased age spectrum and increased likelihood of drop‐out through death plus
likely increased cost per participant); the desire to keep assessment simple, avoiding co‐

54
morbidities; changed drug metabolism in older people and a desire to protect vulnerable
older people from research (Habicht, Witham and McMurdo, 2008, Study)
8.4. Habicht, Witham and McMurdo suggest a) legislation to ensure older people are properly
represented in clinical trials b) changes to the regulatory frameworks controlling
pharmaceutical and medical device licensing so that a licence would require evidence of
effectiveness in the population for whom they are likely to be most commonly used c) extra
funding as part of research grants to recruit larger sample sizes. (Habicht, Witham and
McMurdo, 2008, Study)
Summary
The continued under‐representation of older people in clinical trials, while improving, is a
clear form of age discrimination outside the NHS which has a knock‐on effect on available
treatments for the older patient inside the NHS. Changes to the regulatory frameworks
controlling pharmaceutical and medical device licensing might bring pressure for further
improvement.
9. NICE guidelines and the use of QALYs
9.1. As part of its process of ‘technology appraisal’ to assess the relative cost effectiveness of
procedures and treatments, the National Institute for Health and Clinical Excellence (NICE)
assesses the incremental cost effectiveness ratio (ICER) of the procedure or treatment ie the
cost of each additional Quality Adjusted Life Year (QALY) generated by the treatment. The
additional QALYs generated are calculated by multiplying the improvement in quality of life
by the number of years for which it is effective and may result from an improvement in
quality of life, an improvement in life expectancy or a combination of the two.
NICE recommends that wherever possible, health related quality of life be measured using
the EuroQol 5‐dimensional measure EQ‐5D. (NICE, 2008, guide) EQ‐5D is disease
independent and measures mobility, self‐care, daily activities, pain/discomfort and
anxiety/depression. (Knapp, 2007, review). EQ‐5D is reduced to a single value EQ‐5Dindex by
weighting the three points on each of the 5 dimension scales. An associated analogue scale
EQ‐5Dvas may also be used. QALYs generated in the assessment can be affected by the

55
weights used in EQ‐5Dindex (Parkin, Rice and Devlin, 2008), the severity of the condition being
treated (National Collaborating Centre for Mental Health, 2007, guide) and the time horizon
(the length of time for which treatment effects are considered) for the model in use. The UK
population norm for EQ‐5Dindex and EQ‐5Dvas declines with age. (Kind, 1999, study)
Quality of Life, UK population norms
n=3,395 Kind, 1999 9.2. The limitations of the EQ‐5D measure and the resulting QALYs generated is recognised
particularly in the area of mental health. ‘...the use of EQ‐5D as the core measure of health
state evaluation in the field of psychiatry seems less than fully convincing or appropriate’
(Knapp and Mangalore, 2007, Review)
In its submission to the 2009 Kennedy Review on valuing innovation, Arthritis Care state ‘The
use of the narrow QALY measure as the overriding factor in determining access to
technologies does not sufficiently take into account the diversity of service‐user experience
and the often significant gains that can make a real difference to someone’s actual quality of
life.’ (Arthritis Care, 2009, review)
The Kennedy Review itself recognised the problems in using EQ‐5D, ‘NICE is working with the
EuroQol group to identify possible ways of improving the EQ‐5D tool: it is accepted that this
tool does not capture well, for example, diminution in quality of life consequent on sensory
loss or impairment of cognition’, but was very supportive of the use of ICERs and the QALY in
general ‘ I adopt as a starting point my firm conviction that the approach adopted by NICE is
fundamentally sound. Indeed, I would go further and describe the ICER/QALY approach as
quite simply the best tool available to do the job which NICE has been set’ (Kennedy, 2009,
review)
In a response to the Kennedy Review, the Royal College of Nursing say ‘...quality of life is a
complex concept and cannot easily be reduced to quantitative measure on an interval scale.
Perceptions of the value of improvement in, for example, symptom control and the

56
sufferer’s experience of duration mean that what is objectively a small gain in function for a
relatively short time may be perceived as of considerable value for the patient. QALYs make
no allowance for these factors.’ (Royal College of Nursing, 2009, policy document)
9.3. For NICE ‘... a QALY gained or lost in respect of one disease is equivalent to a QALY gained or
lost in respect of another. It also means that the weight given to the gain of a QALY is the
same regardless of how many QALYs have already been enjoyed, how many are in prospect,
the age or sex of the beneficiaries, their deservedness, and the extent to which the
recipients are deprived in other respects than health.’(Rawlins and Culyer, 2004, review)
‘The QALY ... provides a “common currency” which allows different interventions to be
compared for different conditions. This allows NICE to make its decisions consistently,
transparently and fairly. Cost–utility analysis cannot, however, be the sole basis for NICE’s
decisions and the Institute expects its advisory bodies to use their judgement when
considering the results of cost‐effectiveness analyses.’ (NICE, 2008, policy document)
9.4. It is generally accepted that because of lower life expectancy and higher levels of
comorbidity, treatments and interventions for older people are less able to generate QALYs.
‘Life expectancy is correlated with both age and the ability for a treatment to produce
QALYs. Other things being equal, those who are older have lower life expectancy; and those
with lower life expectancy are able to produce fewer QALYs.’ (Edlin et al, 2008, Review)
‘Other things being equal the treatment of a patient with significant comorbidities will
produce fewer QALYs than treating a patient in otherwise perfect health. Since older people
suffer from more comorbidities than the young, their health gains will be lower on average.’
(Edlin et al, 2008, Review)
‘…if the effects of treatment are expected to last for life, patients with a short life
expectancy cannot expect to come out as favourably as those with long to live.’ (Taylor,
2007, Study)
9.5. It has been argued that, because older people with lower life expectancy and higher levels of
comorbidity are less able to generate QALYs, the QALY is inherently age discriminatory.
‘It is the fact that younger people usually (though not always), have more life expectancy to
gain from treatment that makes the QALY “inherently ageist”.’ (Harris, 2005, Opinion
quoted in Taylor, 2007, Study)

57
9.6. Others argue that because of averaging, the effect of age on QALY league tables is reduced.
‘The influence of age on QALY league table estimates is normally quite small because the
estimates derive from averaging results from patients of different ages. Where a treatment
is predominantly for older patients, the estimate would be affected by the lower life
expectancy of the elderly…’ (Dey and Fraser, 2000, Study)
‘While the macro level use of CEA [cost‐effectiveness analysis] greatly reduces the scope for
age discrimination, it does not entirely remove it. The benefits to older people will still be
lower and so treatments that mostly impact on an older population will still be affected by a
generally lower ability to produce QALYs.’ (Edlin, 2008, Review)
9.7. It is also argued that where a treatment is provided on a pay‐as‐you‐go basis the marginal
costs effectiveness will be the same at any age.
‘...provided costs and the health gains are the same, the incremental cost per QALY will be
no different for a three year old than for an 83 year old. The QALY is not therefore inherently
ageist...’
‘...the elderly might in theory be disadvantaged in the evaluation of an exceptionally
expensive procedure, device, or drug (given as a single dose or a short course) whose health
gain persists over a long period. A child aged three years would then be likely to enjoy more
than 70 years of benefit compared to the additional five years that an 80 year old could
expect. We cannot, though, think of a single example...’ (Rawlins and Dillon, 2005, Opinion)
9.8. Whether the QALY is age discriminatory will depend on how it is used. For example, in a
1991 study to assess the effectiveness of total knee replacement (TKR) surgery, Drewett,
Minns and Sibly calculate QALYs gained by multiplying the improvement in quality of life by
the life expectancy of the patient. (Drewett, Minns and Sibly, 1991, Study) Clearly in such a
calculation, because of lower life expectancy, a one‐off treatment mainly used by older
patients is less able to generate QALYs than a similar one‐off treatment for younger patients.
However we have not been able to locate an example of NICE using the QALY in this way
either in its technology appraisals or as background for guidance.
9.9. ‘NICE openly works to a utilitarian model, but this is not to say it endorses discrimination.
The discretion applied after the application of the QALY and the other stages of appraisal are
intended to account for this. … NICE is applying utilitarian principles and then adapting them
to conform to the egalitarian restrictions placed upon them by the NHS. … adaptation and

58
even weighting of the QALY, can never fully reflect the principles supported by the NHS due
to the differing ethical basis, and as such NICE should be cautious in applying the results of
such a model in situations such as the current Alzheimer’s controversy.’ (Taylor, 2007, Study)
9.10. ‘Some of the criticisms raised (particularly by John Harris) relate not to whether or not older
people “produce” fewer QALYs but instead to the ethical relevance of any difference in
outcome. This stance argues that patients have an inviolable right to health care that is not
diminished by the size of the likely health benefit. If this basis is correct, then CEA [cost ‐
effectiveness analysis] (whether using QALYs, life years gained, or any other measure) is a
source of indirect age discrimination’ (Edlin et al, 2008, Review)
Summary
There is divided opinion over whether the QALY, the primary measure by which the National
Institute for Health and Clinical Excellence (NICE) assesses the cost effectiveness of
procedures and treatments, is inherently age discriminatory. While the suspicion might be
that any benefit measure based on the number of years benefit gained will disadvantage
treatments for the older patient, it is argued that incremental cost / benefit ratios will
usually be the same at any age.
There would appear to be no age related ethical problems in the use of QALYs to assess the
cost effectiveness of treatments applicable across all ages or to assess the relative cost
effectiveness of a range of treatment options for patients of a particular age. The issue is
whether the QALY is an ethically valid tool to assess the relative cost‐effectiveness of a
treatment only or mainly of value to older people against treatments for other conditions
applicable to younger people or across all age ranges and set the incremental cost
effectiveness ratio against a standard benchmark cost per QALY gained.
10. Education and training
10.1. There is a general consensus that a key element in ‘rooting out ageism’ in the NHS is
appropriate education and training, both for existing staff and as part of pre‐clinical training
and education. (Williams, 2000, Opinion; Roberts, Robinson and Seymour, 2002, Survey;
Levenson, 2003, Guide; Oliver, 2007, Opinion)

59
10.2. Ideas for work based training include a specially trained team of nurses, health care
assistants, therapy staff and managers to act as older peoples’ champions and advise others
(Smy, 2004, Study) or bringing age awareness into the mainstream by using older people to
provide training (Hopkins, 2005, Study)
10.3. ‘The training and education of healthcare professionals needs to change to reflect the fact
that their day‐to‐day role will increasingly centre on the care of older people with long‐term
conditions rather than younger patients with curable single conditions.” (Oliver, 2007,
Opinion)
Summary
If, as seems likely, a root cause of age discrimination in the National Health Service is the
cumulative effect of ageist attitudes among NHS staff, then pre‐qualification and in‐house
education and training are key factors in ‘rooting out ageism’. Medical staff need to be much
more aware of the physiology and needs of the older patient.
11. Conclusion
11.1. Since the publication of the National Service Framework for Older People in 2001, cases of
explicit, direct, age discrimination in secondary health care policy are rare. When age
discrimination does occur it is either indirect, through the inadequate provision of services
to meet the needs of older people or as a result of the cumulative effect of ageist attitudes
by individual NHS staff.
11.2. Evidence of the under‐investigation and under‐treatment of older people in cancer care,
cardiology and stroke is so widespread and strong that, even taking into account
confounding factors such as frailty, co‐morbidity and polypharmacy we must conclude that
ageist attitudes are having an effect on overall investigation and treatment levels.
11.3. There is some evidence of ageist attitudes held by health practitioners and that doctors may
be more ageist than other NHS staff but it may be that doctors are the ones most aware of
the complexities in the treatment of older people. Ageist attitudes among medical staff may
do no more than reflect ageist attitudes in society at large. Further research is required to
60
identify the underlying reasons for the clearly evidenced under‐investigation and under‐
treatment of older patients.
11.4. Indications of indirect discrimination against older patients, through inadequate provision of
necessary hospital services, are widespread but mainly anecdotal. It has been asked “How
many anecdotes does it take to constitute evidence?” Inpatient surveys confirm continuing
problems with the attitudes of medical staff, patient privacy, single‐sex accommodation and
the provision and serving of nutritious food.
11.5. Although there is evidence that older patients wait longer in accident and emergency
departments this may be because they experience a higher proportion of hospital
admissions following A&E. Evidence that this is a result of age discrimination in treatment is
not conclusive.
11.6. Although age discrimination in the allocation of hospital critical care beds is often suspected,
the evidence is inconclusive. There is evidence that a lower proportion of eligible older
patients in need are admitted to high dependency and intensive care units but researchers
do not see this as clear evidence of age discrimination.
11.7. Although most people die in hospital that is not where they want to die. There is firm
evidence of the under‐provision of appropriate palliative care and end‐of‐life care for older
patients, particularly those who do not have cancer as their primary diagnosis. There is
evidence of both direct and indirect age discrimination in this area
11.8. Although there is evidence that guidelines on resuscitation are often not being adhered to,
despite suspicions, there is currently no firm evidence that resuscitation is being denied to
patients on the basis of age rather than as a result of a clinical assessment.
11.9. Increasing rates of emergency readmission within one month of hospital discharge, with
higher rates for older people than younger patients, is a cause for increasing concern. This
may result from increasing rates of early discharge with inadequate planning for all patients
but with the effect on older patients, who may take longer to recover from hospital
procedures, being more pronounced. This may be an example of where a universally

61
applied policy is indirectly discriminatory against the older patient.
11.10. It is unclear, from the literature, whether the use of QALYs to assess the relative cost
effectiveness of treatments and procedures, is inherently age discriminatory. There is a
strong suspicion that, no matter how it is packaged, the use of Quality Adjusted Life Years to
assess the relative cost effectiveness of treatments and procedures will discriminate against
those procedures and treatments, for example for Alzheimer’s Disease, Osteoarthritis,
Osteoporosis or Macular Degeneration, that are mainly beneficial to older people with
greater comorbidity and fewer remaining years. It is however argued that, on the contrary,
treatments provided on a pay‐as‐you‐go basis, without large up‐front costs, have the same
marginal cost / benefit trade‐offs at any age.
While there appears to be no problem of age discrimination in the use of the QALY to
compare the relative cost effectiveness of treatments applicable to all ages, or to compare
the relative cost‐effectiveness of alternative treatments of the same condition at any
particular age, there may be problems of age discrimination in the use of QALYs to compare
the costs effectiveness of the treatment of a condition such as Alzheimer’s disease, which
only or predominantly occurs in older age, against treatments of other conditions that occur
in younger people or at all ages, by seeking to meet, in all cases, the same standard
benchmark cost per QALY.
11.11. The key to eliminating age discrimination in the National Health Service is seen by many to
be the raising of awareness of ageist attitudes through education and training both during
the pre‐qualification period and in post. ‘The training and education of healthcare
professionals needs to change to reflect the fact that their day‐to‐day role will increasingly
centre on the care of older people with long‐term conditions rather than younger patients
with curable single conditions.’ (Oliver, 2007, Opinion ) With older people forming an
increasing proportion of patients, the physiological changes associated with ageing should
receive increased emphasis in mainstream pre‐clinical education and training for all medical
staff.

62
12. Recommendations for further study
12.1. There is a need for a comprehensive UK study of ageist attitudes among medical staff,
comparing different medical disciplines benchmarked against the attitudes of the general
public, at different ages, to try to ascertain the root causes of ageism at the individual,
clinical level.
12.2. There should be a review of medical school curricula and training courses for medical staff to
ensure proper and adequate coverage of the physiology and needs of older people as major
users of health services as well as appropriate awareness of ageism and direct and indirect
age discrimination.
12.3. There is a need for a comprehensive, evidence based, review of older people’s experiences
in hospital from admission through to discharge and after‐care planning, together with a
study of post‐hospital outcomes and readmission. The CQC 2008 survey of Accident and
Emergency could be re‐analysed to provide rapid access to comparative information on the
experiences of older patients in A&E and the 2004 and later inpatient surveys could be
rigorously re‐analysed to show differences, including regional differences, in the experiences
of older patients.
63
References Alberti G; Department of Health (2004) Transforming emergency care in England, London: Department of Health Alexander K P and Peterson E D (1997) Coronary artery bypass grafting in the elderly, American Heart Journal 134 (5 (Part 1)) : 856‐864 Anderson D; Royal College of Psychiatrists. Faculty of Old Age Psychiatry (2007) The human rights of older persons in healthcare ‐ response [to the Joint Committee on Human Rights inquiry] from the Faculty of Old Age Psychiatry of the Royal College of Psychiatrists, http://www.rcpsych.ac.uk/docs/The%20Human%20Rights%20of%20Older%20Persons%20in%20Healthcare.doc Arthritis Care (2009) Submission to the Kennedy Review on valuing innovation, 3 April 2009, http://www.nice.org.uk/media/B4E/91/KennedyArthritisCare.pdf Association of Community Health Councils for England and Wales (2001) Nationwide casualty watch 2001, ACHCEW Austin D and Russell E M (2003) Is there ageism in oncology?, Scottish Medical Journal 48 (1) : 17‐20 Bayer A and Fish M (2003) The doctor's duty to the elderly patient in clinical trials, Drugs and Aging 20 (15) : 1087‐1097 BBC News (2006) Parkinson's 'worsens in hospital', http://news.bbc.co.uk/1/hi/health/4929712.stm (23 April 2006) Benbow S J, Walsh A and Gill G V (1997) Diabetes in institutionalised elderly people: a forgotten population?, British Medical Journal 314 (7698, 28 June 1997) : 1868‐1869 Billings J; University of Kent. Centre for Health Services Studies (2003) Staff perceptions of ageist practice in the clinical setting: practice development project, http://www.kent.ac.uk/CHSS/docs/staff_perception_of_ageist_practice.pdf Binns K, Morkane C and O'Mahoney M (2006) Does ageism in heart failure trials lead to ageism in clinical practice?, Age and Ageing 35 (Supp 3) : i66 Birkhead J (ed); Royal College of Physicians. Clinical Effectiveness and Evaluation Unit and Myocardial Ischaemia National Audit Project (MINAP) (2001) A baseline survey of facilities for the management of acute myocardial infarction in England 2000, http://www.rcplondon.ac.uk/clinical‐standards/ceeu/Current‐work/Documents/AMIbaselineSurvey‐minap.pdf Birmingham K (2008) Discriminating between the old, Nursing Older People 20 (4) : 3 Bond M, Bowling A, McKee D, Kennelly M, Banning A P, Dudley N, Elder A and Martin A (2003) Does ageism affect the management of ischaemic heart disease?, Journal of Health Services Research & Policy 8 (1) : 40‐47 Bowling A, Harries C, Forrest D and Harvey N (2006) Variations in cardiac interventions: doctors’ practices and views, Family Practice 23 (4) : 427‐436

64
British Geriatrics Society (2008) The Older Person in the Accident & Emergency Department (Best practice guide Document 3.2 Revised March 2008), http://www.bgs.org.uk/Publications/Compendium/compend_3‐2.htm British Geriatrics Society. Parkinson's Disease Special Interest Group, Parkinson's Disease Society and Disabled Living Foundation (2005) Multidisciplinary care in Parkinson's disease and parkinsonism: from science to practice: a one‐day multidisciplinary conference held on Tuesday 12 July 2005 at the Royal College of Physicians, Regent's Park, London: conference report [of] the 10th National Conference, London: Medical Education Partnership Butler R N; International Longevity Center (2007) Need for drug safety ‐ the older person and ageism. (Issue brief), New York: International Longevity Center Bytheway B (1995) Ageism. (Rethinking ageing series), Buckingham: Open University Press Bytheway B and Johnson J (1990) On defining ageism, Critical Social Policy 10 (2) : 27‐39 Carruthers I and Ormondroyd J; Department of Health (2009) Achieving age equality in health and social care: a report to the Secretary of State for Health ... October 2009, http://www.dh.gov.uk/en/Publicationsandstatistics/Publications/PublicationsPolicyAndGuidance/DH_107278 Carruthers I and Ormondroyd J; Department of Health, National Development Team for Inclusion, Social Care Institute for Excellence, University of West of England. Faculty of Health and Social Care, Centre for Policy on Ageing and University of Leeds (2009) Achieving age equality in health and social care: annex to a report to the Secretary of State for Health ... October 2009: working papers .., http://www.dh.gov.uk/en/Publicationsandstatistics/Publications/PublicationsPolicyAndGuidance/DH_107278 Centre for Policy on Ageing (2009) Ageism and age discrimination in mental health care in the United Kingdom: a review from the literature; commissioned by the Department of Health, London: Centre for Policy on Ageing Centre for Policy on Ageing (2009) Ageism and age discrimination in primary and community health care in the United Kingdom: a review from the literature; commissioned by the Department of Health, London: Centre for Policy on Ageing Centre for Policy on Ageing (2009) Ageism and age discrimination in social care in the United Kingdom: a review from the literature; commissioned by the Department of Health, London: Centre for Policy on Ageing Citizens Advice Bureau (2009) Submission to the Department of Health: National review of age discrimination in health and social care. (Evidence), London: Citizens Advice Bureau Clarke C M (2001) Rationing scarce life‐sustaining resources on the basis of age, Journal of Advanced Nursing 35 (5) : 799‐805 Collinson J, Bakhai A, Flather M D and Fox K A (2005) The management and investigation of elderly patients with acute coronary syndromes without ST elevation: an evidence‐based approach? Results of the Prospective Registry of Acute Ischaemic Syndromes in the United Kingdom (PRAIS‐UK), Age

65
and Ageing 34 (1) : 61‐66 Costello J (2001) Nursing older dying patients: findings from an ethnographic study of death and dying in elderly care wards, Journal of Advanced Nursing 35 (1) : 59‐68 Crome P and Natarajan I (2004) The National Service Framework for older people ‐ England's approach to ending age discrimination in services and therapeutics, Drugs and Aging 21 (8) : 499‐510 Dangoor A (2001) We need a consistent message: [letter], British Medical Journal 322 (7278, 13 January 2001) : 104 Davey B and Ross F; Wirral Hospital NHS Trust and King's College London. Nursing Research Unit (2003) Exploring staff views of old age and health care, http://clearingatkings.com/content/1/c6/01/94/98/WirralReport.pdf Department of Health (2008) End of life care strategy: promoting high quality care for all adults at the end of life: equality impact assessment, http://www.dh.gov.uk/en/Publicationsandstatistics/Publications/PublicationsPolicyAndGuidance/DH_086277 Department of Health (2001b) National service framework for older people: [main report]; executive summary; and Medicines for older people: implementing medicines‐related aspects of the NSF for older people, London: Department of Health : 3vols Department of Health. NSF OP Implementation Team (2002) Age discrimination benchmarking tools and user guides [for]: acute hospital procedures; social care; local information input; and primary care, http://www.dh.gov.uk/en/Publicationsandstatistics/Publications/PublicationsPolicyAndGuidance/DH_4008439 Dey I and Fraser N (2000) Age‐based rationing in the allocation of health care, Journal of Aging and Health 12 (4) : 511‐537 Dieppe P; Dignity and Older Europeans Consortium (2004) Final report of focus groups of UK older people, http://www.cardiff.ac.uk/medic/subsites/dignity/resources/uk_older_people.pdf Donovan J L, Martin R M, Neal D E and Hamdy F C (2005) Prostate cancer: screening approaches, British Journal of Hospital Medicine 66 (11) : 623‐626 Downing A and Wilson R (2005) Older people's use of Accident and Emergency services, Age and Ageing 34 (1) : 24‐30 Drewett R F, Mninns R J and Sibly T F (1992) Measuring outcomes of total knee replacement using quality of life indices, Annals of the Royal College of Surgeons of England 74 : 786‐790 Dudley N J and Burns E (1992) Influence of age on policies for admission and thrombolysis in coronary care units in the United Kingdom, Age and Ageing 21 (2) : 95‐98 Dudley N J, Bowling A, Bond M, McKee D, Scott M M, Banning A, Elder A T, Martin A T and Blackman I (2002) Age‐ and sex‐related bias in the management of heart disease in a district general hospital, Age and Ageing 31 (1) : 37‐42

66
Duffin C (2008) Health care is still age‐biased, Nursing Older People 20 (3) : 9‐10 Ebrahim S (2000) Do not resuscitate decisions: flogging dead horses or a dignified death? Resuscitation should not be withheld from elderly people without discussion, British Medical Journal 320 (7243, 29 April 2000) : 1155‐1156 Edlin R, Round J, McCabe C, Sculpher M, Claxton K and Cookson R; University of Leeds. Faculty of Medicine and Health. Leeds Institute of Health Sciences (2008) Cost‐effectiveness analysis and ageism: a review of the theoretical literature; prepared for the Department of Health, http://www.leeds.ac.uk/lihs/auhe/papers/cea_ageism.pdf Elphick H; British Geriatrics Society. Parkinson's Disease Special Interest Group; Parkinson's Disease Society; Disabled Living Foundation (2005) Provision of Parkinson's disease medication to hospital inpatients and managing Parkinson's disease medication in hospital: the patient's perspective In: Multidisciplinary care in Parkinson's disease and parkinsonism: from science to practice: a one‐day multidisciplinary conference held on Tuesday 12 July 2005 ... conference report [of] the 10th National Conference, London: Medical Education Partnership : 26‐27 Evason E, Dowds L and Devine P (2004) Ageism in Ireland, Londonderry: ARK Northern Ireland Social and Political Archive Fairhead J F and Rothwell P M (2006) Underinvestigation and undertreatment of carotid disease in elderly patients with transient ischaemic attack and stroke: comparative population based study, British Medical Journal 333 (7567, 9 September 2006) : 525‐527 Fraboni M, Saltstone R and Hughes S (1990) Fraboni Scale of Ageism (FSA): an attempt at a more precise measure of ageism, Canadian Journal on Aging 9 (1) : 56‐66 Gidwani S, Davidson N, Trigkilidas D, Blick C, Harborne R and Maurice H D (2007) The detection of patients with ‘fragility fractures’ in fracture clinic – an audit of practice with reference to recent British Orthopaedic Association guidelines, Annals of the Royal College of Surgeons of England 89 (2) : 147‐150 Godlovitch G (2003) Age discrimination in trials and treatment: old dogs and new tricks, Monash Bioethics Review 22 (3) : 66‐77 Goyder E C, McNally P G and Botha J L (2000) Inequalities in access to diabetes care: evidence from a historical cohort study, Quality in Health Care 9 (2) : 85‐90 Grant P T, Henry J M and McNaughton G W (2000) The management of elderly blunt trauma victims in Scotland: evidence of ageism?, Injury 31 (7) : 519‐528 Habicht D W, Witham M D and McMurdo M E (2008) The under‐representation of older people in clinical trials: barriers and potential solutions, Journal of Nutrition, Health and Aging 12 (3) : 194‐196 Hagestad G O and Uhlenberg P (2005) The social separation of old and young: a root of ageism, Journal of Social Issues 61 (2) : 343‐360 Harries C, Forres D, Harvey N, McClelland A and Bowling A (2007) Which doctors are influenced by a patient's age? A multi‐method study of angina treatment in general practice, cardiology and

67
gerontology, Quality and Safety in Health Care 16 (1) : 23‐27 Harris D G and Linnane S J (2005) Making do not attempt resuscitation decisions: do doctors follow the guidelines?, Hospital Medicine 66 (1) : 43‐45 Harris J (2005a) It's not NICE to discriminate, Journal of Medical Ethics 31 (7) : 373‐375 Harrop A, Jopling K and contributors; Age Concern and Help the Aged (2009) One voice: shaping our ageing society, London: Age Concern and Help the Aged Hazell M L, Morris J A, Linehan M F and Frank T L (2009) Temporal change in health‐related quality of life: a longitudinal study in general practice 1999‐2004, British Journal of General Practice 59 (568) : 839‐843 Healthcare Commission (2009) Investigation into Mid Staffordshire NHS Foundation Trust, London: http://www.cqc.org.uk/_db/_documents/Investigation_into_Mid_Staffordshire_NHS_Foundation_Trust.pdf (March 2009) Healthcare Commission (2008) National NHS patient survey programme: Emergency department survey 2008, http://www.cqc.org.uk/usingcareservices/healthcare/patientsurveys/hospitalcare/emergencydepartmentsurvey2008.cfm Healthcare Commission (2007a) Caring for dignity: a national report on dignity in care for older people while in hospital, London: Healthcare Commission Healthcare Commission (2007b) State of healthcare 2007, London: Healthcare Commission Healthcare Commission, Audit Commission and Commission for Social Care Inspection (2006) Living well in later life: a review of progress against the National Service Framework for Older People, London: Healthcare Commission Healy J, Thomas A, Seargeant J and Victor C (2000) Coming up for care: assessing the post‐hospital needs of older patients, London: Policy Studies Institute Help the Aged (2009) Specialist doctors label the NHS institutionally ageist and demand a law to bring it to an end. (Press release, 27 January 2009), http://press.helptheaged.org.uk/_press/Releases/_items/_Specialist+doctors+label+the+NHS+institutionally+ageist+and+demand+a+law+to+bring+it+to+an+end.htm Help the Aged (2007) Government lethargy fuels ageism, says new research. (Press release, 3 September 2007), http://press.helptheaged.org.uk/_press/Releases/_items/news_ageism_030907.htm Higginson I J; Cicely Saunders Foundation, Scottish Partnership for Palliative Care and National Council for Hospice and Specialist Palliative Care Services (2003) Priorities and preferences for end of life care in England, Wales and Scotland, London: National Council for Hospice and Specialist Palliative Care Services Hopkins G (2005) Acting their age, Community Care (1565, 24 March 2005) : 42‐43

68
Hubbard R E, Lyons R A, Woodhouse K W, Hillier S L, Wareham K, Ferguson B and Major E (2003) Absence of ageism in access to critical care: a cross‐sectional study, Age and Ageing 32 (4) : 382‐387 Intensive Care Society. Patient Flows Working Group (2007) Capacity in critical care: history, update and future: the Intensive Care Society’s and Department of Health’s Working Group on Patient Flows in Critical Care, http://www.ics.ac.uk/downloads/ICM%20Prof_Patient%20Flows/historyupdatefuture.pdf Järvinen T L N, Sievänen H, Khan K M, Heinonen A and Kannus P (2008) Shifting the focus in fracture prevention from osteoporosis to falls, British Medical Journal 336 (7636, 19 January 2008) : 124‐126 Kearney N, Miller M, Paul J and Smith K (2000) Oncology healthcare professionals' attitudes toward elderly people, Annals of Oncology 11 (5) : 599‐602 Kennedy I; National Institute for Health and Clinical Excellence (2009) Appraising the value of innovation and other benefits: a short study for NICE, http://www.nice.org.uk/media/98F/5C/KennedyStudyFinalReport.pdf Kind P, Hardman G and Macran S; University of York. Centre for Health Economics (1999) UK population norms for EQ‐5D. (Centre for Health Economics Discussion paper 172), York: University of York Knapp M and Mangalore R (2007) The trouble with QALYs..., Epidemiologia e Psichiatria Sociale 16 (4) : 289‐293 Kogan N (1961) Attitudes toward old people: the development of a scale and an examination of correlates., The Journal of Abnormal and Social Psychology 62 (1) : 44‐54 Lavelle K, Moran A, Howell A, Bundred N, Campbell M and Todd C (2007) Older women with operable breast cancer are less likely to have surgery, British Journal of Surgery 94 (10) : 1209‐1215 Lavelle K, Todd C, Moran A, Howell A, Bundred N and Campbell M (2007) Non‐standard management of breast cancer increases with age in the UK: a population based cohort of women >65 years, British Journal of Cancer 96 (8, 23 April 2007) : 1197‐1203 Lee F and Patel H (2002) Prostate cancer: management and controversies, Hospital Medicine 63 (8) : 465‐470 Lee P Y, Alexander K P, Hammill B G, Pasquali S K and Peterson E D (2001) Representation of elderly persons and women in published randomized trials of acute coronary syndromes, JAMA, the Journal of the American Medical Association 286 (6) : 708‐719 Levenson R (2003a) Auditing age discrimination: a practical approach to promoting age equality in health and social care, London: King's Fund Levenson R (2003) Institutional ageism, Community Care (1481, 17 July 2003) : 42‐43 Luker J, Grimmer‐Sommers K and Palnum K D (2008) Ageism in stroke management: letter [and] Reply from K D Palnum, Age and Ageing 37 (5) : 606‐607 Mackay J H, Powell S J, Charman S C and Rozario C (2004) Resuscitation after cardiac surgery: are we

69
ageist?, European Journal of Anaesthesiology 21 (1) : 66‐71 MacMahon D, Grosset D, Macphee M and Turner K (2006) Parkinson's disease: ageism in prescribing, Geriatric Medicine 36 (5 (Suppl)) : 23‐26 Martin R M (2007) Commentary: Prostate cancer is omnipresent, but should we screen for it?, International Journal of Epidemiology 36 (2) : 278‐280 Mauck K F and Clarke B L (2006) Diagnosis, screening, prevention, and treatment of osteoporosis, Mayo Clinic Proceedings 81 (5) : 662‐672 Maynard A, Bloor K and Freemantle N (2004) Challenges for the National Institute for Clinical Excellence, British Medical Journal 329 (7459, 24 July 2004) : 227‐229 McGlone E and Fitzgerald F; National Council on Ageing and Older People, Ireland (2005) Perceptions of ageism in health and social services in Ireland: report based on research undertaken by Eileen McGlone and Fiona Fitzgerald, QE5, Dublin: National Council on Ageing and Older People Milton J C, Hill‐Smith I and Jackson S H D (2008) Prescribing for older people, British Medical Journal 336 (7644, 15 March 2008) : 606‐609 Mooney G and Jan S (1997) Vertical equity: weighting outcomes or establishing procedures?, Health Policy 39 (1) : 79‐87 Moran T and Moeller H; Christie Hospital NHS Foundation Trust and North West Cancer Intelligence Service (2009) Poor progress in cancer control in elderly in UK: [PowerPoint presentation] at National Cancer Intelligence Network conference, 25th June 2009., http://www.ncin.org.uk/about/conference/2009/11_oral_AMoran.shtml National Collaborating Centre for Mental Health, National Institute for Health and Clinical Excellence and Social Care Institute for Excellence (2007) Dementia: a NICE‐SCIE guideline on supporting people with dementia and their carers in health and social care. (National clinical practice guideline no 42), Leicester: The British Psychological Society and Gaskell National Council for Hospice and Specialist Palliative Care Services (2004) The House of Commons Health Committee Inquiry into Palliative care: submission of evidence, http://www.ncpc.org.uk/download/publications/archive/The_House_of_Commons_Inquiry.pdf National Institute for Clinical Excellence (2001) Referral advice: a guide to appropriate referral from general to specialist services, London: National Institute for Clinical Excellence National Institute for Clinical Excellence. Citizens Council (2004) NICE Citizens Council report on age, www.nice.org.uk (21 January 2004) National Institute for Clinical Excellence. Special Health Authority (2004) Citizens Council report on age ... Board response, http://www.nice.org.uk/niceMedia/pdf/boardmeeting/brdmar04item5.pdf. (17 March 2004) Nazroo J, Jackson J, Karlsen S and Torres M The Black diaspora and health inequalities in the US and England: does where you go and how you get there make a difference?, Sociology of Health & Illness 29 (6) : 811‐830

70
NHS Scotland. Expert Group on Healthcare of Older People (2001) Adding life to years: report of the Expert Group on Healthcare of Older People, Edinburgh: Scottish Executive NICE (National Institute for Health and Clinical Excellence) (2008) Social value judgements: principles for the development of NICE guidance. 2nd ed, London: National Institute for Health and Clinical Excellence Oliver D (2007) 'How do you stand working with all these old people?', Health Service Journal 117 (6083, 22 November 2007) : 20‐21 Palmore E B, Branch L and Harris D K (eds) (2005) Encyclopedia of ageism, Binghamton, NY: Haworth Press Palnum K D, Petersen P, Sorensen H T, Ingeman A, Mainz J, Bartell P and Johnsen S P (2008) Older patients with acute stroke in Denmark: quality of care and short‐term mortality: a nationwide follow‐up study, Age and Ageing 37 (1) : 90‐95 Parker S G, Peet S M, McPherson A, Cannaby A M, Abrams K, Baker R, Wilson A, Lindesay J, Parker G and Jones D R (2002) A systematic review of discharge arrangements for older people, Health Technology Assessment 6 (4) Parkin D, Rice N and Devlin N. City University. School of Social Sciences. Department of Economics and University of York. Centre for Health Economics (2008) Statistical analysis of EQ‐5D profiles: does the use of value sets bias inference? (Department of Economics Discussion paper series no 08/10), http://www.city.ac.uk/economics/dps/discussion_papers/0810.pdf Parkinson's Disease Society (2008) Life with Parkinson's today: room for improvement: results of the UK's largest every survey of people with Parkinson's and carers, London: Parkinson's Disease Society Peake M D, Thompson S, Lowe D and Pearson M G (2003) Ageism in the management of lung cancer, Age and Ageing 32 (2) : 171‐177 Preston S D, Southall A R D, Nel M and Das S K (2008) Geriatric surgery is about disease, not age, Journal of the Royal Society of Medicine 101 (8) : 409‐415 Quarini C and Gosney M (2009) Review of the evidence for a colorectal cancer screening programme in elderly people, Age and Ageing 38 (5) : 503‐508 Rajapakse A, Rajapakse S and Playfer J (2008) Age bias in clinical trials of Parkinson's disease treatment, Journal of the American Geriatrics Society 56 (12) : 2353‐2354 Raleigh V S, Scobie S, Cook A, Jones S, Irons R and Halt K; Commission for Health Improvement (2004) Unpacking the patients' perspective ‐ variations in NHS patient experience in England, London: Commission for Health Improvement Ralston S H, de'Lara G, Farquhar D J, Gallacher S J, Hannan J and McLellan A R (2009) Women over 75 with fragility fractures should have DEXA, BMJ 338 : b2340 Ramsay S E, Morris R W, Papacosta O, Lennon L T, Thomas M C and Whincup P H (2005) Secondary prevention of coronary heart disease in older British men: extent of inequalities before and after
71
implementation of the National Service Framework, Journal of Public Health 27 (4) : 338‐344 Rawlins M and Dillon A (2005) NICE discrimination, Journal of Medical Ethics 31 (12) : 683‐684 Rawlins M D and Culyer A J (2004) National Institute for Clinical Excellence and its value judgments, British Medical Journal 329 (7459, 24 July 2004) : 224‐227 Ray S, Sharp E and Abrams D; Age Concern England and University of Kent. Centre for the Study of Group Processes (2006) Ageism: a benchmark of public attitudes in Britain, London: Age Concern England; Canterbury: Centre for the Study of Group Processes, Reed J, Cook M, Cook G, Inglis P and Clarke C (2006) Specialist services for older people ‐ issues of negative and positive ageism, Ageing and Society 26 (6) : 849‐865 Rehwagen C (2005) Older people are wrongly excluded from drug trials, British Medical Journal 331 (7529, 10 December 2005) : 1360‐c Roberts E and Seymour L (2002) Old habits die hard: tackling age discrimination in health and social care : summary report findings, London: King's Fund Roderick P, Jones C, Tomson C and Mason J (2002) Late referral for dialysis: improving the management of chronic renal disease, QJM 95 (6) : 363‐370 Rogers A, Karlsen S and Addington‐Hall J M (2000) "All the services were excellent. It is when the human element comes in that things go wrong": dissatisfaction with hospital care in the last year of life, Journal of Advanced Nursing 3 (4) : 768‐774 Royal College of Nursing, RCN Rheumatology Forum, RCN Ethics Forum and RCN Policy Unit (2009) Kennedy Review on how NICE values innovation: an RCN response, http://www.nice.org.uk/media/B4F/B6/KennedyRCN.pdf Royal College of Surgeons of England. Clinical Effectiveness Unit, Association of Breast Surgery at the British Association of Surgical Oncology, British Association of Plastic, Reconstructive and Aesthetic Surgeons, Royal College of Nursing and NHS Information Centre for health and social care (2009) National mastectomy and breast reconstruction audit 2009: a national audit of provision and outcomes of mastectomy and breast reconstruction surgery for women in England: second annual Report 2009, http://www.ic.nhs.uk/webfiles/Services/NCASP/Cancer/new%20web%20documents%20(MBR)/NHS_IC%20MBR_CLINICAL_AUDIT_2009.pdf Rudd A G, Hoffman A, Down C, Pearson M and Lowe D (2007) Access to stroke care in England, Wales and Northern Ireland: the effect of age, gender and weekend admission, Age and Ageing 36 (3) : 247‐255 Rudd A G, Lowe D, Hoffman A, Irwin P and Pearson M (2004) Secondary prevention for stroke in the United Kingdom: results from the National Sentinel Audit of Stroke, Age and Ageing 33 (3) : 280‐286 Rupp D E, Vodanovich S J and Credé M (2005) The multidimensional nature of ageism: construct validity and group differences, Journal of Social Psychology 145 (3) : 335‐362 Seymour J, Witherspoon R, Gott M, Ross H, Payne S and Owen T; Help the Aged (2005) End‐of‐life

72
care ‐ promoting comfort, choice and well‐being for older people, Bristol: Policy Press, in association with Help the Aged Shaw M, Maxwell R, Rees K, Ho D, Oliver S, Ben‐Shlomo Y and Ebrahim S (2004) Gender and age inequity in the provision of coronary revascularisation in England in the 1990s: is it getting better?, Social Science & Medicine 59 (12) : 2499‐2507 Sinuff T, Kahnamoui K, Cook D J, Luce J M and Levy M M (2004) Rationing critical care beds: a systematic review, Critical Care Medicine 37 (2) : 1588‐1597 Siu L L (2007) Clinical trials in the elderly ‐ a concept comes of age, New England Journal of Medicine 356 (15, 12 April 2007) : 1575‐1576 Smy J (2004) Challenging ageist attitudes, Nursing Times 100 (13, 30 March 2004) : 24‐25 Steel N, Bachmann M, Maisey S, Shekelle P, Breeze E and Marmot M (2008) Self reported receipt of care consistent with 32 quality indicators: national population survey of adults aged 50 or more in England, British Medical Journal 337 (14 August 2008) : a957 Stewart K, Spice C and Rai G S (2003) Where now with Do Not Attempt Resuscitation decisions?, Age and Ageing 32 (2) : 443‐448 Tadd W; Dignity and Older Europeans Consortium (2004) Comparative analysis of data from older people's focus groups from all Centres [in the Dignity and Older Europeans project], http://www.cardiff.ac.uk/medic/subsites/dignity/resources/older_peoples_views.pdf Taylor J G (2007) NICE, Alzheimer's and the QALY, Clinical Ethics 2 (1) : 50‐54 Townsley C A, Chan K K, Pond G R, Marquez C, Siu L L and Straus S E (2006) Understanding the attitudes of the elderly towards enrolment into cancer clinical trials, BMC Cancer 6 (34) Tsuchiya A, Dolan P and Shaw R (2003) Measuring people's preferences regarding ageism in health: some methodological issues and some fresh evidence, Social Science & Medicine 57 (4) : 687‐696 Turner K (2006) Counteracting ageism in Parkinson's disease: a challenge for nurse specialists, British Journal of Neuroscience Nursing 2 (7) : 327‐331 Turner N J, Haward R A and Mulley G P (1999) Cancer in old age ‐ is it inadequately investigated and treated?, British Medical Journal 319 (7205, 31 July) : 309‐312 Venneman S S, Narnor‐Harris P, Perish M and Hamilton M (2008) "Allow natural death" versus "do not resuscitate": three words that can change a life, Journal of Medical Ethics 34 : 2‐6 Wagg A, Mian S, Lowe D and Potter J; Royal College of Physicians. Clinical Effectiveness and Evaluation Unit and Royal College of Physicians, Healthcare for Older People Programme (2005) Report of the national audit of continence care for older people (65 years and above) in England, Wales and Northern Ireland; prepared on behalf of the Continence Working Party, London: Royal College of Physicians White C (1999) Upper age limit should be raised for cancer screening, British Medical Journal 318 (7187, 27 March 1999) : 831

73
Williams B O (2000) Ageism helps to ration medical treatment, Health Bulletin 58 (3) : 198‐202 Wood R and Bain M; NHS Scotland. Information and Statistics Division (2001) The health and well‐being of older people in Scotland: insights from national data, Edinburgh: NHS Scotland Xavier G (2009) The new health checks must not be allowed to increase inequalities, http://www.nursingtimes.net/nursing‐practice‐clinical‐research/practice‐comment‐archive/the‐new‐health‐checks‐must‐not‐be‐allowed‐to‐increase‐inequalities/5000508.article Nursing Times (14 April 2009) Young J (2006) Ageism in services for transient ischaemic attack and stroke, British Medical Journal 333 (7567, 9 September 2006) : 508‐509