Embed Size (px)
Citation preview
1
A slow, tight-binding inhibitor of InhA, the enoyl-ACP reductase from
Mycobacterium tuberculosis
Sylvia R. Luckner1*
, Nina Liu2*
, Christopher W. am Ende2, Peter J. Tonge
2 & Caroline Kisker
1
Rudolf Virchow Center for Experimental Biomedicine, Institute for Structural Biology, University of
Würzburg, Josef-Schneider-Str. 2, 97080 Würzburg, Germany1
Institute for Chemical Biology & Drug Discovery, Department of Chemistry, Stony Brook University,
Stony Brook, NY 11794-34002
Running head: slow onset inhibition of InhA
*these authors contributed equally to the work
Address correspondence to:
Caroline Kisker, E-mail: [email protected], Telephone: +49 931 31 80381, Fax:
+49 931 31 87320 and
Peter Tonge, E-mail: [email protected], Telephone: +1 631 632 7907, Fax: +1 631 632 7960.
InhA, the enoyl-ACP reductase in
Mycobacterium tuberculosis is an attractive
target for the development of novel drugs
against tuberculosis, a disease that kills more
than two million people each year. InhA is the
target of the current first line drug isoniazid
(INH) for the treatment of tuberculosis
infections. Compounds that directly target
InhA and do not require activation by the
mycobacterial catalase-peroxidase KatG are
promising candidates for treating infections
caused by INH resistant strains. Previously we
reported the synthesis of several diphenyl
ethers with nM affinity for InhA. However,
these compounds are rapid reversible inhibitors
of the enzyme, and based on the knowledge that
long drug-target residence times are an
important factor for in vivo drug activity, we
set out to generate a slow onset inhibitor of
InhA using structure based drug design. 2-(o-
Tolyloxy)-5-hexylphenol (PT70) is a slow, tight
binding inhibitor of InhA with a K1 value of
22 pM. PT70 binds preferentially to the
InhA-NAD+ complex and has a residence time
of 24 minutes on the target, which is 14,000
times longer than that of the rapid-reversible
inhibitor from which it is derived. The 1.8 Å
crystal structure of the ternary complex
between InhA, NAD+ and PT70 reveals the
molecular details of enzyme-inhibitor
recognition and supports the hypothesis that
slow onset inhibition is coupled to ordering of
an active site loop, which leads to the closure of
the substrate binding pocket.
Mycobacterium tuberculosis is the causative agent
of tuberculosis, an infectious disease that is spread
all over the world. Two billion people, one third of
the world’s population, are infected with
tuberculosis and M. tuberculosis is responsible for
8.8 million new infections and 1.6 million deaths
each year (1). The emergence of multi-drug
resistant M. tuberculosis strains, that are resistant
against the current frontline drugs isoniazid and
rifampicin, contribute to the spread and worsen the
situation by lengthening the treatment
considerably from 6 months to nearly two years
and thereby increasing the cost for therapy 20 fold.
Extensively drug resistant strains, that are almost
untreatable with current chemotherapeutics,
threaten both developing and industrialized
countries (2). Novel drugs with activity against
drug resistant strains are therefore urgently needed
to restrain the disease that was once thought to be
under control.
One of the most effective and widely used drugs
for the treatment of tuberculosis is isoniazid
(INH). INH is a prodrug that has to be activated by
KatG, the mycobacterial catalase-peroxidase, to
form together with NAD(H) the INH-NAD adduct
(3). This adduct is a slow onset inhibitor of InhA,
the enoyl-ACP reductase of the mycobacterial type
II fatty acid biosynthesis pathway (4,5). In this
pathway, very long chain fatty acids are generated
that act as precursors for mycolic acids, which in
turn are essential building blocks of the waxy cell
http://www.jbc.org/cgi/doi/10.1074/jbc.M109.090373The latest version is at JBC Papers in Press. Published on March 3, 2010 as Manuscript M109.090373
Copyright 2010 by The American Society for Biochemistry and Molecular Biology, Inc.
by guest on July 28, 2018http://w
ww
.jbc.org/D
ownloaded from
2
wall of mycobacteria (6). Inhibition of InhA
blocks mycolic acid biosynthesis, thereby
impairing the integrity of the cell wall, and
eventually leading to cell death (7). Since the
predominant mechanism of resistance against
isoniazid arises from mutations in KatG (3), new
compounds that directly target InhA, and
circumvent the activation step, are promising
candidates for combating multi drug resistant
strains of M. tuberculosis.
Triclosan inhibits InhA directly (8). Although it is
a relatively weak inhibitor of mycobacterial InhA
(Ki = 0.2 µM (9)), significant progress has been
made to improve its affinity towards InhA: first
generation diphenyl ethers have been developed
using structure based drug design that are nM
inhibitors of InhA with MIC values of 1-2 µg/ml
against both drug sensitive and drug resistant
strains of M. tuberculosis (10). In addition,
Freundlich and coworkers recently reported the
development of potent triclosan derivatives that
demonstrated inhibition of InhA in the nM range
with MIC values of 5-10 µg/ml. (11). However, all
the reported compounds are rapid reversible
inhibitors of the enzyme. This is significant given
the increasing importance attached to compounds
that have long residence times on their targets (see
(12) and references therein), as recently
demonstrated by the correlation between residence
time and in vivo activity for a series of
Francisella tularensis FabI inhibitors (13). In
addition, the highly successful INH-NAD adduct
was shown to be a slow onset inhibitor of InhA
(5). The crystal structures of InhA (pdb code 2nv6
(14)) and the Escherichia coli enoyl reductase
(ecFabI), (pdb code 1qg6 (15)) support the
hypothesis that slow onset inhibition is coupled to
ordering of an active site loop (residues 195-210 in
InhA), which leads to a closure of the substrate
binding pocket.
Towards the design of a slow onset diphenyl ether,
we speculated that there must be an entropic
penalty for loop ordering. Thus, reducing the
conformational flexibility of the lead diphenyl-
ether might enable ordering of the active site loop
thus in turn resulting in slow onset enzyme
inhibition. Introduction of a methyl group ortho to
the diphenyl ether linkage resulted in a compound,
PT70 (Fig. 1) that is a slow onset inhibitor of InhA
with a K1 value of 22 pM. The crystal structure of
PT70 bound to InhA corroborates that slow onset
inhibition is coupled to ordering of the substrate
binding loop. Significantly the B-ring methyl
group of PT70 forms critical van der Waals
interactions with the NAD+ cofactor and with key
amino acids of the formerly disordered substrate
binding loop. These studies provide information
on the mechanistic imperatives for slow onset
inhibition of enoyl ACP reductases and the novel
inhibitor has the potential to be effective against
both, drug sensitive and drug resistant strains of
M. tuberculosis.
Experimental Procedures
Synthesis of PT70. 2-(o-Tolyloxy)-5-hexylphenol
(PT70) was synthesized using the procedure
described previously for the synthesis of alkyl-
substituted diphenyl ethers (16). Briefly, 2-
iodotoluene (7.35 mmol), 4-bromo-2-
methoxyphenol (14.7 mmol), Cs2CO3 (32.3
mmol), (CuOTf)2•PhH (0.735 mmol, 5.0 mol%
Cu), ethyl acetate (0.125 mmol, 5.0 mol%), 1-
naphthoic acid (32.3 mmol), molecular sieves 4 Å
(1.8 g) and toluene (15 ml) were added to an oven-
dried 50 ml two-necked round-bottomed flask
sealed with a septum which was purged with N2,
and heated to 110° C. After 24 hours the reaction
mixture was cooled to RT, dichloromethane was
added and the organic phase was obtained by
filtration. The organic phase was washed with 5%
NaOH and the aqueous layer was then extracted
with dichloromethane. The combined organic
layers were washed with brine, dried over MgSO4
and concentrated under vacuum to give the crude
product (1-(4-bromo-2-methoxyphenoxy)-2-
methylbenzene) which was subsequently purified
by flash column chromatography on silica gel
(ethyl acetate/hexane). ZnCl2 (0.5 M solution in
tetrahydrofuran; 9.0 ml, 4.52 mmol) was added to
a round-bottomed flask sealed with a rubber
septum and purged with nitrogen. Hexyl
magnesium chloride (1.0 M solution in
tetrahydrofuran; 4.0 ml, 4.26 mmol) was then
added dropwise, and the resulting solution was
stirred at room temperature for 20 min. N-
methylpyrrolidinone (4.7 ml) was then added to
the flask, followed by 21.7 mg (0.0426 mmol) of
Pd(P(t-Bu)3)2 and 500 mg (1.71 mmol) of 1-(4-
bromo-2-methoxyphenoxy)-2-methylbenzene after
5 min. The flask was fitted with a reflux condenser
and heated for 48 hours at 130° C. After cooling
by guest on July 28, 2018http://w
ww
.jbc.org/D
ownloaded from
3
gradually to room temperature, 20 ml of a 1.0 M
aqueous HCl solution was added to the flask. The
resulting mixture was extracted with diethyl ether,
the ether extract was washed with water, and dried
over anhydrous MgSO4 and concentrated under
vacuum to give the crude product (1-(4-hexyl-2-
methoxyphenoxy)-2-methylbenzene) which was
purified by flash column chromatography on silica
gel (ethyl acetate/hexane). A solution of boron
tribromide in 1.8 ml of dichloromethane (1.0 M
solution) was added to a solution of the protected
diphenyl ether (1.4 mmol) in 3 ml of dry
dichloromethane at -78° C for 1 hour and then at
room temperature for 3 hours. When thin-layer
chromatography showed that the reaction had
reached completion, the reaction mixture was
quenched with methanol at -78° C and
concentrated to give an oil. A suspension of this
oil in dichloromethane was washed with 10%
aqueous sodium bicarbonate solution and the
organic layer was drawn off, washed sequentially
with water then brine and dried over MgSO4. The
organic layer was filtered, concentrated under
vacuum to give the crude product which was then
purified by flash column chromatography (ethyl
acetate/hexane). 1H NMR (300 MHz, CDCl3): δ
0.87-0.92 (m, 3H), 1.27-1.36 (m, 6H), 1.57-1.63
(m, 2H), 2.30 (s, 3H), 2.52-2.57 (t, J = 7.5 Hz,
2H), 5.56 (s, 1H), 6.61-7.26 (m, 7H); ESI-MS
(m/z): 285.1 (M+1).
Substrate Preparation. Trans-2-dodecenoyl-CoA
(DD-CoA) was synthesized from trans-2-
dodecenoic acid by using the mixed anhydride
method as described previously (17). Aliquots of
the substrate were flash frozen in liquid N2 and
stored at -80 °C.
Expression and purification of InhA. InhA, the
M. tuberculosis enoyl-ACP reductase, was
expressed in E. coli strain BL21(DE3)pLysS. Cells
were induced with 1 mM isopropyl- -D-
thiogalactopyranoside (IPTG) at an OD600 of 0.8
and harvested by centrifugation after shaking for
12 h at 25° C. The bacterial pellet was
resuspended in 20 mM Tris-HCl pH 7.9,
containing 500 mM NaCl and 5 mM imidazole,
lysed by sonication followed by centrifugation at
50000g to remove cell debris. The supernatant was
applied to a nickel affinity column (GE
Healthcare) and InhA was eluted using a gradient
of 60 – 500 mM imidazole. Fractions containing
InhA were pooled and exchanged into 30 mM
Piperazine-1,4-bis(2-ethanesulfonic acid) (PIPES)
buffer pH 6.8 containing 150 mM NaCl and 1 mM
EDTA via desalting columns (GE Healthcare). For
further purification, size exclusion
chromatography was carried out using a Superdex
200 column (GE Healthcare) equilibrated with the
same buffer.
Steady-state kinetic assay. Kinetic assays using
DD-CoA and wild-type InhA were performed as
described previously (9). Reactions were initiated
by addition of InhA to solutions containing
substrate, inhibitor, and NADH in 30 mM PIPES
and 150 mM NaCl, pH 6.8. IC50 values were
determined by varying the concentration of
inhibitor in reactions containing 250 μM NADH,
25 μM DD-CoA, and 100 nM InhA. When the
assays were performed at 10 nM InhA, the enzyme
was stabilized by the addition of glycerol (8%,
v/v) and BSA (0.1 mg/ml). The experimental data
were analyzed using equation 1, where I is the
inhibitor concentration and y is percent activity.
y = 100%/[1 + (I/IC50)] (1)
Data fitting was performed using Grafit 4.0
(Erithacus Software Ltd.).
Progress curve analysis. The slow-onset inhibition
of InhA by PT70 was monitored by adding the
enzyme (5 nM) to assay mixtures containing
glycerol (8%), BSA (0.1 mg/ml), DMSO (2% v/v),
DD-CoA (300 µM), NADH (250 µM), NAD+
(200 µM) and inhibitor (0-480 nM). Reactions
were monitored until the progress curve became
linear, indicating that the steady-state had been
reached. To ensure that substrate depletion would
not significantly affect the reaction rate, low
enzyme concentrations and high substrate
concentrations were used. Progress curves were
analyzed as described previously (13,18). This
involved fitting the data to equation 2,
At = A0 - vst - (vi - vs)(1-γ)*ln{[1-γ*exp(-kobst*t)]/(1-γ)}/(kobs*γ) (2)
where γ = [E]*(1- vs / vi)2/[I], vi and vs are the
initial velocity and steady-state velocity, and kobs is
the observed rate constant for each progress curve.
Values of kobs, vi and vs obtained from equation 2
were then fitted to equations 3 and 4, that describe
a two-step inhibition mechanism in which rapid
binding of the inhibitor to the enzyme is followed
by guest on July 28, 2018http://w
ww
.jbc.org/D
ownloaded from
4
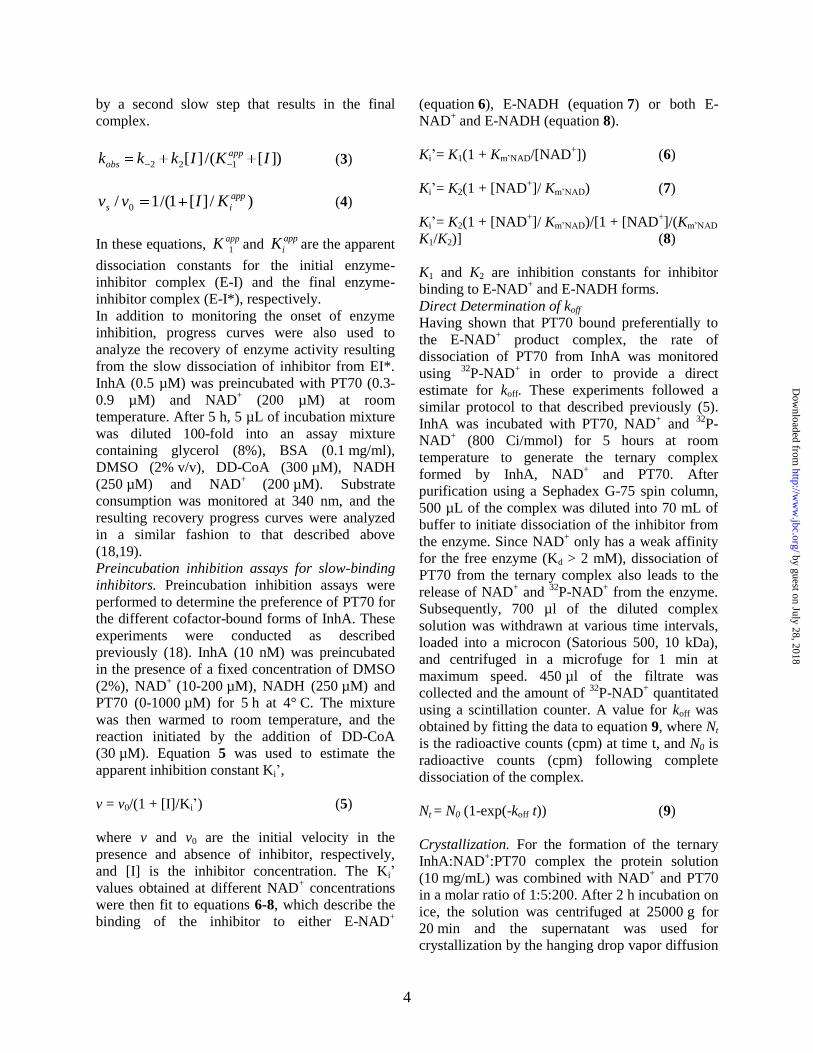
by a second slow step that results in the final
complex.
])[/(][ 122 IKIkkk app
obs (3)
)/][1/(1/ 0
app
is KIvv (4)
In these equations, appK 1 and
app
iK are the apparent
dissociation constants for the initial enzyme-
inhibitor complex (E-I) and the final enzyme-
inhibitor complex (E-I*), respectively.
In addition to monitoring the onset of enzyme
inhibition, progress curves were also used to
analyze the recovery of enzyme activity resulting
from the slow dissociation of inhibitor from EI*.
InhA (0.5 µM) was preincubated with PT70 (0.3-
0.9 µM) and NAD+ (200 µM) at room
temperature. After 5 h, 5 µL of incubation mixture
was diluted 100-fold into an assay mixture
containing glycerol (8%), BSA (0.1 mg/ml),
DMSO (2% v/v), DD-CoA (300 µM), NADH
(250 µM) and NAD+
(200 µM). Substrate
consumption was monitored at 340 nm, and the
resulting recovery progress curves were analyzed
in a similar fashion to that described above
(18,19).
Preincubation inhibition assays for slow-binding
inhibitors. Preincubation inhibition assays were
performed to determine the preference of PT70 for
the different cofactor-bound forms of InhA. These
experiments were conducted as described
previously (18). InhA (10 nM) was preincubated
in the presence of a fixed concentration of DMSO
(2%), NAD+
(10-200 µM), NADH (250 µM) and
PT70 (0-1000 µM) for 5 h at 4° C. The mixture
was then warmed to room temperature, and the
reaction initiated by the addition of DD-CoA
(30 µM). Equation 5 was used to estimate the
apparent inhibition constant Ki’,
v = v0/(1 + [I]/Ki’) (5)
where v and v0 are the initial velocity in the
presence and absence of inhibitor, respectively,
and [I] is the inhibitor concentration. The Ki’
values obtained at different NAD+ concentrations
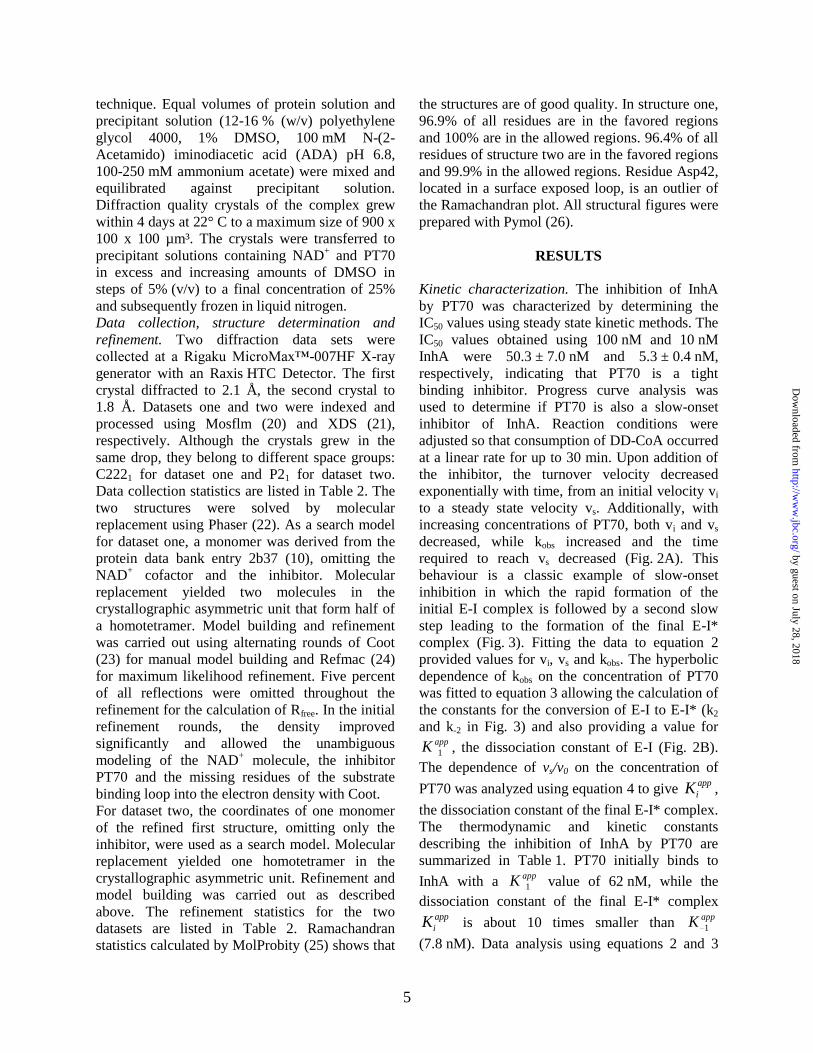
were then fit to equations 6-8, which describe the
binding of the inhibitor to either E-NAD+
(equation 6), E-NADH (equation 7) or both E-
NAD+ and E-NADH (equation 8).
Ki’= K1(1 + Km’NAD/[NAD+]) (6)
Ki’= K2(1 + [NAD+]/ Km’NAD) (7)
Ki’= K2(1 + [NAD+]/ Km’NAD)/[1 + [NAD
+]/(Km’NAD
K1/K2)] (8)
K1 and K2 are inhibition constants for inhibitor
binding to E-NAD+ and E-NADH forms.
Direct Determination of koff
Having shown that PT70 bound preferentially to
the E-NAD+ product complex, the rate of
dissociation of PT70 from InhA was monitored
using 32
P-NAD+
in order to provide a direct
estimate for koff. These experiments followed a
similar protocol to that described previously (5).
InhA was incubated with PT70, NAD+ and
32P-
NAD+ (800 Ci/mmol) for 5 hours at room
temperature to generate the ternary complex
formed by InhA, NAD+ and PT70. After
purification using a Sephadex G-75 spin column,
500 µL of the complex was diluted into 70 mL of
buffer to initiate dissociation of the inhibitor from
the enzyme. Since NAD+ only has a weak affinity
for the free enzyme (Kd > 2 mM), dissociation of
PT70 from the ternary complex also leads to the
release of NAD+ and
32P-NAD
+ from the enzyme.
Subsequently, 700 µl of the diluted complex
solution was withdrawn at various time intervals,
loaded into a microcon (Satorious 500, 10 kDa),
and centrifuged in a microfuge for 1 min at
maximum speed. 450 µl of the filtrate was
collected and the amount of 32
P-NAD+ quantitated
using a scintillation counter. A value for koff was
obtained by fitting the data to equation 9, where Nt
is the radioactive counts (cpm) at time t, and N0 is
radioactive counts (cpm) following complete
dissociation of the complex.
Nt = N0 (1-exp(-koff t)) (9)
Crystallization. For the formation of the ternary
InhA:NAD+:PT70 complex the protein solution
(10 mg/mL) was combined with NAD+ and PT70
in a molar ratio of 1:5:200. After 2 h incubation on
ice, the solution was centrifuged at 25000 g for
20 min and the supernatant was used for
crystallization by the hanging drop vapor diffusion
by guest on July 28, 2018http://w
ww
.jbc.org/D
ownloaded from
5
technique. Equal volumes of protein solution and
precipitant solution (12-16 % (w/v) polyethylene
glycol 4000, 1% DMSO, 100 mM N-(2-
Acetamido) iminodiacetic acid (ADA) pH 6.8,
100-250 mM ammonium acetate) were mixed and
equilibrated against precipitant solution.
Diffraction quality crystals of the complex grew
within 4 days at 22° C to a maximum size of 900 x
100 x 100 µm³. The crystals were transferred to
precipitant solutions containing NAD+ and PT70
in excess and increasing amounts of DMSO in
steps of 5% (v/v) to a final concentration of 25%
and subsequently frozen in liquid nitrogen.
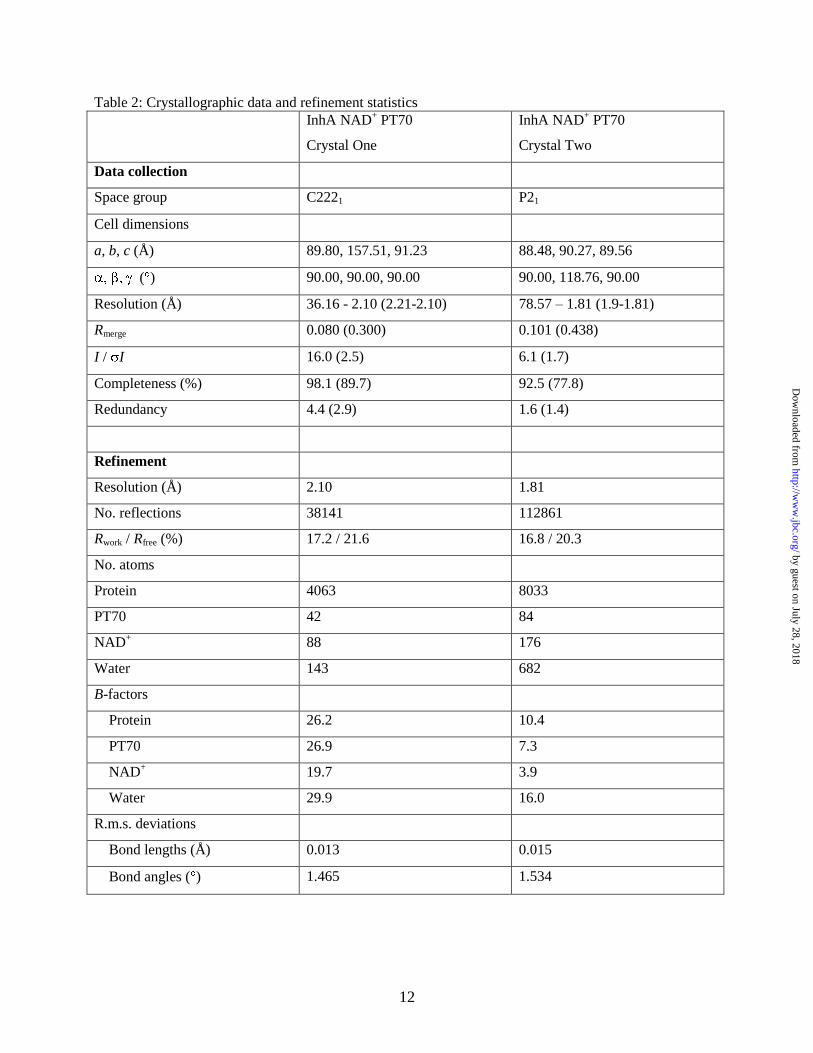
Data collection, structure determination and
refinement. Two diffraction data sets were
collected at a Rigaku MicroMax™-007HF X-ray
generator with an Raxis HTC Detector. The first
crystal diffracted to 2.1 Å, the second crystal to
1.8 Å. Datasets one and two were indexed and
processed using Mosflm (20) and XDS (21),
respectively. Although the crystals grew in the
same drop, they belong to different space groups:
C2221 for dataset one and P21 for dataset two.
Data collection statistics are listed in Table 2. The
two structures were solved by molecular
replacement using Phaser (22). As a search model
for dataset one, a monomer was derived from the
protein data bank entry 2b37 (10), omitting the
NAD+ cofactor and the inhibitor. Molecular
replacement yielded two molecules in the
crystallographic asymmetric unit that form half of
a homotetramer. Model building and refinement
was carried out using alternating rounds of Coot
(23) for manual model building and Refmac (24)
for maximum likelihood refinement. Five percent
of all reflections were omitted throughout the
refinement for the calculation of Rfree. In the initial
refinement rounds, the density improved
significantly and allowed the unambiguous
modeling of the NAD+ molecule, the inhibitor
PT70 and the missing residues of the substrate
binding loop into the electron density with Coot.
For dataset two, the coordinates of one monomer
of the refined first structure, omitting only the
inhibitor, were used as a search model. Molecular
replacement yielded one homotetramer in the
crystallographic asymmetric unit. Refinement and
model building was carried out as described
above. The refinement statistics for the two
datasets are listed in Table 2. Ramachandran
statistics calculated by MolProbity (25) shows that
the structures are of good quality. In structure one,
96.9% of all residues are in the favored regions
and 100% are in the allowed regions. 96.4% of all
residues of structure two are in the favored regions
and 99.9% in the allowed regions. Residue Asp42,
located in a surface exposed loop, is an outlier of
the Ramachandran plot. All structural figures were
prepared with Pymol (26).
RESULTS
Kinetic characterization. The inhibition of InhA
by PT70 was characterized by determining the
IC50 values using steady state kinetic methods. The
IC50 values obtained using 100 nM and 10 nM
InhA were 50.3 ± 7.0 nM and 5.3 ± 0.4 nM,
respectively, indicating that PT70 is a tight
binding inhibitor. Progress curve analysis was
used to determine if PT70 is also a slow-onset
inhibitor of InhA. Reaction conditions were
adjusted so that consumption of DD-CoA occurred
at a linear rate for up to 30 min. Upon addition of
the inhibitor, the turnover velocity decreased
exponentially with time, from an initial velocity vi
to a steady state velocity vs. Additionally, with
increasing concentrations of PT70, both vi and vs
decreased, while kobs increased and the time
required to reach vs decreased (Fig. 2A). This
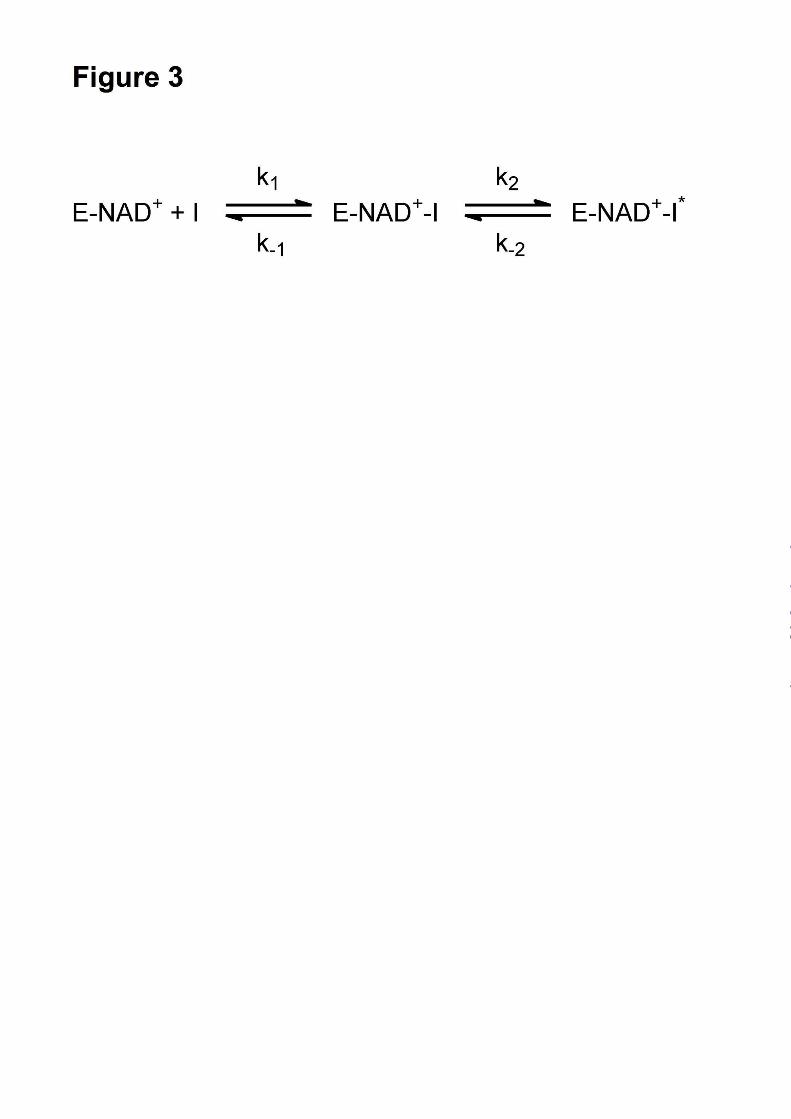
behaviour is a classic example of slow-onset
inhibition in which the rapid formation of the
initial E-I complex is followed by a second slow
step leading to the formation of the final E-I*
complex (Fig. 3). Fitting the data to equation 2
provided values for vi, vs and kobs. The hyperbolic
dependence of kobs on the concentration of PT70
was fitted to equation 3 allowing the calculation of
the constants for the conversion of E-I to E-I* (k2
and k-2 in Fig. 3) and also providing a value for appK 1 , the dissociation constant of E-I (Fig. 2B).
The dependence of vs/v0 on the concentration of
PT70 was analyzed using equation 4 to give app
iK ,
the dissociation constant of the final E-I* complex.
The thermodynamic and kinetic constants
describing the inhibition of InhA by PT70 are
summarized in Table 1. PT70 initially binds to
InhA with a appK 1 value of 62 nM, while the
dissociation constant of the final E-I* complex app
iK is about 10 times smaller than appK 1
(7.8 nM). Data analysis using equations 2 and 3
by guest on July 28, 2018http://w
ww
.jbc.org/D
ownloaded from
6
also provided a value for k-2, the rate constant for
conversion of E-I* to E-I. Assuming that k-1>>k2
and k-2, then k-2 will be equal to koff, the
dissociation rate constant for the formation of
active enzyme from E-I*. The value of k-2
obtained from progress curve analysis of 0.041
min-1
is the same within experimental error to the
values obtained when the recovery of enzyme
activity was monitored (Fig. 2C, 0.044 min-1
), and
when koff was determined directly by following the
dissociation of 32
P-NAD+ from the enzyme-
inhibitor ternary complex (0.043 min-1
). Thus, the
residence time of PT70 on the enzyme (1/koff) is
24 min, which is about 3-fold smaller than that of
the INH-NAD adduct (Table 1). Most diphenyl
ethers, preferentially bind to the E-NAD+ product
complex of InhA and other FabI enzymes and only
occasionally prefer the E-NADH form of the
enzyme (9,27,28,10,29,13)). Preincubation studies
were used to examine which form of the enzyme
PT70 prefers. InhA and PT70 were preincubated
in the presence of saturating NADH (250 µM) and
at different fixed concentrations of NAD+ (10, 30,
50, 100, 200 µM). Assays were initiated by adding
the substrate DD-CoA to obtain the apparent
inhibition constant Ki’ at each concentration of
NAD+. The dependence of Ki’ on the
concentration of NAD+ was fit to equations 6-8
using a KmNAD value of 4 mM and a KmNADH value
of 48 µM. The dependence of Ki’ on the
concentration of NAD+ was best described by
equation 8 (Fig. 2D), indicating that PT70 binds to
both the E-NAD+ and E-NADH forms of the
enzyme albeit with a strong (4000-fold) preference
for the enzyme-oxidized cofactor product complex
(K1 = 0.022 nM, K2 = 90.6 nM, Table 1). The
value of K1 is significantly smaller than that
obtained for app
iK (7.8 nM), however, the latter
was determined at a fixed concentration of NAD+.
Structure of the ternary InhA-PT70-NAD+
complex. The binding of PT70 to InhA and the
basis for the slow binding step was further
characterized by structural studies. Two structures
of the ternary InhA:NAD+:PT70 complex were
solved. The first structure was solved at a
resolution of 2.1 Å resolution, and belongs to
space group C2221 the same space group as in the
ternary InhA complex with 5-octyl-2-
phenoxyphenol and NAD+ (8PP, PDB code 2b37
(10)). The second structure was obtained at 1.8 Å
resolution and belongs to space group P21, which
has not been reported for InhA so far (structural
data are summarized in Table 2) (Fig. 4). The slow
onset inhibitor PT70 binds to the substrate binding
site with the two rings of the inhibitor oriented
almost 90° to each other comparable to the rings
of the diphenyl ethers 5PP and 8PP described
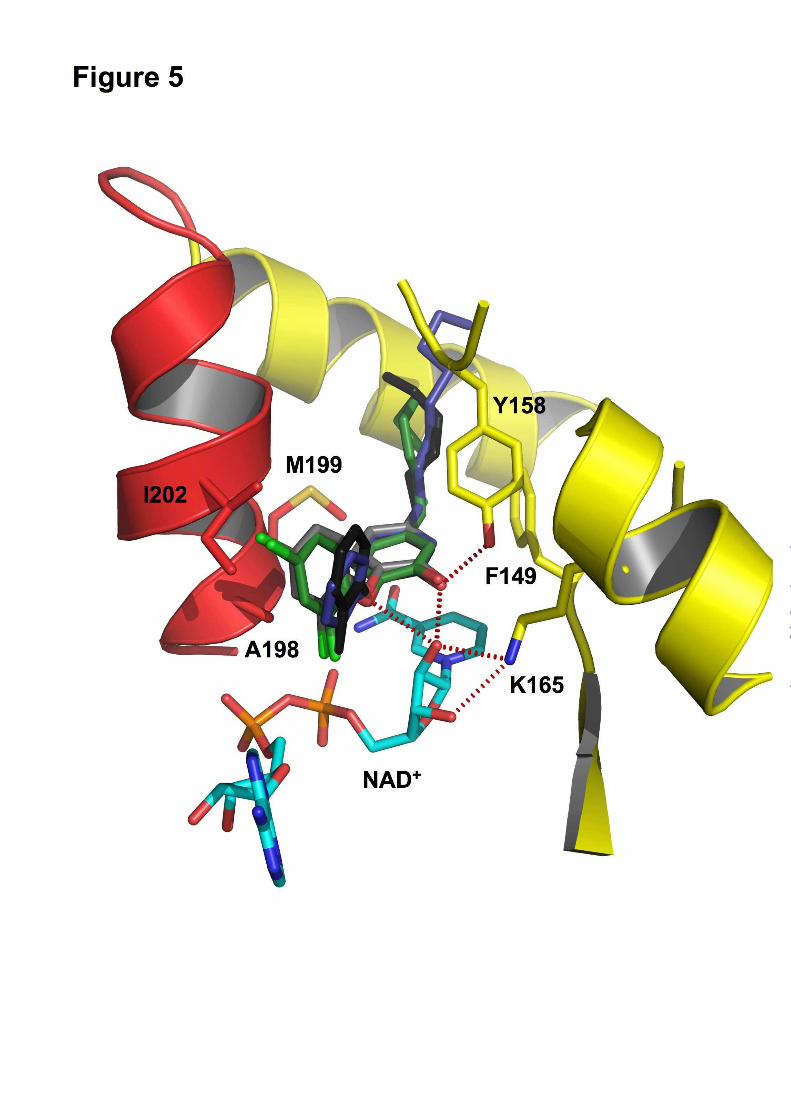
previously (10). Hydrogen bonds are formed
between the inhibitor hydroxyl group and Tyr158
and a hydrogen bonding network is formed
between the 2’-hydroxyl group of NAD+ and
Lys165 (Fig. 5, red dotted lines). A - stacking
interaction between the B-ring of PT70 and the
nicotinamide ring of NAD+ further stabilizes the
conformation of the inhibitor. The alkyl chain of
PT70 extends into the hydrophobic environment of
the substrate binding cavity and forms
hydrophobic interactions with residues Phe149
and Tyr158. Most importantly, however, is the
substrate binding loop (residues 195-210, helix α6)
of the structures reported here, which is ordered
and forms a helix that covers the entrance to the
active site (Fig. 4). Hydrophobic interactions are
formed between the phenyl rings of the inhibitor
and amino acids Ala198, Ile202 and Met199 of the
substrate binding loop (Fig. 5). Ala198 forms
hydrophobic interactions with the B-ring methyl
group at a distance of 3.4 Å, Ile202 with the B-
ring at a distance of 3.7 Å and Met199 interacts
with the A-ring at a distance of 3.8 Å.
Additionally, the PT70 methyl group forms van-
der-Waals contacts to the phosphate groups of the
NAD+ cofactor, resulting in a 1 Å shift of the B-
ring upward relative to its position in 8PP. In
contrast, when triclosan is bound to InhA the B-
ring is tilted by ~25° towards Ile202 of the
substrate binding loop and thereby interferes
sterically with the loop residues, pushing the loop
away from the substrate cavity instead of keeping
it in place (Fig. 5).
DISCUSSION
We have used structure based design to develop a
slow onset inhibitor that directly targets InhA, the
enoyl-ACP reductase of Mycobacterium
tuberculosis. Previous work resulted in the
development of a series of alkyl-diphenyl ethers
that are nanomolar inhibitors of InhA (10). The
best inhibitor of this series, 8PP, is active against
drug sensitive and drug resistant strains of MTB.
by guest on July 28, 2018http://w
ww
.jbc.org/D
ownloaded from
7
Although these inhibitors have high affinity for
InhA, they are still rapid reversible inhibitors.
However, based on these encouraging results we
rationally modified the alkyl-diphenyl ethers in
order to promote interactions between the inhibitor
and the loop that becomes ordered during slow-
onset inhibition.
The resulting inhibitor, PT70, shows improved
affinity for InhA compared to the first generation
compounds reported previously (10,11). Like the
parent compound 5-hexyl-2-phenoxyphenol that
lacks the methyl group (6PP, Fig. 1), PT70 binds
preferentially to the E-NAD+ product. However,
the K1 value of 22 pM for PT70 is ~430-fold
smaller than the Ki’ value of 9.4 nM for 6PP (10),
and thus introduction of the methyl group has
dramatically increased the affinity of the inhibitor
for the enzyme complex. More importantly, this
inhibitor now also displays slow onset inhibition,
which is expected to be crucial for its in vivo
antibacterial activity. Assuming that kon for 6PP is
limited by the rate of encounter of enzyme and
inhibitor (109 M
-1 s
-1), then the Ki’ value of 9.4 nM
allows koff for 6PP to be estimated at 9.4 s-1
, giving
a residence time of 0.1 s for 6PP on the enzyme.
This value is in stark contrast to the residence time
of 24 min for PT70, a 14,000-fold increase
compared to 6PP.
The crystal structures of the ternary
InhA:NAD+:PT70 complex reveal how the
inhibitor is bound to the active site. The observed
hydrophobic interactions and the hydrogen
bonding network of PT70 are similar to the
observed interactions of previously described
triclosan derivatives (10). In addition, however,
PT70 generates hydrophobic interactions to amino
acids Ala198, Met199 and Ile202 which are part of
the substrate binding loop (residues 195-210 in
InhA). This substrate binding loop is disordered in
InhA structures in the presence of triclosan as well
as in the structures with the improved 5PP and
8PP triclosan derivatives which, despite their
improved IC50 values, remain to be rapid
reversible inhibitors (10). In contrast, triclosan is a
slow onset inhibitor of E. coli FabI and the
corresponding crystal structure shows that the
substrate binding loop is ordered (15). The
substrate binding loop is also ordered in the crystal
structure of InhA inhibited by the slow onset INH-
NAD adduct (14). These observations prompted us
to speculate that compounds with the ability to
cause loop ordering will be slow, tight binding
inhibitors of InhA (10). While loop ordering with
respect to INH-NAD binding remains elusive, the
triclosan bound E. coli FabI structure clearly
reveals that the inhibitor forms hydrophobic
interactions with the loop-amino acids Ala196 and
Ala197, which correspond to Ala198 and Met199
in InhA. Additionally, Rozwarski and coworkers
identified in the crystal structure of InhA with a
C16 fatty acyl substrate (30), that hydrophobic
amino acids of the loop are important for proper
substrate binding into the cavity. Interestingly, the
last few carbon atoms of the fatty acid interact
with the hydrophobic amino acids Ala198, Met199
and Ile202. A fatty acid shorter than 16 carbons
might not be accommodated correctly by the
enzyme due to missing interactions with Ala198,
Met199 and Ile202.
These observations strongly suggest that the
interactions with the three amino acids (Ala198,
Met199, Ile202) are important determinants for
loop ordering. An inhibitor, like PT70, that is able
to directly interact with these residues leads to a
defined loop structure. The ordered substrate
binding loop covers the entrance to the binding
pocket and thereby locks the inhibitor into the
cavity and increases its residence time. It is
conceivable that the conformational change of the
loop poses the slow step observed in the binding
studies.
It is important to note that Freundlich and
coworkers recently reported InhA structures
inhibited by triclosan derivatives (11) that have an
ordered substrate binding loop in two of the four
structures (pdb codes 3fng and 3fnh). However, it
was not reported, if the compounds are slow
binding inhibitors. The possibility that loop
ordering is due to intermolecular contacts in space
group I4122, which has not been reported so far for
InhA structures, can not be excluded. In this space
group residues 197-205 of the substrate binding
loop are closely packed with atoms of symmetry
related molecules so that interactions due to
crystallographic packing could be the reason for
the ordered substrate binding loop. This contention
is also supported by the fact that the co-crystal
structures of InhA with the other inhibitors from
this series which crystallized in space group C2
(pdb codes 3fne and 3fnf) remain disordered in the
loop segment. In the case of our PT70 structures,
that crystallized in space groups C2221 and P21,
by guest on July 28, 2018http://w
ww
.jbc.org/D
ownloaded from
8
crystal contacts can be ruled out to be responsible
for loop ordering, and instead the hydrophobic
interactions of the residues with the inhibitor itself
lead to the formation of the stable helix of the
substrate binding loop. Close inspection of the
solvent areas between the molecules in the crystal
packing demonstrate that the closest contact
between two of the loops within the tetramer and
the symmetry related molecule is at least ~5 Å and
no salt bridges or hydrogen bonds exist between
the molecules that directly stabilize the loop.
Finally, the substrate binding loop in the
InhA:NAD+:PT70 structure adopts a different
conformation compared to that observed in other
InhA complexes in which the substrate binding
loop is also ordered. While the loop in the PT70
bound structures is close to the substrate binding
pocket due to hydrophobic interactions with the
inhibitor, the loops in the other structures are
located further from the pocket. Although the fatty
acid in the substrate-bound structure (pdb code
1bvr (30)) does interact with residues Ala198,
Ile202 and Met199, movement of the loop in this
case is thought to be necessary to widen the
binding pocket in order to accommodate the long
chain fatty acid. However, in the InhA complexes
with the triclosan derivative JPL (pdb code 3fng
(11)) and the pyrrolidine carboxamide inhibited
form (pdb code 2h7m (31)), movement of the loop
away from the substrate binding pocket is likely
due to absence of contacts between the inhibitors
and the loop. While a number of contacts are
present between enzyme and inhibitor in the PT70
structure, a detailed analysis of the structural data
suggests that interactions with the side chain of
Ile202, which is turned towards the PT70 B-ring,
is particularly important for orientation of the
substrate binding loop close to the active site.
Although measurements of inhibitor residence
time are not normally incorporated into drug
discovery programs, there is growing evidence
that residence time is a critical factor for in vivo
drug activity (32,12,33,13). In particular, slow
onset inhibitors will spend longer times bound to
their targets compared to rapid reversible
inhibitors, and will remain bound even when free
drug concentrations are low. Recent studies with
the FabI enzyme from F. tularensis highlight the
importance of this concept, where it was seen that
residence time was a better predictor of in vivo
activity than the thermodynamic affinity of the
inhibitor for the enzyme (13).
The new characteristics of PT70 facilitate the
hydrophobic interactions to the important loop
residues of InhA, resulting in slow tight binding
inhibition. Our work supports the prediction that
slow onset inhibition of enoyl-ACP reductases is
indeed coupled to loop ordering. Slow binding and
improved residence time are expected to result in
significant improvements in in vivo antibacterial
activity.
REFERENCES
1. WHO. (2007) WHO Report www.who.int/tb/publications/global_report/2007/pdf/full.pdf.
2. Jain, A., and Mondal, R. (2008) FEMS Immunol. Med. Microbiol. 53(2), 145-150
3. Zhang, Y., Heym, B., Allen, B., Young, D., and Cole, S. (1992) Nature 358(6387), 591-593
4. Banerjee, A., Dubnau, E., Quemard, A., Balasubramanian, V., Um, K. S., Wilson, T., Collins, D.,
de Lisle, G., and Jacobs, W. R., Jr. (1994) Science 263(5144), 227-230
5. Rawat, R., Whitty, A., and Tonge, P. J. (2003) Proc. Nat. Acad. Sci. U.S.A. 100, 13881-13886
6. Barry, C. E., 3rd, Lee, R. E., Mdluli, K., Sampson, A. E., Schroeder, B. G., Slayden, R. A., and
Yuan, Y. (1998) Prog Lipid Res 37(2-3), 143-179
7. Vilcheze, C., Morbidoni, H. R., Weisbrod, T. R., Iwamoto, H., Kuo, M., Sacchettini, J. C., and
Jacobs, W. R., Jr. (2000) Journal of bacteriology 182(14), 4059-4067
8. McMurry, L. M., Oethinger, M., and Levy, S. B. (1998) Nature 394(6693), 531-532
9. Parikh, S. L., Xiao, G., and Tonge, P. J. (2000) Biochemistry 39(26), 7645-7650
10. Sullivan, T. J., Truglio, J. J., Boyne, M. E., Novichenok, P., Zhang, X., Stratton, C. F., Li, H. J.,
Kaur, T., Amin, A., Johnson, F., Slayden, R. A., Kisker, C., and Tonge, P. J. (2006) ACS
chemical biology 1(1), 43-53
11. Freundlich, J. S., Wang, F., Vilcheze, C., Gulten, G., Langley, R., Schiehser, G. A., Jacobus, D.
P., Jacobs, W. R., Jr., and Sacchettini, J. C. (2009) ChemMedChem 4(2), 241-248
by guest on July 28, 2018http://w
ww
.jbc.org/D
ownloaded from
9
12. Copeland, R. A., Pompliano, D. L., and Meek, T. D. (2006) Nature reviews 5(9), 730-739
13. Lu, H., England, K., am Ende, C., Truglio, J. J., Luckner, S., Reddy, B. G., Marlenee, N. L.,
Knudson, S. E., Knudson, D. L., Bowen, R. A., Kisker, C., Slayden, R. A., and Tonge, P. J.
(2009) ACS chemical biology 4(3), 221-231
14. Vilcheze, C., Wang, F., Arai, M., Hazbon, M. H., Colangeli, R., Kremer, L., Weisbrod, T. R.,
Alland, D., Sacchettini, J. C., and Jacobs, W. R., Jr. (2006) Nature medicine 12(9), 1027-1029
15. Ward, W. H., Holdgate, G. A., Rowsell, S., McLean, E. G., Pauptit, R. A., Clayton, E., Nichols,
W. W., Colls, J. G., Minshull, C. A., Jude, D. A., Mistry, A., Timms, D., Camble, R., Hales, N. J.,
Britton, C. J., and Taylor, I. W. (1999) Biochemistry 38(38), 12514-12525
16. am Ende, C. W., Knudson, S. E., Liu, N., Childs, J., Sullivan, T. J., Boyne, M., Xu, H., Gegina,
Y., Knudson, D. L., Johnson, F., Peloquin, C. A., Slayden, R. A., and Tonge, P. J. (2008)
Bioorganic & medicinal chemistry letters 18(10), 3029-3033
17. Parikh, S., Moynihan, D. P., Xiao, G., and Tonge, P. J. (1999) Biochemistry 38(41), 13623-13634
18. Copeland, R. A. (2005) Evaluation of enzyme inhibitors in drug discovery. A guide for medicinal
chemists and pharmacologists., Wiley, Hoboken, New Jersey
19. Williams, J. W., Morrison, J.F., Duggleby, R.G. (1979) Biochemistry 18(12), 2567-2573
20. Leslie, A. G. W. (1992) Recent changes to the MOSFLM package for processing film and image
plate data In. Joint CCP4 + ESF-EAMCB Newsletter on Protein Crystallography
21. Kabsch, W. (1988) Journal of Applied Crystallography 21(1), 67-72
22. McCoy, A. J., Grosse-Kunstleve, R. W., Adams, P. D., Winn, M. D., Storoni, L. C., and Read, R.
J. (2007) Phaser crystallographic software. In. Journal of Applied Crystallography
23. Emsley, P., and Cowtan, K. (2004) Acta crystallographica 60(Pt 12 Pt 1), 2126-2132
24. Murshudov, G. N., Vagin, A. A., and Dodson, E. J. (1997) Acta crystallographica 53(Pt 3), 240-
255
25. Davis, I. W., Leaver-Fay, A., Chen, V. B., Block, J. N., Kapral, G. J., Wang, X., Murray, L. W.,
Arendall, W. B., 3rd, Snoeyink, J., Richardson, J. S., and Richardson, D. C. (2007) Nucleic acids
research 35(Web Server issue), W375-383
26. DeLano, W. L. (2002) The PyMOL Molecular Graphics System. In., Palo Alto, CA, USA.
27. Sivaraman, S., Sullivan, T. J., Johnson, F., Novichenok, P., Cui, G., Simmerling, C., and Tonge,
P. J. (2004) J Med Chem 47(3), 509-518
28. Rafi, S. B., Cui, G., Song, K., Cheng, X., Tonge, P. J., and Simmerling, C. (2006) J Med Chem
49(15), 4574-4580
29. Lu, H., and Tonge, P. J. (2008) Acc. Chem. Res. 41(1), 11-20
30. Rozwarski, D. A., Vilcheze, C., Sugantino, M., Bittman, R., and Sacchettini, J. C. (1999) The
Journal of biological chemistry 274(22), 15582-15589
31. He, X., Alian, A., Stroud, R., and Ortiz de Montellano, P. R. (2006) Journal of Medicinal
Chemistry 49(21), 6308-6323
32. Lewandowicz, A., Tyler, P. C., Evans, G. B., Furneaux, R. H., and Schramm, V. L. (2003) The
Journal of biological chemistry 278(34), 31465-31468
33. Tummino, P. J., and Copeland, R. A. (2008) Biochemistry 47(20), 5481-5492
34. Heinig, M., and Frishman, D. (2004) Nucleic acids research 32(Web Server issue), W500-502
by guest on July 28, 2018http://w
ww
.jbc.org/D
ownloaded from
10
FOOTNOTES
This work was supported in part by grant AI44639 from the National Institutes of Health to P.J.T. and
through the Deutsche Forschungsgemeinschaft (SFB 630 and Forschungszentrum FZ82) to C.K.
The abbreviations used are: 5PP, 5-pentyl-2-phenoxyphenol; 6PP, 5-hexyl-2-phenoxyphenol; 8PP, 5-
octyl-2-phenoxyphenol; ACP, acyl carrier protein; DD-CoA, trans 2-dodecenyl-CoA; INH, isoniazid;
PT70, 2-(o-tolyloxy)-5-hexylphenol.
Coordinates for the crystal structures of the ternary complexes of Mycobacterium tuberculosis
InhA:NAD+:PT70 have been deposited at the RCSB Protein Data Bank with accession codes 2x22 and
2x23.
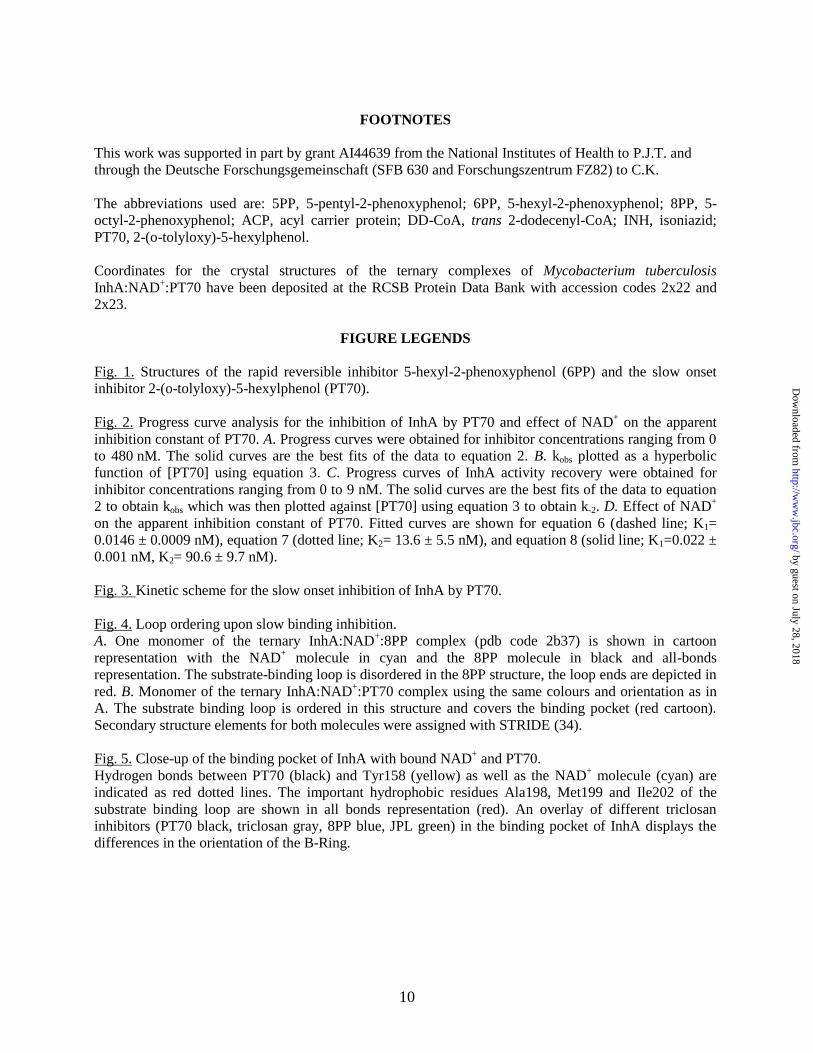
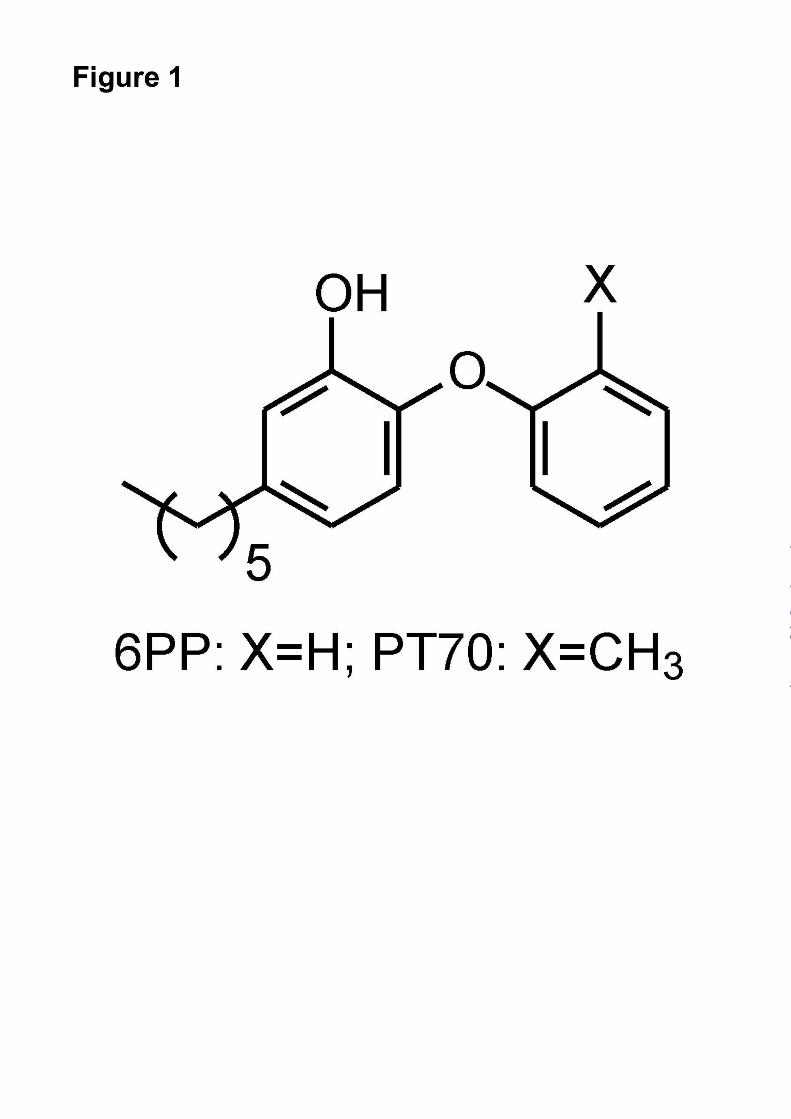
FIGURE LEGENDS
Fig. 1. Structures of the rapid reversible inhibitor 5-hexyl-2-phenoxyphenol (6PP) and the slow onset
inhibitor 2-(o-tolyloxy)-5-hexylphenol (PT70).
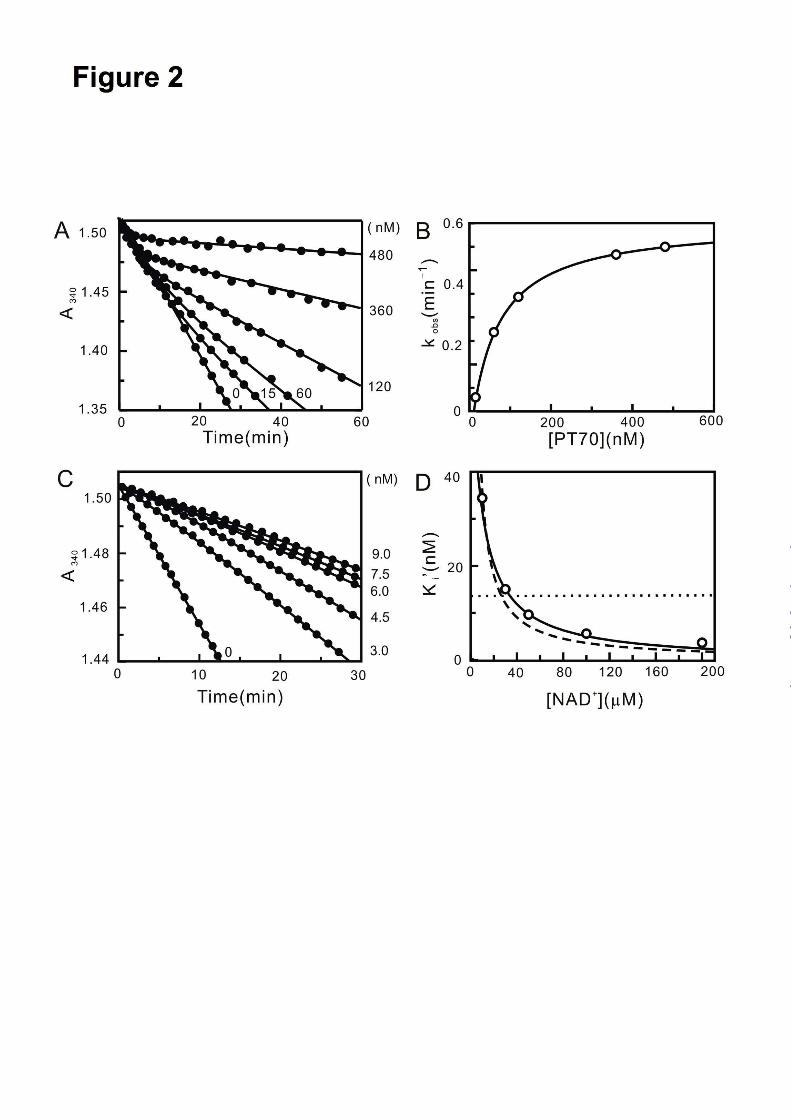
Fig. 2. Progress curve analysis for the inhibition of InhA by PT70 and effect of NAD+ on the apparent
inhibition constant of PT70. A. Progress curves were obtained for inhibitor concentrations ranging from 0
to 480 nM. The solid curves are the best fits of the data to equation 2. B. kobs plotted as a hyperbolic
function of [PT70] using equation 3. C. Progress curves of InhA activity recovery were obtained for
inhibitor concentrations ranging from 0 to 9 nM. The solid curves are the best fits of the data to equation
2 to obtain kobs which was then plotted against [PT70] using equation 3 to obtain k-2. D. Effect of NAD+
on the apparent inhibition constant of PT70. Fitted curves are shown for equation 6 (dashed line; K1=
0.0146 ± 0.0009 nM), equation 7 (dotted line; K2= 13.6 ± 5.5 nM), and equation 8 (solid line; K1=0.022 ±
0.001 nM, K2= 90.6 ± 9.7 nM).
Fig. 3. Kinetic scheme for the slow onset inhibition of InhA by PT70.
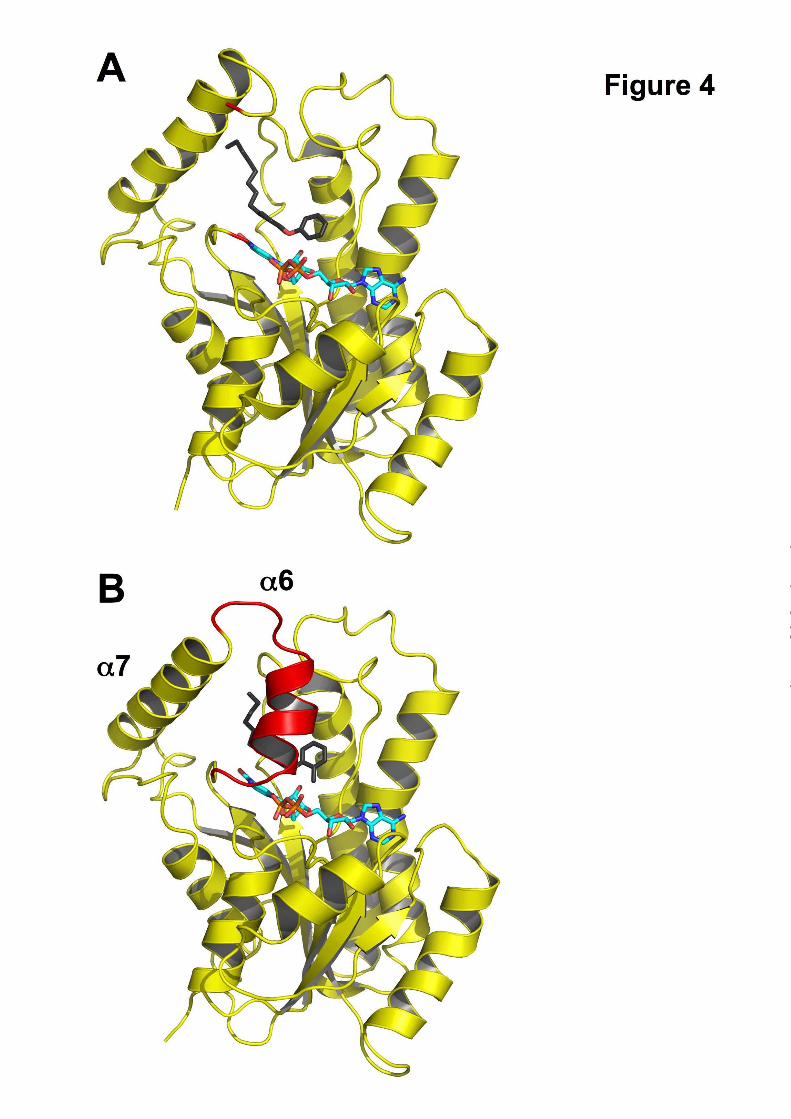
Fig. 4. Loop ordering upon slow binding inhibition.
A. One monomer of the ternary InhA:NAD+:8PP complex (pdb code 2b37) is shown in cartoon
representation with the NAD+ molecule in cyan and the 8PP molecule in black and all-bonds
representation. The substrate-binding loop is disordered in the 8PP structure, the loop ends are depicted in
red. B. Monomer of the ternary InhA:NAD+:PT70 complex using the same colours and orientation as in
A. The substrate binding loop is ordered in this structure and covers the binding pocket (red cartoon).
Secondary structure elements for both molecules were assigned with STRIDE (34).
Fig. 5. Close-up of the binding pocket of InhA with bound NAD+ and PT70.
Hydrogen bonds between PT70 (black) and Tyr158 (yellow) as well as the NAD+ molecule (cyan) are
indicated as red dotted lines. The important hydrophobic residues Ala198, Met199 and Ile202 of the
substrate binding loop are shown in all bonds representation (red). An overlay of different triclosan
inhibitors (PT70 black, triclosan gray, 8PP blue, JPL green) in the binding pocket of InhA displays the
differences in the orientation of the B-Ring.
by guest on July 28, 2018http://w
ww
.jbc.org/D
ownloaded from
11
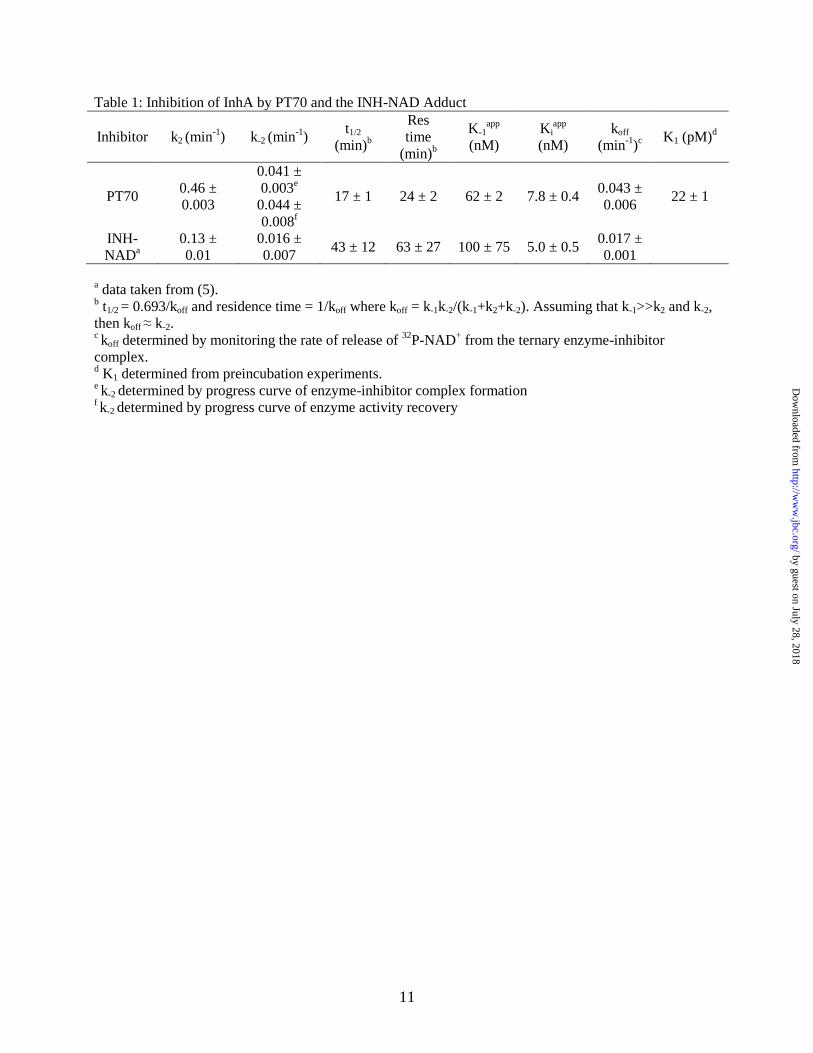
Table 1: Inhibition of InhA by PT70 and the INH-NAD Adduct
Inhibitor k2 (min-1
) k-2 (min-1
) t1/2
(min)b
Res
time
(min)b
K-1app
(nM)
Kiapp
(nM)
koff
(min-1
)c K1 (pM)
d
PT70 0.46 ±
0.003
0.041 ±
0.003e
0.044 ±
0.008f
17 ± 1 24 ± 2 62 ± 2 7.8 ± 0.4 0.043 ±
0.006 22 ± 1
INH-
NADa
0.13 ±
0.01
0.016 ±
0.007 43 ± 12 63 ± 27 100 ± 75 5.0 ± 0.5
0.017 ±
0.001
a data taken from (5).
b t1/2 = 0.693/koff and residence time = 1/koff where koff = k-1k-2/(k-1+k2+k-2). Assuming that k-1>>k2 and k-2,
then koff ≈ k-2. c koff determined by monitoring the rate of release of
32P-NAD
+ from the ternary enzyme-inhibitor
complex. d K1 determined from preincubation experiments.
e k-2 determined by progress curve of enzyme-inhibitor complex formation
f k-2 determined by progress curve of enzyme activity recovery
by guest on July 28, 2018http://w
ww
.jbc.org/D
ownloaded from
12
Table 2: Crystallographic data and refinement statistics
InhA NAD
+ PT70
Crystal One
InhA NAD+ PT70
Crystal Two
Data collection
Space group C2221 P21
Cell dimensions
a, b, c (Å) 89.80, 157.51, 91.23 88.48, 90.27, 89.56
( ) 90.00, 90.00, 90.00 90.00, 118.76, 90.00
Resolution (Å) 36.16 - 2.10 (2.21-2.10) 78.57 – 1.81 (1.9-1.81)
Rmerge 0.080 (0.300) 0.101 (0.438)
I / I 16.0 (2.5) 6.1 (1.7)
Completeness (%) 98.1 (89.7) 92.5 (77.8)
Redundancy 4.4 (2.9) 1.6 (1.4)
Refinement
Resolution (Å) 2.10 1.81
No. reflections 38141 112861
Rwork / Rfree (%) 17.2 / 21.6 16.8 / 20.3
No. atoms
Protein 4063 8033
PT70 42 84
NAD+ 88 176
Water 143 682
B-factors
Protein 26.2 10.4
PT70 26.9 7.3
NAD+ 19.7 3.9
Water 29.9 16.0
R.m.s. deviations
Bond lengths (Å) 0.013 0.015
Bond angles ( ) 1.465 1.534
by guest on July 28, 2018http://w
ww
.jbc.org/D
ownloaded from
Sylvia R. Luckner, Nina Liu, Christopher W. am Ende, Peter J. Tonge and Caroline KiskerMycobacterium tuberculosis
A slow, tight-binding inhibitor of InhA, the enoyl-ACP reductase from
published online March 3, 2010J. Biol. Chem.
10.1074/jbc.M109.090373Access the most updated version of this article at doi:
Alerts:
When a correction for this article is posted•
When this article is cited•
to choose from all of JBC's e-mail alertsClick here
by guest on July 28, 2018http://w
ww
.jbc.org/D
ownloaded from


![[김지오]Hold me tight](https://img.pdfslide.tips/doc/110x75/553f13f2550346b2098b46bd/hold-me-tight.jpg)