Embed Size (px)
Citation preview
ASTUDYOFTHEINVESTMENTANDFINANCINGOFELECTRICITY
GENERATIONINTHEFACEOFCHANGINGDEMANDIN
SOUTHAFRICA
BY
GARETHFOULKESJONES
LEGALDISCLAIMER:
This document has been compiled for informational purposes. The
informationhereinissubjecttoupdating,completionandamendment.
ThecontentsofthisProgressReportarestrictlyconfidential.Thisdocument
isnottobedistributedtoanythirdpartyinwholeorinpartexceptwiththe
prior and express consent of IMPERIAL CYGNUS INVESTMENTS (Pty) Ltd
(ICI).
TheinformationcontainedintheReportisselectiveanddoesnotconstitute
allthedocumentationrelatedtotheProjectthusfar. Suchinformationwill
bemadeavailableuponrequest.
ABSTRACT
Thisstudyconsidersthecurrentstateofelectricitydemandandsupplywithinthe
South African market and how same may evolve until 2030. It estimates the
demand for electricity in South Africa and the corresponding required
investment. Assuming GDP growth trajectories of 3% and 6%, the study
estimatedthecostofelectricityrequiredbetween2010and2030.Usinggrowth
ratesof3%peryearthestudyestimatesthatthecountrymustinvestaboutR27
billion intoelectricitygeneration. Usinggrowthratesof6%peryear thestudy
estimates that the country must invest about R232 billion into electricity
generation. This suggests a massive investment requirement. The study also
considers thepossiblealternative that canbeused toraise the funds including:
using ESKOM’s internal resources, government resources (through taxes),
increasingthepriceofelectricity,andborrowingfrommultilateralorganizations
suchas theWorldBank(probablywithgovernmentguarantees). Thedifferent
optionsmusthowevertakeintoaccountESKOM’Sfinancialpositionaswellasits
roleasadevelopmentalentityratherthanaprivatefirm.
By
GarethFoulkesJones
TABLEOFCONTENTS
CHAPTER1:INTRODUCTION
1.1 Background 1
1.2 Scope 7
1.3 ProblemStatement 7
1.4 Outcome 9
CHAPTER2:LITERATUREREVIEW
2.1 Introduction 13
2.2 EmpiricalLiteratureReview 14
2.3 TheoreticalFramework 24
2.4 Conclusion 25
CHAPTER3:RESEARCHMETHODOLOGY
3.1 Introduction 26
3.2 Quantitative/QualitativeResearchApproach 29
3.3 DataSources 31
3.4 Conclusion 35
CHAPTER4:RESULTSANDDISCUSSIONOFRESEARCHFINDINGS
4.1 Introduction 36
4.2 RegressionResults 37
4.3 ForecastingElectricityDemandorConsumption 41
4.4 EstimatingRequiredInvestment 48
4.5 FinancingInvestment 53
4.6 CompetitorAnalysis 53
4.7 DegreeofRegulation/Deregulator 56
4.8 ProductandServicesPricingStrategies 57
4.9 BarrierstoEntry 63
4.10 Conclusion 69
CHAPTER5:CONCLUSIONSANDRECOMMENDATIONSFORFURTHERRESEARCH
5.1 Introduction 71
5.2 ConclusionandPolicyRecommendation 71
5.3 PolicyRecommendation 78
5.4 LimitationsofStudy 80
BIBLIOGRAPHY&REFERENCES 82
LISTOFTABLES
Table1 SouthAfricaMacro‐EconomicIndicators 3
Table2 SouthAfrica’sPopulationbyProvince 4
Table3.1 DataSources 32
Table3.2 DescriptiveStatistics 33
Table3.3 CorrelationMatrix 34
Table4.1 DemandforElectricityinSouthAfrica 37
Table4.2 ForecastedElectricityConsumption/Demand(2010–2030) 42
Table4.3 ForecastedElectricityConsumption/Demand(Assuming6%GDPGrowth) 45
Table4.4 Scenario1:RequiredInvestmentAssuming3%GDPGrowthRate 49
Table4.5 Scenario2:RequiredInvestmentAssuming6%GDPGrowthRate 51
Table4.6 TheTariffDesignProcess 60
Table4.7 SWOTAnalysisforESKOM 64
Table4.8 ESKOMGroupFinancialPerformance 68
LISTOFFIGURES
Figure4.1 ForecastedElectricityDemand(AssumingGDPGrowthRateequalto3%) 44
Figure4.2 ForecastedElectricityDemand(AssumingGDPGrowthRateequalto6%) 46
Figure4.3 ComparisonofScenario1and2ForecastedElectricityConsumption 47
Figure4.4 ANaturalMonopolistsDemandandCostCurves 56

‐1‐
CHAPTER1
Introduction
1.1 Background
TheSouthAfricaneconomy isoneof themostdevelopedand industrialized inAfrica.
Furthermore, SouthAfrica is largelydominatedby secondaryandservice sectors, the
twoofwhichaccountedformorethan80%ofthecountry’sGDPin2008(Muradzikwa,
2009).Thenationconsistsofapopulationofsome50millioninhabitants,55%ofwhom
areprojectedtoliveinurbanareas.Between2000and2007theeconomygrewbyan
averageof4%perannum, inkeepingwith theSouthAfricanGovernment’s economic
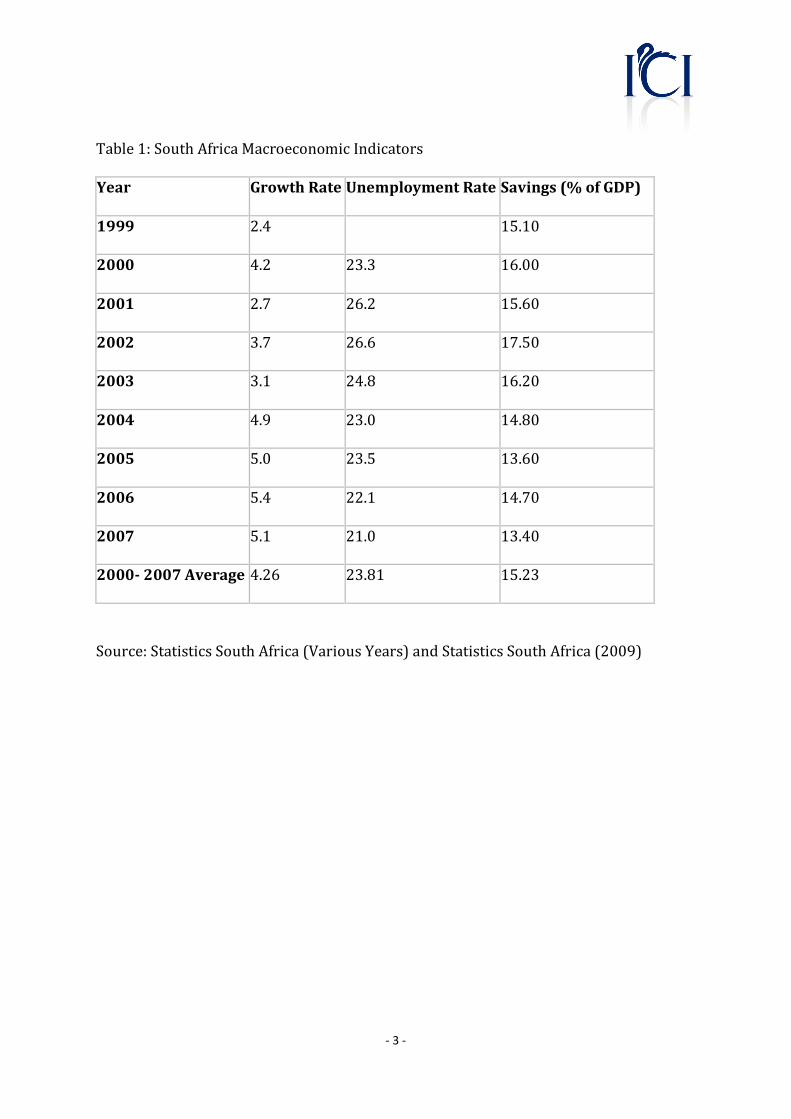
policy. Please refer to Table 1 below, which displays the principal macro‐economic
indicatorsforthecountry.
Despite its marked degree of sophistication in certain respects, it is important to
observe that the South African energy sector consists of both first and third world
elements. Elaborating upon this, South Africa produces approximately 45% of the
electricityontheAfricancontinentandisthe12thhighestcarbonemitterintheworld.
Thislatterstatisticisattributabletotheextensiveuseofcoal‐firedpowerstations,with
a limited contribution from a combinationof hydro and nuclear power (DME, 2000).
Oneofthegivenreasonsforthepopularityofcoalinenergygenerationisonaccountof
itsrelativecheapnessandavailabilitycoupledwithSouthAfrica’s technologicalability
‐2‐
to use low‐grade coal for effective electricity generation. It is also pertinent that
renewable forms of energy constitute no more than approximately 5% of the total
energysupplyasobservedbyHowellsetal(2005).
Furthermore,despitetheevidentleveloftechnologicalsophisticationwithintheSouth
African electricity sector, over 75%of SouthAfrica’s rural households use fuelwood
energytoatleastalimitedextentinordertosatisfytheirenergyneeds.Thislevelofuse
asobservedbyDavis(1998)variesfromafewtimespermonthtodaily,anddepends
largelyupontheindividualneedsandconditionsoftherespectivehouseholds.Overand
above fuelwood, such rural households alsomake extensive use of paraffin, candles,
batteries and reticulated electricity for a variety of applications. However, it was
observed by Davis (1998) that such alternatives are often found to be somewhat
expensivealternativestothatoffuelwood.
‐3‐
Table1:SouthAfricaMacroeconomicIndicators
Year GrowthRate UnemploymentRate Savings(%ofGDP)
1999 2.4 15.10
2000 4.2 23.3 16.00
2001 2.7 26.2 15.60
2002 3.7 26.6 17.50
2003 3.1 24.8 16.20
2004 4.9 23.0 14.80
2005 5.0 23.5 13.60
2006 5.4 22.1 14.70
2007 5.1 21.0 13.40
20002007Average 4.26 23.81 15.23
Source:StatisticsSouthAfrica(VariousYears)andStatisticsSouthAfrica(2009)
‐4‐
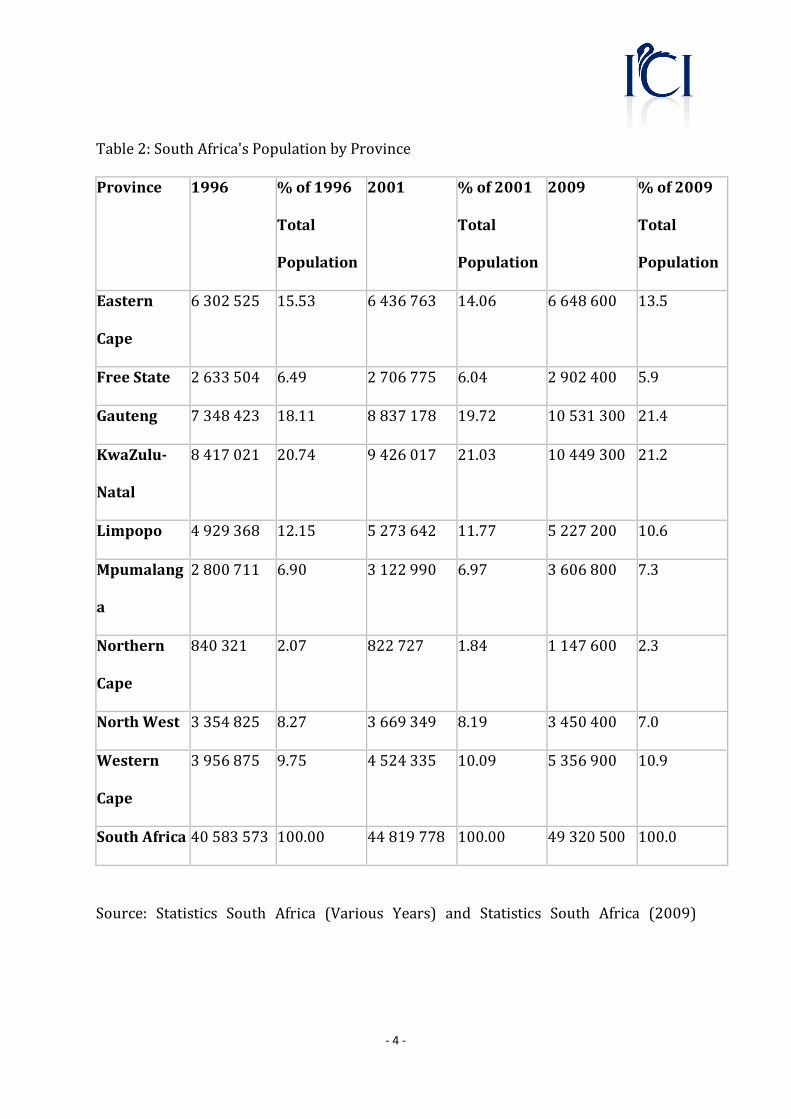
Table2:SouthAfrica'sPopulationbyProvince
Province 1996 %of1996
Total
Population
2001 %of2001
Total
Population
2009 %of2009
Total
Population
Eastern
Cape
6302525 15.53 6436763 14.06 6648600 13.5
FreeState 2633504 6.49 2706775 6.04 2902400 5.9
Gauteng 7348423 18.11 8837178 19.72 10531300 21.4
KwaZulu
Natal
8417021 20.74 9426017 21.03 10449300 21.2
Limpopo 4929368 12.15 5273642 11.77 5227200 10.6
Mpumalang
a
2800711 6.90 3122990 6.97 3606800 7.3
Northern
Cape
840321 2.07 822727 1.84 1147600 2.3
NorthWest 3354825 8.27 3669349 8.19 3450400 7.0
Western
Cape
3956875 9.75 4524335 10.09 5356900 10.9
SouthAfrica 40583573 100.00 44819778 100.00 49320500 100.0
Source: Statistics South Africa (Various Years) and Statistics South Africa (2009)
‐5‐
Having established a broad overviewof the SouthAfrican electricity sector, onemay
nowconsider ingreaterdetail theoriginsof itskeyplayer in the formofESKOM. Its
originswerefoundedintheElectricitySupplyCommission(ESCOM)in1922.TheSouth
AfricanGovernmentthenproceededtoconsolidatethenation’selectricitysupplywithin
this new entity. By 1948, ESCOM exercised a monopoly over the country’s power
stations and high voltage transmission lines. ESCOM proceeded upon an upward
trajectory over the following decades ultimately resulting in the completed
interconnectednationaltransmissiongridintheearly1970’s.
However,asaresultofacommissionofinquiryin1983,ESCOMwasrenamed“ESKOM”.
Furthermore,theElectricityActof1987wasalsoimplementedduringthisperiod.This
latteractresultedinESKOMabandoningitscoreoperatingprincipleof“neitheraprofit
noraloss”andtherebyobligedtheorganizationtosupplyelectricityinacost‐effective
manner,withintheconfinesofitslimitedresourcesandinconsiderationofthenational
interest.
These policies, coupled with conditions, which encouraged ESKOM to become more
operationally efficient, resulted in South Africa enjoying a well‐developed electricity
generationanddistributionsystembytheearly1990s.However,theapartheidpolicies
which had fostered such development had meant that the industrial sector and the
privileged white minority were given priority to electricity supply, whilst excluding
much of rural South Africa and resulting in enormous backlogs in the number of
‐6‐
connections forurbanblackhouseholds.Asa consequence,Ziramba (2008)observed
thatby1991,onlyathirdofSouthAfrica’spopulationhadaccesstoelectricity.
Againstthisbackground,themodernESKOMremainsthesolesupplierofelectricityin
South Africa in real terms, and is statistically responsible for approximately 96% of
electricity generation (ESKOM Annual Report, 2007). The remaining 4% is split
betweenprivategeneratorsaccountingfor3.2%,andmunicipalauthoritiesaccounting
for the final 0.8% of supply. Furthermore, with the exception of the Motraco line,
ESKOM owns all transmission lines throughout South Africa. Presently, ESKOM is
responsible for generating approximately 45%of the electricity used in Africawhich
equates to roughly 38 000 MWe per annum (ESKOM, 2007). It is noteworthy that
approximately 88% of this output is derived from Coal, 2% by hydro‐electric
generation, 5% by nuclear power, 4% by pumped storage and 1% by oil‐fired gas
turbines (ESKOM, 2007). Therefore, whilst ESKOM has endeavoured to diversify its
energysupply,itisnonethelessstillheavilydependentuponCoalasitsprincipalenergy
source.Intermsofdistribution,ESKOMalsoenjoysadominantposition.Tothisend,it
is responsible for nearly 60% of all direct sales to the 40% of electricity capacity
distributed by 177 amalgamatedmunicipal authorities as according toMabugu et al.
(2008).
WithinSouthAfrica,ESKOMcontinuestosellelectricitytoavariedsetofclients,which
includeindustrial,mining,commercial,agriculturalandresidentialcustomers.Overand
‐7‐
above such direct sales, it also sells to a number of redistributors. Furthermore,
according to ESKOM (Annual Reports, 2006 and 2007), ESKOM’s transmission lines
span the approximately26,000kilometers throughoutSouthAfricaaswell as several
otherSouthernAfricanDevelopmentCountries(SADC).
It is also noteworthy that in respect of ESKOM’s operations within the electricity
industry, legislation was passed in 2001, which converted ESKOM into a tax‐paying
public entity,which is in turnwholly state‐owned. Itmay alsobe furtheropined that
whereonehasalargenumberofdistributorswithinaparticularmarket,thismayresult
in a highly fragmented and inefficient Electricity Distribution Industry (EDI).
Consequently, the government effected such legislation in 2001 in order to help
rationalize the EDI. This policy resulted in a further consolidation of electricity
distribution assets held by ESKOMand local governments into six regional electricity
distributors(REDs).Theintentionbehindthiswastopromotegreatercompetitiveness
inelectricitygeneration,Furthermore,theaforementionedrestructuringaimstocreate
an ESKOM owned subsidiary to retain 70% of the generation market share. The
remaining 30% would be shared between private independent power producers
constituting20%andBlackEconomicEmpowermentGroupsmakingupthefinal10%.
It is argued that such reforms to the EDIwould result in a reliable and high quality
service being provided to all electricity consumers, and thereby help to promote the
Governments twin objectives of providing affordable electricity and meeting stated
nationalelectrificationobjectives.
‐8‐
Theresultsofthisstudyareintendedtoleadtoabetterunderstandingofthedifferent
challengeswhichESKOMfaces,whichrangefromtheneedtoinvestefficientlytomeet
growing demand in the face of limited resourceswithwhich to do so, aswell as the
seeking of timely financing for such investments and selecting politically and
economicallyviablesourcesoffundstofinancesuchprojects.
1.2 Scope
The study utilized annual historical data for ESKOM for the period 1980 to 2009 in
order to forecast the demand for electricity and the requisite corresponding level of
investment(capitalexpenditure)requiredtomeetsuchdemand.
ThestudyalsoexaminesESKOM’sfinancialstatementsinordertoassessthesourcesof
fundswhichhavebeenusedinordertofinancetheinvestmentsinthepast.
Finally, themain objective of this study is therefore to better understand the role of
ESKOM in theSouthAfricanenergy sector, given thegrowingdemand forenergyand
the strategic goals of the company. More particularly, the aim is to forecast the
investmentrequiredtomeetSouthAfrica’sgrowingdemandforelectricity.Inorderto
achieve this objective, this research aims to forecast South Africa’s demand for
electricityoverthenext15yearsandthecorrespondingrequiredlevelsofinvestment.
‐9‐
Thisobjectiveisimportantgiventherecentoutageswhichhaveadverselyaffectedthe
economy,onaccountofdemandregularlyexceedingsupply.
1.3 ProblemStatement
SouthAfricahasbeensubjectedtonumerousblackoutsinrecentyears.Inlightofthis,
the South African government has attempted to manage the demand for electricity.
Unfortunately,itiswidelybelievedthatsuchelectricitysupplychallengeswereinfact
predominantly the result of political indecision. In the early 2000’s therewere also
some debates onwhether ESKOM should be privatized or not. During this particular
period, the government as the sole shareholder underinvested in electricity capacity
building.Thisdearthofinvestmenteventuallyresultedintheelectricitycrisiswhichthe
countrynowfindsitselfcontendingwith.
TheimpactoftheaforementionedblackoutsapproximatedtoalossofR50Billionfor
the South African economy in that period (Inglesi, 2010). Furthermore, during this
period,thelevelofeconomicgrowthinthefirstquarterof2008fellto1.6%from5.4%
inthelastquarterof2007(Inglesi,2010).
‐10‐
Giventheabovebackground,theauthorhassoughttoaddressthefollowingquestions
inthisdissertation:
1) What factors drive electricity consumption in South Africa and how is
consumptionlikelytochangeoverthenext10years?
2) Whatisthelevelofinvestmentrequiredtomeetsuchdemand/consumption?
3) Howshouldthislevelofdemandbefinanced?
Thereareanumberofreasonswhyastudyofthisnatureshouldbeconducted.Someof
thereasonsinthisinstancemaybestipulatedasfollows;
Itwill assist in highlighting the required investment necessary tomeet the country’s
electricitysupplyneeds;
Itwill informpolicymakers on the differentoptions available in respect of financing
electricitygenerationinthecountry;and
ThestudywillalsocontributetothediscussionssurroundingelectricitypricinginSouth
Africa.
‐11‐
1.4 Outcome
Thisresearchwillhelppolicymakersinthreeprincipalways.Thesemaybestipulated
asfollows;
(i) ItwillcontributetothedebatearoundelectricitygenerationinAfricancountries
ingeneralandSouthAfrica inparticular.This isespecially importantgiventhe
suggestionbycommentatorsthatSouthAfricashouldinvestinhydro‐electricity
generation. The Inga Dam in the Democratic Republic of Congo by way of
examplehas suchvast electricitygenerationpotential, that itwouldbeable to
generatesufficientelectricitytosatisfytheneedsoftheentireAfricancontinent,
wereittobeproperlyharnessed.
(ii) Itwillalsoaidtheformulationofpolicy,giventhattherearepresentlyeffortsto
reform the South African energy sector in order to secure reliable and cost
effective supplyovertheensuingyearsanddecades.Consequently,anaccurate
estimation of the demand for electricity will assist policy makers as they
endeavour to secure the requisite supply of electricity for all sectors of the
economy.
(iii) ConsideringthemonopolisticnatureofESKOM,itisreasonabletoassertthatthe
national pricing policy is controlled by the government. Consequently, it is
critical to consider the appropriate funding structure for such a monopolistic
‐12‐
parastatal.Thisaspectofthestudybearsrelevancetothequestionastowhether
ESKOMisinfactmoreofacommercialordevelopmentalentity.
With conclusion of the introduction, onemay now reviewwhat the ensuing Chapter
shall consider. Chapter Two shall provide a comprehensive review of existing and
pertinent literature pertaining to the subjectmatter. Following same, Chapter 3 shall
considerthemethodologyutilizedtoderivetheresultsinthepaper,aswellasexplain
thereasonswhysuchamethodologyisemployedinthisinstance.Chapter4willseekto
explaintheresultsderivedfromthemethodologyemployedinChapter3asappliedto
theempirical information inChapter2andadditionalsources.Finally,Chapter5shall
providedaconclusionofalltheaforementionedChapters,andwhererelevanttoreview
same.

‐13‐
CHAPTER2
LiteratureReview
2.1 Introduction
Theaimofthissectionistoreviewrelevantliterature.Itishopedthatsuchaliterature
reviewwillhelpusbetterunderstandwhathasbeendoneandthusenableustoidentify
gapsintheliteraturethatneedtobefilled.Itwillalsohelpusrationalizethecontextof
the problem especially given the current debate on climate change and the financial
crisis. The literature review section is made up of two main components. The first
section considers the empirical literature.This is then followed by the section,which
considersthetheoreticalframeworkuponwhichthispaperisbased.
Theauthormusthastentocautionthatsomeoftheextantliteratureoncapitalstructure
is largely based on private‐owned firms rather than on parastatals such as ESKOM.
Consequently, the reader must bear in mind that conclusions drawn from such
literature,unlikeotherfirmswhichareprivatelyownedandarethusownedbyprivate
shareholderspursuingprofits,ESKOMisagovernmentownedentity,essentiallyowned
by taxpayers.Whilst its goals aredifferent,ESKOMoften raises finance in the capital
marketslikeanyprivatefirm.Ithoweverhasadditionalsourcesoffundsintheformof
government and multilateral organizations like the World Bank, Development Bank
Southern Africa and African Development bank among others. The government is
‐14‐
believedtohaveguaranteedtherecentloanthatwasadvancedtoESKOMbytheWorld
Bank.
2.2 EmpiricalLiteratureReview
Generally there is adearthof literatureon theenergy sector inSouthAfrica, and the
electricity sector in particular (Inglesi. 2010). However, the 2007‐2008 energy crisis
whichplungedtheSouthAfricaneconomyintobothliteralandfigurativedarkness,and
thecurrentcampaignbyorganizationssuchastheWorldBankonthesustainableuseof
energyresourceshasseentheproliferationofstudiesonenergyandelectricityusage.
See for example studies by Inglesi (2010), Ziramba (2008), Odhiambo (2009), and
Bogetic and Fedderke (2005). According to Bogetic and Fedderke (2005) there are
three main reasons why forecasting infrastructure investment needs is important in
Sub‐Saharan Africa (SSA), in general, and South Africa, in particular. Firstly, there is
evidence of a strong relationship between infrastructure investment and economic
growth. Secondly, in South Africa, there have been various efforts to stimulate
infrastructure on account of its pivotal role in spurring economic growth within the
country’s Accelerated Shared Growth Initiative in South Africa (ASGISA) strategy.
Thirdly,thereisalsoalinkbetweeninfrastructureinvestmentorinfrastructurequality,
ontheonehand,andequityandpoverty,ontheother.Thisisespeciallygermaneforthe
SouthAfricaneconomygiven itshistoricalbackgroundwhereaccessto infrastructure,
amongotherthingswasthepreserveofaminoritygroup.
‐15‐
ThestudiesonelectricitydemandcanbedividedintothosethatfocusedonSouthAfrica
andthosewhicharefocusedonothercountries.ThosethatfocusedonSouthAfricacan
further be subdivided into thosewhich attempted to estimate residential demand for
electricity and those that attempted to estimate the aggregate demand for electricity.
Thosepaperswhich concernedSouthAfricawere generallyaggregate innature, and
include: Bogetic and Fedderke (2005), Perkins, Fedderke and Luiz (2005), Odhiambo
(2009), Amusa et al (2009), Dergiades and Tsoulfidis (2008), Holtedahl and Joutz
(2004),Narayanetal(2007)andInglesi(2010).Thosefocusedonresidentialdemand
forelectricity include:Louwet al (2008),DonatosandMergos (1991),Hondroyiannis
(2004) and Walker (1979). In the following section we look at these studies and
criticallyanalysetheirfindings.
Usingdynamicheterogeneouspanelestimationtechniqueandapanelof52countries,
BogeticandFedderke(2005)estimateddemandfunctionsforelectricity.Theycovered
theperiod1980‐2002.They then forecasted thedemand forelectricity from2002 to
2010 and found that South Africa will need to invest about 0.2% of its GDP into
electricity generation (assuming a growth rate of 3.6 per annum). The figure would
double(to0.4%ofGDP) if theeconomyisassumedtogrowat6%perannum(asper
theASGISApolicyframework).
In a related paper Perkins, Fedderke and Luiz (2005) analyzed South Africa
infrastructure investment. The paper’s principle aim was to initiate some work on
‐16‐
infrastructure and its role in development by developing a number of infrastructure
development indicators in South Africa for the period 1870 ‐2002. The paper also
attempted to analyze the link between economic growth and infrastructure
development. The paper produced three key findings. Firstly, they found that the
relationship between infrastructure and economic growth tends to be bi‐directional.
That is, investment in infrastructure tends to spur economic growth. But economic
growthalsotendstobeassociatedwithanincreaseininfrastructureneeds.Hencethe
causalityisnotunidirectional.Soeventhoughmoststudiestendtoestimateregression
equations with an endogenous economic growth and exogenous infrastructure, the
studybyPerkins,FedderkeandLuiz(2005)seemstosuggestthatinfrastructureisalso
endogenous. Secondly, Perkins, Fedderke and Luiz (2005) argue that South Africa’s
infrastructurehasdevelopedinphasesanditmaythusbeimportantforpolicymakers
to choose the right type of infrastructure and focus on it – rather than taking a
haphazardapproachtoinfrastructureinvestment.Mostimportantly,theprojectsmust
be chosen based on appropriate cost‐benefit analysis (Perkins, Fedderke and Luiz,
2005).
Using data from for the period 1971 – 2006, Odhiambo (2009) examined the
relationshipbetweenelectricityconsumptionandeconomicgrowthinSouthAfrica.He
foundabidirectionalcausalitybetweenelectricityconsumptionandeconomicgrowth,
corroborating the findings by Perkins, Fedderke and Luiz (2005). The policy
prescription emanating from the study is that investment in electricity infrastructure
‐17‐
shouldbeintensifiedintandemwiththecountry’sdesiredgrowthtrajectory,aswellas
thecountry’sASGISApolicyframeworkandthecountry’sindustrializationpolicy.
Moststudiesondemandforelectricityaremacroinnature.Louwetal(2008)adopted
adifferenttackandusedamicroapproachtoinvestigatethedeterminantsofelectricity
consumption.TheyalsofocusedonthepoorhouseholdsinacommunityintheWestern
Cape. This is important given that electricity supply in South Africa, unlike in most
developing countries, is not an urban phenomenon. The government has, since 1994
embarkedonaprogrammetoensureaccesstoelectricitybytheruraldwellersaswell.
Poorhouseholdhavefreeaccesstothefirst50kWh/monththattheyconsume.Louwet
al(2008),usinghouseholdsurveydatacollectedin2001and2002,foundthatincome,
wood fuel usage and access to credit were the main factors affecting electricity
consumption.Duetodatalimitationstheirmodelhoweverdidnotcontrolfortheprice
of electricity and price of electricity substitutes. Consequently the model was
misspecified as it left out the main factors that should be included in any demand
function. Thus the impact of the price of electricity was not assessed nor did they
calculatethecross‐priceelasticities.
Acknowledging the paucity of research analyzing the demand for electricity in
developing countries in general and in SA in particular, Amusa et al (2009) uses
macroeconomicdatatoinvestigatethedeterminantsofaggregatedemandforelectricity
in South Africa. They cover the period 1960‐2007. They also used a bounds testing
approachtocointegration.TheirpaperwhichaimedtoimproveonPouris’(1987)study

‐18‐
by using more contemporary econometric approaches as well as more recent data,
calculated income and price elasticities of demand in SouthAfrica. For example, they
argued that Pouris’s paper failed to test for data stationarity, suggesting that the
findings from Pouris’s the study may actually be spurious. Hence they adopted an
autoregressivedistributedlag(ARDL)modeltoestimatetheelasticities.Theyalsomade
useoftheerrorcorrectioninherentintheARDLframeworktoassesstheshort‐runand
long‐run impactsof themaindriversof electricity consumption inSouthAfrica.They
also tested parameter stability. To this end, they found that income, and not price of
electricity, is the main driver of electricity consumption in South Africa. This is an
important finding given the current debate around electricity pricing. If the price of
electricityisnotasignificantfactorinthedemandforelectricityfunctionthenapolicy
thrustthatfocusesonpricingmaynotbetheoptimalpolicyoption.
InarecentstudyintheUS,DergiadesandTsoulfidis(2008)investigatedtheresidential
demandforelectricityfortheperiod1965‐2006.Theexplanatoryvariableswhichthey
usedincludeGDPpercapita,priceofelectricity,priceofoilforheatingpurposes(used
toproxythepriceofasubstitute),andweatherconditions.UsingtheARDLapproachto
cointegrationtheyfoundthecoefficientofpricetobesignificantlydifferentfromzero.
They also found a stable relationship between the variables used. Furthermore, to
measure the intensity of electricity usage by households they used the number of
occupied stock of houses. Since occupied houses are most likely to have a higher
‐19‐
number of electricity using appliances, this implies that the higher the number of
occupiedhousesthehighertheusageofelectricity.
In an attempt to capture the role of economic development in driving electricity
demand,HoltedahlandJoutz(2004)addedanadditionalvariabletotheusualeconomic
variablesnormallyincludedinanordinarydemandfunctionthattheyestimatedforthe
Taiwanese economy. The variable added is the urbanization. Urbanization was
measuredas theproportionof thepopulationincitiesof100000ormore(Holtedahl
andJoutz,2004).Theothereconomicvariablesincludedarepopulationchanges,price
of electricity and household disposable income. Price of electricity was found to be
negativelyrelatedtothedemandforelectricity.Thepriceof theelectricitycoefficient
wasalsofoundtobesignificant;withtheirownpriceeffectbeingfoundtobeinelastic.
This implies that an increase in the price of electricity by 1% in Taiwan results in a
reductioninthequantitydemandedbylessthan1%.Sousingthepriceincreasesasa
strategy to curtail the demand for electricity as emphasized by the South African
governmentmaynotbetheoptimalstrategytoembarkon.Thisalsopointstothefact
that as an economy develops, electricity becomes a necessity that every household
cannotdowithout. Soan increase in thepriceof electricitymay result inhouseholds
movingsomeoftheincomefromothersourcesintoelectricityratherthansignificantly
reducingthedemandforelectricity.Therelationshipbetweenown‐priceandelectricity
demandwasalso foundtobestable inboththeshort‐runand long‐run; implyingthat
‐20‐
policiescanbeoptimallymadesincesucharelationshipexistsinboththeshort‐runand
long‐run.
Oneoftheimportantrecentstudiesconductedinthedevelopedeconomiesisthestudy
byNarayanetal,(2007).Narayanetal(2007)coveredtheG7countriesfortheperiod
1978‐2003andestimatedaresidentialdemandfunctionforG7countries.Theyuseda
panel cointegration approach. In this respect, they found that residential demand for
electricityintheG7countrieswasincomeelasticandpriceelasticinthelongrun.Sucha
resultisimportantforpolicymakersespeciallyasmostgovernmentsareendeavouring
to develop better demand management policies. In countries such as South Africa,
which is trying to restructure the entire energy sector as well as develop a more
sustainableenergypricingpolicy,theseresultsareofvitalimportance.
The high own‐price elasticity found by Narayan et al (2007) suggests that in the G7
countriesconsumersaresensitivetoelectricitypricechanges–apossiblereasonisthat
theyusegasesasasubstitute.Thisimpliesthatapricingpolicymaybemoreeffectivein
controllingelectricityusagethaninTaiwan,forexample.However,itisnoteworthythat
suchapricingpolicyappliesprovidedthatelectricitysubstitutesareavailable.Itmust
alsobenotedthatgroupingcountriesasaregionaswasdonebyNarayanetal(2007)
whilstusingmoredatapointsandthusprovidingmoredegreesoffreedom,andhence
enabling us to estimate more efficient parameters, may not give us an individual
countrypicture. Itwouldhave been useful if, in conjunction to a panel for thewhole
‐21‐
region,individualresidentialelectricitydemandfunctionsforeachcountryintheregion
werealsoestimated.
Narayanetal(2007)alsoconcludedthatpricingpoliciesshouldbeusedtocontrolthe
residentialdemandforelectricityintheregion–especiallytakingcognizanceofthefact
thatresidentialdemandforelectricityispriceelastic.Thestudyalsoattemptedtolook
atthepolicyimplicationsoftheresultsespeciallyastheypertaintothesustainableuse
ofenergy,ingeneral,andelectricity,inparticularaswellasthereductionofgreenhouse
gasemissions.AccordingtoNarayanetal(2007)theG7countriesgeneratedabout40%
ofthetotalelectricitygeneratedinthewholeworld.Thispointstoasignificantemission
ofgreenhousegases;thuscontributingtoglobalwarming.
DonatosandMergos(1991)collecteddataontheGreekeconomyfortheperiod1961to
1986 and estimated a residential electricity demand function for that country. They
used several variablesasexplanatoryvariables including:householddisposal income,
priceof electricity, salesof electricityappliances,population changesand thepriceof
diesel.Thedependentvariableusedwas the per capita electricity consumption.They
consequently foundthatdemandforelectricity inGreece isprice inelasticand income
elastic.Tothisend,Hondroyiannis(2004)alsofoundcorroboratingresults.Thisimplies
that price has little impact on electricity demand. The policy implication emanating
from this is that trying tomanage demand using price changesmay not be effective
‐22‐
hence it may be necessary to introduce substitutes for electricity. The study also
suggeststhealignmentofelectricitypricestothoseobtainedintheEuropeanregion.
The study also found that population increases tend to increase the demand for
electricity.Salesofelectricapplianceswerefoundtobeinsignificantaswasthepriceof
diesel in theirrelationshipto thedemandforelectricity.Thedemandforelectricity in
Greecewasfoundtobefairlyconstantwhencomparingthedemandofoneregionwith
that of another. The implication of this finding is that regional differences appear to
have a minimal impact on the variation in electricity demand. This finding is also
importantwhenitcomestopolicymaking,astheregionsaremoreorlesshomogenous
in terms of electricity demand. A policy designed for one region can therefore, with
minimalmodification,beeasilyappliedtootherregions.
AccordingtoSmith(1980),estimatesofdemandfunction forelectricityare important
forpolicymaking.Forexample,demandresponsivenesstopricechangeshasabearing
onthedemandforecasts;somethingthatiscriticallyimportantforinvestmentplanning
at national level aswell as at firm level. Firms in any given economy are one of the
importantsectorsthatconsumeasignificantamountofelectricity.Forecastingdemand
is also important for regulatory reviews–especiallygiven the currentdebatearound
globalwarmingandtheneedtoefficientlyandsustainablyutilizeenergy(Smith,1980).
Walker (1979) estimated the residential electricity demand for a random sample of
householdsfortheUSeconomyduringtheperiod1972–1975. Householdelectricity
consumptionwasestimatedasafunctionofchangesinweather,realpriceofelectricity
‐23‐
andrealhouseholddisposableincome. TocapturetheimpactofanArabOilEmbargo
thatwasimposedintheearly1970’sWalker(1979)alsointroducedadummythattook
avalueof1aftertheembargoandzerobeforetheintroductionoftheembargo.Itwas
however found that the embargo aswell as the call by theUS government to reduce
electricityconsumptionduringtheembargodidnotresult inareduction inelectricity
consumption;thecoefficientontheembargodummywaspositiveandinsignificant.
Inglesi(2010)estimatedaggregatedemandforelectricityinSouthAfricausingdatafor
theperiod1980–2006.Inglesi(2010)usedanerrorcorrectionmodelsandtheEngle‐
Grangermethodologytoforecastelectricitydemand.Themainvariablesusedare:real
gross domestic product, real electricity consumption, average electricity price, real
disposable income and population changes. Itmust be noted that it is possible that
Inglesi’sresultsmaybeaffectedbydataproblems.Forexample,itispossiblethatreal
disposable incomeandrealGDParehighlycorrelated;hencethedatamaybeplagued
withproblemsofmulticollinearity.AlsorealGDPcanbeendogenousasitmaybedriven
by electricity generation or consumption. Inglesi found that the disposable income,
priceofelectricity,realGDPandpopulationtobesignificant.Thesevariablesalsohad
thehypothesisedsigns;withincomeelasticitybeing0.42(inelastic)andpriceelasticity
being‐0.55(inelastic).Thesefindingsareimportantforpolicy.Forexample,ifitistrue
that demand for electricity in SouthAfrica is price inelastic then a 1% change in the
priceofelectricityreducesdemandby less than1%; implyingthatdemandisnot that
responsive to price changes. The policymakers need such information if they are to
‐24‐
come up with effective demand management policies. More importantly, a long‐run
relationshipwasfoundbetweenelectricityconsumptionandpriceofelectricityaswell
asbetweenelectricityconsumptionandeconomicgrowth.Ashort‐runrelationshipwas
alsofoundbetweenpopulationgrowthandelectricityconsumption.
2.3 TheoreticalFramework
According to classical economics themain factorswhich affect the demandof a good
include; own price of the good, household real income (the relationship between
demandandincomedependingonwhetherthegoodisanormalorinferiorgood),the
priceofrelatedgoods(whetherthegoodsarecomplementsorsubstitutes),population
andexpectedfuturepricechanges.Inthecaseofresidentialdemandforelectricitythe
common substitutes are the natural gas, heating oil, fuelwood (inmost rural areas).
Normallytherelationshipbetweenthepriceofthegoodandthedemandforthegoodis
theparamountrelationship inanydemandfunction.Themaintheoriesexplainingthe
relationship are the cardinal utility theory, ordinal utility theory and the revealed
preference theory.The cardinalist approachassumes thatutility ismeasurable;hence
consumingoneadditionalutilityofagoodresultintotalsatisfactionderivedfromthat
changingbyacertainamount.Theordinalistapproacharguesthatthisisunrealisticas
measuringutility ispractically impossible.What is important,arguetheordinalists, is
thatonecancomparedifferentbundlesofgoods. Forexampleonecanstate thatone
‐25‐
derivesmoreutilityfromconsumingbundleAthanbundleB,butonemaynotknowthe
exactimpactsofachangeintotalutilityduetotheconsumptionofthetwobundles.
Mostmodels used to estimate the demand for electricity function have attempted to
estimate the price elasticity and income elasticity (Inglesi, 2010). According to
economic theory there is a negative relationship between disposable income and the
following variables: own price of the good, temperature (low temperature results in
moreelectricityconsumption)andpriceofsubstitutes.Itisalsoestimatedthatthereis
a positive relationship between electricity consumption and the following variables:
incomegrowth,populationgrowth,theamountofelectricalappliancesinahousehold,
householdsizeandpriceofcomplements.
2.4 Conclusion
This chapter reviewed the relevant literature. It started by considering the empirical
workconductedinSouthAfricanandothercountries.Itthenlookedatthetheoretical
framework or the theoretical models that explain the behavior of consumers. The
literature reviewhelpedonebetterunderstandwhathasbeendiscoveredhistorically
andthusenabledonetoidentifygapsintheliteraturethatneedtobeaddressed.Italso
helped rationalize the context of the problem especially given the current debate on
climatechangeandthefinancialcrisis.Thenextchapterconsidersthemethodologyto
beusedinformulatingtheanalysis.
‐26‐
CHAPTER3
ResearchMethodology
3.1 Introduction
Themajortheorythatguidestheresearchistheneoclassicaldemandtheory.Itprovides
the author with the theoretical model that informs the econometric model to be
estimated.Italsoassistswiththeimportantvariablestobeincludedintheeconometric
model. The expected signs, or the hypothesis, of the models are actually gleaned or
informedbythetheoreticalmodel.Thatis,variablesshallnotbedroppedorincludedin
themodelsimplybecausetheyaresignificantorsimplybecausetheymakethemodel
significant.Thevariablesareincludedbecausetheoryprovidesthattheymustbe.
Despite its strengths and benefits the demand theory can also fail to explain some
specialcases.Forexamplewhilethepriceofagoodisexpectedtobenegativelyrelated
tothequantitydemandedof thegood, therearespecialcaseswherethedemandmay
actuallybepositivelyrelatedtothepriceofagood.Thatis,anincreaseinthepriceof
goodXmayactuallyresultinanincreaseindemandforgoodX.Oneexampleisthatofa
goodassociatedwithstatus:withpeopledemandingmoreofthegoodevenastheprice
goes up. The need to join the Jones’s (or the so‐called band wagon effect) and also
explainwhyanincreaseinthepriceofagoodcanresultinmorebeingdemanded.Itis
howeverexpectedthatinthiscaseelectricityisanormalgoodwhosepricetendstogo
‐27‐
downaspriceincreasesandassuchwedonotexpectthedemandmodeltobeaffected
bythespecialcasesmentioned.
The aim of this chapter is therefore to explain the methodology utilized in order to
estimatethedemandforelectricity function.Likethedemandforanycommodity, the
demandforelectricityisafunctionofincome,populationandpriceofelectricity,among
other factors.Theauthor closely followsBogetic andFedderke (2006) in this respect.
ThemodelbyBogeticandFedderke(2006)isareducedformequationforthedemand
forinfrastructure.Itexpressesthedemandforinfrastructureasafunctionofpercapita
income, sectoral shares in GDP (with the individual shares of the following sectors
includedasseparatevariables:agriculture,manufacturingandservices).
Generally most demand models to be estimated take similar forms: the dependent
variable is expressed as a function of several variables. The differencemay be in the
functional form that the actual estimated equation takes as well as the variables
included.Forexample,LakhaniandBumb(1978)estimatedthefollowingmodel:
tttttGDPaPAaPEaaDE !++++=3210
Where:
DE–isthedemandforelectricityattimet.
PE–thepriceofelectricityattimet.
PA–thepriceofasubstituteattimet.
‐28‐
GDP–grossdomesticproductattimet.
Inglesi(2010)estimatedthefollowing:
t220!+++=
tttPEaIncomeaaED
Where:
ED–isthedemandforelectricityattimet.
PE–thepriceofelectricityattimet.
Income–grossdomesticproductattimet(GDP)
InOdhiambo (2009)the roleof incomeorGDP is alsoemphasized.Odhiambo (2009)
washoweverlookingatthedirectionofcausalitybetweenelectricityconsumptionand
economic growth. Ziramba (2008) uses a model similar to Inglesi (2010) but he
includedatimevariable.
AsexplainedinthefollowingsectiontheAuthoradoptedamodelsimilartotheabove
models.Theonlyexception is that theAuthor includedmorevariables. Inaddition to
income and price of electricity the author has also included a variable to measure
population.
‐29‐
3.2 Quantitative/QualitativeResearchApproach
The author adopted a quantitative research approach. To better understand the
determinants of demand for electricity and thus be able to forecast additional
investmentrequiredforthegenerationofadditionalelectricityonewillneedtoaddress
threemainpoints.First,oneneedstoadopta theoreticalmodelofconsumerbehavior
(demand theory). Having established the theoretical underpinnings, the Author then
adopted an econometric model to estimate the necessary parameters. Once the
parametershavebeenestimatedonethenneedtoutilizetheminordertoforecastthe
future demand for electricity and the concomitant funding required to finance such
investments.
Consequently,thetheoryallowedtheauthortodevelopthevariablestobeincludedin
the model. These variables are electricity consumption, income, price of electricity,
population and GDP. The author then collected secondary data for the different
variables.Finallyonethenutilizedthedatatoruntheregressionsandthusrenderthe
quantitativeanalysis.
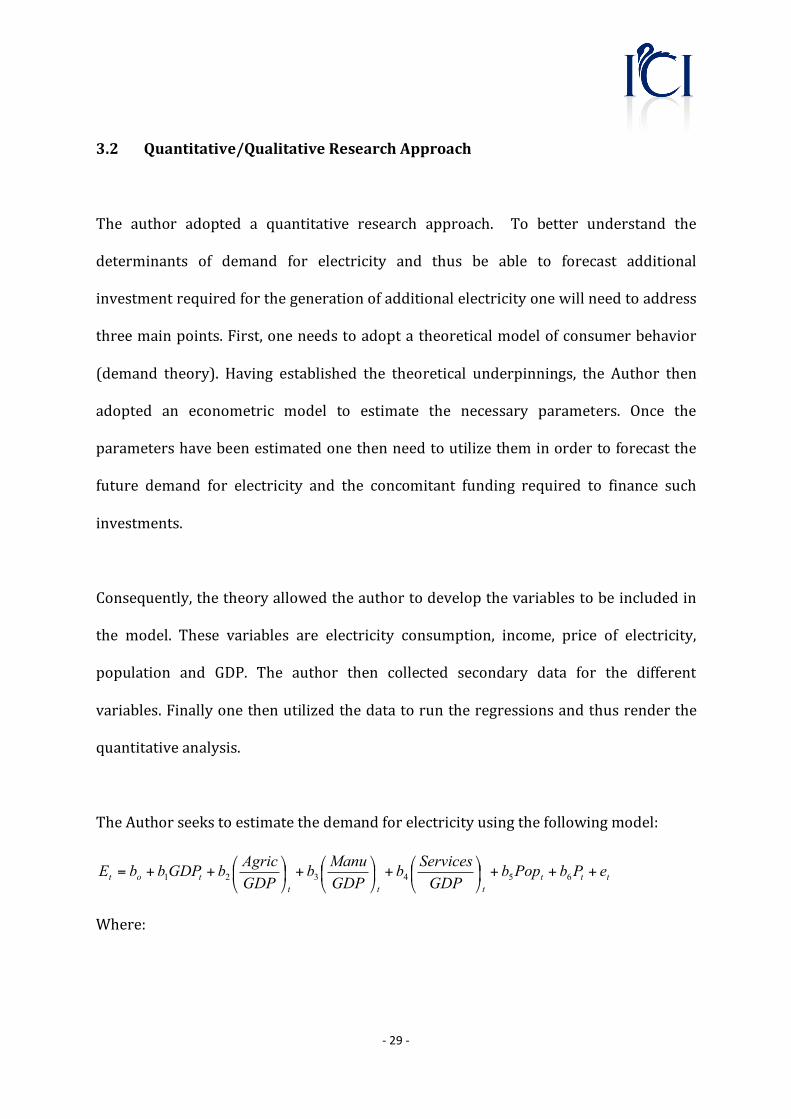
TheAuthorseekstoestimatethedemandforelectricityusingthefollowingmodel:
ttt
ttt
tot ePbPopbGDP
Servicesb
GDP
Manub
GDP
AgricbGDPbbE +++!
"
#$%
&+!
"
#$%
&+!
"
#$%
&++=
654321
Where:
‐30‐
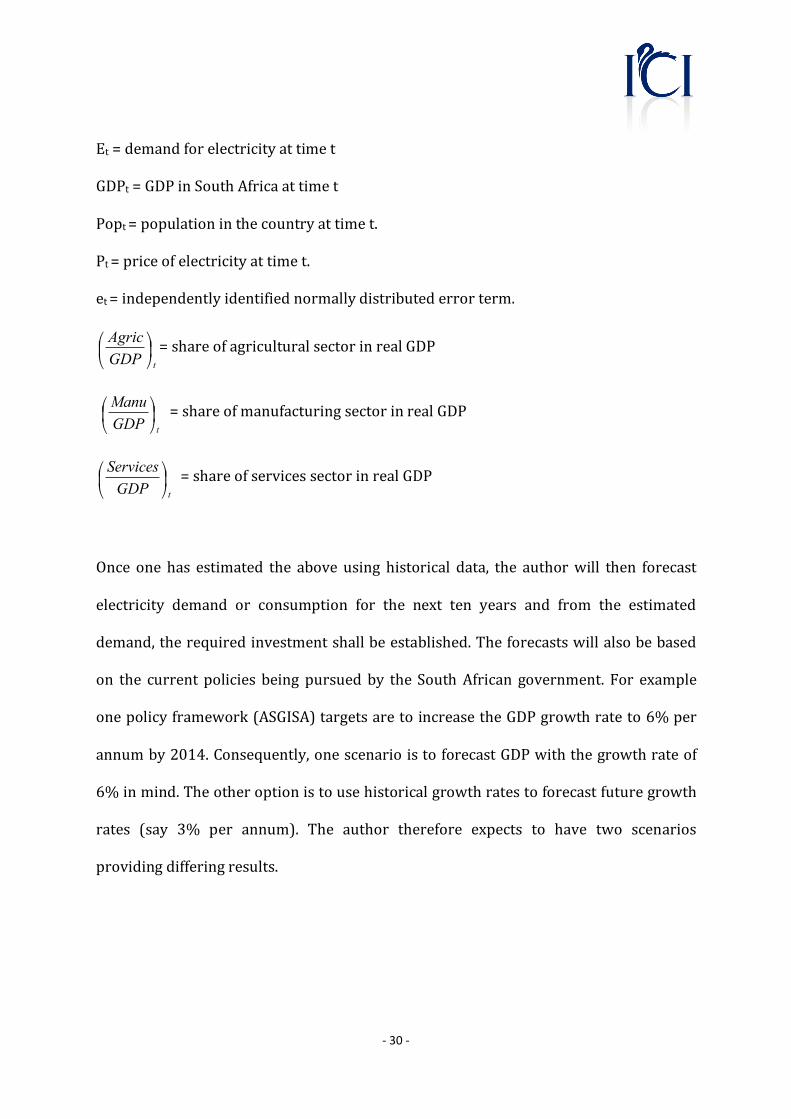
Et=demandforelectricityattimet
GDPt=GDPinSouthAfricaattimet
Popt=populationinthecountryattimet.
Pt=priceofelectricityattimet.
et=independentlyidentifiednormallydistributederrorterm.
tGDP
Agric!"
#$%
& =shareofagriculturalsectorinrealGDP
t
GDP
Manu!"
#$%
& =shareofmanufacturingsectorinrealGDP
tGDP
Services!"
#$%
& =shareofservicessectorinrealGDP
Once one has estimated the above using historical data, the authorwill then forecast
electricity demand or consumption for the next ten years and from the estimated
demand,therequiredinvestmentshallbeestablished.Theforecastswillalsobebased
on the currentpolicies being pursued by theSouthAfrican government. For example
onepolicyframework(ASGISA)targetsaretoincreasetheGDPgrowthrateto6%per
annumby2014.Consequently,onescenarioistoforecastGDPwiththegrowthrateof
6%inmind.Theotheroptionistousehistoricalgrowthratestoforecastfuturegrowth
rates (say 3% per annum). The author therefore expects to have two scenarios
providingdifferingresults.
‐31‐
Once the required investmenthasbeenestimated inmonetary terms theauthor shall
then consider the different sources of raising funds tomeet the required investment.
Thusthesectiononfinancingwillconsiderthedifferentmeansofraisingtherequisite
funds.Moreover, it isperhapspertinent tonote that fundsmaybe raised from loans,
alternativelyfrominternalcoffers/financialresourcesaswellasfromanincreaseinthe
priceofelectricity.Finally,thesectiononfundingalsoconsidersboththedisadvantages
andadvantagesofusingthesedifferentsourcesoffunding,anddiscussesthepotential
ramificationsofeach.
3.3 DataSources
Aconsiderableamountof thedatagatheredfor thisstudywassourcedfromStatistics
South Africa (Stats SA). Stats SA is the main statistical agency in the country. Its
responsibility is to collect both primary and secondary data by conducting various
surveys;whichvaryfromhouseholdsurveystomeasureinflationtofirm‐levelsurveys
whichmeasureeconomicactivitywithinthecountry.Consequently,thedatagenerated
bythisorganizationisconsideredbothaccurateandreliable.Theauthoralsocollected
additional data from the Reserve Bank of South Africa. The Reserve Bank is South
Africa’s central bank, and extensively collects and collates macroeconomic data for
publicconsumption.Thefollowingtableshowsthesourcesofdatausedintheanalysis.
‐32‐
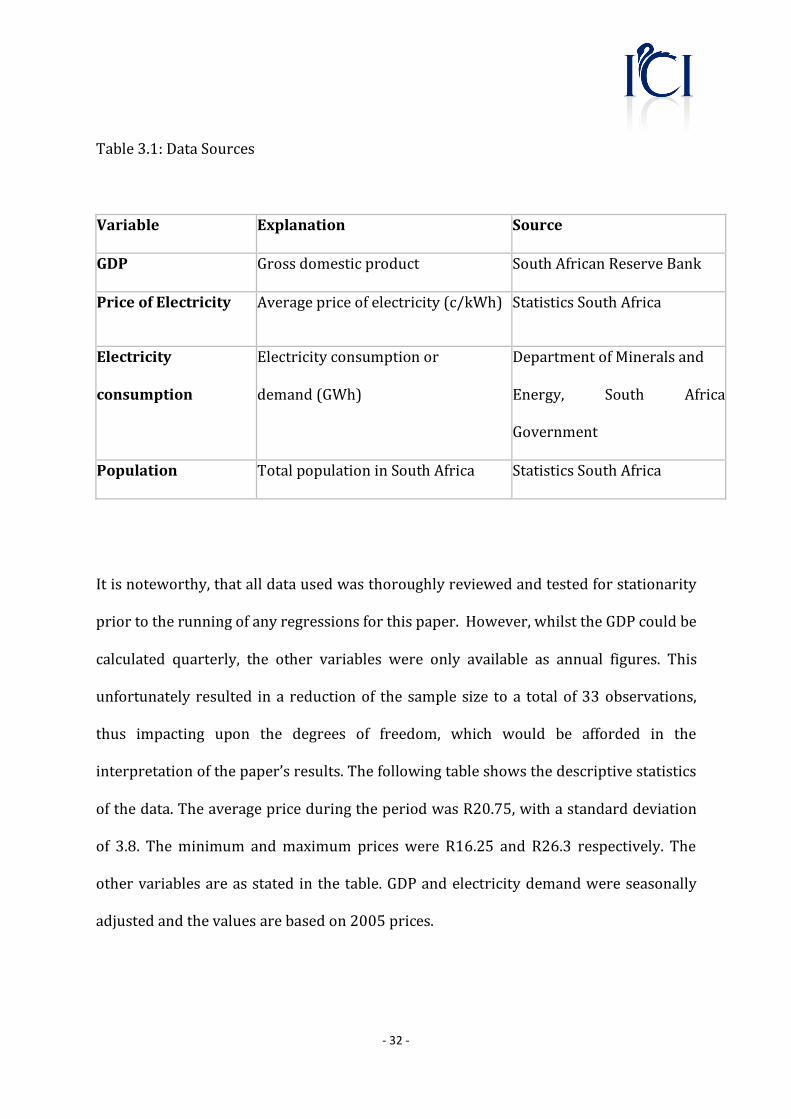
Table3.1:DataSources
Variable Explanation Source
GDP Grossdomesticproduct SouthAfricanReserveBank
PriceofElectricity Averagepriceofelectricity(c/kWh) StatisticsSouthAfrica
Electricity
consumption
Electricityconsumptionor
demand(GWh)
DepartmentofMineralsand
Energy, South Africa
Government
Population TotalpopulationinSouthAfrica StatisticsSouthAfrica
Itisnoteworthy,thatalldatausedwasthoroughlyreviewedandtestedforstationarity
priortotherunningofanyregressionsforthispaper.However,whilsttheGDPcouldbe
calculated quarterly, the other variables were only available as annual figures. This
unfortunately resulted ina reductionof the sample size toa totalof33observations,
thus impacting upon the degrees of freedom, which would be afforded in the
interpretationofthepaper’sresults.Thefollowingtableshowsthedescriptivestatistics
ofthedata.TheaveragepriceduringtheperiodwasR20.75,withastandarddeviation
of 3.8. Theminimum andmaximum priceswere R16.25 and R26.3 respectively. The
othervariablesareasstated inthetable.GDPandelectricitydemandwereseasonally
adjustedandthevaluesarebasedon2005prices.

‐33‐
Table3.2:DescriptiveStatistics
Variable Obs Mean Std.Dev Min Max
Electricity
Demand
33 127956.3 61344.11 10340 204979
Price
(ZAR)
33 20.75 3.8 16.25 26.3
GDP 33 4928913 1055338 3742469 7258084
Population 33 40303.1 6651.75 29075 50110
Agriculture 33 127004.8 19550.81 80872 162360
Services 33 2766634 756706.2 1838225 4422452
Source:Source:StatisticsSouthAfricaDatabase,ReserveBankofSouthAfricadatabase.
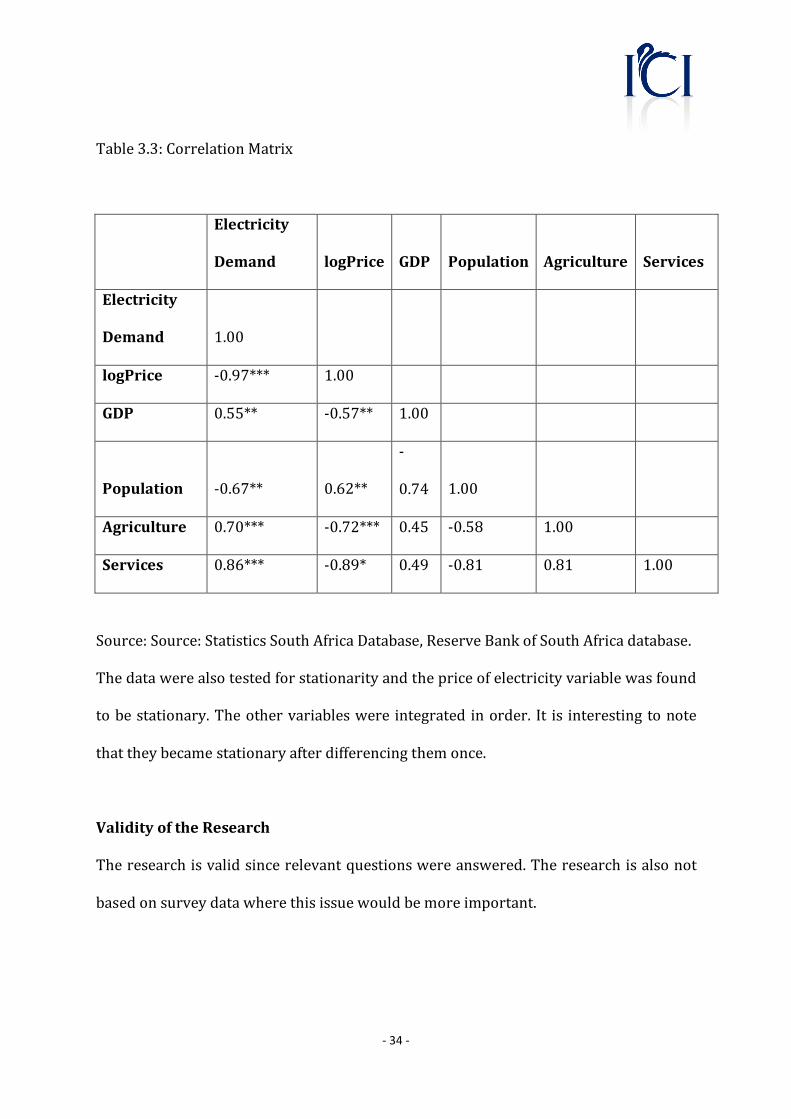
Thetablebelowshowsthecorrelationmatrixforthedatawiththeasterisksindicating
the level of significance of the relationship. For example the price of electricity and
electricitydemandwerehighlycorrelatedat1%levelofsignificance.
‐34‐
Table3.3:CorrelationMatrix
Electricity
Demand logPrice GDP Population Agriculture Services
Electricity
Demand 1.00
logPrice ‐0.97*** 1.00
GDP 0.55** ‐0.57** 1.00
Population ‐0.67** 0.62**
‐
0.74 1.00
Agriculture 0.70*** ‐0.72*** 0.45 ‐0.58 1.00
Services 0.86*** ‐0.89* 0.49 ‐0.81 0.81 1.00
Source:Source:StatisticsSouthAfricaDatabase,ReserveBankofSouthAfricadatabase.
Thedatawerealsotestedforstationarityandthepriceofelectricityvariablewasfound
tobestationary.Theothervariableswere integrated inorder. It is interestingtonote
thattheybecamestationaryafterdifferencingthemonce.
ValidityoftheResearch
Theresearchisvalidsincerelevantquestionswereanswered.Theresearchisalsonot
basedonsurveydatawherethisissuewouldbemoreimportant.
‐35‐
ReliabilityoftheResearch
Reliability of the research usually revolves around the reproducibility of the same
results by other researchers. The model estimated is a normal model and is
reproducible.
EthicsandConfidentiality
The research is based on secondary data. ESKOM, the unit of study, is a government
ownedutility. Informationconcerning theentity ispubliclyavailable. So there areno
confidentialityconcernsonaccountoftheinformationusedexistsandisfreelyavailable
withinthepublicdomain.
3.3 Conclusion
It is common for researchers to argue that a dissertation, after asking relevant
questions,mustexplainhowthequestionaretoaddressed,mustconducttheresearch
astheperthemethodology,andfinallymustexplaintheresults.Theaimofthissection
istoexplainthemethodologytobeusedtoaddresstheresearchquestionsraisedinthe
previous chapters. This chapter looked at the models used in the literature and
explainedthedifferentvariablesused.Afterconsideringallthemodelstheauthorthen
chooseamodelthatincludesthegenerallyacceptedvariables.Thenextchapterutilizes
the model in order to estimate the equations as well as to forecast the demand for
electricityinfuture.
‐36‐
CHAPTER4
AnalysisofResults
4.1 Introduction
Theaimof this section is toanalyze the results that emanated from themethodology
that was explained in chapter 3. It commences with estimating the demand for
electricity inSouthAfrica.Theregressionresultssection is thenfollowedbyasection
which basically estimates the forecasted demand for electricity. It concludes with a
costing exercise intended to derive the requisite investment needed to meet the
forecasteddemand.
‐37‐
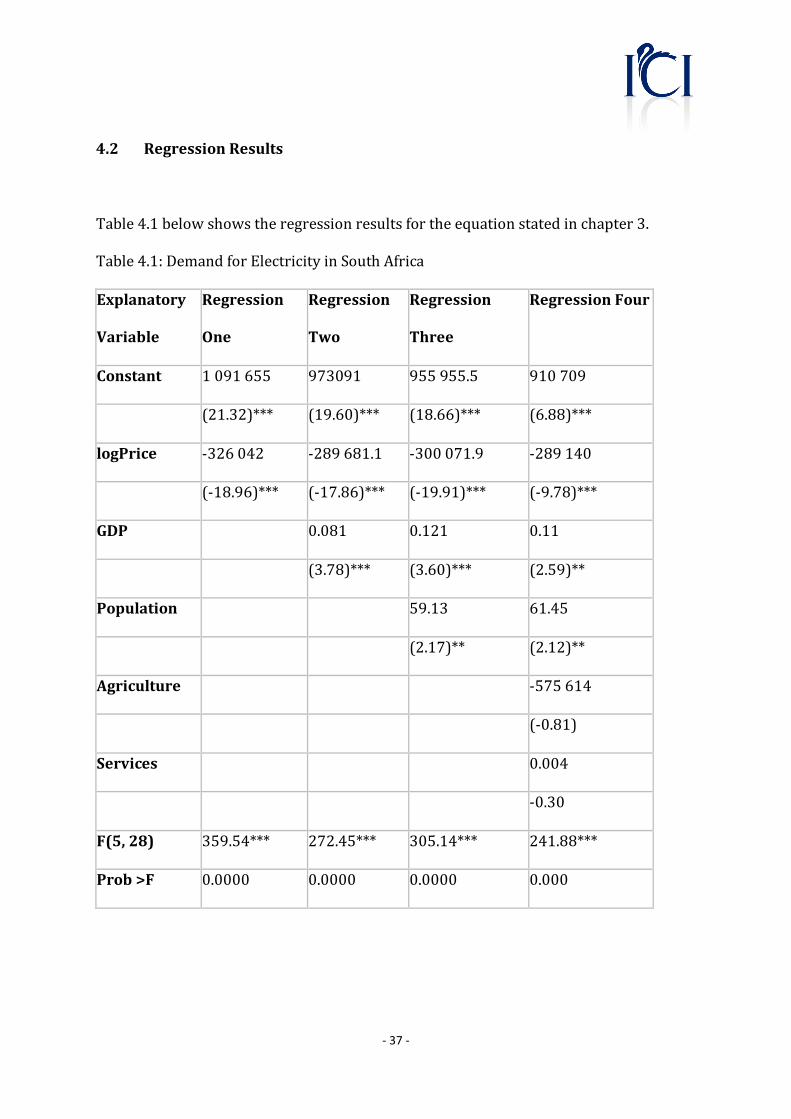
4.2 RegressionResults
Table4.1belowshowstheregressionresultsfortheequationstatedinchapter3.
Table4.1:DemandforElectricityinSouthAfrica
Explanatory
Variable
Regression
One
Regression
Two
Regression
Three
RegressionFour
Constant 1091655 973091 955955.5 910709
(21.32)*** (19.60)*** (18.66)*** (6.88)***
logPrice ‐326042 ‐289681.1 ‐300071.9 ‐289140
(‐18.96)*** (‐17.86)*** (‐19.91)*** (‐9.78)***
GDP 0.081 0.121 0.11
(3.78)*** (3.60)*** (2.59)**
Population 59.13 61.45
(2.17)** (2.12)**
Agriculture ‐575614
(‐0.81)
Services 0.004
‐0.30
F(5,28) 359.54*** 272.45*** 305.14*** 241.88***
Prob>F 0.0000 0.0000 0.0000 0.000
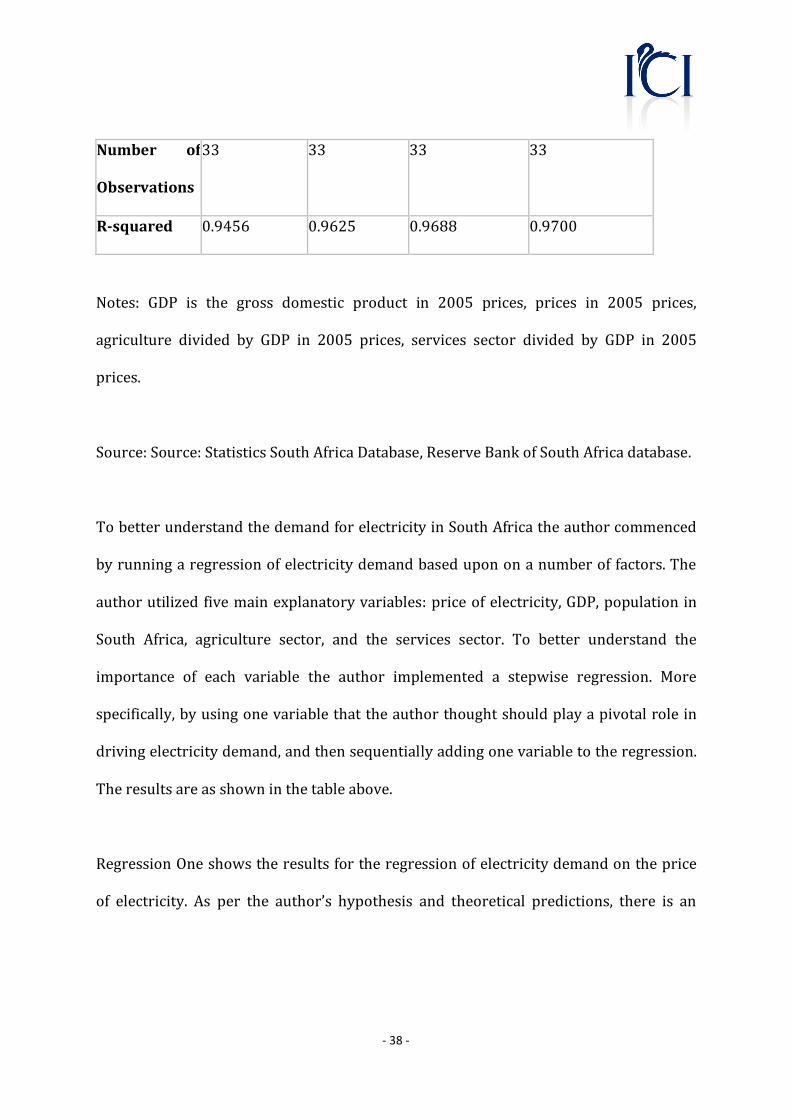
‐38‐
Number of
Observations
33 33 33 33
Rsquared 0.9456 0.9625 0.9688 0.9700
Notes: GDP is the gross domestic product in 2005 prices, prices in 2005 prices,
agriculture divided by GDP in 2005 prices, services sector divided by GDP in 2005
prices.
Source:Source:StatisticsSouthAfricaDatabase,ReserveBankofSouthAfricadatabase.
TobetterunderstandthedemandforelectricityinSouthAfricatheauthorcommenced
byrunningaregressionofelectricitydemandbasedupononanumberoffactors.The
authorutilized fivemainexplanatoryvariables:priceofelectricity,GDP,population in
South Africa, agriculture sector, and the services sector. To better understand the
importance of each variable the author implemented a stepwise regression. More
specifically,byusingonevariablethattheauthorthoughtshouldplayapivotalrolein
drivingelectricitydemand,andthensequentiallyaddingonevariabletotheregression.
Theresultsareasshowninthetableabove.
RegressionOneshowstheresultsfortheregressionofelectricitydemandontheprice
of electricity. As per the author’s hypothesis and theoretical predictions, there is an
‐39‐
inverse relationship between electricity demand and its price. Furthermore, the
coefficientforthepricevariableisnegativeandsignificantatthe1%levelsignificance;
suggesting that an increase in the priceof electricity tends to reduce the demand for
electricity. Thewholemodel is also significant at the1% level of significance as seen
fromanFvalueof359.54andaProb>F=0.0000.Themodel’sR‐squared,at94.56%,is
alsoverylarge.Thisimpliesthatabout94.56%ofthevariabilityinelectricitydemandis
duetovariabilityinthepriceofelectricity.
However, one important variable which should drive electricity consumption is the
incomeleveloftheSouthAfricancitizens.TheauthorusedGDPtomeasuresuchincome
level.Ahigherlevelofincomeincreasesthepurchasingpowerofthegeneralpopulation
resulting in higher demand for goods and services, including electricity. The author
therefore expected a positive relationship between changes in GDP and electricity
demand.ChangesinGDPcanalsobeusedtomeasurethegrowthrateoftheeconomy.A
growingeconomymustbesupportedbyanincreasedsupplyofelectricity.Lowerlevels
ofelectricitysupplymaypushtheeconomyawayfromitsoptimalgrowthpath.Itmay
also result in lower investment and ultimately cause untold suffering to the general
population due to decreased GDP and lower income levels, once the Keynesian
multiplier (in reverse gear) kicks in. To this end, Regression Two shows the results
whenelectricitydemandisregressedonpriceandGDPalone. Thepricecoefficient is
stillnegativeandsignificantat1%level.TheGDPparameterispositiveandsignificant
at 1% level, implying that an increase inGDP increases the demand for electricity in
‐40‐
South Africa. The model for Regression Two is also significant at the 1% level.
Compared to Regression One the R‐squared for Regression Two also marginally
increasedto96.25%from94.56%;anincreaseofabout1.79%.
InRegressionThree theauthor thenadded thepopulationvariable.The results show
that, as per the author’s expectation, the variable is positive and significant at a 5%
level, implyingthatanincreaseinpopulationincreasesthedemandforelectricity.The
parameters for the price and GDP variable are still significant and have the correct
signs.Thenegativesignforthepriceofelectricityparametercorroboratesfindingsby
Inglesi (2010), Amusa et al. (2009) andPouris, (1987), but is contrary to findings by
Ziramba(2008)whofoundthatthepriceofelectricitywasinsignificant.Thet‐statistic
for theGDP variable actuallymarginally increasedwhen the population variablewas
added. The whole model is also significant. R‐squared increased from 96.25% to
96.88% (an increase of about 0.65%). Also, the positive sign of the GDP parameter
supportsthefindingsbyZiramba(2008).
InRegression4theauthorthenranthefullmodel.Theresultsareasshownincolumn
five of the above table. The results show that the agriculture and services sector
variable are insignificant. The parameters for the price of electricity, GDP and
populationvariablesarestillsignificantandhavethecorrectsigns.Itmustbenotedthat
addingtheagricultureandservices sectorshassomewhataffectedtheresults asseen
fromadecline in the t‐statistics for thepricevariable from‐19.91 to‐9.78. TheGDP
‐41‐
parameter’st‐statisticsalsodecreasedfrom3.60to2.59.TheGDPparameter’slevelof
significance also declined from 1% level to 5% level when the author added the
agriculture and services sectors. The parameter for the population variable also
declinedto2.12from2.17.Moreover,theR‐squaredincreasedto97%whentheauthor
addedtheagricultureandservicesvariables;amarginalincreaseofonly0.12%.
Itisquiteclearfromtheresultsthatthepriceofelectricity,GDPandpopulationplaya
very important role in driving the demand for electricity. It is also clear that these
variablesarenotequallyimportantindrivingthedemandforelectricity.Thestepwise
regressionsuggeststhatthemostimportantvariableisthepriceofelectricity.Giventhe
insignificanceoftheagricultureandservicessectorintheregressionresultswesuggest
that the most appropriate model of the four is regression three. The author shall
thereforeusethismodelinthesubsequentdiscussions.Finally,theauthorshallalsouse
regressionthreeforforecastingthedemandforelectricity.
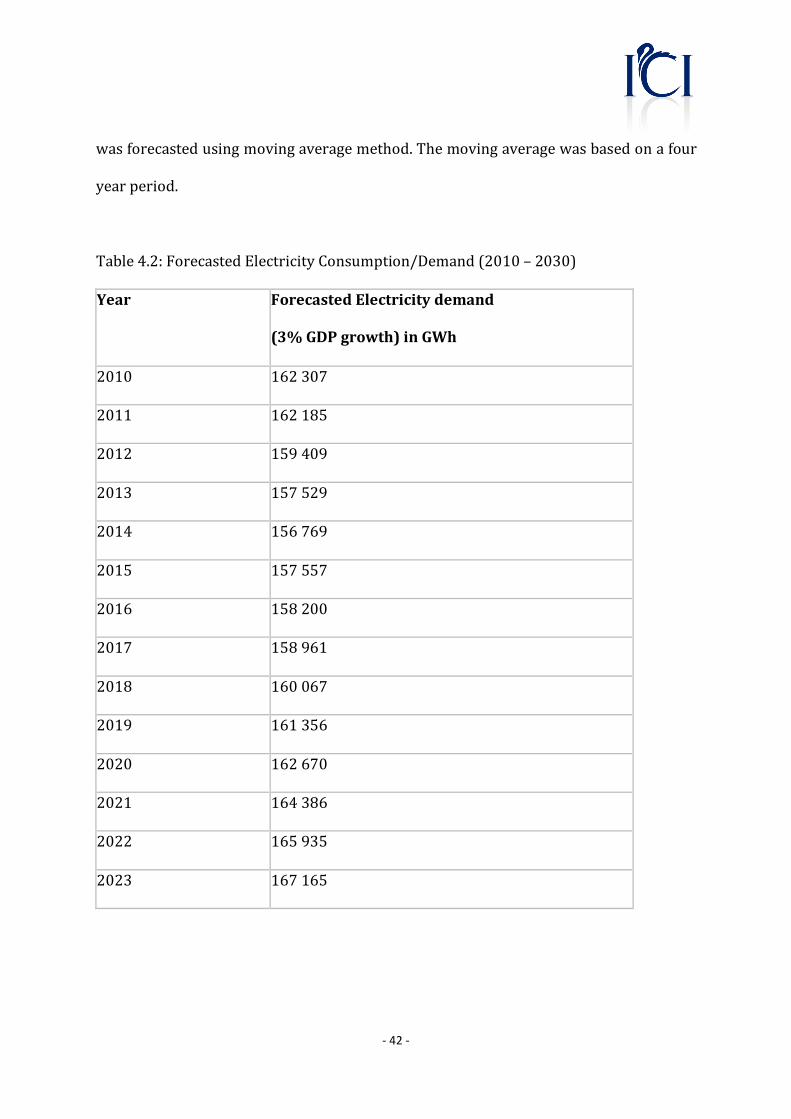
4.3 ForecastingElectricityDemandorConsumption
Scenario1:Assuming3%GDPGrowthRate
Inordertoforecastelectricitydemandtheauthorshallcommencebymakingaseriesof
assumptions.Firstly,theauthorshallassumethatGDPwillgrowby3%peryearinthe
next15years.PopulationforecastswereobtainedfromStatsSA.Also,thepricevariable
‐42‐
wasforecastedusingmovingaveragemethod.Themovingaveragewasbasedonafour
yearperiod.
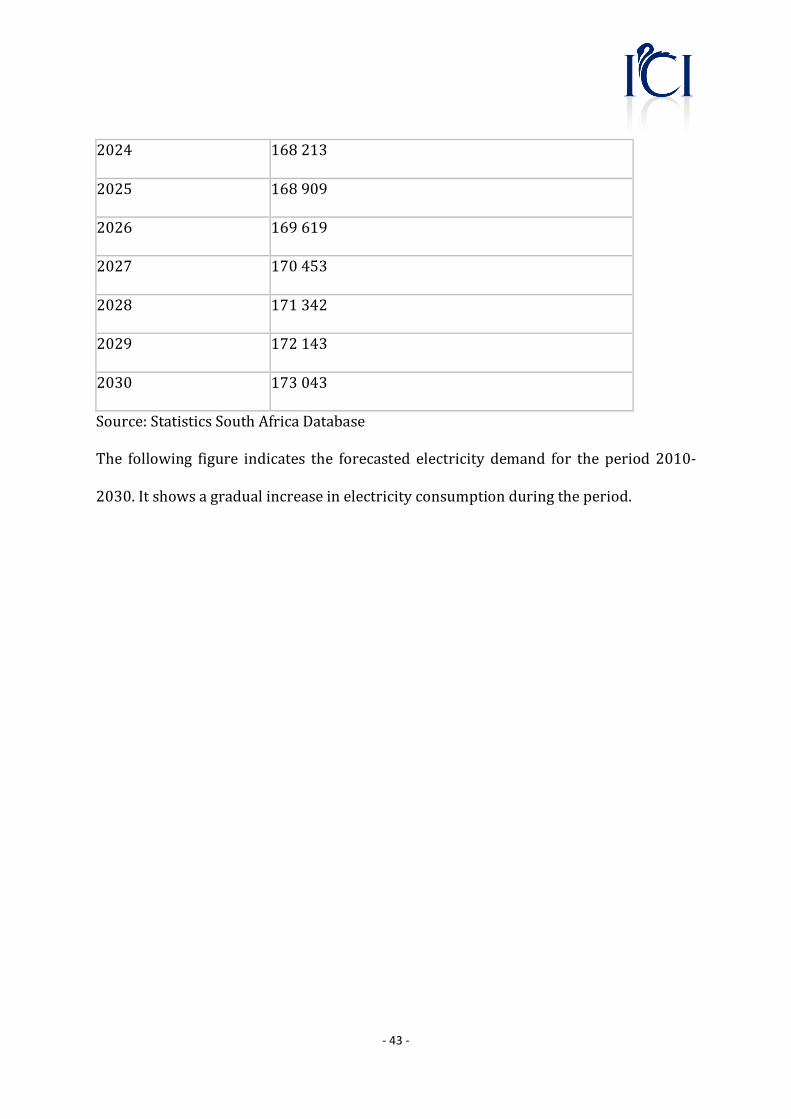
Table4.2:ForecastedElectricityConsumption/Demand(2010–2030)
Year ForecastedElectricitydemand
(3%GDPgrowth)inGWh
2010 162307
2011 162185
2012 159409
2013 157529
2014 156769
2015 157557
2016 158200
2017 158961
2018 160067
2019 161356
2020 162670
2021 164386
2022 165935
2023 167165
‐43‐
2024 168213
2025 168909
2026 169619
2027 170453
2028 171342
2029 172143
2030 173043
Source:StatisticsSouthAfricaDatabase
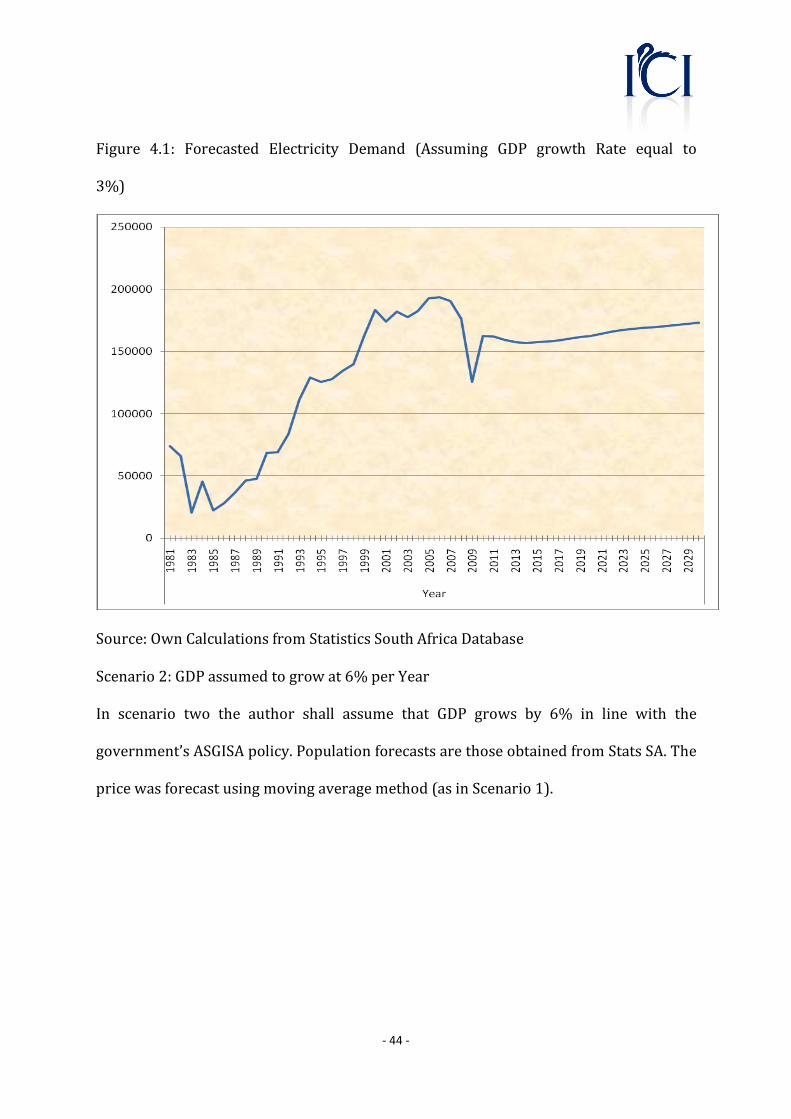
The following figure indicates the forecasted electricity demand for the period 2010‐
2030.Itshowsagradualincreaseinelectricityconsumptionduringtheperiod.
‐44‐
Figure 4.1: Forecasted Electricity Demand (Assuming GDP growth Rate equal to
3%)
Source:OwnCalculationsfromStatisticsSouthAfricaDatabase
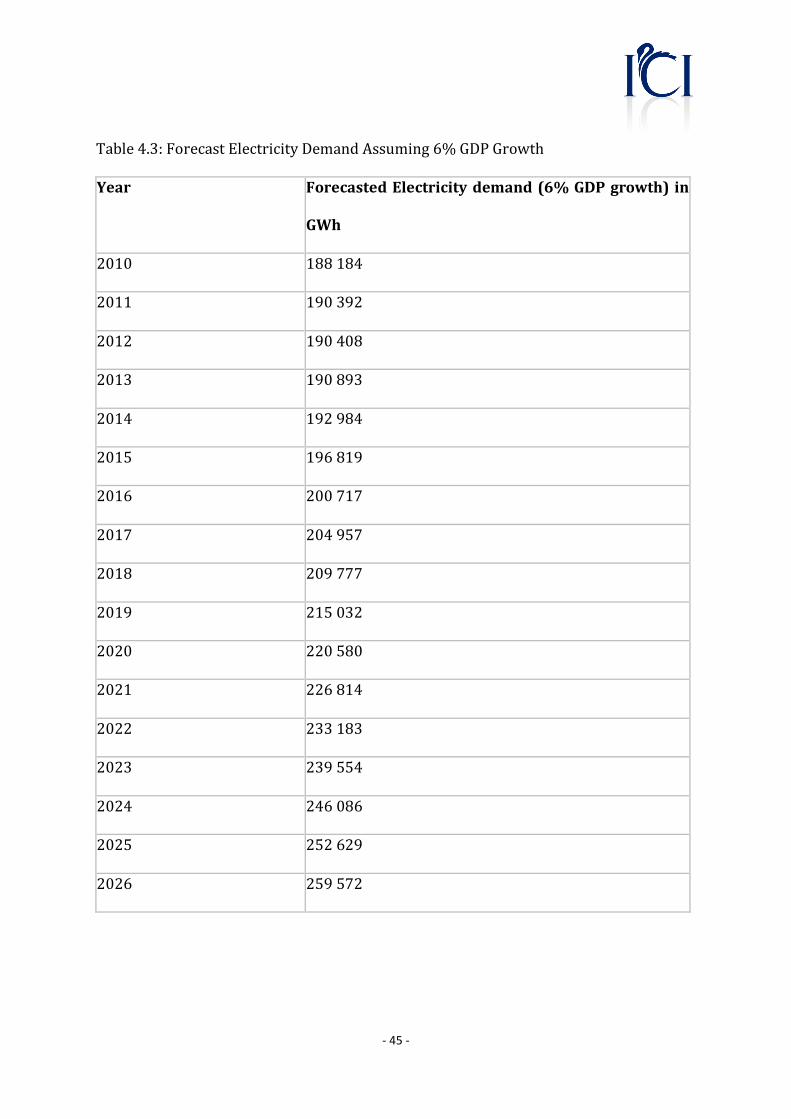
Scenario2:GDPassumedtogrowat6%perYear
In scenario two the author shall assume that GDP grows by 6% in line with the
government’sASGISApolicy.PopulationforecastsarethoseobtainedfromStatsSA.The
pricewasforecastusingmovingaveragemethod(asinScenario1).
‐45‐
Table4.3:ForecastElectricityDemandAssuming6%GDPGrowth
Year ForecastedElectricitydemand(6%GDPgrowth) in
GWh
2010 188184
2011 190392
2012 190408
2013 190893
2014 192984
2015 196819
2016 200717
2017 204957
2018 209777
2019 215032
2020 220580
2021 226814
2022 233183
2023 239554
2024 246086
2025 252629
2026 259572

‐46‐
2027 267049
2028 275016
2029 283360
2030 292295
Source:StatisticsSouthAfricaDatabase
Figure 4.2: Forecast Electricity Demand (Assuming GDP growth Rate equal to
6%)
‐47‐
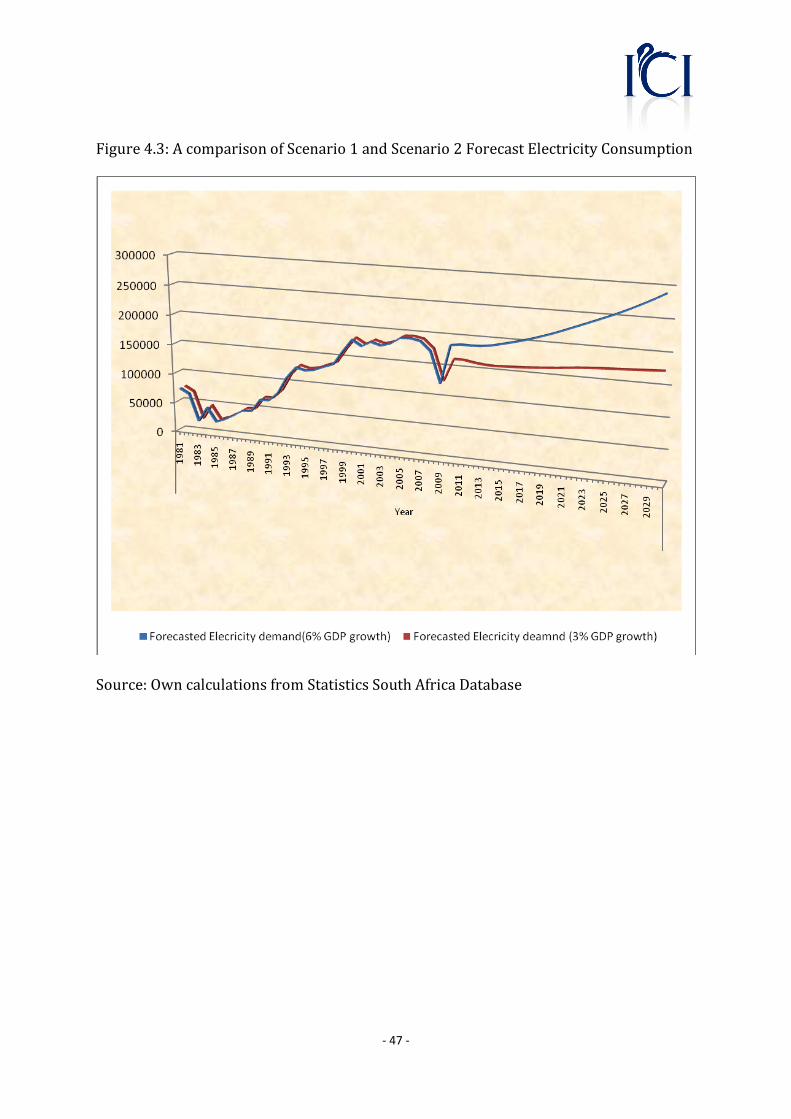
Figure4.3:AcomparisonofScenario1andScenario2ForecastElectricityConsumption
Source:OwncalculationsfromStatisticsSouthAfricaDatabase
‐48‐
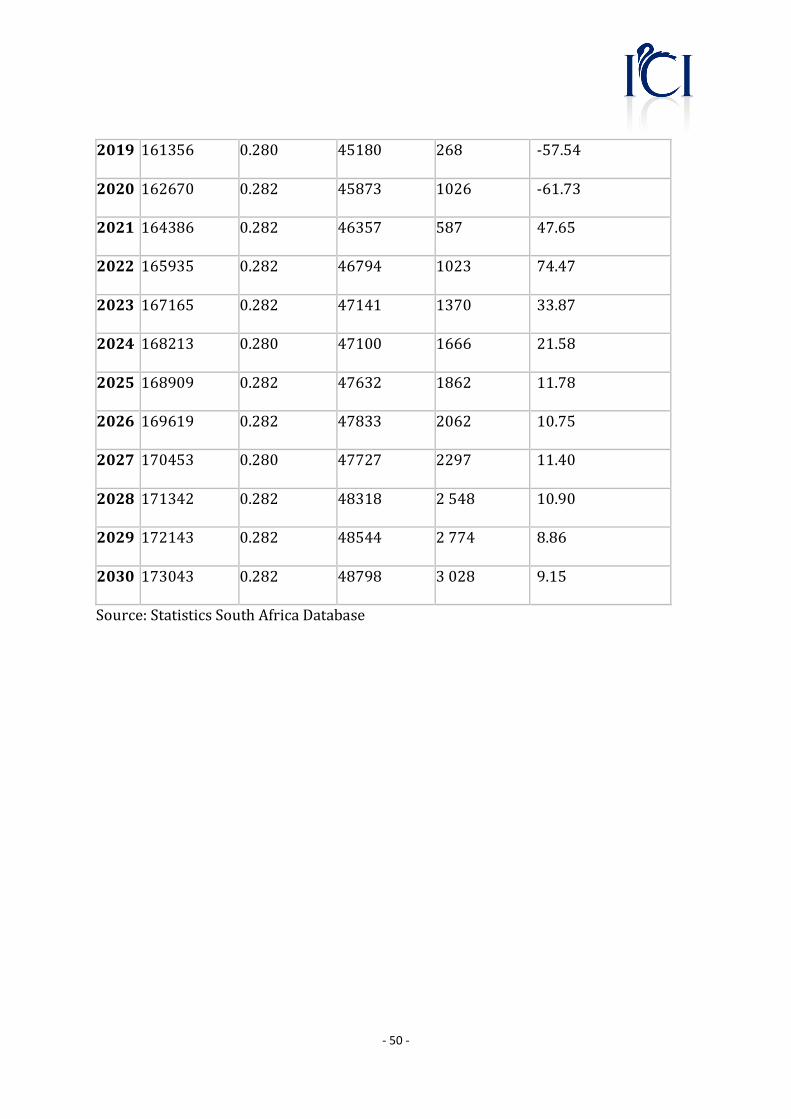
4.4 EstimatingRequiredInvestment
Toestimatetherequired investmenttheauthorneededthecostofgeneratingagiven
unitofelectricity.AccordingtotheESKOMannualReport(2010)theoperatingcostof
generatingakWhofelectricityisR0.282(or28.2cents).Giventhattheauthor’sfigures
are inGWh,one thenmultiplied the costby1000000 inorder toderive the costper
GWh.TheauthorfoundthatitcostsR282000topresentlygenerateaGWhofelectricity
inSouthAfrica.Pleasenotethattheauthorisusing2010pricestocalculatethecostof
generatingelectricityinSouthAfrica.Accordingtothescenario1forecasts(scenario1
assumes an annual GDP growth rate of 3%) the country must have invested a
cumulative amount of about R27 billion into electricity generation if it is not to face
cripplingshortages(seeTable4.4below).Scenario2assumeshighergrowthrateand
thushigherelectricityconsumption.Scenario2assumesanannualGDPgrowthrateof
6%.Accordingtotheresultsfromthefollowingtablesanaccumulatedamountequalto
R232billionmusthavebeeninvestedintoelectricitygenerationby2030ifthecountry
istoavoidelectricityshortageslikethosewitnessedin2008.

‐49‐
Table4.4:Scenario1:RequiredInvestmentAssuming3%GDPGrowth
Year Forecast
Electricity
demand
(3%GDP
growth)
Price to
generate
electricity
per
GigaWatthou
r
(GWh)
[South
African
Rands in
Millions]
Costof
generating
Electricity
(2010
Prices)
ZARMillions
Additional
Investment
Required to
meet
electricity
demand
[South
African
Rands in
Millions]
Annual
Increasein
Additional
Investment(%)
2010 162307 0.280 45770 ‐
2011 162185 0.282 45736 34
2012 159409 0.282 44953 817 19.42
2013 157529 0.280 44108 1347 64.87
2014 156769 0.282 44209 1562 15.89
2015 157557 0.282 44431 1339 ‐14.23
2016 158200 0.280 44296 1158 ‐13.52
2017 158961 0.282 44827 943 ‐18.54
2018 160067 0.282 45139 632 ‐33.04
‐50‐
2019 161356 0.280 45180 268 ‐57.54
2020 162670 0.282 45873 1026 ‐61.73
2021 164386 0.282 46357 587 47.65
2022 165935 0.282 46794 1023 74.47
2023 167165 0.282 47141 1370 33.87
2024 168213 0.280 47100 1666 21.58
2025 168909 0.282 47632 1862 11.78
2026 169619 0.282 47833 2062 10.75
2027 170453 0.280 47727 2297 11.40
2028 171342 0.282 48318 2548 10.90
2029 172143 0.282 48544 2774 8.86
2030 173043 0.282 48798 3028 9.15
Source:StatisticsSouthAfricaDatabase
‐51‐
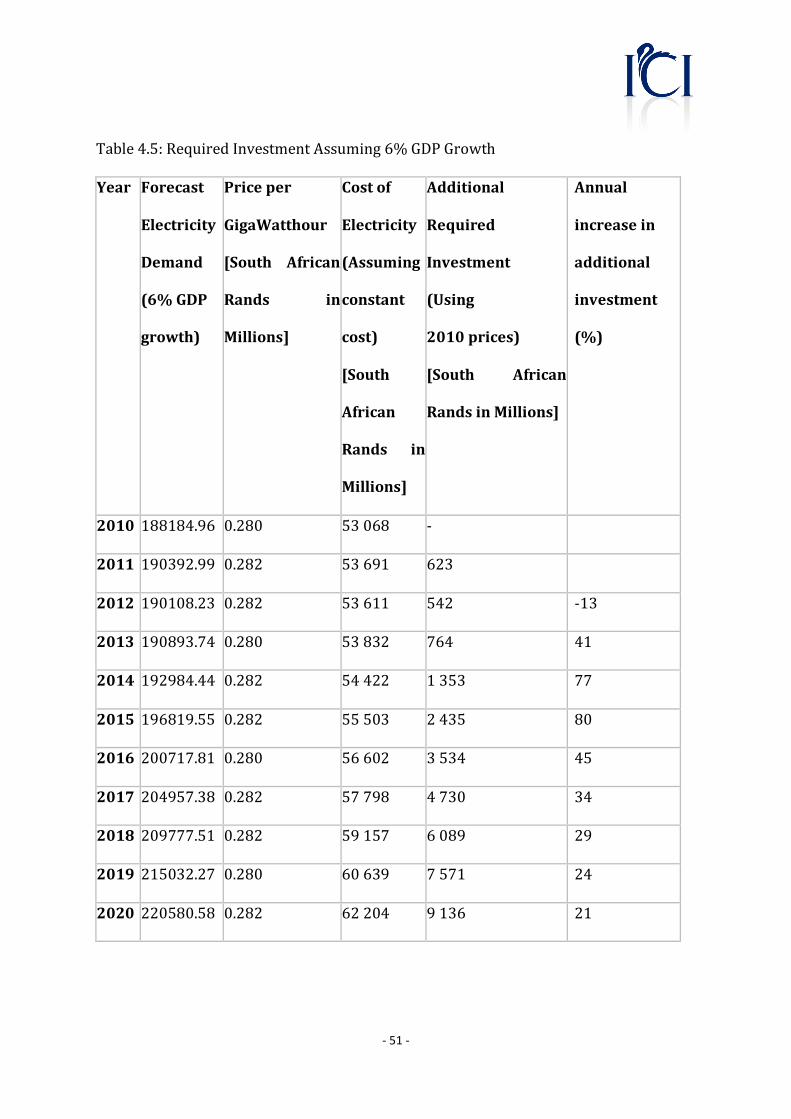
Table4.5:RequiredInvestmentAssuming6%GDPGrowth
Year Forecast
Electricity
Demand
(6%GDP
growth)
Priceper
GigaWatthour
[South African
Rands in
Millions]
Costof
Electricity
(Assuming
constant
cost)
[South
African
Rands in
Millions]
Additional
Required
Investment
(Using
2010prices)
[South African
RandsinMillions]
Annual
increasein
additional
investment
(%)
2010 188184.96 0.280 53068 ‐
2011 190392.99 0.282 53691 623
2012 190108.23 0.282 53611 542 ‐13
2013 190893.74 0.280 53832 764 41
2014 192984.44 0.282 54422 1353 77
2015 196819.55 0.282 55503 2435 80
2016 200717.81 0.280 56602 3534 45
2017 204957.38 0.282 57798 4730 34
2018 209777.51 0.282 59157 6089 29
2019 215032.27 0.280 60639 7571 24
2020 220580.58 0.282 62204 9136 21
‐52‐
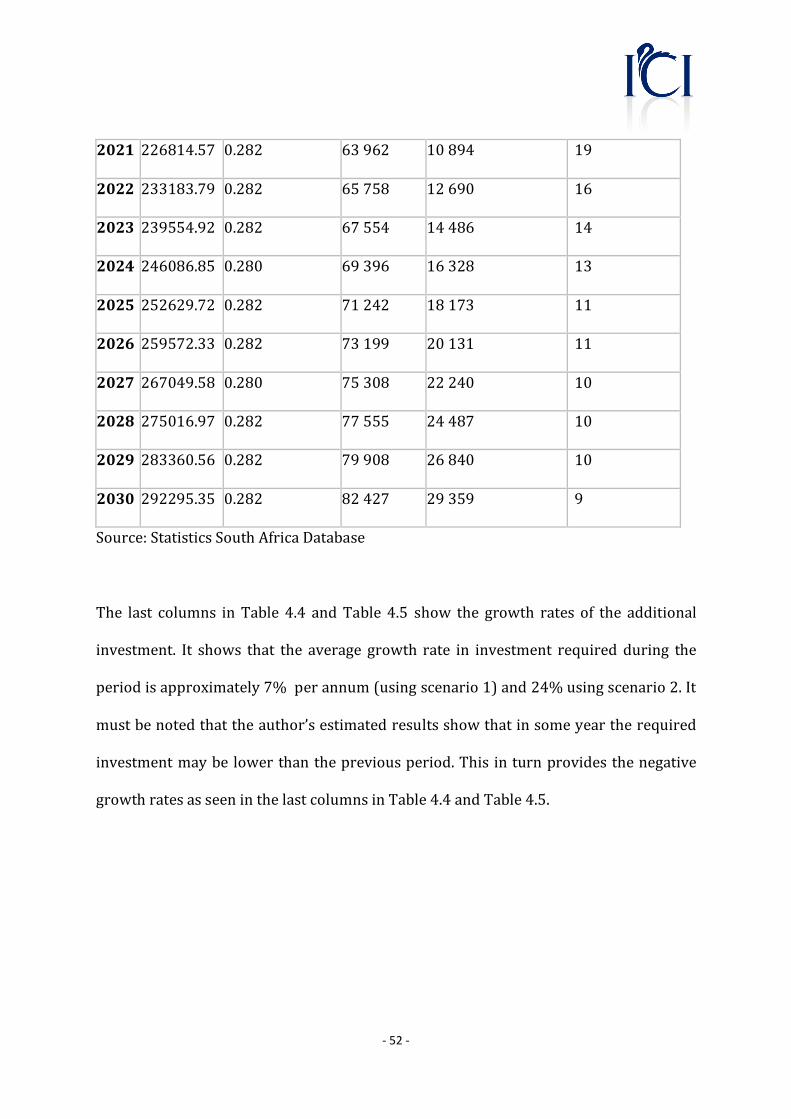
2021 226814.57 0.282 63962 10894 19
2022 233183.79 0.282 65758 12690 16
2023 239554.92 0.282 67554 14486 14
2024 246086.85 0.280 69396 16328 13
2025 252629.72 0.282 71242 18173 11
2026 259572.33 0.282 73199 20131 11
2027 267049.58 0.280 75308 22240 10
2028 275016.97 0.282 77555 24487 10
2029 283360.56 0.282 79908 26840 10
2030 292295.35 0.282 82427 29359 9
Source:StatisticsSouthAfricaDatabase
The last columns in Table 4.4 andTable 4.5 show the growth rates of the additional
investment. It shows that the average growth rate in investment required during the
periodisapproximately7%perannum(usingscenario1)and24%usingscenario2.It
mustbenotedthattheauthor’sestimatedresultsshowthatinsomeyeartherequired
investmentmaybe lowerthanthepreviousperiod.This in turnprovidesthenegative
growthratesasseeninthelastcolumnsinTable4.4andTable4.5.

‐53‐
4.5 FinancingInvestment
This section considers a number of factors thatmay influence ESKOM’s capability to
raisetherequisite funds for investment.Eventhough it isamonopoly,ESKOMcannot
freely determine the price of electricity. The price is controlled by the government
throughtheNationalEnergyRegulatorofSouthAfrica(NERSA).Tobetterunderstand
how it prices its product and the environment in which it operates the author
formulated a SWOT analysis in order to consider other factors, which may affect
ESKOM’soperations.
4.6 CompetitorandMarketAnalysis
Presently, there are a few private players (also known as independent power
producers)inSouthAfrica.Theindependentpowerproducerscontributeabout5%to
the South African energy market (ESKOM, 2010). Essentially, ESKOM has no major
competitor in the generation and distribution of electricity (Foulkes‐Jones, 2010;
ESKOM, 2010). The parastatal is thus amonopolist; facing almost the entiremarket
demand. ESKOM can also be considered to be a natural monopoly. According to
Foulkes‐Jones (2010) and Muradzikwa et al (2006) a natural monopoly is a market
structure inwhichonlyone firmcansolelysupplythewholemarketatrelatively low
costs. The natural monopolist’s long run average cost curve (LRAC) is downward
sloping over a large range of output (Foulkes‐Jones, 2010); with “the monopolist
‐54‐
actually singlehandedly catering for the entire market in that range of the LRAC”
(Parkinetal,2008;McConnellandBrue,2005).Thisisofsuchsignificancethatshould
other smaller firms try to enter themarket the costsmay be pushed up and thereby
ultimatelyharmingtheendconsumers.Tothisend,Figure4.4hereinbelowshowsthat
if a profit‐maximizing natural monopolist were to produce as a profit‐maximizer it
wouldproduce1000units(this iswherethe MarginalRevenue=MarginalCosts1). It
would charge a price equal to $25. Producing at this point however is suboptimal.
Firstly,thereisexcesscapacitysincethefirmisnotproducingatthepointwhereLRAC
is at its minimum (Parkin et al, 2008; McConnell and Brue, 2005). Moreover, the
consumer is charged a higher price than would be necessary were the firm were to
produce at theminimum point of the LRAC. Thus the naturalmonopolistmaymake
profitatthispoint.Thereishowevernoguaranteethatsuchprofitswillbereinvestedto
enhance futuregenerationofelectricity. It ispossible that if thenaturalmonopolist is
private the profit may be shared among the shareholders or even consumed as
perquisiteconsumptionbythemanagement(Foulkes‐Jones,2010).Itmaybenecessary
forthegovernmenttointervenesothattheprivatemonopolistisforcedtoproduceata
sociallyacceptablepoint,suchaspoint“F”.Also,atpoint“F”moreisproducedatlower
costs. This is beneficial to the consumer as the goods are likely to be sold at lower
1MarginalRevenue(MR)istheincreaseintotalrevenueduetoaunitincreaseinoutputsold.MarginalCosts(MC)isthe
increaseintotalcostsduetoaunitincreaseinoutputproduced.
‐55‐
prices; increasing the consumer surplus. Another alternative would be for the
government to nationalize the monopolist and ensure that it produces a socially
desirableoutputlevel.Thedrawbackisthatmostparastatalsinemergingordeveloping
countriesarenotasproductiveasprivatelyowned firms.Also, anumberof themare
corruptorcaneasilybeabusedbypoliticiansor thosecloselyconnectedtotheruling
elite.
AccordingtoFoulkes‐Jones(2010)andParkinetal(2008)thegovernmentcan,through
regulating bodies, force the monopolist to produce and charge the price that
corresponds to the point where the long run marginal cost curve (LRMC) cuts the
demandcurve.Itmustbenotedhoweverthatatthatpointthemonopolistwillnotbe
abletocoveritsproductioncosts.Thusintheabsenceofgovernmentsupportitmaybe
forcedtoshutdownintheshortrunifitcannotcoveritsaveragecost,orexitinthelong
runifsuchlossespersists.

‐56‐
Figure4.4:ANaturalMonopolist’sDemandandCostsCurve
Source:AdoptedfromFoulkes‐Jones(2010);Muradzikwaetal(2006),andParkinetal
2008)
4.7 DegreeofRegulationandDeregulation:TheCaseofESKOM
AsalreadyexplainedinSection4.6,ESKOMisaparastatal.Assuchitfacesanumberof
challenges. One important challenge is that it does not have the freedom to single‐
handedlydictatethepriceofelectricity(Foulkes‐Jones,2010;ESKOM,2010).IfESKOM
needs to change the price of electricity itmust attain approval from the government.
Thegovernment, through theNationalEnergyRegulatorof SouthAfrica (NERSA)will
M R D
L R A C L R M C
E
D
20
25
0 2000 4000
F
Q u a n t i t y
Price and Costs
‐57‐
have to hold public hearings where members of the public and various other
stakeholders are allowed to air their objection to such decisions. As a result of such
hearings, ESKOM may occasionally be requested not to increase the price. One
significantaspecthoweveristhatanincreaseinthepriceofelectricitymayhaveserious
consequencesfortheentireeconomy,thisisespeciallyattributabletotheimportanceof
electricity in production input. Ithas been argued by some commentators that in the
past ESKOM was not allowed to charge a viable price that would have ensured a
sustained supply of electricity (Foulkes‐Jones, 2010). Consequently the South African
Economy experienced serious power outages which serious affected the country’s
growth rate as well as its position as a destination for foreign direct investment
(Foulkes‐Jones,2010).
4.8 ProductandServicesPricingStrategies
AsstatedearlierESKOMisessentiallyanaturalmonopoly. It isaparastatalownedby
government and regulated by government through NERSA (ESKOM, 2010). The
regulations are in terms of how it must produce and the price that it must charge.
ESKOM(2009)statesthatitsstrategicpricingobjectivesare:
• Economicefficiencyandsustainability
• Revenuerecovery
• Fairnessandequity
‐58‐
Theauthorbrieflyconsiderseachoneofthesepoints,asfollows;
• Economic efficiencyand sustainability: tariffswill contain cost reflective signals
thatpromoteeconomicefficiencyandsustainability (Foulkes‐Jones,2010).The
marketstructureinwhichESKOMfindsitselfinmustbeconsidered.Theefficient
productionofelectricitymustalsotakeintoaccounttheenvironmentalimpactof
suchproduction.Thepossibilityofotherplayersmustalsobetakenintoaccount.
More importantly, theuseofother sourcesof electricity, rather thancoal as is
currently thecaseneedstobeconsidered.Otherpossiblesources includewind
powerandsolarenergy.
• Revenue recovery: tariff structures will not expose ESKOM to unacceptable
revenue risk and provide themeans for adequate revenue recovery to ensure
reliability of supply (Foulkes‐Jones, 2010). This may be compromised by the
politicalpressurefromotherstakeholderswhomaynotasfarsightedasESKOM
or otherswhomay fail to understand the rational of high salaries for ESKOM
management.Especiallywhensuchsalariesarefargreaterthanthemanagement
of private sector management let alone that of the management of other
governmentdepartments.Thismustbeviewed in lightof the fact thatCEOsor
themanagement generally have their own labourmarket inwhich themarket
conditionsestablishthesalariesandbenefitsofsuchemployees.
• Fairness and equity: tariffs will be designed in such a way that they as non‐
discriminatoryaspossible.Thismustbedonebytakingintoaccounttheneedsof
all customers on a fair and equitable basis (Foulkes‐Jones, 2010). Thismeans
‐59‐
accesstoelectricityisnotfortherichonlybutforSouthAfricans,includingthe
poor(mostofwhomwerepreviouslydisadvantagedbytheapartheidsystem).At
the same time sustainability is only possible if funds are made available for
investment into the futuregenerationof electricity forall SouthAfricans. Such
finance can come from price increases. Other sources such as government
support or loans frommultilateral institutions in the formof theWorldBank,
Development Southern Africa and African Development Bank should also be
considered.
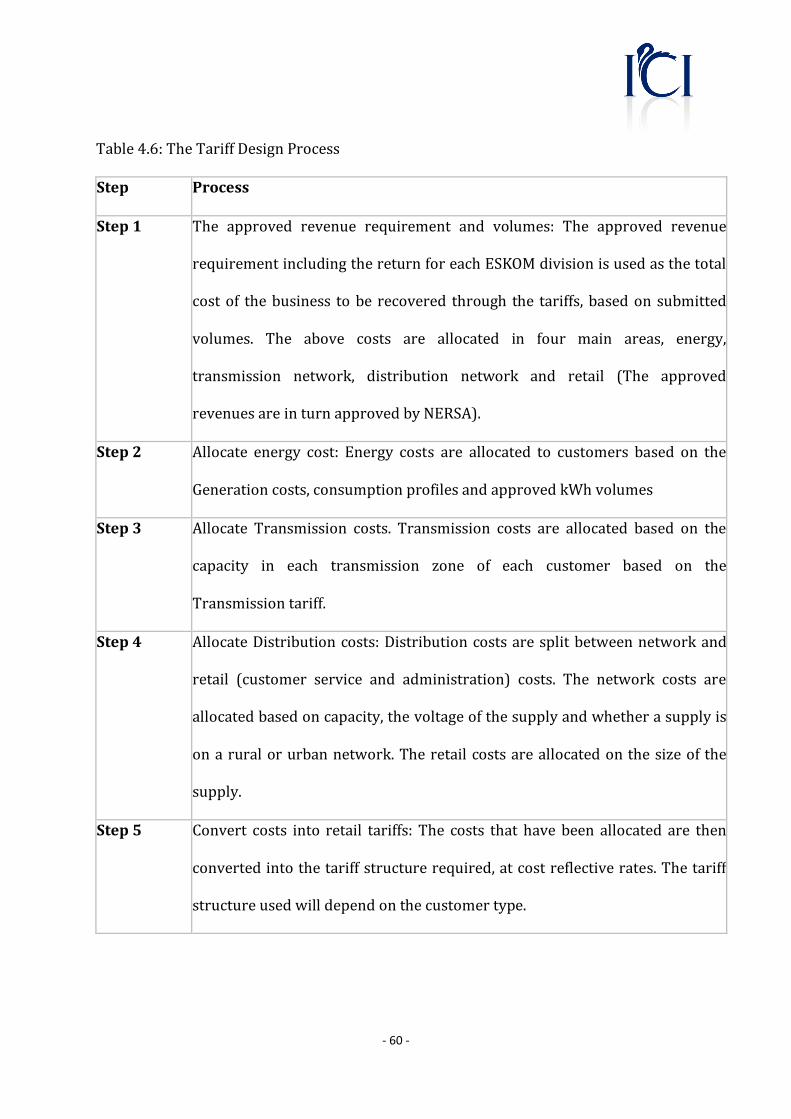
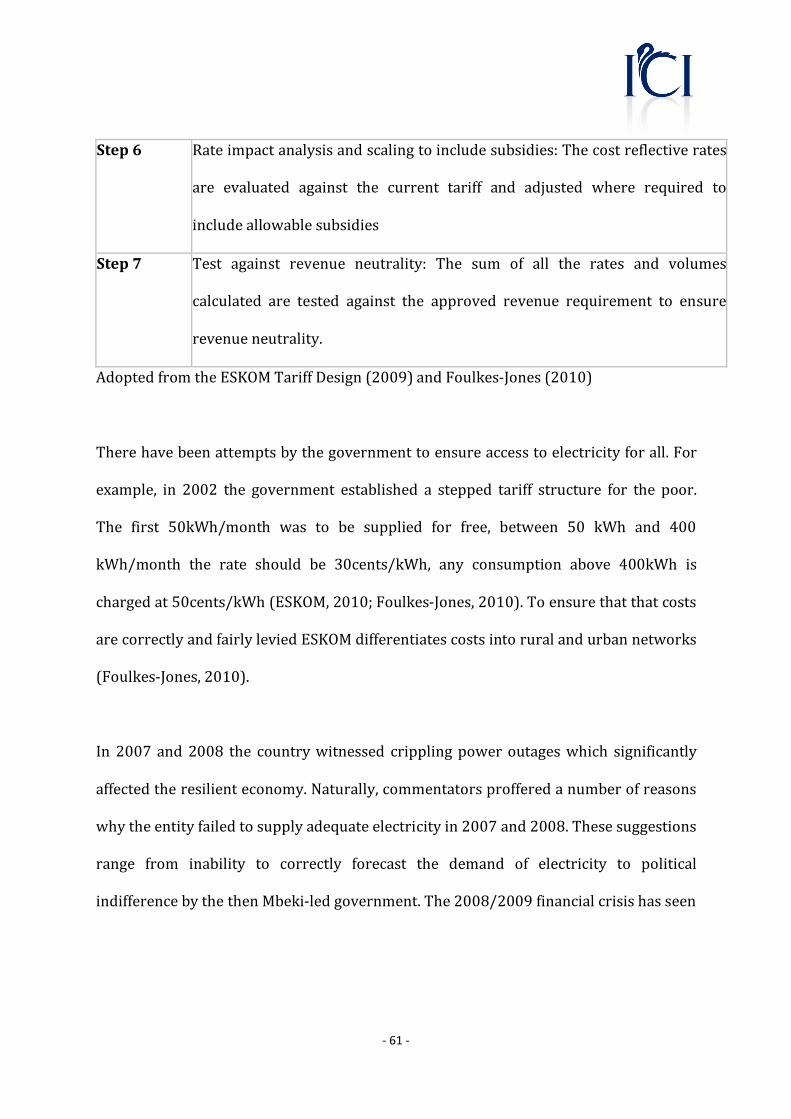
According to ESKOM (2009) the design of the electricity tariffs by ESKOM involves 7
principlestepsasshowninthefollowingtable.ThetablewasadoptedfromtheESKOM
TariffDesignPaper(2009)andFoulkes‐Jones(2010).
‐60‐
Table4.6:TheTariffDesignProcess
Step Process
Step1
The approved revenue requirement and volumes: The approved revenue
requirementincludingthereturnforeachESKOMdivisionisusedasthetotal
costof thebusiness tobe recovered through the tariffs,basedon submitted
volumes. The above costs are allocated in four main areas, energy,
transmission network, distribution network and retail (The approved
revenuesareinturnapprovedbyNERSA).
Step2
Allocate energy cost: Energy costs are allocated to customers based on the
Generationcosts,consumptionprofilesandapprovedkWhvolumes
Step3
Allocate Transmission costs. Transmission costs are allocated based on the
capacity in each transmission zone of each customer based on the
Transmissiontariff.
Step4
AllocateDistributioncosts:Distributioncostsaresplitbetweennetworkand
retail (customer service and administration) costs. The network costs are
allocatedbasedoncapacity,thevoltageofthesupplyandwhetherasupplyis
onaruralorurbannetwork.Theretailcostsareallocatedonthesizeof the
supply.
Step5
Convert costs into retail tariffs: The costs that have been allocated are then
convertedintothetariffstructurerequired,atcostreflectiverates.Thetariff
structureusedwilldependonthecustomertype.
‐61‐
Step6
Rateimpactanalysisandscalingtoincludesubsidies:Thecostreflectiverates
are evaluated against the current tariff and adjusted where required to
includeallowablesubsidies
Step7
Test against revenue neutrality: The sum of all the rates and volumes
calculated are tested against the approved revenue requirement to ensure
revenueneutrality.
AdoptedfromtheESKOMTariffDesign(2009)andFoulkes‐Jones(2010)
Therehavebeenattemptsbythegovernmenttoensureaccesstoelectricityforall.For
example, in 2002 the government established a stepped tariff structure for the poor.
The first 50kWh/month was to be supplied for free, between 50 kWh and 400
kWh/month the rate should be 30cents/kWh, any consumption above 400kWh is
chargedat50cents/kWh(ESKOM,2010;Foulkes‐Jones,2010).Toensurethatthatcosts
arecorrectlyandfairlyleviedESKOMdifferentiatescostsintoruralandurbannetworks
(Foulkes‐Jones,2010).
In 2007 and 2008 the countrywitnessed cripplingpower outageswhich significantly
affectedtheresilienteconomy.Naturally,commentatorsprofferedanumberofreasons
whytheentityfailedtosupplyadequateelectricityin2007and2008.Thesesuggestions
range from inability to correctly forecast the demand of electricity to political
indifferencebythethenMbeki‐ledgovernment.The2008/2009financialcrisishasseen
‐62‐
reduced demand for electricity, giving ESKOM some time in which to address its
shortfalls in supply. The entity has had time to strategize and ensure that what
happenedin2008/09willnotberepeatedagain.Short‐runstrategiesincludedemand
management toensure thatwhat is available is efficientlyutilized.Long‐runplanning
requirestheentitytobuildnewpowerstations.TothisendESKOMmanagedtosecure
some funding from theWorldBank. It ishoweverhoped thatonce thevariouspower
stationsunderconstructionbyESKOMareoperationaltheriskofpoweroutageswillbe
significantlyreduced,ifnoteliminated.
Theoptionofraisingfundsforinvestmentbyincreasesinpriceisnotpoliticallyviable
presently.Economicallyitmayalsobeunpalatable.Anincreaseinthepriceofelectricity
can have a ripple effect through the economy. This may cause macroeconomic
instability in an economy which is already contending with more than 20%
unemployment.Themacro‐instabilitycanalsopushtheinflationrateoutofthecentral
bank’s target of between 3% and 6%. The implications of this include a substantial
reduction in investor confidence and possibly a commensurate drop in foreign direct
investment.Ultimatelyunemploymentmayincrease,causingpoliticalinstabilityakinto
thecurrentEgyptiandebacle.
‐63‐
4.9 Barrierstoentry
The energy sector, especially the electricity generation segment of the value chain, is
verydifficulttopenetratepresently.Consequently,thereisnothreatofpotentialentry
by competitors, thereby ensuring that ESKOM’s monopoly is likely to persist for the
foreseeable future. The principal challenge in this instance is attributable to the
prohibitivelyhighinitialset‐upcosts.Whilstcompetitionmaybeacatalystforadrivein
efficiency,itmustbenotedthatinacasewherethemonopolyisnaturalitmayactually
betoconsumers’advantagethatESKOMremainsamonopoly.
The price of electricity is also considered to be very low by international standards.
AccordingtoKowalikandCoetzee(2007)theaveragepriceofelectricityinSouthAfrica
was 25cents per kilowatt in 2007.However, it is noteworthy that the domestic tariff
varies from onemunicipality to the other. In response to this discrepancy, there are
plans afoot to establish a common price across allmunicipalitieswithin the country.
Therefore,itisreasonabletoassertthatthelowelectricitypricesmakeitverydifficult
foranypotentialnewentrantstorecouptheirinvestedfunds.Thepaybackperiodmay
therefore prove very long. The government is however encouraging the entrance of
independentproducersofrenewableenergy.
‐64‐
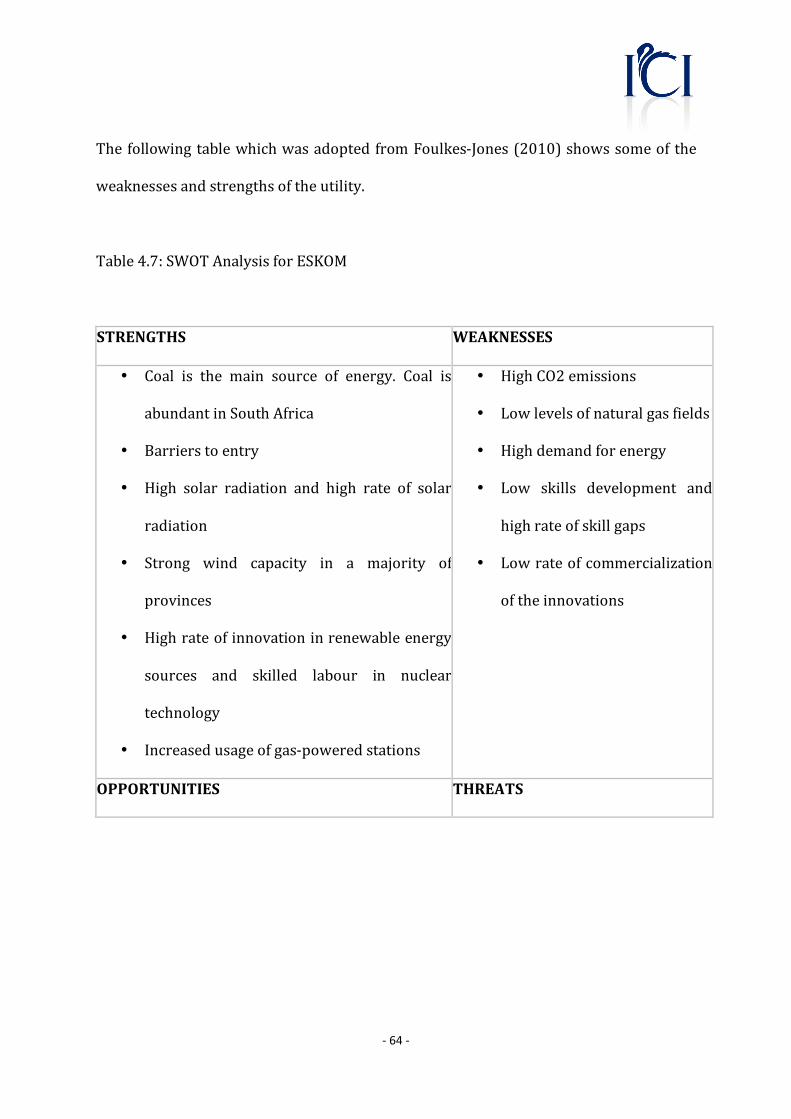
ThefollowingtablewhichwasadoptedfromFoulkes‐Jones(2010)showssomeof the
weaknessesandstrengthsoftheutility.
Table4.7:SWOTAnalysisforESKOM
STRENGTHS WEAKNESSES
• Coal is the main source of energy. Coal is
abundantinSouthAfrica
• Barrierstoentry
• High solar radiation and high rate of solar
radiation
• Strong wind capacity in a majority of
provinces
• Highrateofinnovationinrenewableenergy
sources and skilled labour in nuclear
technology
• Increasedusageofgas‐poweredstations
• HighCO2emissions
• Lowlevelsofnaturalgasfields
• Highdemandforenergy
• Low skills development and
highrateofskillgaps
• Lowrateofcommercialization
oftheinnovations
OPPORTUNITIES THREATS
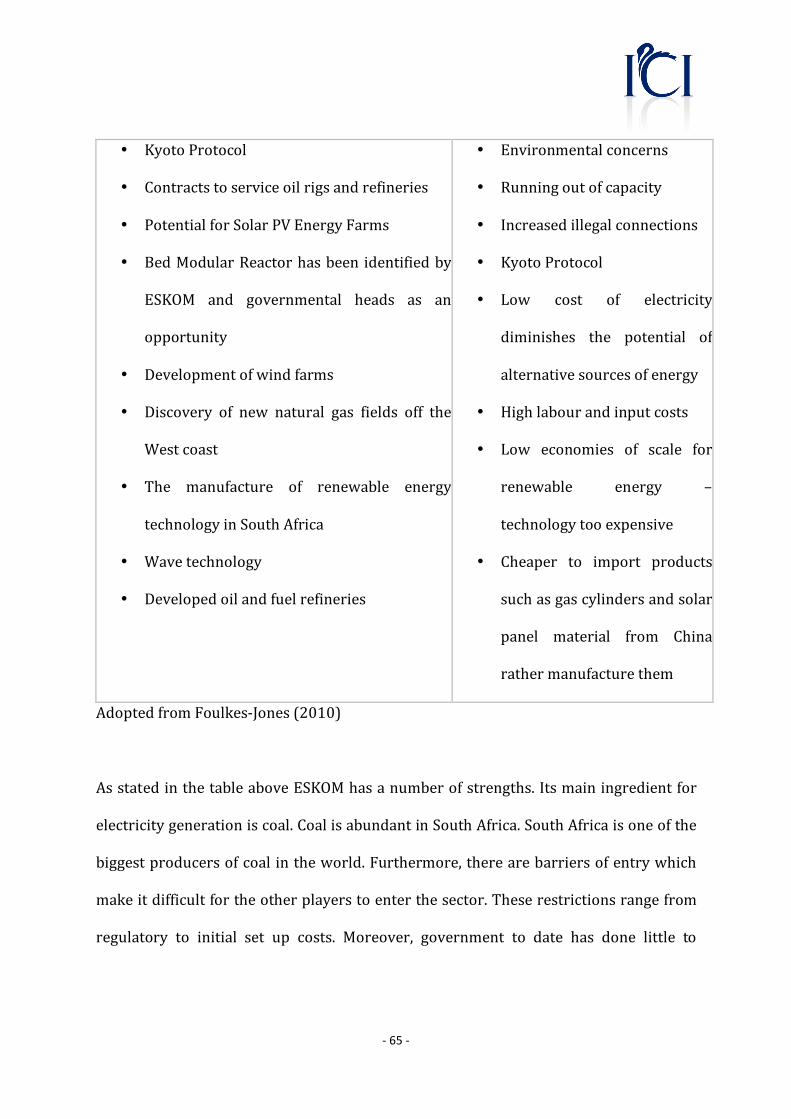
‐65‐
• KyotoProtocol
• Contractstoserviceoilrigsandrefineries
• PotentialforSolarPVEnergyFarms
• BedModularReactorhasbeen identifiedby
ESKOM and governmental heads as an
opportunity
• Developmentofwindfarms
• Discovery of new natural gas fields off the
Westcoast
• The manufacture of renewable energy
technologyinSouthAfrica
• Wavetechnology
• Developedoilandfuelrefineries
• Environmentalconcerns
• Runningoutofcapacity
• Increasedillegalconnections
• KyotoProtocol
• Low cost of electricity
diminishes the potential of
alternativesourcesofenergy
• Highlabourandinputcosts
• Low economies of scale for
renewable energy –
technologytooexpensive
• Cheaper to import products
suchasgascylindersandsolar
panel material from China
rathermanufacturethem
AdoptedfromFoulkes‐Jones(2010)
AsstatedinthetableaboveESKOMhasanumberofstrengths.Itsmainingredientfor
electricitygenerationiscoal.CoalisabundantinSouthAfrica.SouthAfricaisoneofthe
biggestproducersofcoalintheworld.Furthermore,therearebarriersofentrywhich
makeitdifficultfortheotherplayerstoenterthesector.Theserestrictionsrangefrom
regulatory to initial set up costs. Moreover, government to date has done little to
‐66‐
actively encourage private players to enter the sector. However, were other private
players to enter themarket, itwill nonetheless take time for them to really compete
withESKOM.
AnotherpotentialstrengthisthatSouthAfricapreviouslyproducedelectricitythrough
themediumofnuclearpower.Consequently, thecountryenjoysaskilled labour force
that could facilitate in thegenerationof nuclearpower.There is also apossibilityof
usingalternative sourcesofpower in the formofwindandsolar.ESKOMmay inany
event have to diversify and use these sources as well. It can, with the support of
governmentandinterestedprivateplayers,developsolarfarmswhichcanalsoproduce
electricity.
According toFoulkes‐Jones (2010),ESKOMhasan advantage in thatwhilst itmaybe
difficulttounilaterallyincreasethetariffdomestically,itisfarmoreatlibertytodoso
with its customers based in other countries. Consequently, this is an opportunity for
ESKOMtogenerateadditionalrevenuetofuelitsfutureexpansion.
ItshouldbenotedthatwhilstESKOMsuffersthepotentialthreatwhichisalwaysposed
bynewmarketentrants, itwillnonetheless takea considerableamountof time fora
seriouscompetitortobecomeestablished.
‐67‐
GiventheaboveenvironmentalfactorswhichinfluencethecapabilityofESKOMtoraise
capital, the author now wishes to consider ESKOM’s financial position and assess
whether the firm will be able to raise the funds required for investment. The table
belowshowsESKOM’sfinancialperformanceindicatorsfortheperiod2006–2009.The
parastatal’s EBIT has been declining during the period in question. In 2006 it was
R7030millionbutby2009thefigurehaddeclinedtoanegativeR2115million.Thenet
profitfortheyearalsodeclinedfrom4447millionin2006toanegativeof168million
in 2008. By 2009 the net profit had declined to a negative 9668million. In spite of
deterioratingfinancialpositionasshownbythedecliningEBITandnetprofitthefirm
witnessedagradualincreaseinitsassetbaseandtotalequityduringtheperiod2006–
2009.
The debt service ratio shows the ability of the firm to honour itsdebt obligations. In
2006thedebtserviceratiowas0.56butby2009theratiohaddeclinedtoanegative
0.55. This could be attributable to the high debt level in ESKOM’s balance sheet. For
example in 2006 the entity’s debt‐equity ratio was 0.19 but by 2009 the ratio has
increaseto1.22;implyingthattheentity’scapitalstructureisdominatedwithdebt.

‐68‐
Table4.8:ESKOMGroupFinancialPerformance
Financial
Performance
Indicator
2006 2007 2008 2009
EBIT
(ZAR)Millions
7032 6452 3215 ‐2115
Net profit for
theYear
(ZAR)Millions
4447 7220 ‐168 ‐9668
TotalAssets
(ZAR)Millions
125716 139838 166170 199302
TotalEquity
(ZAR)Millions
48670 55890 61129 59578
Debt/Equity
Ratio
(ZAR)Millions
0.19 ‐0.21 0.40 1.22
Debt Service
CoverRatio
(ZAR)Millions
0.56 0.44 ‐0.17 ‐0.55
InterestCover
(ZAR)Millions
6.8 9.11 2.5 ‐0.80
‐69‐
Source:ESKOMIntegratedReport(2010)
Giventheabove,itwouldappearthatESKOMshouldincreasethepriceofelectricityin
ordertoraisethefundsforexpansion.However,thismayonlyconstituteapartofthe
possiblesolution,asESKOMcanalsobepartiallyfundedthroughtaxes.Forexample,an
emergencyfundcanbeestablishedtofinancetheinfrastructurerequired. ESKOMcan
also secure loans from multilateral organizations such as the World Bank and the
African Development Bank. The other alternative is to open the sector to private
participantstherebymitigatingtheresponsibilityofESKOMsomewhatandreducingthe
need forESKOMto carry suchprohibitive levelsofdebt. Furthermore, soas toavoid
duplication of investment in infrastructure, the private players should be allowed to
feedintothenationalgrid.Theycaninturn“sell”thepowertheygeneratetoESKOMin
theformof“PowerPurchaseAgreements”atapredeterminedtariff,therebyensuringa
securealternativesourceofelectricityataprofitableratetoprivateindustry.Theprice
of electricity can continue to be controlled by the government as is currently being
done,andtherebyensureastrongregulatoryregime.
4.10 Conclusion
This chapter estimated the demand for electricity in South Africa. The price of
electricity,GDPandpopulationwerefoundtobeimportantvariablesthatinfluencethe
demandforelectricity.Thissuggeststhatastheeconomygrowsmoreelectricityneeds
‐70‐
tobegenerated.Populationisthereforeanimportantfactorindeterminingthedemand
for electricity. The government must therefore take population growth into account
whencraftingenergypolicies.
Thechapteralsoforecastthedemandforelectricityandfoundthatasignificantamount
of money will need to be invested into electricity generation in future. The author
utilized two scenarios; Scenario 1 assumed an annual GDP growth rate of 3% per
annum,whilstScenario2assumedagrowthrateof6%perannum.AssumingScenario
1, a total of some R27 billionmust have been invested into electricity generation by
2030toavoidpoweroutagesaswitnessed in2008. If on theotherhandonewere to
assumeagrowthrateof6%,thetotalamountincreasestoR232billion.Thissuggests
that doubling the GDP growth rate significantly increases the amount of required
investment. Furthermore, it is estimated that South Africa’s demand for electricity is
growingat15%peryear(ESKOM,2007).
The chapter also looks at ESKOM’s financial position. This is important given the
author’sneedtoestablishwhetherESKOMcanaffordtoraisetherequiredinvestments
fromitsinternalcoffers.ThefinancialstatementsshowsthatifESKOMcontinuesonthe
sametrajectoryasithasinthepast5yearsitismostlikelytofailtoraisetherequisite
fundsfrominternalcoffers.Itmadelossesin2008and2009.Otherfinancialindicators
suchastheinterestcoverageratioanddebtservicecoverratiodonotappearpromising
either.
‐71‐
CHAPTER5
ConclusionandDiscussionofResearchFindings
5.1 Introduction
Thischapteraimstoconcludethedissertation.Itstartsbymakinggeneralcommentson
the main results especially given the research questions raised in Chapter 1. More
importantly, it also considers thepolicy implicationsemanating from the results. It is
composedof twosections.Section5.1 looksat theconclusionandsection5.2looksat
thepolicyrecommendations.
5.2 ConclusionandPolicyRecommendations
Thestudysoughttoanswerthreemainquestions.Firstly,itconsideredthemainfactors
which drive electricity consumption in South Africa. The study also proceeded to
forecast electricity consumption or demand in South Africa given the factors
investigated earlier. Given such factors and the electricity consumption levels the
questiononinvestmentrequiredtomeetsuchdemandwasthenaddressed.Finally,the
thirdissuethatthestudyaddressedwastheissueoffinancingtheinvestmentrequired
togenerateincreasingelectricitydemandinSouthAfrica.

‐72‐
The author’s results suggest that the priceof electricity, income (asmeasured by the
gross domestic product) and population are themost important drivers of electricity
consumptioninSouthAfrica.Thepriceofelectricitywasfoundtobeinverselyrelatedto
electricity consumption or demand. This is consistent with economic theory which
postulatesthatthehigherthepriceofacommoditythemoreexpensiveitbecomesand
thusthelowerthedemandforthatproduct.Theimplicationisthatonepotentialtoolto
usetoreduceelectricityconsumptionistoincreasethepriceofelectricity.Usingprice
changes as a tool tomanage electricity consumption could be appliedwith a view to
punishing those firms and individuals that may be wasting electricity. However, the
poorwouldbeunabletoaffordsuchpriceincreases,andmustthereforebeprotected.
Whetheritispoliticallyfeasiblehowever,isanotherquestiontobediscussedinanother
forum. Furthermore, using the price as a tool is especially useful and efficient in the
short run. Moreover, the government or ESKOM can formulate a short run demand
management policy which involves educating consumers on electricity usage and on
how not to waste electricity as well as the commensurate costs incurred with the
wastefuluseofelectricity.
A higher price of electricitymaymake electricity generationmore lucrative and thus
attractmoreplayers intothesector. InSouthAfricathere isadeliberatepolicybythe
governmenttoattractmoreindependentprivateproducersofelectricity.Itisexpected
thatinfutureabout30%oftheelectricitygeneratedinSouthAfricashouldbeproduced
‐73‐
byprivateplayers.ThistrendrunsinstarkcontrasttoESKOMpresentrole,wherebyit
generatesinexcessof90%ofthenation’selectricityrequirements.
There are also a number of factors which may make it impossible for ESKOM to
effectively use price increases as an effective tool to manage electricity demand or
consumption. Firstly, ESKOM is largely considered to a developmental entity. It is
thereforenotaprivate firmmotivatedbyprofit.Also, it isownedbygovernmentand
cannot freely increase the price of electricity to achieve desired objectives. Any price
increasemust also be approved by government throughNERSA.NERSAmust in turn
consultthepublic,throughpublichearingsandfollowdueprocess.Naturallythepublic
tends to resists any such price increases. Moreover, Organizations such as COSATU
(workerorganizations)tendtoplaceconsiderablepressureonESKOMnottoincrease
thepriceofelectricity.Despitesuchpressures,ESKOMisinvariablyrequiredtocharge
lower prices to poor households. Notwithstanding this cheaper rate, there are
nonetheless a large number of illegal connections to the grid, which constitute a
considerable draw on the electricity supply, without the commensurate financial
contributionforsame.
AnothersignificantfactorwhichdriveselectricityconsumptioninSouthAfricaisthatof
income. To this end, the author used the gross domestic product (GDP) tomeasure
income.Accordingtoeconomictheoryanincreaseinincomeincreasesthedemandfora
normalgood.Foraninferiorgoodanincreaseinpricereducesquantitydemanded.The
‐74‐
author’s results suggest that there is a positive relationship between income and
quantity demanded of electricity. This is in line with the author’s hypothesis and
economictheory.This implies thatan increase inGDPincreasesquantityofelectricity
demanded. This in turn implies that as the economy develops, more electricity is
required to support such growth. It also goeswithout saying that electricity in South
Africa,likeinanyothercountry,isanormalandnotinferiorgood.Itmustbenotedthat
eventhoughincomemayhavebeenincreasinginSouthAfrica,forthemajorityofSouth
Africa’spoorthishashadlittlebenefit.Thisinturnleaveslittleincometobespenton
suchresourcesaselectricitybytheimpoverishedsectorsofthesociety.
Shiftsinpopulationalsoaffectelectricityconsumption.Thegreaterthepopulationthe
higher the amount of electricity consumed. The author hypothesized that population
and electricity consumed would be positively related. The results confirm this
hypothesis. The population coefficient is positive and significant at 1% level. The
implication is that population control can be used as a tool to reduce electricity
consumption in the country. It may however be socially and politically difficult to
implementsuchastrategyboth in theshortrunand longrun.Presently,eventhough
the country conducts population census once very ten years, South Africa does not
appeartohaveaclearpopulationpolicy.
Another important issue that the paper addressed concerns the various potential
sources of finance available to ESKOM. From the field of corporate finance and to a
‐75‐
certain extent financial economics ingeneral, a firm’smain sources of finance can be
grouped into external and internal finance. Internal finance is generated by the firm
throughretainedearnings.Fromafirm’spointofviewitisthecheapestsourceoffunds.
Furthermore,themajordifferencebetweendebtandequityisthatdebtholdershavea
contractspecifyingthattheirclaimsmustbepaidinfullbeforethefirmcanmakeany
payments to theequityholders.A seconddistinctionbetweendebtand equity is that
paymentstodebt‐holdersaregenerallyviewedasatax‐deductibleexpenseofthefirm.
Incontrastthedividendsonanequityinstrumentareviewedasapayoutofprofitsand
theyarenotatax‐deductibleexpense.Externalfinanceislargelydebt.Also,debtmaybe
categorizedintoprivatedebtandpublicdebt.Privatedebtwouldconstitutedebtfrom,
forexample,banksorinsurancefirms,whilepublicdebtisdebttypicallyacquiredfrom
bondholders,forexample.Morespecifically,thisconstitutesdebtthatmaybetradedon
bondexchanges.
Inthefollowingtheauthorconsidersthedifferenttheoriesofcapitalstructure.Itmust
howeverbenotedthatmostof thetheories in theextant literature focusonprivately
owned firms and not developmental or government owned entities such as ESKOM.
However,ESKOMalsoraisesfundsinthecapitalmarketsjustlikeotherfirms,therefore
thesamefactors thataffectprivate firmsmust, toacertaindegree,alsoaffectESKOM.
We must however caution that such theories of capital are especially germane to
privatelyownedfirmsandmaynotbesuitableforentitieslikeESKOM.
‐76‐
From literature concerning capital structure, the main theories on how firms raise
capitalare:trade‐offtheoryandpeckingordertheory.Accordingtothetrade‐offtheory,
value‐maximizing firms choose the level of debt by balancing tax benefits of debt
against the costs associatedwithdebt suchasbankruptcyandagency costs.The firm
choosesthelevelofdebtthatmaximizesitsvalue.Theoptimalcapitalstructureoccurs
wherethemarginalbenefitofincreasingdebtbyanadditionalunitisequaltomarginal
cost of increasing debt by the same unit. It is important to note that as the firm
increases its debt level the probability of bankruptcy and financial distress also
increases.
Inperfectcapitalmarkets,howafirmraisescapitalisirrelevanttothevalueofthefirm.
Howeverthepossibilityofbankruptcycostsandfinancialdistressandtheinclusionof
taxesimplythatModiglianiandMiller’sirrelevancepropositionsdonotapplyinreality.
Thatis,anincreaseindebtforexample,increasestheprobabilitythatthefirmwillfail
to honour its debt obligations. This will tend to affect the value of the firm. Also,
potential providers of finance tend to require a firm to also contribute something to
business rather than requiring100%of the funds to financeabusiness to come from
outside(e.g.as100%).
Inafollow‐uptotheir1958article,ModiglianiandMiller(1963)introducedcorporate
taxesandtheirconclusionwasthat tomaximize itsvalue,a firmshouldactuallyhave
100%debt.ThecornersolutionimpliedbytheModiglianiandMillermodelis,however,
‐77‐
at oddswith the empirical behaviourof firms. Since then the important question has
beenwhy are firms not using 100%debt to finance their activities?Research efforts
havefocusedontryingtoidentifycostsassociatedwithdebtfinancing,whichfirmstend
to trade‐off against the taxbenefits.But this ishowevernotvery relevant forESKOM
which is government owned and can also raise funds frommultilateral organizations
suchastheWorldBank.Thegovernmentalsotendstoguaranteesuchloans.Suchthat
the theoretical capital structuremodelsmaynotbe sufficiently relevant inexplaining
thebehaviorofESKOMwhenraisingcapital.
TheauthoralsoconsideredESKOM’sfinancialpositionandfoundthattheentitymade
lossesinthepasttwofinancialyearsthatis2008and2009.SeeTable4.8.Fromsucha
financialpositionitdoesnotappearthatESKOMisinapositiontoraisefinanceforthe
essentialinvestmentsforthegenerationofextraelectricity.Furthermore,ESKOMlacks
the massive retained earnings that could be used to finance such future investment.
Consequently, the financialpositionappearstosuggest that itmayhavetodependon
external funds such as loans. The loans can be from multilateral developmental
institutionssuchastheWorldBank,theAfricanDevelopmentBankortheDevelopment
Bank Southern Africa. It can also depend on government funding. It is possible that
ESKOM can borrow by issuing long term bonds. Unfortunately, given its present
financial position, itmay be considered a risky investment bymany investors. Credit
ratingagenciesmayalso lowlyrate it. Investorsmaythuschargehigher interestrates
foranysuchloans.
‐78‐
5.3 PolicyRecommendations
There is an urgent need for government intervention to ensure sufficient electricity
generation in South Africa. South Africa as an economy cannot afford regular power
outages such as those witnessed in 2008. From the thesis the following suggestions
shallbemade;
GovernmentmustallowmoreprivateplayerstoentertheSouthAfricanenergymarket.
Theseindependentpowerproducerscouldgenerateelectricityandfeeditintonational
grid. The advantage is that ESKOM has already established a massive infrastructure
throughoutthecountry,therebyintroducingprivateplayerstofeedintothegridwould
notposeamajorchallenge.Presently,accordingtotheDepartmentofEnergy,thepolicy
isthatindependentprivateplayersarerequiredtocontribute/generate30%ofthetotal
electricity consumed. Currently the contribution by private players is very minimal;
with ESKOM still supply more than 95% of the country’s electricity. More steps are
beingtakenbythegovernmenttoencourageprivatesectorparticipation.
However, according toMr. Godsell the former ESKOM chief executive officer, private
players are not necessarily the panacea to South Africa’s electricity problems (Helen
SuzmanFoundation,2010).Privatesectororganizationsareusuallyprofit‐oriented.Itis
thuspossible that theprivateplayers canactuallyproduceelectricityathigherprices
thanESKOMespecially givenESKOM’smonopolyon power and the possibility that it
‐79‐
mayhugelybenefitfromeconomiesofscale.Itishowevertheauthors’consideredview
that introducing more players in electricity sector can bring about competition and
ultimatelytheconsumermaybenefitfromsuchcompetition.
Related to the private sector participation in the generation of electricity is the
ownershipof thenationalgrid.Somecommentatorssuggests that it isnotoptimal for
ESKOM (also a generator of electricity) to own the national grid. Some suggests that
perhapsthenationalgridmustbeownedbyan independentorganizationwhichthen
allowsallelectricitygeneratorsaccessontothesystem.Thislatterproposalisintended
to promoted equity and reasonable access to all. However, and perhaps most
pertinently, the Minister of Energy observed that the grid must be owned by a
government‐ownedentityandmustnotbeinprivatehands.
Theindependentpowerproducersmustbeencouragedtogoandexpandbeyondfossil‐
based fuel sources. These includewind, solar and nuclear. It should also be borne in
mind that there is movement towards the production of clean energy. In 2003 the
governmentcameupwithaRenewableEnergyWhitePaperwhichaimedatintroducing
renewable energy and ensuring that about 4% of electricity comes from renewable
energyby2013(HelenSuzmanFoundation,2010).
GovernmentorESKOMshouldalsobeallowedtoraisethepriceofelectricityinorderto
more effectively manage electricity demand in the short run. This may however not
‐80‐
prove a feasible political strategy given that a significant portionof the population is
poor.Thismayalsonotbeacceptabletoworkers’unionssuchastheCongressofSouth
AfricaTradeUnions.Incidentally,thegovernmentwillrequireCOSATU’ssupportifitis
tosuccessfullyimplementcrediblepoliciesofthisnature.
Government should enact a clear population policy over and above conducting
censuses.Suchapolicycanhelpgovernmentsufficientlysupplyelectricitytotheentire
country.
5.4 Limitationsofthestudy
Despitethestudyachievingresultsnotdissimilartothosefoundinotherstudiesorin
accordancewith fundamental economic theory, it nonetheless has certain limitations.
Firstly, due to data limitations, the sample size was smaller than initially expected.
Originally thestudywassupposedtobebasedonquarterlydata for theperiod1985‐
2010.Thatis,morethan100datapoints.However,duetothefactthatdataonpriceof
electricity, electricity consumption and population was only available on an annual
basis,thestudyhadtouseannualratherthanquarterlydata.Thissubstantiallyreduced
thesamplesize.Whilstanysampleabove30isstillusable(Gujarati,2004)theauthor
stillcautionsthattheresultsmust,onaccountofthis,beinterpretedwiththiscaveatin
mind.
‐81‐
Itisalsopossiblethatsuchareductioninthesamplesizeaffectstheprecisenessofthe
estimatedparameters.Usuallyparameterefficiencyimproveswithlargersamples.This
observationrunsintandemwiththenotionofmostestimators,includingtheOrdinary
Least Squares estimator, are being asymptotically efficient. The efficiency of the
parametersmaythusbeaffectedbythereductioninsamplesize.
The secondweakness of the study is its use of historical data for the period 1993 to
2010 to forecast electricity consumption up to the year 2030. According to Gujarati
(2004) the further one forecasts into the future the less accurate the forecast. The
author’s forecasts were however based on a realistic set of assumptions, based on
expectedgrowthratesinGDPandpopulationgrowthrates.Theauthorformulatedtwo
scenarios.Scenario1assumedtheGDPgrowthrateforthedurationoftheperiodwould
be3%and theother scenarioassumedagrowth rateof6%. It ispossible that actual
growthrateduringtheperiodinquestionwillfallwithinthisrange.Inthatinstance,the
forecastedelectricityconsumptionandthecorrespondingrequiredinvestmentwillalso
fallbetweentheamountsestimatedusingthetwogrowthrates.IntheirstudyFedderke
andBogetic(2006)alsomadethesameassumptions.

‐82‐
BIBLIOGRAPHY
Alam,M.,Sathaye,J.,Barnes,D.,(1998).UrbanhouseholdenergyuseinIndia:efficiency
and policy implications. Journal of Energy Policy, Issue: 26. [Online] Available from:
doi:10.1016/S0301‐4215(98)00008‐1 (Accessed: 30/8/2010). The Emerald Insight
Database.TheUniversityofLiverpoolLibrary
Amusa,H. et al. (2009),Aggregatedemand forelectricity inSouthAfrica:An analysis
using the bounds testing approach to cointegration, Journal of Energy Policy; Volume
37(10). [Online]. Available from:
http://dx.doi.org.ezproxy.liv.ac.uk/10.1016/j.enpol.2009.05.016 (Accessed 5/9/2010).
TheEmeraldInsightDatabase.TheUniversityofLiverpoolLibrary
Aschauer (1989), Is Public Expenditure Productive? Journal of Monetary Economics,
Volume 23(2), [Online]. Available from: doi:10.1016/0304‐3932(89)90047‐0
(Accessed20/8/2010).TheSciverse.TheUniversityofLiverpool
Berens, J. L. and Cuny, C. J. (1995). The capital structure puzzle revisited. Review of
Financial Studies; Volume 8(4), [Online]. Available from:
http://rfs.oxfordjournals.org/content/8/4/1185.abstract (Accessed 15/9/2010).
OxfordJournal.OxfordOrg
‐83‐
Bogetic, Z. and Fedderke, J. (2005), Infrastructure and Growth in South Africa:
Benchmarking,ProductivityandInvestmentNeeds,JournalofPublicEconomics,Volume
37(9), [Online]. Available from doi:10.1016/j.worlddev.2009.01.008 (Accessed
7/9/2010).TheEmeraldInsightDatabase.TheUniversityofLiverpoolLibrary
Davidson, O., Tyani, L., Afrane‐Okesse, Y., (2002). Sustainable energy and climate
change: African perspectives. Developing energy solutions for climate change: South
African research at EDRC,Energy & Development Research Centre, University of Cape
Town:
Davis, M. (1998) ‘Rural Household energy consumption: the effects of access to
electricity ‐ evidence from South Africa’. Journal of Energy Policy, Volume 26(3),
[Online]. Available from doi:10.1016/S0301‐4215(97)00100‐6(Accessed 20/9/2010).
TheEmeraldInsightDatabase.TheUniversityofLiverpoolLibrary
DeVitaG.,EndresenK.andHuntI.C.(2006)‘Anempiricalanalysisofenergydemandin
Namibia’, Journal of Energy Policy, Volume 34(18), [Online] Available from:
doi:10.1016/j.enpol.2005.07.016(Accessed20/6/2010)ScienceDirect
Dergiades,Theologos&Tsoulfidis,(2008),Estimatingresidentialdemandforelectricity
in the United States, Journal of Energy Economics, Volume 30(5), [Online] Available
‐84‐
from: doi:10.1016/j.eneco.2008.05.005 (Accessed on 17/8/2010). The Emerald
InsightDatabase.TheUniversityofLiverpool
Donatos,G.S.andMergos,G. J. (1991),ResidentialDemandforelectricity:Thecaseof
Greece, Journal of Energy Economics, Volume 13(1), [Online] Available from:
doi:10.1016/0140‐9883(91)90054‐4 (Accessed 6/9/2010). The Emerald Insight
Database.TheUniversityofLiverpoolLibrary
ESKOM (2007) Annual Report 2007, ESKOM. [Online] Available from:
http://www.eskom.co.za/annreport07/annreport07/index.htm(Accessed24/8/2010).
ESKOM(2008)ESKOM’stariffdesignandmethodologyfor2008/09,ESKOM.
[Online] Available from:
http://www.ESKOM.co.za/live/content.php?Item_ID=4057&Revision=en/5 (Accessed:
15/8/2010)
ESKOM Annual Report (2010). The Path to Recovery. ESKOM South Africa [Online].
Availablefrom:http://www.ESKOM.co.za(Accessed20/8/2010)
Foulkes‐Jones,G.(2010).AnalysisofEskomwithinthebroaderenergysectorofSouth
Africa from a managerial‐economic perspective. (Submitted to The University of
Liverpoolon3/2/2010).TheUniversityofLiverpool

‐85‐
Gaunt,C.T.,(2008)‘SouthAfrica’srapidelectrificationprogramme:Policy,institutional,
planning,financingandtechnicalinnovations’. JournalofEnergyPolicy,Volume36(9),
[Online]. doi:10.1016/j.enpol.2008.05.022, (Accessed on 17/8/2010). The Emerald
InsightDatabase.TheUniversityofLiverpoolLibrary
Gwatidzo,T.,Ojah,K.(2009).'Corporatecapitalstructuredeterminants:evidencefrom
five African countries' African Finance Journal , Volume 11 (1). [Online].
http://EconPapers.repec.org/RePEc:afj:journl:v:11:y:2009:i:1:p:1‐23,EconPapers.
Holtedahl, P. and Joutz, F. L. (2004). Residential Electricity Demand in Taiwan, The
JournalofEnergyEconomics,Volume26(2),[Online].doi:10.1016/j.eneco.2003.11.001,
(Accessed 25/09/2010). The Emerald InsightDatabase. TheUniversity of Liverpool
Library
Hondroyiannis, G. and Lazaretou, S. (2004), Inflation persistence during periods of
structural change – an assessment using Greek data, [Online]
http://ideas.repec.org/f/pho316.html, (Accessed 5/9/2010). The European Central
Bank
Howells, M.I., Alfstad, T., Victor, D.G., Goldstein, G., Remme, U., (2005) ‘A model of
householdenergyservicesinalow‐incomeruralAfricanVillage’.TheJournalofEnergy
‐86‐
Policy, Volume 33(14), [Online]. doi:10.1016/j.enpol.2004.02.019, (Accessed
22/8/2010).TheEmeraldInsightDatabase.TheUniversityofLiverpoolLibrary
InglesiR.(2010)AggregateelectricitydemandinSouthAfrica:conditionalforecaststo
2030, Journal of Applied Energy, Volume 87(1), [Online].
doi:10.1016/j.apenergy.2009.08.017 (Accessed 14/9/2010). The Emerald Insight
Database.TheUniversityofLiverpoolLibrary
Kennedy,P.(2003).AGuidetoEconometrics.5thEdition.TheMITPressCambridge,
Massachussetts
Kessides, C. (1993), The contributions of infrastructure to economic development,
World Bank Discussion Papers, Volume 213 (13), [Online].
http://ideas.repec.org/e/pke162.html,(Accessed22/8/2010).TheWorldBank
Kowalik, P. and Coetzee, K (2007) The Scope of the Energy Industry in theWestern
Cape, Access Market International. [Online]
http://www.capegateway.gov.za/other/2005/11/final_first_paper_energy_printing.pdf,
(Accessed:17/8/2010).TheGovernmentoftheWesternCape
Louw, et. al. (2008) Determinants of electricity demand for newly electrified low‐
income African households, Journal of Energy Policy, Volume 36(8), [Online].
‐87‐
doi:10.1016/j.enpol.2008.02.032, (Accessed 20/8/2010). The Emerald Insight
Database.TheUniversityofLiverpoolLibrary
McConnell, C. R andBrue, S. L (2005) Economics: Principles, Problems and Policies.
16thEdition.McGrawHill.London.
Modigliani,F.andMiller,M.(1963).CorporateincometaxesandtheCostofCapital:A
Correction, American Economic Review 53(3), [Online]
http://www.jstor.org/stable/1809167, (Accessed 20/9/2010). The American
EconomicAssociation
Muradzikwa, S., Smith,L. andDeVilliersPierre (2006). Economics.OxfordUniversity
Press
Myers,S.CandMajluf,N.S.(1984).Corporatefinancingandinvestmentdecisionswhen
firms have information that investors do not have. Journal of Financial Economics,
Volume 13, [Online]
https://www2.bc.edu/~chemmanu/phdfincorp/MF891%20papers/myers%20and%2
0majluf%201984.pdf (Accessed 25/9/2010). Elsevier Science Publishers B.V (North
Holland)
‐88‐
Myers,S.C.(1984).TheCapitalStructurePuzzle.TheJournalofFinance,Volume39(3),
[Online], http://www.jstor.org/pss/2327916, (Accessed 10/9/2010). JSTOR
Publications.TheAmericanFinanceAssociation
Narayanet al, (2007),Modellingoilpricevolatility, Journalof EnergyPolicy, Volume
35(12),[Online]doi:10.1016/j.enpol.2007.07.020,(Accessed15/9/2010).TheEmerald
InsightDatabase.TheUniversityofLiverpoolLibrary
OdhiamboN.M.(2009)ElectricityconsumptionandeconomicgrowthinSouthAfrica:A
trivariate causality test, Journal of Energy Economics, Volume 31(5), [Online]
doi:10.1016/j.eneco.2009.01.005, (Accessed 10/8/2010), The Emerald Insight
Database,TheUniversityofLiverpoolLibrary
Parkin, M., Powell, M., and Mathews, K. (2008) Economics, 7th Edition. Pearson
EducationLimited.England
Perkins, P., Fedderke, J., and Luiz, (2005), ‘An analysis of economic infrastructure
investment in South Africa’, South African Journal of Economics, Vol. 73(2), [Online],
doi:10.1111/j.1813‐6982.2005.00014.x, (Accessed 25/8/2010), The Emerald Insight
Database,TheUniversityofLiverpoolLibrary.
‐89‐
Pouris, A. (1987)The price elasticity of electricity demand in SouthAfrica. Journal of
Applied Economics, Volume 19(1), [Online]. doi: 10.1080/00036848700000073,
(Accessed 19/8/2010), The Emerald Insight Database, The University of Liverpool
Library
Sarmah, R., Bora, M.C., Bhattacharjee, D.J., (2002). Energy profiles of rural domestic
sectorinsixun‐electrifiedvillagesofJorhatdistrictofAssam,JournalofEnergy,Volume
27(1), [Online], doi:10.1016/S0360‐5442(01)00040‐8, (Accessed: 17/8/2010), The
EmeraldInsightDatabase,TheUniversityofLiverpoolLibrary
SmithA.F.M.andSpiegelhalterD.J.(1980),BayesFactorsandChoiceCriteriaforLinear
Models, Journal of Royal Statistical Society, Volume 42(2), [Online],
http://www.jstor.org/pss/2984964, (Accessed 19/9/2010). The University of
Nottingham
Vogelvang, B. (2005). Econometrics: Theory and Applications with Eviews. Pearson
EducationLimited,UK
Wilson,D.,andAdams,I.(2006)ReviewofsecurityofsupplyinSouthAfrica:Areportto
the Department of Public Enterprise [Online] http://www.dpe.gov.za/news‐311
(Accessed 16/7/2010), The Department of Public Enterprise, Government of South
Africa
‐90‐
Ziramba, E. (2008) The demand for residential electricity in South Africa, Journal of
Energy Policy, Volume 36(9), [Online]. doi:10.1016/j.enpol.2008.05.026, (Accessed
15/9/2010),TheEmeraldInsightDatabase,TheUniversityofLiverpoolLibrary