Embed Size (px)
Citation preview

โอกาสจากการใชประโยชนจากการเปดเสรดานการลงทนภายใต AEC/FTA
โรงแรมมราเคล แกรนด
คณกญญพนธ แรงขาคณกญญพนธ แรงขา
ทปรกษาอาวโส สมาคมอาหารแชเยอกแขงไทย
วนพธท 15 มถนายน 2554 เวลา 10.45-12.00น.
• Asean Economic Community กอตงขน
• มลคาการคา
yตามปฎญญากรงเทพฯ เมอวนท
8 สงหาคม 2510 ประกอบดวยสมาชก 5 ประเทศ ไดแก อนโดนเซย
มาเลเซย ฟลปปนส สงคโปร
และไทย ในปจจบนมสมาชก
เพมขนรวมเปน 10 ประเทศ
คอ บรไน เวยดนาม ลาว พมา ไทยสงออกไปอาเซยน ไทยนาเขาจากอาเซยน
และกมพชา
• ป
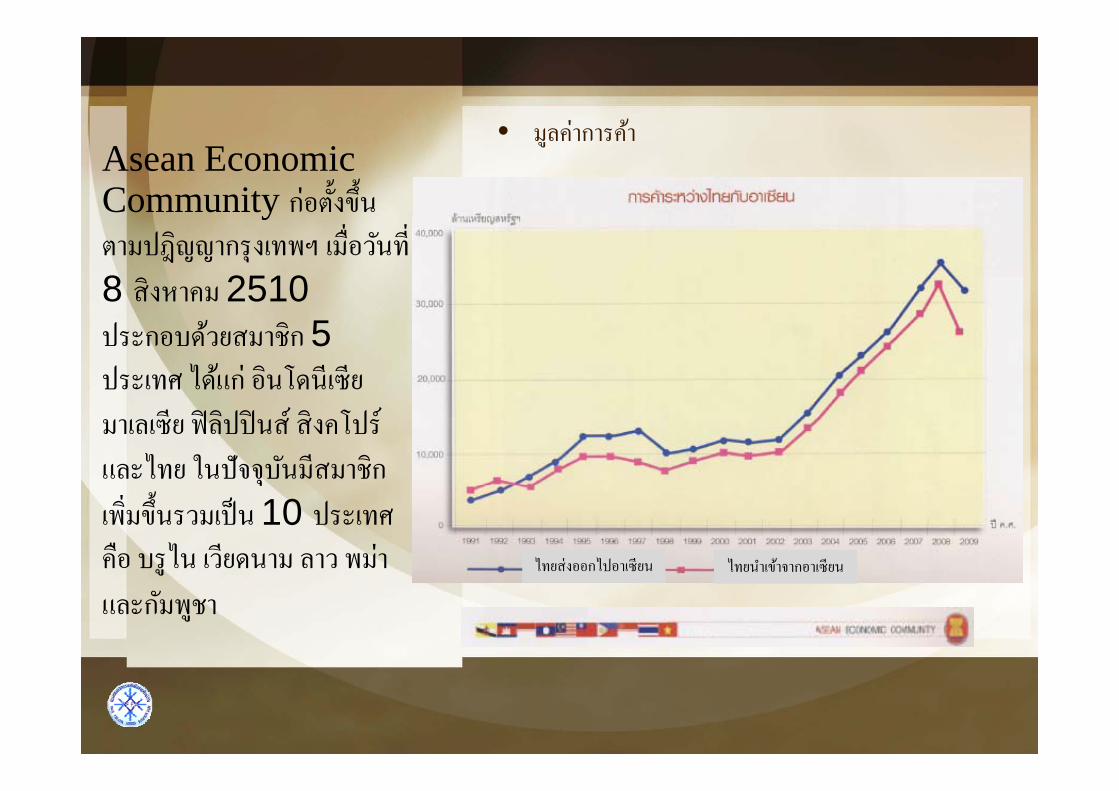
AEC Blueprint• การเปนตลาดเดยวและฐานการผลตรวม
- การเคลอนยายสนคาบรการ การลงทน แรงงาน และเงนทน
อยางเสรมากขนAEC Blueprint-แผนงานในการ ไป
• การสรางขดความสามารถในการแขงขนทางเศรษฐกจ
ของอาเซยนดาเนนการไปส
ประชาคมเศรษฐกจ - นโยบายภาษ พฒนาโครงสรางพนฐาน
• การพฒนาเศรษฐกจอยางเสมอภาค
อาเซยน ภายในป
2015- รวมกลมทางเศรษฐกจ ลดชองวางของระดบการพฒนา
ระหวางประเทศสมาชกเกาและใหม สนบสนน SMEs2015 • การบรณาการเขากบเศรษฐกจโลก
- สงเสรมการรวมกลมเขากบประชาคมโลก ดานนโยบาย
เศรษฐกจของอาเซยนกบประเทศภายนอกภมภาค

โอกาสของการ
1. สรางตลาดขนาดใหญ
- ASEAN มประชากรรวมกวา 580 ลานคนโอกาสของการ
รวมกลมทางเศรษฐกจ
- สรางความนาสนใจและดงดดการคา/การลงทน
2. สงเสรมแหลงวตถดบใชประโยชนจากทรพยากรในภมภาคของอาเซยน ทมผลดาน
บวกตอประเทศไทย
- ใชประโยชนจากทรพยากรในภมภาค
- สรางความไดเปรยบในการแขงขน - สงเสรม Competitive advantagep g
3. เพมอานาจการตอรอง - การสรางทาทรวมในระดบภมภาค
- สรางพนธมตรรวมในดานเศรษฐกจทงในระดบ
ภมภาคและอนภมภาค
สงเสรมการเปนศนยกลางของอาเซยน - สงเสรมการเปนศนยกลางของอาเซยน

ใ
ขอตกลงทมผลบงคบใชแลว
• อาเซยน – จน
ปปจจบนอาเซยนไดม
ความตกลง FTA ใน
• อาเซยน – ญปน
• อาเซยน – เกาหล
ความตกลง FTA ในกรอบตางๆ
• อาเซยน – อนเดย
• อาเซยน – ออสเตรเลย
ไ ไ นอกจากนในอนาคตยงมความเปนไปไดทอาเซยนจะขยาย
การจดทา FTA ใหมากขน เชน กรอบอาเซยน+3 (จน
ญปน และเกาหล) อาเซยน+6 (จน เกาหลใต ญปน ญปน และเกาหล) , อาเซยน+6 (จน เกาหลใต ญปน
ออสเตรเลย นวซแลนด และอนเดย) , อาเซยนกบEU, อาเซยนกบGCC และอาเซยนกบMercosur ซง
จะสงผลใหขนาดของตลาดและเศรษฐกจขยายตวมากขนไป
อก

ASEAN Statistics
Top ten ASEAN trade commodity groups, 2009as of 15 July 2010
value in US$ million; share in percentV l Sh t t t l ASEAN t d1/
2-digit HS code
Description Exports Imports Total trade Exports Imports Total trade
85 Electric machinery, equipment and parts; sound equipment; television equipment
175,788.0 154,209.4 329,997.4 21.7 21.2 21.5
Mi l f l i l il & d t f th i
Value Share to total ASEAN tradeCommodity group1/
27 Mineral fuels, mineral oils & products of their distillation; bitumin substances; mineral w ax
112,834.5 128,105.3 240,939.8 13.9 17.6 15.7
84 Nuclear reactors, boilers, machinery and mechanical appliances; parts thereof
109,232.2 105,767.8 215,000.0 13.5 14.6 14.0
87 Vehicles, (not railw ay, tramw ay, rolling stock); parts and accessories
20,387.4 21,577.7 41,965.2 2.5 3.0 2.7 and accessories
39 Plastics and articles thereof 21,568.0 19,837.7 41,405.6 2.7 2.7 2.7
71Natural or cultured pearls, precious or semiprecious stones, precious metals and metals clad therew ith and articles thereof; imitation jew elry; coin
20,246.1 15,154.2 35,400.3 2.5 2.1 2.3
29 Organic chemicals 19,169.6 15,239.6 34,409.3 2.4 2.1 2.2
90Optical, photographic, cinematographic, measuring, checking, precision, medical or surgical instruments/apparatus; parts & accessories
15,545.8 16,432.7 31,978.5 1.9 2.3 2.1
Animal or vegetable fats and oils and their clevage15
Animal or vegetable fats and oils and their clevage products; prepared edible fats; animal or vegetable w axes
25,566.0 2,902.5 28,468.5 3.2 0.4 1.9
40 Rubber and articles thereof 20,843.9 6,597.5 27,441.4 2.6 0.9 1.8 Top Ten Commodities 541,181.6 485,824.4 1,027,006.0 66.8 66.9 66.8
Oth 2/ 269 307 6 240 529 6 509 837 2 33 2 33 1 33 2Others2/ 269,307.6 240,529.6 509,837.2 33.2 33.1 33.2 Total 810,489.2 726,354.1 1,536,843.3 100.0 100.0 100.0
Source: ASEAN Trade Database (compiled f rom data submission and/or websites of ASEAN Member Countries' national statistical of f ices and other relev ant gov ernment agencies)
Notes- not av ailable as of publication time 1/ identif ied based on the share of the 2-digit classif ication (section) of the Harmonizedx not av ailable/not compiled Sy stem (HS) to total trade
2/ include products with unspecif ied codes and/or products that could not be explicitlyclassif ied according to the current HSSome f igures may not sum up to totals due to rounding of f errors.

ASEAN Statistics
Intra- and extra-ASEAN trade by commodity group, 2009as of 15 July 2010
in US$ million$
2-digit HS code
Description Exports Imports Total trade Exports Imports Total trade Exports Imports Total trade
01 Live animals 303.5 288.4 591.9 21.4 546.8 568.1 324.8 835.2 1,160.0
Commodity group1/ Intra-ASEAN Total ASEANExtra-ASEAN
02 Meat and edible meat offal 83.6 15.5 99.1 98.5 1,586.6 1,685.1 182.1 1,602.1 1,784.2 03 Fish, crustaceans & aquatic invertebrates 805.8 1,044.4 1,850.2 6,633.5 2,466.0 9,099.5 7,439.3 3,510.4 10,949.7
04 Dairy produce; birds eggs; honey and other edible animal products
593.7 547.0 1,140.7 473.4 2,321.9 2,795.3 1,067.1 2,868.9 3,936.0
05 Other products of animal origin 6 2 16 6 22 7 48 7 132 3 181 0 54 9 148 9 203 805 Other products of animal origin 6.2 16.6 22.7 48.7 132.3 181.0 54.9 148.9 203.8
06 Live trees, plants; bulbs, roots; cut f low ers & ornamental foliage
40.6 54.3 94.9 229.9 48.2 278.1 270.5 102.5 373.0
07 Edible vegetables & certain roots & Tubers 399.0 381.7 780.7 1,938.6 1,132.6 3,071.2 2,337.5 1,514.3 3,851.8 08 Edible fruit & nuts; citrus fruit or melon peel 329.2 421.5 750.8 1,771.6 1,459.1 3,230.7 2,100.8 1,880.6 3,981.5 09 Coffee, tea, mate & spices 363.1 306.1 669.2 2,435.7 407.0 2,842.7 2,798.7 713.1 3,511.8 10 Cereals 2,607.6 2,172.5 4,780.1 8,165.1 3,666.6 11,831.7 10,772.6 5,839.1 16,611.8 11 Milling products; malt; starch; inulin; w heat gluten 964.5 242.4 1,206.9 3,624.8 1,018.2 4,642.9 4,589.3 1,260.5 5,849.9
12 Oil seeds & oleaginous fruits; miscellaneous grains, seeds & 906 6 176 7 1 083 3 3 920 9 2 144 3 6 065 3 4 827 6 2 321 0 7 148 612fruit; industrial or medicinal plants; straw & fodder
906.6 176.7 1,083.3 3,920.9 2,144.3 6,065.3 4,827.6 2,321.0 7,148.6
13 Lac; gums, resins & other vegetable sap & extracts 28.7 28.4 57.1 155.5 199.9 355.4 184.2 228.3 412.5 14 Vegetable plaiting materials & other vegetable products 32.1 31.3 63.5 88.9 62.2 151.0 121.0 93.5 214.5
15 Animal or vegetable fats and oils and their clevage products; prepared edible fats; animal or vegetable w axes
2,924.7 2,368.4 5,293.1 22,641.3 534.1 23,175.4 25,566.0 2,902.5 28,468.5 prepared edible fats; animal or vegetable w axes
16 Edible preparations of meat, fish, crustaceans, mollusks or other aquatic invertebrates
236.3 247.2 483.5 6,578.7 234.7 6,813.5 6,815.0 482.0 7,297.0
17 Sugars and sugar confectionary 1,010.1 682.9 1,693.1 1,663.8 1,353.4 3,017.2 2,674.0 2,036.3 4,710.3 18 Cocoa and cocoa preparations 892.3 897.0 1,789.3 2,040.6 701.5 2,742.2 2,932.9 1,598.5 4,531.4 19 Preparations of cereals, f lour, starch or milk; bakers w ares 1,132.5 838.6 1,971.1 1,605.3 796.8 2,402.2 2,737.8 1,635.5 4,373.3 20 Preparations of vegetables, fruit, nuts or other plant parts 243.3 154.4 397.8 2,089.6 572.4 2,662.0 2,332.9 726.9 3,059.8 21 Miscellaneous edible preparations 1,137.2 822.4 1,959.6 1,377.5 1,389.7 2,767.2 2,514.7 2,212.1 4,726.8 22 Beverages, spirits and vinegar 1,518.7 407.9 1,926.6 980.1 1,881.5 2,861.6 2,498.8 2,289.4 4,788.1
ASEAN Statistics
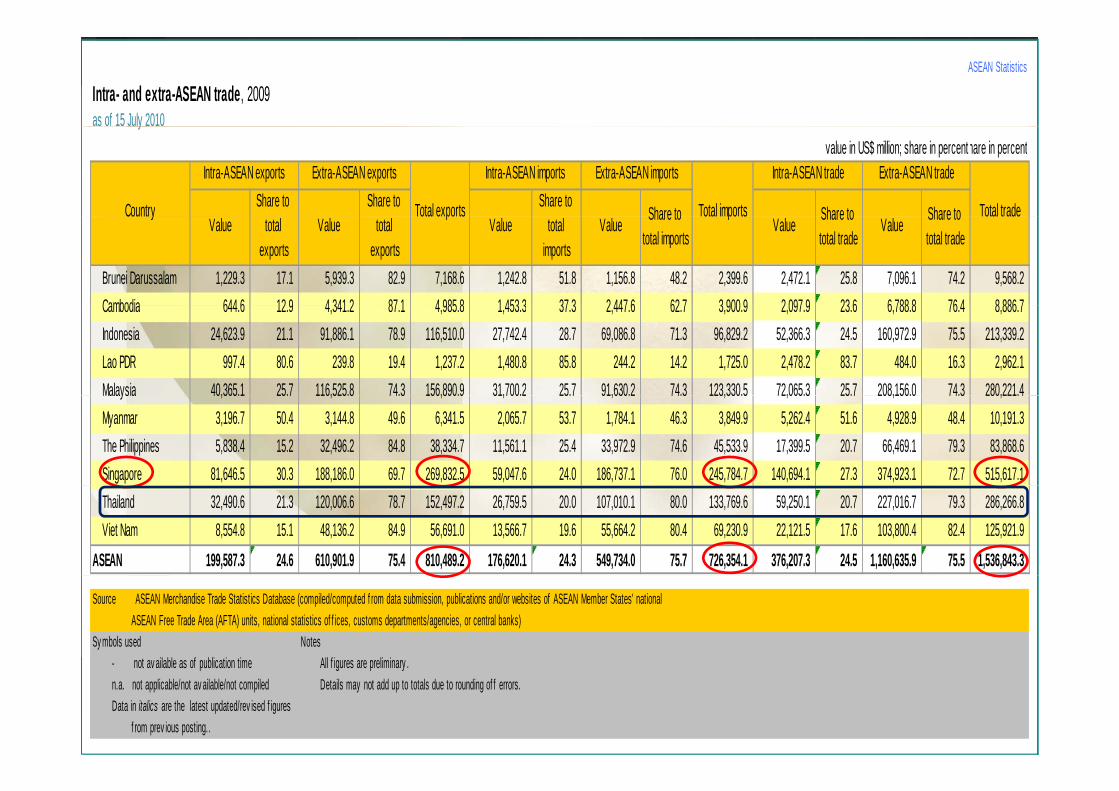
Intra- and extra-ASEAN trade, 2009as of 15 July 2010y
value in US$ million; share in percenthare in percent
Share to Share to Share to Share to Share to Share to Total tradeTotal importsTotal exports
Intra-ASEAN trade Extra-ASEAN trade
Country
Extra-ASEAN exports Intra-ASEAN imports Extra-ASEAN importsIntra-ASEAN exports
Value total exports
Value total exports
Value total imports
Value Share to total imports
Value Share to total trade
Value Share to total trade
Brunei Darussalam 1,229.3 17.1 5,939.3 82.9 7,168.6 1,242.8 51.8 1,156.8 48.2 2,399.6 2,472.1 25.8 7,096.1 74.2 9,568.2 Cambodia 644 6 12 9 4 341 2 87 1 4 985 8 1 453 3 37 3 2 447 6 62 7 3 900 9 2 097 9 23 6 6 788 8 76 4 8 886 7
Total tradeTotal importsTotal exportsCountry
Cambodia 644.6 12.9 4,341.2 87.1 4,985.8 1,453.3 37.3 2,447.6 62.7 3,900.9 2,097.9 23.6 6,788.8 76.4 8,886.7 Indonesia 24,623.9 21.1 91,886.1 78.9 116,510.0 27,742.4 28.7 69,086.8 71.3 96,829.2 52,366.3 24.5 160,972.9 75.5 213,339.2 Lao PDR 997.4 80.6 239.8 19.4 1,237.2 1,480.8 85.8 244.2 14.2 1,725.0 2,478.2 83.7 484.0 16.3 2,962.1 Malaysia 40,365.1 25.7 116,525.8 74.3 156,890.9 31,700.2 25.7 91,630.2 74.3 123,330.5 72,065.3 25.7 208,156.0 74.3 280,221.4Malaysia 40,365.1 25.7 116,525.8 74.3 156,890.9 31,700.2 25.7 91,630.2 74.3 123,330.5 72,065.3 25.7 208,156.0 74.3 280,221.4 Myanmar 3,196.7 50.4 3,144.8 49.6 6,341.5 2,065.7 53.7 1,784.1 46.3 3,849.9 5,262.4 51.6 4,928.9 48.4 10,191.3 The Philippines 5,838.4 15.2 32,496.2 84.8 38,334.7 11,561.1 25.4 33,972.9 74.6 45,533.9 17,399.5 20.7 66,469.1 79.3 83,868.6 Singapore 81,646.5 30.3 188,186.0 69.7 269,832.5 59,047.6 24.0 186,737.1 76.0 245,784.7 140,694.1 27.3 374,923.1 72.7 515,617.1 Thailand 32,490.6 21.3 120,006.6 78.7 152,497.2 26,759.5 20.0 107,010.1 80.0 133,769.6 59,250.1 20.7 227,016.7 79.3 286,266.8 Viet Nam 8,554.8 15.1 48,136.2 84.9 56,691.0 13,566.7 19.6 55,664.2 80.4 69,230.9 22,121.5 17.6 103,800.4 82.4 125,921.9
ASEAN 199,587.3 24.6 610,901.9 75.4 810,489.2 176,620.1 24.3 549,734.0 75.7 726,354.1 376,207.3 24.5 1,160,635.9 75.5 1,536,843.3
Source ASEAN Merchandise Trade Statistics Database (compiled/computed f rom data submission, publications and/or websites of ASEAN Member States' national ASEAN Free Trade Area (AFTA) units, national statistics of f ices, customs departments/agencies, or central banks)
Sy mbols used Notes- not av ailable as of publication time All f igures are preliminary not av ailable as of publication time All f igures are preliminary .n.a. not applicable/not av ailable/not compiled Details may not add up to totals due to rounding of f errors.Data in italics are the latest updated/rev ised f igures
f rom prev ious posting..
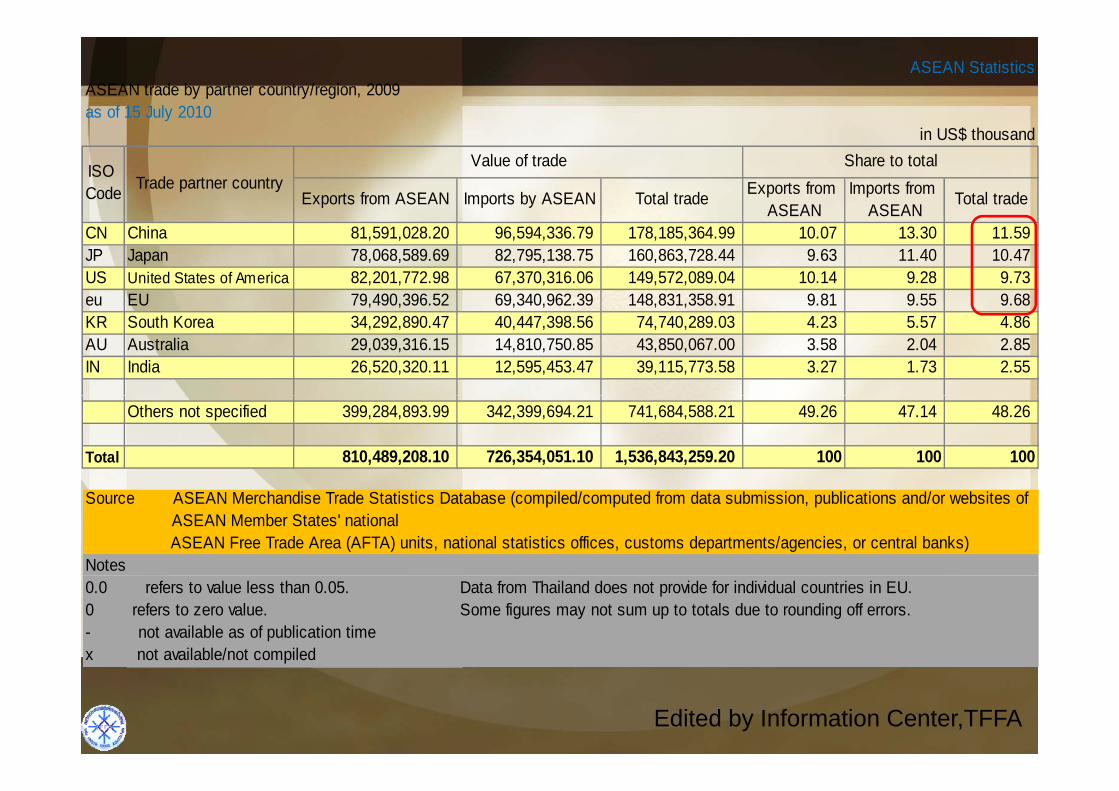
ASEAN trade by partner country/region, 2009as of 15 July 2010
ASEAN Statistics
Exports from ASEAN Imports by ASEAN Total trade Exports from ASEAN
Imports from ASEAN
Total tradeISO Code Trade partner country
Value of trade Share to totalin US$ thousand
ASEAN ASEANCN China 81,591,028.20 96,594,336.79 178,185,364.99 10.07 13.30 11.59 JP Japan 78,068,589.69 82,795,138.75 160,863,728.44 9.63 11.40 10.47 US United States of America 82,201,772.98 67,370,316.06 149,572,089.04 10.14 9.28 9.73 eu EU 79,490,396.52 69,340,962.39 148,831,358.91 9.81 9.55 9.68 , , , , , ,KR South Korea 34,292,890.47 40,447,398.56 74,740,289.03 4.23 5.57 4.86 AU Australia 29,039,316.15 14,810,750.85 43,850,067.00 3.58 2.04 2.85 IN India 26,520,320.11 12,595,453.47 39,115,773.58 3.27 1.73 2.55
Others not specified 399,284,893.99 342,399,694.21 741,684,588.21 49.26 47.14 48.26
Total 810,489,208.10 726,354,051.10 1,536,843,259.20 100 100 100
ASEAN Free Trade Area (AFTA) units, national statistics offices, customs departments/agencies, or central banks)Notes
Source ASEAN Merchandise Trade Statistics Database (compiled/computed from data submission, publications and/or websites of ASEAN Member States' national
0.0 refers to value less than 0.05. Data from Thailand does not provide for individual countries in EU.0 refers to zero value. Some figures may not sum up to totals due to rounding off errors.- not available as of publication timex not available/not compiled
Edited by Information Center,TFFA
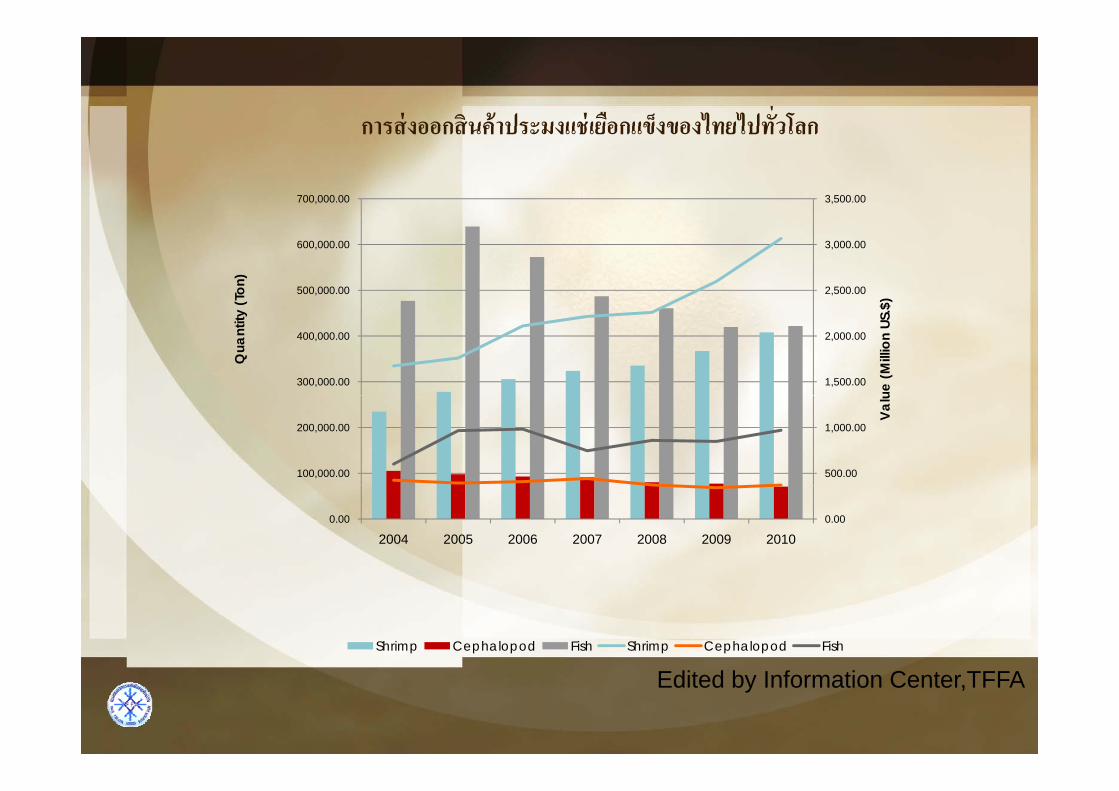
การสงออกสนคาประมงแชเยอกแขงของไทยไปทวโลกการสงออกสนคาประมงแชเยอกแขงของไทยไปทวโลก
3,500.00700,000.00
2,500.00
3,000.00
500,000.00
600,000.00
$)(Ton
)
1,500.00
2,000.00
300,000.00
400,000.00
ue (M
illio
n US
.$
Qua
ntity
500.00
1,000.00
100,000.00
200,000.00
Valu
0.000.00
2004 2005 2006 2007 2008 2009 2010
Shrimp Cephalopod Fish Shrimp Cephalopod Fish
Edited by Information Center,TFFA

แนวโนมการสงออกสนคาประมงแชเยอกแขงของไทยไปทวโลก
TOTAL ประมาณการ TOTALGrowth Rate
Jan - Dec, 2010 Jan - Dec, 2011
แนวโนมการสงออกสนคาประมงแชเยอกแขงของไทยไปทวโลก
Product, ,
Q V V Q V V Q V V
(Tons) ( M/B ) ( M/US.$ ) (Tons) ( M/B ) ( M/US.$ ) (Tons) ( M/B ) ( M/US.$ )
Shrimp 407,978.13 96,644.24 3,065.67
367,180.32
99,200.00
3,200.00 -10.00 2.64 4.38
Cephalopod
70,798.12 11,733.68 371.10
73,516.00 11,740.94
378.74 3.84 0.06 2.06
Fish
421 964 08
30 602 25 970 12 400 000 00
28 023 69
903 99 -5 21 -8 43 -6 82Fish 421,964.08 30,602.25 970.12 400,000.00 28,023.69 903.99 -5.21 -8.43 -6.82
ALL TOTAL 900,740.33 138,980.17 4,406.89 840,696.32 138,964.63 4,482.73 -6.67 -0.01 1.72
Exchange Rate 31.54bath/USD in 2010 Edited by Information Center,TFFA
31bath/USD in 2011 Update : 28 April 2011

EU10%Asean
6%
other14%
มลคาการคาสนคาอาหารทะเล
ระหวางไทยและอาเซยน USA24%
Asia29%
6%ระหวางไทยและอาเซยน
Japan17%
หมายเหต : เอเซย ไมรวมอาเซยน
Source : Information and Communication Technology Center With Cooperation of The Customs Department
Edit by Information Center Thai Frozen Foods Association

Export Fresh, Chilled, Frozen and Prepared, Preserved Shrimp of Thailand
0306 & 1605 : กงสดแชเยนแชแขง & กงแปรรป Quantity : TonValue : Million Baht
Q V( M/B )
Q V( M/B )
Q V( M/B )
Q V( M/B )
Asean 10,215.86 1,447.03 9,231.25 1,482.77 1,382.41 282.57 -58.13 -43.68Brunei 1.65 0.47 0.00 0.00 0.00 0.00 0.00 0.00
Jan - Dec 2009Jan - Apr 2011COUNTRY
Jan - Dec 2010 Jan - Apr 2011 Growth Rate %
Brunei 1.65 0.47 0.00 0.00 0.00 0.00 0.00 0.00Singapore 2,142.53 360.42 1,903.81 321.22 534.79 104.34 484.34 372.55Indenesia 0.25 0.11 0.32 1.57 0.17 1.14 0.00 0.00Malay sia 2,244.06 197.73 483.10 89.48 36.25 12.94 -78.33 -59.73
Philippiens 161.55 34.44 62.26 13.10 0.00 0.00 -100.00 -100.00Kampuchea 72.29 1.52 313.87 6.40 14.02 0.28 -92.17 -92.22
Laos 10.50 0.83 6.95 0.59 2.10 0.20 -2.33 5.26My anmar 227.47 14.43 717.08 27.41 82.87 5.51 -61.68 -21.51Vietnam 5,355.56 837.08 5,743.86 1,023.00 712.21 158.16 -72.42 -62.66Others 365,285.13 86,837.17 398,746.88 95,161.47 99,467.06 26,401.40 -6.10 8.27Total 375,500.99 88,284.20 407,978.13 96,644.24 100,849.47 26,683.97 -7.67 7.22
Import Fresh Chilled Frozen Shrimp of Thailand
Q V( M/B )
Q V( M/B )
Q V( M/B )
Q V( M/B )
Jan - Apr 2011COUNTRYJan - Dec 2009 Jan - Dec 2010 Jan - Apr 2011 Growth Rate %
Import Fresh, Chilled, Frozen Shrimp of Thailand0306 : กงสดแชเยนแชเขง
( M/B ) ( M/B ) ( M/B ) ( M/B )Asean 4,808.11 241.80 5,063.62 169.37 2,962.93 61.86 95.27 10.64
Brunei 0.00 0.00 0.01 0.01 0.00 0.00 0.00 0.00Singapore 0.94 0.59 0.67 0.47 0.19 0.15 -5.00 0.00Indenesia 109.73 25.78 76.93 6.11 0.03 0.01 -99.90 -99.79Malay sia 3,966.25 97.04 4,378.51 61.87 2,718.08 22.44 106.71 18.92y , , ,
Philippiens 1.00 0.46 0.03 0.02 0.06 0.05 0.00 0.00Kampuchea 171.30 2.06 22.60 0.27 0.02 0.00 -99.84 -100.00
Laos 0.70 0.32 2.17 0.90 2.34 0.97 654.84 592.86My anmar 344.97 68.05 343.61 56.97 170.03 28.36 50.10 49.42Vietnam 213.22 47.50 239.09 42.75 72.18 9.88 53.15 -23.23
Edit by Information Center Thai Frozen Foods Association
Source : Information and Communication Technology Center With Cooperation of The Customs Department
Others 6,530.59 1,240.81 6,844.44 1,092.34 1,577.76 292.87 -30.34 -21.99Total 11,338.70 1,482.61 11,908.06 1,261.71 4,540.69 354.73 20.05 -17.76

Export Fresh, Chilled, Frozen and Prepared, Preserved Cephalopod of Thailand
0307 & 16059090004 : ปลาหมกสดแชเยนแชแขง & ปลาหมกแปรรป Quantity : TonValue : Million Baht
Growth Rate %
QV
( M/B ) QV
( M/B ) QV
( M/B ) QV
( M/B )Asean 3,501.26 231.65 5,655.77 351.30 763.17 54.13 -69.60 -69.90Brunei 14.90 4.80 10.06 4.68 1.03 0.69 0.00 0.00
Jan - Apr 2011COUNTRYJan - Dec 2009 Jan - Dec 2010 Jan - Apr 2011 Growth Rate %
Singapore 166.60 12.49 108.77 11.39 15.32 1.84 -18.34 -45.40Indenesia 59.21 10.86 18.12 4.08 4.87 2.48 0.00 0.00Malay sia 725.50 63.16 49.02 1.46 0.00 0.00 -100.00 -100.00
Philippiens 1.10 0.42 0.56 0.21 0.62 0.14 0.00 0.00Kampuchea 0.00 0.00 0.00 0.00 0.00 0.00 -100.00 -100.00
L 5 40 0 32 6 95 0 42 2 10 0 14 2 33 7 69Lao 5.40 0.32 6.95 0.42 2.10 0.14 -2.33 7.69My anmar 0.02 0.01 0.00 0.00 0.00 0.00 0.00 0.00Vietnam 2,528.53 139.59 5,462.29 329.06 739.23 48.84 -70.31 -72.28Others 73,955.75 11,462.97 65,142.35 11,382.38 20,585.32 4,111.58 -6.50 8.45Total 77,457.01 11,694.62 70,798.12 11,733.68 21,348.49 4,165.71 -12.96 4.90
Q V Q V Q V Q VJan - Apr 2011COUNTRY
Jan - Dec 2009 Jan - Dec 2010 Jan - Apr 2011 Growth Rate %
0307 : ปลาหมกสดแชเยนแชแขง
Import Fresh, Chilled, Frozen Cephalopod of Thailand
Q V( M/B )
Q V( M/B )
Q V( M/B )
Q V( M/B )
Asean 17,694.64 824.17 17,752.66 706.49 4,343.90 186.32 -1.61 -8.81Brunei 0.00 0.00 0.00 0.00 0.00 0.00 0.00 0.00
Singapore 6.94 0.19 5.01 0.14 0.00 0.00 0.00 0.00Indenesia 2,350.63 90.79 3,753.65 167.12 1,276.84 66.21 19.40 14.49M l i 6 547 58 454 89 3 900 12 268 00 1 041 10 66 25 16 07 24 14Malay sia 6,547.58 454.89 3,900.12 268.00 1,041.10 66.25 -16.07 -24.14
Philippiens 206.52 36.45 330.14 38.28 31.97 5.50 -54.19 -48.60Kampuchea 0.00 0.00 0.00 0.00 0.00 0.00 0.00 0.00
Laos 0.00 0.00 0.00 0.00 0.00 0.00 0.00 0.00My anmar 8,582.15 241.82 9,690.82 222.19 1,963.66 44.58 -3.53 -8.01Vietnam 0.82 0.03 72.92 10.76 30.33 3.78 0.00 0.00
Edit by Information Center Thai Frozen Foods Association
Source : Information and Communication Technology Center With Cooperation of The Customs Department
Vietnam 0.82 0.03 72.92 10.76 30.33 3.78 0.00 0.00Others 35,716.81 2,147.22 45,095.63 3,048.90 15,441.66 997.45 18.13 12.76Total 53,411.45 2,971.39 62,848.29 3,755.39 19,785.56 1,183.77 13.15 8.71

Export Fresh, Chilled, Frozen and Prepared, Preserved Total Fish of Thailand
0302 / 0303 & 0304 & 1604 : ปลาสดแชเยนแชแขง & ปลาทนาสดแชเยนแชแขง & เนอปลาสดแชเยนแชแขง & ปลาแปรรป & ปลาทนาแปรรป
Q V( M/B )
Q V( M/B )
Q V( M/B )
Q V( M/B )
A 115 003 55 2 124 04 116 188 85 2 375 75 39 399 53 903 64 0 88 24 19
Jan - Apr 2011COUNTRYJan - Dec 2009 Jan - Dec 2010 Jan - Apr 2011 Growth Rate % Quantity : Ton
Value : Million Baht
Asean 115,003.55 2,124.04 116,188.85 2,375.75 39,399.53 903.64 -0.88 24.19Brunei 2,210.96 229.70 2,025.60 212.36 661.03 71.37 2,033.04 2,439.86
Singapore 13,425.98 423.08 13,496.85 404.25 3,996.54 122.84 -7.21 -31.20Indenesia 3,446.59 159.68 4,500.64 197.48 1,858.21 77.66 -24.09 74.36Malay sia 84,930.71 890.44 79,729.77 852.37 25,806.22 276.06 -9.08 -13.89
Philippiens 793 56 66 64 1 201 02 100 27 1 431 07 84 04 706 51 754 93Philippiens 793.56 66.64 1,201.02 100.27 1,431.07 84.04 706.51 754.93Kampuchea 264.46 14.95 213.41 11.94 65.52 4.55 -75.76 -83.73
Lao 1,676.31 62.40 1,957.98 68.03 936.40 35.39 117.56 405.57My anmar 162.72 14.81 279.43 23.56 116.06 11.36 -55.59 -41.14Vietnam 7,998.62 252.46 12,857.71 512.59 4,540.79 222.00 31.98 89.63Others 294 805 70 26 205 37 305 775 21 28 226 59 94 753 16 9 039 17 2 61 7 10Others 294,805.70 26,205.37 305,775.21 28,226.59 94,753.16 9,039.17 2.61 7.10Total 409,809.25 28,329.41 421,964.06 30,602.34 134,152.69 9,942.81 1.56 8.45
Growth Rate %0302 / 0303 & 0304 : ปลาสดแชเยนแชเขง & ปลาทนาสดแชเยนแชแขง & เนอปลาสดแชเยนแชแขง
Import Fresh, Chilled, Frozen Total Fish of Thailand
Q V( M/B )
Q V( M/B )
Q V( M/B )
Q V( M/B )
Asean 387,382.16 9,457.98 364,256.70 8,272.60 118,597.60 2,933.20 -0.85 10.83Brunei 0.00 0.00 0.00 0.00 0.00 0.00 0.00 0.00
Jan - Apr 2011Growth Rate %
COUNTRYJan - Dec 2009 Jan - Dec 2010 Jan - Apr 2011
Source : Information and Communication Technology Center With Cooperation of The Customs Department
Singapore 1,336.25 165.14 1,684.87 189.79 361.71 43.29 -55.15 -61.80Indenesia 183,672.72 4,668.85 200,965.08 4,247.58 57,840.79 1,130.88 -21.76 -27.35Malaysia 9,885.07 336.20 8,706.33 430.87 3,592.55 84.83 40.95 -19.68
Philippiens 25,053.87 1,186.02 18,877.51 889.42 13,920.71 624.13 304.12 282.50Kampuchea 1,435.75 16.59 55.30 0.91 159.93 3.00 555.45 757.14
Laos 0 00 0 00 0 00 0 00 0 00 0 00 0 00 0 00
Edit by Information Center Thai Frozen Foods Association
Laos 0.00 0.00 0.00 0.00 0.00 0.00 0.00 0.00Myanmar 153,444.54 2,036.53 121,894.72 1,723.11 36,791.93 639.00 2.81 31.87Vietnam 12,553.96 1,048.65 12,072.89 790.92 5,929.98 408.07 92.53 83.15Others 1,028,220.81 47,254.17 1,052,977.09 48,776.55 401,269.14 19,303.00 18.08 32.52Total 1,415,602.97 56,712.15 1,417,233.79 57,049.15 519,866.74 22,236.20 13.15 29.19

การใชประโยชนจากเปนแหลงวตถดบใหม
เปนแหลงทดแทนวตถดบทขาดแคลน
การเปดเสรของ
ป
- ภาษนาเขา 0 % เชน ปลาสด
- ภาษลดลงเหลอ 5% ในกลมสนคาทเปน อตสาหกรรมประมง ภาษลดลงเหลอ 5% ในกลมสนคาทเปน
Sensitive List เชน ปลาหมก ปลาแล
- ภาษลดลงเหลอ 20% จาก 40% เชน หอยภาษลดลงเหลอ 20% จาก 40% เชน หอย
สรางความรวมมอในการทาประมงรวมกน
แตกมอปสรรคในดานเทคนค เชน กตกาและ แตกมอปสรรคในดานเทคนค เชน กตกาและ
เงอนไขการทาประมงรวม

• ใ
ป ป ใ
• สนคาอยนอกรายการลดภาษหรออยในรายการ
สนคาทมความออนไหวจะลดสนคาใหเปน
ใ ป 2015 ปญหาและอปสรรคใน
การใชประโยชนจาก
ศนยทงหมดในป 2015 เชน เวยดนาม ลาว
กมพชา พมา
AEC/FTA - ในปจจบนประเทศดงกลาว คงภาษรอยละ
5 ซงเปนรายการสนคาในกลมปลาทนา ปลาแล
เนอปลาบด กง ปลาหมก ทประเทศในอาเซยน
นามาแลกเปลยนในกรอบ FTA • ไมใชสทธประโยชนจาก FTA เนองจากเปน
การคา ผานชายแดน

ASEAN Seafood กรอบความรวมมอ
• ความรวมมอในดานการพฒนาสนคาและเทคโนโลย Federationกอตงเมอวนท 13 พฤษภาคม
2552 ป 7
(Products and Technology) โดย เวยดนาม
• ความรวมมอในดานมาตรฐานอาหารและคณภาพ/ความ2552 ประกอบดวยสมาชก 7 ประเทศ โดยมวตถประสงคเพอ
ปลอดภยของอาหารสผบรโภค (Food Standard, Quality and Traceability) โดย ไทย
สรางอตสาหกรรมอาหารทะเลของ
กลมอาเซยนใหมความแขงแกรง
ไ ป ใ
• ความรวมมอในดานการสรางความมนคงในปจจยการผลต
(Products Inputs Securing) โดย อนโดฯ พมา
ฟลปปนส ซงถอไดวา อาเซยนเปนผนาในการ
ผลตอาหารปอนสครวโลก ทงนก
ไป
ฟลปปนส
• ความรวมมอในดานการตลาด (Marketing) โดย ไทย
• ความรวมมอในดานโลจสตกส (Logistics เพอนาไปสการสรางความรวมมอ
การดาเนนการคาอยางเสรและมงส
ป ป
• ความรวมมอในดานโลจสตกส (Logistics Cooperation) โดย มาเลเซย
เปาหมายแหงการรวมกนเปน
ASEAN Charter

- มการประชมรวมกนปละ 2 ครง เพอสรางความ
แขงแกรงของอตสาหกรรมฯ
- การเขารวมงานแฟรในประเทศสมาชก เพอใหเปนท
รจกในประเทศตางๆ
Activities รจกในประเทศตางๆ
- จดทา weekly News เพอแลกเปลยนขอมลขาวสารขาวสาร
- เขารวมประชมในเวทอาเซยน เชน Asean-SEAFDEC ConferenceSEAFDEC Conference

แนวทางการตดสนใจแนวทางการตดสนใจ
การลงทนในกลมประเทศอาเซยน
A Framework for ASEAN Investment Decisions Making

THAILAND: INTERNATIONALIZATIONTHAILAND: INTERNATIONALIZATION
IN‐OUT OUT‐OUT
IN‐IN OUT‐IN

A Framework for ASEAN Investment Decisions Making
Competitive STRATEGY GLOBAL COMPETITION
INTERNAL CONSTRAINTSCapital, growth strategy,existing network
PHASE ISupply Chain
Strategy
TARIFFS AND TAXINCENTIVES
PHASE IIPRODUCTION TECHNOLOGIESCost, Scale/Scope impact, supportreq ired fle ibilit
REGIONAL DEMANDSize, growth, homogeneity,
Regional FacilityConfiguration
required, flexibility
COMPETITIVEENVIRONMENT
local specifications
POLITICAL, EXCHANGERATE AND DEMAND RISK
PHASE IIIDesirable Sites AVAILABLE
INFRASTRUCTUREPRODUCTION METHODSSkill needs, response time
PHASE IVLocation Choices
FACTOR COSTSLabor, materials, site specific
LOGISTICS COSTSTransport, inventory, Location Choicescoordination

กรอบการตดสนใจในการตดสนใจลงทนในกลมประเทศอาเซยน (A Framework for
ASEAN Investment Decisions Making ประกอบดวย ASEAN Investment Decisions Making ประกอบดวย
ขนท 1: กลยทธดาน Supply Chain ประกอบดวย
1 1 กลยทธการแขงขน (Competition Strategy) 1.1 กลยทธการแขงขน (Competition Strategy)
1.2 การแขงขนในเวทโลก (Global Competition)
1 3 ขอจากดภายใน (Internal Constraints)1.3ขอจากดภายใน (Internal Constraints)
1.4 เงนทน กลยทธของการเตบโต เครอขายทเกดขน
การตดสนใจดงกลาว อาจนาโครงสรางดานการตลาดเขามาพจารณาดวย เชน เปาหมาย
ตลาด กลมลกคา ปจจยดานราคาในตลาด เปนตน ตลาด กลมลกคา ปจจยดานราคาในตลาด เปนตน
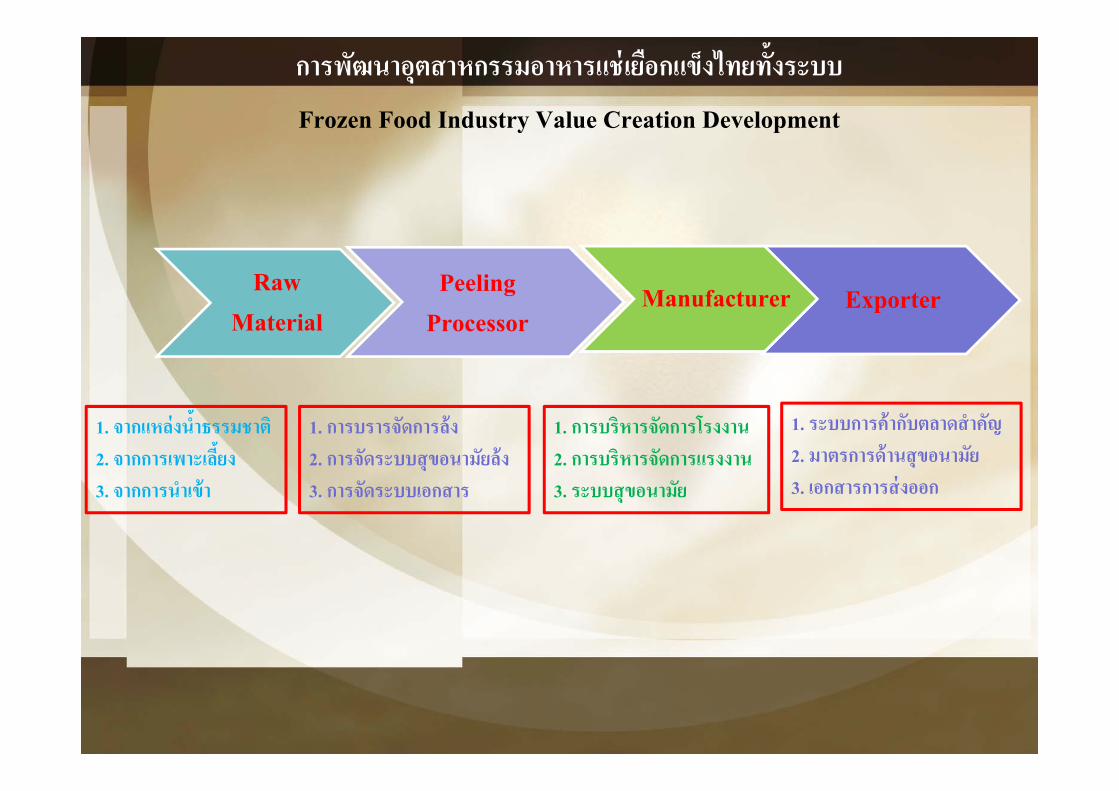
การพฒนาอตสาหกรรมอาหารแชเยอกแขงไทยทงระบบ
Frozen Food Industry Value Creation DevelopmentFrozen Food Industry Value Creation Development
ExporterManufacturerPeeling Raw ExporterManufacturer
ProcessorMaterial
1. จากแหลงนาธรรมชาต
2. จากการเพาะเลยง
3
1. การบรารจดการลง
2. การจดระบบสขอนามยลง
3
1. การบรหารจดการโรงงาน
2. การบรหารจดการแรงงาน
3
1. ระบบการคากบตลาดสาคญ
2. มาตรการดานสขอนามย
3 เอกสารการสงออก3. จากการนาเขา 3. การจดระบบเอกสาร 3. ระบบสขอนามย 3. เอกสารการสงออก

United States Import StatisticsCommodity: 0304, Fish Fillets And Other Fish Meat, W/N Minced, Fresh, Chilled Or Frozen
Calendar Year: 2006 ‐ 2010, Year To Date: 04/2010 & 04/2011United States Dollars
Country Calendar Year Year To Date
2006 2007 2008 2009 2010 04/2010 04/2011 %Change
World 2988582988 3340142500 3447685474 3379462419 3763234114 1163655266 1355615191 16.5
Indonesia 105599396 136567012 162448998 170544736 203760130 60575206 58595328 ‐3.27
Vietnam 81314952 93862647 114103168 147595531 180373379 44589699 86024546 92.92
Phili i 36610823 45225342 34617341 38998966 48747551 10418304 14897896 43Philippines 36610823 45225342 34617341 38998966 48747551 10418304 14897896 43
Thailand 36996069 43555782 44958662 49185487 42134406 13594933 12976362 ‐4.55
Singapore 21074393 19903684 18749432 11455661 16217270 4487671 5015974 11.77
Malaysia 11174790 5283943 6446630 6395182 4422517 1787325 2369955 32.6
Cambodia 5398898 4581148 3268737 6946005 2837805 2153273 230355 ‐89.3
Laos 0 3862 0 0 50441 0 0 n/a

Japan Import StatisticsCommodity: 0304, Fish Fillets And Other Fish Meat, W/N Minced, Fresh, Chilled Or Frozen
Calendar Year: 2006 ‐ 2010, Year To Date: 04/2010 & 04/2011Calendar Year: 2006 2010, Year To Date: 04/2010 & 04/2011
United States Dollars
Country Calendar Year Year To Date
2006 2007 2008 2009 2010 04/2010 04/2011 %Change
World 2114325917 2079241155 2643703496 2216956056 2438672997 683953991 978076513 43
Thailand 167775231 160409615 225420481 149680533 190134253 57951958 61726428 6.51
Vi t 44114575 49653134 92749420 44360290 67568665 18229229 17822636 2 23Vietnam 44114575 49653134 92749420 44360290 67568665 18229229 17822636 ‐2.23
Indonesia 38171930 41478987 58628151 47013621 67418519 17703445 20686364 16.85
Myanmar 5121028 5531516 7334350 5700159 6358253 2143673 2089848 ‐2.51
Singapore 326343 474742 331831 254429 0 0 0 n/a
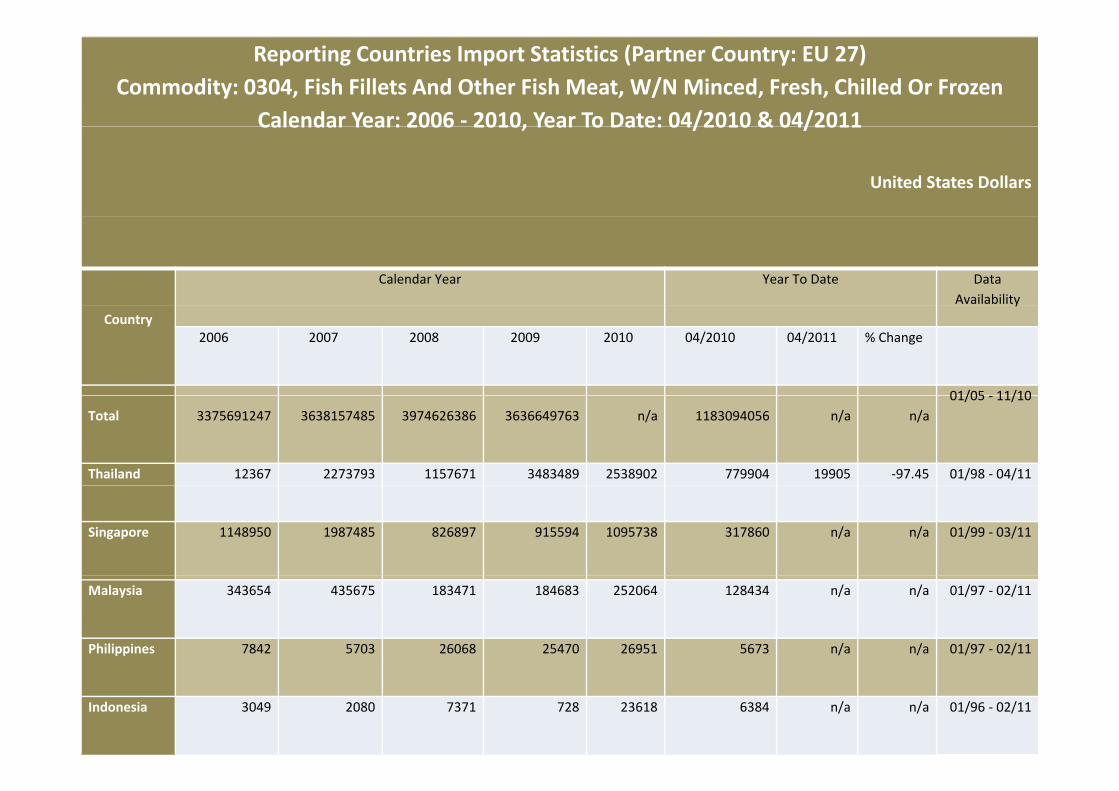
Reporting Countries Import Statistics (Partner Country: EU 27)Commodity: 0304, Fish Fillets And Other Fish Meat, W/N Minced, Fresh, Chilled Or Frozen
Calendar Year: 2006 ‐ 2010, Year To Date: 04/2010 & 04/2011Calendar Year: 2006 2010, Year To Date: 04/2010 & 04/2011
United States Dollars
Calendar Year Year To Date Data Availability
Countryy
2006 2007 2008 2009 2010 04/2010 04/2011 % Change
01/05 11/10Total 3375691247 3638157485 3974626386 3636649763 n/a 1183094056 n/a n/a
01/05 ‐ 11/10
Thailand 12367 2273793 1157671 3483489 2538902 779904 19905 ‐97.45 01/98 ‐ 04/11
Singapore 1148950 1987485 826897 915594 1095738 317860 n/a n/a 01/99 ‐ 03/11
Malaysia 343654 435675 183471 184683 252064 128434 n/a n/a 01/97 ‐ 02/11
Philippines 7842 5703 26068 25470 26951 5673 n/a n/a 01/97 ‐ 02/11
Indonesia 3049 2080 7371 728 23618 6384 n/a n/a 01/96 ‐ 02/11

ขนท 2: รปลกษณสงอานวยความสะดวกในพนท
2.1 กฎระเบยบดานภาษและ Tax Incentive
2.2 ความตองการของผบรโภคในทองถน (Regional Demand) เชน ขนาดของ
demand ในทองถน เชน จานวนประชากร อตราการขยายตวของ demand
องคประกอบทเหมอนกนหรอแตกตางกนของ demand ในแตละธรกจ และ
คณลกษณะเฉพาะของความตองการของผบรโภคภายในประเทศ
2.3 การเมองในทองถน (Political)
2.4 สถานณดานการเงนและการคลง เชน ความเสถยรภาพทางเศรษฐกจ
(Economic Stability) อตราแลกเปลยน (Exchange rate)
2.5 ความเสยงตอการเปลยนแปลงของความตองการภายในทองถน (Demand
risk)
2.6 เทคโนโลยการผลต (Production Technologies) เชน ตนทน (Cost) ผลกระ
ทบขนาดและขอบเขตของเทคโนโลยการผลต (Scale/Scope Impact)
มาตรการการการสนบสนน (Support Required) และความยดหยน (Flexibility)
2.7 สภาวะการแขงขน (Competitive Environment)

ขนท 3: การพจารณาความเหมาะสมของพนทตามความตองการของธรกจ (Desirable
Sites)
3.1 โครงสรางพนฐานทมความพรอม (Available Infrastructure)
3.2 กระบวนการผลตมความเหมาะสมตอธรกจ (Production Methods) เชน
ความเชยวชาญในการผลต เชน ตองใชแรงงานทมความชานาญการ (Skilled
needs) หรอ เวลาการผลตและการใหบรการตามความตองการของตลาด
(Response time)
ขนท 4: เกณฑพจารณาเลอกสถานทตง
4.1 Cost Factor ไดแก คาแรงงาน ราคาปจจยการผลต ทตงอยในยานทเหมาะสม
หรอไม
4.2 Logistics cost เชน การขนสง การเกบสนคาคงคลง การประสานงาน ผ
ใหบรการและทาเรอหรอสนามบน
4.3 เทคโนโลยการผลต (Production Technologies) เชน ตนทน (Cost) ผลกระทบ
ตอขนาดการลงทนและขอบเขตของเทคโนโลยการผลต (Scale/Scope Impact)
ความตองการการสนบสนนจากภาครฐ (State Support Required) และความ
ยดหยน (Flexibility)

Thai Frozen Foods AssociationThai Frozen Foods Association