Embed Size (px)
Citation preview
Aalborg Universitet
Power Flow Analysis for Low-Voltage AC and DC Microgrids Considering DroopControl and Virtual Impedance
Li, Chendan; Chaudhary, Sanjay Kumar; Savaghebi, Mehdi; Quintero, Juan Carlos Vasquez;Guerrero, Josep M.Published in:I E E E Transactions on Smart Grid
DOI (link to publication from Publisher):10.1109/TSG.2016.2537402
Publication date:2017
Document VersionAccepted author manuscript, peer reviewed version
Link to publication from Aalborg University
Citation for published version (APA):Li, C., Chaudhary, S. K., Savaghebi, M., Quintero, J. C. V., & Guerrero, J. M. (2017). Power Flow Analysis forLow-Voltage AC and DC Microgrids Considering Droop Control and Virtual Impedance. I E E E Transactions onSmart Grid, 8(6), 2754 - 2764 . https://doi.org/10.1109/TSG.2016.2537402
General rightsCopyright and moral rights for the publications made accessible in the public portal are retained by the authors and/or other copyright ownersand it is a condition of accessing publications that users recognise and abide by the legal requirements associated with these rights.
? Users may download and print one copy of any publication from the public portal for the purpose of private study or research. ? You may not further distribute the material or use it for any profit-making activity or commercial gain ? You may freely distribute the URL identifying the publication in the public portal ?
Take down policyIf you believe that this document breaches copyright please contact us at [email protected] providing details, and we will remove access tothe work immediately and investigate your claim.
www.microgrids.et.aau.dk
Abstract— In the Low-Voltage (LV) AC microgrids (MGs), with a relatively high R/X ratio, virtual impedance is usually adopted to improve the performance of droop control applied to Distributed Generators (DGs). At the same time, LV DC microgrid using virtual impedance as droop control is emerging without adequate power flow studies. In this paper, power flow analyses for both AC and DC microgrids are formulated and implemented. The mathematical models for both types of microgrids considering the concept of virtual impedance are used to be in conformity with the practical control of the distributed generators. As a result, calculation accuracy is improved for both AC and DC microgrid power flow analyses, comparing with previous methods without considering virtual impedance. Case studies are conducted to verify the proposed power flow analyses in terms of convergence and accuracy. Investigation of the impact to the system of internal control parameters adopted by distributed generators is also conducted by using proposed method.
Index Terms—AC/DC microgrids, Low-Voltage, droop control, virtual impedance, power flow
NOMENCLATURE
DG Distributed generation
PE Power Electronics f Output voltage frequency of DG units
0if Nominal frequency of DG unit i
PiK Proportional frequency droop parameter in DG unit i
(DC)/Gi GiP P Real power generation of dispatchable DG unit i
(DC)/Gi GiV V Output voltage of dispatchable DG unit i
0 0 (DC)/ VG i G iV Nominal voltage of DG unit i
QiK Proportional amplitude droop parameter of DG unit i
GiQ Reactive power of the dispatchable DG unit i
0iP Rated real power of load i
0iQ Rated reactive power of load i
i Exponent coefficient of real power
i Exponent coefficient of reactive power f Frequency deviation to nominal frequency
,pf iK Real power frequency dependency
C. Li, S. K. Chaudhary, M. Savaghebi, J. C. Vasquez and J. M. Guerrero are with the Department of Energy Technology, Aalborg University, 9220, Denmark. (e-mail: [email protected]; [email protected]; [email protected]; [email protected]; [email protected] ).
,qf iK Reactive power frequency dependency
(DC)/Di DiP P Real power load at bus i
DiQ Reactive power load at bus i
(DC)/i iP P Injected real power at bus i
iQ Injected reactive power at bus i i Phase angle at bus i ijG Conductance of branch ij
ijB Susceptance of branch ij
(DC)/i iV V Bus voltage of bus i
,droop iV Voltage of the virtual droop bus i
viZ Virtual impedance
(DC)/i iI I Injected current at bus i [ ]ijY Bus admittance matrix of the network
,Gi specP Specified generation real power at bus i
,Gi specQ Specified generation reactive power at bus i
gN Number of dispatchable DG buses pqN Number of PQ buses
_line ijR Line resistance for line ij _line ijL Line inductance for line ij _line ijZ Line impedance for line ij
Impedance angle of line 12 (DC)viR Virtual resistance in DC microgrid
(DC)gN Number of dispatchable DG buses in DC microgrid
(DC)pN Number of P buses in DC microgrid ( )xF y Mismatch function x of vector y
I. INTRODUCTION
microgrid should be able to integrate, control and manage the distributed energy resources, energy storage systems
and loads in both grid-connected and islanded modes [1] − [3]. As a basic steady state analysis tool for any electrical network, power flow analysis is essential to get the overall view of the system for the design and operation of microgrids [4]. It can be applied to microgrid network optimization, component capacity optimization in the planning stage of the microgrid. It can also be adopted in network reconfiguration, power control in real time during operation. By applying the power flow analysis in a specific system configuration, power system security analysis, and protection coordination can be
Power Flow Analysis for Low-Voltage AC and DC Microgrids Considering Droop Control and
Virtual Impedance Chendan Li, Student Member, IEEE, Sanjay K. Chaudhary, Member, IEEE, Mehdi Savaghebi, Senior
Member, IEEE, Juan C. Vasquez, Senior Member, IEEE, and Josep M. Guerrero, Fellow, IEEE
A
IEEE TRANSACTIONS ON SMART GRID
2
implemented. Moreover, it can be used in the initialization of the system dynamic analysis, and small signal analysis, etc. Power flow analysis can be embedded as a component in the energy management system of the microgrid.
Conventionally, power flow analysis is modelled by node voltage method [5], using different types of buses--PV, PQ and Vθ buses (or P and V buses in DC system) [6], [7]. However, with the features which are distinct from traditional power systems, conventional methods become no longer suitable for microgrid applications. The limitation of previous power flow formulation for AC microgrids mainly lies in the following items 1) The amount of the power supplied by each DG unit is usually not pre-specified, and thus these DG units cannot simply be modelled as PQ buses; 2) despite more flexible control of power electronic (PE) interfaces for DGs, the limited capacity of a single DG unit makes it impractical to be taken as the slack bus, especially in islanded mode, while in conventional methods at least one slack bus must be assigned to balance the real and reactive power losses; 3) In islanded mode, the frequency of the microgrid is no longer fixed but changes frequently within a range due to uncertainty of primary resources, load and intra-day market factors [8], and this cannot be shown in traditional methods. In addition, the emerging concept of DC microgrid requires more research on power flow analysis to take its special steady state characteristics into account [9].
The problem of tailoring conventional power flow programs for microgrid applications has been recently addressed in [10] − [12]. The study performed in [10] emphasizes modelling the AC system in the sequence-component frame to represent all the control purposes, but it still uses the traditional method in each component frame by assuming the existence of a slack bus. In [11], a two-step power flow analysis approach is proposed so as to represent electronically-coupled DG units, with the feature to calculate the internal variables of each DG unit. However, in most cases, the impact of different internal variables on the system is of more interest but cannot be evaluated by this approach. The method proposed in [12] represents correctly the actual distributed slack buses by modelling the DG units as droop buses. However, the traditional droop control with P-f and Q-V droop is derived from the approximation of power flow equations under the assumption that the output impedance of the converter is inductive. It might not be the case when the transmission line is not inductive, and in this situation traditional droop will not be valid due to the coupling of the active and reactive power [1] [13]. Although some variations of the droop method, such as resistive droop, are proposed to address the resistive output impedance, they cannot be generalized [13] [14]. To make P-f and Q-V droop control valid, virtual impedance loops should be added to local controllers of the converters to provide the desired output impedance and to increase the stability of the system in AC microgrids [15] − [17]. In addition, these studies do not consider the case of DC microgrids. In a DC microgrid, the load sharing mechanism is achieved by droop control through feeding back the output current via a virtual resistance to the voltage loop. Power flow analysis methods which do not consider virtual impedance compromise the accuracy of the power flow results.
In this paper, to solve the aforementioned problems, we take the concept of virtual impedance into consideration for both AC and DC microgrids power flow analyses. This way, the accuracy of the power flow analysis in both systems can be improved. Moreover, the impact of the control parameters of the DG units on the power flow of the microgrid can be analysed, and an overall view of the system state in steady state can be obtained for guiding the system design and operation. This method can be a facilitative tool for the development of microgrid systems, and is able to act as essential sub-function in the microgrid energy management system.
This paper is organized as follows. The background of the virtual impedance concept and mathematical model of power flow analysis for AC microgrids is presented in Section II. The case studies for AC microgrids are provided in Section III. Similar discussions for both problem formulation and case studies for DC microgrid power flow analysis are presented in Section IV and V, respectively. Finally, Section VI concludes the paper.
II. PROBLEM FORMULATION FOR AC MICROGRIDS
A. Virtual impedance in AC microgrids
Decentralized droop scheme is a widely adopted control strategy for sharing the real and reactive load autonomously without communication to other units or to a central controller. The well-known P/Q droop method P-f and Q-V droop integrated in the local control of DG units in an inductive network can be written as [1] − [3], [18] and [19]
0i Pi Gif f K P (1)
0| | | |Gi G i Qi GiV V K Q (2)
where f, f0i, KPi, PGi, VGi, VG0i, KQi, and QGi are output frequency, nominal frequency, frequency droop gain, active power, output voltage, nominal voltage, amplitude droop gain, and reactive power of the DG unit i, respectively.
The traditional droop control , as is interpreted as in (1) and (2), assumes that the line impedance is inductive enough to model the DG unit as an ideal voltage source whose voltage and frequency are determined by droop characteristics [1] − [3], [18] and [19]. It is because in this situation the P and Q are almost decoupled. The relationship of the power and the line impedance can be illustrated by using a two bus system with a DG unit in bus 1 and a slack bus in bus 2 as shown in Fig. 1.
Overlooking the power consumption on the line impedance, there are
Fig. 1. Equivalent circuit of a distributed generator and a slack bus.
1 1 1S P Q j
1 1V 2 2V
_12lineZ
3
2
1 2 2
_12 _12
cos( ) cosline line
VV VP
Z Z (1)
2
1 2 2
_12 _12
sin( ) cosline line
VV VQ
Z Z (2)
where P1 and Q1 is the active and reactive power flowing from bus1 to bus 2; Zline_12 the impedance of line 12, θ1 the bus angle in bus 1; and is the angle of the impedance of line 12.
Consider θ1 is very small and thus can omitted, only when the line impedance is mainly inductive ( ≈90°), can the active power and reactive power be well decoupled. In this case, P and Q have a linear relationship with bus angle and bus voltage amplitude, respectively. This can be written as [13]
1 2
_12
sinline
VVP
Z (3)
2
1 2 2
_12
cos
line
VV VQ
Z
(4)
This is the condition for the traditional droop to be valid. In practice, according to the typical R/X ratio in Table I, LV network is more resistive [18]. In this case, without using virtual impedance, large, bulky, expensive filter is often placed outside the converter to meet this requirement for traditional droop to be valid. To avoid this, virtual impedance is use to change the output impedance of the converter [15]-[17].
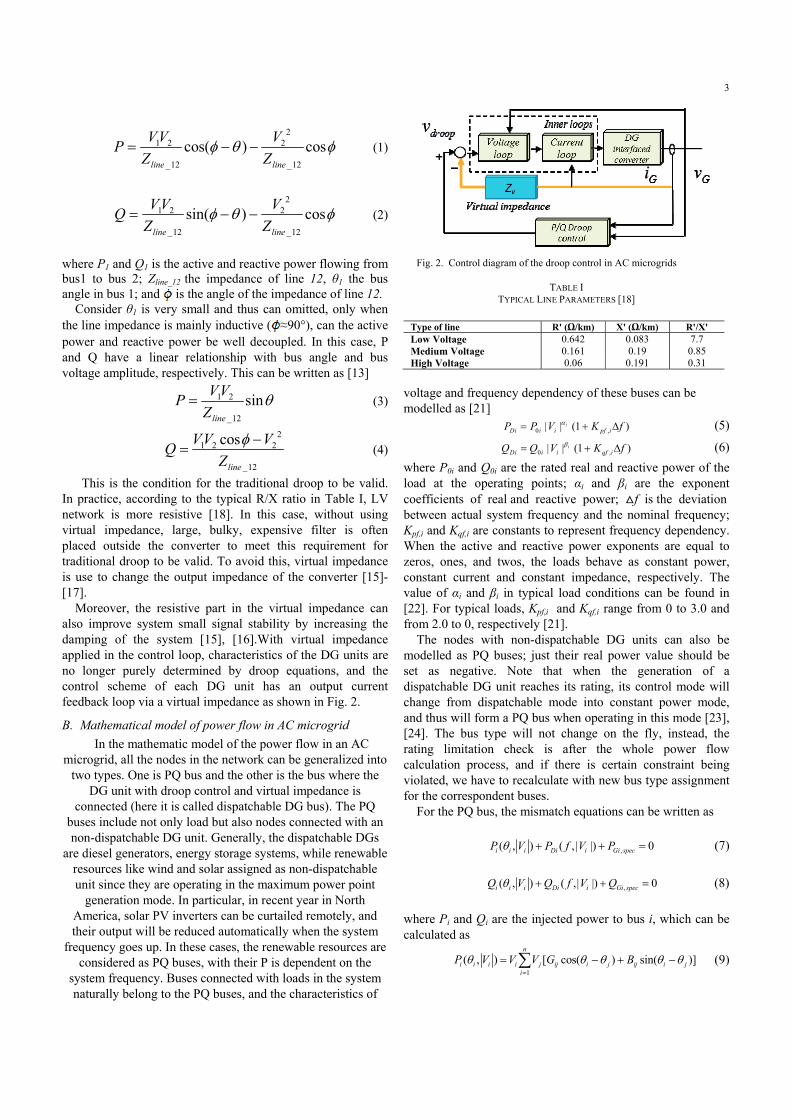
Moreover, the resistive part in the virtual impedance can also improve system small signal stability by increasing the damping of the system [15], [16].With virtual impedance applied in the control loop, characteristics of the DG units are no longer purely determined by droop equations, and the control scheme of each DG unit has an output current feedback loop via a virtual impedance as shown in Fig. 2.
B. Mathematical model of power flow in AC microgrid
In the mathematic model of the power flow in an AC microgrid, all the nodes in the network can be generalized into
two types. One is PQ bus and the other is the bus where the DG unit with droop control and virtual impedance is
connected (here it is called dispatchable DG bus). The PQ buses include not only load but also nodes connected with an non-dispatchable DG unit. Generally, the dispatchable DGs
are diesel generators, energy storage systems, while renewable resources like wind and solar assigned as non-dispatchable unit since they are operating in the maximum power point
generation mode. In particular, in recent year in North America, solar PV inverters can be curtailed remotely, and their output will be reduced automatically when the system
frequency goes up. In these cases, the renewable resources are considered as PQ buses, with their P is dependent on the
system frequency. Buses connected with loads in the system naturally belong to the PQ buses, and the characteristics of
Fig. 2. Control diagram of the droop control in AC microgrids
TABLE I
TYPICAL LINE PARAMETERS [18]
Type of line R' (Ω/km) X' (Ω/km) R'/X' Low Voltage 0.642 0.083 7.7 Medium Voltage 0.161 0.19 0.85 High Voltage 0.06 0.191 0.31
voltage and frequency dependency of these buses can be modelled as [21]
0 ,| | (1 )iDi i i pf iP P V K f (5)
0 ,| | (1 )iDi i i qf iQ Q V K f (6)
where P0i and Q0i are the rated real and reactive power of the load at the operating points; αi and βi are the exponent coefficients of real and reactive power; f is the deviation between actual system frequency and the nominal frequency; Kpf,i and Kqf,i are constants to represent frequency dependency. When the active and reactive power exponents are equal to zeros, ones, and twos, the loads behave as constant power, constant current and constant impedance, respectively. The value of αi and βi in typical load conditions can be found in [22]. For typical loads, Kpf,i and Kqf,i range from 0 to 3.0 and from 2.0 to 0, respectively [21].
The nodes with non-dispatchable DG units can also be modelled as PQ buses; just their real power value should be set as negative. Note that when the generation of a dispatchable DG unit reaches its rating, its control mode will change from dispatchable mode into constant power mode, and thus will form a PQ bus when operating in this mode [23], [24]. The bus type will not change on the fly, instead, the rating limitation check is after the whole power flow calculation process, and if there is certain constraint being violated, we have to recalculate with new bus type assignment for the correspondent buses.
For the PQ bus, the mismatch equations can be written as
,( , ) ( ,| |) 0i i i Di i Gi specP V P f V P (7)
,( , ) ( ,| |) 0i i i Di i Gi specQ V Q f V Q (8)
where Pi and Qi are the injected power to bus i, which can be calculated as
1
( , ) [ cos( ) sin( )]n
i i i i j ij i j ij i ji
P V V V G B
(9)
4
vi vi viZ R j L lineZ
,droop iV
iIiV
1iV
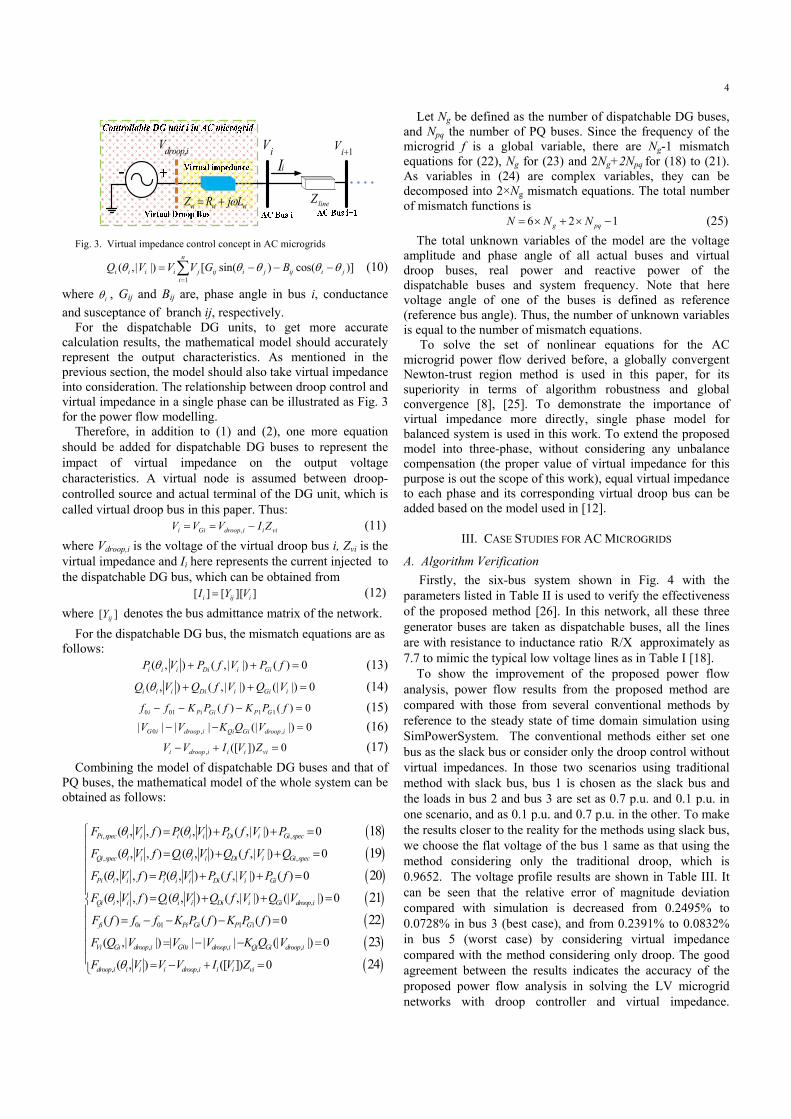
Fig. 3. Virtual impedance control concept in AC microgrids
1
( ,| |) [ sin( ) cos( )]n
i i i i j ij i j ij i ji
Q V V V G B
(10)
where i , Gij and Bij are, phase angle in bus i, conductance
and susceptance of branch ij, respectively. For the dispatchable DG units, to get more accurate
calculation results, the mathematical model should accurately represent the output characteristics. As mentioned in the previous section, the model should also take virtual impedance into consideration. The relationship between droop control and virtual impedance in a single phase can be illustrated as Fig. 3 for the power flow modelling.
Therefore, in addition to (1) and (2), one more equation should be added for dispatchable DG buses to represent the impact of virtual impedance on the output voltage characteristics. A virtual node is assumed between droop-controlled source and actual terminal of the DG unit, which is called virtual droop bus in this paper. Thus:
,i Gi droop i i viV V V I Z (11)
where Vdroop,i is the voltage of the virtual droop bus i, Zvi is the virtual impedance and Ii here represents the current injected to the dispatchable DG bus, which can be obtained from
[ ] [ ][ ]i ij iI Y V (12)
where [ ]ijY denotes the bus admittance matrix of the network.
For the dispatchable DG bus, the mismatch equations are as follows:
( , ) ( ,| |) ( ) 0i i i Di i GiP V P f V P f (13)
( , ) ( ,| |) (| |) 0i i i Di i Gi iQ V Q f V Q V (14)
0 01 1 1( ) ( ) 0i Pi Gi P Gf f K P f K P f (15)
0 , ,| | | | (| |) 0G i droop i Qi Gi droop iV V K Q V (16)
, ([ ]) 0i droop i i i viV V I V Z (17)
Combining the model of dispatchable DG buses and that of PQ buses, the mathematical model of the whole system can be obtained as follows:
, ,
, ,
,
( , , ) ( , ) ( ,| |) 0
( , , ) ( , ) ( ,| |) 0
( , , ) ( , ) ( ,| |) ( ) 0
( , , ) ( , ) ( ,| |) (| |)
18
20
19
Pi spec i i i i i Di i Gi spec
Qi spec i i i i i Di i Gi spec
Pi i i i i i Di i Gi
Qi i i i i i Di i Gi droop i
F V f P V P f V P
F V f Q V Q f V Q
F V f P V P f V P f
F V f Q V Q f V Q V
0 01 1 1
, 0 , ,
, ,
0
( ) ( ) ( ) 0
( ,| |) | | | | (
| |) 0
( , ) ([ ])
0
22
23
24
21
fi i Pi Gi P G
Vi Gi droop i G i droop i Qi Gi droop i
droop i i i i droop i i i vi
F f f f K P f K P f
F Q V V V K Q V
F V V V I V Z
Let Ng be defined as the number of dispatchable DG buses, and Npq the number of PQ buses. Since the frequency of the microgrid f is a global variable, there are Ng-1 mismatch equations for (22), Ng for (23) and 2Ng+2Npq for (18) to (21). As variables in (24) are complex variables, they can be decomposed into 2×Ng mismatch equations. The total number of mismatch functions is 6 2 1g pqN N N (25)
The total unknown variables of the model are the voltage amplitude and phase angle of all actual buses and virtual droop buses, real power and reactive power of the dispatchable buses and system frequency. Note that here voltage angle of one of the buses is defined as reference (reference bus angle). Thus, the number of unknown variables is equal to the number of mismatch equations.
To solve the set of nonlinear equations for the AC microgrid power flow derived before, a globally convergent Newton-trust region method is used in this paper, for its superiority in terms of algorithm robustness and global convergence [8], [25]. To demonstrate the importance of virtual impedance more directly, single phase model for balanced system is used in this work. To extend the proposed model into three-phase, without considering any unbalance compensation (the proper value of virtual impedance for this purpose is out the scope of this work), equal virtual impedance to each phase and its corresponding virtual droop bus can be added based on the model used in [12].
III. CASE STUDIES FOR AC MICROGRIDS
A. Algorithm Verification
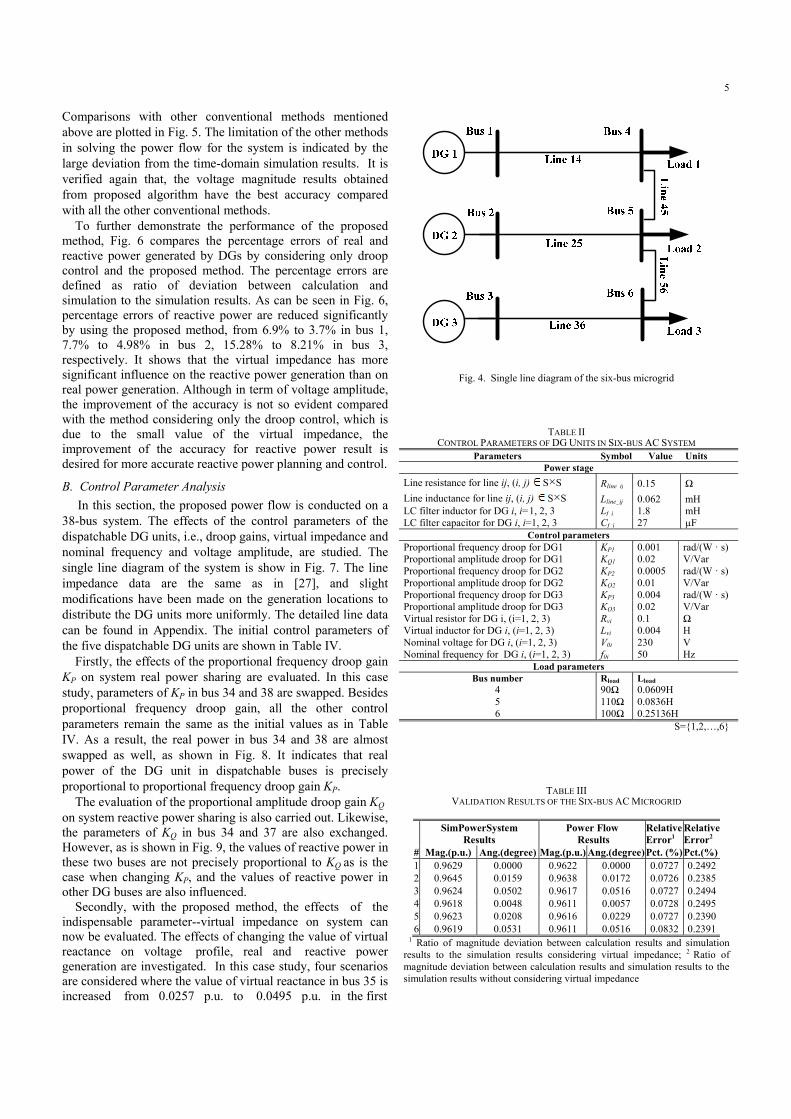
Firstly, the six-bus system shown in Fig. 4 with the parameters listed in Table II is used to verify the effectiveness of the proposed method [26]. In this network, all these three generator buses are taken as dispatchable buses, all the lines are with resistance to inductance ratio R/X approximately as 7.7 to mimic the typical low voltage lines as in Table I [18].
To show the improvement of the proposed power flow analysis, power flow results from the proposed method are compared with those from several conventional methods by reference to the steady state of time domain simulation using SimPowerSystem. The conventional methods either set one bus as the slack bus or consider only the droop control without virtual impedances. In those two scenarios using traditional method with slack bus, bus 1 is chosen as the slack bus and the loads in bus 2 and bus 3 are set as 0.7 p.u. and 0.1 p.u. in one scenario, and as 0.1 p.u. and 0.7 p.u. in the other. To make the results closer to the reality for the methods using slack bus, we choose the flat voltage of the bus 1 same as that using the method considering only the traditional droop, which is 0.9652. The voltage profile results are shown in Table III. It can be seen that the relative error of magnitude deviation compared with simulation is decreased from 0.2495% to 0.0728% in bus 3 (best case), and from 0.2391% to 0.0832% in bus 5 (worst case) by considering virtual impedance compared with the method considering only droop. The good agreement between the results indicates the accuracy of the proposed power flow analysis in solving the LV microgrid networks with droop controller and virtual impedance.
5
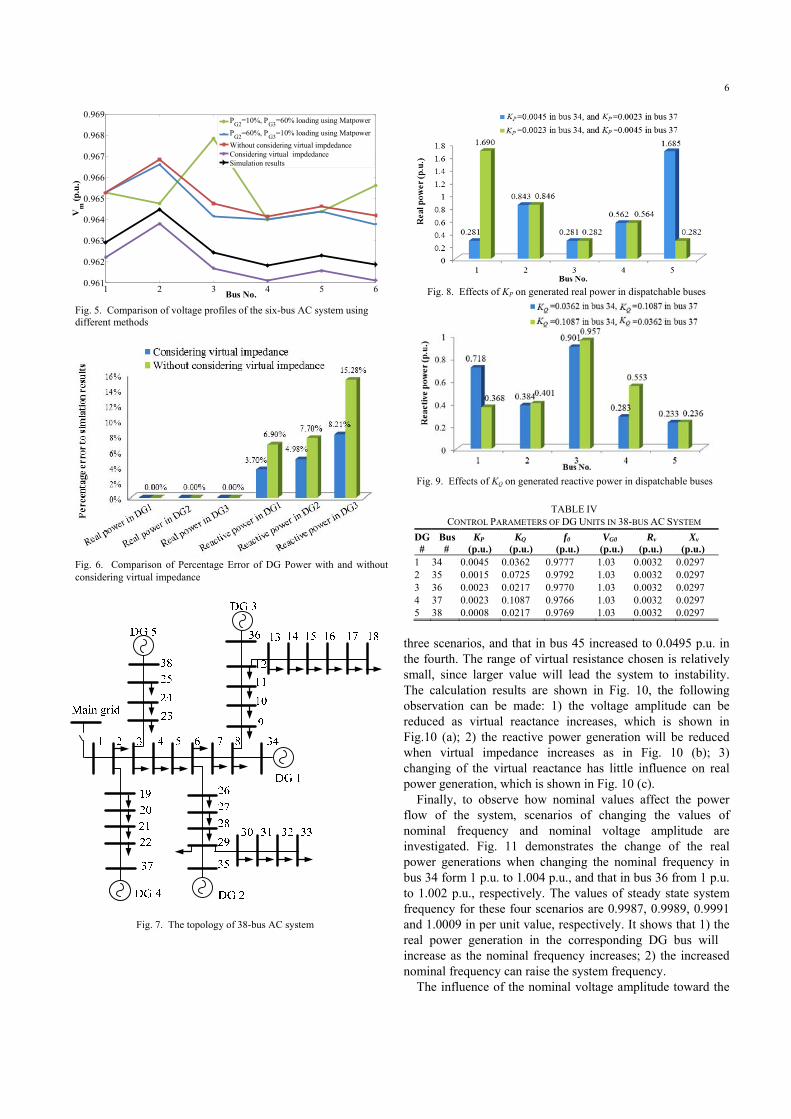
Comparisons with other conventional methods mentioned above are plotted in Fig. 5. The limitation of the other methods in solving the power flow for the system is indicated by the large deviation from the time-domain simulation results. It is verified again that, the voltage magnitude results obtained from proposed algorithm have the best accuracy compared with all the other conventional methods.
To further demonstrate the performance of the proposed method, Fig. 6 compares the percentage errors of real and reactive power generated by DGs by considering only droop control and the proposed method. The percentage errors are defined as ratio of deviation between calculation and simulation to the simulation results. As can be seen in Fig. 6, percentage errors of reactive power are reduced significantly by using the proposed method, from 6.9% to 3.7% in bus 1, 7.7% to 4.98% in bus 2, 15.28% to 8.21% in bus 3, respectively. It shows that the virtual impedance has more significant influence on the reactive power generation than on real power generation. Although in term of voltage amplitude, the improvement of the accuracy is not so evident compared with the method considering only the droop control, which is due to the small value of the virtual impedance, the improvement of the accuracy for reactive power result is desired for more accurate reactive power planning and control.
B. Control Parameter Analysis
In this section, the proposed power flow is conducted on a 38-bus system. The effects of the control parameters of the dispatchable DG units, i.e., droop gains, virtual impedance and nominal frequency and voltage amplitude, are studied. The single line diagram of the system is show in Fig. 7. The line impedance data are the same as in [27], and slight modifications have been made on the generation locations to distribute the DG units more uniformly. The detailed line data can be found in Appendix. The initial control parameters of the five dispatchable DG units are shown in Table IV.
Firstly, the effects of the proportional frequency droop gain KP on system real power sharing are evaluated. In this case study, parameters of KP in bus 34 and 38 are swapped. Besides proportional frequency droop gain, all the other control parameters remain the same as the initial values as in Table IV. As a result, the real power in bus 34 and 38 are almost swapped as well, as shown in Fig. 8. It indicates that real power of the DG unit in dispatchable buses is precisely proportional to proportional frequency droop gain KP.
The evaluation of the proportional amplitude droop gain KQ
on system reactive power sharing is also carried out. Likewise, the parameters of KQ in bus 34 and 37 are also exchanged. However, as is shown in Fig. 9, the values of reactive power in these two buses are not precisely proportional to KQ as is the case when changing KP, and the values of reactive power in other DG buses are also influenced.
Secondly, with the proposed method, the effects of the indispensable parameter--virtual impedance on system can now be evaluated. The effects of changing the value of virtual reactance on voltage profile, real and reactive power generation are investigated. In this case study, four scenarios are considered where the value of virtual reactance in bus 35 is increased from 0.0257 p.u. to 0.0495 p.u. in the first
Fig. 4. Single line diagram of the six-bus microgrid
TABLE II CONTROL PARAMETERS OF DG UNITS IN SIX-BUS AC SYSTEM
Parameters Symbol Value Units Power stage
Line resistance for line ij, (i, j) S×S Rline ij 0.15 Ω
Line inductance for line ij, (i, j) S×S Lline_ij 0.062 mH LC filter inductor for DG i, i=1, 2, 3 Lf i 1.8 mH LC filter capacitor for DG i, i=1, 2, 3 Cf_i 27 µF
Control parameters Proportional frequency droop for DG1 KP1 0.001 rad/(W · s) Proportional amplitude droop for DG1 KQ1 0.02 V/Var Proportional frequency droop for DG2 KP2 0.0005 rad/(W · s) Proportional amplitude droop for DG2 KQ2 0.01 V/Var Proportional frequency droop for DG3 KP3 0.004 rad/(W · s) Proportional amplitude droop for DG3 KQ3 0.02 V/Var Virtual resistor for DG i, (i=1, 2, 3) Rvi 0.1 Ω Virtual inductor for DG i, (i=1, 2, 3) Lvi 0.004 H Nominal voltage for DG i, (i=1, 2, 3) V0i 230 V Nominal frequency for DG i, (i=1, 2, 3) f0i 50 Hz
Load parameters Bus number Rload Lload
0.0609H 0.0836H 0.25136H
4 90Ω 5 110Ω 6 100Ω
S=1,2,…,6
TABLE III VALIDATION RESULTS OF THE SIX-BUS AC MICROGRID
#
SimPowerSystem Results
Power Flow Results
Relative Error1
Relative Error2
Mag.(p.u.) Ang.(degree) Mag.(p.u.) Ang.(degree) Pct. (%)Pct.(%)1 0.9629 0.0000 0.9622 0.0000 0.0727 0.24922 0.9645 0.0159 0.9638 0.0172 0.0726 0.23853 0.9624 0.0502 0.9617 0.0516 0.0727 0.24944 0.9618 0.0048 0.9611 0.0057 0.0728 0.24955 0.9623 0.0208 0.9616 0.0229 0.0727 0.23906 0.9619 0.0531 0.9611 0.0516 0.0832 0.2391
1 Ratio of magnitude deviation between calculation results and simulation results to the simulation results considering virtual impedance; 2 Ratio of magnitude deviation between calculation results and simulation results to the simulation results without considering virtual impedance
6
1 2 3 4 5 60.961
0.962
0.963
0.964
0.965
0.966
0.967
0.968
0.969
Bus No.
Vm
(p
.u.)
PG2
=10%, PG3
=60% loading using Matpower
PG2
=60%, PG3
=10% loading using Matpower
Without considering virtual impdedanceConsidering virtual impdedanceSimulation results
Fig. 5. Comparison of voltage profiles of the six-bus AC system using different methods
Fig. 6. Comparison of Percentage Error of DG Power with and without considering virtual impedance
Fig. 7. The topology of 38-bus AC system
Fig. 8. Effects of KP on generated real power in dispatchable buses
Fig. 9. Effects of KQ on generated reactive power in dispatchable buses
TABLE IV CONTROL PARAMETERS OF DG UNITS IN 38-BUS AC SYSTEM
DG #
Bus #
KP (p.u.)
KQ (p.u.)
f0
(p.u.) VG0
(p.u.) Rv
(p.u.) Xv
(p.u.) 1 34 0.0045 0.0362 0.9777 1.03 0.0032 0.0297 2 35 0.0015 0.0725 0.9792 1.03 0.0032 0.0297 3 36 0.0023 0.0217 0.9770 1.03 0.0032 0.0297 4 37 0.0023 0.1087 0.9766 1.03 0.0032 0.0297 5 38 0.0008 0.0217 0.9769 1.03 0.0032 0.0297
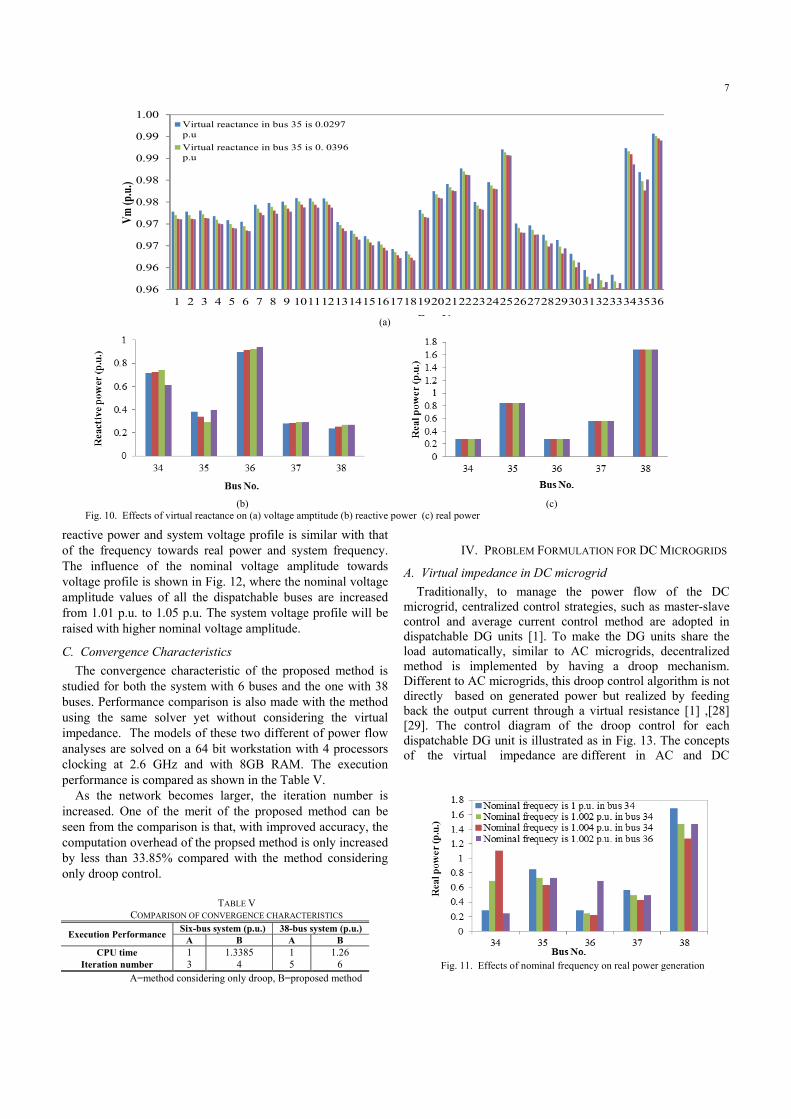
three scenarios, and that in bus 45 increased to 0.0495 p.u. in the fourth. The range of virtual resistance chosen is relatively small, since larger value will lead the system to instability. The calculation results are shown in Fig. 10, the following observation can be made: 1) the voltage amplitude can be reduced as virtual reactance increases, which is shown in Fig.10 (a); 2) the reactive power generation will be reduced when virtual impedance increases as in Fig. 10 (b); 3) changing of the virtual reactance has little influence on real power generation, which is shown in Fig. 10 (c).
Finally, to observe how nominal values affect the power flow of the system, scenarios of changing the values of nominal frequency and nominal voltage amplitude are investigated. Fig. 11 demonstrates the change of the real power generations when changing the nominal frequency in bus 34 form 1 p.u. to 1.004 p.u., and that in bus 36 from 1 p.u. to 1.002 p.u., respectively. The values of steady state system frequency for these four scenarios are 0.9987, 0.9989, 0.9991 and 1.0009 in per unit value, respectively. It shows that 1) the real power generation in the corresponding DG bus will increase as the nominal frequency increases; 2) the increased nominal frequency can raise the system frequency.
The influence of the nominal voltage amplitude toward the
7
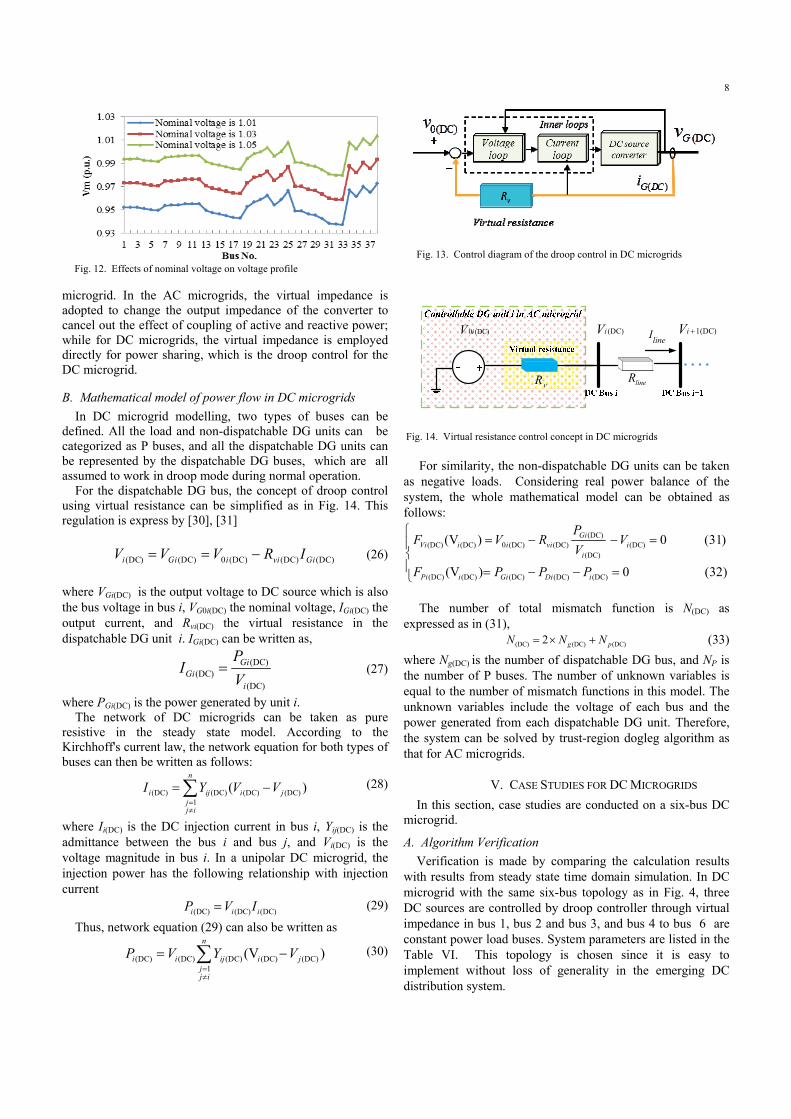
reactive power and system voltage profile is similar with that of the frequency towards real power and system frequency. The influence of the nominal voltage amplitude towards voltage profile is shown in Fig. 12, where the nominal voltage amplitude values of all the dispatchable buses are increased from 1.01 p.u. to 1.05 p.u. The system voltage profile will be raised with higher nominal voltage amplitude.
C. Convergence Characteristics
The convergence characteristic of the proposed method is studied for both the system with 6 buses and the one with 38 buses. Performance comparison is also made with the method using the same solver yet without considering the virtual impedance. The models of these two different of power flow analyses are solved on a 64 bit workstation with 4 processors clocking at 2.6 GHz and with 8GB RAM. The execution performance is compared as shown in the Table V.
As the network becomes larger, the iteration number is increased. One of the merit of the proposed method can be seen from the comparison is that, with improved accuracy, the computation overhead of the propsed method is only increased by less than 33.85% compared with the method considering only droop control.
TABLE V COMPARISON OF CONVERGENCE CHARACTERISTICS
Execution Performance Six-bus system (p.u.) 38-bus system (p.u.)
A B A B CPU time 1 1.3385 1 1.26
Iteration number 3 4 5 6 A=method considering only droop, B=proposed method
IV. PROBLEM FORMULATION FOR DC MICROGRIDS
A. Virtual impedance in DC microgrid
Traditionally, to manage the power flow of the DC microgrid, centralized control strategies, such as master-slave control and average current control method are adopted in dispatchable DG units [1]. To make the DG units share the load automatically, similar to AC microgrids, decentralized method is implemented by having a droop mechanism. Different to AC microgrids, this droop control algorithm is not directly based on generated power but realized by feeding back the output current through a virtual resistance [1] ,[28] [29]. The control diagram of the droop control for each dispatchable DG unit is illustrated as in Fig. 13. The concepts of the virtual impedance are different in AC and DC
Fig. 11. Effects of nominal frequency on real power generation
0.96
0.96
0.97
0.97
0.98
0.98
0.99
0.99
1.00
1 2 3 4 5 6 7 8 9 101112131415161718192021222324252627282930313233343536
Vm
(p.u
.)
B N
Virtual reactance in bus 35 is 0.0297p.u
Virtual reactance in bus 35 is 0. 0396p.u
(a)
(b) (c) Fig. 10. Effects of virtual reactance on (a) voltage amptitude (b) reactive power (c) real power
8
Fig. 12. Effects of nominal voltage on voltage profile
microgrid. In the AC microgrids, the virtual impedance is adopted to change the output impedance of the converter to cancel out the effect of coupling of active and reactive power; while for DC microgrids, the virtual impedance is employed directly for power sharing, which is the droop control for the DC microgrid.
B. Mathematical model of power flow in DC microgrids
In DC microgrid modelling, two types of buses can be defined. All the load and non-dispatchable DG units can be categorized as P buses, and all the dispatchable DG units can be represented by the dispatchable DG buses, which are all assumed to work in droop mode during normal operation.
For the dispatchable DG bus, the concept of droop control using virtual resistance can be simplified as in Fig. 14. This regulation is express by [30], [31]
(DC) (DC) 0 (DC) (DC) (DC)i Gi i vi GiV V V R I (26)
where VGi(DC) is the output voltage to DC source which is also the bus voltage in bus i, VG0i(DC) the nominal voltage, IGi(DC) the output current, and Rvi(DC) the virtual resistance in the dispatchable DG unit i. IGi(DC) can be written as,
(DC)
(DC)(DC)
GiGi
i
PI
V (27)
where PGi(DC) is the power generated by unit i. The network of DC microgrids can be taken as pure
resistive in the steady state model. According to the Kirchhoff's current law, the network equation for both types of buses can then be written as follows:
(DC) (DC) (DC) (DC)
1
( )n
i ij i jjj i
I Y V V
(28)
where Ii(DC) is the DC injection current in bus i, Yij(DC) is the admittance between the bus i and bus j, and Vi(DC) is the voltage magnitude in bus i. In a unipolar DC microgrid, the injection power has the following relationship with injection current
(DC) (DC) (DC)i i iP V I (29)
Thus, network equation (29) can also be written as
(DC) (DC) (DC) (DC) (DC)
1
(V )n
i i ij i jjj i
P V Y V
(30)
Fig. 13. Control diagram of the droop control in DC microgrids
vR lineR
lineI0 (DC)iV (DC)iV 1(DC)iV
Fig. 14. Virtual resistance control concept in DC microgrids
For similarity, the non-dispatchable DG units can be taken
as negative loads. Considering real power balance of the system, the whole mathematical model can be obtained as follows:
(DC)(DC) (DC) 0 (DC) (DC) (DC)
(DC)
(DC) (DC) (DC) (DC) (DC)
(V ) 0 (31)
(V ) 0 (32)
GiVi i i vi i
i
Pi i Gi Di i
PF V R V
V
F P P P
The number of total mismatch function is N(DC) as expressed as in (31),
(DC) (DC) (DC)2 g pN N N (33)
where Ng(DC) is the number of dispatchable DG bus, and NP is the number of P buses. The number of unknown variables is equal to the number of mismatch functions in this model. The unknown variables include the voltage of each bus and the power generated from each dispatchable DG unit. Therefore, the system can be solved by trust-region dogleg algorithm as that for AC microgrids.
V. CASE STUDIES FOR DC MICROGRIDS
In this section, case studies are conducted on a six-bus DC microgrid.
A. Algorithm Verification
Verification is made by comparing the calculation results with results from steady state time domain simulation. In DC microgrid with the same six-bus topology as in Fig. 4, three DC sources are controlled by droop controller through virtual impedance in bus 1, bus 2 and bus 3, and bus 4 to bus 6 are constant power load buses. System parameters are listed in the Table VI. This topology is chosen since it is easy to implement without loss of generality in the emerging DC distribution system.
9
TABLE VI. SYSTEM PARAMETERS OF SIX- BUS DC MICROGRID Parameters Symbol Value Units
Control parameters Reference voltage in bus i, (i=1, 2, 3) V0i(DC) 380 V
Virtual resistance for DC source 1 Rv1 0.6 Ω Virtual resistance for DC source 2 Rv2 0.5 Ω Virtual resistance for DC source 3 Rv3 0.2 Ω
Line parameters Line resistance for line 1 Rline_1 0.2 Ω Line resistance for line 2 Rline 2 0.4 Ω Line resistance for line 3 Rline_3 0.3 Ω Line resistance for line 4 Rline_4 0.25 Ω Line resistance for line 5 Rline_5 0.2 Ω
Load parameters Bus number Power(W)
4 4500 5 5700 6 6350
TABLE VII.
VALIDATION RESULTS OF THE SIX-BUS DC MICROGRID
No. SimPowerSystem Results Power Flow Results Mag.(p.u.) Power(W) Mag.(p.u.) Power(W)
1 0.9765 4809.85 0.9796 4806.61 2 0.9816 4375.04 0.9846 4372.11 3 0.9864 7576.49 0.9894 7572.37 4 0.9697 4500* 0.9728 4500* 5 0.9692 5700* 0.9723 5700* 6 0.9704 6350* 0.9735 6350*
The comparison results are shown in Table VII. It shows
that the maximum deviation of voltage amplitude to the simulation is less than 0.32%, and the maximum deviation of bus injection power is less than 0.67%. The good agreement between these two sets of results proves the effectiveness of the proposed power flow analysis for the DC microgrid.
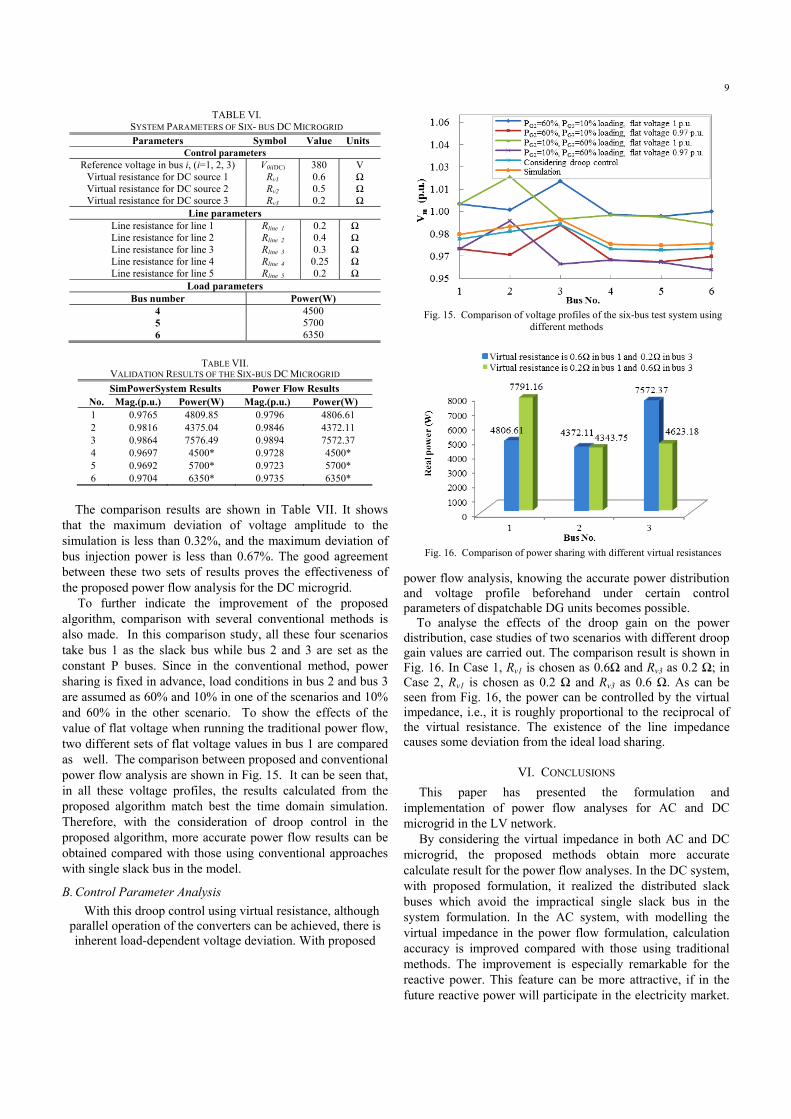
To further indicate the improvement of the proposed algorithm, comparison with several conventional methods is also made. In this comparison study, all these four scenarios take bus 1 as the slack bus while bus 2 and 3 are set as the constant P buses. Since in the conventional method, power sharing is fixed in advance, load conditions in bus 2 and bus 3 are assumed as 60% and 10% in one of the scenarios and 10% and 60% in the other scenario. To show the effects of the value of flat voltage when running the traditional power flow, two different sets of flat voltage values in bus 1 are compared as well. The comparison between proposed and conventional power flow analysis are shown in Fig. 15. It can be seen that, in all these voltage profiles, the results calculated from the proposed algorithm match best the time domain simulation. Therefore, with the consideration of droop control in the proposed algorithm, more accurate power flow results can be obtained compared with those using conventional approaches with single slack bus in the model.
B. Control Parameter Analysis
With this droop control using virtual resistance, although parallel operation of the converters can be achieved, there is inherent load-dependent voltage deviation. With proposed
Fig. 15. Comparison of voltage profiles of the six-bus test system using
different methods
Fig. 16. Comparison of power sharing with different virtual resistances
power flow analysis, knowing the accurate power distribution and voltage profile beforehand under certain control parameters of dispatchable DG units becomes possible.
To analyse the effects of the droop gain on the power distribution, case studies of two scenarios with different droop gain values are carried out. The comparison result is shown in Fig. 16. In Case 1, Rv1 is chosen as 0.6Ω and Rv3 as 0.2 Ω; in Case 2, Rv1 is chosen as 0.2 Ω and Rv3 as 0.6 Ω. As can be seen from Fig. 16, the power can be controlled by the virtual impedance, i.e., it is roughly proportional to the reciprocal of the virtual resistance. The existence of the line impedance causes some deviation from the ideal load sharing.
VI. CONCLUSIONS
This paper has presented the formulation and implementation of power flow analyses for AC and DC microgrid in the LV network.
By considering the virtual impedance in both AC and DC microgrid, the proposed methods obtain more accurate calculate result for the power flow analyses. In the DC system, with proposed formulation, it realized the distributed slack buses which avoid the impractical single slack bus in the system formulation. In the AC system, with modelling the virtual impedance in the power flow formulation, calculation accuracy is improved compared with those using traditional methods. The improvement is especially remarkable for the reactive power. This feature can be more attractive, if in the future reactive power will participate in the electricity market.
10
Comparing with the method considering only the droop control, the improvement is not with a high cost—the computation overhead only increased slightly.
By virtue of the proposed method, with more detailed control parameters modelled, more detailed parameter analysis can be conducted by proposed power flow analyses. This will contribute to the system operation and optimization with higher accuracy.
APPENDIX
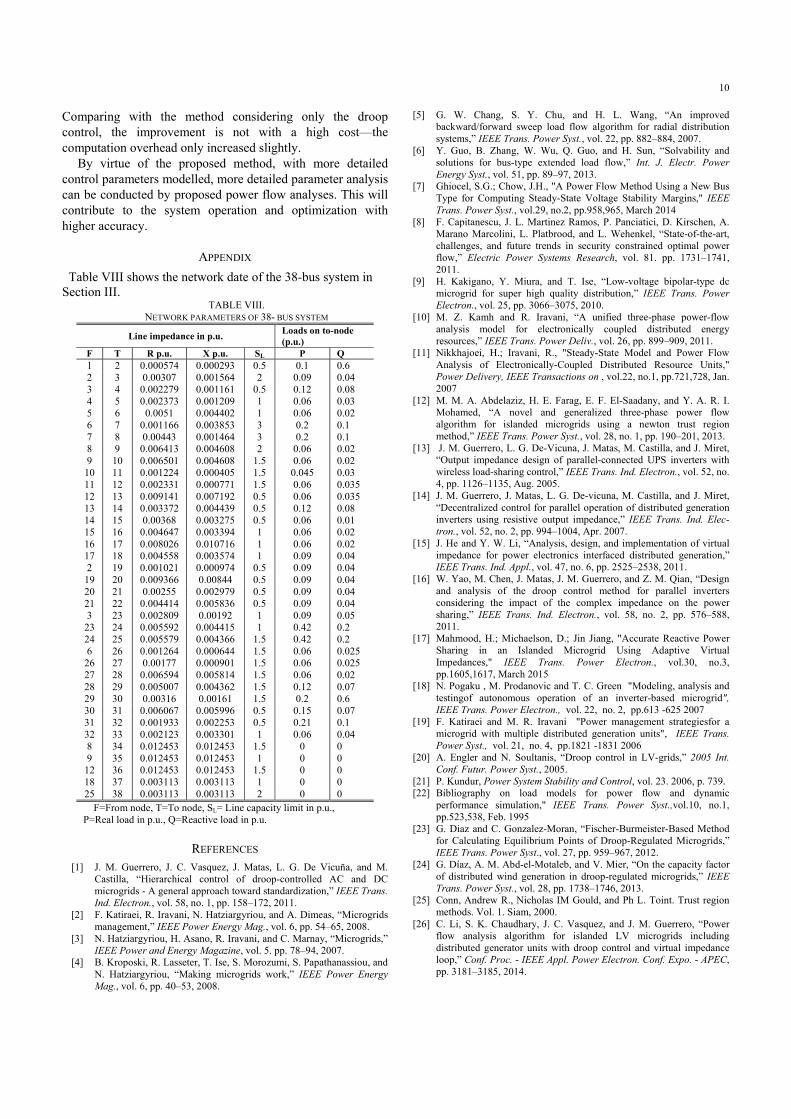
Table VIII shows the network date of the 38-bus system in Section III.
TABLE VIII. NETWORK PARAMETERS OF 38- BUS SYSTEM
Line impedance in p.u. Loads on to-node (p.u.)
F T R p.u. X p.u. SL P Q 1 2 0.000574 0.000293 0.5 0.1 0.6 2 3 0.00307 0.001564 2 0.09 0.04 3 4 0.002279 0.001161 0.5 0.12 0.08 4 5 0.002373 0.001209 1 0.06 0.03 5 6 0.0051 0.004402 1 0.06 0.02 6 7 0.001166 0.003853 3 0.2 0.1 7 8 0.00443 0.001464 3 0.2 0.1 8 9 0.006413 0.004608 2 0.06 0.02 9 10 0.006501 0.004608 1.5 0.06 0.02 10 11 0.001224 0.000405 1.5 0.045 0.03 11 12 0.002331 0.000771 1.5 0.06 0.035 12 13 0.009141 0.007192 0.5 0.06 0.035 13 14 0.003372 0.004439 0.5 0.12 0.08 14 15 0.00368 0.003275 0.5 0.06 0.01 15 16 0.004647 0.003394 1 0.06 0.02 16 17 0.008026 0.010716 1 0.06 0.02 17 18 0.004558 0.003574 1 0.09 0.04 2 19 0.001021 0.000974 0.5 0.09 0.04 19 20 0.009366 0.00844 0.5 0.09 0.04 20 21 0.00255 0.002979 0.5 0.09 0.04 21 22 0.004414 0.005836 0.5 0.09 0.04 3 23 0.002809 0.00192 1 0.09 0.05 23 24 0.005592 0.004415 1 0.42 0.2 24 25 0.005579 0.004366 1.5 0.42 0.2 6 26 0.001264 0.000644 1.5 0.06 0.025 26 27 0.00177 0.000901 1.5 0.06 0.025 27 28 0.006594 0.005814 1.5 0.06 0.02 28 29 0.005007 0.004362 1.5 0.12 0.07 29 30 0.00316 0.00161 1.5 0.2 0.6 30 31 0.006067 0.005996 0.5 0.15 0.07 31 32 0.001933 0.002253 0.5 0.21 0.1 32 33 0.002123 0.003301 1 0.06 0.04 8 34 0.012453 0.012453 1.5 0 0 9 35 0.012453 0.012453 1 0 0 12 36 0.012453 0.012453 1.5 0 0 18 37 0.003113 0.003113 1 0 0 25 38 0.003113 0.003113 2 0 0 F=From node, T=To node, SL= Line capacity limit in p.u., P=Real load in p.u., Q=Reactive load in p.u.
REFERENCES [1] J. M. Guerrero, J. C. Vasquez, J. Matas, L. G. De Vicuña, and M.
Castilla, “Hierarchical control of droop-controlled AC and DC microgrids - A general approach toward standardization,” IEEE Trans. Ind. Electron., vol. 58, no. 1, pp. 158–172, 2011.
[2] F. Katiraei, R. Iravani, N. Hatziargyriou, and A. Dimeas, “Microgrids management,” IEEE Power Energy Mag., vol. 6, pp. 54–65, 2008.
[3] N. Hatziargyriou, H. Asano, R. Iravani, and C. Marnay, “Microgrids,” IEEE Power and Energy Magazine, vol. 5. pp. 78–94, 2007.
[4] B. Kroposki, R. Lasseter, T. Ise, S. Morozumi, S. Papathanassiou, and N. Hatziargyriou, “Making microgrids work,” IEEE Power Energy Mag., vol. 6, pp. 40–53, 2008.
[5] G. W. Chang, S. Y. Chu, and H. L. Wang, “An improved backward/forward sweep load flow algorithm for radial distribution systems,” IEEE Trans. Power Syst., vol. 22, pp. 882–884, 2007.
[6] Y. Guo, B. Zhang, W. Wu, Q. Guo, and H. Sun, “Solvability and solutions for bus-type extended load flow,” Int. J. Electr. Power Energy Syst., vol. 51, pp. 89–97, 2013.
[7] Ghiocel, S.G.; Chow, J.H., "A Power Flow Method Using a New Bus Type for Computing Steady-State Voltage Stability Margins," IEEE Trans. Power Syst., vol.29, no.2, pp.958,965, March 2014
[8] F. Capitanescu, J. L. Martinez Ramos, P. Panciatici, D. Kirschen, A. Marano Marcolini, L. Platbrood, and L. Wehenkel, “State-of-the-art, challenges, and future trends in security constrained optimal power flow,” Electric Power Systems Research, vol. 81. pp. 1731–1741, 2011.
[9] H. Kakigano, Y. Miura, and T. Ise, “Low-voltage bipolar-type dc microgrid for super high quality distribution,” IEEE Trans. Power Electron., vol. 25, pp. 3066–3075, 2010.
[10] M. Z. Kamh and R. Iravani, “A unified three-phase power-flow analysis model for electronically coupled distributed energy resources,” IEEE Trans. Power Deliv., vol. 26, pp. 899–909, 2011.
[11] Nikkhajoei, H.; Iravani, R., "Steady-State Model and Power Flow Analysis of Electronically-Coupled Distributed Resource Units," Power Delivery, IEEE Transactions on , vol.22, no.1, pp.721,728, Jan. 2007
[12] M. M. A. Abdelaziz, H. E. Farag, E. F. El-Saadany, and Y. A. R. I. Mohamed, “A novel and generalized three-phase power flow algorithm for islanded microgrids using a newton trust region method,” IEEE Trans. Power Syst., vol. 28, no. 1, pp. 190–201, 2013.
[13] J. M. Guerrero, L. G. De-Vicuna, J. Matas, M. Castilla, and J. Miret, “Output impedance design of parallel-connected UPS inverters with wireless load-sharing control,” IEEE Trans. Ind. Electron., vol. 52, no. 4, pp. 1126–1135, Aug. 2005.
[14] J. M. Guerrero, J. Matas, L. G. De-vicuna, M. Castilla, and J. Miret, “Decentralized control for parallel operation of distributed generation inverters using resistive output impedance,” IEEE Trans. Ind. Elec- tron., vol. 52, no. 2, pp. 994–1004, Apr. 2007.
[15] J. He and Y. W. Li, “Analysis, design, and implementation of virtual impedance for power electronics interfaced distributed generation,” IEEE Trans. Ind. Appl., vol. 47, no. 6, pp. 2525–2538, 2011.
[16] W. Yao, M. Chen, J. Matas, J. M. Guerrero, and Z. M. Qian, “Design and analysis of the droop control method for parallel inverters considering the impact of the complex impedance on the power sharing,” IEEE Trans. Ind. Electron., vol. 58, no. 2, pp. 576–588, 2011.
[17] Mahmood, H.; Michaelson, D.; Jin Jiang, "Accurate Reactive Power Sharing in an Islanded Microgrid Using Adaptive Virtual Impedances," IEEE Trans. Power Electron., vol.30, no.3, pp.1605,1617, March 2015
[18] N. Pogaku , M. Prodanovic and T. C. Green "Modeling, analysis and testingof autonomous operation of an inverter-based microgrid", IEEE Trans. Power Electron., vol. 22, no. 2, pp.613 -625 2007
[19] F. Katiraei and M. R. Iravani "Power management strategiesfor a microgrid with multiple distributed generation units", IEEE Trans. Power Syst., vol. 21, no. 4, pp.1821 -1831 2006
[20] A. Engler and N. Soultanis, “Droop control in LV-grids,” 2005 Int. Conf. Futur. Power Syst., 2005.
[21] P. Kundur, Power System Stability and Control, vol. 23. 2006, p. 739. [22] Bibliography on load models for power flow and dynamic
performance simulation," IEEE Trans. Power Syst.,vol.10, no.1, pp.523,538, Feb. 1995
[23] G. Diaz and C. Gonzalez-Moran, “Fischer-Burmeister-Based Method for Calculating Equilibrium Points of Droop-Regulated Microgrids,” IEEE Trans. Power Syst., vol. 27, pp. 959–967, 2012.
[24] G. Díaz, A. M. Abd-el-Motaleb, and V. Mier, “On the capacity factor of distributed wind generation in droop-regulated microgrids,” IEEE Trans. Power Syst., vol. 28, pp. 1738–1746, 2013.
[25] Conn, Andrew R., Nicholas IM Gould, and Ph L. Toint. Trust region methods. Vol. 1. Siam, 2000.
[26] C. Li, S. K. Chaudhary, J. C. Vasquez, and J. M. Guerrero, “Power flow analysis algorithm for islanded LV microgrids including distributed generator units with droop control and virtual impedance loop,” Conf. Proc. - IEEE Appl. Power Electron. Conf. Expo. - APEC, pp. 3181–3185, 2014.

11
[27] Singh, D.; Misra, R.K.; Singh, D., "Effect of Load Models in Distributed Generation Planning," IEEE Trans. Power Syst.,vol.22, no.4, pp.2204,2212, Nov. 2007
[28] Dong Chen; Lie Xu, "Autonomous DC Voltage Control of a DC Microgrid With Multiple Slack Terminals," IEEE Trans. Power Syst., vol.27, no.4, pp.1897,1905, Nov. 2012
[29] Karlsson, P.; Svensson, J., "DC bus voltage control for a distributed power system," Power Electronics, IEEE Trans. Power Electron., vol.18, no.6, pp.1405,1412, Nov. 2003
[30] C. Li, S. K. Chaudhary, T. Dragicevic, J. C. Vasquez, and J. M. Guerrero, “Power flow analysis for DC voltage droop controlled DC microgrids,” in 11th International Multi-Conference on Systems, Signals Devices (SSD), 2014, pp. 1–5.
[31] C. Li, S. K. Chaudhary, J. C. Vasquez, and J. M. Guerrero, “Power flow analysis for droop controlled LV hybrid AC-DC microgrids with virtual impedance,” in 2014 IEEE PES General Meeting | Conference & Exposition, 2014, pp. 1–4.
Chendan Li (S’13) received the B.S. degree and M.S. degree in Electrical Engineering from Nanjing Agricultural University, Nanjing Univ. of Aeronautics & Astronautics, Nanjing, Jiangsu, China, in 2009 and 2012 respectively.
She is currently working toward the Ph.D. degree in the Department of Energy Technology at Aalborg University, Aalborg, Denmark, as a member in the Microgrids Research Programme. Her main research interests include steady state and dynamic analysis, optimization and
distributed control for AC and DC microgrid.
Sanjay K. Chaudhary (S’01–M’11) obtained his M. Tech. (Electrical Engg.) in 2002 from Indian Institute of Technology, Kanpur, India. He received his Ph.D. from Aalborg University, Denmark in 2011.
He worked with ABB Ltd. India from 2002 to 2005 and with Honeywell Technology Solutions Lab, Bangalore from 2005-2008. In July 2011, he joined the Department of Energy Technology, Aalborg University as Assistant Professor. Since July 2015, he is employed as Associate Professor.
His main interest is on grid integration of renewable energy, application of power converters in power system, HVDC and FACTS.
Mehdi Savaghebi (S’06-M’15-SM’15) was born in Karaj, Iran, in 1983. He received the B.Sc. degree from University of Tehran, Iran, in 2004 and the M.Sc. and Ph.D. degrees with highest honors from Iran University of Science and Technology, Tehran, Iran in 2006 and 2012, respectively, all in Electrical Engineering. From 2007 to 2014, he was a Lecturer in Electrical Engineering Department, Karaj Branch, Azad University where he taught various courses and conducted research on power systems and electrical machines. In 2010, he was a Visiting
Ph.D. Student with the Department of Energy Technology, Aalborg University, Aalborg, Denmark and with the Department of Automatic Control Systems and Computer Engineering, Technical University of Catalonia, Barcelona, Spain.
Currently, he is a Postdoctoral Fellow in Department of Energy Technology, Aalborg University. His main research interests include distributed generation systems, microgrids and power quality issues of electrical systems. Dr. Savaghebi is a member of Technical Committee of Renewable Energy Systems, IEEE Industrial Electronics Society and also IEEE Task Force on Microgrids Stability Analysis and Modeling.
Juan C. Vasquez (M’12-SM’14) received the B.S. degree in electronics engineering from the Autonomous University of Manizales, Manizales, Colombia, and the Ph.D. degree in automatic control, robotics, and computer vision from the Technical University of Catalonia, Barcelona, Spain, in 2004 and 2009, respectively. He was with the Autonomous University of Manizales working as a teaching assistant and the Technical University of Catalonia as a Post-Doctoral Assistant in 2005 and 2008 respectively. In 2011, he was Assistant Professor and from 2014 he is
working as an Associate Professor at the Department of Energy Technology, Aalborg University, Denmark where he is the Vice Programme Leader of the Microgrids Research Program. From Feb. 2015 to April. 2015 he was a Visiting Scholar at the Center of Power Electronics Systems (CPES) at Virginia Tech. His current research interests include operation, advanced hierarchical and cooperative control, optimization and energy management applied to distributed generation in AC and DC microgrids. He has authored and co-authored more than 100 technical papers only in Microgrids where 60 of them are published in international IEEE journals.
Dr. Vasquez is currently a member of the IEC System Evaluation Group SEG4 on LVDC Distribution and Safety for use in Developed and Developing Economies, the Renewable Energy Systems Technical Committee TC-RES in IEEE Industrial Electronics, PELS, IAS, and PES Societies.
Josep M. Guerrero (S’01-M’04-SM’08-FM’15) received the B.S. degree in telecommunications engineering, the M.S. degree in electronics engineering, and the Ph.D. degree in power electronics from the Technical University of Catalonia, Barcelona, in 1997, 2000 and 2003, respectively. Since 2011, he has been a Full Professor with the Department of Energy Technology, Aalborg University,
Denmark, where he is responsible for the Microgrid Research Program. From 2012 he is a guest Professor at the Chinese Academy of Science and the Nanjing University of Aeronautics and Astronautics; from 2014 he is chair Professor in Shandong University; and from 2015 he is a distinguished guest Professor in Hunan University.
His research interests is oriented to different microgrid aspects, including power electronics, distributed energy-storage systems, hierarchical and cooperative control, energy management systems, and optimization of microgrids and islanded minigrids; recently specially focused on maritime microgrids for electrical ships, vessels, ferries and seaports. Prof. Guerrero is an Associate Editor for the IEEE TRANSACTIONS ON POWER ELECTRONICS, the IEEE TRANSACTIONS ON INDUSTRIAL ELECTRONICS, and the IEEE Industrial Electronics Magazine, and an Editor for the IEEE TRANSACTIONS on SMART GRID and IEEE TRANSACTIONS on ENERGY CONVERSION. He has been Guest Editor of the IEEE TRANSACTIONS ON POWER ELECTRONICS Special Issues: Power Electronics for Wind Energy Conversion and Power Electronics for Microgrids; the IEEE TRANSACTIONS ON INDUSTRIAL ELECTRONICS Special Sections: Uninterruptible Power Supplies systems, Renewable Energy Systems, Distributed Generation and Microgrids, and Industrial Applications and Implementation Issues of the Kalman Filter; and the IEEE TRANSACTIONS on SMART GRID Special Issue on Smart DC Distribution Systems. He was the chair of the Renewable Energy Systems Technical Committee of the IEEE Industrial Electronics Society. He received the best paper award of the IEEE Transactions on Energy Conversion for the period 2014-2015. In 2014 and 2015 he was awarded by Thomson Reuters as Highly Cited Researcher, and in 2015 he was elevated as IEEE Fellow for his contributions on “distributed power systems and microgrids.”