Embed Size (px)
Citation preview
Aalborg Universitet
Thermal response testing of precast pile heat exchangers
Fieldwork report
Pagola, Maria Alberdi; Poulsen, Søren Erbs; Jensen, Rasmus Lund; Madsen, Søren
Publication date:2017
Document VersionPublisher's PDF, also known as Version of record
Link to publication from Aalborg University
Citation for published version (APA):Pagola, M. A., Poulsen, S. E., Jensen, R. L., & Madsen, S. (2017). Thermal response testing of precast pile heatexchangers: Fieldwork report. Aalborg University. Department of Civil Engineering. DCE Technical Reports No.234
General rightsCopyright and moral rights for the publications made accessible in the public portal are retained by the authors and/or other copyright ownersand it is a condition of accessing publications that users recognise and abide by the legal requirements associated with these rights.
? Users may download and print one copy of any publication from the public portal for the purpose of private study or research. ? You may not further distribute the material or use it for any profit-making activity or commercial gain ? You may freely distribute the URL identifying the publication in the public portal ?
Take down policyIf you believe that this document breaches copyright please contact us at [email protected] providing details, and we will remove access tothe work immediately and investigate your claim.
Downloaded from vbn.aau.dk on: December 26, 2021
ISSN 1901-726X DCE Technical Report No. 234
Thermal response testing of precast pile heat exchangers:
fieldwork report.
Maria Alberdi-Pagola Søren Erbs Poulsen (VIA University College, Horsens, DK)
Rasmus Lund Jensen Søren Madsen

Alberdi-Pagola et. al (2017) DCE Technical Report No. 234 Thermal property measurements of soil and concrete samples
2
Alberdi-Pagola et. al (2017) DCE Technical Report No. 234 Thermal property measurements of soil and concrete samples
3
DCE Technical Report No. 234
Thermal response testing of precast pile heat exchangers: fieldwork report.
by
Maria Alberdi-Pagola Søren Erbs Poulsen (VIA University College)
Rasmus Lund Jensen Søren Madsen
December 2017
© Aalborg University
Aalborg University Department of Civil Engineering
Alberdi-Pagola et. al (2017) DCE Technical Report No. 234 Thermal property measurements of soil and concrete samples
4
Scientific Publications at the Department of Civil Engineering Technical Reports are published for timely dissemination of research results and scientific work carried out at the Department of Civil Engineering (DCE) at Aalborg University. This medium allows publication of more detailed explanations and results than typically allowed in scientific journals. Technical Memoranda are produced to enable the preliminary dissemination of scientific work by the personnel of the DCE where such release is deemed to be appropriate. Documents of this kind may be incomplete or temporary versions of papers—or part of continuing work. This should be kept in mind when references are given to publications of this kind. Contract Reports are produced to report scientific work carried out under contract. Publications of this kind contain confidential matter and are reserved for the sponsors and the DCE. Therefore, Contract Reports are generally not available for public circulation. Lecture Notes contain material produced by the lecturers at the DCE for educational purposes. This may be scientific notes, lecture books, example problems or manuals for laboratory work, or computer programs developed at the DCE. Theses are monograms or collections of papers published to report the scientific work carried out at the DCE to obtain a degree as either PhD or Doctor of Technology. The thesis is publicly available after the defence of the degree. Latest News is published to enable rapid communication of information about scientific work carried out at the DCE. This includes the status of research projects, developments in the laboratories, information about collaborative work and recent research results.
Published 2017 by Aalborg University Department of Civil Engineering Thomas Manns Vej 23 DK-9000, Aalborg Ø, Denmark Printed in Aalborg at Aalborg University ISSN 1901-726X DCE Technical Report No. 234
Alberdi-Pagola et. al (2017) DCE Technical Report No. 234 Thermal property measurements of soil and concrete samples
5
Table of contents
List of figures .................................................................................................................................. 5 List of tables .................................................................................................................................... 7 List of acronyms .............................................................................................................................. 7 1. Introduction ................................................................................................................................. 8 2. Thermal response testing ......................................................................................................... 8 3. Test sites ............................................................................................................................... 10
3.1. Langmarksvej ................................................................................................................. 10 3.2. Rosborg Gymnasium ...................................................................................................... 14
4. TRT sets ................................................................................................................................ 19 4.1. Langmarksvej ................................................................................................................. 20 4.2. Rosborg Gymnasium ...................................................................................................... 21 4.3. Test comparison ............................................................................................................. 21
5. Summary ............................................................................................................................... 22 6. Acknowledgements ................................................................................................................ 23 7. References ............................................................................................................................ 23 8. Appendices ............................................................................................................................ 25
A) Test site documentation .................................................................................................. 25 B) Energy pile drawings....................................................................................................... 31 C) Temperature measurements ........................................................................................... 33 D) Thermal response test data ............................................................................................ 36 E) TRT equipment data sheet.............................................................................................. 42
List of figures Figure 1: Thermal response test set-up, after Gehlin (2002). The figure represents the TRT in heating mode, i. e., when the inlet temperature Tin overcomes the outlet Tout. ............................................. 9 Figure 2: The Langmarksvej test site, Langmarksvej 84, 8700 Horsens, Denmark. ...................... 10 Figure 3: Stratigraphic profile at the Langmarksvej test site. Bulk density ρ, water content, thermal
conductivity λs and volumetric heat capacity ρcp measured in the laboratory using the Hot Disk
apparatus are also provided. ρcp eff and λs eff are weighted average estimates over the length of the
drilling. .......................................................................................................................................... 11 Figure 4: Ground heat exchanger location at Langmarksvej test site (Langmarksvej 84, 8700 Horsens): top view and vertical section. EP: Energy Pile; BHE: Borehole Heat Exchanger; TSA: Temperature Sensor Array; 1U: Single-U pipe arrangement; 2U: Double-U pipe arrangement. .... 13 Figure 5: Demonstration model of the precast energy pile with W-shaped heat exchanger pipes fitted to the reinforcement bars; b.1) horizontal cross section of the W-shape energy pile and; b.2) horizontal cross section of the single-U energy pile. ...................................................................... 14 Figure 6: Vertical cross section of the location of a single Pt100 temperature sensor within the TSA drilling, located 0.85 m apart form EP3. ........................................................................................ 14 Figure 7: The Rosborg Gymnasium building at Vestre Engvej 61, 7100 Vejle, Denmark. The south and north extensions are founded on 200 and 220 energy piles, respectively. .............................. 15 Figure 8: Stratigraphic profile at the Rosborg North test site. Bulk density ρ, water content, thermal
conductivity λs and volumetric heat capacity ρcp measured in the laboratory using the Hot Disk
apparatus are also provided. ρcp eff and λs eff are weighted average estimates over the length of the
drilling. .......................................................................................................................................... 16 Figure 9: Footprint of the Rosborg Gymnasium’s northern extension building. The location of instrumented piles and piles available for testing are also provided. ............................................. 17
Alberdi-Pagola et. al (2017) DCE Technical Report No. 234 Thermal property measurements of soil and concrete samples
6
Figure 10: Footprint of the Rosborg Gymnasium’s southern extension building. The location of instrumented piles and piles available for testing are also provided. ............................................. 17 Figure 11: Schematic arrangement of Pt100 strings within the instrumented piles and their depths at Rosborg North, piles 1 and 2 (EP_RN_1 & 2): vertical section and cross sections. ....................... 19 Figure 12: Short term GHE temperature responses in the TRTs. RS = Rosborg South, RN = Rosborg North, LM = Langmarksvej, BHE = Borehole Heat Exchanger ...................................................... 22 Figure 13: Soil description of the samples collected each 0.5 m in the drilling executed to host the temperature sensor array TSA. ..................................................................................................... 25 Figure 14: Ongoing TRT at the 18 m deep BHE at Langmarksvej. Inlet- and outlet pipes are insulated to prevent disturbances from ambient temperature conditions. ..................................................... 26 Figure 15: A single EP at the Langmarksvej test site prior to connecting the TRT equipment. ...... 26 Figure 16: Monitoring drilling work. The drilling is located 0.85 m from EP3 (see Figure 4). .......... 27 Figure 17: View of the EP3, the TSA and the BHE at the Langmarksvej test site. ......................... 27 Figure 18: Ongoing TRT of the 18 m long EP3 at Langmarksvej. Inlet- and outlet pipes are insulated to prevent disturbances from ambient temperature conditions. The adjacent box, covered with black plastic bags, contains the computer and the modules to log the temperature data from the underground Pt100 TSA. .............................................................................................................. 28 Figure 19: Soil description of the samples collected each 0.5 m in the monitoring drilling executed at Rosborg Gymnasium. ................................................................................................................... 29 Figure 20: Pile instrumentation with Pt100 temperature sensors. .................................................. 29 Figure 21: A) Ongoing TRT of the 16 m long EP at Rosborg North. Inlet- and outlet pipes are insulated to prevent disturbances from ambient conditions. B) The adjacent box, covered with black plastic bags contains the computer and the modules to log the temperature data from the Pt100 temperature sensors casted into the pile (see Figures 11 and 20). ............................................... 30 Figure 22: Vertical cross section of a W-shape driven energy pile. ............................................... 31 Figure 23: Geometry and dimensions in mm of a W-shape energy pile. ........................................ 32 Figure 24: Schematic of the calibration setup. ............................................................................... 33 Figure 25: Calibration curve for the 3 m length cable. True temperature VS resistance reading. ... 34 Figure 26: Undisturbed soil temperatures measured during the testing periods at the Langmarskvej test site. ........................................................................................................................................ 36 Figure 27: Undisturbed soil temperatures measured prior to the TRT of the energy pile at Rosborg North (EP_RN_1) the 9/02/2016. .................................................................................................. 37 Figure 28: Measured temperature and fluid flow profiles during the TRT of the BHE at Langmarksvej test site. Tin and Tout are the inlet- and outlet fluid temperature, respectively. Notice that recovery data (water circulation without heating) was also collected for 50 hours following the test. ........... 37 Figure 29: Measured temperature and fluid flow profiles during the TRT of EP8 at the Langmarksvej test site. Tin and Tout are the inlet- and outlet fluid temperature, respectively. ................................ 38 Figure 30: Measured temperature and fluid flow profiles during the TRT of EP7 at the Langmarksvej test site. Tin and Tout are the inlet- and outlet fluid temperature, respectively. Notice that the power was interrupted for 10 hours during the test. ................................................................................. 38 Figure 31: Measured temperature and fluid flow profiles during the TRT of EP4 at the Langmarksvej test site. Tin and Tout are the inlet- and outlet fluid temperature, respectively. ................................ 39 Figure 32: Measured temperature and fluid flow profiles during the TRT of EP3 at the Langmarksvej test site. Tin and Tout are the inlet- and outlet fluid temperature, respectively. Notice that recovery data (water circulation without heating) was also collected over 115 hours. .................................. 39 Figure 33: Measured ground temperature profiles from the TSA (0.85 m from EP3, Figure 4) at different levels (0, -2, -6, -10, -14, -18 m below terrain) and at different times (0, 25, 90, 147 hours) during the TRT of EP3 at the Langmarksvej test site. ................................................................... 40 Figure 34: Measured temperature and fluid flow profiles during the TRT of EP_RS at the north extension of Rosborg Gymnasium. Tin and Tout are the inlet- and outlet fluid temperature, respectively. .................................................................................................................................. 40
Alberdi-Pagola et. al (2017) DCE Technical Report No. 234 Thermal property measurements of soil and concrete samples
7
Figure 35: Measured temperature and fluid flow profiles during the TRT of EP_RN at the north extension of Rosborg Gymnasium. Tin and Tout are the inlet- and outlet fluid temperature, respectively. .................................................................................................................................. 41 Figure 36: Pile temperatures measured with the Pt100 temperature sensors casted in the concrete at different levels (+0.1, -2.7, -6.7, -10.7, 14.7 m relative to the ground surface) and at different times (0, 10, 25, 49 hours) during the TRT of the energy pile EP_RN [W + 16 m] at the north extension of Rosborg Gymnasium. Temp.1 = middle sensor-string and Temp.2 = pipe-wall sensor-string (Figure 11). ............................................................................................................................................... 41
List of tables Table 1: Properties of tested GHE at the Langmarksvej (LM) test site (information provided by Centrum Pæle A/S and VIA University College). ........................................................................... 12 Table 2: Properties of tested energy piles (EP) at Rosborg Gymnasium test site. ......................... 18 Table 3: Key parameters for the TRTs performed at the Langmarksvej test site. .......................... 20 Table 4: Summary of main parameters of the TRTs performed at Rosborg Gymnasium test site. . 21
List of acronyms
AR: Aspect Ratio BHE: Borehole Heat Exchanger DAQ: Data Acquisition System EP: Energy Pile GHE: Ground Heat Exchanger LM: Langmarksvej RN: Rosborg Gymnasium North extension RS: Rosborg Gymnasium South extension TRT: Thermal Response Test TSA: Temperature Sensors Array
Alberdi-Pagola et. al (2017) DCE Technical Report No. 234 Thermal property measurements of soil and concrete samples
8
1. Introduction Centrum Pæle A/S, Aalborg University, VIA University College and INSERO Horsens are partners in an industrial PhD project dealing with quadratic cross section pile heat exchangers. This document presents the fieldwork undertaken in the project at two test sites in Denmark: one in Horsens and another in Vejle. The tasks have been carried out between January 2014 and February 2016. The fieldwork consists mainly of several thermal response tests (TRT) of precast pile heat exchangers. Pile heat exchangers, also known as energy piles, are thermo-active ground structures that utilize reinforced concrete foundation piles as vertical closed-loop heat exchangers. The interpretation of the in-situ TRT yields the effective thermal conductivity of the ground λs [W/m/K] and the borehole or pile thermal resistance Rb [K·m/W]. These estimated thermal parameters form the basis for dimensioning a planned ground source heat pump installation based on closed loop vertical ground heat exchangers. However, this report does not cover topics related to the interpretation of TRT data. The report is organized as follows: first, the concept of TRT is explained. Second, the test sites are described. Third, the field work is presented and a summary of the future work regarding the methodology to treat the data from the tests is provided. Finally, further documentation of the fieldwork, the pile heat exchangers and the TRT equipment is extended in diverse appendices.
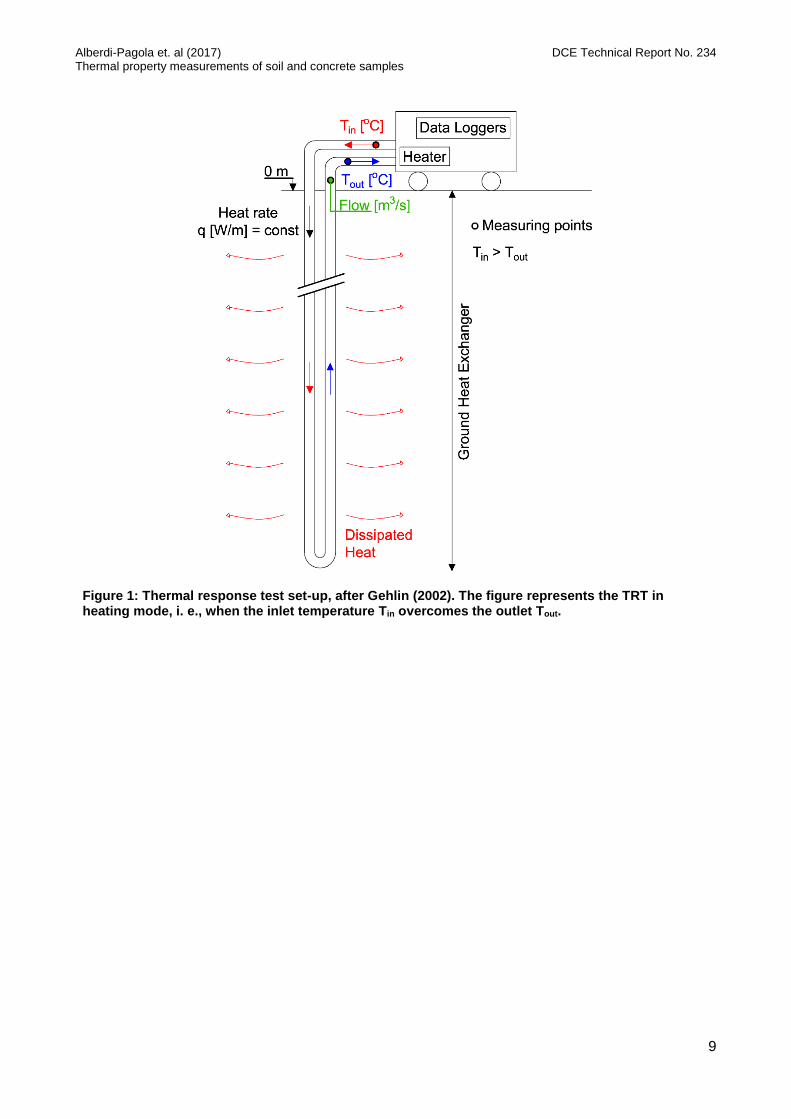
2. Thermal response testing Thermal response testing (TRT) is a widely used field method for estimating soil thermal conductivity λs [W/m/K] and thermal resistance of traditional borehole heat exchangers (BHE) Rb [K·m/W] (Mogensen P., 1983, Gehlin, 2002). In the TRT, the heat carrier fluid (water) is circulated in the GHE at a specified rate while being continuously warmed by a heater. Heat dissipates to the GHE and subsequently to the ground, and records of the fluid inlet- and outlet temperatures, the fluid flow rate and energy consumption are compiled every 10 minutes during the test (for at least 48 hours). Ambient temperatures inside and outside the TRT equipment are also recorded during the test. Figure 1 illustrates the TRT set-up. The thermal conductivity of the ground λs and the GHE thermal resistance Rb are estimated in the interpretation of the measured heat carrier fluid inlet and outlet temperatures. The thermal conductivity of the ground λs is a measure of the ease with which the soil conducts heat. Heat is more easily extracted from highly conductive soils and such soils recuperate more rapidly from thermal depletion. The interpretation of the TRT yields an average soil thermal conductivity over the length of the GHE. It is not possible, in the interpretation, to distinguish individual soil layers unless a Distributed TRT is performed (Acuña et al., 2009). The presence of groundwater flow increases the effective thermal conductivity of the ground. The GHE thermal resistance Rb is the integrated thermal resistance between the heat carrier fluid and the ground. As such, the piping, the flow rate and regime, heat exchanger configuration, grout and GHE diameter influence the GHE thermal resistance Rb. It should be as low as possible to facilitate the heat transfer. The analytical infinite line source approach is a standard method for analysing TRT of traditional vertical borehole heat exchangers (ASHRAE, 2011). However, there is a lack of scientifically supported guidelines for analysing TRT data from energy piles (Loveridge, 2012, GSHP Association, 2012). The quadratic cross section precast piles do not fulfil the basic geometrical assumptions for vertical ground heat exchangers and, therefore, novel approaches that better characterize the heat transfer in and around such structures are required.
Alberdi-Pagola et. al (2017) DCE Technical Report No. 234 Thermal property measurements of soil and concrete samples
9
Figure 1: Thermal response test set-up, after Gehlin (2002). The figure represents the TRT in heating mode, i. e., when the inlet temperature Tin overcomes the outlet Tout.
Alberdi-Pagola et. al (2017) DCE Technical Report No. 234 Thermal property measurements of soil and concrete samples
10
3. Test sites In the following, the two test sites will be described in terms of geology and types of GHEs.
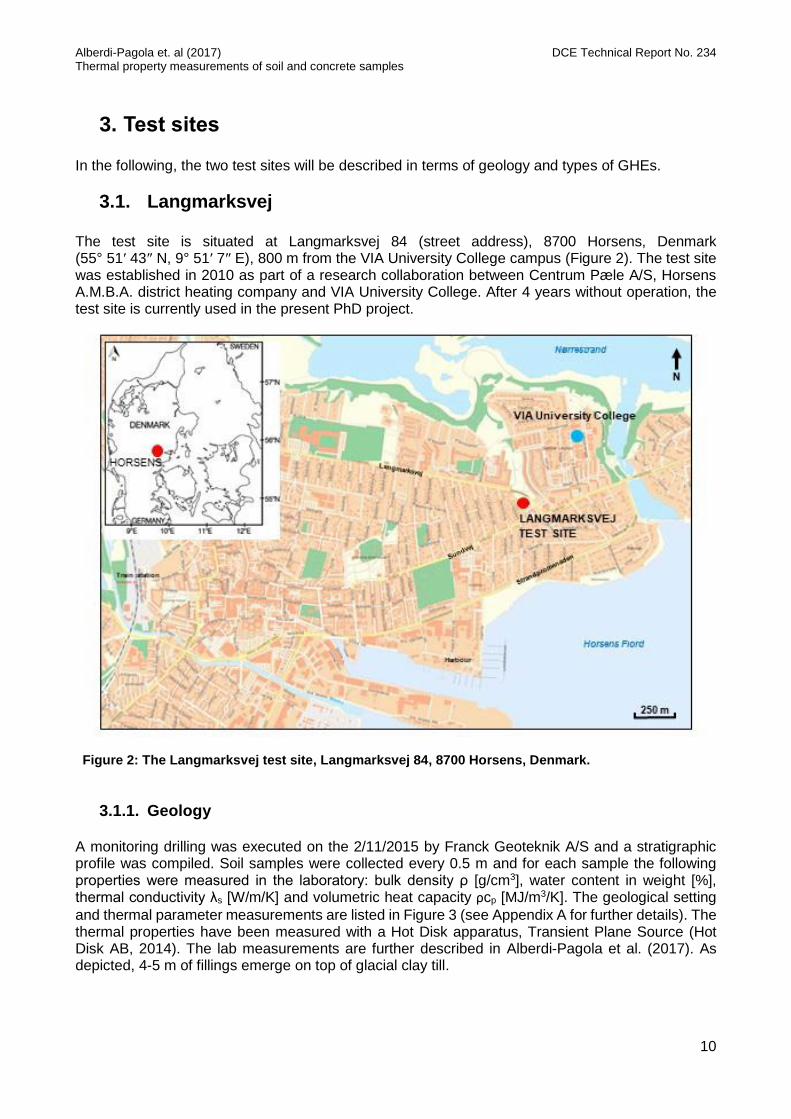
3.1. Langmarksvej The test site is situated at Langmarksvej 84 (street address), 8700 Horsens, Denmark (55° 51′ 43″ N, 9° 51′ 7″ E), 800 m from the VIA University College campus (Figure 2). The test site was established in 2010 as part of a research collaboration between Centrum Pæle A/S, Horsens A.M.B.A. district heating company and VIA University College. After 4 years without operation, the test site is currently used in the present PhD project.
Figure 2: The Langmarksvej test site, Langmarksvej 84, 8700 Horsens, Denmark.
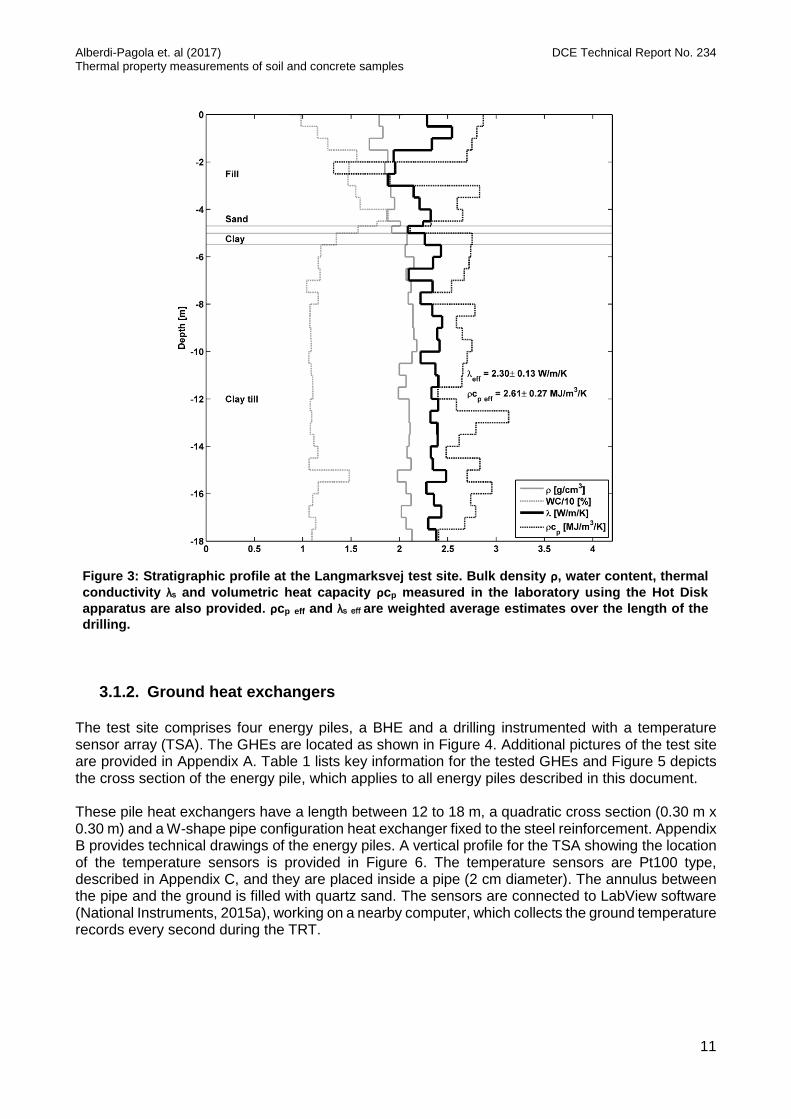
3.1.1. Geology A monitoring drilling was executed on the 2/11/2015 by Franck Geoteknik A/S and a stratigraphic profile was compiled. Soil samples were collected every 0.5 m and for each sample the following properties were measured in the laboratory: bulk density ρ [g/cm3], water content in weight [%], thermal conductivity λs [W/m/K] and volumetric heat capacity ρcp [MJ/m3/K]. The geological setting
and thermal parameter measurements are listed in Figure 3 (see Appendix A for further details). The thermal properties have been measured with a Hot Disk apparatus, Transient Plane Source (Hot Disk AB, 2014). The lab measurements are further described in Alberdi-Pagola et al. (2017). As depicted, 4-5 m of fillings emerge on top of glacial clay till.
Alberdi-Pagola et. al (2017) DCE Technical Report No. 234 Thermal property measurements of soil and concrete samples
11
Figure 3: Stratigraphic profile at the Langmarksvej test site. Bulk density ρ, water content, thermal
conductivity λs and volumetric heat capacity ρcp measured in the laboratory using the Hot Disk
apparatus are also provided. ρcp eff and λs eff are weighted average estimates over the length of the
drilling.
3.1.2. Ground heat exchangers
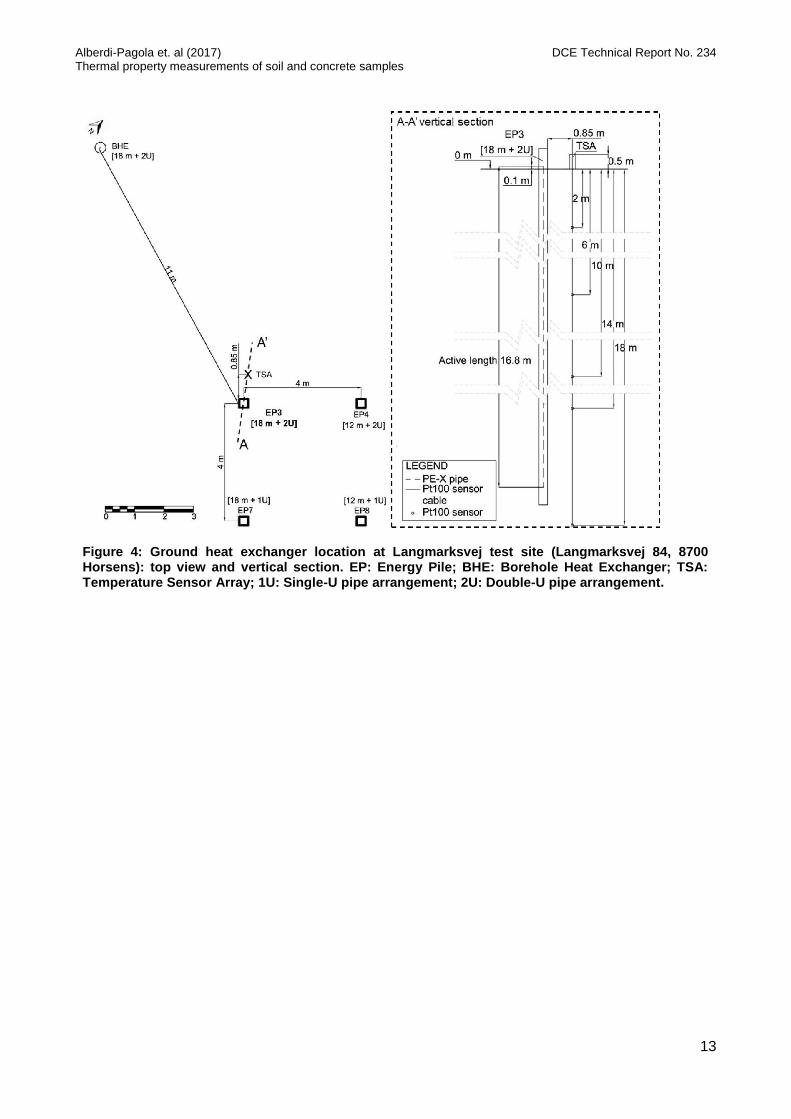
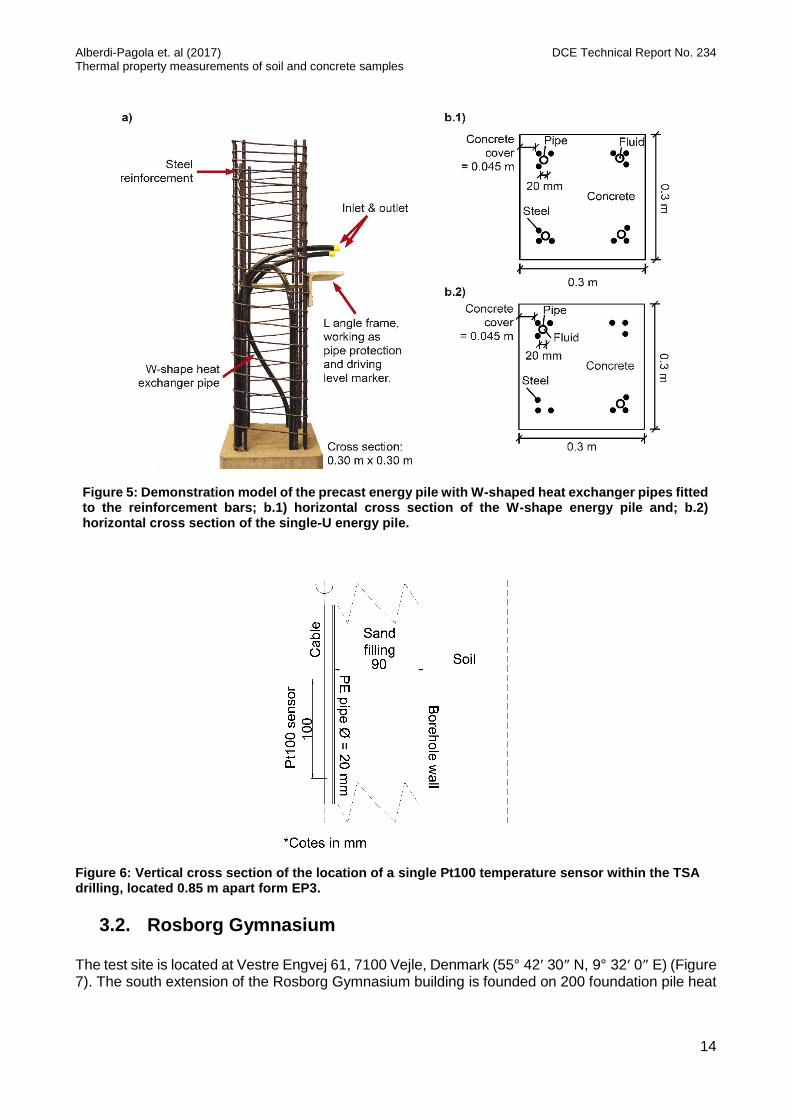
The test site comprises four energy piles, a BHE and a drilling instrumented with a temperature sensor array (TSA). The GHEs are located as shown in Figure 4. Additional pictures of the test site are provided in Appendix A. Table 1 lists key information for the tested GHEs and Figure 5 depicts the cross section of the energy pile, which applies to all energy piles described in this document. These pile heat exchangers have a length between 12 to 18 m, a quadratic cross section (0.30 m x 0.30 m) and a W-shape pipe configuration heat exchanger fixed to the steel reinforcement. Appendix B provides technical drawings of the energy piles. A vertical profile for the TSA showing the location of the temperature sensors is provided in Figure 6. The temperature sensors are Pt100 type, described in Appendix C, and they are placed inside a pipe (2 cm diameter). The annulus between the pipe and the ground is filled with quartz sand. The sensors are connected to LabView software (National Instruments, 2015a), working on a nearby computer, which collects the ground temperature records every second during the TRT.
Alberdi-Pagola et. al (2017) DCE Technical Report No. 234 Thermal property measurements of soil and concrete samples
12
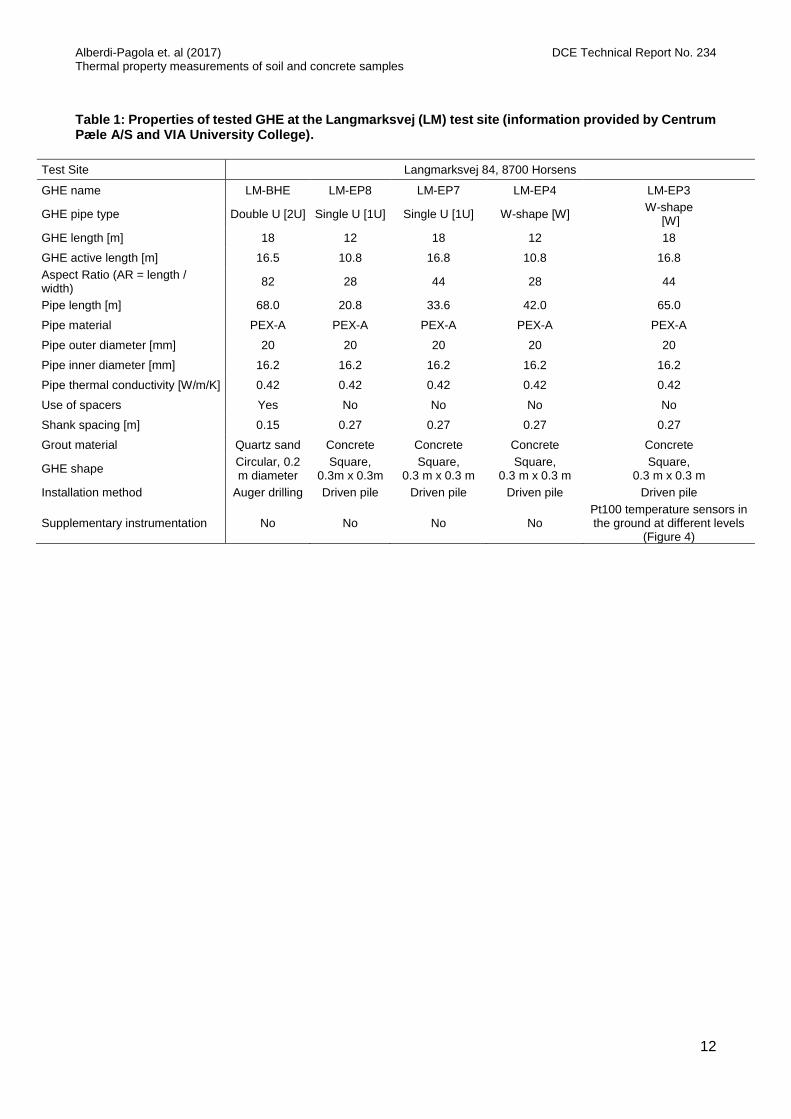
Table 1: Properties of tested GHE at the Langmarksvej (LM) test site (information provided by Centrum Pæle A/S and VIA University College).
Test Site Langmarksvej 84, 8700 Horsens
GHE name LM-BHE LM-EP8 LM-EP7 LM-EP4 LM-EP3
GHE pipe type Double U [2U] Single U [1U] Single U [1U] W-shape [W] W-shape
[W]
GHE length [m] 18 12 18 12 18
GHE active length [m] 16.5 10.8 16.8 10.8 16.8
Aspect Ratio (AR = length / width)
82 28 44 28 44
Pipe length [m] 68.0 20.8 33.6 42.0 65.0
Pipe material PEX-A PEX-A PEX-A PEX-A PEX-A
Pipe outer diameter [mm] 20 20 20 20 20
Pipe inner diameter [mm] 16.2 16.2 16.2 16.2 16.2
Pipe thermal conductivity [W/m/K] 0.42 0.42 0.42 0.42 0.42
Use of spacers Yes No No No No
Shank spacing [m] 0.15 0.27 0.27 0.27 0.27
Grout material Quartz sand Concrete Concrete Concrete Concrete
GHE shape Circular, 0.2 m diameter
Square, 0.3m x 0.3m
Square, 0.3 m x 0.3 m
Square, 0.3 m x 0.3 m
Square, 0.3 m x 0.3 m
Installation method Auger drilling Driven pile Driven pile Driven pile Driven pile
Supplementary instrumentation No No No No Pt100 temperature sensors in the ground at different levels
(Figure 4)
Alberdi-Pagola et. al (2017) DCE Technical Report No. 234 Thermal property measurements of soil and concrete samples
13
Figure 4: Ground heat exchanger location at Langmarksvej test site (Langmarksvej 84, 8700 Horsens): top view and vertical section. EP: Energy Pile; BHE: Borehole Heat Exchanger; TSA: Temperature Sensor Array; 1U: Single-U pipe arrangement; 2U: Double-U pipe arrangement.
Alberdi-Pagola et. al (2017) DCE Technical Report No. 234 Thermal property measurements of soil and concrete samples
14
Figure 5: Demonstration model of the precast energy pile with W-shaped heat exchanger pipes fitted to the reinforcement bars; b.1) horizontal cross section of the W-shape energy pile and; b.2) horizontal cross section of the single-U energy pile.
Figure 6: Vertical cross section of the location of a single Pt100 temperature sensor within the TSA drilling, located 0.85 m apart form EP3.
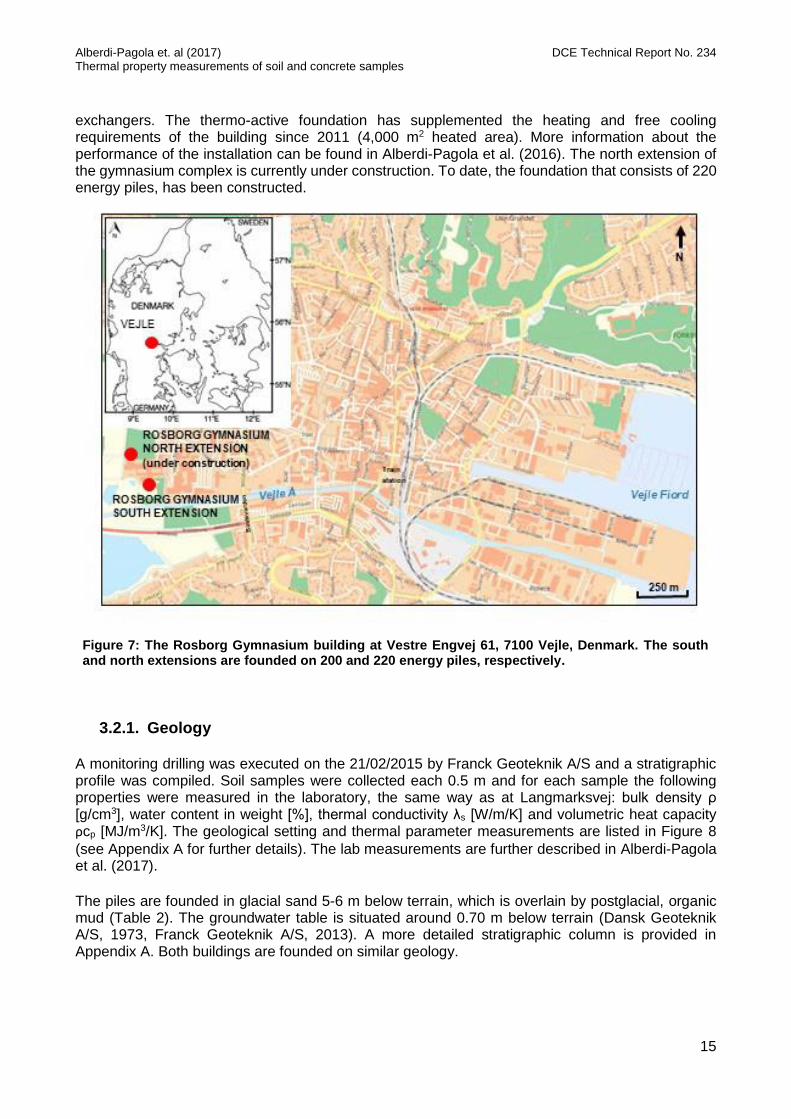
3.2. Rosborg Gymnasium The test site is located at Vestre Engvej 61, 7100 Vejle, Denmark (55° 42′ 30″ N, 9° 32′ 0″ E) (Figure 7). The south extension of the Rosborg Gymnasium building is founded on 200 foundation pile heat
Alberdi-Pagola et. al (2017) DCE Technical Report No. 234 Thermal property measurements of soil and concrete samples
15
exchangers. The thermo-active foundation has supplemented the heating and free cooling requirements of the building since 2011 (4,000 m2 heated area). More information about the performance of the installation can be found in Alberdi-Pagola et al. (2016). The north extension of the gymnasium complex is currently under construction. To date, the foundation that consists of 220 energy piles, has been constructed.
Figure 7: The Rosborg Gymnasium building at Vestre Engvej 61, 7100 Vejle, Denmark. The south and north extensions are founded on 200 and 220 energy piles, respectively.
3.2.1. Geology A monitoring drilling was executed on the 21/02/2015 by Franck Geoteknik A/S and a stratigraphic profile was compiled. Soil samples were collected each 0.5 m and for each sample the following properties were measured in the laboratory, the same way as at Langmarksvej: bulk density ρ [g/cm3], water content in weight [%], thermal conductivity λs [W/m/K] and volumetric heat capacity ρcp [MJ/m3/K]. The geological setting and thermal parameter measurements are listed in Figure 8
(see Appendix A for further details). The lab measurements are further described in Alberdi-Pagola et al. (2017).
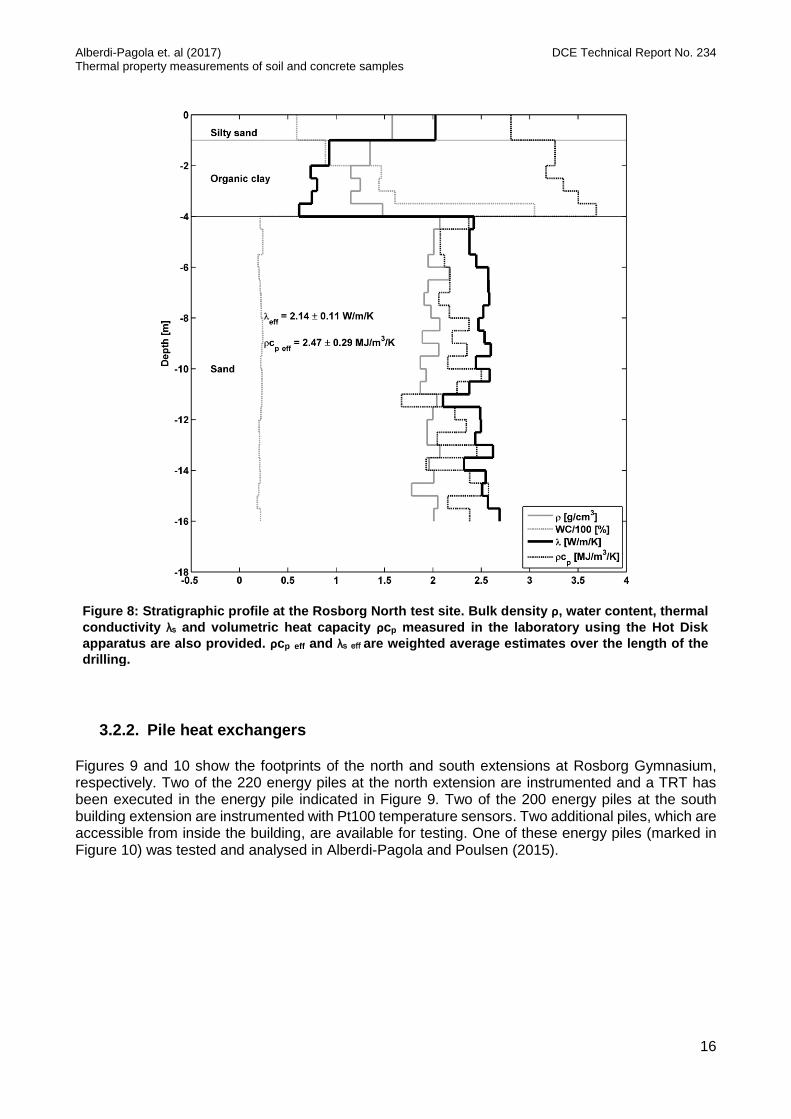
The piles are founded in glacial sand 5-6 m below terrain, which is overlain by postglacial, organic mud (Table 2). The groundwater table is situated around 0.70 m below terrain (Dansk Geoteknik A/S, 1973, Franck Geoteknik A/S, 2013). A more detailed stratigraphic column is provided in Appendix A. Both buildings are founded on similar geology.
Alberdi-Pagola et. al (2017) DCE Technical Report No. 234 Thermal property measurements of soil and concrete samples
16
Figure 8: Stratigraphic profile at the Rosborg North test site. Bulk density ρ, water content, thermal
conductivity λs and volumetric heat capacity ρcp measured in the laboratory using the Hot Disk
apparatus are also provided. ρcp eff and λs eff are weighted average estimates over the length of the
drilling.
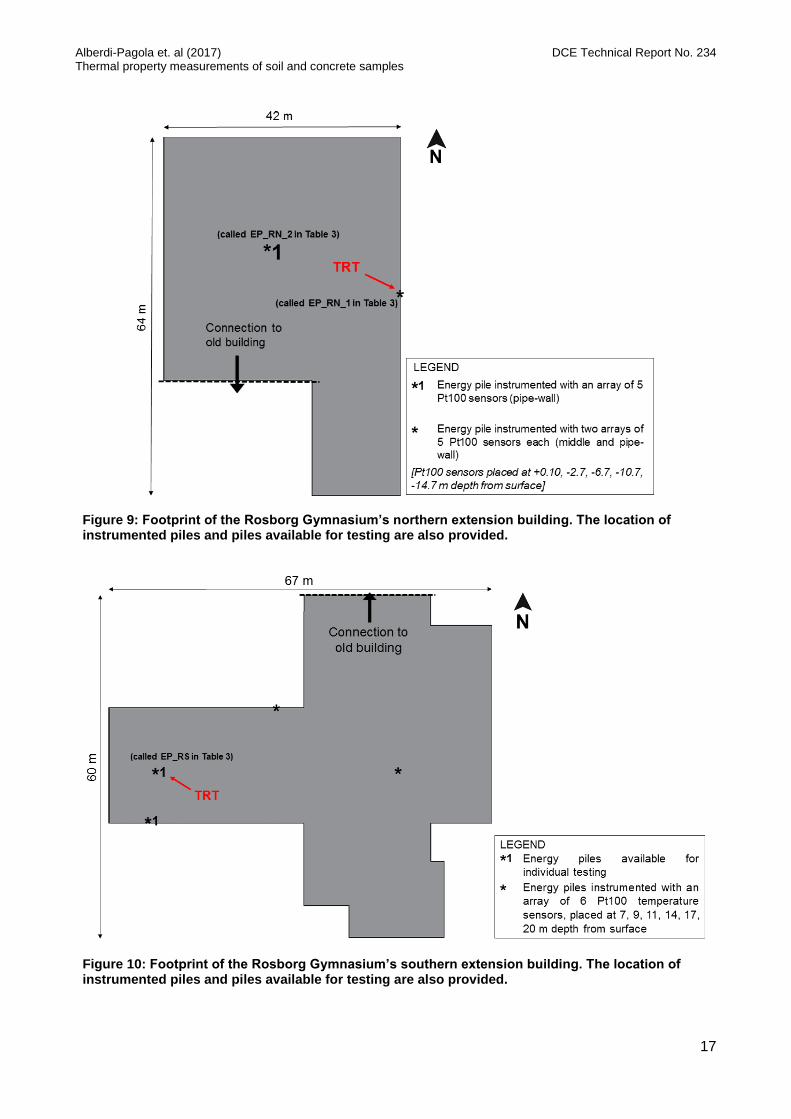
3.2.2. Pile heat exchangers Figures 9 and 10 show the footprints of the north and south extensions at Rosborg Gymnasium, respectively. Two of the 220 energy piles at the north extension are instrumented and a TRT has been executed in the energy pile indicated in Figure 9. Two of the 200 energy piles at the south building extension are instrumented with Pt100 temperature sensors. Two additional piles, which are accessible from inside the building, are available for testing. One of these energy piles (marked in Figure 10) was tested and analysed in Alberdi-Pagola and Poulsen (2015).
Alberdi-Pagola et. al (2017) DCE Technical Report No. 234 Thermal property measurements of soil and concrete samples
17
Figure 9: Footprint of the Rosborg Gymnasium’s northern extension building. The location of instrumented piles and piles available for testing are also provided.
Figure 10: Footprint of the Rosborg Gymnasium’s southern extension building. The location of instrumented piles and piles available for testing are also provided.
Alberdi-Pagola et. al (2017) DCE Technical Report No. 234 Thermal property measurements of soil and concrete samples
18
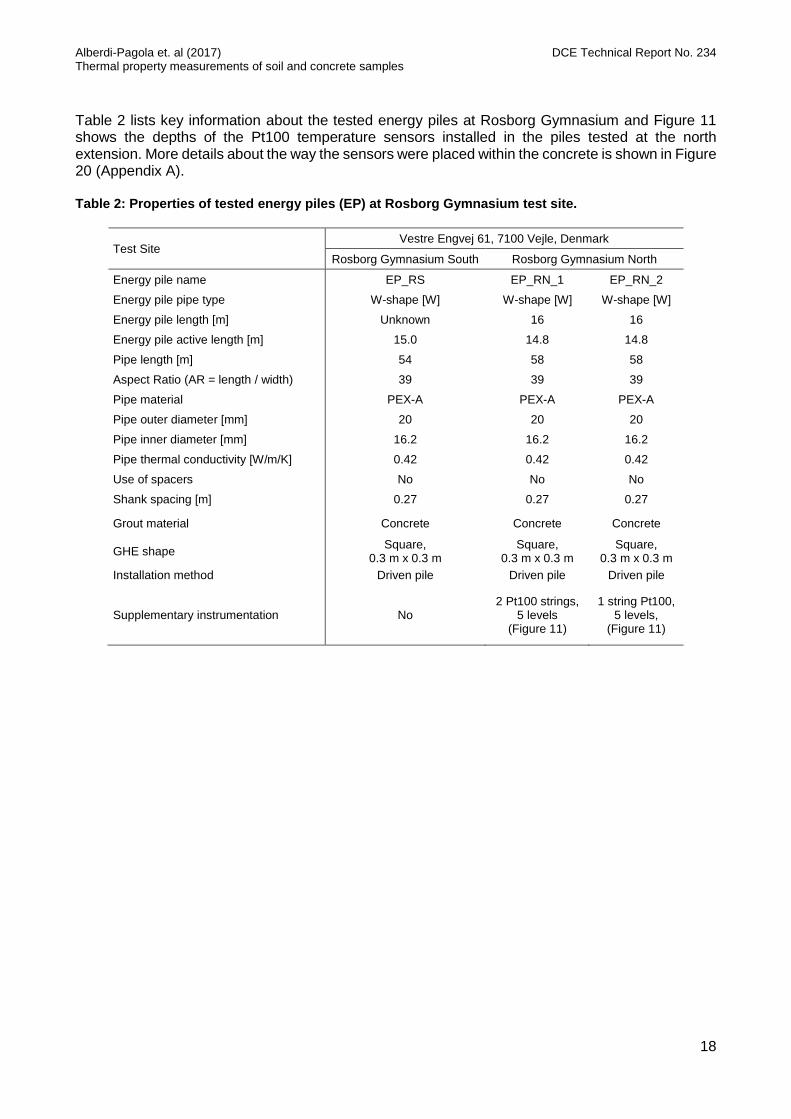
Table 2 lists key information about the tested energy piles at Rosborg Gymnasium and Figure 11 shows the depths of the Pt100 temperature sensors installed in the piles tested at the north extension. More details about the way the sensors were placed within the concrete is shown in Figure 20 (Appendix A). Table 2: Properties of tested energy piles (EP) at Rosborg Gymnasium test site.
Test Site Vestre Engvej 61, 7100 Vejle, Denmark
Rosborg Gymnasium South Rosborg Gymnasium North
Energy pile name EP_RS EP_RN_1 EP_RN_2
Energy pile pipe type W-shape [W] W-shape [W] W-shape [W]
Energy pile length [m] Unknown 16 16
Energy pile active length [m] 15.0 14.8 14.8
Pipe length [m] 54 58 58
Aspect Ratio (AR = length / width) 39 39 39
Pipe material PEX-A PEX-A PEX-A
Pipe outer diameter [mm] 20 20 20
Pipe inner diameter [mm] 16.2 16.2 16.2
Pipe thermal conductivity [W/m/K] 0.42 0.42 0.42
Use of spacers No No No
Shank spacing [m] 0.27 0.27 0.27
Grout material Concrete Concrete Concrete
GHE shape Square,
0.3 m x 0.3 m Square,
0.3 m x 0.3 m Square,
0.3 m x 0.3 m
Installation method Driven pile Driven pile Driven pile
Supplementary instrumentation No 2 Pt100 strings,
5 levels (Figure 11)
1 string Pt100, 5 levels,
(Figure 11)
Alberdi-Pagola et. al (2017) DCE Technical Report No. 234 Thermal property measurements of soil and concrete samples
19
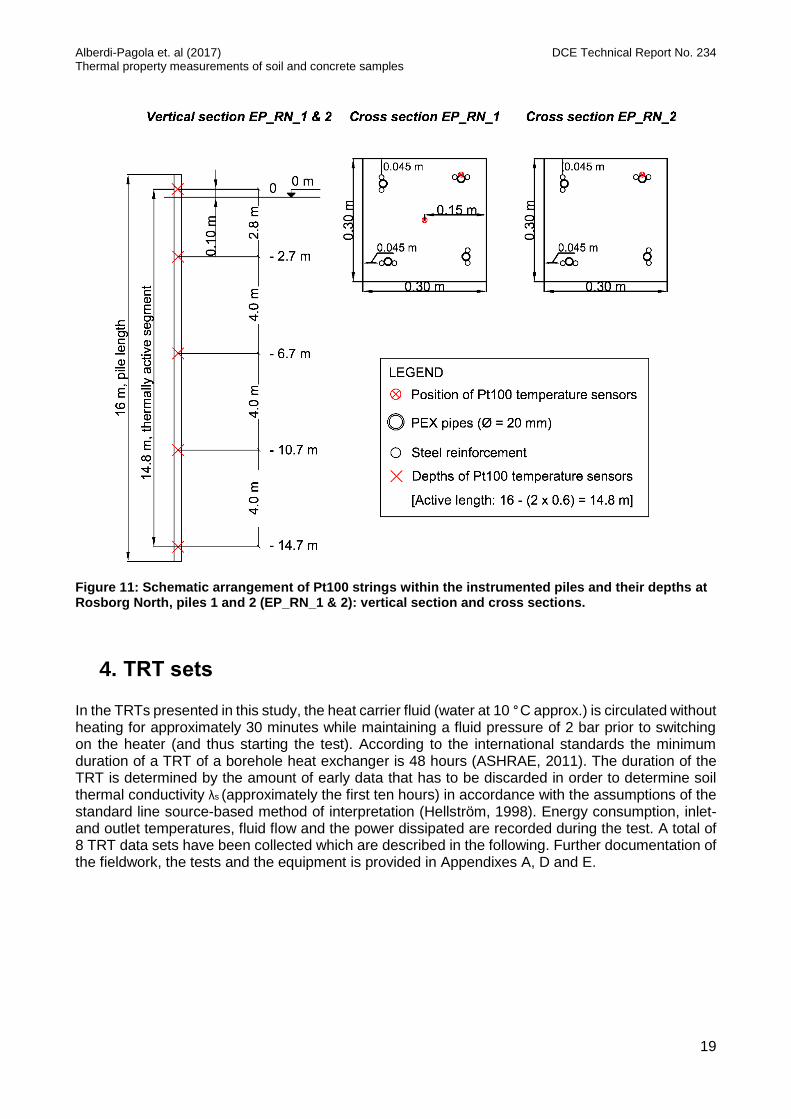
Figure 11: Schematic arrangement of Pt100 strings within the instrumented piles and their depths at Rosborg North, piles 1 and 2 (EP_RN_1 & 2): vertical section and cross sections.
4. TRT sets In the TRTs presented in this study, the heat carrier fluid (water at 10 °C approx.) is circulated without heating for approximately 30 minutes while maintaining a fluid pressure of 2 bar prior to switching on the heater (and thus starting the test). According to the international standards the minimum duration of a TRT of a borehole heat exchanger is 48 hours (ASHRAE, 2011). The duration of the TRT is determined by the amount of early data that has to be discarded in order to determine soil thermal conductivity λs (approximately the first ten hours) in accordance with the assumptions of the standard line source-based method of interpretation (Hellström, 1998). Energy consumption, inlet- and outlet temperatures, fluid flow and the power dissipated are recorded during the test. A total of 8 TRT data sets have been collected which are described in the following. Further documentation of the fieldwork, the tests and the equipment is provided in Appendixes A, D and E.
Alberdi-Pagola et. al (2017) DCE Technical Report No. 234 Thermal property measurements of soil and concrete samples
20
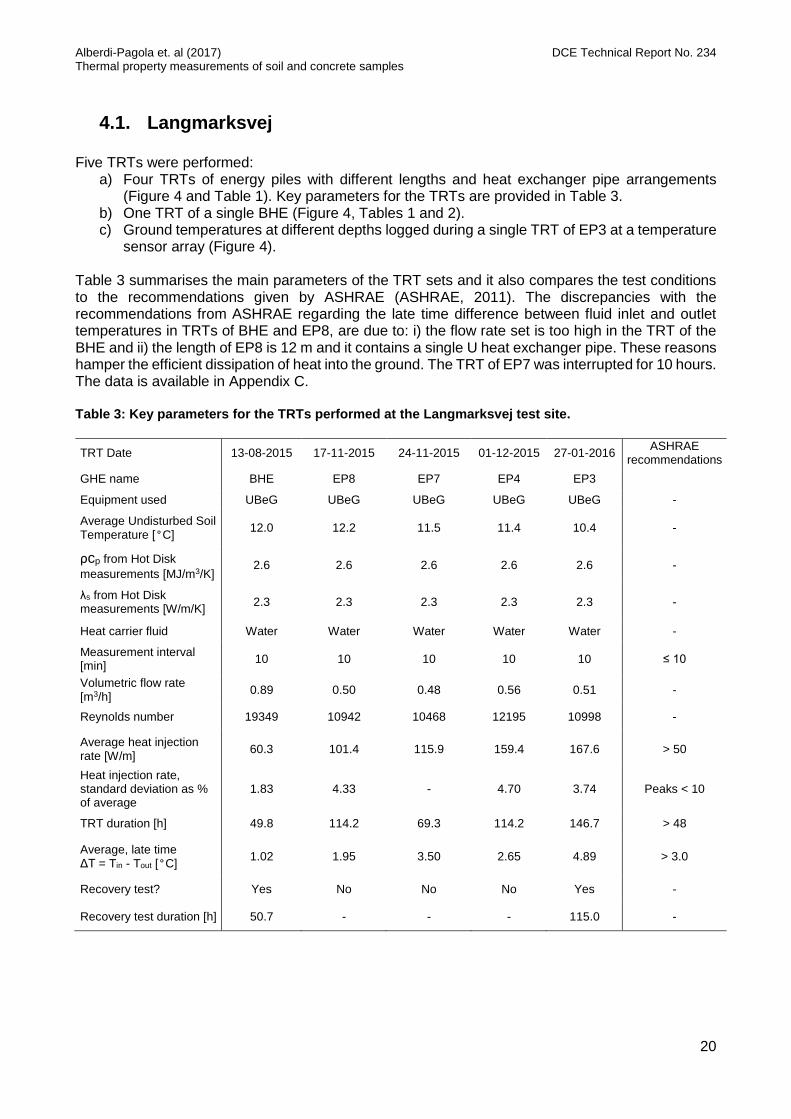
4.1. Langmarksvej Five TRTs were performed:
a) Four TRTs of energy piles with different lengths and heat exchanger pipe arrangements (Figure 4 and Table 1). Key parameters for the TRTs are provided in Table 3.
b) One TRT of a single BHE (Figure 4, Tables 1 and 2). c) Ground temperatures at different depths logged during a single TRT of EP3 at a temperature
sensor array (Figure 4). Table 3 summarises the main parameters of the TRT sets and it also compares the test conditions to the recommendations given by ASHRAE (ASHRAE, 2011). The discrepancies with the recommendations from ASHRAE regarding the late time difference between fluid inlet and outlet temperatures in TRTs of BHE and EP8, are due to: i) the flow rate set is too high in the TRT of the BHE and ii) the length of EP8 is 12 m and it contains a single U heat exchanger pipe. These reasons hamper the efficient dissipation of heat into the ground. The TRT of EP7 was interrupted for 10 hours. The data is available in Appendix C. Table 3: Key parameters for the TRTs performed at the Langmarksvej test site.
TRT Date 13-08-2015 17-11-2015 24-11-2015 01-12-2015 27-01-2016 ASHRAE
recommendations
GHE name BHE EP8 EP7 EP4 EP3
Equipment used UBeG UBeG UBeG UBeG UBeG -
Average Undisturbed Soil Temperature [°C]
12.0 12.2 11.5 11.4 10.4 -
ρcp from Hot Disk
measurements [MJ/m3/K] 2.6 2.6 2.6 2.6 2.6 -
λs from Hot Disk measurements [W/m/K]
2.3 2.3 2.3 2.3 2.3 -
Heat carrier fluid Water Water Water Water Water -
Measurement interval [min]
10 10 10 10 10 ≤ 10
Volumetric flow rate [m3/h]
0.89 0.50 0.48 0.56 0.51 -
Reynolds number 19349 10942 10468 12195 10998 -
Average heat injection rate [W/m]
60.3 101.4 115.9 159.4 167.6 > 50
Heat injection rate, standard deviation as % of average
1.83 4.33 - 4.70 3.74 Peaks < 10
TRT duration [h] 49.8 114.2 69.3 114.2 146.7 > 48
Average, late time ΔT = Tin - Tout [°C]
1.02 1.95 3.50 2.65 4.89 > 3.0
Recovery test? Yes No No No Yes -
Recovery test duration [h] 50.7 - - - 115.0 -
Alberdi-Pagola et. al (2017) DCE Technical Report No. 234 Thermal property measurements of soil and concrete samples
21
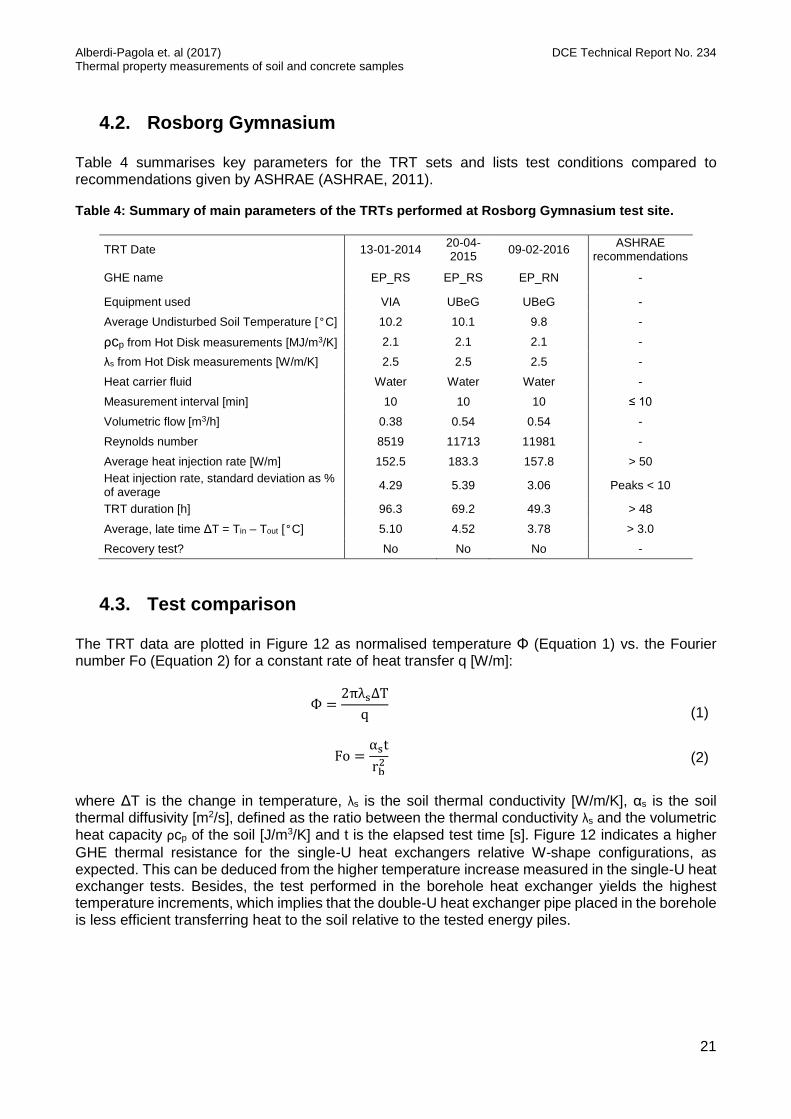
4.2. Rosborg Gymnasium Table 4 summarises key parameters for the TRT sets and lists test conditions compared to recommendations given by ASHRAE (ASHRAE, 2011). Table 4: Summary of main parameters of the TRTs performed at Rosborg Gymnasium test site.
TRT Date 13-01-2014 20-04-2015
09-02-2016 ASHRAE
recommendations
GHE name EP_RS EP_RS EP_RN -
Equipment used VIA UBeG UBeG -
Average Undisturbed Soil Temperature [°C] 10.2 10.1 9.8 -
ρcp from Hot Disk measurements [MJ/m3/K] 2.1 2.1 2.1 -
λs from Hot Disk measurements [W/m/K] 2.5 2.5 2.5 -
Heat carrier fluid Water Water Water -
Measurement interval [min] 10 10 10 ≤ 10
Volumetric flow [m3/h] 0.38 0.54 0.54 -
Reynolds number 8519 11713 11981 -
Average heat injection rate [W/m] 152.5 183.3 157.8 > 50
Heat injection rate, standard deviation as % of average
4.29 5.39 3.06 Peaks < 10
TRT duration [h] 96.3 69.2 49.3 > 48
Average, late time ΔT = Tin – Tout [°C] 5.10 4.52 3.78 > 3.0
Recovery test? No No No -
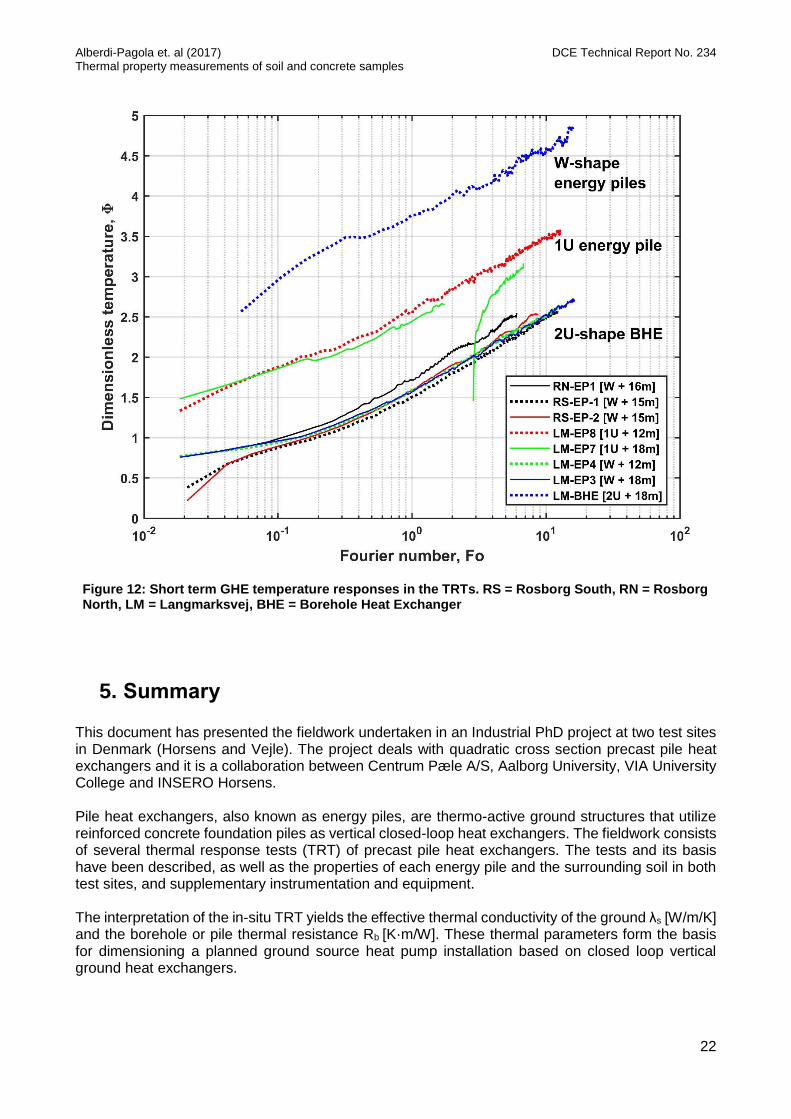
4.3. Test comparison The TRT data are plotted in Figure 12 as normalised temperature Φ (Equation 1) vs. the Fourier number Fo (Equation 2) for a constant rate of heat transfer q [W/m]:
Ф =2πλs∆T
q
(1)
Fo =αst
rb2 (2)
where ΔT is the change in temperature, λs is the soil thermal conductivity [W/m/K], αs is the soil thermal diffusivity [m2/s], defined as the ratio between the thermal conductivity λs and the volumetric heat capacity ρcp of the soil [J/m3/K] and t is the elapsed test time [s]. Figure 12 indicates a higher
GHE thermal resistance for the single-U heat exchangers relative W-shape configurations, as expected. This can be deduced from the higher temperature increase measured in the single-U heat exchanger tests. Besides, the test performed in the borehole heat exchanger yields the highest temperature increments, which implies that the double-U heat exchanger pipe placed in the borehole is less efficient transferring heat to the soil relative to the tested energy piles.
Alberdi-Pagola et. al (2017) DCE Technical Report No. 234 Thermal property measurements of soil and concrete samples
22
Figure 12: Short term GHE temperature responses in the TRTs. RS = Rosborg South, RN = Rosborg North, LM = Langmarksvej, BHE = Borehole Heat Exchanger
5. Summary This document has presented the fieldwork undertaken in an Industrial PhD project at two test sites in Denmark (Horsens and Vejle). The project deals with quadratic cross section precast pile heat exchangers and it is a collaboration between Centrum Pæle A/S, Aalborg University, VIA University College and INSERO Horsens. Pile heat exchangers, also known as energy piles, are thermo-active ground structures that utilize reinforced concrete foundation piles as vertical closed-loop heat exchangers. The fieldwork consists of several thermal response tests (TRT) of precast pile heat exchangers. The tests and its basis have been described, as well as the properties of each energy pile and the surrounding soil in both test sites, and supplementary instrumentation and equipment. The interpretation of the in-situ TRT yields the effective thermal conductivity of the ground λs [W/m/K] and the borehole or pile thermal resistance Rb [K·m/W]. These thermal parameters form the basis for dimensioning a planned ground source heat pump installation based on closed loop vertical ground heat exchangers.
Alberdi-Pagola et. al (2017) DCE Technical Report No. 234 Thermal property measurements of soil and concrete samples
23
The future work will be focused on the analysis and interpretation of the recorded field data to verify models for quadratic cross section energy piles. The scientific objectives are: - To validate existing and novel, short run-time analytical and numerical models of the thermal
behaviour of quadratic heat exchanger pile (2D - 3D implications).
- Based on the validated models, to investigate the feasibility of TRT methods for energy pile
applications. Particular attention will be paid to the estimation of soil thermal conductivity λs
[W/m/K] and pile thermal resistance Rb [K·m/W].
- To provide recommendations regarding interpretation methods, testing times and likely
uncertainties for quadratic pile TRTs.
6. Acknowledgements We kindly thank the following financial partners: Centrum Pæle A/S, INSERO Horsens and Innovationsfonden Denmark. We express our deep gratitude to Hicham Johra for his advice and to Rosborg Gymnasium & HF and to HKV Horsens for facilitating access to their installations.
7. References ACUÑA, J., MOGENSEN, P. & PALM, B., 2009. Distributed thermal response test on a U-pipe borehole heat exchanger. Effstock 2009, 11th International Conference on Thermal Energy Storage, Stockholm, June 14-17 2009. Academic Conferences Publishing. ALBERDI-PAGOLA, M., JENSEN, R. L., MADSEN, S. & POULSEN, S. E. 2017. Measurement of thermal properties of soil and concrete samples In: AALBORG UNIVERSITY, D. O. C. E. (ed.). Aalborg, Denmark: Aalborg University. ALBERDI-PAGOLA, M., JENSEN, R. L. & POULSEN, S. E., 2016. A performance case study of energy pile foundation at Rosborg Gymnasium (Denmark). 12th REHVA World Congress Clima2016, 22-25 May 2016 Aalborg, Denmark. p. 10 (accepted). ALBERDI-PAGOLA, M. & POULSEN, S. E., 2015. Thermal response testing and performance of quadratic cross section energy piles (Vejle, Denmark). XVI European Conference on Soil Mechanics and Geotechnical Engineering 2015. Edinburgh, United Kingdom: ICE Institution of Civil Engineers. ASHRAE, 2011. 2011 ASHRAE Handbook - Heating, Ventilating, and Air-Conditioning Applications (SI Edition). American Society of Heating, Refrigerating and Air-Conditioning Engineers, Inc. DANSK GEOTEKNIK A/S, 1973. Geoteknisk rapport. Grundundersøgelser for Amtsgymnasium i Vejle, Vestre Engvej, Vejle. DANSK STANDARD, 2008. DS/EN 60751: Industrial platinum resistance thermometers and platinum temperature sensors. FRANCK GEOTEKNIK A/S, 2013. Geoteknisk rapport, parameterundersøgelse. Rosborg Gymnasium, Vestre Engvej 61, Vejle. Ny Nordfløj. GEHLIN, S., 2002. Thermal Response Test. Method Development and Evaluation. Doctor of Philosophy, Luleå University of Technology.
Alberdi-Pagola et. al (2017) DCE Technical Report No. 234 Thermal property measurements of soil and concrete samples
24
GSHP ASSOCIATION, 2012. Thermal Pile: Design, Installation & Materials Standards. National Energy Centre, Davy Avenue, Knowlhill, Milton Keynes: Ground Source Heat Pump Association. HAMID, A., 2004. F200 Calibration Certificate. In: LABORATORIES, A. S. HELLSTRÖM, G., 1998. Thermal Performance of Borehole Heat Exchangers. Swedish Council for Building Research (BFR). HOT DISK AB, 2014. Hot Disk Thermal Constants Analyser TPS 1500 unit, Intruction Manual. ISOTHERMAL TECHNOLOGY 2000. Venus 2140: Evaluation Report LOVERIDGE, F., 2012. The thermal performance of foundation piles used as heat exchangers in ground energy systems. PhD Thesis, University of Southampton. MOGENSEN, P., 1983. Fluid to Duct Wall Heat Transfer in Duct System Heat Storage. Proc. Int. Conf. On Subsurface Heat Storage in Theory and Practice. 1983 Stockholm. Sweden, June 6–8, 1983. Swedish Council for Building Research, PP: 652-657. NATIONAL INSTRUMENTS, 2015a. LabVIEW User Manual. NATIONAL INSTRUMENTS, 2015b. NI 9216 Datasheet. UBEG UMWELT BAUGRUND GEOTHERMIE GEOTECHNIK, 2013. Thermal Response Test Equipment Data. Germany. WHEELER, A. J. & GANJI, A. R., 2004. Introduction to Engineering Experimentation, Upper Saddle River, New Jersey 07458, USA, Pearson Education, Inc.
Alberdi-Pagola et. al (2017) DCE Technical Report No. 234 Thermal property measurements of soil and concrete samples
25
8. Appendices
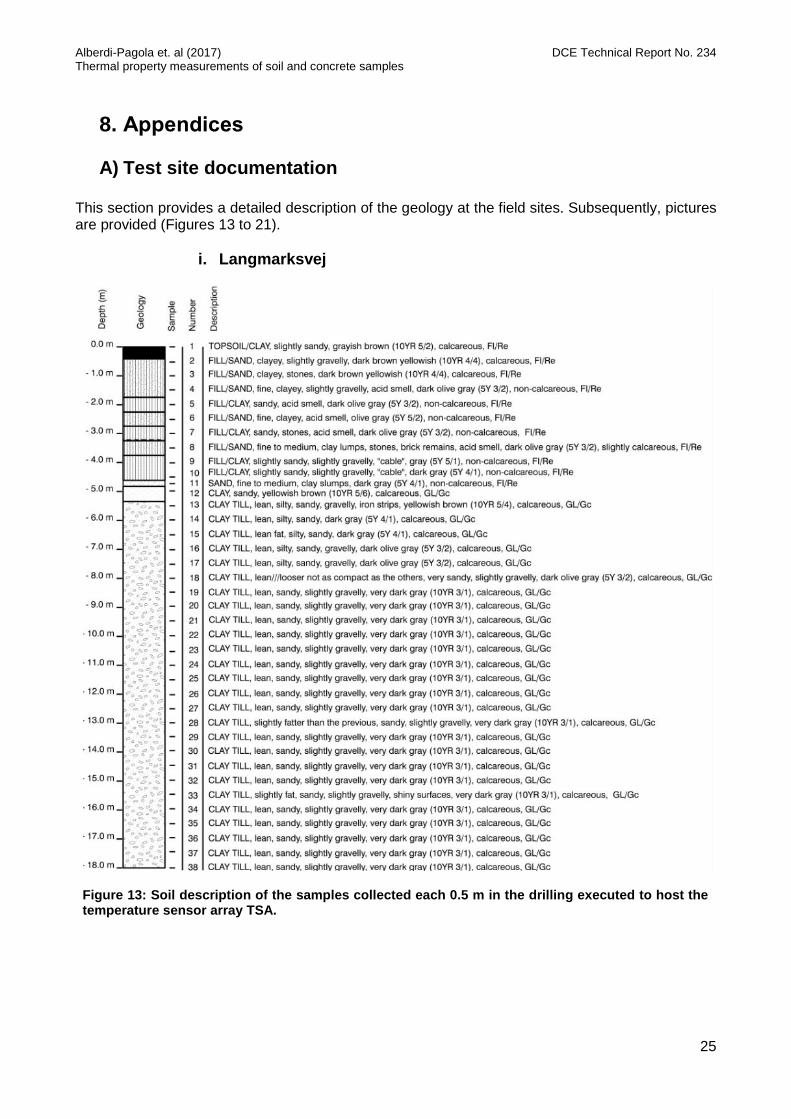
A) Test site documentation This section provides a detailed description of the geology at the field sites. Subsequently, pictures are provided (Figures 13 to 21).
i. Langmarksvej
Figure 13: Soil description of the samples collected each 0.5 m in the drilling executed to host the temperature sensor array TSA.
Alberdi-Pagola et. al (2017) DCE Technical Report No. 234 Thermal property measurements of soil and concrete samples
26
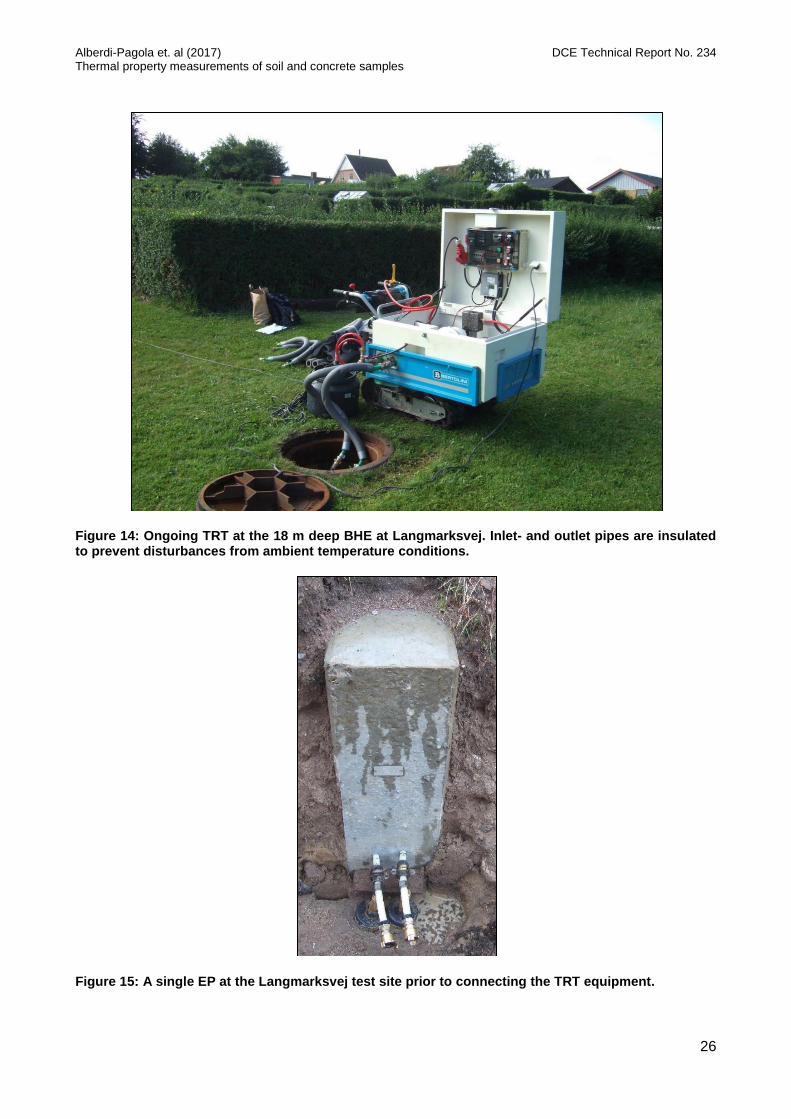
Figure 14: Ongoing TRT at the 18 m deep BHE at Langmarksvej. Inlet- and outlet pipes are insulated to prevent disturbances from ambient temperature conditions.
Figure 15: A single EP at the Langmarksvej test site prior to connecting the TRT equipment.
Alberdi-Pagola et. al (2017) DCE Technical Report No. 234 Thermal property measurements of soil and concrete samples
27
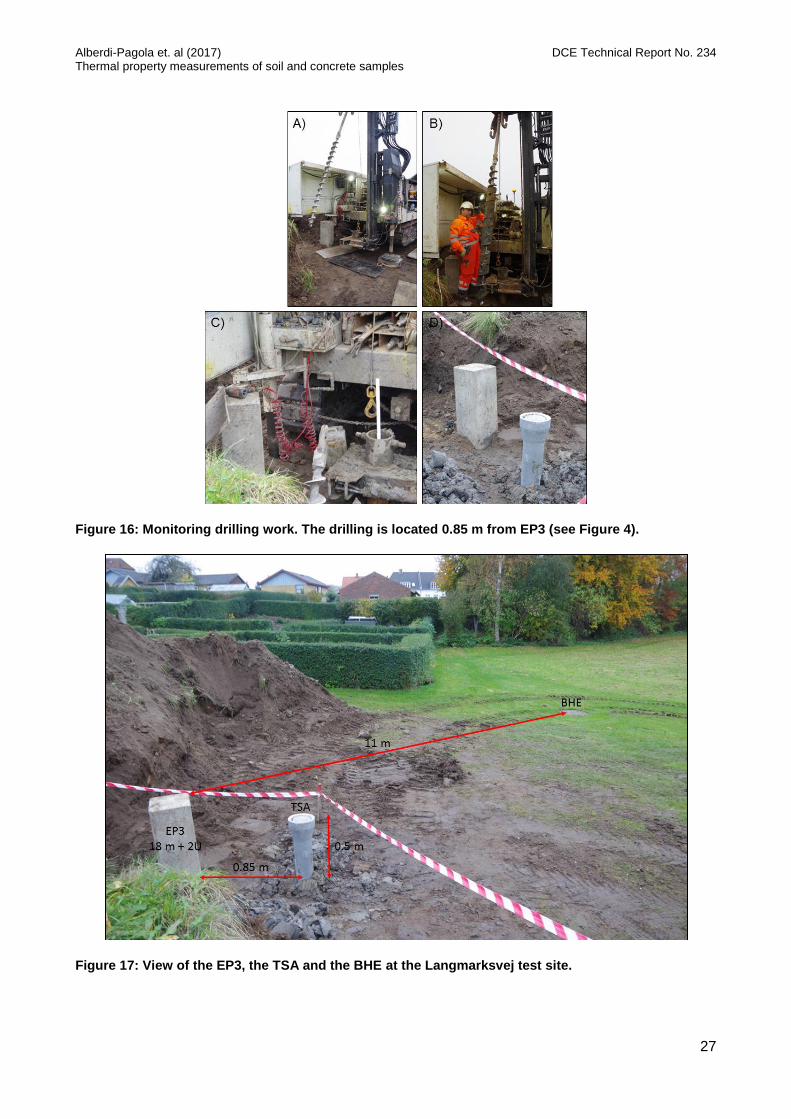
Figure 16: Monitoring drilling work. The drilling is located 0.85 m from EP3 (see Figure 4).
Figure 17: View of the EP3, the TSA and the BHE at the Langmarksvej test site.
Alberdi-Pagola et. al (2017) DCE Technical Report No. 234 Thermal property measurements of soil and concrete samples
28
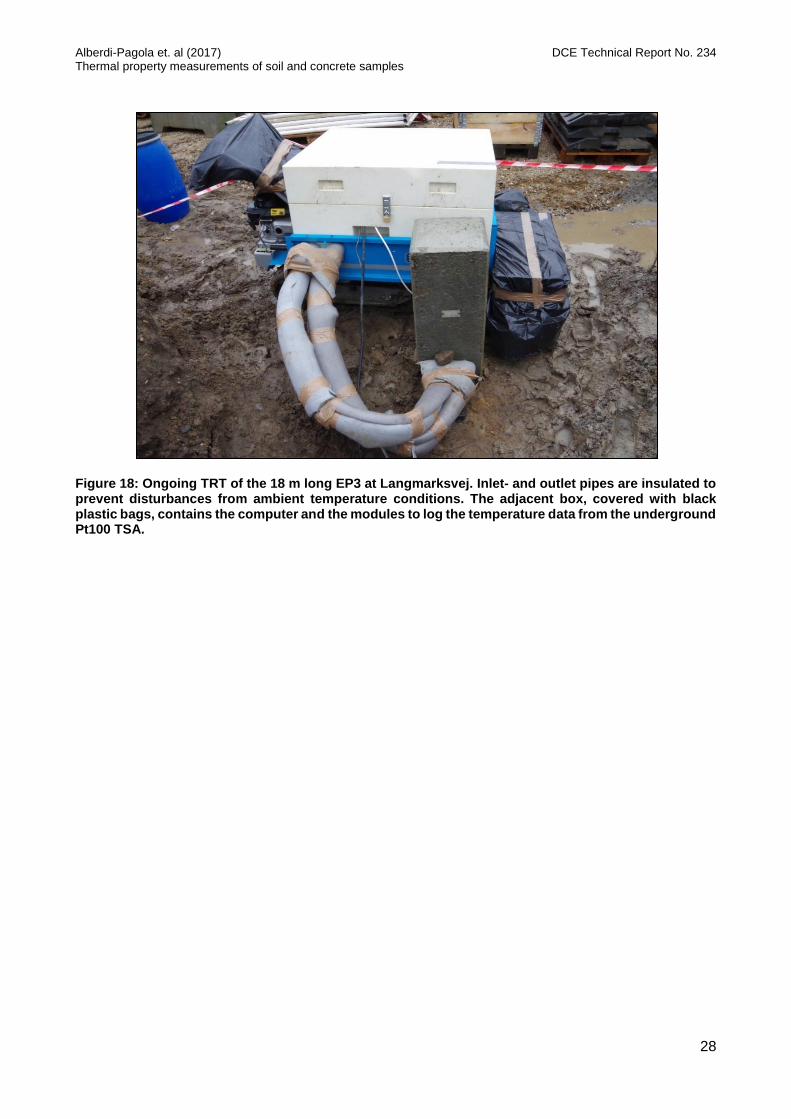
Figure 18: Ongoing TRT of the 18 m long EP3 at Langmarksvej. Inlet- and outlet pipes are insulated to prevent disturbances from ambient temperature conditions. The adjacent box, covered with black plastic bags, contains the computer and the modules to log the temperature data from the underground Pt100 TSA.
Alberdi-Pagola et. al (2017) DCE Technical Report No. 234 Thermal property measurements of soil and concrete samples
29
ii. Rosborg Gymnasium
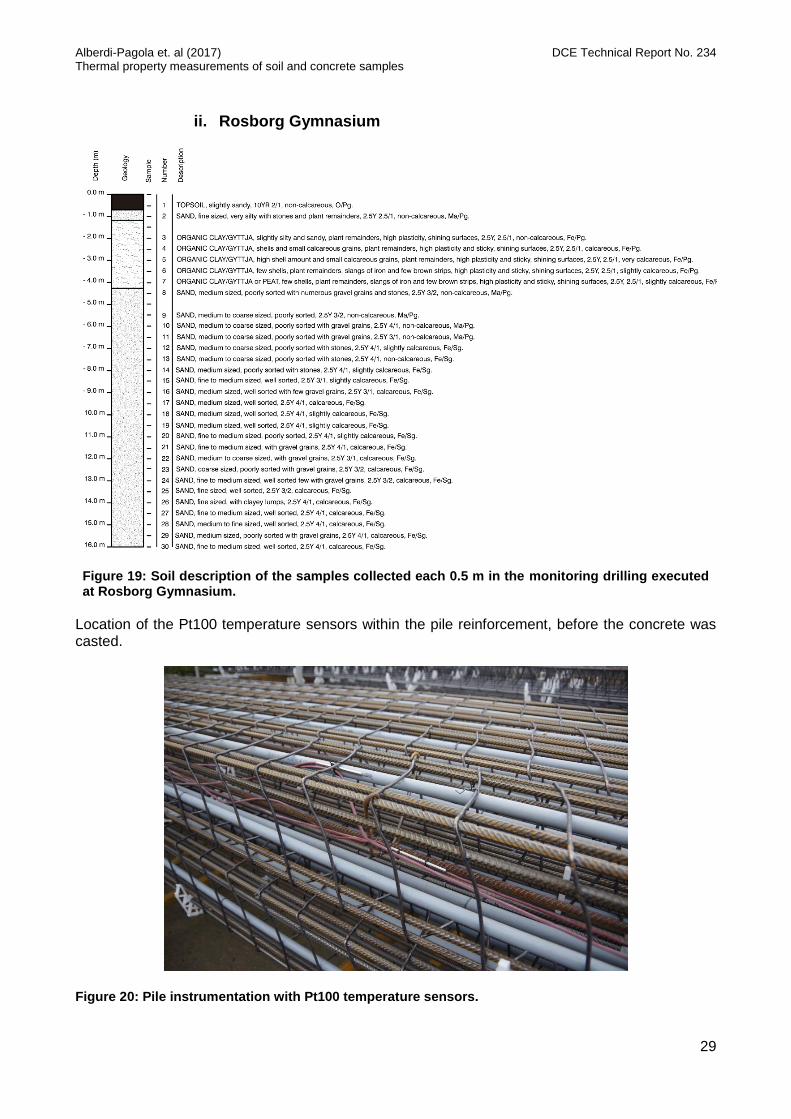
Figure 19: Soil description of the samples collected each 0.5 m in the monitoring drilling executed at Rosborg Gymnasium.
Location of the Pt100 temperature sensors within the pile reinforcement, before the concrete was casted.
Figure 20: Pile instrumentation with Pt100 temperature sensors.
Alberdi-Pagola et. al (2017) DCE Technical Report No. 234 Thermal property measurements of soil and concrete samples
30
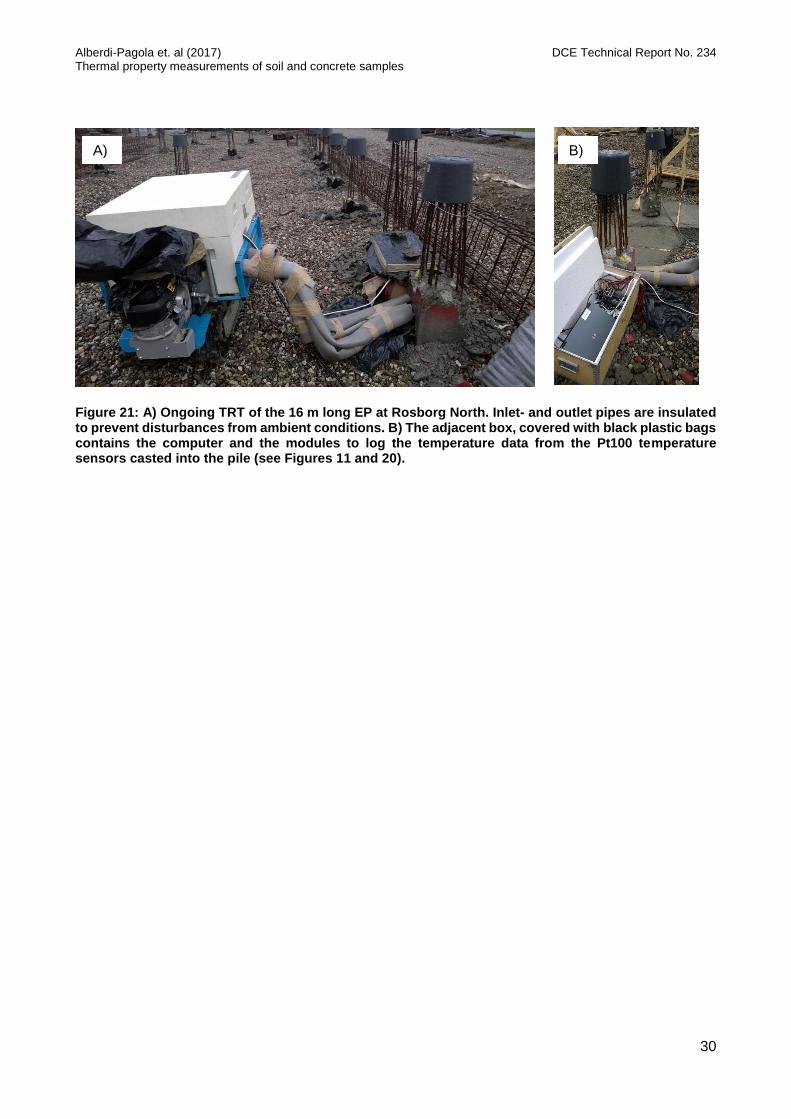
Figure 21: A) Ongoing TRT of the 16 m long EP at Rosborg North. Inlet- and outlet pipes are insulated to prevent disturbances from ambient conditions. B) The adjacent box, covered with black plastic bags contains the computer and the modules to log the temperature data from the Pt100 temperature sensors casted into the pile (see Figures 11 and 20).
A) B)
Alberdi-Pagola et. al (2017) DCE Technical Report No. 234 Thermal property measurements of soil and concrete samples
31
B) Energy pile drawings
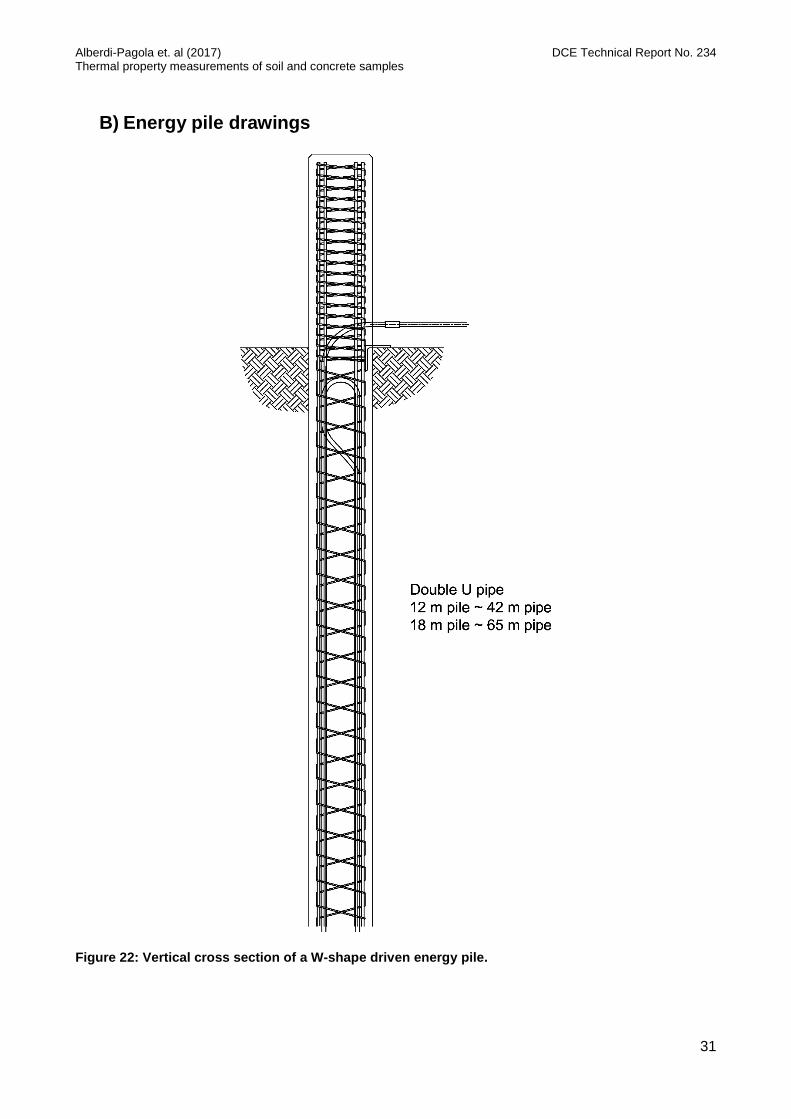
Figure 22: Vertical cross section of a W-shape driven energy pile.
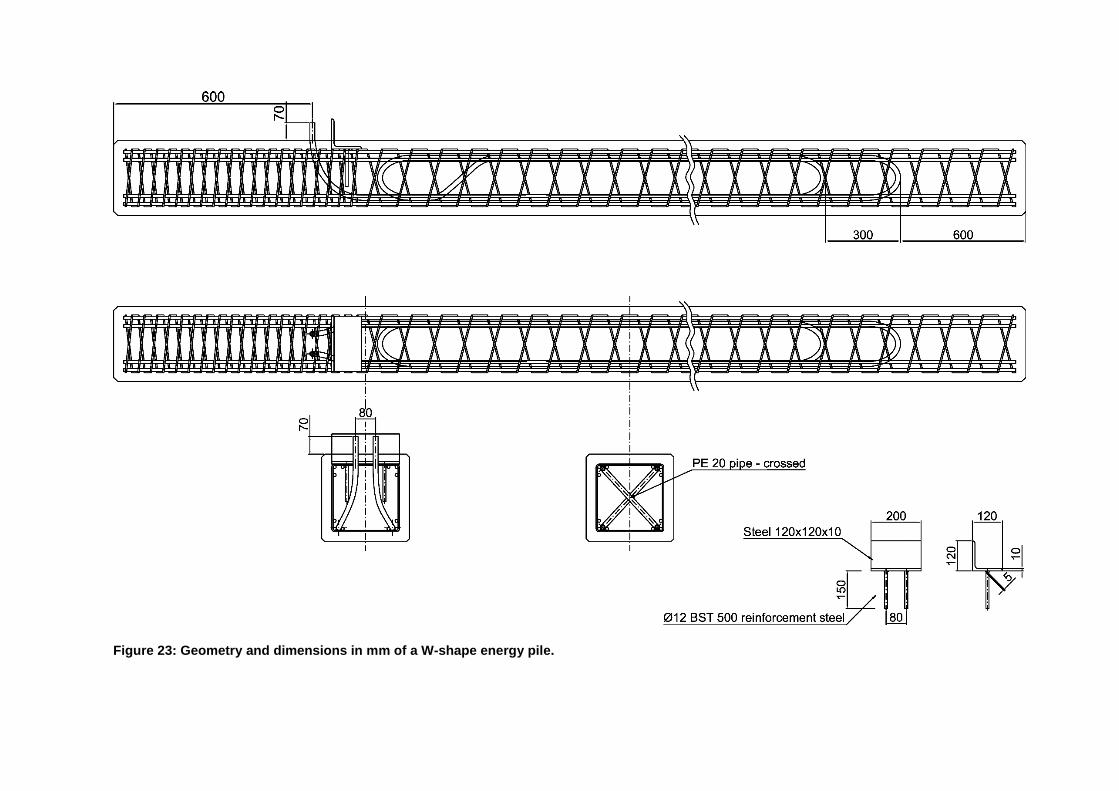
Figure 23: Geometry and dimensions in mm of a W-shape energy pile.
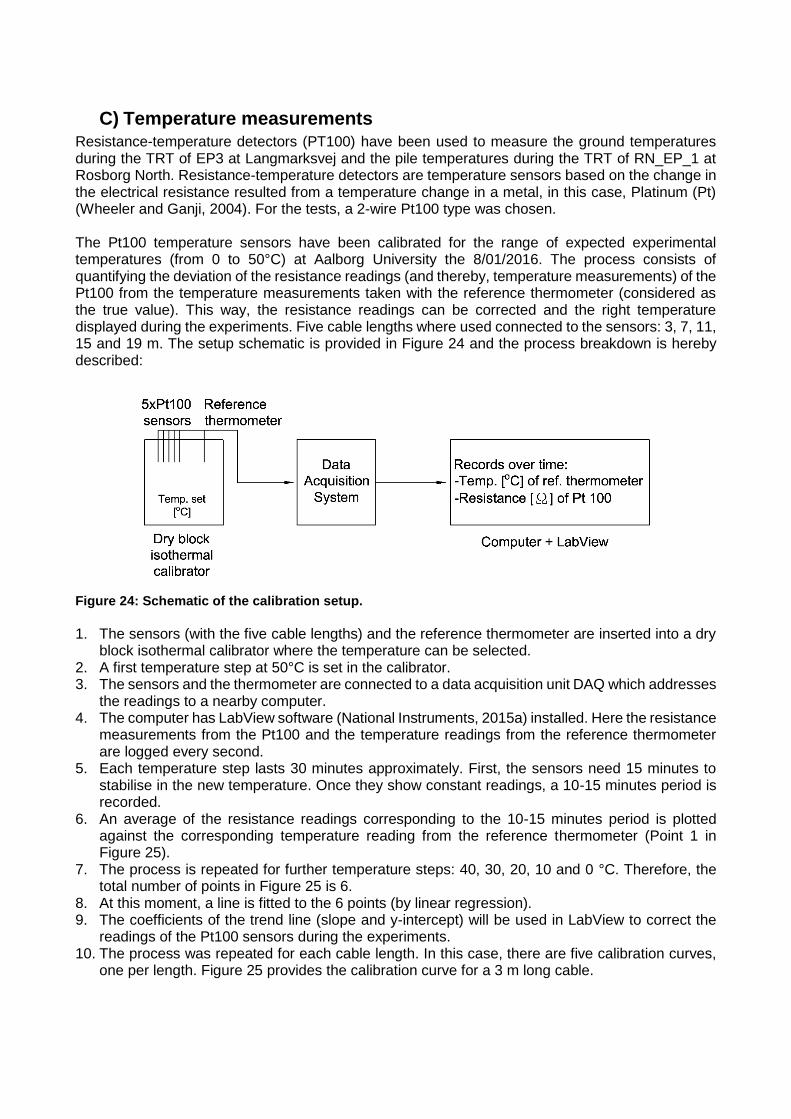
C) Temperature measurements Resistance-temperature detectors (PT100) have been used to measure the ground temperatures during the TRT of EP3 at Langmarksvej and the pile temperatures during the TRT of RN_EP_1 at Rosborg North. Resistance-temperature detectors are temperature sensors based on the change in the electrical resistance resulted from a temperature change in a metal, in this case, Platinum (Pt) (Wheeler and Ganji, 2004). For the tests, a 2-wire Pt100 type was chosen. The Pt100 temperature sensors have been calibrated for the range of expected experimental temperatures (from 0 to 50°C) at Aalborg University the 8/01/2016. The process consists of quantifying the deviation of the resistance readings (and thereby, temperature measurements) of the Pt100 from the temperature measurements taken with the reference thermometer (considered as the true value). This way, the resistance readings can be corrected and the right temperature displayed during the experiments. Five cable lengths where used connected to the sensors: 3, 7, 11, 15 and 19 m. The setup schematic is provided in Figure 24 and the process breakdown is hereby described:
Figure 24: Schematic of the calibration setup.
1. The sensors (with the five cable lengths) and the reference thermometer are inserted into a dry
block isothermal calibrator where the temperature can be selected. 2. A first temperature step at 50°C is set in the calibrator. 3. The sensors and the thermometer are connected to a data acquisition unit DAQ which addresses
the readings to a nearby computer. 4. The computer has LabView software (National Instruments, 2015a) installed. Here the resistance
measurements from the Pt100 and the temperature readings from the reference thermometer are logged every second.
5. Each temperature step lasts 30 minutes approximately. First, the sensors need 15 minutes to stabilise in the new temperature. Once they show constant readings, a 10-15 minutes period is recorded.
6. An average of the resistance readings corresponding to the 10-15 minutes period is plotted against the corresponding temperature reading from the reference thermometer (Point 1 in Figure 25).
7. The process is repeated for further temperature steps: 40, 30, 20, 10 and 0 °C. Therefore, the total number of points in Figure 25 is 6.
8. At this moment, a line is fitted to the 6 points (by linear regression). 9. The coefficients of the trend line (slope and y-intercept) will be used in LabView to correct the
readings of the Pt100 sensors during the experiments. 10. The process was repeated for each cable length. In this case, there are five calibration curves,
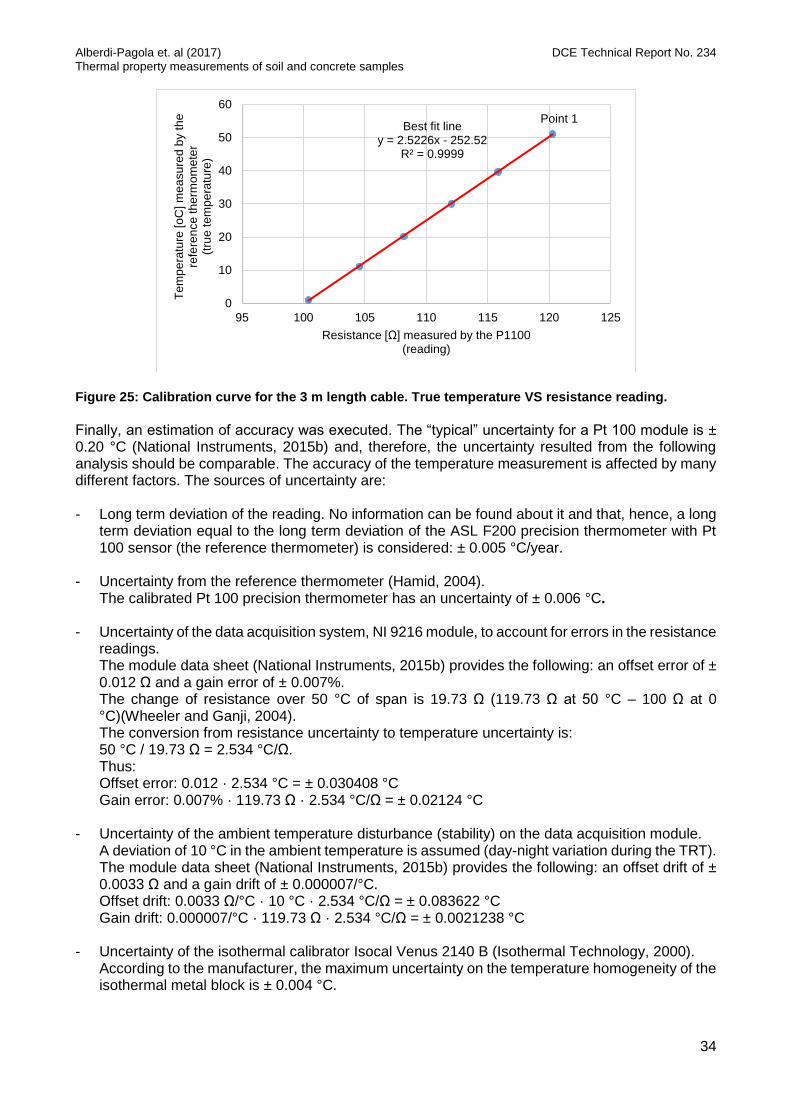
one per length. Figure 25 provides the calibration curve for a 3 m long cable.
Alberdi-Pagola et. al (2017) DCE Technical Report No. 234 Thermal property measurements of soil and concrete samples
34
Figure 25: Calibration curve for the 3 m length cable. True temperature VS resistance reading.
Finally, an estimation of accuracy was executed. The “typical” uncertainty for a Pt 100 module is ± 0.20 °C (National Instruments, 2015b) and, therefore, the uncertainty resulted from the following analysis should be comparable. The accuracy of the temperature measurement is affected by many different factors. The sources of uncertainty are: - Long term deviation of the reading. No information can be found about it and that, hence, a long
term deviation equal to the long term deviation of the ASL F200 precision thermometer with Pt 100 sensor (the reference thermometer) is considered: ± 0.005 °C/year.
- Uncertainty from the reference thermometer (Hamid, 2004).
The calibrated Pt 100 precision thermometer has an uncertainty of ± 0.006 °C. - Uncertainty of the data acquisition system, NI 9216 module, to account for errors in the resistance
readings. The module data sheet (National Instruments, 2015b) provides the following: an offset error of ± 0.012 Ω and a gain error of ± 0.007%. The change of resistance over 50 °C of span is 19.73 Ω (119.73 Ω at 50 °C – 100 Ω at 0 °C)(Wheeler and Ganji, 2004). The conversion from resistance uncertainty to temperature uncertainty is: 50 °C / 19.73 Ω = 2.534 °C/Ω. Thus: Offset error: 0.012 · 2.534 °C = ± 0.030408 °C Gain error: 0.007% · 119.73 Ω · 2.534 °C/Ω = ± 0.02124 °C
- Uncertainty of the ambient temperature disturbance (stability) on the data acquisition module.
A deviation of 10 °C in the ambient temperature is assumed (day-night variation during the TRT). The module data sheet (National Instruments, 2015b) provides the following: an offset drift of ± 0.0033 Ω and a gain drift of ± 0.000007/°C. Offset drift: 0.0033 Ω/°C · 10 °C · 2.534 °C/Ω = ± 0.083622 °C Gain drift: 0.000007/°C · 119.73 Ω · 2.534 °C/Ω = ± 0.0021238 °C
- Uncertainty of the isothermal calibrator Isocal Venus 2140 B (Isothermal Technology, 2000). According to the manufacturer, the maximum uncertainty on the temperature homogeneity of the isothermal metal block is ± 0.004 °C.
Best fit liney = 2.5226x - 252.52
R² = 0.9999
0
10
20
30
40
50
60
95 100 105 110 115 120 125
Te
mp
era
ture
[o
C] m
ea
su
red
by t
he
re
fere
nce
th
erm
om
ete
r (t
rue
te
mp
era
ture
)
Resistance [Ω] measured by the P1100(reading)
Point 1
Alberdi-Pagola et. al (2017) DCE Technical Report No. 234 Thermal property measurements of soil and concrete samples
35
- Uncertainty derived from the cable length, i.e., the effect of the cable length in the measured temperature. An uncertainty in the measurement of the length of the cable of 0.02 m is assumed. The measurements from the calibration process allow to obtain the relation between the length of the cables and the resistance. An average value between the coefficients (slopes derived from the resistance VS length relation for each temperature step) has been taken: 0.0962 Ω/m. The uncertainty in the temperature reading resulted from the cable length: 0.02 m · 0.0962 Ω/m · 2.534 °C/Ω = ± 0.0049 °C
- Uncertainty of the sensor itself. The following information has been taken from Dansk Standard (2008): Temperature coefficient resistance α: 0.00385 Ω/Ω/°C, which is defined as:
α =R100 − R0
100 ∙ R0
Being R0 the resistance of the sensor at 0°C and R100 the resistance of the sensor at 100 °C. This relation can be used to calculate the uncertainty of the resistance temperature detector:
ΔR = R0 ∙ α ∙ ΔT
To calculate the uncertainty within a range of 50 °C, from 0°C to 50 °C:
ΔR50 = R0 ∙ α ∙ ΔT
The resistance of the sensor at 0 °C is given by the standard for different type of sensors and a Class B sensor has been assumed, being: 100.00 Ω ± 0.12 Ω at 0 °C. Therefore, the uncertainty at 0 °C is ± 0.12 Ω. The uncertainty in the resistance for a detector ranging temperatures from 0 °C to 50 °C is: ΔR = 0.12 Ω · 0.00385 Ω/Ω/°C · 50°C = ± 0.0231Ω Translating it to temperature units, the uncertainty of the Pt100 sensor is: 0.0231 Ω · 2.534 °C/Ω = ± 0.0585354 °C
Subsequently, the global uncertainty (U) of the calibrated Pt 100, estimated by quadrature addition and under a perfect calibration assumption, would be:
U = √0.0052 + 0.0062 + 0.030412 + 0.021242 + 0.08362 + 0.00212 + 0.0042 + 0.00492 + 0.05852
= ± 0.11°C This uncertainty is slightly lower than the typical expected error.
Alberdi-Pagola et. al (2017) DCE Technical Report No. 234 Thermal property measurements of soil and concrete samples
36
D) Thermal response test data This appendix provides the figures (from Figure 26 to Figure 36) of the data sets collected during the 8 TRTs performed at the Langmarksvej and Rosborg Gymnasium test sites.
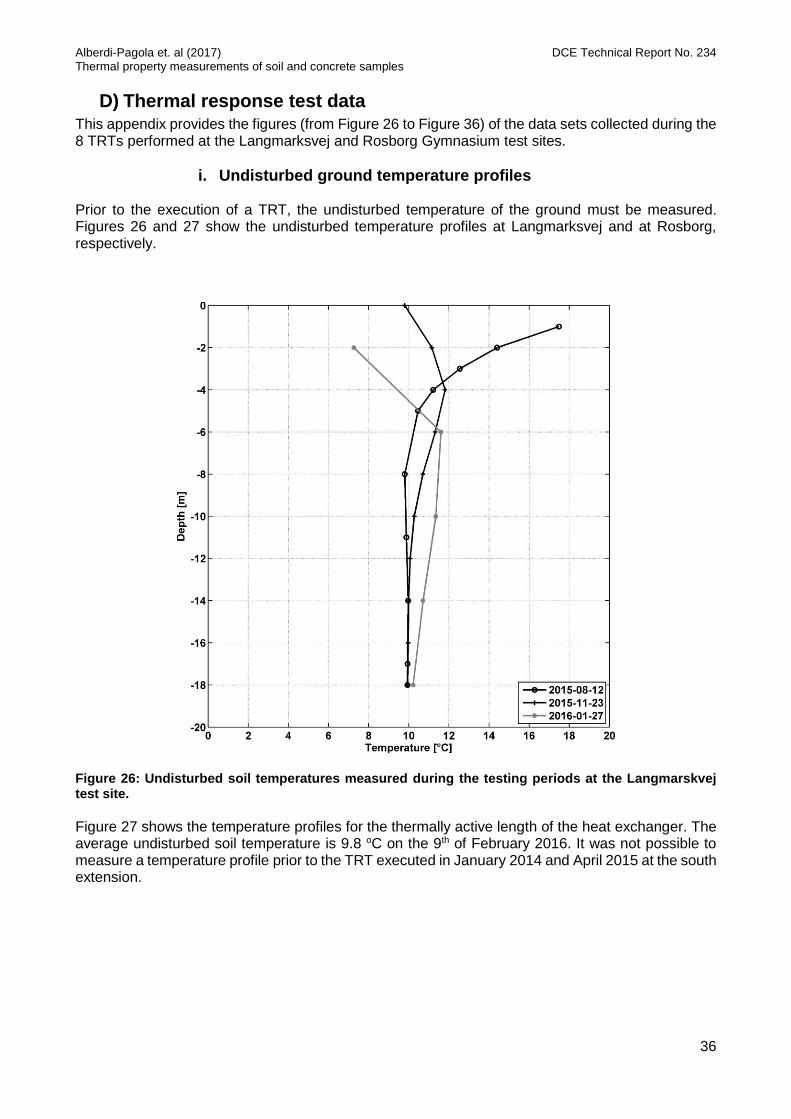
i. Undisturbed ground temperature profiles Prior to the execution of a TRT, the undisturbed temperature of the ground must be measured. Figures 26 and 27 show the undisturbed temperature profiles at Langmarksvej and at Rosborg, respectively.
Figure 26: Undisturbed soil temperatures measured during the testing periods at the Langmarskvej test site.
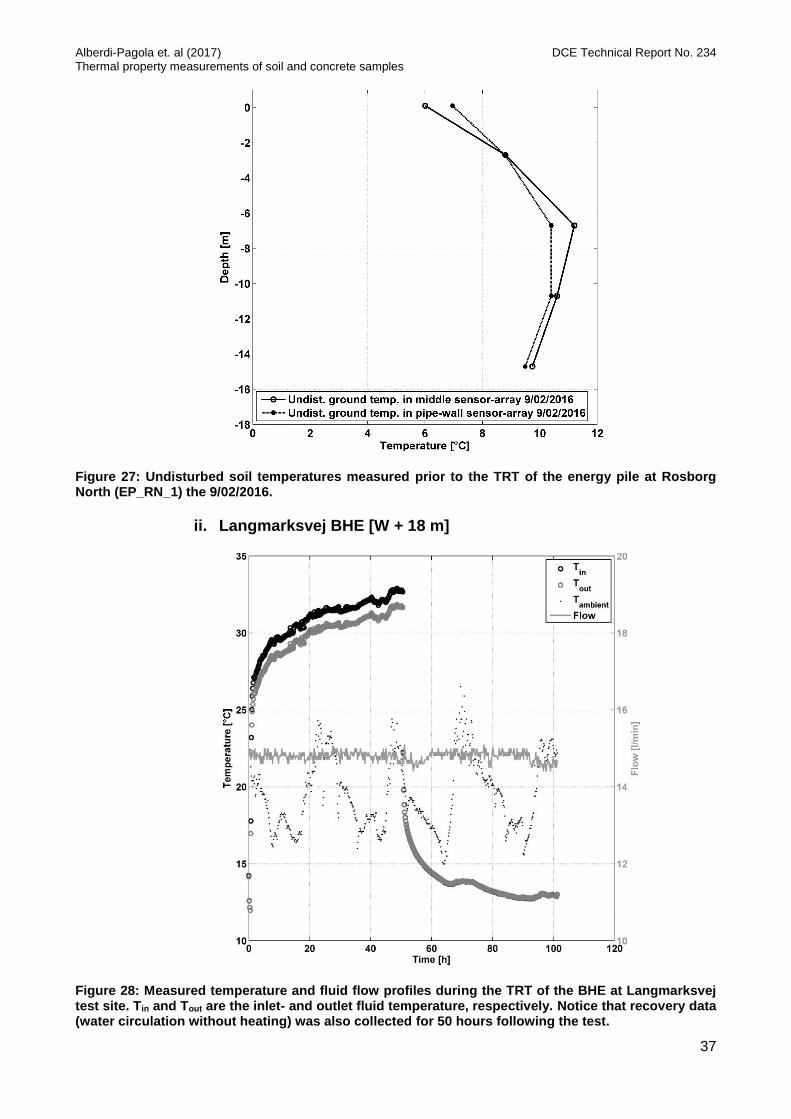
Figure 27 shows the temperature profiles for the thermally active length of the heat exchanger. The average undisturbed soil temperature is 9.8 oC on the 9th of February 2016. It was not possible to measure a temperature profile prior to the TRT executed in January 2014 and April 2015 at the south extension.
Alberdi-Pagola et. al (2017) DCE Technical Report No. 234 Thermal property measurements of soil and concrete samples
37
Figure 27: Undisturbed soil temperatures measured prior to the TRT of the energy pile at Rosborg North (EP_RN_1) the 9/02/2016.
ii. Langmarksvej BHE [W + 18 m]
Figure 28: Measured temperature and fluid flow profiles during the TRT of the BHE at Langmarksvej test site. Tin and Tout are the inlet- and outlet fluid temperature, respectively. Notice that recovery data (water circulation without heating) was also collected for 50 hours following the test.
Alberdi-Pagola et. al (2017) DCE Technical Report No. 234 Thermal property measurements of soil and concrete samples
38
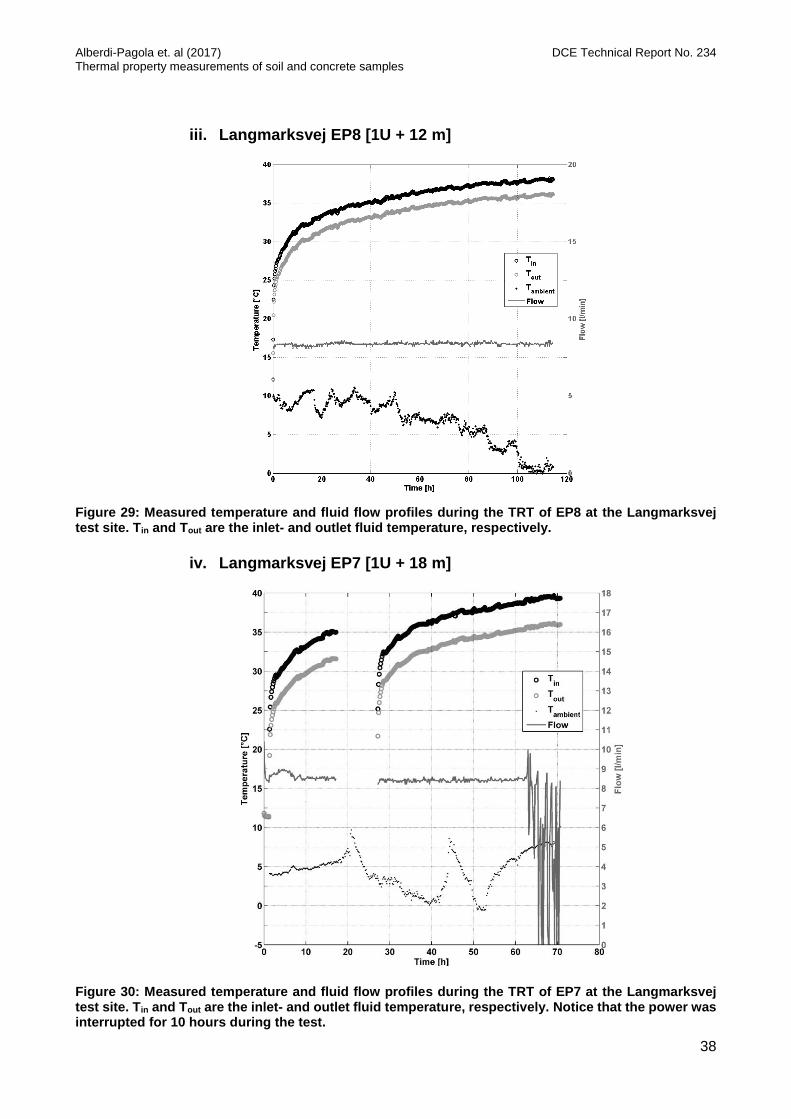
iii. Langmarksvej EP8 [1U + 12 m]
Figure 29: Measured temperature and fluid flow profiles during the TRT of EP8 at the Langmarksvej test site. Tin and Tout are the inlet- and outlet fluid temperature, respectively.
iv. Langmarksvej EP7 [1U + 18 m]
Figure 30: Measured temperature and fluid flow profiles during the TRT of EP7 at the Langmarksvej test site. Tin and Tout are the inlet- and outlet fluid temperature, respectively. Notice that the power was interrupted for 10 hours during the test.
Alberdi-Pagola et. al (2017) DCE Technical Report No. 234 Thermal property measurements of soil and concrete samples
39
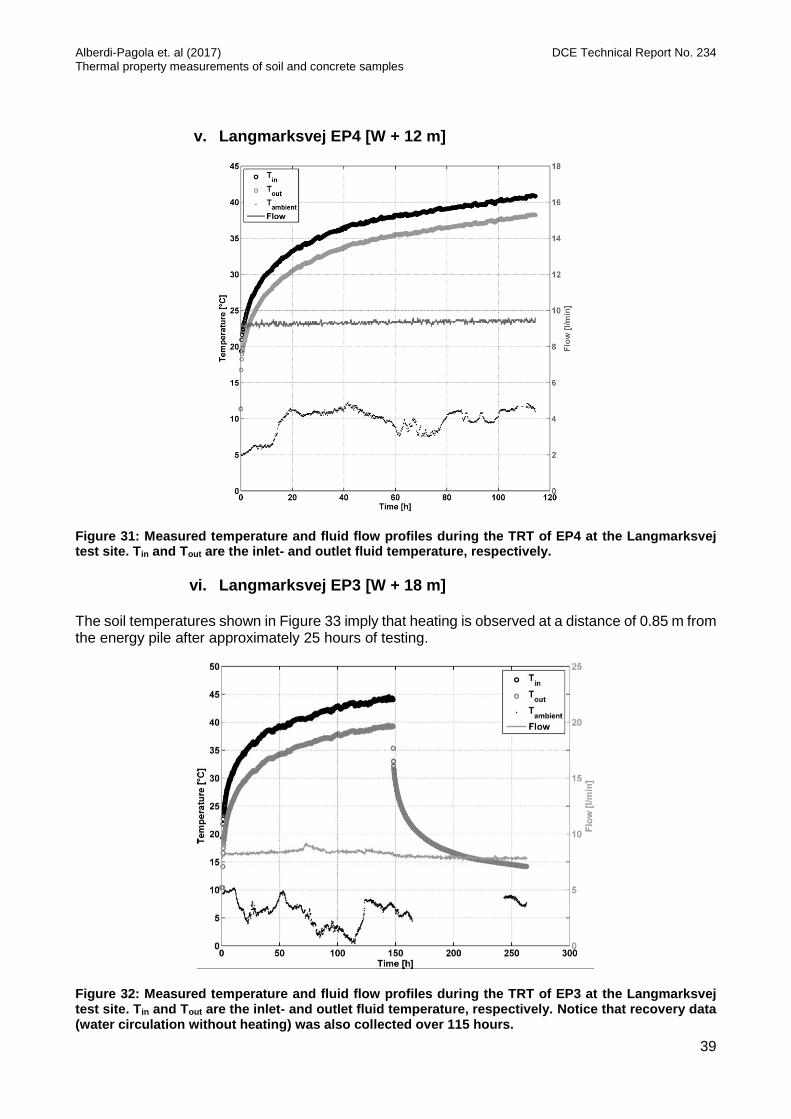
v. Langmarksvej EP4 [W + 12 m]
Figure 31: Measured temperature and fluid flow profiles during the TRT of EP4 at the Langmarksvej test site. Tin and Tout are the inlet- and outlet fluid temperature, respectively.
vi. Langmarksvej EP3 [W + 18 m]
The soil temperatures shown in Figure 33 imply that heating is observed at a distance of 0.85 m from the energy pile after approximately 25 hours of testing.
Figure 32: Measured temperature and fluid flow profiles during the TRT of EP3 at the Langmarksvej test site. Tin and Tout are the inlet- and outlet fluid temperature, respectively. Notice that recovery data (water circulation without heating) was also collected over 115 hours.
Alberdi-Pagola et. al (2017) DCE Technical Report No. 234 Thermal property measurements of soil and concrete samples
40
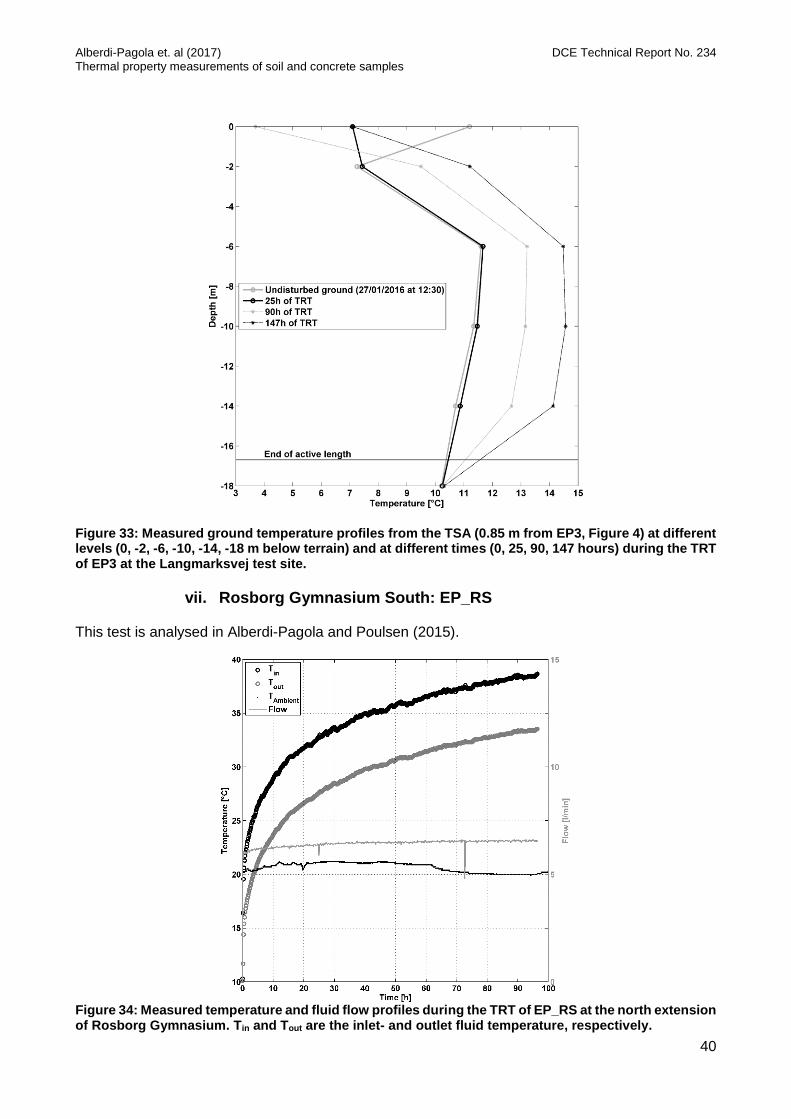
Figure 33: Measured ground temperature profiles from the TSA (0.85 m from EP3, Figure 4) at different levels (0, -2, -6, -10, -14, -18 m below terrain) and at different times (0, 25, 90, 147 hours) during the TRT of EP3 at the Langmarksvej test site.
vii. Rosborg Gymnasium South: EP_RS This test is analysed in Alberdi-Pagola and Poulsen (2015).
Figure 34: Measured temperature and fluid flow profiles during the TRT of EP_RS at the north extension of Rosborg Gymnasium. Tin and Tout are the inlet- and outlet fluid temperature, respectively.
Alberdi-Pagola et. al (2017) DCE Technical Report No. 234 Thermal property measurements of soil and concrete samples
41
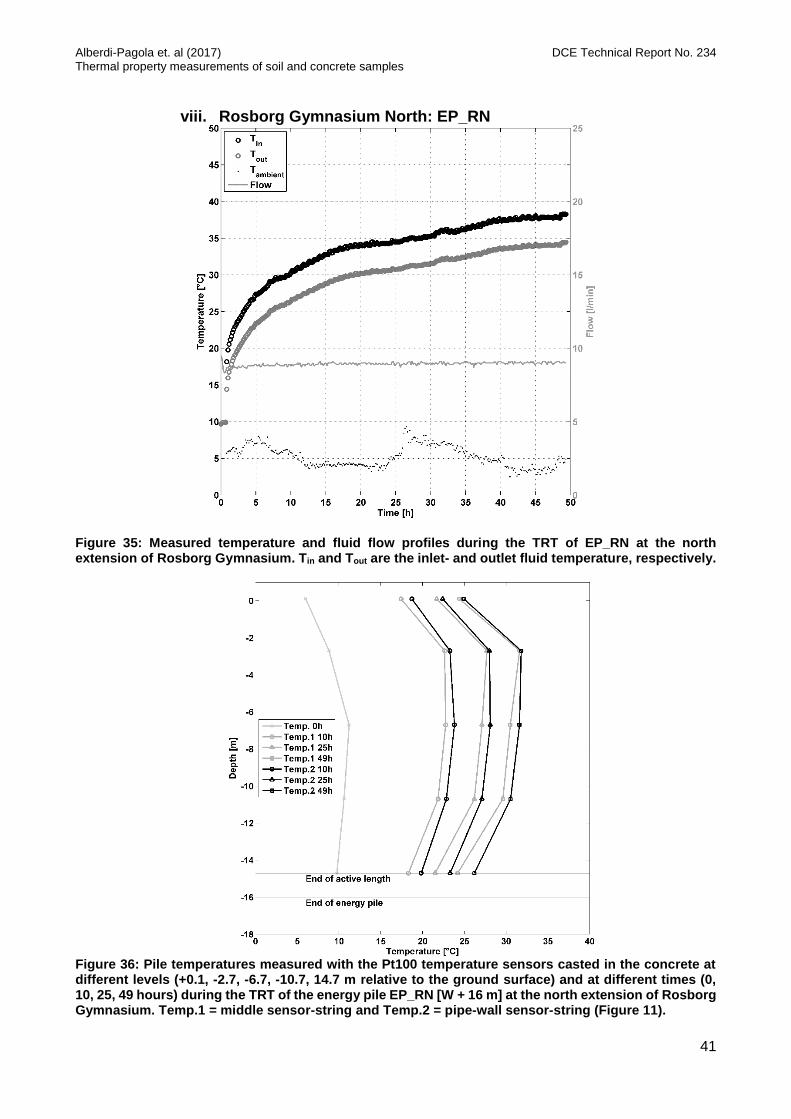
viii. Rosborg Gymnasium North: EP_RN
Figure 35: Measured temperature and fluid flow profiles during the TRT of EP_RN at the north extension of Rosborg Gymnasium. Tin and Tout are the inlet- and outlet fluid temperature, respectively.
Figure 36: Pile temperatures measured with the Pt100 temperature sensors casted in the concrete at different levels (+0.1, -2.7, -6.7, -10.7, 14.7 m relative to the ground surface) and at different times (0, 10, 25, 49 hours) during the TRT of the energy pile EP_RN [W + 16 m] at the north extension of Rosborg Gymnasium. Temp.1 = middle sensor-string and Temp.2 = pipe-wall sensor-string (Figure 11).
Alberdi-Pagola et. al (2017) DCE Technical Report No. 234 Thermal property measurements of soil and concrete samples
42
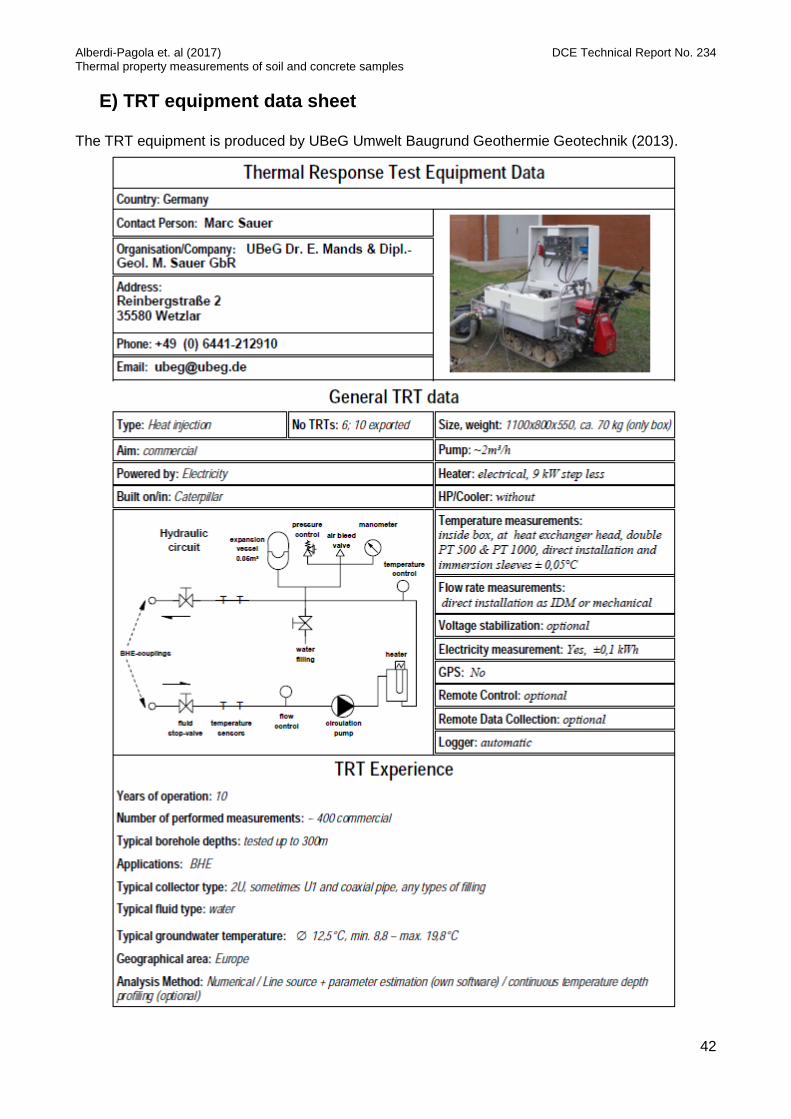
E) TRT equipment data sheet The TRT equipment is produced by UBeG Umwelt Baugrund Geothermie Geotechnik (2013).

Alberdi-Pagola et. al (2017) DCE Technical Report No. 234 Thermal property measurements of soil and concrete samples
43
1901-726X DCE Technical Report No. 234