Embed Size (px)
Citation preview
8/9/2019 Abbottabad Soed
http://slidepdf.com/reader/full/abbottabad-soed 1/150
8/9/2019 Abbottabad Soed
http://slidepdf.com/reader/full/abbottabad-soed 2/150
8/9/2019 Abbottabad Soed
http://slidepdf.com/reader/full/abbottabad-soed 3/150
State of theEnvironment and Development
Abbottabad
8/9/2019 Abbottabad Soed
http://slidepdf.com/reader/full/abbottabad-soed 4/150
The designation of geographical entities in this book and the presentation of material do notimply the expression of any opinion whatsoever on the part of IUCN concerning the legalstatus of any country, territory or area, or of its authorities, or concerning the delimitation ofits frontiers or boundaries.
Published by:IUCN, Sarhad Programme.
Copyright: © 2004 International Union for the Conservation of Nature and Natural Resources, Pakistan,and the Government of the North-West Frontier Province (NWFP).
Abbottabad—State of the Environment and Development was prepared by the Governmentof the NWFP (Planning and Development Department) in collaboration withIUCN-The World Conservation Union. It was supported by the Swiss Agency forDevelopment and Cooperation (SDC). The contents of this document and the opinionsexpressed do not constitute an endorsement by the SDC.
Citation is encouraged. Reproduction and/or translation of this publication for educational orother non-commercial purposes is authorised without prior written permission from IUCNPakistan, provided the source is fully acknowledged.
Reproduction of this publication for resale or other commercial purposes is prohibited withoutprior written permission from IUCN Pakistan.
Citation:IUCN Pakistan (2004). Abbottabad—State of the Environment and Development.IUCN Pakistan and NWFP: Karachi, Pakistan. xii +136 pp.
Editor:Firuza Pastakia
ISBN:969-8141-72-3
Design and layout:Creative Unit (Pvt.) Ltd.
Printed by:Rosette Printers, Karachi
Available from:IUCN-The World Conservation Union, PakistanSarhad Programme OfficeHouse No. 109, Sarhad Office RoadDefence Officers ColonyKhyber Road, PeshawarTel: 091-5271728/5276032Fax: 091-5275093
IUCN-Abbottabad OfficeDistrict Government SecretariatAbbottabadTel: 0992-9310358Fax: 0992-332449www.acs.iucnp.org
8/9/2019 Abbottabad Soed
http://slidepdf.com/reader/full/abbottabad-soed 5/150
C ontentsAbbreviations
iv
Introduction vi
Reader»s Guide vii
Executive Summary viii
PART I BACKGROUND1. Abbottabad District Profile 22. Prioritising Issues 17
PART II GREEN SECTORS3. Agriculture and Horticulture 214. Forests and Watersheds 305. Livestock and Poultry 396. Grazing Land and Fodder Reserves 447. Biodiversity, Parks and Protected Areas 498. Fisheries 54
PART III BROWN SECTORS9. Mining 5710. Energy 60
11. Waste Water and Solid Waste Management 6512. Land Use Planning and Zoning 70
PART IV SOCIO-ECONOMIC SECTORS13. Education 7414. Health and Population Welfare 8915. Infrastructure: Roads and Communications 9616. Drinking Water 9917. Ecotourism 10418. Enterprise Development 10919. Culture 11420. Gender 117
PART V INTER-SECTORAL THEMES21. Cross-Cutting Themes 123
Annex 1: Technical Terms and Concepts 127Annex 2: Bibliography 132
Annex 3: Map of District Abbottabad 135
8/9/2019 Abbottabad Soed
http://slidepdf.com/reader/full/abbottabad-soed 6/150
ACS Abbottabad Conservation Strategy
ADB Asian Development Bank
ADP Annual Development Programme
AMC Ayub Medical College and Hospital Complex
ASSD Abbottabad Strategy for Sustainable Development
BADP Barani Area Development Project
CBO Community-Based Organisation
CCS Chitral Conservation Strategy
CNG Compressed Natural GasEIA Environmental Impact Assessment
EMW Ever-Married Woman
EPB Export Promotion Bureau
FEF Frontier Education Foundation
GDA Galliyat Development Authority
GoNWFP Government of the North-West Frontier Province
GoP Government of Pakistan
HHTIT Hazara Hill Tract Improvement TrustIIED International Institute for Environment and Development
IUCN The World Conservation Union
KfW Kreditanstalt für Wiederaufbau
KPP Khushhal Pakistan Programme
L&DD Livestock and Dairy Development Department
LPG Liquefied Petroleum Gas
MC Municipal Committee
MSU Multi-Donor Support Unit
NGO Non-Governmental Organisation
NHA National Highway Authority
NRCP Natural Resource Conservation Project
NSSD National Strategies for Sustainable Development
NWFP North-West Frontier Province
OECD Organisation for Economic Co-operation and Development
PCRET Pakistan Council for Renewable Energy and Technology
iv Abbottabad State of the Environment and Development
ABBREVIATIONS

8/9/2019 Abbottabad Soed
http://slidepdf.com/reader/full/abbottabad-soed 7/150
Abbreviations
PEP-ILE Primary Education Programme-Improvement of theLearning Environment
PHED Public Health Engineering Department
PHP Project for Horticultural Promotion
PIDC Pakistan Industrial Development Corporation
PPAF Pakistan Poverty Alleviation Fund
PRC Potato Research Centre
SDC Swiss Agency for Development and Cooperation
SIE Small Industries EstateSoED State of the Environment & Development
SPADE Society for Public Awareness and Development Economics
SPCS Sarhad Provincial Conservation Strategy
SRSP Sarhad Rural Support Programme
SUNGI SUNGI Development Foundation
TMA Town Municipal Administration
UN United Nations
UNDP United Nations Development Programme
WB World Bank
WSSD World Summit on Sustainable Development
WTTC World Travel and Tourism Council
WWF World Wide Fund for Nature
ZTBL Zarai Taraqiati Bank Limited
vAbbottabad State of the Environment and Development
8/9/2019 Abbottabad Soed
http://slidepdf.com/reader/full/abbottabad-soed 8/150
The challenge of preparing a lower-tier developmentstrategy must by necessity focus on issues particular tothe district. In the case of Abbottabad, this effort wasstymied right from the start by the glaring absence of
reliable statistics for various sectors. No formal impact
assessment studies were available and no independent criticalanalysis of development initiatives appeared to have beenundertaken.
The lack of baseline indicators to serve as a foundation forremedial proposals required that such a study be conducted. TheState of the Environment and Development (SoED) wasdeveloped in response to this need, so that the most recentavailable data on various sectors could be brought together in asingle volume. The SoED examines the current status of keysectors that have a direct bearing on development in the district.It takes stock of initiatives completed or in the pipelines and
critically examines lessons provided by these efforts. Thisdocument is based on the findings of individual sector papers thatwere commissioned and finalised after broad interaction withstakeholders. By compiling and condensing these studies, theSoED serves as a snapshot of the district.
The wealth of statistical information here is intended to provide aplatform for informed decision making. It is our hope that thisdocument serves as a benchmark study, to be updated at regularintervals, so that the process of systematic data gathering set inmotion here can become an integral part of all future planning.
INTRODUCTION
vi Abbottabad State of the Environment and Development
8/9/2019 Abbottabad Soed
http://slidepdf.com/reader/full/abbottabad-soed 9/150
viiAbbottabad State of the Environment and Development
The structural framework for the SoED and its companion pub-lication, the Abbottabad Strategy for Sustainable Develop- ment (ASSD), was developed simultaneously so that eachdocument, while standing alone, would also reflect the con-
tent of the other. The SoED lays the groundwork for an integrateddevelopment vision for Abbottabad, examining in depth the currentstatus of key sectors. This volume is designed for sector specialists andthose seeking a deeper understanding of the on-ground realities under-pinning the strategic development vision outlined in the ASSD.
The SoED begins with an overview of the district, covering physical geog-raphy, climate and land use patterns, as well as demographic and socio-economic indicators. Broader themes that impact human development,including poverty, unemployment, society and culture, are examinedalong with current institutional arrangements. The strategy formulationprocess is described, outlining the public consultation exercises held toidentify issues that were relevant to the people of Abbottabad.
The heart of this document consists of a detailed analysis of 18 coreareas, which are discussed in individual chapters. Besides compilingstatistical data, these chapters aim to assess the contribution of majorplayers and examine the lessons that have been learned from previousdevelopment initiatives.
The concluding chapter takes a step back from sectoral analyses toexamine broader themes that have a wide-ranging impact ondevelopment efforts in all sectors. These cross-cutting themes arehighlighted to ensure that they are kept in mind while planning remedialmeasures targeted at specific sectors.
READER»S GUIDE
8/9/2019 Abbottabad Soed
http://slidepdf.com/reader/full/abbottabad-soed 10/150
viii Abbottabad State of the Environment and Development
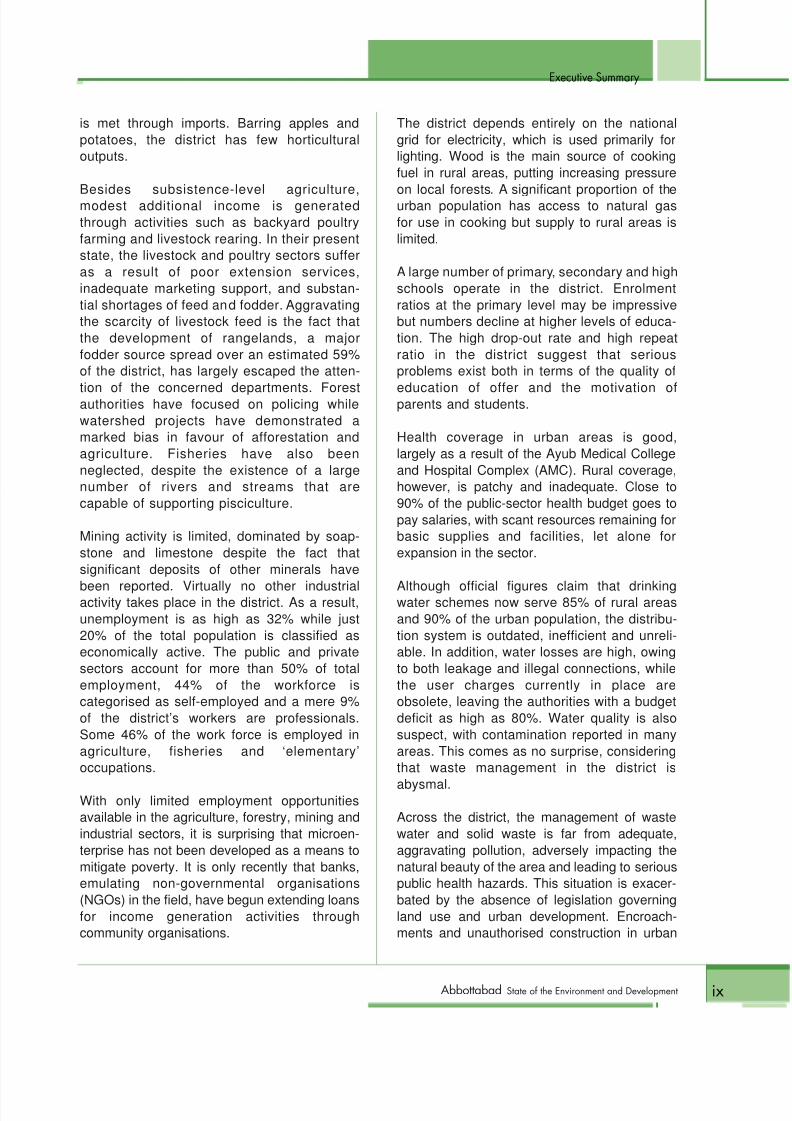
Abbottabad district is home to an estimated 928,000individuals, with the vast majority living in rural
areas. Although just 18.6% of the district’sresidents currently make their home in the cities,deepening poverty is leading to increasing urbanisation.Spread over 178,401 ha of predominantly mountainousterrain, population density in the district is high, at 466persons per km 2.
Forests cover an area of 39,395 ha, or a little over 20% of thedistrict, accounting for 5.4% of the total forest resources of theNorth-West Frontier Province (NWFP). The majority ofAbbottabad’s forested area is today so severely denuded thatonly 29% of forests support a density greater than 50%.
Meanwhile, the gap between use and regenerative capacitycontinues to widen.
Overall, some 48% of land in the district is under agricultureand land use intensity is high. Agriculture is the mainstay ofthe district’s economy but the sector operates at a subsis-tence level. Of the 63,000 ha under cultivation, only 11% isirrigated. The remaining 56,000 ha of farmland dependsexclusively on rain. As a result, per-hectare yields are low,and local demand for cereal crops such as maize and wheat
E XECUTIVESUMMARY
8/9/2019 Abbottabad Soed
http://slidepdf.com/reader/full/abbottabad-soed 11/150
Executive Summary
is met through imports. Barring apples andpotatoes, the district has few horticulturaloutputs.
Besides subsistence-level agriculture,modest additional income is generatedthrough activities such as backyard poultryfarming and livestock rearing. In their presentstate, the livestock and poultry sectors sufferas a result of poor extension services,inadequate marketing support, and substan-tial shortages of feed and fodder. Aggravatingthe scarcity of livestock feed is the fact thatthe development of rangelands, a majorfodder source spread over an estimated 59%of the district, has largely escaped the atten-
tion of the concerned departments. Forestauthorities have focused on policing whilewatershed projects have demonstrated amarked bias in favour of afforestation andagriculture. Fisheries have also beenneglected, despite the existence of a largenumber of rivers and streams that arecapable of supporting pisciculture.
Mining activity is limited, dominated by soap-stone and limestone despite the fact thatsignificant deposits of other minerals have
been reported. Virtually no other industrialactivity takes place in the district. As a result,unemployment is as high as 32% while just20% of the total population is classified aseconomically active. The public and privatesectors account for more than 50% of totalemployment, 44% of the workforce iscategorised as self-employed and a mere 9%of the district’s workers are professionals.Some 46% of the work force is employed inagriculture, fisheries and ‘elementary’occupations.
With only limited employment opportunitiesavailable in the agriculture, forestry, mining andindustrial sectors, it is surprising that microen-terprise has not been developed as a means tomitigate poverty. It is only recently that banks,emulating non-governmental organisations(NGOs) in the field, have begun extending loansfor income generation activities throughcommunity organisations.
The district depends entirely on the nationalgrid for electricity, which is used primarily forlighting. Wood is the main source of cookingfuel in rural areas, putting increasing pressure
on local forests. A significant proportion of theurban population has access to natural gasfor use in cooking but supply to rural areas islimited.
A large number of primary, secondary and highschools operate in the district. Enrolmentratios at the primary level may be impressivebut numbers decline at higher levels of educa-tion. The high drop-out rate and high repeatratio in the district suggest that seriousproblems exist both in terms of the quality of
education of offer and the motivation ofparents and students.
Health coverage in urban areas is good,largely as a result of the Ayub Medical Collegeand Hospital Complex (AMC). Rural coverage,however, is patchy and inadequate. Close to90% of the public-sector health budget goes topay salaries, with scant resources remaining forbasic supplies and facilities, let alone forexpansion in the sector.
Although official figures claim that drinkingwater schemes now serve 85% of rural areasand 90% of the urban population, the distribu-tion system is outdated, inefficient and unreli-able. In addition, water losses are high, owingto both leakage and illegal connections, whilethe user charges currently in place areobsolete, leaving the authorities with a budgetdeficit as high as 80%. Water quality is alsosuspect, with contamination reported in manyareas. This comes as no surprise, consideringthat waste management in the district is
abysmal.
Across the district, the management of wastewater and solid waste is far from adequate,aggravating pollution, adversely impacting thenatural beauty of the area and leading to seriouspublic health hazards. This situation is exacer-bated by the absence of legislation governingland use and urban development. Encroach-ments and unauthorised construction in urban
ixAbbottabad State of the Environment and Development
8/9/2019 Abbottabad Soed
http://slidepdf.com/reader/full/abbottabad-soed 12/150
Executive Summary
areas put additional pressure on alreadystretched municipal services.
Despite a roads network spanning some 464
km, access to remote rural areas is difficult.The district is traversed by a number ofmajor roads, including the Karakoram high-way and the Murree–Abbottabad road. As aresult of its location at the crossroads ofmajor highways, Abbottabad city is exposedto excessive pollution originating from transittraffic.
Of the 12 habitats identified in the NWFP(Roberts 1977), three are to be found inAbbottabad. The district is rich in biodiversity,
supporting a wide variety of flora and fauna.Two protected areas, the Ayubia NationalPark and the Qalandarabad game reserve,have been designated. The natural beautyand breathtaking landscape of the districtmake it an attractive destination for tourists.Even with its rich biodiversity, and thenetwork of roads facilitating access, tourismhas witnessed a steady decline in recentyears. Instead, Abbottabad serves primarilyas a transit point for other destinations,attracting mostly day visitors.
Cultural norms in the area are beginning tochange, with significant shifts away fromtraditional values already evident, particularlyin urban areas. At the same time, tribal affilia-tions have not been abandoned altogether. Inthis state of flux, women continue to bemarginalised.
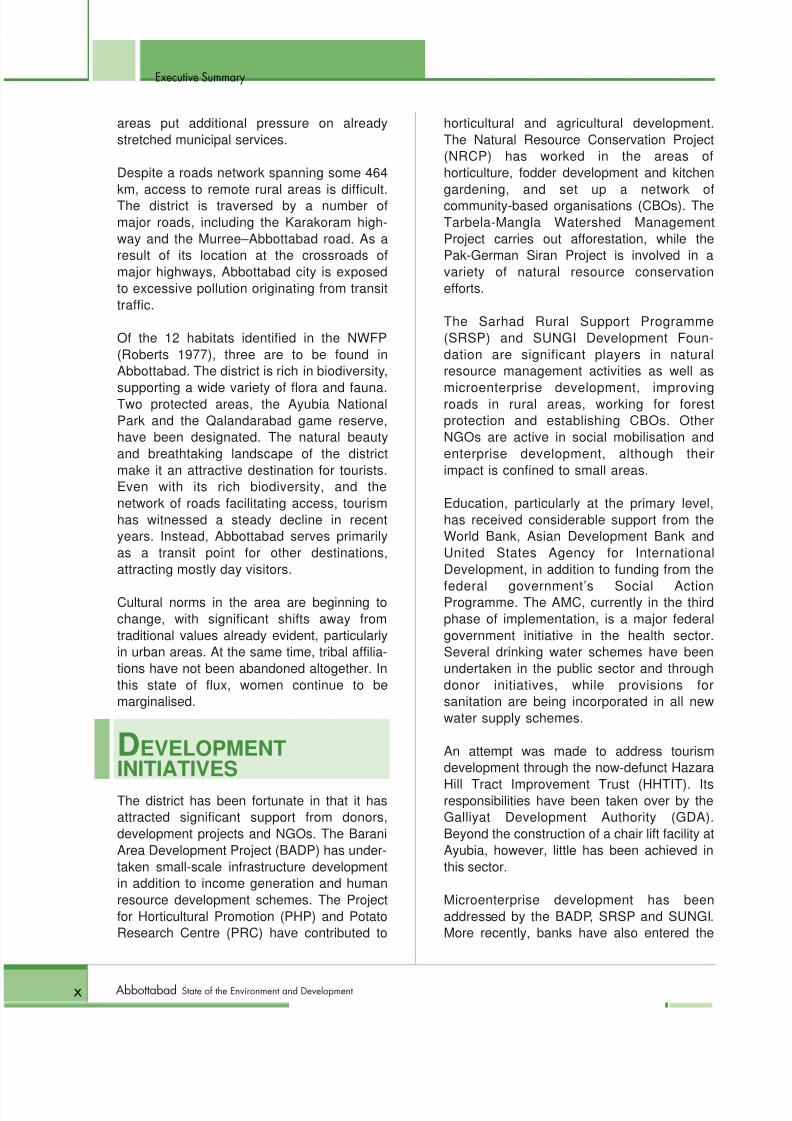
DEVELOPMENTINITIATIVESThe district has been fortunate in that it hasattracted significant support from donors,development projects and NGOs. The BaraniArea Development Project (BADP) has under-taken small-scale infrastructure developmentin addition to income generation and humanresource development schemes. The Projectfor Horticultural Promotion (PHP) and PotatoResearch Centre (PRC) have contributed to
horticultural and agricultural development.The Natural Resource Conservation Project(NRCP) has worked in the areas ofhorticulture, fodder development and kitchen
gardening, and set up a network ofcommunity-based organisations (CBOs). TheTarbela-Mangla Watershed ManagementProject carries out afforestation, while thePak-German Siran Project is involved in avariety of natural resource conservationefforts.
The Sarhad Rural Support Programme(SRSP) and SUNGI Development Foun-dation are significant players in naturalresource management activities as well as
microenterprise development, improvingroads in rural areas, working for forestprotection and establishing CBOs. OtherNGOs are active in social mobilisation andenterprise development, although theirimpact is confined to small areas.
Education, particularly at the primary level,has received considerable support from theWorld Bank, Asian Development Bank andUnited States Agency for InternationalDevelopment, in addition to funding from the
federal government’s Social ActionProgramme. The AMC, currently in the thirdphase of implementation, is a major federalgovernment initiative in the health sector.Several drinking water schemes have beenundertaken in the public sector and throughdonor initiatives, while provisions forsanitation are being incorporated in all newwater supply schemes.
An attempt was made to address tourismdevelopment through the now-defunct Hazara
Hill Tract Improvement Trust (HHTIT). Itsresponsibilities have been taken over by theGalliyat Development Authority (GDA).Beyond the construction of a chair lift facility atAyubia, however, little has been achieved inthis sector.
Microenterprise development has beenaddressed by the BADP, SRSP and SUNGI.More recently, banks have also entered the
x Abbottabad State of the Environment and Development
8/9/2019 Abbottabad Soed
http://slidepdf.com/reader/full/abbottabad-soed 13/150
Executive Summary
field, with the Bank of Khyber emerging as amajor lender for small enterprise. The ExportPromotion Bureau (EPB) and Small IndustriesDevelopment Board are attempting to promote
larger business ventures.
ACHIEVEMENTS ANDSHORTFALLSWhile many indicators for development in thedistrict show progress over recent years, withhigher literacy, improved infrastructure andincreased drinking water supply, there is stillroom for improvement in many areas. Nosimple solution or single sector can be high-
lighted as critical to achieving such improve-ment. In fact, development issues confrontingthe district are broad-based, cutting acrosssectoral boundaries as well as functionaldivisions. Improving governance, access toresources, developing capacity and diversify-ing income generation are a few such areas,where only a multi-sectoral approach has anyhope of yielding positive and sustainableresults.
The district remains a significant importer of
cereals and is capable of meeting barely 30%of its wheat needs locally. Although theeconomy is dominated by natural resource-based sectors and industries, coordinationbetween green sector governmentdepartments is practically non-existent.Departmental performance is strait-jacketedby an outdated administrative outlook as wellas myopia. The forest authorities focusalmost exclusively on timber, while the agri-culture department’s activities are restrictedto cursory extension activities. One immedi-
ate consequence of this narrow vision is theneglect of rangelands and fodder supplyissues. Watershed programmes have dis-played a similar tunnel vision, resulting inchronic feed and fodder shortages. Thescarcity of animal feed in turn restricts expan-sion of the poultry and livestock sectors.
Expansion in the livestock, poultry andmicroenterprise sectors is particularly impor-
tant for a district such as Abbottabad, whereonly incremental gains are possible inagriculture. These sectors can serve toalleviate poverty by creating alternative
avenues of income generation. Diversifyingthe scope of economic activity can help tomitigate the pressure on natural resourcesas well. Despite the many advantagesinvolved, these sectors have not receivedsufficient attention.
By creating opportunities for employment,education also serves as a critical componentof poverty alleviation programmes. InAbbottabad, literacy has increased in recentyears but participation rates are dismal,
declining steadily at higher levels ofeducation, particularly among females and inrural areas. Repeat ratios and drop-out ratesare also high, with quality, accessibility andgender equity emerging as recurringproblems at all levels.
On paper, the district’s health statistics seemimpressive. Abbottabad’s position comparedto the province as a whole is ahead on majorindicators but the figures belie issues ofaccess for the vast majority of rural residents.
High investment in tertiary health care, at theexpense of preventive efforts, and poorcoverage are dominant concerns in thissector. Problems with regard to basic healthunits and rural health centres are rarelyaddressed.
Drinking water supply is another area wherestatistics are misleading. Although coveragehas expanded, this has not been matched byan improvement in the quality of watersupplied. Widespread contamination, owing
largely to poor waste management, is causefor serious concern. The obsolete supplysystem is difficult to upgrade, while irrationaluser charges make the current arrangementfinancially unviable.
High unemployment and a predominantlyyouthful population, coupled with populationgrowth and increasing urbanisation, lead tointense competition for scarce resources. In
xiAbbottabad State of the Environment and Development
8/9/2019 Abbottabad Soed
http://slidepdf.com/reader/full/abbottabad-soed 14/150
Executive Summary
the absence of much-needed regulation andenforcement mechanisms, current activities ina number of sectors are undertaken with noregard whatsoever for the long-term conse-
quences. The district’s fragile ecosystem issubjected to further strain in the form of hap-hazard and illegal construction, and pollutionfrom transit traffic. To curb these trends, landuse and zoning laws are urgently neededalong with strict enforcement of theenvironmental impact assessment regime forall new projects.
While environmental degradation is a seriousconcern in and of itself, pollution, congestionand unsanitary conditions also adverselyimpact a number of other sectors.
Abbottabad’s potential as a tourist destina-tion, for instance, suffers as a result. Thetourism sector has also been subject toofficial neglect. The poor track record of theHHTIT and the administrative limbo in whichthe GDA is currently mired have contributedto a drastic decline in tourist numbers.
xii Abbottabad State of the Environment and Development
8/9/2019 Abbottabad Soed
http://slidepdf.com/reader/full/abbottabad-soed 15/150
Background
PART I
8/9/2019 Abbottabad Soed
http://slidepdf.com/reader/full/abbottabad-soed 16/150
2 Abbottabad State of the Environment and Development
District Profile
District Abbottabad was once part of theHazara division, which covered the
present-day districts of Abbottabad,Battagram, Haripur, Kohistan and Mansehra.The district takes its name from the city ofAbbottabad, named after Major James Abbot,the first deputy commissioner of Hazara, whoserved from 1849 to 1853 under the Britishcolonial administration of India. The terrain of thearea is both rugged and scenic, and its locationat the base of the Himalayas lends it a temper-
ate climate throughout most of the year. Situatedbetween 33°50’ and 34°23’ North, and 73° 35’and 73° 31’ East, Abbottabad is bordered byMansehra district in the North, Muzzafarabadand Rawalpindi districts in the East, Haripur andRawalpindi districts in the South and Haripurdistrict in the West (Annex 3) .
Abbottabad
8/9/2019 Abbottabad Soed
http://slidepdf.com/reader/full/abbottabad-soed 17/150
Abbottabad District Profile
3Abbottabad State of the Environment and Development
1P HYSICAL FEATURES ANDTOPOGRAPHY
Spread over an area of 1,967 km2
(178,401 ha),Abbottabad district is located in predominantlymountainous terrain. The average elevation ofpeaks in the district ranges from 2,500 m to2,700 m (the Miranjani peak at 3,313 m is thehighest point). These mountains form part of thelesser Himalayas and dominate the landscape.The Dongagali range hugs the right banks of theKunhar and Jhelum rivers, entering the districtfrom the north. It has several offshoots that varyin elevation from 2,500 m to 2,700 m. A numberof spurs project on either side of this range, with
those towards the west varying in elevation from600 m to 1,500 m.
The mountains gradually give way to a series ofvalleys. On the northern border of the district, aseries of low-lying hills forms a barrier to theMangal tract in Mansehra. To the south of thesehills lies the Rash plain, covering an area of 6km2. Once a vast lake, the centre of this plain ismarshy to this day, although most of this area isnow drained and ideally suited to growing maizeand potatoes. Another such area is the Dhan
tract, an elevated basin enclosed by the Narahills. Other small cultivable tracts lie along thevalleys of rivers and streams, among them theplain tract of the Dor valley to the south, whichmerges with the Haripur plains, and the Loratract which lies on the Dhund branch of upperHaro river.
The district is drained by perennial streams, drystreams and nullahs . The central region, a majorsurface area, is drained by the Daur river whichoriginates at the northern end of the Nathiagali
range and joins the Siran river near the town ofHaripur. The elevation of this sub-watershedvaries from less than 600 m near ShahMaqsood to 2,979 m at Miranjani. The upperreaches of the watershed are covered in mixedtemperate coniferous forests, the middlereaches in chir pine and the lower part withscrub forests. Grasslands are interspersed withforests and cropland to form a unique mosaic ofland use patterns.
The Haro river originates at the southern end ofthe Dongagali range and flows through the dis-trict as two separate streams. The northern orupper stream is known as the Karlal Haro while
the southern or lower section is called theDhund Haro. The Karlal Haro originates nearChanglagali and flows south to Satura village,
joining the second branch near the Jabri forestrest house. The Dhund Haro originates nearKuldana and flows down to the north of Lora vil-lage. Ultimately, both streams of the Haro riverfall into the Khanpur lake. The highest point ofthe Dhund Haro watershed is 1,725 m nearLora. The upper reaches and left bank of theKarlal Haro are covered with chir pine forests,while the cooler areas around Dhund Haro are
covered in natural and planted forests of chir pine, extending into the Satura and Makhnialforest ranges of Haripur Forest Division. Themiddle and lower parts consist of shrub forests,grasslands and cultivated fields. The Siran riverenters the district from the north-west and flowssouth along Abbottabad’s western border, exit-ing the district near Kachhi village.
These rivers sprout countless tributaries, someof which are permanent (known as a katha )while others experience seasonal flows (known
as kassi ). In addition to the main streams, theKunhar river flows along the north-easternboundary of the district, joining the Jhelumriver in the east. The Jhelum river itself flowsalong the eastern boundary of the district forsome 50 km.
GEOLOGY AND SOILAbbottabad’s rocky ground is rich in minerals,containing deposits of biotite, granite, limestone,
phyllite, schist, slate, soapstone and quartz.These mineral soils occur as residual depositsin the hills and alluvial deposits on valley floors.Most of the soil is grey in colour (under moistforests) and coarse in texture. The soil is formedby snow deposits as well as water and sedi-mentary rock and is mostly dry-farmed for sub-sistence cropping. Farm soil may be classifiedinto four categories:i. loam and clay, mainly non-calcareous;
8/9/2019 Abbottabad Soed
http://slidepdf.com/reader/full/abbottabad-soed 18/150
Abbottabad District Profile
4 Abbottabad State of the Environment and Development
1ii. loam, steep and shallow soils (humid
mountainous region);iii. loam and clay, partly non-calcareous with
loess traces; and
iv. loam with stones, and shallow (sub-humidmountain region).
The mountain ridges and terraces lying on thewestern and eastern boundaries of the districtare severely eroded as a result of landslides,landslips, rock falls and debris flows. Inceptisolsand chromudertic soils are the most commonsoil types found in the district. The inceptisolsform level, productive basin plains, while thechromudertic soils form piedmonts and undu-lated, dissected gullied lands. The soils of
Ayubia and Bagnotar range from humid to sub-humid tropical continental.
The climate and topography of the district isdivided more or less naturally into three parts:i. the plains of Havelian and the Rash valley
in Abbottabad, suitable for vegetable andfruit production;
ii. the mild hills of the Tanawal–Sherwan belt,well suited for livestock and fodder; and
iii. the high hills of the Galliyat, suitable fortourism, forestry and some off-season veg-
etable cultivation.
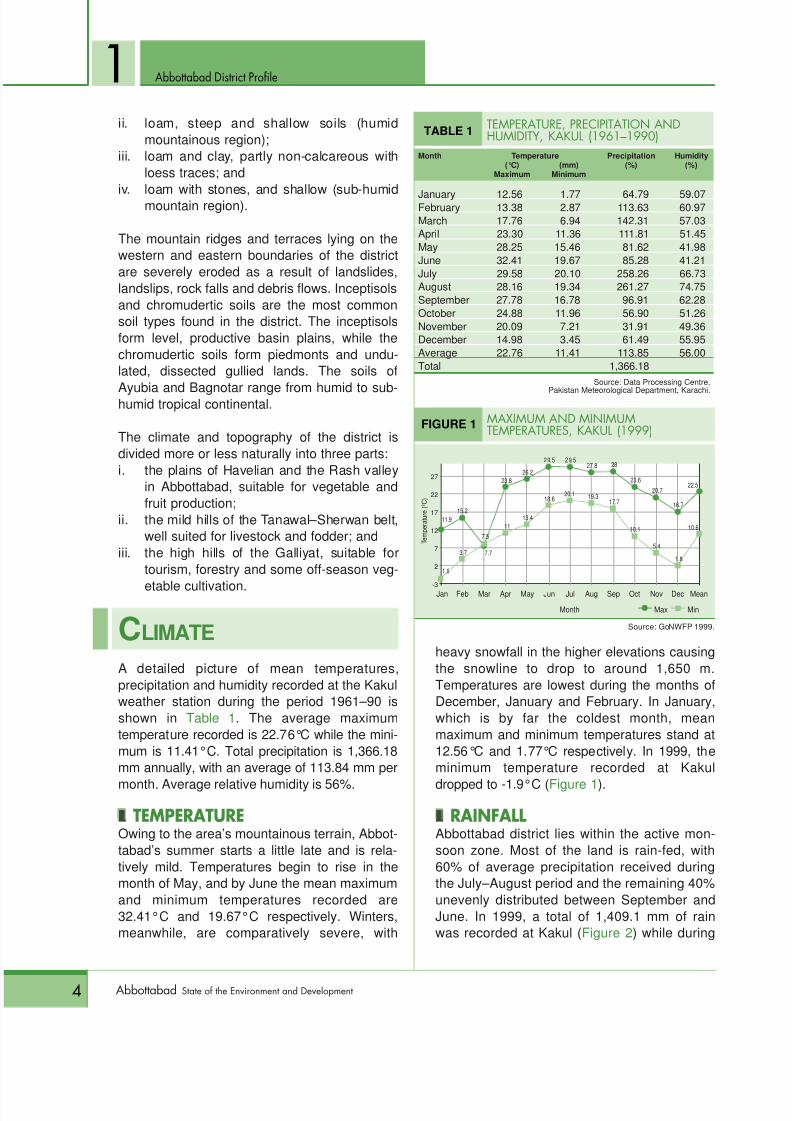
CLIMATEA detailed picture of mean temperatures,precipitation and humidity recorded at the Kakulweather station during the period 1961–90 isshown in Table 1 . The average maximumtemperature recorded is 22.76°C while the mini-mum is 11.41°C. Total precipitation is 1,366.18mm annually, with an average of 113.84 mm per
month. Average relative humidity is 56%.
snTEMPERATUREOwing to the area’s mountainous terrain, Abbot-tabad’s summer starts a little late and is rela-tively mild. Temperatures begin to rise in themonth of May, and by June the mean maximumand minimum temperatures recorded are32.41°C and 19.67°C respectively. Winters,meanwhile, are comparatively severe, with
heavy snowfall in the higher elevations causingthe snowline to drop to around 1,650 m.Temperatures are lowest during the months ofDecember, January and February. In January,which is by far the coldest month, meanmaximum and minimum temperatures stand at12.56°C and 1.77°C respectively. In 1999, theminimum temperature recorded at Kakul
dropped to -1.9°C ( Figure 1 ).
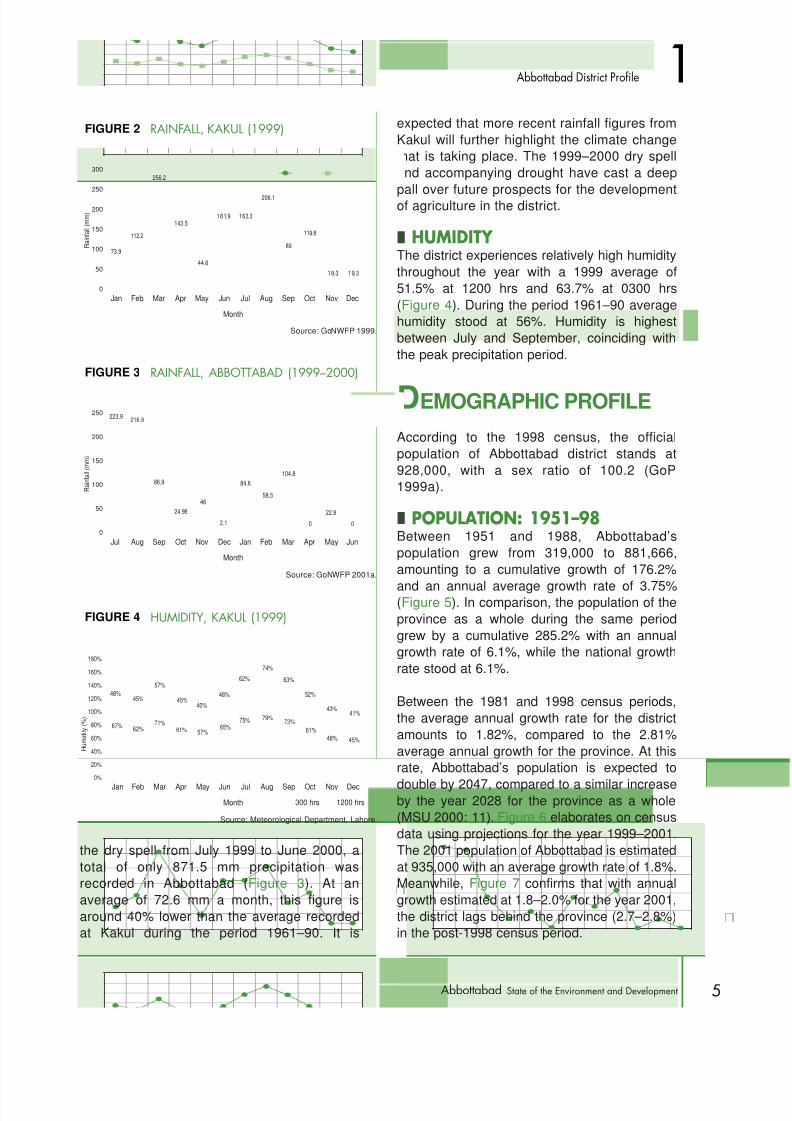
snRAINFALLAbbottabad district lies within the active mon-soon zone. Most of the land is rain-fed, with60% of average precipitation received duringthe July–August period and the remaining 40%unevenly distributed between September andJune. In 1999, a total of 1,409.1 mm of rainwas recorded at Kakul ( Figure 2 ) while during
TABLE 1 TEMPERATURE, PRECIPITATION ANDHUMIDITY, KAKUL (1961√1990)
Month Temperature Precipitation Humidity(°C) (mm) (%) (%)
Maximum Minimum
January 12.56 1.77 64.79 59.07February 13.38 2.87 113.63 60.97March 17.76 6.94 142.31 57.03April 23.30 11.36 111.81 51.45May 28.25 15.46 81.62 41.98June 32.41 19.67 85.28 41.21July 29.58 20.10 258.26 66.73August 28.16 19.34 261.27 74.75September 27.78 16.78 96.91 62.28October 24.88 11.96 56.90 51.26November 20.09 7.21 31.91 49.36December 14.98 3.45 61.49 55.95Average 22.76 11.41 113.85 56.00Total 1,366.18
Source: Data Processing Centre,
Pakistan Meteorological Department, Karachi.
Jan Feb Mar Apr May Jun Jul Aug Sep Oct Nov Dec Mean
FIGURE 1 MAXIMUM AND MINIMUMTEMPERATURES, KAKUL (1999)
27
22
17
12
7
2
-3
Max MinMonth
T e m p e r a t u r e ( º C )
11.9
1.9
3.7 7.7
13.4
18.620.1 19.3
17.7
10.1
5.4
1.8
10.611
15.2
7.5
23.826.2
29.5 29.527.8 28
23.620.7
16.7
22.5
Source: GoNWFP 1999.
8/9/2019 Abbottabad Soed
http://slidepdf.com/reader/full/abbottabad-soed 19/150
Abbottabad District Profile
5Abbottabad State of the Environment and Development
1
the dry spell from July 1999 to June 2000, atotal of only 871.5 mm precipitation wasrecorded in Abbottabad ( Figure 3 ). At anaverage of 72.6 mm a month, this figure isaround 40% lower than the average recordedat Kakul during the period 1961–90. It is
expected that more recent rainfall figures fromKakul will further highlight the climate changethat is taking place. The 1999–2000 dry spelland accompanying drought have cast a deep
pall over future prospects for the developmentof agriculture in the district.
snHUMIDITY The district experiences relatively high humiditythroughout the year with a 1999 average of51.5% at 1200 hrs and 63.7% at 0300 hrs(Figure 4 ). During the period 1961–90 averagehumidity stood at 56%. Humidity is highestbetween July and September, coinciding withthe peak precipitation period.
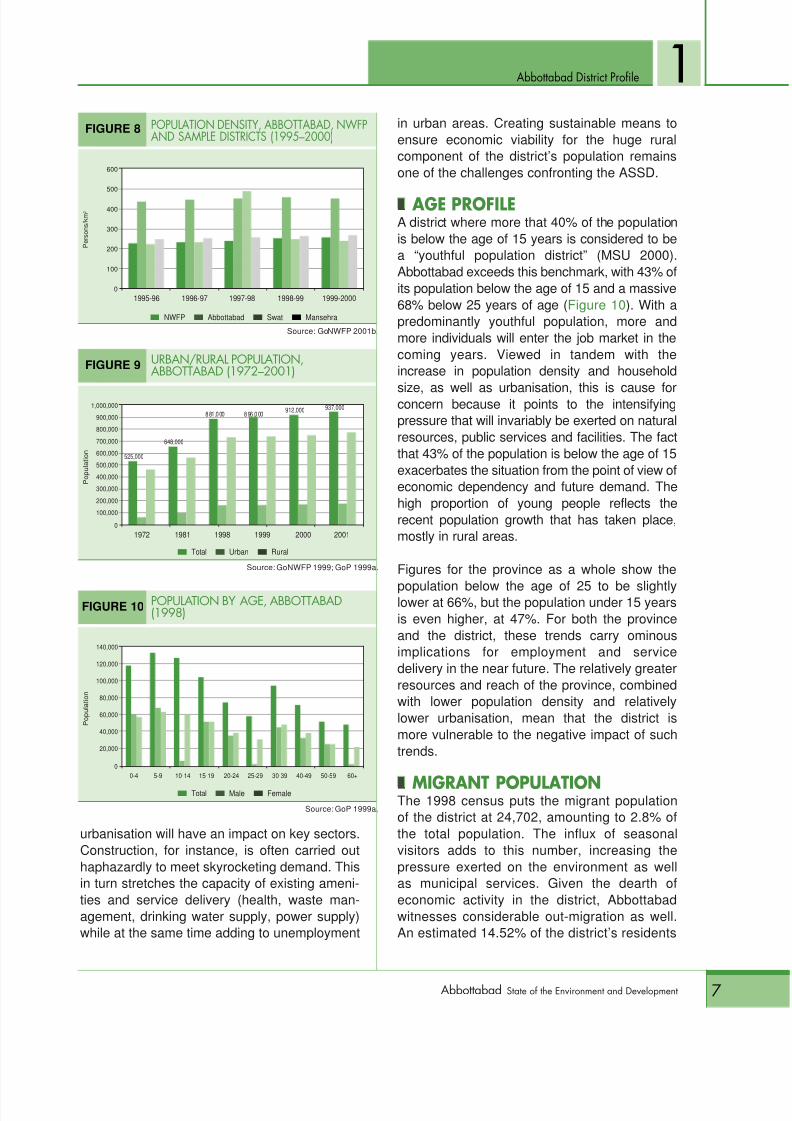
DEMOGRAPHIC PROFILEAccording to the 1998 census, the officialpopulation of Abbottabad district stands at928,000, with a sex ratio of 100.2 (GoP1999a).
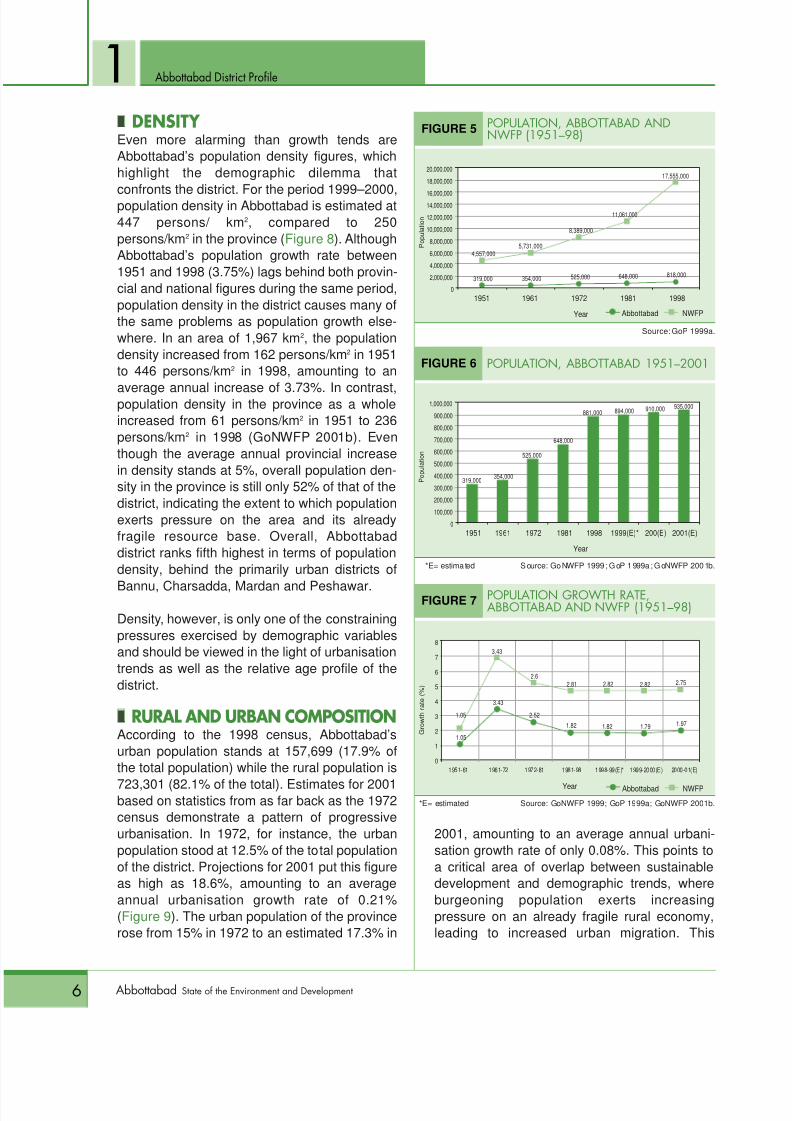
snPOPULATION: 1951√98Between 1951 and 1988, Abbottabad’spopulation grew from 319,000 to 881,666,amounting to a cumulative growth of 176.2%
and an annual average growth rate of 3.75%(Figure 5 ). In comparison, the population of theprovince as a whole during the same periodgrew by a cumulative 285.2% with an annualgrowth rate of 6.1%, while the national growthrate stood at 6.1%.
Between the 1981 and 1998 census periods,the average annual growth rate for the districtamounts to 1.82%, compared to the 2.81%average annual growth for the province. At thisrate, Abbottabad’s population is expected to
double by 2047, compared to a similar increaseby the year 2028 for the province as a whole(MSU 2000: 11). Figure 6 elaborates on censusdata using projections for the year 1999–2001.The 2001 population of Abbottabad is estimatedat 935,000 with an average growth rate of 1.8%.Meanwhile, Figure 7 confirms that with annualgrowth estimated at 1.8–2.0% for the year 2001,the district lags behind the province (2.7–2.8%)in the post-1998 census period.
Jan Feb Mar Apr May Jun Jul Aug Sep Oct Nov Dec
FIGURE 2 RAINFALL, KAKUL (1999)
300
250
200
150
100
50
0
Month
R a i n f a l l ( m m )
73.9
256.2
161.9 163.3
206.1
143.5
44.6
112.289
119.8
19.3 19.3
Source: GoNWFP 1999.
Jul Aug Sep Oct Nov Dec Jan Feb Mar Apr May Jun
FIGURE 3 RAINFALL, ABBOTTABAD (1999√2000)
250
200
150
100
50
0
Month
R a i n f a l l ( m m )
223.9
84.6
216.9
104.8
0
22.8
0
58.5
2.1
4624.98
86.9
Source: GoNWFP 2001a.
Jan Feb Mar Apr May Jun Jul Aug Sep Oct Nov Dec
FIGURE 4 HUMIDITY, KAKUL (1999)
180%
160%
140%
120%
100%
80%
60%
40%
20%
0%
300 hrs 1200 hrsMonth
H u m
i d i t y ( % )
40%
48%
62%
74%
63%
52%
43%41%
79%75%65%
57%61%71%
62%67% 73%61%
48% 45%
48%45%
57%
45%
Source: Meteorological Department, Lahore.
8/9/2019 Abbottabad Soed
http://slidepdf.com/reader/full/abbottabad-soed 20/150
Abbottabad District Profile
6 Abbottabad State of the Environment and Development
1snDENSITY Even more alarming than growth tends areAbbottabad’s population density figures, whichhighlight the demographic dilemma that
confronts the district. For the period 1999–2000,population density in Abbottabad is estimated at447 persons/ km 2, compared to 250persons/km 2 in the province ( Figure 8 ). AlthoughAbbottabad’s population growth rate between1951 and 1998 (3.75%) lags behind both provin-cial and national figures during the same period,population density in the district causes many ofthe same problems as population growth else-where. In an area of 1,967 km 2, the populationdensity increased from 162 persons/km 2 in 1951to 446 persons/km 2 in 1998, amounting to an
average annual increase of 3.73%. In contrast,population density in the province as a wholeincreased from 61 persons/km 2 in 1951 to 236persons/km 2 in 1998 (GoNWFP 2001b). Eventhough the average annual provincial increasein density stands at 5%, overall population den-sity in the province is still only 52% of that of thedistrict, indicating the extent to which populationexerts pressure on the area and its alreadyfragile resource base. Overall, Abbottabaddistrict ranks fifth highest in terms of populationdensity, behind the primarily urban districts of
Bannu, Charsadda, Mardan and Peshawar.
Density, however, is only one of the constrainingpressures exercised by demographic variablesand should be viewed in the light of urbanisationtrends as well as the relative age profile of thedistrict.
snRURAL AND URBAN COMPOSITIONAccording to the 1998 census, Abbottabad’surban population stands at 157,699 (17.9% ofthe total population) while the rural population is
723,301 (82.1% of the total). Estimates for 2001based on statistics from as far back as the 1972census demonstrate a pattern of progressiveurbanisation. In 1972, for instance, the urbanpopulation stood at 12.5% of the total populationof the district. Projections for 2001 put this figureas high as 18.6%, amounting to an averageannual urbanisation growth rate of 0.21%(Figure 9 ). The urban population of the provincerose from 15% in 1972 to an estimated 17.3% in
2001, amounting to an average annual urbani-sation growth rate of only 0.08%. This points toa critical area of overlap between sustainabledevelopment and demographic trends, whereburgeoning population exerts increasingpressure on an already fragile rural economy,leading to increased urban migration. This
1951 1961 1972 1981 1998
FIGURE 5 POPULATION, ABBOTTABAD ANDNWFP (1951√98)
20,000,000
18,000,000
16,000,00014,000,000
12,000,000
10,000,000
8,000,000
6,000,000
4,000,000
2,000,000
0
Year
P o p u l a t i o n
319,000
4,557,0005,731,000
8,389,000
17,555,000
354,000 525,000 648,000 818,000
Source: GoP 1999a.
11,061,000
Abbottabad NWFP
1951 1961 1972 1981 1998 1999(E)* 200(E) 2001(E)
FIGURE 6 POPULATION, ABBOTTABAD 1951√2001
1,000,000
900,000
800,000
700,000
600,000
500,000
400,000
300,000
200,000
100,000
0
Year
P o p u
l a t i o n
*E= estima ted S ource: Go NWFP 1999 ; G oP 1 999a ; G oNWFP 200 1b.
319,000 354,000
525,000
648,000
881,000 894,000 910,000 935,000
1951-61 1961-72 1972-81 1981-98 1998-99(E)* 1999-2000(E) 2000-01(E)
FIGURE 7 POPULATION GROWTH RATE,ABBOTTABAD AND NWFP (1951√98)
8
7
6
5
4
3
2
1
0
Year
G r o w
t h r a
t e ( % )
1.05
3.43
2.521.82 1.82 1.79 1.97
2.752.822.822.812.6
3.43
1.05
*E= estimated Source: GoNWFP 1999; GoP 1999a; GoNWFP 2001b.
Abbottabad NWFP
8/9/2019 Abbottabad Soed
http://slidepdf.com/reader/full/abbottabad-soed 21/150
8/9/2019 Abbottabad Soed
http://slidepdf.com/reader/full/abbottabad-soed 22/150
Abbottabad District Profile
8 Abbottabad State of the Environment and Development
1have migrated, with particularly high migrationtaking place during the period 1971–81 (Elahi,sector paper ‘Enterprise Development’). TheSUNGI baseline report for the year 1998
reveals that of the 3,613 households sampledin Abbottabad, as many as 86% had at leastone family member who had migrated (SUNGI2000). More than 70% of these migrantstravelled to other parts of the country while12% headed abroad. Of the total number ofmigrants, 20% were seasonal and only 3%categorised as daily. The report further showsthat of the sample population of 25,511, 15%were migrants, of whom 71% were in-countrymigrants, 10% out-country migrants and 19%daily or seasonal migrants.
Compared to their more commercially savvyneighbours in Haripur and Mansehra,Abbottabad’s residents are more likely to seekemployment. This is partly the result of Abbot-tabad’s former status as the headquarters ofHazara Division, which led to a heavy governmentand military presence in the area. The Divisionwas abolished in 2001, following the launch of thedevolution process. But even today, governmentservice makes up a high proportion of overallemployment in the district. Government jobs in
turn often entail transfers. In light of the economiclimitations of the district, this bias in favour ofemployment as opposed to trade indicates thatout-migration must be high. Studies need to becarried out to determine the exact quantum of thismovement of labour and the associated socio-cul-tural impacts. Given the high population density,migration out of the district is not thought to havea significant negative impact, while remittancesmay actually serve to boost the local economy.
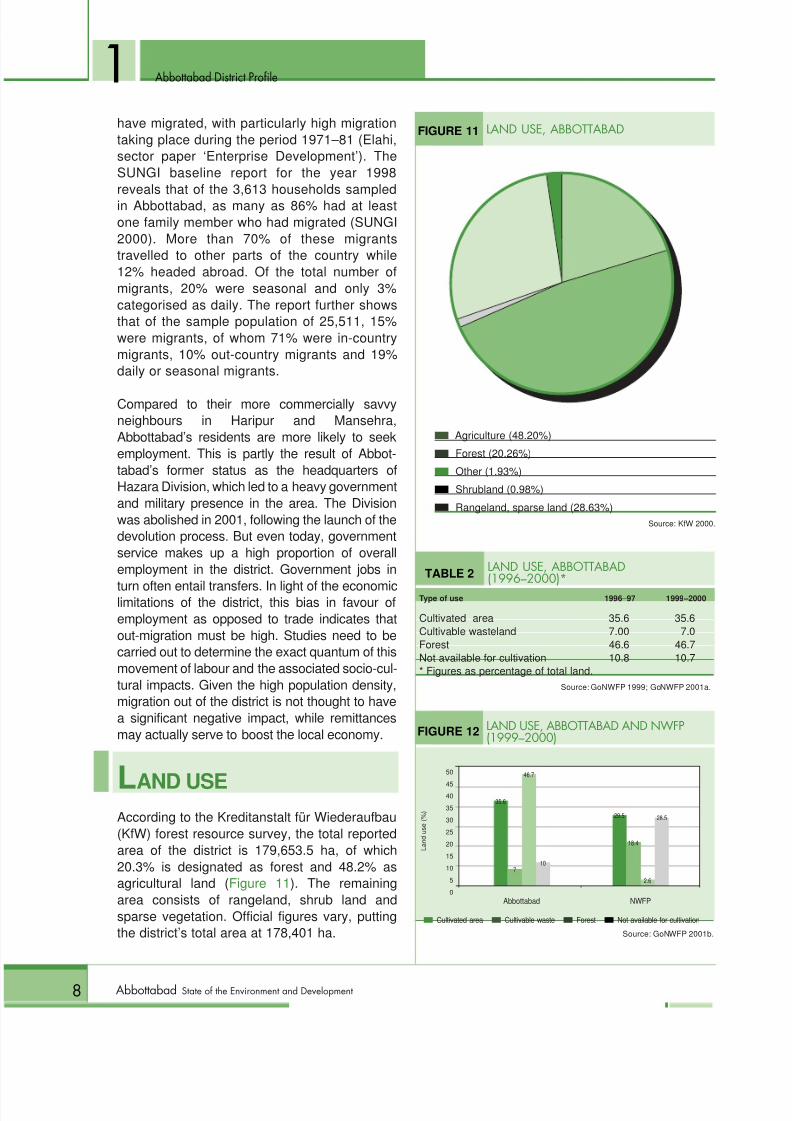
LAND USEAccording to the Kreditanstalt für Wiederaufbau(KfW) forest resource survey, the total reportedarea of the district is 179,653.5 ha, of which20.3% is designated as forest and 48.2% asagricultural land ( Figure 11 ). The remainingarea consists of rangeland, shrub land andsparse vegetation. Official figures vary, puttingthe district’s total area at 178,401 ha.
FIGURE 11 LAND USE, ABBOTTABAD
s Agriculture (48.20%)s Forest (20.26%)s Other (1.93%)s Shrubland (0.98%)s Rangeland, sparse land (28.63%)
Source: KfW 2000.
Abbottabad NWFP
FIGURE 12 LAND USE, ABBOTTABAD AND NWFP(1999√2000)
50
4540
35
30
25
20
15
10
5
0
s Cultivated area s Cultivable waste s Forest s Not available for cultivation
L a n d u s e
( % )
Source: GoNWFP 2001b.
35.6
7
46.7
10
29.5
18.4
2.6
28.5
TABLE 2 LAND USE, ABBOTTABAD(1996√2000)*
Type of use 1996–97 1999–2000
Cultivated area 35.6 35.6Cultivable wasteland 7.00 7.0Forest 46.6 46.7Not available for cultivation 10.8 10.7* Figures as percentage of total land.
Source: GoNWFP 1999; GoNWFP 2001a.
8/9/2019 Abbottabad Soed
http://slidepdf.com/reader/full/abbottabad-soed 23/150
Abbottabad District Profile
9Abbottabad State of the Environment and Development
1Land use in the district based on official statis-tics ( Table 2 ) employ a different system of tech-nical demarcation. These figures show that arelatively high proportion of land in Abbottabad
is classified as cultivated (35.6%), compared tothe province as a whole (29.9%) ( Figure 12 ).Forest land in the district (46.7%) also exceedsthat in the province (23.6%). Meanwhile, mostof the land that is suitable for agriculture isalready being cultivated. The percentage ofland not available for cultivation is relatively low(10.7%) in Abbottabad compared to theprovince (28.5%). In terms of land use trendsduring the period 1996–2000, there is nosignificant variation.
For the purpose of our analysis, the KfW fig-ures are retained only where absolutely neces-
sary, while official figures have been used formost calculations. It is worth noting that,besides variations in available agriculture,forest and development statistics, considerableconfusion also prevails in the use of terminol-ogy and interpretation. The glossary of techni-cal terms and concepts attempts to clarifysome of this confusion for the general reader(Annex 1 ).
Despite technical and definitional variations, thefigures indicate that land resources in Abbot-tabad are already under severepressure and close to depletion. As such, only
incremental increases in output can beexpected and that too with cost-benefit trade-offs. This highlights the need to find alternatevenues for investment and underscores theimportance of optimising agricultural output in asustainable manner.
The district is heavily rain dependent, with only0.399% of the total area under irrigation,compared to 11.1% in the whole of the North-West Frontier Province (NWFP) and 14.7% for
settled districts in the
province (GoNWFP2001a). As a conse-quence, figures forAbbottabad show 14 per-sons per cultivated ha(compared to 11 for theprovince as a whole) and126 persons per irrigatedha (compared to 23 forthe province). In addi-tion, the location of thedistrict and the nature of
the terrain make the pur-suit of new irrigationinfrastructure economi-cally unviable.
Cropping intensity in thedistrict is high, at 88.28%(compared to 111.51% forthe province), partly owingto the shortage of water
which limits double-cropping (GoNWFP 2001a).Intensity of land use in the district is also high, at
81.7% (compared to. 61.6% for the province).
The cumulative effect of these factors is thatagriculture cannot realistically be viewed as asector upon which future initiatives for sustain-able development may be anchored. Crop rota-tion, the use of improved seed/cultivars, moreefficient agricultural practices (the ‘extension’aspect), and a small increase in water supplythrough economic use and harvesting, are a few
Despite technical and definitionalvariations, available figures indicatethat land resources in Abbottabadare under severe pressure. As such,only incremental increases inagricultural output can be expected,and that too with cost-benefittrade-offs. This highlights the needto find alternate venues forinvestment and underscores theimportance of optimisingagricultural output in a sustainablemanner.
8/9/2019 Abbottabad Soed
http://slidepdf.com/reader/full/abbottabad-soed 24/150
Abbottabad District Profile
10 Abbottabad State of the Environment and Development
1of the options available to improve the function-ing of the sector. But no major or dramaticincrease in output is possible. As such, if sus-tainable development is to become a realistic
goal, capable of addressing the environmental,social and economic targets intrinsic to theprocess, then the focus will need to shift awayfrom agriculture and the district’s economy willneed to be diversified.
EMPLOYMENTCurrent international indicators classify povertyon the basis of average daily income (less than$1/day, based on purchasing power) or bench-
marks such as a daily calorie intake (2,550 calo-ries/day), determined by the United Nations. Nosuch data are available for Abbottabad. In theabsence of reliable and consensual indicatorsfor the district, the ASSD relies on census dataalong with crude indicators for poverty culledfrom other sources.
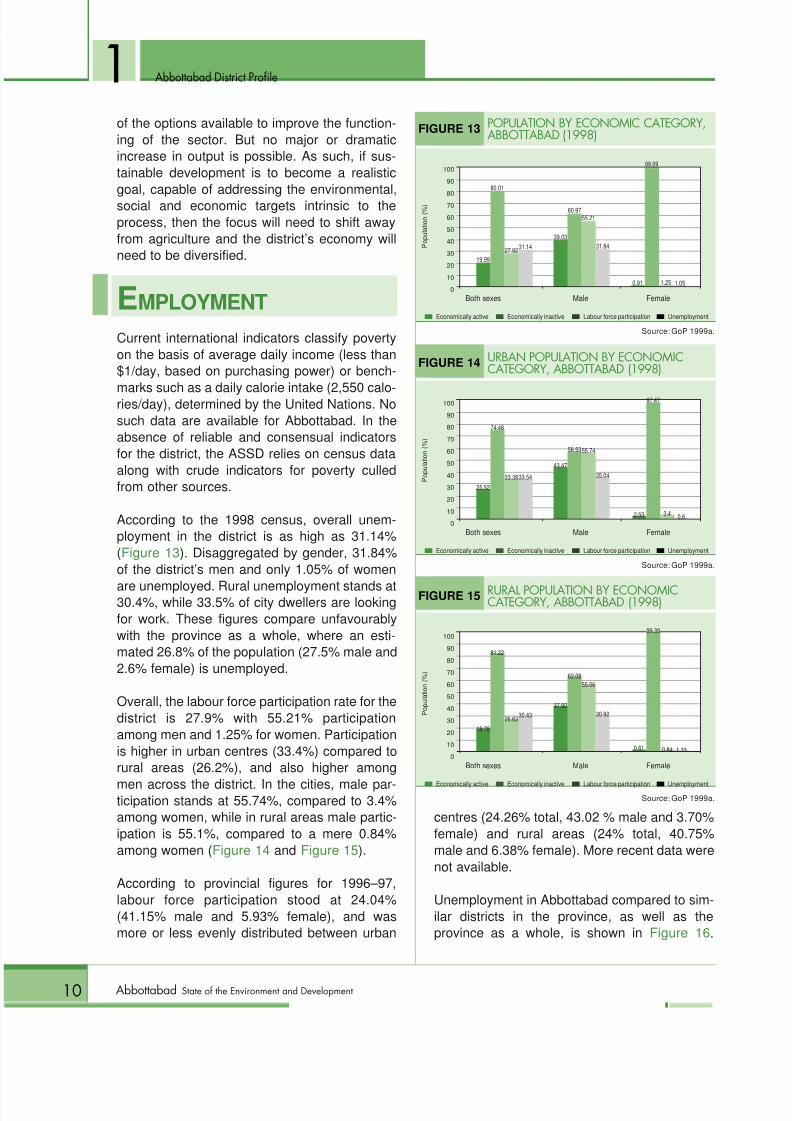
According to the 1998 census, overall unem-ployment in the district is as high as 31.14%(Figure 13 ). Disaggregated by gender, 31.84%of the district’s men and only 1.05% of women
are unemployed. Rural unemployment stands at30.4%, while 33.5% of city dwellers are lookingfor work. These figures compare unfavourablywith the province as a whole, where an esti-mated 26.8% of the population (27.5% male and2.6% female) is unemployed.
Overall, the labour force participation rate for thedistrict is 27.9% with 55.21% participationamong men and 1.25% for women. Participationis higher in urban centres (33.4%) compared torural areas (26.2%), and also higher among
men across the district. In the cities, male par-ticipation stands at 55.74%, compared to 3.4%among women, while in rural areas male partic-ipation is 55.1%, compared to a mere 0.84%among women ( Figure 14 and Figure 15 ).
According to provincial figures for 1996–97,labour force participation stood at 24.04%(41.15% male and 5.93% female), and wasmore or less evenly distributed between urban
centres (24.26% total, 43.02 % male and 3.70%female) and rural areas (24% total, 40.75%male and 6.38% female). More recent data werenot available.
Unemployment in Abbottabad compared to sim-ilar districts in the province, as well as theprovince as a whole, is shown in Figure 16 .
Both sexes Male Female
FIGURE 13 POPULATION BY ECONOMIC CATEGORY,ABBOTTABAD (1998)
100
90
8070
60
50
40
30
20
10
0
s Economically active s Economically inactive s Labour force participation s Unemployment
P o p u l a t i o n
( % )
Source: GoP 1999a.
19.99
80.01
27.9231.1439.03
60.9755.21
31.84
0.91
99.09
1.25 1.05
Both sexes Male Female
FIGURE 14 URBAN POPULATION BY ECONOMICCATEGORY, ABBOTTABAD (1998)
100
90
80
70
60
50
40
30
20
10
0
s Economically active s Economically inactive s Labour force participation s Unemployment
P o p u l a t i o n
( % )
Source: GoP 1999a.
25.52
74.48
33.3833.54
43.47
56.5355.74
35.04
2.53
97.47
3.4 0.6
Both sexes Male Female
FIGURE 15 RURAL POPULATION BY ECONOMICCATEGORY, ABBOTTABAD (1998)
100
90
80
70
60
50
40
30
20
10
0
s Economically active s Economically inactive s Labour force participation s Unemployment
P o p u
l a t i o n ( % )
Source: GoP 1999a.
18.78
81.22
26.6330.43
0.61
99.39
0.84 1.33
55.0662.08
30.9237.92
8/9/2019 Abbottabad Soed
http://slidepdf.com/reader/full/abbottabad-soed 25/150
Abbottabad District Profile
11Abbottabad State of the Environment and Development
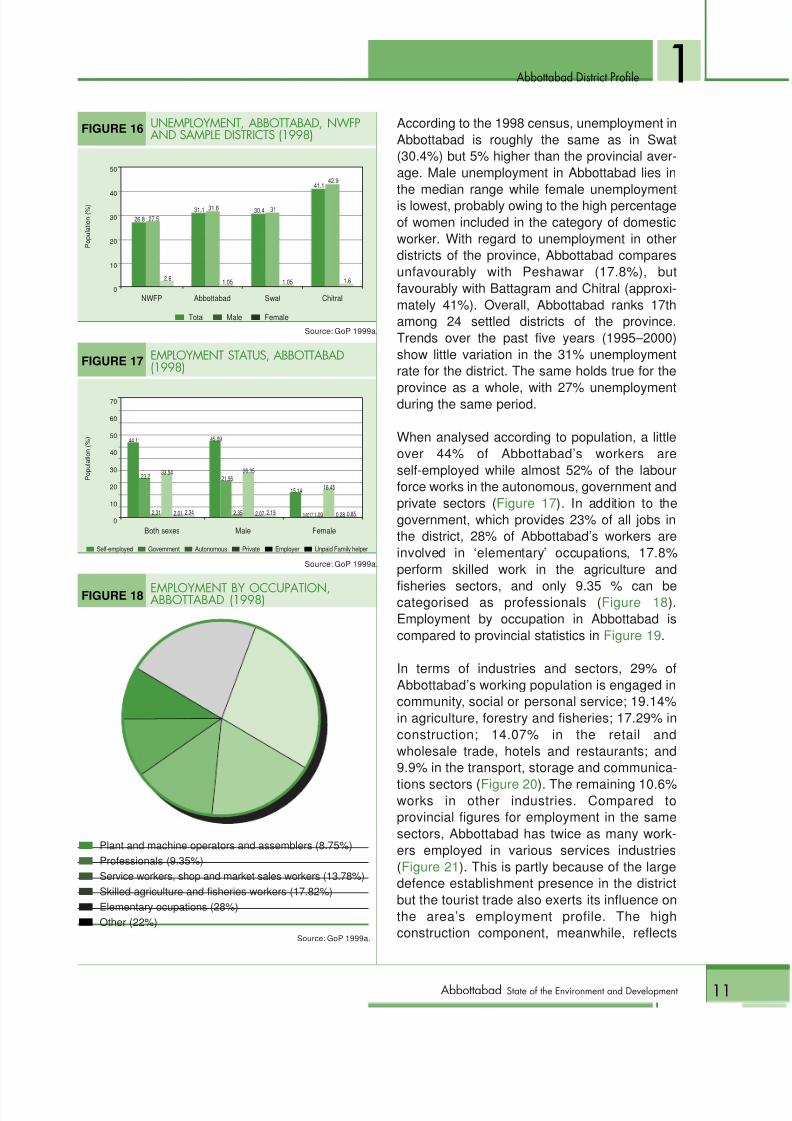
1According to the 1998 census, unemployment inAbbottabad is roughly the same as in Swat(30.4%) but 5% higher than the provincial aver-age. Male unemployment in Abbottabad lies in
the median range while female unemploymentis lowest, probably owing to the high percentageof women included in the category of domesticworker. With regard to unemployment in otherdistricts of the province, Abbottabad comparesunfavourably with Peshawar (17.8%), butfavourably with Battagram and Chitral (approxi-mately 41%). Overall, Abbottabad ranks 17thamong 24 settled districts of the province.Trends over the past five years (1995–2000)show little variation in the 31% unemploymentrate for the district. The same holds true for the
province as a whole, with 27% unemploymentduring the same period.
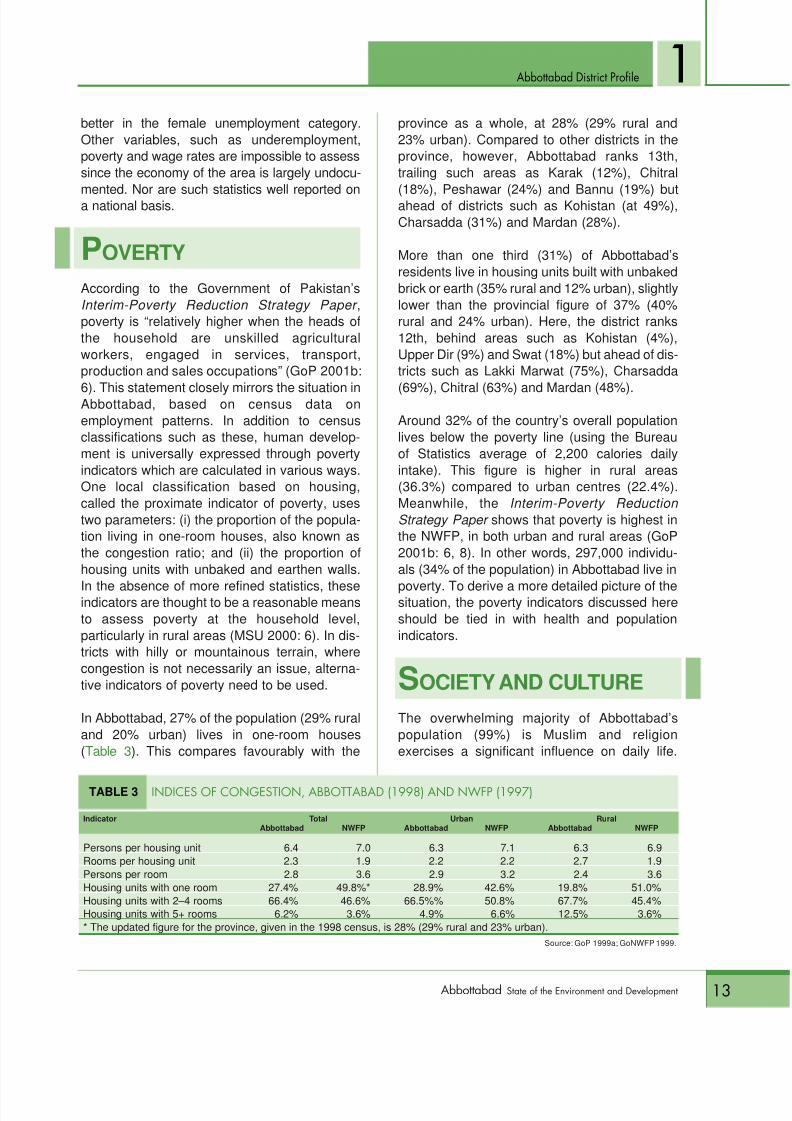
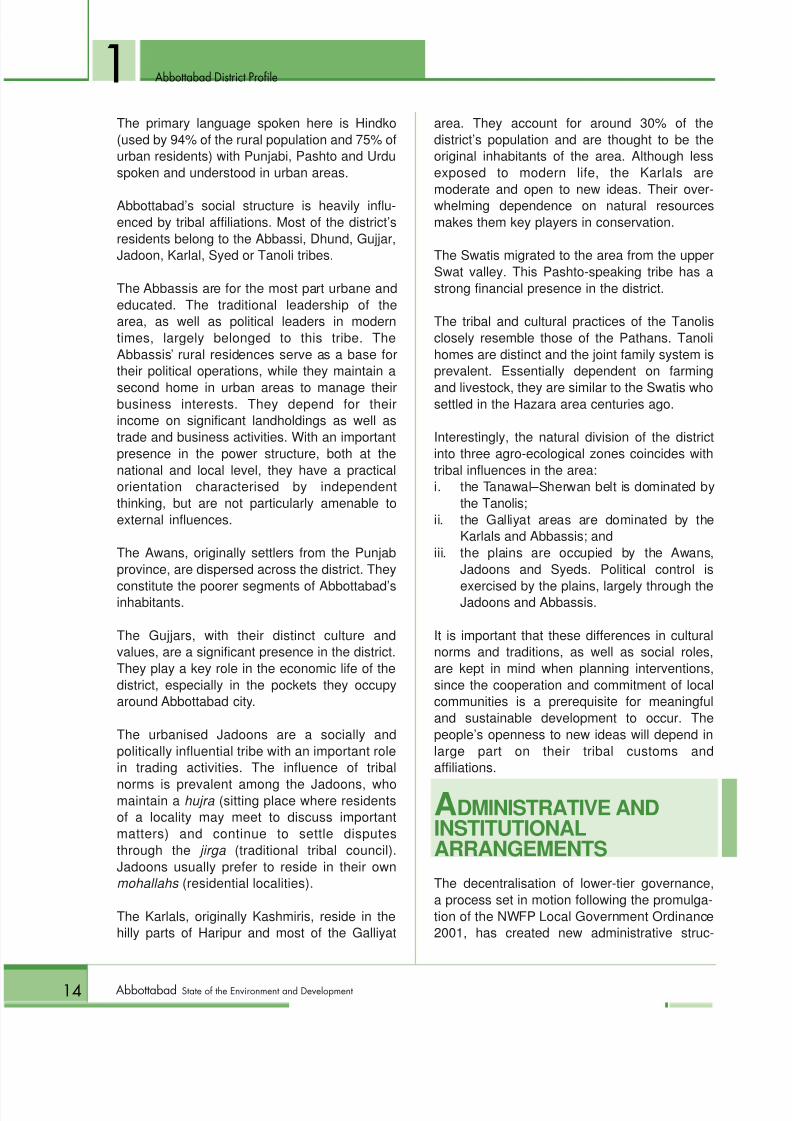
When analysed according to population, a littleover 44% of Abbottabad’s workers areself-employed while almost 52% of the labourforce works in the autonomous, government andprivate sectors ( Figure 17 ). In addition to thegovernment, which provides 23% of all jobs inthe district, 28% of Abbottabad’s workers areinvolved in ‘elementary’ occupations, 17.8%perform skilled work in the agriculture and
fisheries sectors, and only 9.35 % can becategorised as professionals ( Figure 18 ).Employment by occupation in Abbottabad iscompared to provincial statistics in Figure 19 .
In terms of industries and sectors, 29% ofAbbottabad’s working population is engaged incommunity, social or personal service; 19.14%in agriculture, forestry and fisheries; 17.29% inconstruction; 14.07% in the retail andwholesale trade, hotels and restaurants; and9.9% in the transport, storage and communica-
tions sectors ( Figure 20 ). The remaining 10.6%works in other industries. Compared toprovincial figures for employment in the samesectors, Abbottabad has twice as many work-ers employed in various services industries(Figure 21 ). This is partly because of the largedefence establishment presence in the districtbut the tourist trade also exerts its influence onthe area’s employment profile. The highconstruction component, meanwhile, reflects
Both sexes Male Female
FIGURE 17 EMPLOYMENT STATUS, ABBOTTABAD(1998)
70
60
50
40
30
20
10
0
s Self-employed s Government s Autonomous s Private s Employer s Unpaid Family helper
P o p u l a t i o n
( % )
Source: GoP 1999a.
44.11
23.233.54
2.01 2.34
NWFP Abbottabad Swat Chitral
FIGURE 16 UNEMPLOYMENT, ABBOTTABAD, NWFPAND SAMPLE DISTRICTS (1998)
50
40
30
20
10
0
s Total s Male s Female
P o p u l a t i o n
( % )
Source: GoP 1999a.
26.8 27.5
2.6
31.1 31.8
1.05
30.4 31
1.05
41.142.9
1.6
2.31
45.09
21.9526.35
2.07 2.192.35
15.14
0.6017
16.45
0.28 0.851.09
FIGURE 18 EMPLOYMENT BY OCCUPATION,ABBOTTABAD (1998)
s Plant and machine operators and assemblers (8.75%)s Professionals (9.35%)s Service workers, shop and market sales workers (13.78%)s Skilled agriculture and fisheries workers (17.82%)s Elementary ocupations (28%)s Other (22%)
Source: GoP 1999a.

8/9/2019 Abbottabad Soed
http://slidepdf.com/reader/full/abbottabad-soed 26/150
Abbottabad District Profile
12 Abbottabad State of the Environment and Development
1the pressure of the tourist trade as well as theforces of urbanisation, infrastructure develop-ment and population growth. Despite thearea’s overwhelming dependence on natural
resources, less than half of Abbottabad’s work-ing population is employed in the agriculture,forestry, fishing and hunting sectors, comparedto the province. This indicates the relativelylimited potential of agriculture and points onceagain to the importance of diversifying thedistrict’s economy.
Another area of concern for Abbottabad is thehigh proportion of poorly skilled workers and therelatively greater number of service workers,probably owing to the seasonal push generated
by the tourist transport sector as well as thepopulation’s propensity to favour jobs asopposed to trade and commerce.
snCENSUS CLASSIFICATIONSCertain discrepancies in the statistics arise as aresult of the methodology used by the census(see glossary, particularly in relation to theterms ‘unemployment’ and ‘economicallyactive’). For instance, female unemployment isexcessively low because, according to thecensus, domestic work (70% of which is per-
formed by women) is classified as employmenteven though this category of work is not takeninto account when the economically activepopulation is calculated. Similarly, the labourforce participation rate, calculated in the censusas the percentage of the population aged 10years and above that is economically active,ignores the International Labour Organizationstandard of 15 years and above as a morehumane and acceptable cut-off point. Thus,figures for the economically active category andlabour force participation rates used in the
ASSD will differ from the data provided by thecensus. This fact needs to be underscored atthe stage of planning for poverty alleviation andsustainable development interventions.
Despite the definitional limitations of terms usedby the census bureau, the figures clearly showthat unemployment in Abbottabad is high in termsof both total unemployment and male unemploy-ment, and that the district fares only partially
Ski lled Elementary Services Profess ionals Plant and Otheragriculture and occupations workers, shop machine
fisheries and market operators andworkers sales workers assemblers
FIGURE 19 EMPLOYMENT BY OCCUPATION,ABBOTTABAD (1998) AND NWFP (1997)
40
30
20
10
0
s Abbottabad s NWFP
P o p u l a t i o n
( % )
Source: GoP 1999a.
35.9
2826.3
14
8.3 96.2
95.9
22
17.3518
Community, Agriculture, Construction Wholesale and Transport, Othersocial and forestry, retail trade, storage andpersonal fishing and restaurants communicationsservice hunting and hotels
FIGURE 21 EMPLOYMENT BY INDUSTRY,ABBOTTABAD (1998) AND NWFP (1997)
50
40
30
20
10
0
s Abbottabad s NWFP
E m p l o y m e n t
( % )
Source: GoP 1999a; GoNWFP 1999.
15.319
45.6
17
10.314
107.9
107.3
29
FIGURE 20 EMPLOYMENT BY INDUSTRY,ABBOTTABAD (1998)
s Transport, storage and communications (9.9%)s Wholesale and retail, restaurants and hotels (14.07%)s Construction (17.29%)s Community, social and personal service (29%)s Agriculture, forestry hunting and fishing (19.14%)s Other industries (10.06%)
Source: GoP 1999a.
8/9/2019 Abbottabad Soed
http://slidepdf.com/reader/full/abbottabad-soed 27/150
Abbottabad District Profile
13Abbottabad State of the Environment and Development
1better in the female unemployment category.Other variables, such as underemployment,poverty and wage rates are impossible to assesssince the economy of the area is largely undocu-
mented. Nor are such statistics well reported ona national basis.
P OVERTYAccording to the Government of Pakistan’sInterim-Poverty Reduction Strategy Paper ,poverty is “relatively higher when the heads ofthe household are unskilled agriculturalworkers, engaged in services, transport,production and sales occupations” (GoP 2001b:
6). This statement closely mirrors the situation inAbbottabad, based on census data onemployment patterns. In addition to censusclassifications such as these, human develop-ment is universally expressed through povertyindicators which are calculated in various ways.One local classification based on housing,called the proximate indicator of poverty, usestwo parameters: (i) the proportion of the popula-tion living in one-room houses, also known asthe congestion ratio; and (ii) the proportion ofhousing units with unbaked and earthen walls.
In the absence of more refined statistics, theseindicators are thought to be a reasonable meansto assess poverty at the household level,particularly in rural areas (MSU 2000: 6). In dis-tricts with hilly or mountainous terrain, wherecongestion is not necessarily an issue, alterna-tive indicators of poverty need to be used.
In Abbottabad, 27% of the population (29% ruraland 20% urban) lives in one-room houses(Table 3 ). This compares favourably with the
province as a whole, at 28% (29% rural and23% urban). Compared to other districts in theprovince, however, Abbottabad ranks 13th,trailing such areas as Karak (12%), Chitral
(18%), Peshawar (24%) and Bannu (19%) butahead of districts such as Kohistan (at 49%),Charsadda (31%) and Mardan (28%).
More than one third (31%) of Abbottabad’sresidents live in housing units built with unbakedbrick or earth (35% rural and 12% urban), slightlylower than the provincial figure of 37% (40%rural and 24% urban). Here, the district ranks12th, behind areas such as Kohistan (4%),Upper Dir (9%) and Swat (18%) but ahead of dis-tricts such as Lakki Marwat (75%), Charsadda
(69%), Chitral (63%) and Mardan (48%).
Around 32% of the country’s overall populationlives below the poverty line (using the Bureauof Statistics average of 2,200 calories dailyintake). This figure is higher in rural areas(36.3%) compared to urban centres (22.4%).Meanwhile, the Interim-Poverty Reduction Strategy Paper shows that poverty is highest inthe NWFP, in both urban and rural areas (GoP2001b: 6, 8). In other words, 297,000 individu-als (34% of the population) in Abbottabad live in
poverty. To derive a more detailed picture of thesituation, the poverty indicators discussed hereshould be tied in with health and populationindicators.
S OCIETY AND CULTUREThe overwhelming majority of Abbottabad’spopulation (99%) is Muslim and religionexercises a significant influence on daily life.
TABLE 3 INDICES OF CONGESTION, ABBOTTABAD (1998) AND NWFP (1997)
Indicator Total Urban RuralAbbottabad NWFP Abbottabad NWFP Abbottabad NWFP
Persons per housing unit 6.4 7.0 6.3 7.1 6.3 6.9Rooms per housing unit 2.3 1.9 2.2 2.2 2.7 1.9Persons per room 2.8 3.6 2.9 3.2 2.4 3.6Housing units with one room 27.4% 49.8%* 28.9% 42.6% 19.8% 51.0%Housing units with 2–4 rooms 66.4% 46.6% 66.5%% 50.8% 67.7% 45.4%Housing units with 5+ rooms 6.2% 3.6% 4.9% 6.6% 12.5% 3.6%* The updated figure for the province, given in the 1998 census, is 28% (29% rural and 23% urban).
Source: GoP 1999a; GoNWFP 1999.
8/9/2019 Abbottabad Soed
http://slidepdf.com/reader/full/abbottabad-soed 28/150
Abbottabad District Profile
14 Abbottabad State of the Environment and Development
1The primary language spoken here is Hindko(used by 94% of the rural population and 75% ofurban residents) with Punjabi, Pashto and Urduspoken and understood in urban areas.
Abbottabad’s social structure is heavily influ-enced by tribal affiliations. Most of the district’sresidents belong to the Abbassi, Dhund, Gujjar,Jadoon, Karlal, Syed or Tanoli tribes.
The Abbassis are for the most part urbane andeducated. The traditional leadership of thearea, as well as political leaders in moderntimes, largely belonged to this tribe. TheAbbassis’ rural residences serve as a base fortheir political operations, while they maintain a
second home in urban areas to manage theirbusiness interests. They depend for theirincome on significant landholdings as well astrade and business activities. With an importantpresence in the power structure, both at thenational and local level, they have a practicalorientation characterised by independentthinking, but are not particularly amenable toexternal influences.
The Awans, originally settlers from the Punjabprovince, are dispersed across the district. They
constitute the poorer segments of Abbottabad’sinhabitants.
The Gujjars, with their distinct culture andvalues, are a significant presence in the district.They play a key role in the economic life of thedistrict, especially in the pockets they occupyaround Abbottabad city.
The urbanised Jadoons are a socially andpolitically influential tribe with an important rolein trading activities. The influence of tribal
norms is prevalent among the Jadoons, whomaintain a hujra (sitting place where residentsof a locality may meet to discuss importantmatters) and continue to settle disputesthrough the jirga (traditional tribal council).Jadoons usually prefer to reside in their ownmohallahs (residential localities).
The Karlals, originally Kashmiris, reside in thehilly parts of Haripur and most of the Galliyat
area. They account for around 30% of thedistrict’s population and are thought to be theoriginal inhabitants of the area. Although lessexposed to modern life, the Karlals are
moderate and open to new ideas. Their over-whelming dependence on natural resourcesmakes them key players in conservation.
The Swatis migrated to the area from the upperSwat valley. This Pashto-speaking tribe has astrong financial presence in the district.
The tribal and cultural practices of the Tanolisclosely resemble those of the Pathans. Tanolihomes are distinct and the joint family system isprevalent. Essentially dependent on farming
and livestock, they are similar to the Swatis whosettled in the Hazara area centuries ago.
Interestingly, the natural division of the districtinto three agro-ecological zones coincides withtribal influences in the area:i. the Tanawal–Sherwan belt is dominated by
the Tanolis;ii. the Galliyat areas are dominated by the
Karlals and Abbassis; andiii. the plains are occupied by the Awans,
Jadoons and Syeds. Political control is
exercised by the plains, largely through theJadoons and Abbassis.
It is important that these differences in culturalnorms and traditions, as well as social roles,are kept in mind when planning interventions,since the cooperation and commitment of localcommunities is a prerequisite for meaningfuland sustainable development to occur. Thepeople’s openness to new ideas will depend inlarge part on their tribal customs andaffiliations.
ADMINISTRATIVE ANDINSTITUTIONALARRANGEMENTSThe decentralisation of lower-tier governance,a process set in motion following the promulga-tion of the NWFP Local Government Ordinance2001, has created new administrative struc-
8/9/2019 Abbottabad Soed
http://slidepdf.com/reader/full/abbottabad-soed 29/150
Abbottabad District Profile
15Abbottabad State of the Environment and Development
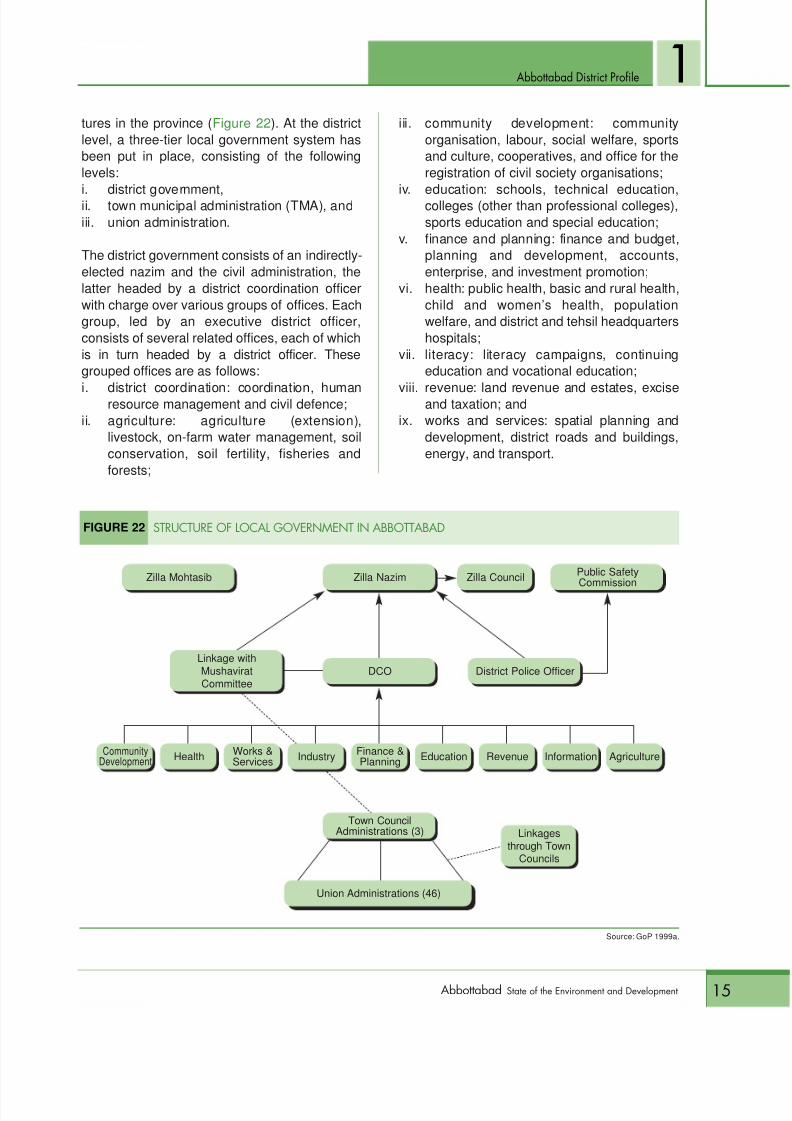
1tures in the province ( Figure 22 ). At the districtlevel, a three-tier local government system hasbeen put in place, consisting of the followinglevels:
i. district government,ii. town municipal administration (TMA), andiii. union administration.
The district government consists of an indirectly-elected nazim and the civil administration, thelatter headed by a district coordination officerwith charge over various groups of offices. Eachgroup, led by an executive district officer,consists of several related offices, each of whichis in turn headed by a district officer. Thesegrouped offices are as follows:
i. district coordination: coordination, humanresource management and civil defence;ii. agriculture: agriculture (extension),
livestock, on-farm water management, soilconservation, soil fertility, fisheries andforests;
iii. community development: communityorganisation, labour, social welfare, sportsand culture, cooperatives, and office for theregistration of civil society organisations;
iv. education: schools, technical education,colleges (other than professional colleges),sports education and special education;
v. finance and planning: finance and budget,planning and development, accounts,enterprise, and investment promotion;
vi. health: public health, basic and rural health,child and women’s health, populationwelfare, and district and tehsil headquartershospitals;
vii. literacy: literacy campaigns, continuingeducation and vocational education;
viii. revenue: land revenue and estates, exciseand taxation; andix. works and services: spatial planning and
development, district roads and buildings,energy, and transport.
FIGURE 22 STRUCTURE OF LOCAL GOVERNMENT IN ABBOTTABAD
Zilla Nazim Public SafetyCommissionZilla Mohtasib Zilla Council
CommunityDevelopment Health Works &
ServicesFinance &Planning Education Revenue Information Agriculture
District Police OfficerDCO
Town CouncilAdministrations (3)
Union Administrations (46)
Linkage withMushaviratCommittee
Industry
Linkagesthrough Town
Councils
Source: GoP 1999a.
8/9/2019 Abbottabad Soed
http://slidepdf.com/reader/full/abbottabad-soed 30/150
Abbottabad District Profile
16 Abbottabad State of the Environment and Development
1The district government answers to an electedzilla council, which has budget approval andsupervisory authority.
At the second tier of local government, the TMAis headed by an indirectly-elected town nazim,while a town municipal officer supervises eachof the three town councils. The TMA includesthe following functionaries:i. tehsil officer (municipal regulations):
responsible for business licenses; the man-agement of municipal land, estates, prop-erty, facilities, business and commercialenterprise; and the enforcement of munici-pal laws, rules and by-laws;
ii. tehsil officer (infrastructure and services):responsible for water, drainage, sewerageand sanitation; roads (other than provincialand district roads), streets and street
lighting; fire-fighting; and park services;iii. tehsil officer (planning): responsible forspatial planning and land use control;building control; and the coordination ofdevelopment plans and projects with unionadministrations, village councils and otherlocal governments; and
iv. tehsil officer (finance): responsible forbudgeting, revenues and accounts.
8/9/2019 Abbottabad Soed
http://slidepdf.com/reader/full/abbottabad-soed 31/150
17Abbottabad State of the Environment and Development
I n developing district-level strategies, the opera-tive principle is that decisions must be taken atthe grassroots level in consultation with stake-
holders. This is the only way to achieve the multi-
faceted objectives of the new development para-digm where sustainable development and povertyalleviation are pursued in tandem with naturalresource conservation and environmental protec-tion. As part of this wider strategy, IUCN-TheWorld Conservation Union established a SupportUnit in Abbottabad to liaise with the district admin-istration in setting the stage for the preparation ofthe ASSD.
S TRATEGY FORMULATION PROCESSThe Sarhad Provincial Conservation Strategy (SPCS) views publicconsultations as an integral part of the strategy formulationprocess. Seeking local opinion regarding sustainable developmentissues at the district level is an important first step. While ensuringthe participation of stakeholders at the grassroots level, this alsopromotes ownership and commitment among communities.
P rioritising Issues
8/9/2019 Abbottabad Soed
http://slidepdf.com/reader/full/abbottabad-soed 32/150
18 Abbottabad State of the Environment and Development
2 Prioritising Issues
The ASSD formulation process was launched inAbbottabad in September 1997. At that stage,
meetings and discussions were held with civilsociety representatives and government part-ners to introduce and explain the concept oflower-tier strategy formulation, as envisaged inthe SPCS. Following these exploratory andintroductory contacts, members for a Round-table and Steering Committee were identifiedwith the support of the district administration. Inearly 1998, the 73-member Roundtable and 12-member Steering Committee were officially noti-fied by the deputy commissioner’s office. Cross-sectoral representation was ensured in both
these bodies, which were expected to serve asforums that would provide a platform for localopinion, and act as a think tank to provide inputand guidance.
The first two meetings of the Steering Com-mittee in January and February 1998 identifieda number of issues perceived as central toattaining sustainable development in the dis-trict. Broadly categorised, key issues identifiedin these early consultations are as follows:
Rural Areass Roads and communications networks,s Drinking water and health,s Deforestation and land erosion, ands Education.
Urban Areass Sanitation and drainage,s Solid waste disposal, ands Air pollution.
These issues were put before the Roundtable inApril–May 1998 to seek comprehensive inputfrom a wider spectrum of civil society representa-tives and to set the stage for public consultations.
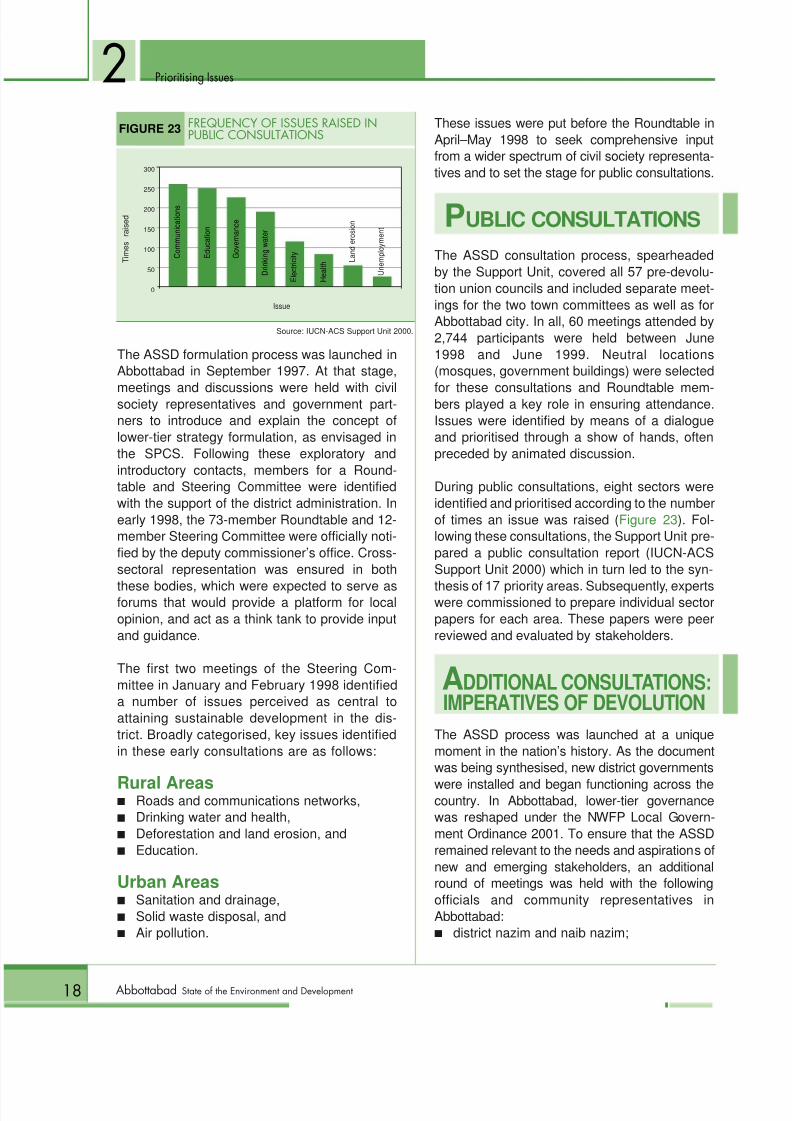
P UBLIC CONSULTATIONSThe ASSD consultation process, spearheadedby the Support Unit, covered all 57 pre-devolu-tion union councils and included separate meet-ings for the two town committees as well as forAbbottabad city. In all, 60 meetings attended by2,744 participants were held between June1998 and June 1999. Neutral locations(mosques, government buildings) were selected
for these consultations and Roundtable mem-bers played a key role in ensuring attendance.Issues were identified by means of a dialogueand prioritised through a show of hands, oftenpreceded by animated discussion.
During public consultations, eight sectors wereidentified and prioritised according to the numberof times an issue was raised ( Figure 23 ). Fol-lowing these consultations, the Support Unit pre-pared a public consultation report (IUCN-ACSSupport Unit 2000) which in turn led to the syn-
thesis of 17 priority areas. Subsequently, expertswere commissioned to prepare individual sectorpapers for each area. These papers were peerreviewed and evaluated by stakeholders.
A DDITIONAL CONSULTATIONS:IMPERATIVES OF DEVOLUTION
The ASSD process was launched at a uniquemoment in the nation’s history. As the documentwas being synthesised, new district governments
were installed and began functioning across thecountry. In Abbottabad, lower-tier governancewas reshaped under the NWFP Local Govern-ment Ordinance 2001. To ensure that the ASSDremained relevant to the needs and aspirations ofnew and emerging stakeholders, an additionalround of meetings was held with the followingofficials and community representatives inAbbottabad:s district nazim and naib nazim;
FIGURE 23 FREQUENCY OF ISSUES RAISED INPUBLIC CONSULTATIONS
300
250
200
150
100
50
0
Issue
T i m e s r a i s e d
Source: IUCN-ACS Support Unit 2000.
C o m m u
n i c a t i o n s
E d u
c a t i o n
G o v e r n a n c e
D r i n k i n g w
a t e r
E l e c t r i c i t y
H e a l t h L
a n d e r o s i o n
U n e m p l o y m
e n t
8/9/2019 Abbottabad Soed
http://slidepdf.com/reader/full/abbottabad-soed 33/150
19Abbottabad State of the Environment and Development
2Prioritising Issues
s district coordination officer and executive dis-trict officers for various areas includingfinance and planning, agriculture, education,health, community development, and works
and services;s key union council nazims; ands key stakeholders, including personnel from
the agricultural extension department, GDA,NRCP and SRSP; and representatives fromthe financial, commercial and non-govern-mental sectors.
Selected Roundtable members were also con-sulted to chalk out the future of the forum in thenew set-up. Further synthesis, analysis and dis-cussions with stakeholders brought to the fore
the following sectors in order of priority:i. infrastructure, roads and communications;
ii. education;iii. drinking water;iv. energy;v. health and population;
vi. agriculture and horticulture;vii. livestock and poultry;viii. forests and watersheds;ix. biodiversity, parks and protected areas;x. grazing lands and fodder reserves;xi. waste water and solid waste management;xii. enterprise development;xiii. gender;xiv. ecotourism;xv. culture;xvi. mining; andxvii. fisheries.

8/9/2019 Abbottabad Soed
http://slidepdf.com/reader/full/abbottabad-soed 34/150
Green Sectors
PART II
8/9/2019 Abbottabad Soed
http://slidepdf.com/reader/full/abbottabad-soed 35/150
21Abbottabad State of the Environment and Development
Horticulture
Abbottabad’s economy depends heavily onnatural resources and subsistence
agriculture is a predominant feature of thisdependence. At the same time, only a relativelysmall percentage of land in the district is undercultivation. Despite the importance of agricultureand the scarcity of arable land, the public sectorhas made no arrangements for irrigation. Conse-quently, cultivable land is at a premium across thedistrict, with land use intensity at 83.5% andcropping intensity at 61.6% ( Table 4 ).
The cool, temperate climate is ideally suited to fruit productionas well as floriculture. From an area of 674 ha allocated tohorticulture, the district produces 5,537 t of fruit. Of this quan-tity, 4,575 t (nearly 83%) of the crop consists of apples whichare grown on 560 ha. Other fruit and nut crops cultivated inAbbottabad include apricot, fig, pear, persimmon, plum andwalnut. The district is also rich in medicinal herbs, with 43varieties found in the area.
A griculture and
8/9/2019 Abbottabad Soed
http://slidepdf.com/reader/full/abbottabad-soed 36/150
22 Abbottabad State of the Environment and Development
3 Agriculture and Horticulture
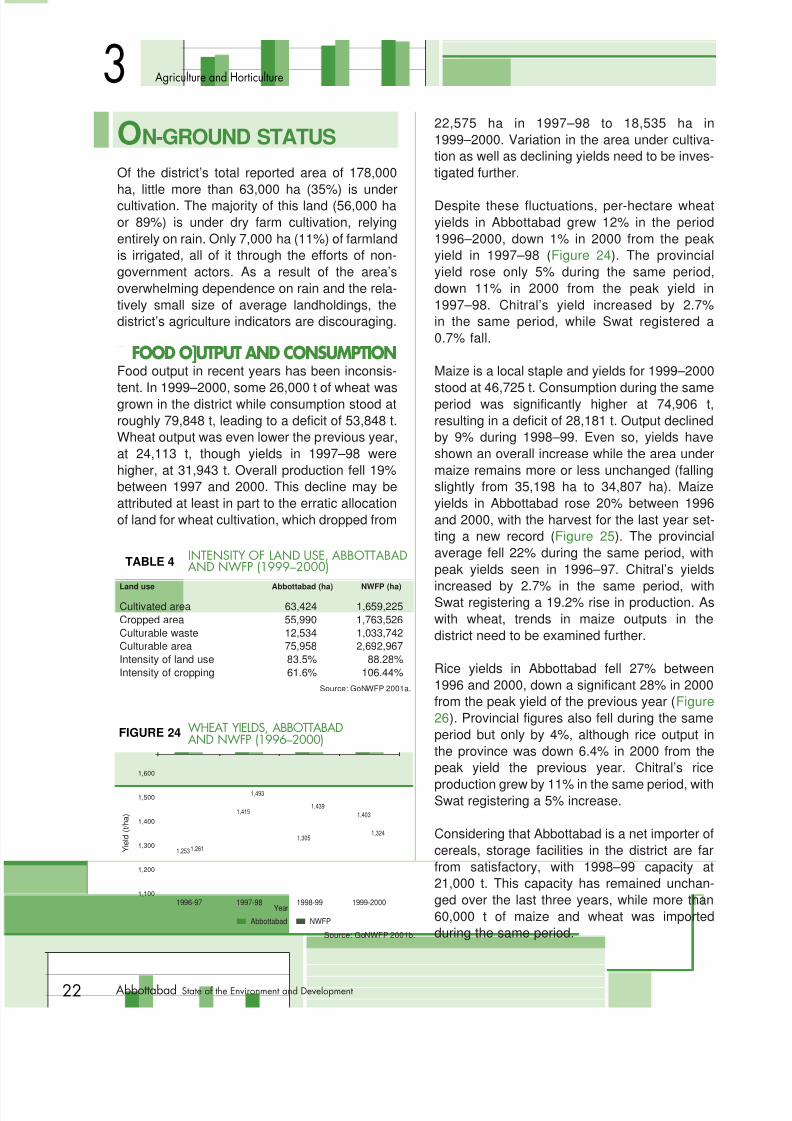
ON-GROUND STATUSOf the district’s total reported area of 178,000
ha, little more than 63,000 ha (35%) is undercultivation. The majority of this land (56,000 haor 89%) is under dry farm cultivation, relyingentirely on rain. Only 7,000 ha (11%) of farmlandis irrigated, all of it through the efforts of non-government actors. As a result of the area’soverwhelming dependence on rain and the rela-tively small size of average landholdings, thedistrict’s agriculture indicators are discouraging.
s
nFOOD O]UTPUT AND CONSUMPTION
Food output in recent years has been inconsis-
tent. In 1999–2000, some 26,000 t of wheat wasgrown in the district while consumption stood atroughly 79,848 t, leading to a deficit of 53,848 t.Wheat output was even lower the previous year,at 24,113 t, though yields in 1997–98 werehigher, at 31,943 t. Overall production fell 19%between 1997 and 2000. This decline may beattributed at least in part to the erratic allocationof land for wheat cultivation, which dropped from
22,575 ha in 1997–98 to 18,535 ha in1999–2000. Variation in the area under cultiva-tion as well as declining yields need to be inves-tigated further.
Despite these fluctuations, per-hectare wheatyields in Abbottabad grew 12% in the period1996–2000, down 1% in 2000 from the peakyield in 1997–98 ( Figure 24 ). The provincialyield rose only 5% during the same period,down 11% in 2000 from the peak yield in1997–98. Chitral’s yield increased by 2.7%in the same period, while Swat registered a0.7% fall.
Maize is a local staple and yields for 1999–2000
stood at 46,725 t. Consumption during the sameperiod was significantly higher at 74,906 t,resulting in a deficit of 28,181 t. Output declinedby 9% during 1998–99. Even so, yields haveshown an overall increase while the area undermaize remains more or less unchanged (fallingslightly from 35,198 ha to 34,807 ha). Maizeyields in Abbottabad rose 20% between 1996and 2000, with the harvest for the last year set-ting a new record ( Figure 25 ). The provincialaverage fell 22% during the same period, withpeak yields seen in 1996–97. Chitral’s yields
increased by 2.7% in the same period, withSwat registering a 19.2% rise in production. Aswith wheat, trends in maize outputs in thedistrict need to be examined further.
Rice yields in Abbottabad fell 27% between1996 and 2000, down a significant 28% in 2000from the peak yield of the previous year ( Figure26 ). Provincial figures also fell during the sameperiod but only by 4%, although rice output inthe province was down 6.4% in 2000 from thepeak yield the previous year. Chitral’s rice
production grew by 11% in the same period, withSwat registering a 5% increase.
Considering that Abbottabad is a net importer ofcereals, storage facilities in the district are farfrom satisfactory, with 1998–99 capacity at21,000 t. This capacity has remained unchan-ged over the last three years, while more than60,000 t of maize and wheat was importedduring the same period.
1996-97 1997-98 1998-99 1999-2000
FIGURE 24 WHEAT YIELDS, ABBOTTABADAND NWFP (1996√2000)
1,600
1,500
1,400
1,300
1,200
1,100
s Abbottabad s NWFP
Y i e l d ( t / h a )
Source: GoNWFP 2001b.
1,2531,261
1,415
1,493
1,305
1,4391,403
1,324
Year
TABLE 4 INTENSITY OF LAND USE, ABBOTTABADAND NWFP (1999√2000)
Land use Abbottabad (ha) NWFP (ha)
Cultivated area 63,424 1,659,225Cropped area 55,990 1,763,526Culturable waste 12,534 1,033,742Culturable area 75,958 2,692,967Intensity of land use 83.5% 88.28%Intensity of cropping 61.6% 106.44%
Source: GoNWFP 2001a.
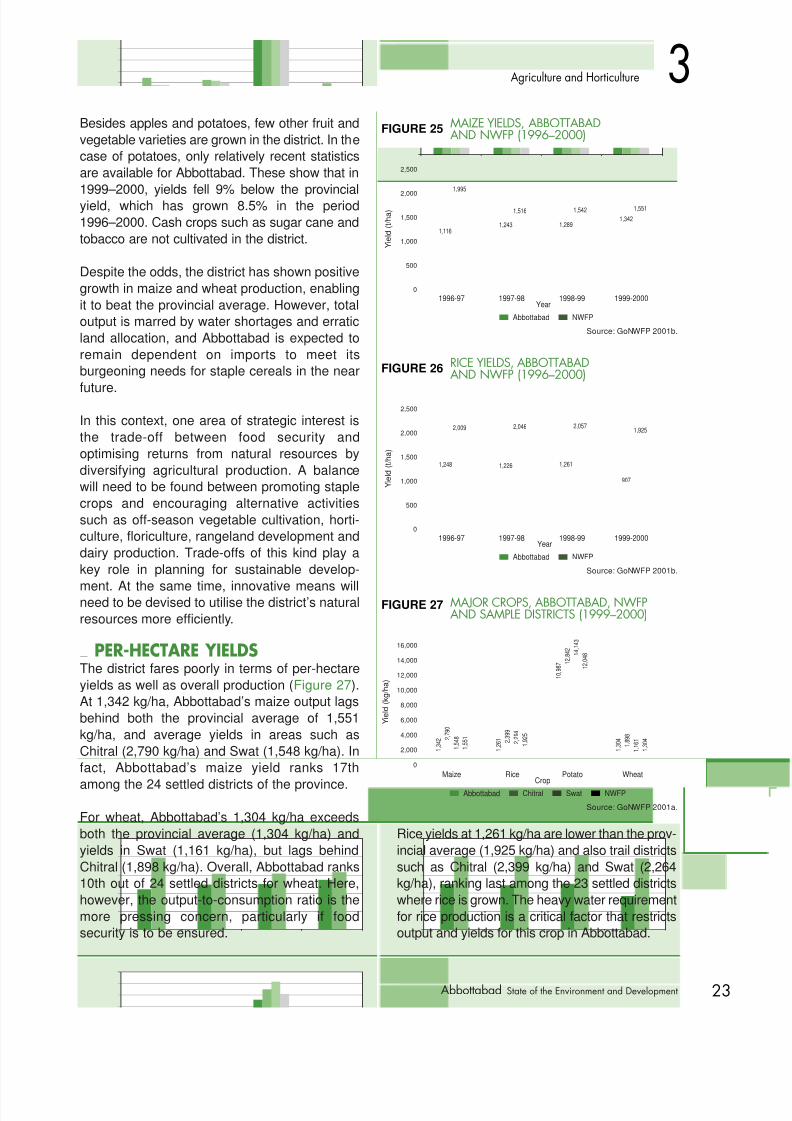
8/9/2019 Abbottabad Soed
http://slidepdf.com/reader/full/abbottabad-soed 37/150
23Abbottabad State of the Environment and Development
3Agriculture and Horticulture
Besides apples and potatoes, few other fruit andvegetable varieties are grown in the district. In thecase of potatoes, only relatively recent statisticsare available for Abbottabad. These show that in
1999–2000, yields fell 9% below the provincialyield, which has grown 8.5% in the period1996–2000. Cash crops such as sugar cane andtobacco are not cultivated in the district.
Despite the odds, the district has shown positivegrowth in maize and wheat production, enablingit to beat the provincial average. However, totaloutput is marred by water shortages and erraticland allocation, and Abbottabad is expected toremain dependent on imports to meet itsburgeoning needs for staple cereals in the near
future.
In this context, one area of strategic interest isthe trade-off between food security andoptimising returns from natural resources bydiversifying agricultural production. A balancewill need to be found between promoting staplecrops and encouraging alternative activitiessuch as off-season vegetable cultivation, horti-culture, floriculture, rangeland development anddairy production. Trade-offs of this kind play akey role in planning for sustainable develop-
ment. At the same time, innovative means willneed to be devised to utilise the district’s naturalresources more efficiently.
snPER-HECTARE YIELDSThe district fares poorly in terms of per-hectareyields as well as overall production ( Figure 27 ).At 1,342 kg/ha, Abbottabad’s maize output lagsbehind both the provincial average of 1,551kg/ha, and average yields in areas such asChitral (2,790 kg/ha) and Swat (1,548 kg/ha). Infact, Abbottabad’s maize yield ranks 17th
among the 24 settled districts of the province.
For wheat, Abbottabad’s 1,304 kg/ha exceedsboth the provincial average (1,304 kg/ha) andyields in Swat (1,161 kg/ha), but lags behindChitral (1,898 kg/ha). Overall, Abbottabad ranks10th out of 24 settled districts for wheat. Here,however, the output-to-consumption ratio is themore pressing concern, particularly if foodsecurity is to be ensured.
Rice yields at 1,261 kg/ha are lower than the prov-incial average (1,925 kg/ha) and also trail districtssuch as Chitral (2,399 kg/ha) and Swat (2,264kg/ha), ranking last among the 23 settled districtswhere rice is grown. The heavy water requirementfor rice production is a critical factor that restrictsoutput and yields for this crop in Abbottabad.
1996-97 1997-98 1998-99 1999-2000
FIGURE 25 MAIZE YIELDS, ABBOTTABADAND NWFP (1996√2000)
2,500
2,000
1,500
1,000
500
0
s Abbottabad s NWFP
Y i e l d ( t / h a )
Source: GoNWFP 2001b.
1,116
1,995
1,243
1,516
1,289
1,5421,342
1,551
1996-97 1997-98 1998-99 1999-2000
FIGURE 26 RICE YIELDS, ABBOTTABADAND NWFP (1996√2000)
2,500
2,000
1,500
1,000
500
0
s Abbottabad s NWFP
Y i e l d ( t / h a )
Source: GoNWFP 2001b.
1,248
2,009
1,226
2,046
1,261
2,057
907
1,925
Year
Year
Maize Rice Potato Wheat
FIGURE 27 MAJOR CROPS, ABBOTTABAD, NWFPAND SAMPLE DISTRICTS (1999√2000)
16,000
14,000
12,000
10,000
8,000
6,000
4,000
2,000
0
s Abbottabad s Chitral s Swat s NWFP
Y i e l d ( k g / h a )
Source: GoNWFP 2001a.
1 , 3
4 2 2
, 7 9 0
1 , 5
4 8
1 , 5
5 1
1 , 2
6 1
2 , 3
9 9
2 , 2
6 4
1 , 9
2 5
1 0
, 9 8 7 1
2 , 8
4 2
1 4
, 1 4 3
1 2
, 0 4 8
1 , 3
0 4
1 , 8
9 8
1 , 1
6 1
1 , 3
0 4
Crop
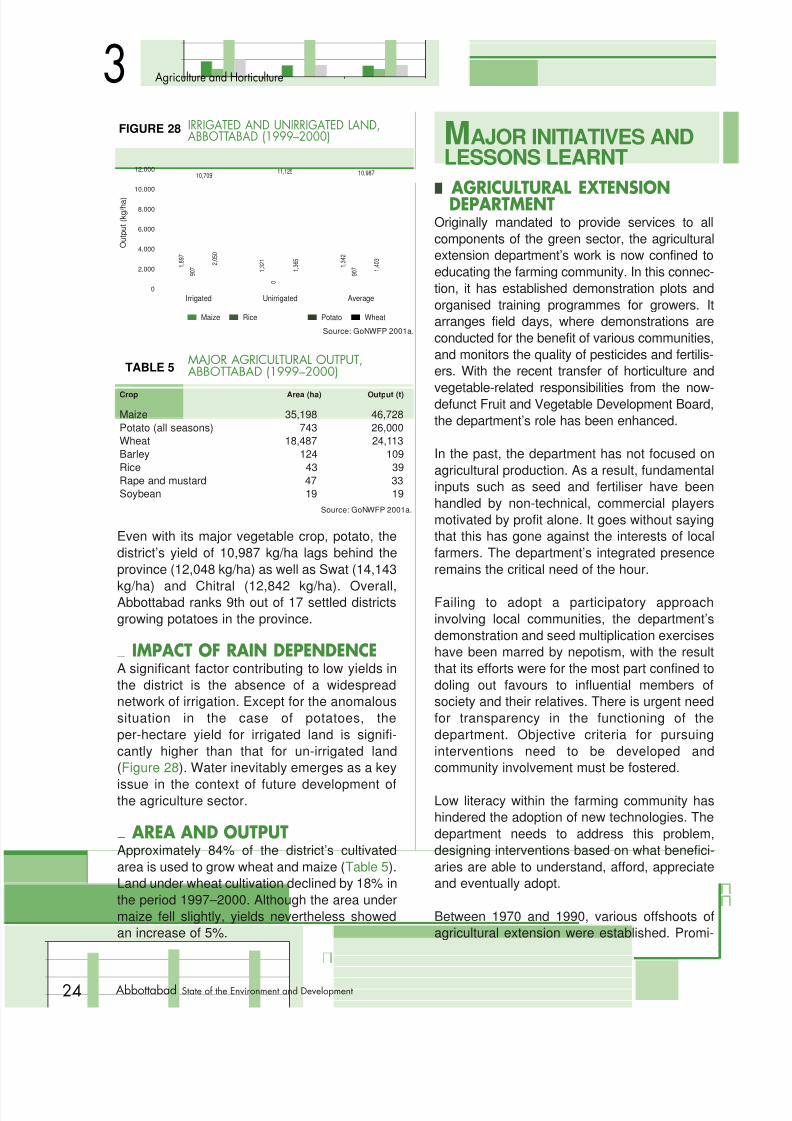
8/9/2019 Abbottabad Soed
http://slidepdf.com/reader/full/abbottabad-soed 38/150
24 Abbottabad State of the Environment and Development
3 Agriculture and Horticulture
Even with its major vegetable crop, potato, thedistrict’s yield of 10,987 kg/ha lags behind theprovince (12,048 kg/ha) as well as Swat (14,143
kg/ha) and Chitral (12,842 kg/ha). Overall,Abbottabad ranks 9th out of 17 settled districtsgrowing potatoes in the province.
snIMPACT OF RAIN DEPENDENCEA significant factor contributing to low yields inthe district is the absence of a widespreadnetwork of irrigation. Except for the anomaloussituation in the case of potatoes, theper-hectare yield for irrigated land is signifi-cantly higher than that for un-irrigated land(Figure 28 ). Water inevitably emerges as a key
issue in the context of future development ofthe agriculture sector.
sn AREA AND OUTPUTApproximately 84% of the district’s cultivatedarea is used to grow wheat and maize ( Table 5 ).Land under wheat cultivation declined by 18% inthe period 1997–2000. Although the area undermaize fell slightly, yields nevertheless showedan increase of 5%.
MAJOR INITIATIVES ANDLESSONS LEARNT
s
n AGRICULTURAL EXTENSIONDEPARTMENT
Originally mandated to provide services to allcomponents of the green sector, the agriculturalextension department’s work is now confined toeducating the farming community. In this connec-tion, it has established demonstration plots andorganised training programmes for growers. Itarranges field days, where demonstrations areconducted for the benefit of various communities,and monitors the quality of pesticides and fertilis-ers. With the recent transfer of horticulture and
vegetable-related responsibilities from the now-defunct Fruit and Vegetable Development Board,the department’s role has been enhanced.
In the past, the department has not focused onagricultural production. As a result, fundamentalinputs such as seed and fertiliser have beenhandled by non-technical, commercial playersmotivated by profit alone. It goes without sayingthat this has gone against the interests of localfarmers. The department’s integrated presenceremains the critical need of the hour.
Failing to adopt a participatory approachinvolving local communities, the department’sdemonstration and seed multiplication exerciseshave been marred by nepotism, with the resultthat its efforts were for the most part confined todoling out favours to influential members ofsociety and their relatives. There is urgent needfor transparency in the functioning of thedepartment. Objective criteria for pursuinginterventions need to be developed andcommunity involvement must be fostered.
Low literacy within the farming community hashindered the adoption of new technologies. Thedepartment needs to address this problem,designing interventions based on what benefici-aries are able to understand, afford, appreciateand eventually adopt.
Between 1970 and 1990, various offshoots ofagricultural extension were established. Promi-
Irrigated Unirrigated Average
FIGURE 28 IRRIGATED AND UNIRRIGATED LAND,ABBOTTABAD (1999√2000)
12,000
10,000
8,000
6,000
4,000
2,000
0
s Maize s Rice s Potato s Wheat
O u t p u
t ( k g / h a )
Source: GoNWFP 2001a.
1 , 8
9 7
9 0 7
10,709
2 , 0
5 0
1 , 3
2 1
0
11,125
1 , 3
6 5
1 , 3
4 2
9 0 7
10,987
1 , 4
0 3
TABLE 5 MAJOR AGRICULTURAL OUTPUT,ABBOTTABAD (1999√2000)
Crop Area (ha) Output (t)
Maize 35,198 46,728Potato (all seasons) 743 26,000Wheat 18,487 24,113Barley 124 109Rice 43 39Rape and mustard 47 33Soybean 19 19
Source: GoNWFP 2001a.
8/9/2019 Abbottabad Soed
http://slidepdf.com/reader/full/abbottabad-soed 39/150
25Abbottabad State of the Environment and Development
Agriculture and Horticulture
nent among these were the now-defunct Fruitand Vegetable Development Board, AgricultureDevelopment Authority and agriculture engi-neering department, as well as the BADP, soil
conservation department and on-farm watermanagement department. The soil conservationand on-farm water management departmentscontinue to operate at the district level. Nomechanism has been developed to coordinatetheir operations, with the result that these enti-ties often work at cross-purposes. As such, it isno surprise that their cumulative impact on thedevelopment of the sector has been minimal.
Meanwhile, controlling the adulteration of fertilis-ers and pesticides is difficult in the face of
resource constraints, the lack of proper laborato-ries to analyse samples, delays in reporting anda cumbersome prosecution process. Legislationis also an issue, and it is imperative that fertiliserand pesticide laws are amended.
Poor penetration in rural areas, the shortage offinancial and technical resources, and the low
level of expertise and motivation of personnelsuggest that major capacity-building efforts willbe required to improve the effectiveness of thedepartment.
snBARANI AREA DEVELOPMENT PROJECTLaunched in 1993 to help improve theeconomic, social and nutritional status of thepeople in barani areas of the district, theBADP is funded by the Asian Development
Bank (ADB) and implemented by theprovincial government’s planning and devel-opment department. BADP initiatives fall intotwo categories: (i) agricultural extension and
(ii) horticultural extension.Under agriculture extension programmes, theBADP has set up demonstration plots to instructfarmers in the use of quality cereal and oil seedcultivars. Similarly, seed multiplication plots formaize and wheat have been planted to demon-strate seed production techniques. Between1993 and 2000, some 5,198 such plots weresown for various crops. In addition to demon-stration plots, farmers have received training ingrain storage and organic waste management,
with agricultural exten-sion workers providingcrop management train-ing. Field days andrefresher courses havebeen held as well. In all,115 days were allocatedto these activities in theperiod 1993–2000. TheBADP has constructedsheds for farm machin-ery, purchased tractors
and assisted farmers inhiring farm implements atsubsidised rates.
In the case of horticulture extension, the BADPhas established a deciduous fruit nursery farmin the village of Mangal and laid out 40 smalldemonstration orchards in farmers’ fields.Under its vegetable demonstration programme,the Galliyat area was selected for growing off-season vegetables and seven field assistantswere hired to provide additional support to the
agriculture department. Fruit and vegetableprocessing also receives attention. Womenhave been involved in kitchen gardening whilevillage agricultural extension workers aretrained in fruit orchard planting andmaintenance, nursery management, andvegetable production.
The BADP’s long-term success has beenmarred by the absence of village-level
3
One area of strategic interest is thetrade-off between ensuring food securityand optimising returns by diversifyingagricultural production. A balance willneed to be found between promotingstaple crops and encouragingalternative activities such as off-seasonvegetable cultivation.
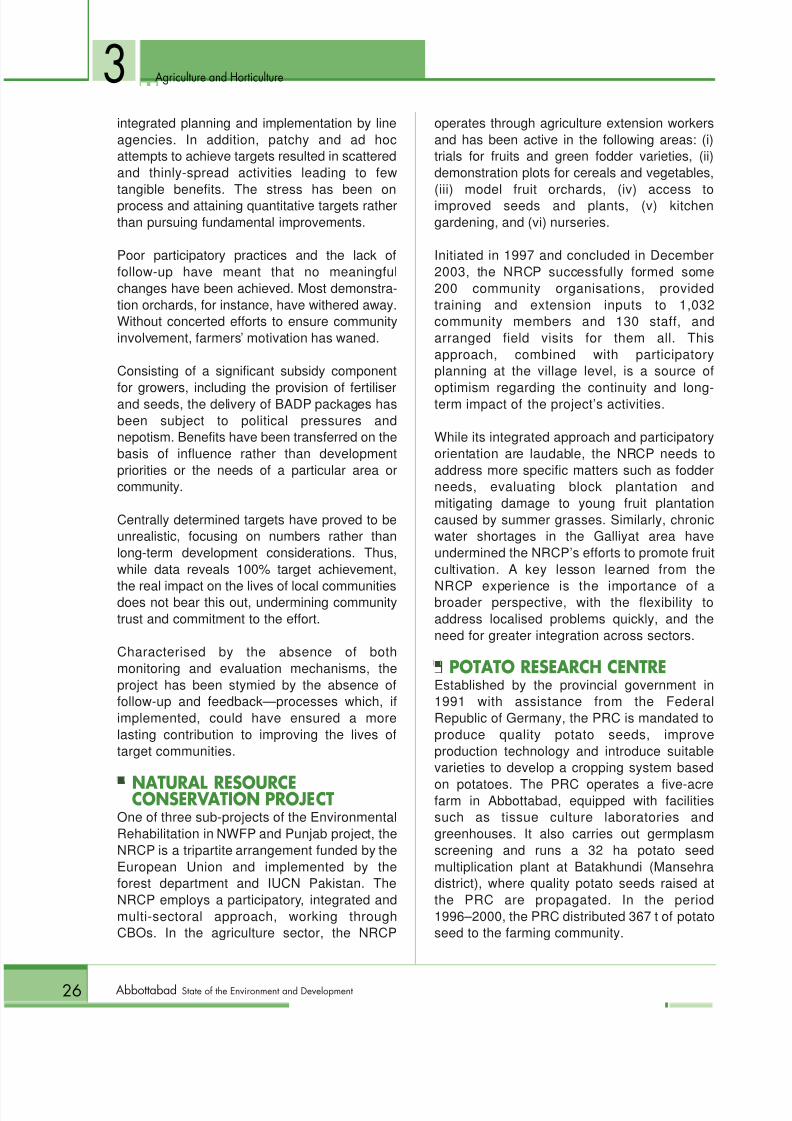
8/9/2019 Abbottabad Soed
http://slidepdf.com/reader/full/abbottabad-soed 40/150
26 Abbottabad State of the Environment and Development
Agriculture and Horticulture
integrated planning and implementation by lineagencies. In addition, patchy and ad hocattempts to achieve targets resulted in scatteredand thinly-spread activities leading to few
tangible benefits. The stress has been onprocess and attaining quantitative targets ratherthan pursuing fundamental improvements.
Poor participatory practices and the lack offollow-up have meant that no meaningfulchanges have been achieved. Most demonstra-tion orchards, for instance, have withered away.Without concerted efforts to ensure communityinvolvement, farmers’ motivation has waned.
Consisting of a significant subsidy component
for growers, including the provision of fertiliserand seeds, the delivery of BADP packages hasbeen subject to political pressures andnepotism. Benefits have been transferred on thebasis of influence rather than developmentpriorities or the needs of a particular area orcommunity.
Centrally determined targets have proved to beunrealistic, focusing on numbers rather thanlong-term development considerations. Thus,while data reveals 100% target achievement,
the real impact on the lives of local communitiesdoes not bear this out, undermining communitytrust and commitment to the effort.
Characterised by the absence of bothmonitoring and evaluation mechanisms, theproject has been stymied by the absence offollow-up and feedback—processes which, ifimplemented, could have ensured a morelasting contribution to improving the lives oftarget communities.
s
nNATURAL RESOURCECONSERVATION PROJECT
One of three sub-projects of the EnvironmentalRehabilitation in NWFP and Punjab project, theNRCP is a tripartite arrangement funded by theEuropean Union and implemented by theforest department and IUCN Pakistan. TheNRCP employs a participatory, integrated andmulti-sectoral approach, working throughCBOs. In the agriculture sector, the NRCP
operates through agriculture extension workersand has been active in the following areas: (i)trials for fruits and green fodder varieties, (ii)demonstration plots for cereals and vegetables,
(iii) model fruit orchards, (iv) access toimproved seeds and plants, (v) kitchengardening, and (vi) nurseries.
Initiated in 1997 and concluded in December2003, the NRCP successfully formed some200 community organisations, providedtraining and extension inputs to 1,032community members and 130 staff, andarranged field visits for them all. Thisapproach, combined with participatoryplanning at the village level, is a source of
optimism regarding the continuity and long-term impact of the project’s activities.
While its integrated approach and participatoryorientation are laudable, the NRCP needs toaddress more specific matters such as fodderneeds, evaluating block plantation andmitigating damage to young fruit plantationcaused by summer grasses. Similarly, chronicwater shortages in the Galliyat area haveundermined the NRCP’s efforts to promote fruitcultivation. A key lesson learned from the
NRCP experience is the importance of abroader perspective, with the flexibility toaddress localised problems quickly, and theneed for greater integration across sectors.
snPOTATO RESEARCH CENTREEstablished by the provincial government in1991 with assistance from the FederalRepublic of Germany, the PRC is mandated toproduce quality potato seeds, improveproduction technology and introduce suitablevarieties to develop a cropping system based
on potatoes. The PRC operates a five-acrefarm in Abbottabad, equipped with facilitiessuch as tissue culture laboratories andgreenhouses. It also carries out germplasmscreening and runs a 32 ha potato seedmultiplication plant at Batakhundi (Mansehradistrict), where quality potato seeds raised atthe PRC are propagated. In the period1996–2000, the PRC distributed 367 t of potatoseed to the farming community.
3
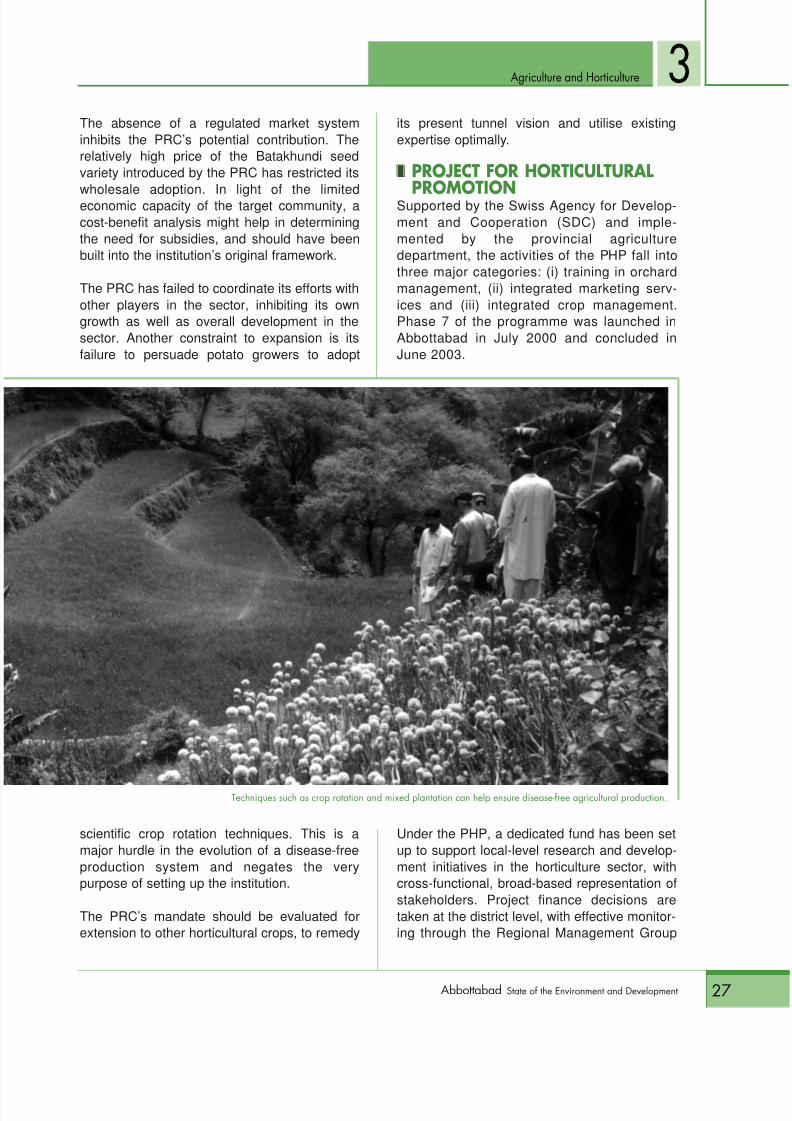
8/9/2019 Abbottabad Soed
http://slidepdf.com/reader/full/abbottabad-soed 41/150
27Abbottabad State of the Environment and Development
Agriculture and Horticulture
The absence of a regulated market systeminhibits the PRC’s potential contribution. Therelatively high price of the Batakhundi seedvariety introduced by the PRC has restricted its
wholesale adoption. In light of the limitedeconomic capacity of the target community, acost-benefit analysis might help in determiningthe need for subsidies, and should have beenbuilt into the institution’s original framework.
The PRC has failed to coordinate its efforts withother players in the sector, inhibiting its owngrowth as well as overall development in thesector. Another constraint to expansion is itsfailure to persuade potato growers to adopt
scientific crop rotation techniques. This is amajor hurdle in the evolution of a disease-freeproduction system and negates the verypurpose of setting up the institution.
The PRC’s mandate should be evaluated forextension to other horticultural crops, to remedy
its present tunnel vision and utilise existingexpertise optimally.
s
nPROJECT FOR HORTICULTURAL
PROMOTIONSupported by the Swiss Agency for Develop-ment and Cooperation (SDC) and imple-mented by the provincial agriculturedepartment, the activities of the PHP fall intothree major categories: (i) training in orchardmanagement, (ii) integrated marketing serv-ices and (iii) integrated crop management.Phase 7 of the programme was launched inAbbottabad in July 2000 and concluded inJune 2003.
Under the PHP, a dedicated fund has been setup to support local-level research and develop-ment initiatives in the horticulture sector, withcross-functional, broad-based representation ofstakeholders. Project finance decisions aretaken at the district level, with effective monitor-ing through the Regional Management Group
3
Techniques such as crop rotation and mixed plantation can help ensure disease-free agricultural production.
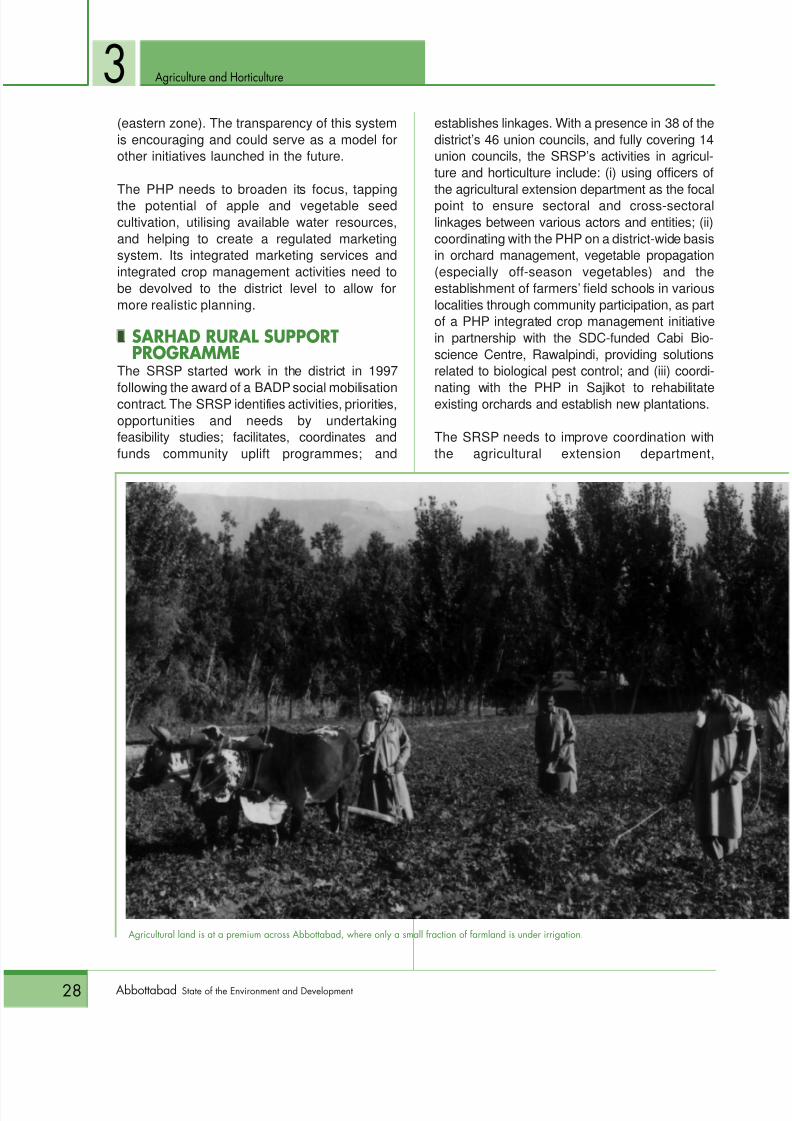
8/9/2019 Abbottabad Soed
http://slidepdf.com/reader/full/abbottabad-soed 42/150
28 Abbottabad State of the Environment and Development
Agriculture and Horticulture
(eastern zone). The transparency of this systemis encouraging and could serve as a model forother initiatives launched in the future.
The PHP needs to broaden its focus, tappingthe potential of apple and vegetable seedcultivation, utilising available water resources,and helping to create a regulated marketingsystem. Its integrated marketing services andintegrated crop management activities need tobe devolved to the district level to allow formore realistic planning.
sn
SARHAD RURAL SUPPORTPROGRAMME
The SRSP started work in the district in 1997
following the award of a BADP social mobilisationcontract. The SRSP identifies activities, priorities,opportunities and needs by undertakingfeasibility studies; facilitates, coordinates andfunds community uplift programmes; and
establishes linkages. With a presence in 38 of thedistrict’s 46 union councils, and fully covering 14union councils, the SRSP’s activities in agricul-ture and horticulture include: (i) using officers of
the agricultural extension department as the focalpoint to ensure sectoral and cross-sectorallinkages between various actors and entities; (ii)coordinating with the PHP on a district-wide basisin orchard management, vegetable propagation(especially off-season vegetables) and theestablishment of farmers’ field schools in variouslocalities through community participation, as partof a PHP integrated crop management initiativein partnership with the SDC-funded Cabi Bio-science Centre, Rawalpindi, providing solutionsrelated to biological pest control; and (iii) coordi-
nating with the PHP in Sajikot to rehabilitateexisting orchards and establish new plantations.
The SRSP needs to improve coordination withthe agricultural extension department,
3
Agricultural land is at a premium across Abbottabad, where only a small fraction of farmland is under irrigation.
8/9/2019 Abbottabad Soed
http://slidepdf.com/reader/full/abbottabad-soed 43/150
29Abbottabad State of the Environment and Development
Agriculture and Horticulture
particularly in order to disseminate relevanttechnologies. Seeking increased involvementof women in kitchen gardening practices willhelp make a positive contribution to the SRSP’s
major area of interest, which is poverty allevia-tion. Credit extension for agricultural andhorticultural activities remains a weak area.
snSUNGI DEVELOPMENT FOUNDATIONThe agriculture-related initiatives of SUNGI’snatural resource management programmeconcentrate on building the capacity of localfarmers by investing in improved agriculturalpractices as well as by promoting innovativeincome-generating activities. SUNGI isinvolved in seed distribution, establishing
demonstration plots and training farmers. Ithas formed the Kissan Awami Council (farmerspeople’s council), an institutional forum forsmall farmers, and conducts seminars andworkshops aimed at promoting the sustainabledevelopment of agriculture.
SUNGI’s agriculture-based initiatives form a rel-atively small component of its natural resourcemanagement activities in the district. While ithas been relatively successful in mobilising andgalvanising local communities, it is equally
important for SUNGI to pursue the establish-ment of improved coordination mechanisms inwhich key decisions are made in a participatorymanner, with the involvement of stakeholders aswell as governmental functionaries.
snZARAI TARAQIATI BANK LIMITEDFormerly know as the Agriculture Develop-ment Bank of Pakistan and renamed in 2003,the Zarai Taraqiati Bank Limited (ZTBL) is the
primary source of credit for agricultural andhorticultural activities in the district. Itsperformance in the field, however, is dismal. Inthe period 2000–01, the ZTBL’s target forlending in the sector was Rs 24.4 million, ofwhich only Rs 2.621 million (11%) was actuallyachieved.
For the year 2000–01, the loan disbursementachievement of the ZTBL stood at 63%. It isthought that procedural hindrances, the cumber-some passbook system and a basic absence of
interaction with end users (farming communitiesand credit facilitators) are responsible for theZTBL’s dismal performance.
Certain key areas need to be addressed, not just by the ZTBL but other lending agencies aswell. General inter-sectoral data and impactassessment information should be madeavailable to improve credit extension. Isolatedinterventions to pursue individual targets needto be replaced by a more business-likeapproach. Credit extension procedures must be
simplified and resources should be directedtowards viable income-generating activities aswell as the expansion of water resources.
3

8/9/2019 Abbottabad Soed
http://slidepdf.com/reader/full/abbottabad-soed 44/150
30 Abbottabad State of the Environment and Development
Watersheds
Abbottabad district covers just 1.8% of the totalland area of the NWFP but accounts for 5.4%
of the province’s forest resources (KfW2000). Official statistics for forest cover in the districtare at variance with estimates provided by otheragencies. According to an inventory carried out byKfW, Abbottabad’s forests cover 36,394.6 ha,amounting to 21.4% of the district’s total area, whileofficial figures show the district’s forested area to beslightly higher, at 36,441 ha. The analysis below relieson official estimates.
ON-GROUND STATUSsnFOREST MANAGEMENT AND OWNERSHIP:
HISTORICAL CONTEXTThe history of forest management in the Hazara area dates back to1851, when Lord Dalhousie, Governor General of colonial India from1848 to 1856, created a new category of ‘reserved’ forest, marking thefirst time that any special type of forest area was designated in theregion. Guzara forests were demarcated in 1873 while cantonment and
Forests and
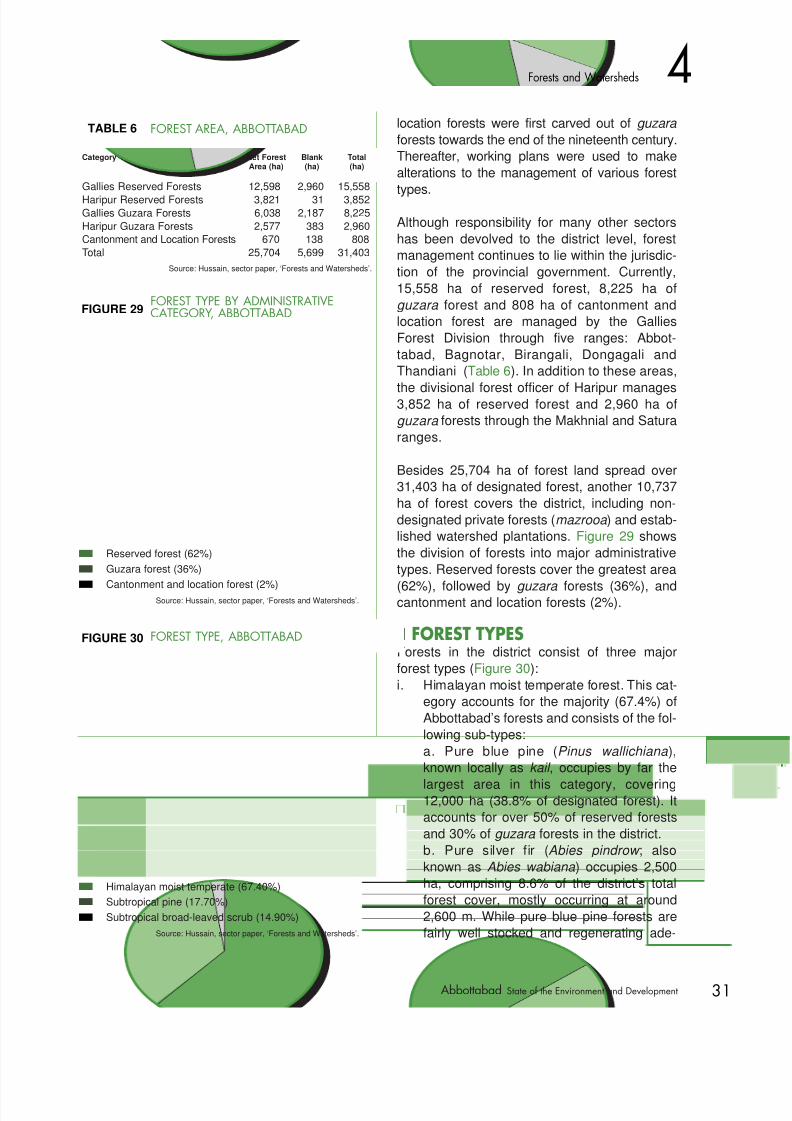
8/9/2019 Abbottabad Soed
http://slidepdf.com/reader/full/abbottabad-soed 45/150
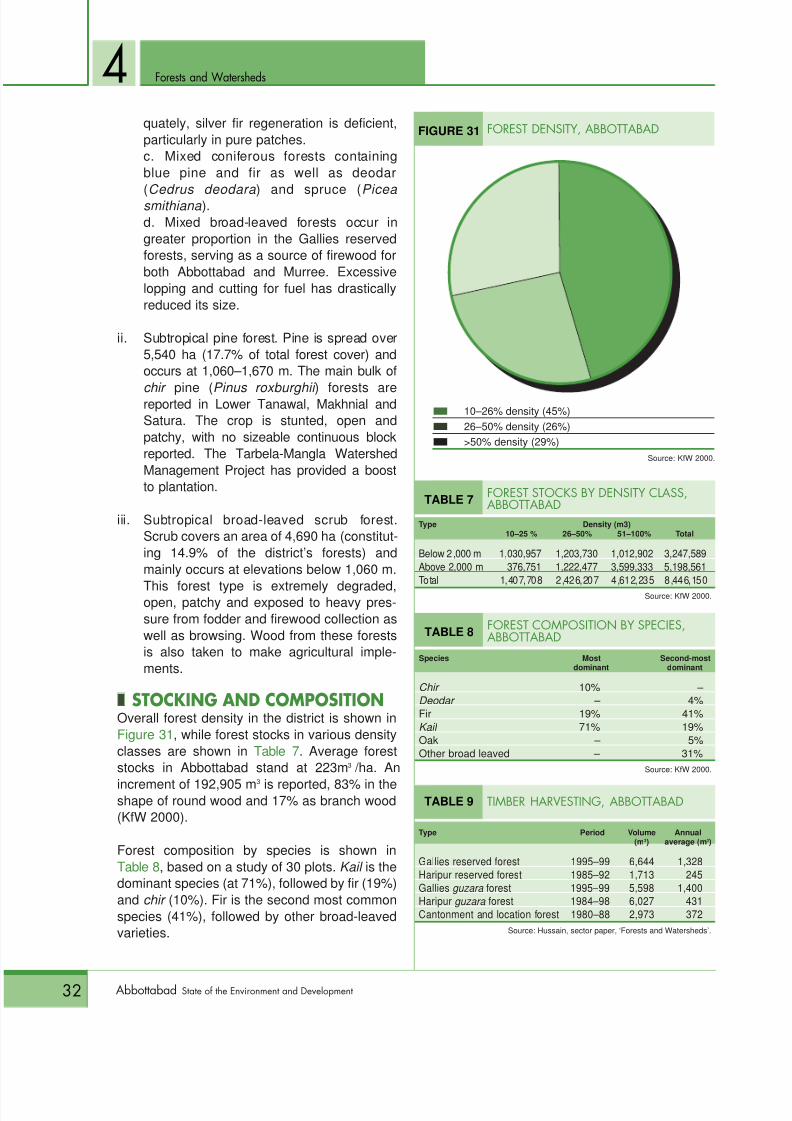
8/9/2019 Abbottabad Soed
http://slidepdf.com/reader/full/abbottabad-soed 46/150
Forests and Watersheds
32 Abbottabad State of the Environment and Development
4quately, silver fir regeneration is deficient,particularly in pure patches.c. Mixed coniferous forests containingblue pine and fir as well as deodar
(Cedrus deodara ) and spruce ( Picea smithiana ).d. Mixed broad-leaved forests occur ingreater proportion in the Gallies reservedforests, serving as a source of firewood forboth Abbottabad and Murree. Excessivelopping and cutting for fuel has drasticallyreduced its size.
ii. Subtropical pine forest. Pine is spread over5,540 ha (17.7% of total forest cover) andoccurs at 1,060–1,670 m. The main bulk of
chir pine ( Pinus roxburghii ) forests arereported in Lower Tanawal, Makhnial andSatura. The crop is stunted, open andpatchy, with no sizeable continuous blockreported. The Tarbela-Mangla WatershedManagement Project has provided a boostto plantation.
iii. Subtropical broad-leaved scrub forest.Scrub covers an area of 4,690 ha (constitut-ing 14.9% of the district’s forests) andmainly occurs at elevations below 1,060 m.
This forest type is extremely degraded,open, patchy and exposed to heavy pres-sure from fodder and firewood collection aswell as browsing. Wood from these forestsis also taken to make agricultural imple-ments.
snSTOCKING AND COMPOSITIONOverall forest density in the district is shown inFigure 31 , while forest stocks in various densityclasses are shown in Table 7 . Average foreststocks in Abbottabad stand at 223m 3 /ha. An
increment of 192,905 m3
is reported, 83% in theshape of round wood and 17% as branch wood(KfW 2000).
Forest composition by species is shown inTable 8 , based on a study of 30 plots. Kail is thedominant species (at 71%), followed by fir (19%)and chir (10%). Fir is the second most commonspecies (41%), followed by other broad-leavedvarieties.
FIGURE 31 FOREST DENSITY, ABBOTTABAD
s 10–26% density (45%)s 26–50% density (26%)s >50% density (29%)
Source: KfW 2000.
TABLE 8 FOREST COMPOSITION BY SPECIES,ABBOTTABAD
Species Most Second-mostdominant dominant
Chir 10% – Deodar – 4%Fir 19% 41%Kail 71% 19%Oak – 5%Other broad leaved – 31%
Source: KfW 2000.
TABLE 7 FOREST STOCKS BY DENSITY CLASS,ABBOTTABAD
Type Density (m3)10–25 % 26–50% 51–100% Total
Below 2 ,000 m 1,030,957 1,203,730 1,012,902 3,247,589Above 2,000 m 376,751 1,222,477 3,599,333 5,198,561Total 1,407,708 2,426,207 4,612,235 8,446,150
Source: KfW 2000.
TABLE 9 TIMBER HARVESTING, ABBOTTABAD
Type Period Volume Annual(m 3) average (m 3)
Gallies reserved forest 1995–99 6,644 1,328Haripur reserved forest 1985–92 1,713 245Gallies guzara forest 1995–99 5,598 1,400Haripur guzara forest 1984–98 6,027 431Cantonment and location forest 1980–88 2,973 372
Source: Hussain, sector paper, ‘Forests and Watersheds’.
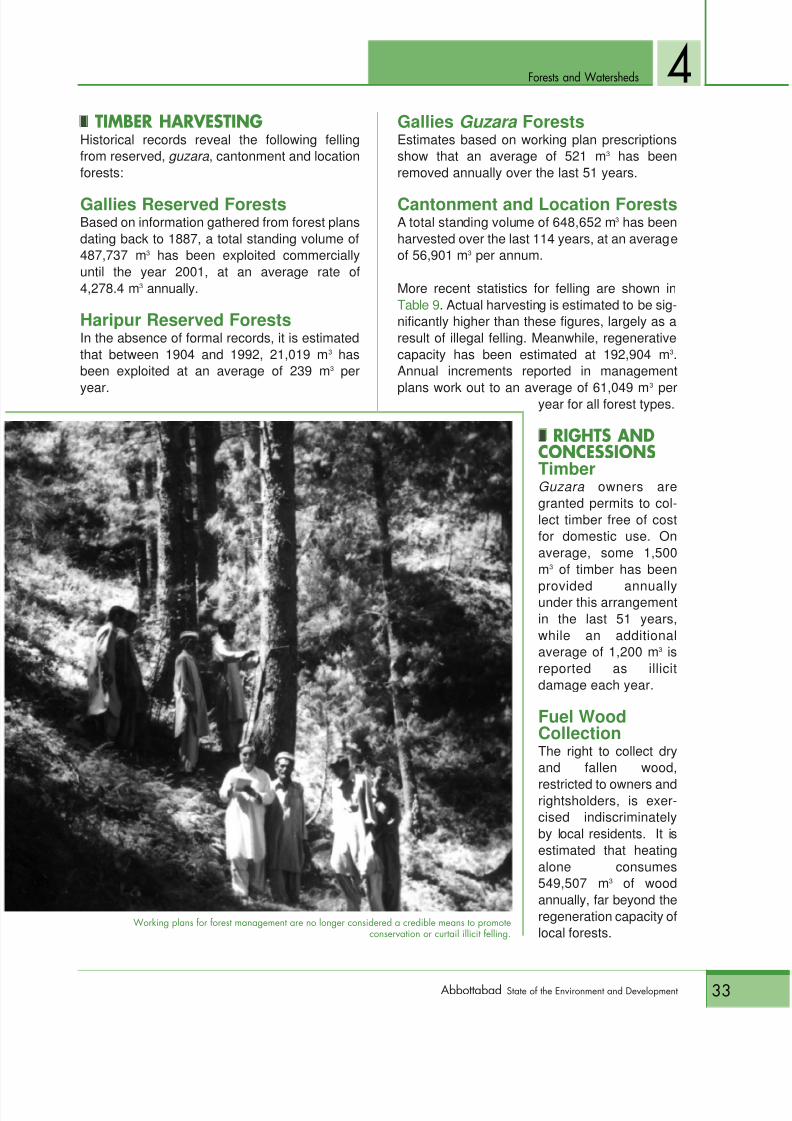
8/9/2019 Abbottabad Soed
http://slidepdf.com/reader/full/abbottabad-soed 47/150
Forests and Watersheds
33Abbottabad State of the Environment and Development
4snTIMBER HARVESTINGHistorical records reveal the following fellingfrom reserved, guzara , cantonment and locationforests:
Gallies Reserved ForestsBased on information gathered from forest plansdating back to 1887, a total standing volume of487,737 m 3 has been exploited commerciallyuntil the year 2001, at an average rate of4,278.4 m 3 annually.
Haripur Reserved ForestsIn the absence of formal records, it is estimatedthat between 1904 and 1992, 21,019 m 3 hasbeen exploited at an average of 239 m 3 per
year.
Gallies Guzara ForestsEstimates based on working plan prescriptionsshow that an average of 521 m 3 has beenremoved annually over the last 51 years.
Cantonment and Location ForestsA total standing volume of 648,652 m 3 has beenharvested over the last 114 years, at an averageof 56,901 m 3 per annum.
More recent statistics for felling are shown inTable 9 . Actual harvesting is estimated to be sig-nificantly higher than these figures, largely as aresult of illegal felling. Meanwhile, regenerativecapacity has been estimated at 192,904 m 3.Annual increments reported in management
plans work out to an average of 61,049 m3
peryear for all forest types.
snRIGHTS ANDCONCESSIONSTimberGuzara owners aregranted permits to col-lect timber free of costfor domestic use. Onaverage, some 1,500m3 of timber has been
provided annuallyunder this arrangementin the last 51 years,while an additionalaverage of 1,200 m 3 isreported as illicitdamage each year.
Fuel WoodCollectionThe right to collect dryand fallen wood,
restricted to owners andrightsholders, is exer-cised indiscriminatelyby local residents. It isestimated that heatingalone consumes549,507 m 3 of woodannually, far beyond theregeneration capacity oflocal forests.
Working plans for forest management are no longer considered a credible means to promoteconservation or curtail illicit felling.
8/9/2019 Abbottabad Soed
http://slidepdf.com/reader/full/abbottabad-soed 48/150
Forests and Watersheds
34 Abbottabad State of the Environment and Development
4Grazing and Grass CuttingOwners enjoy grazing rights free of charge inguzara forests, while rightsholders may grazetheir animals in specified reserved forests. No
restrictions govern grass cutting in any categoryof forest.
snBENEFITS ACCRUING TO LOCALCOMMUNITIES
Income from Commercial SalesOwners of guzaras are entitled to receive 80%of the net proceeds from commercial harvestingin such forests. Between 1955 and 1998, thetotal share of owners stood at Rs 3,050,112 forall categories of forest.
Free Grant of TimberThe cash value of timber granted free of chargeto owners in the period 1950–98 is Rs2,635,476.
Seigniorage FeeGuzara owners are entitled to receive seignior-age fees from the sale of adjacent forests.Between 1880 and 1964, this amount stood at atotal of Rs 317,769. These payments are nolonger made.
s
n WATERSHEDSThe main Murree–Thandiani mountain ridge
divides the district into two distinct watersheds:the Indus (covering 78.7% of the area) and theJhelum (covering 21.3% of the area). Accord-ing to the Forestry Sector Master Plan, totalsoil loss is estimated to be 2.8 million t annu-ally (75.4% attributed to the Indus and 24.6%to the Jhelum). Various spurs of the main ridgedivide the district into seven sub-watersheds,as follows:i. Haro: 42,137 ha;
ii. Siran: 35,419 ha;iii. Jhelum: 22,880 ha;iv. Daur: 19,564 ha;v. Kunhar: 15,272 ha;vi. Sokah Nullah: 12,627 ha; andvii. Indus: 1,964 ha (Hussain et al, 2001).
The topography of each of these watersheds isdistinct, as are cultivation practices, forest typesand soil erosion issues.
MAJOR INITIATIVES ANDLESSONS LEARNT
Forests are a major component of the district’seconomy, and figure prominently in naturalresource management initiatives. Such projectscover a wide range of activities from legal pro-tection to work aimed at preventing forest degra-dation.
sn ADMINISTRATIVE AND POLICY INITIATIVES
Cooperative SocietiesIn pursuance of the policy provisions of the 1975Agriculture Enquiry Committee, and as a means
to appease disgruntled owners of guzara forests, the NWFP government in 1980launched an experimental programme in whichmanagement of guzaras was handed over toowners’ cooperatives. In Abbottabad, two suchcooperatives (the Bandi Pahar Forests Cooper-ative and the Simli Dheri Cooperative) weregiven management rights over 2,263 acres ofguzara forest in the Galliyat area. After the gov-ernment detected heavy damage in both areas,these cooperatives were disbanded.
The plan, undertaken without pilot testing,awareness raising or capacity building, wasdoomed from the start. Implementation wascharacterised by the absence of a participa-tory orientation and marred by political inter-ference, providing a valuable lesson in hownot to introduce conservation measures. With-out a comprehensive understanding of suchpartnerships and the related dynamics, radicaldepartures in managerial orientation areimpossible.
Demarcation of ForestsReserved forests were demarcated in the wakeof a forest department survey carried out in1904–05 while guzaras were demarcated aslate as 1950 with the promulgation of theHazara Management of Wasteland (Guzara)Rules 1950. This delay in demarcation resultedin the loss of sizeable chunks of forest to agri-culture and grazing. Under the aegis of theforest department, management through proper
8/9/2019 Abbottabad Soed
http://slidepdf.com/reader/full/abbottabad-soed 49/150
Forests and Watersheds
35Abbottabad State of the Environment and Development
4plans commenced in Haripur in 1965 and in theGallies in 1966.
Exploitation of Non-Timber Forest
ProductsRecords indicate that until the early 1930s, inaddition to timber and fuel wood, considerablerevenue was earned from the sale of charcoal,kuth (a medicinal herb, Saussurea lappa ) andresin, as well as by charging fees for grazingand grass cutting. Thereafter, the focus shiftedsolely to timber management.
Firewood DepotsIn the absence of alternative sources of fuel,wood is widely used for heating purposes, par-
ticularly in rural areas. The British colonialadministration established firewood depots inAbbottabad and Murree to discourage illegalfelling. The policy was later thought to be coun-terproductive and discontinued in 1921.
Mazrooa PolicyIn addition to demarcated guzara forests, un-demarcated, un-planned, privately owned sec-tions of forest are called mazrooa . A workingpolicy was devised for their management in1975, giving owners certain rights. Implemented
in an ad hoc manner and lacking a system ofchecks and balances, the policy actually servedto promote illegal felling. Abuses arising fromthis system paved the way for the encroachmentof adjacent guzaras , and the policy was discon-tinued in 1978.
Sale of Standing Trees andDepartmental WorkingUntil 1974, marked trees were sold standing tocontractors. In the absence of supervision,abuse of this system led to widespread illegal
felling. Eventually, the forest departmentstepped in to fell, convert and transport trees. Inan arrangement that came to be known as‘departmental working’, the earlier contractsystem was abolished in 1974, and a forest har-vesting division was created to oversee felling,conversion and transportation.
These arrangements have proved to be a failurein the long run. To begin with, the sale of stand-
ing trees on contract was conducted without suf-ficient oversight and the process was rife withcorruption. But the move to departmental work-ing through the forest harvesting division has
also proven to be futile. The commercial viabilityof this plan has been undermined by a host offactors, including rigid rules, disbursementdelays as a result of centralised control of fundsby the finance department, the government’sown culture of avoiding risk and maintaining thestatus quo, frequent misuse of authority, andprocedural delays.
Seigniorage FeesUntil 1961, guzara owners were entitled toreceive a seigniorage fee from the sale of
timber taken from reserved forests. In that year,payments were discontinued, following achange in government policy. Prior to that date,the last time these rates were revised was1904. Before it was abolished, the feeamounted to a paltry Rs 5 per tree. As such, itis no surprise that forest owners became alien-ated and local communities came to viewbroader government-sponsored conservationmeasures with scepticism.
Under the NWFP Forest Ordinance 2002, the
rates have at long last been revised. Measuresrelated to actual disbursement are yet to be putin place.
Windfall PolicyImplemented twice, in 1998 and 2001, thispolicy allowed the sporadic sanitary felling of dryand diseased trees as well as the conversion ofwind-felled trees into timber for commercial use.Since wind-felled trees are traditionally collectedby local communities for domestic use, thispolicy deprived rightsholders of access to timber
and fuel, exacerbating pressure on green trees.The system lacked monitoring and supervisionmechanisms and was economically unsound.
Working PlansReserved forests in Haripur and the Gallieshave been managed under regular workingplans since 1878 and 1906 respectively. Simi-lar plans for the guzara forests of Haripur andthe Gallies were introduced in 1965 and 1966
8/9/2019 Abbottabad Soed
http://slidepdf.com/reader/full/abbottabad-soed 50/150
Forests and Watersheds
36 Abbottabad State of the Environment and Development
4respectively. The adoption of working planshas not always served to benefit forestresources, particularly since working planshave been subject to frequent, arbitrary revi-
sions and extensions.Until 1878, the forest department operated with-out working plans, much to the detriment offorest resource conservation. Even after work-ing plans were made operational, their efficacywas hindered by the failure to accommodate theneeds of local communities. Working plans havealso been marred by the department’s timberorientation, as opposed to an integrated naturalresource management approach. Partial imple-mentation, the absence of monitoring and coor-
dinating mechanisms, and repeated revisionsand extensions spurred by vested interests,have all served to defeat their original purpose.As a result, workingplans are no longer con-sidered a credible meansto promote conservationor curtail illicit felling.
Government-sponsoredactivities in the forestsector are characterised
by a series of absences:continuity, timeliness,rational policy evaluation,community participationand interactive manage-ment have all been miss-ing. Instead, ad hoc deci-sion making, administra-tive inefficiency andmyopia have been promi-nent features of many such initiatives.
The forest department, originally created tomanage state forests, has not succeeded intaking owners on board in matters of forestmanagement. Mere policing is a recipe for dis-aster. Indeed, it has become painfully clear thatthe forest department cannot conserve foreststhrough policing alone. Community involve-ment, based on trust and an understanding ofmutual long-term interests, is the only way thatthe department can improve its performance.
Local communities should be involved in pri-vate forest nursery raising, which wouldincrease overall forest cover, boost the incomeof the rural poor and increase their stake in con-
servation.s
nFOREST DEVELOPMENTCORPORATION
The Forest Development Corporation wasestablished in 1976 for the scientific exploitationof forests and the promotion of forest-basedindustries. Despite significant autonomy, it hasfailed to make any visible impact. Rather, itsworking has been marred by inflated overheads,delays, a bureaucratic orientation, poor financialstructuring and a general lack of understanding
of the unique role of this organisation. Its opera-tions have in some cases actually facilitated thedepletion of forest resources.
s
nFORESTRY SECTOR PROJECT
The NWFP Forestry Sector Project, imple-
mented by the forest department, is co-financedby an ADB loan and a grant-in-aid from theNetherlands government. Launched in 1996,the project is expected to conclude in December2004.
The project aims to promote a participatory ori-entation within the forest department for the pur-pose of improving natural resource manage-ment. Under a four-tier participatory planning
Until 1974, marked trees were soldstanding to timber contractors. In theabsence of supervision, abuse of thissystem led to widespread illegal felling.Eventually, the forest department
stepped in to fell, convert andtransport trees. In an arrangement thatcame to be known as ‘departmentalworking’, the contract system wasabolished and a forest harvestingdivision was created.
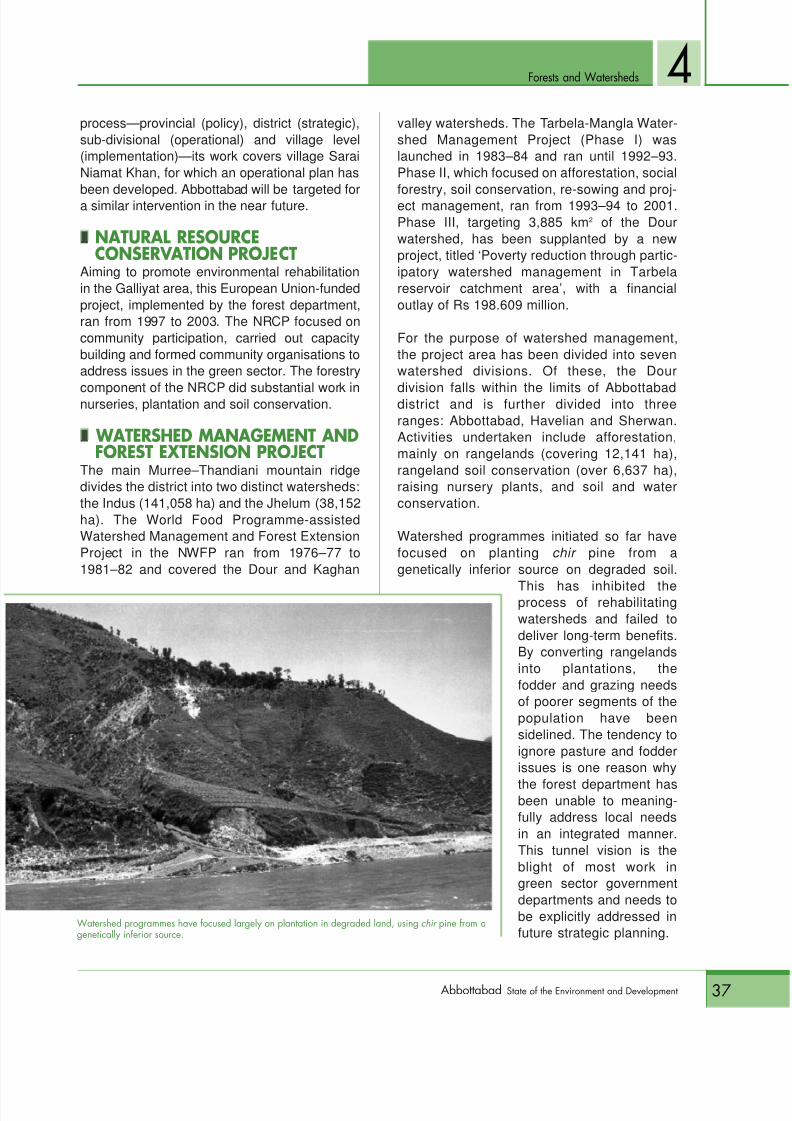
8/9/2019 Abbottabad Soed
http://slidepdf.com/reader/full/abbottabad-soed 51/150
Forests and Watersheds
37Abbottabad State of the Environment and Development
4process—provincial (policy), district (strategic),sub-divisional (operational) and village level(implementation)—its work covers village SaraiNiamat Khan, for which an operational plan has
been developed. Abbottabad will be targeted fora similar intervention in the near future.
snNATURAL RESOURCECONSERVATION PROJECT
Aiming to promote environmental rehabilitationin the Galliyat area, this European Union-fundedproject, implemented by the forest department,ran from 1997 to 2003. The NRCP focused oncommunity participation, carried out capacitybuilding and formed community organisations toaddress issues in the green sector. The forestry
component of the NRCP did substantial work innurseries, plantation and soil conservation.
sn WATERSHED MANAGEMENT ANDFOREST EXTENSION PROJECT
The main Murree–Thandiani mountain ridgedivides the district into two distinct watersheds:the Indus (141,058 ha) and the Jhelum (38,152ha). The World Food Programme-assistedWatershed Management and Forest ExtensionProject in the NWFP ran from 1976–77 to1981–82 and covered the Dour and Kaghan
valley watersheds. The Tarbela-Mangla Water-shed Management Project (Phase I) waslaunched in 1983–84 and ran until 1992–93.Phase II, which focused on afforestation, social
forestry, soil conservation, re-sowing and proj-ect management, ran from 1993–94 to 2001.Phase III, targeting 3,885 km 2 of the Dourwatershed, has been supplanted by a newproject, titled ‘Poverty reduction through partic-ipatory watershed management in Tarbelareservoir catchment area’, with a financialoutlay of Rs 198.609 million.
For the purpose of watershed management,the project area has been divided into sevenwatershed divisions. Of these, the Dour
division falls within the limits of Abbottabaddistrict and is further divided into threeranges: Abbottabad, Havelian and Sherwan.Activities undertaken include afforestation,mainly on rangelands (covering 12,141 ha),rangeland soil conservation (over 6,637 ha),raising nursery plants, and soil and waterconservation.
Watershed programmes initiated so far havefocused on planting chir pine from agenetically inferior source on degraded soil.
This has inhibited theprocess of rehabilitatingwatersheds and failed todeliver long-term benefits.By converting rangelandsinto plantations, thefodder and grazing needsof poorer segments of thepopulation have beensidelined. The tendency toignore pasture and fodderissues is one reason why
the forest department hasbeen unable to meaning-fully address local needsin an integrated manner.This tunnel vision is theblight of most work ingreen sector governmentdepartments and needs tobe explicitly addressed infuture strategic planning.
Watershed programmes have focused largely on plantation in degraded land, using chir pine from agenetically inferior source.
8/9/2019 Abbottabad Soed
http://slidepdf.com/reader/full/abbottabad-soed 52/150
Forests and Watersheds
38 Abbottabad State of the Environment and Development
4Of the seven sub-watersheds in the area, theIndus, Haro, Siran and Soka continue to oper-ate without a formal watershed programme.Even in areas where such programmes are
operational, micro-catchments are notincluded in management plans with theresult that little long-term impact has beenachieved.
Finally, by failing to actively seek the involve-ment of local communities, watershed projectshave created resentment among local residentswhose land has come under forest departmentcontrol and who are deprived of much-neededfuel because of the department’s excessive con-centration on chir pine.
s
n WORLD WIDE FUND FOR NATURE-PAKISTAN
In the Galliyat area, the World Wide Fund forNature (WWF)-Pakistan is implementing a con-servation and training project in applied ethno-botany. Called ‘People and Plants’, this projectreceives technical support from the UnitedNations Educational and Scientific Organisa-tion, WWF (International) and the Royal Botani-cal Gardens, UK. Its research has providedvaluable insights which may be used in planning
larger strategic initiatives in the future.snOTHER INITIATIVESThe forest conservation activities of the SRSPand SUNGI include participatory interventions,capacity building and awareness raising. TheSRSP, awarded a social mobilisation contract in1997 under the BADP, is working with local com-munities to conserve and expand the naturalresource base in the district. The NRCP, SRSPand forest department as well as local CBOs inNagri Bala union council (Galliyat) have estab-
lished a model Joint Forest Management Com-mittee. With its active stakeholder involvement,this Committee may well prove to be a break-through in terms of future forest managementapproaches.
The long-term impact of development projectsand non-government interventions is difficult toassess, and their sustainability is open todebate. Even so, the players involved in the
implementation of such projects possess thecapacity to be active partners in implementingthe vision outlined in the ASSD. Their experienceon the ground has equipped them with expertise
and local knowledge, and their work has in manycases led to the development of mutual goodwillbetween their staff and local communities. Thesestrengths alone make them ideal potential part-ners in ASSD implementation.
Specific problems and lessons learnt from theworking of the forest department, discussedabove, provide certain generic insights thatshould be kept in mind while evolving strategicinitiatives for the sector in future. To beginwith, the forest department’s timber orientation
needs to be replaced by an integrated viewthat accommodates other sectors and activi-ties that affect the economic life of the district.Similarly, the forest department cannot suc-cessfully manage and conserve forestresources simply by stepping up policing or byintroducing measures that undermine theinterests of local communities. As such, it isnecessary that stakeholders are brought intothe process as partners in the management ofnatural resources in their own areas.
Access, equity and the exercise of rights bygenuine rightsholders are all areas that willneed to be given attention in the future. The
joint forest management system has beentested on a pilot basis under the Siran Devel-opment Project. Adjustments now need to bemade so that this approach can be adopted ona wider basis to promote local support for forestconservation.
Another key issue that will need to beaddressed is the acute scarcity of land in the
district. To bridge the gap between demand andsupply of forest resources, and to ease thepressure on forests, farm forestry will need tobe encouraged. Conservation initiatives alsoneed to examine one final, crucial factor: popu-lation growth puts enormous pressure on natu-ral resources, leading to unsustainable use. Noconservation effort can be successful in thelong term if it does not simultaneously addressthis issue.
8/9/2019 Abbottabad Soed
http://slidepdf.com/reader/full/abbottabad-soed 53/150
39Abbottabad State of the Environment and Development
Poultry
Most farm households in the district practisesmall-scale mixed farming, where by-
products of the livestock sector serve asimportant household inputs: manure and urine arethe primary source of fertiliser, dung cakes areused as fuel, and animals are employed fordraught purposes. Besides being a source of cashincome, milk, dairy products, meat and eggs alsomeet some of the protein requirements of thehousehold.
ON-GROUND STATUSsnLIVESTOCK PROFILEIn 1996, 115,805 head of cattle, 133,463 buffaloes and 222,472goats were kept in the district, along with 32,217 sheep ( Table10 ). In comparison with districts such as Kohat, Mardan,Peshawar and Swat, Abbottabad’s total livestock population in1996 (562,011) was second only to Kohat (617,975). The poten-tial for dairy development is evident from these numbers, particu-larly in the case of cattle and goats.
Livestock and
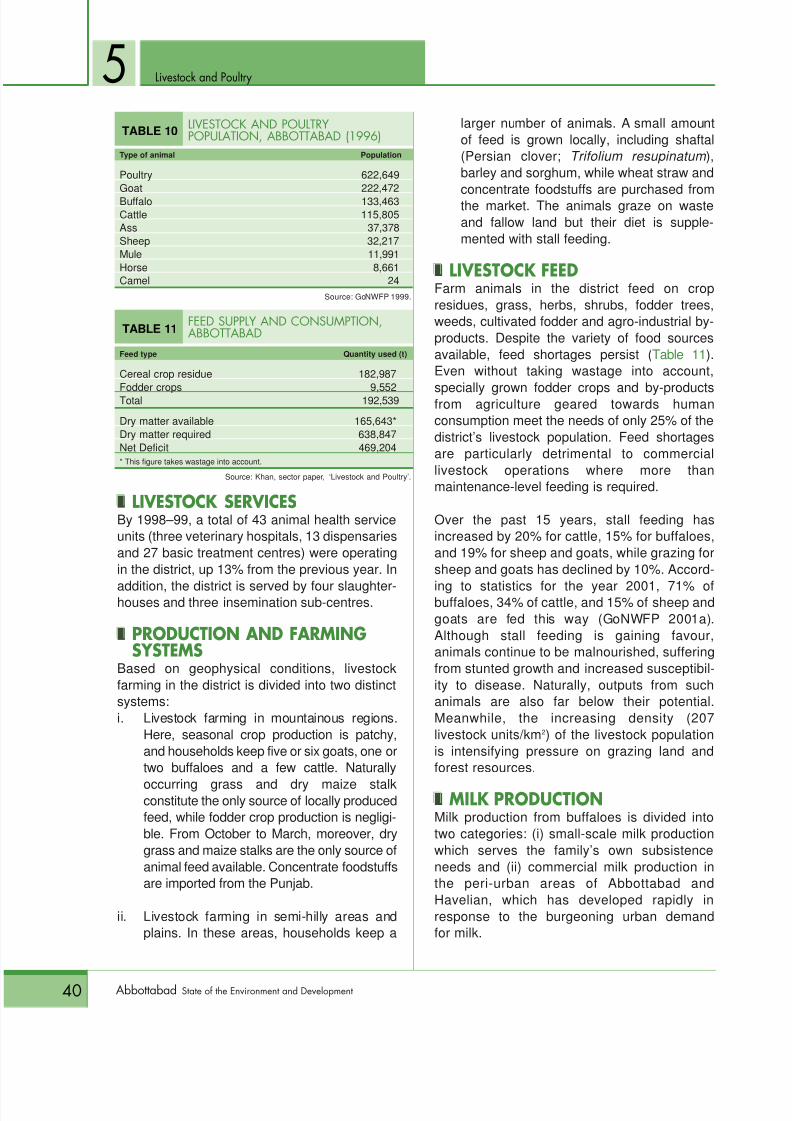
8/9/2019 Abbottabad Soed
http://slidepdf.com/reader/full/abbottabad-soed 54/150
40 Abbottabad State of the Environment and Development
5 Livestock and Poultry
snLIVESTOCK SERVICESBy 1998–99, a total of 43 animal health serviceunits (three veterinary hospitals, 13 dispensariesand 27 basic treatment centres) were operatingin the district, up 13% from the previous year. In
addition, the district is served by four slaughter-houses and three insemination sub-centres.
snPRODUCTION AND FARMINGSYSTEMS
Based on geophysical conditions, livestockfarming in the district is divided into two distinctsystems:i. Livestock farming in mountainous regions.
Here, seasonal crop production is patchy,and households keep five or six goats, one ortwo buffaloes and a few cattle. Naturally
occurring grass and dry maize stalkconstitute the only source of locally producedfeed, while fodder crop production is negligi-ble. From October to March, moreover, drygrass and maize stalks are the only source ofanimal feed available. Concentrate foodstuffsare imported from the Punjab.
ii. Livestock farming in semi-hilly areas andplains. In these areas, households keep a
larger number of animals. A small amountof feed is grown locally, including shaftal(Persian clover; Trifolium resupinatum ),barley and sorghum, while wheat straw and
concentrate foodstuffs are purchased fromthe market. The animals graze on wasteand fallow land but their diet is supple-mented with stall feeding.
snLIVESTOCK FEEDFarm animals in the district feed on cropresidues, grass, herbs, shrubs, fodder trees,weeds, cultivated fodder and agro-industrial by-products. Despite the variety of food sourcesavailable, feed shortages persist ( Table 11 ).Even without taking wastage into account,
specially grown fodder crops and by-productsfrom agriculture geared towards humanconsumption meet the needs of only 25% of thedistrict’s livestock population. Feed shortagesare particularly detrimental to commerciallivestock operations where more thanmaintenance-level feeding is required.
Over the past 15 years, stall feeding hasincreased by 20% for cattle, 15% for buffaloes,and 19% for sheep and goats, while grazing forsheep and goats has declined by 10%. Accord-
ing to statistics for the year 2001, 71% ofbuffaloes, 34% of cattle, and 15% of sheep andgoats are fed this way (GoNWFP 2001a).Although stall feeding is gaining favour,animals continue to be malnourished, sufferingfrom stunted growth and increased susceptibil-ity to disease. Naturally, outputs from suchanimals are also far below their potential.Meanwhile, the increasing density (207livestock units/km 2) of the livestock populationis intensifying pressure on grazing land andforest resources.
s
nMILK PRODUCTION
Milk production from buffaloes is divided intotwo categories: (i) small-scale milk productionwhich serves the family’s own subsistenceneeds and (ii) commercial milk production inthe peri-urban areas of Abbottabad andHavelian, which has developed rapidly inresponse to the burgeoning urban demandfor milk.
TABLE 10 LIVESTOCK AND POULTRYPOPULATION, ABBOTTABAD (1996)
Type of animal Population
Poultry 622,649Goat 222,472Buffalo 133,463Cattle 115,805Ass 37,378Sheep 32,217Mule 11,991Horse 8,661Camel 24
Source: GoNWFP 1999.
TABLE 11 FEED SUPPLY AND CONSUMPTION,ABBOTTABAD
Feed type Quantity used (t)
Cereal crop residue 182,987
Fodder crops 9,552Total 192,539
Dry matter available 165,643*Dry matter required 638,847Net Deficit 469,204* This figure takes wastage into account.
Source: Khan, sector paper, ‘Livestock and Poultry’.
8/9/2019 Abbottabad Soed
http://slidepdf.com/reader/full/abbottabad-soed 55/150
8/9/2019 Abbottabad Soed
http://slidepdf.com/reader/full/abbottabad-soed 56/150
42 Abbottabad State of the Environment and Development
Livestock and Poultry
snBARANI AREA DEVELOPMENTPROJECT
The BADP’s work in the livestock and poultrysector began in 1994–95 in coordination with
the L&DD department. Between 1995 and 2000,the BADP’s activities included:i. distributing 492 units of Beetal goat and
2,373 units of poultry;ii. breeding over 13,500 buffaloes and cows
through artificial insemination;iii. vaccinating 36,000 large animals and
333,000 poultry;iv. establishing 152 demonstration fodder
plots; andv. training 125 male and female farmers in
animal health, dairy husbandry, and poultry
vaccination and management.snCOMMERCIAL POULTRY FARMERSSome 60 broiler breeder farms, 200 broiler farms,one layer breeder farm, six layer breeder farmsand two hatcheries oper-ate in the district, alongwith a feed mill. Theabsence of investmentlimits feed output,however, and only 10% offeed requirements are met
through indigenous pro-duction. Despite theimportance of the poultrysector to the districteconomy, no rational pro-duction and marketinginputs have been providedon a district-wide basis to enable more effectiveplanning. Meanwhile, traditional channels ofmarketing are exploitative and discourage entry.
s
nCREDIT AGENCIES
The ZTBL, the First Women Bank and mostnationalised commercial banks as well as milkdealers extend some form of credit to dairy andpoultry farmers, mostly on a short-term basis.The Bank of Khyber is the latest entrant to thefield with 20% of its microcredit portfolioearmarked for livestock-related activities.
Despite the willingness of government institu-tions in recent years to provide credit for the
livestock sector, few farmers have the necessarytraining and expertise to utilise loans on a scalethat is commercially viable. This is largelybecause of the absence of successful model
enterprises, and inadequate monitoring andevaluation procedures. At present, terms andconditions attached to loans are not based oncrop production, limiting their appeal amongfarmers.
snLIVESTOCK AND DAIRY DEVELOPMENT DEPARTMENT
Focusing on animal health and breed improve-ment through artificial insemination, the L&DDdepartment is the principal provider ofservices to livestock owners. Services are
organised around three veterinary hospitals,11 dispensaries and 24 basic health centres,staffed for the most part by veterinarians. It isestimated that the department’s animal healthcare services cover only 14% of ruminant
animals in the district. In breed improvementprogrammes, coverage of buffalo and cattle isa dismal 2%.
Since the department is staffed primarily by
veterinarians, it is not surprising that its focusis on animal health issues, often at theexpense of livestock production extension. Asa result, little advice is available to farmers onimproving production techniques. Thedepartment’s capacity to provide much-needed animal health and breeding servicesis also severely limited. Here, private-sectorinput or public-private partnerships are worthconsidering.
5
Despite the willingness of governmentinstitutions to provide credit for thelivestock sector, few farmers have the
necessary training and expertise toutilise loans on a scale that iscommercially viable.
8/9/2019 Abbottabad Soed
http://slidepdf.com/reader/full/abbottabad-soed 57/150
43Abbottabad State of the Environment and Development
Livestock and Poultry
snNATURAL RESOURCECONSERVATION PROJECT
The NRCP’s 2000–01 work plan for thelivestock sector targets 70 villages in the Berote,
Boi and Thai areas. Its activities cover 34villages in 15 union councils, where some 138male and female community organisations havebeen established with close to 9,000 members.NRCP initiatives include work in the followingareas:i. breed improvement;ii. animal husbandry, including treatment,
vaccination and deworming;iii. supplying animal medicines at a 50%
subsidy;iv. fodder propagation;
v. defining the role of livestock extensionworkers;vi. training livestock farmers, distributing
information and organising field days; andvii. establishing linkages between community
organisations, livestock extension workersand the NRCP.
snSARHAD RURAL SUPPORTPROGRAMME
The SRSP’s activities in the livestock and dairysector focus on establishing a platform of
CBOs through which the L&DD departmentcan channel appropriate assistance to live-stock farmers. The SRSP has distributed goatsand poultry amongst livestock farmers, andextends credit for such activities to residents ofrural areas.
In terms of community involvement, the SRSPhas experienced operational difficulties inmaintaining three-way coordination betweenitself, voluntary organisations and the L&DDdepartment. This is at least partly a result of the
lack of clarity about the respective roles ofthese actors. Particularly since the SRSP isfundamentally a participatory entity, itsexperience provides an important lesson indeveloping a participatory orientation forinitiatives elsewhere in the sector.
5

8/9/2019 Abbottabad Soed
http://slidepdf.com/reader/full/abbottabad-soed 58/150
44 Abbottabad State of the Environment and Development
Fodder Reserves
Rangelands are broadly defined asuncultivated lands that provide fodder
for grazing animals. Considerableconfusion exists regarding both the formaldefinition of such areas, as well as theirquantum. According to some studies,Abbottabad’s rangelands cover 89,852 ha(Hatim et al 2001). This calculation is based onthe assumption that 56% of forest land is undergrazing, with culturable waste added to thatfigure. For the purpose of our discussion, all
forest areas (coniferous, scrub and shrublands), grasslands (grazing or hay-makingareas) and other uncultivated lands thatsupport herbaceous or shrubby growth arecounted as rangelands. Based on this widerdefinition, the total area of rangelands in Abbot-tabad district stands at 105,356 ha, amountingto 59% of the district’s reported area.
G razing Land and
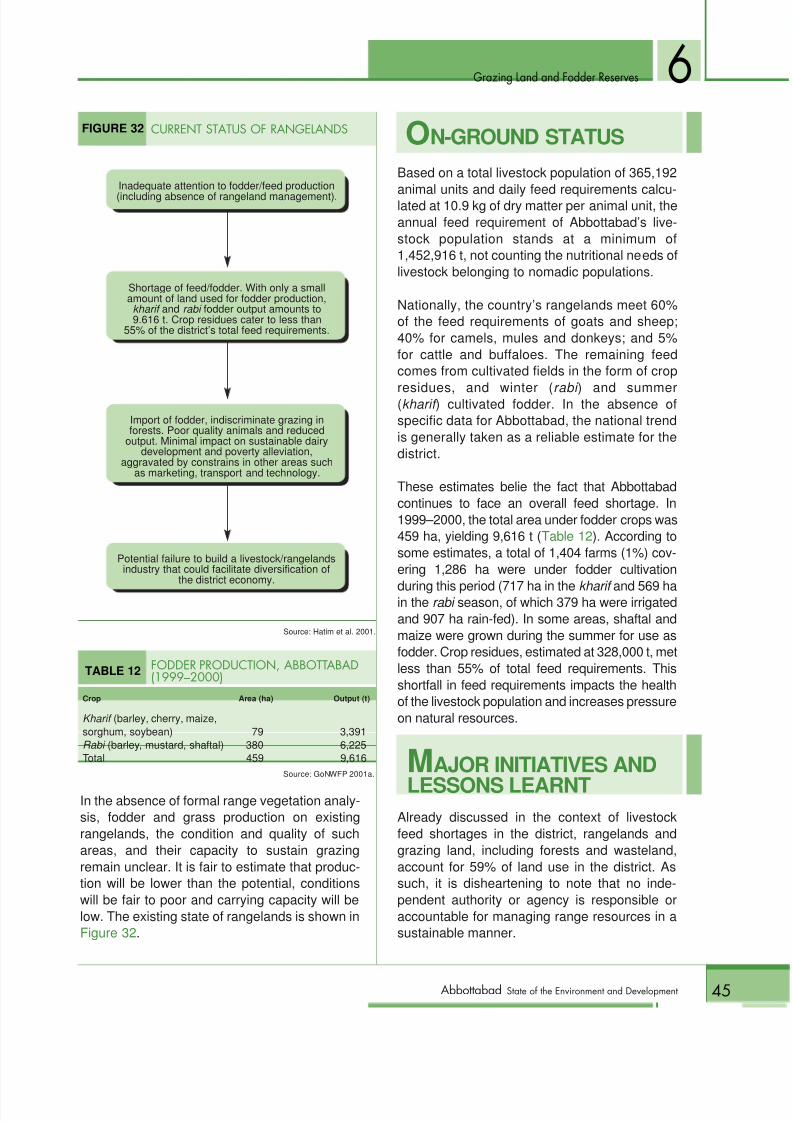
8/9/2019 Abbottabad Soed
http://slidepdf.com/reader/full/abbottabad-soed 59/150
Grazing Land and Fodder Reserves
45Abbottabad State of the Environment and Development
6
In the absence of formal range vegetation analy-sis, fodder and grass production on existingrangelands, the condition and quality of suchareas, and their capacity to sustain grazingremain unclear. It is fair to estimate that produc-tion will be lower than the potential, conditionswill be fair to poor and carrying capacity will below. The existing state of rangelands is shown inFigure 32 .
ON-GROUND STATUSBased on a total livestock population of 365,192
animal units and daily feed requirements calcu-lated at 10.9 kg of dry matter per animal unit, theannual feed requirement of Abbottabad’s live-stock population stands at a minimum of1,452,916 t, not counting the nutritional needs oflivestock belonging to nomadic populations.
Nationally, the country’s rangelands meet 60%of the feed requirements of goats and sheep;40% for camels, mules and donkeys; and 5%for cattle and buffaloes. The remaining feedcomes from cultivated fields in the form of crop
residues, and winter ( rabi ) and summer(kharif ) cultivated fodder. In the absence ofspecific data for Abbottabad, the national trendis generally taken as a reliable estimate for thedistrict.
These estimates belie the fact that Abbottabadcontinues to face an overall feed shortage. In1999–2000, the total area under fodder crops was459 ha, yielding 9,616 t ( Table 12 ). According tosome estimates, a total of 1,404 farms (1%) cov-ering 1,286 ha were under fodder cultivation
during this period (717 ha in the kharif and 569 hain the rabi season, of which 379 ha were irrigatedand 907 ha rain-fed). In some areas, shaftal andmaize were grown during the summer for use asfodder. Crop residues, estimated at 328,000 t, metless than 55% of total feed requirements. Thisshortfall in feed requirements impacts the healthof the livestock population and increases pressureon natural resources.
MAJOR INITIATIVES ANDLESSONS LEARNT
Already discussed in the context of livestockfeed shortages in the district, rangelands andgrazing land, including forests and wasteland,account for 59% of land use in the district. Assuch, it is disheartening to note that no inde-pendent authority or agency is responsible oraccountable for managing range resources in asustainable manner.
TABLE 12 FODDER PRODUCTION, ABBOTTABAD(1999√2000)
Crop Area (ha) Output (t)
Kharif (barley, cherry, maize,sorghum, soybean) 79 3,391Rabi (barley, mustard, shaftal) 380 6,225Total 459 9,616
Source: GoNWFP 2001a.
FIGURE 32 CURRENT STATUS OF RANGELANDS
Inadequate attention to fodder/feed production(including absence of rangeland management).
Shortage of feed/fodder. With only a smallamount of land used for fodder production,
kharif and rabi fodder output amounts to9.616 t. Crop residues cater to less than
55% of the district’s total feed requirements.
Import of fodder, indiscriminate grazing inforests. Poor quality animals and reduced
output. Minimal impact on sustainable dairydevelopment and poverty alleviation,
aggravated by constrains in other areas suchas marketing, transport and technology.
Potential failure to build a livestock/rangelandsindustry that could facilitate diversification of
the district economy.
Source: Hatim et al. 2001.
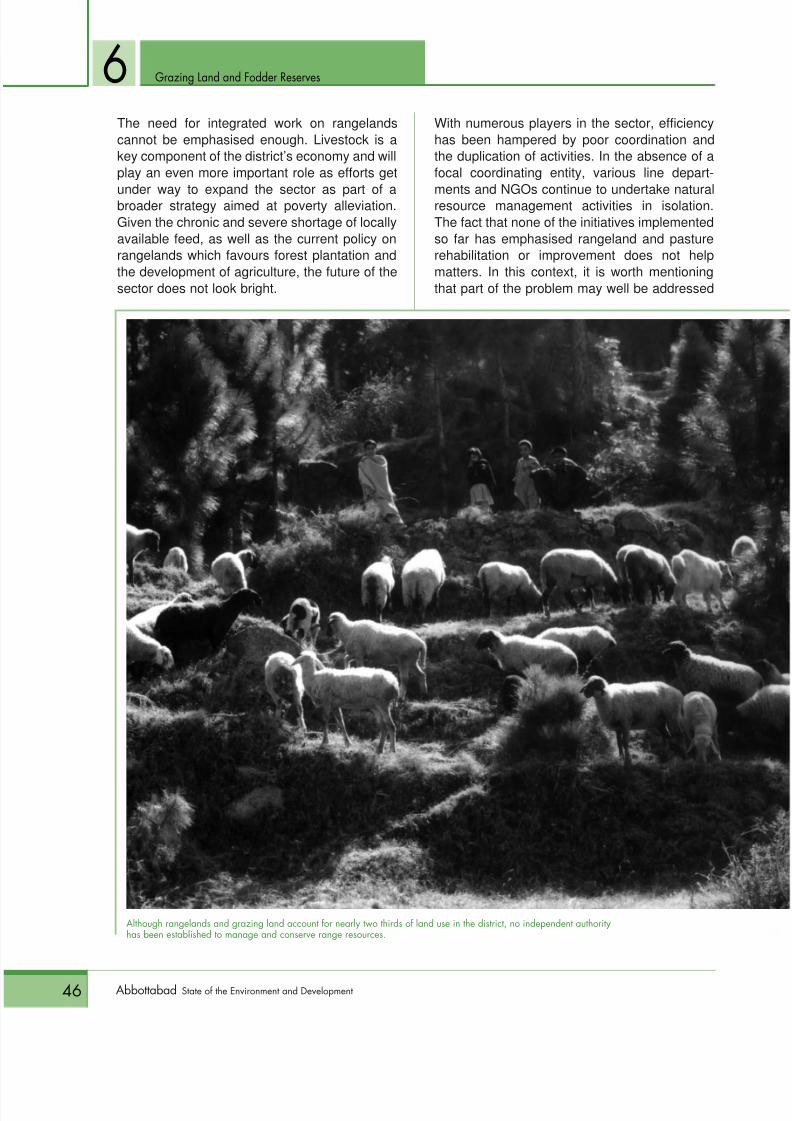
8/9/2019 Abbottabad Soed
http://slidepdf.com/reader/full/abbottabad-soed 60/150
Grazing Land and Fodder Reserves
46 Abbottabad State of the Environment and Development
6The need for integrated work on rangelandscannot be emphasised enough. Livestock is akey component of the district’s economy and willplay an even more important role as efforts get
under way to expand the sector as part of abroader strategy aimed at poverty alleviation.Given the chronic and severe shortage of locallyavailable feed, as well as the current policy onrangelands which favours forest plantation andthe development of agriculture, the future of thesector does not look bright.
With numerous players in the sector, efficiencyhas been hampered by poor coordination andthe duplication of activities. In the absence of afocal coordinating entity, various line depart-
ments and NGOs continue to undertake naturalresource management activities in isolation.The fact that none of the initiatives implementedso far has emphasised rangeland and pasturerehabilitation or improvement does not helpmatters. In this context, it is worth mentioningthat part of the problem may well be addressed
Although rangelands and grazing land account for nearly two thirds of land use in the district, no independent authorityhas been established to manage and conserve range resources.
8/9/2019 Abbottabad Soed
http://slidepdf.com/reader/full/abbottabad-soed 61/150
Grazing Land and Fodder Reserves
47Abbottabad State of the Environment and Development
6through the joint forest management conceptrecently introduced in the NWFP.
s
nGOVERNMENT DEPARTMENTS
Although the forest department is responsiblefor wasteland management, it has not providedtechnical or financial input to improve herba-ceous production in state forests to rehabilitatewasteland for the purpose of forage production.Instead, its major emphasis has been on theprotection and improvement of wood, the so-called timber orientation.
The agriculture department, responsible forfarmland, has made little progress in the devel-opment of rangeland. Only relatively recently(1994–95), under the BADP, were outlays made
available by the agricultural extension depart-ment to (i) increase fodder production by intro-ducing a demonstration programme, (ii) pro-mote forage and fodder tree production, and (iii)improve fodder preservation and utilisationtechniques. Interestingly, according to the eval-uation report of BADP Phase I, no actualprogress has been made in any of these areas(ADB 2001).
snNATURAL RESOURCECONSERVATION PROJECT
For the period 1996–2003, sector-specificinitiatives of the NRCP envisage rangeland
improvement on 2,000 ha, improved fodderproduction on 1,000 ha and livestock manage-ment in 70 villages. So far, trials on the use offertiliser to enhance grass production have beencarried out. Mott grass ( Pennisetum pur- pureum ), a fast-growing fodder which enhancesmilk production, is being introduced on theboundaries of cultivated fields and new fodder
varieties are being intro-duced in small demon-stration plots.
s
n WATERSHEDPROJECTS
With a focus on afforesta-tion in wasteland, whichcovers some 12,141 ha inthe district, the first ofthese projects was imple-mented in 1971–72. Overthe years, this focus hasremained unchanged, asseen in the work of theTarbela-Mangla Water-
shed Management Pro- ject (Phase I, 1983–84 to1992–93) which also con-centrated on afforesta-tion. Rangeland rehabili-tation and managementhave been addressedonly sporadically, with
measures such as digging ponds and providingcommunity support training in pasture raising. Interms of pasture improvement, a mere 4 ha offodder crops were cultivated and three ponds
constructed.
Phase II of the Tarbela-Mangla WatershedManagement Project (1993–94 to 2000–01)continued to stress afforestation. Of the totaloutlay of Rs 753 million, only Rs 9.5 million (amere 1.3%) was used to build 82 irrigationponds and extend support to 55 communities forfodder-related initiatives.
In the early period of watershed project
implementation, livestock feed wassupplied to landowners rather thanland users, creating a clash of interestswhich led users to resist activities suchas planting on grasslands or commonlands. This failure to identify the realstakeholders indicates acute myopiaon the part of planners. The needs and
priorities of communities were notevaluated, illustrating the conceptualmisdirection that has dogged initiativesin this sector.

8/9/2019 Abbottabad Soed
http://slidepdf.com/reader/full/abbottabad-soed 62/150
Grazing Land and Fodder Reserves
48 Abbottabad State of the Environment and Development
6Phase III (2001–06) proposes an outlay of Rs616 million and is expected to provide relativelygreater support to the sector. Grass cutting (haymaking), demonstration plots and the
construction of 100 ponds is planned, andvegetative cover is to be improved by controllinggrazing, using techniques developed by theMalakand Social Forestry Project.
In the early period of watershed projectimplementation, livestock feed was supplied tolandowners rather than land users, creating aclash of interests which led land users to resistactivities such as planting on grasslands orcommon lands. This failure to identify the realstakeholders indicates acute myopia on the
part of planners and has damaged long-termprospects for developing a participatory orien-tation. Planning was based on biased land useconcepts, with priority wrongly placed on the
conversion of grassland and grazing land toforest plantation. The needs and priorities of theconcerned communities were not evaluated,illustrating once again the conceptual misdirec-
tion that has dogged initiatives in the sector.In terms of implementation, poor planting tech-niques and the selection of inappropriatespecies resulted in the failure of such plans,magnified by droughts and heavy downpoursthat occur regularly in the area. The selection ofinappropriate techniques points to serious short-falls in technical capacity.
s
nOTHER INITIATIVES
SUNGI’s work in this sector includes establish-
ing fodder demonstration plots as part of anintegrated effort to enhance natural resourcerelated activities. The SRSP has also con-tributed to this sector.
8/9/2019 Abbottabad Soed
http://slidepdf.com/reader/full/abbottabad-soed 63/150
49Abbottabad State of the Environment and Development
and Protected Areas
Abbottabad’s mountainous landscape is charac-terised by vertical vegetational variations which
occur along sloping terrain. With its unique bio-ecology and a diverse ecosystem, the district offers arich natural environment to support a variety of wild floraand fauna. Of the 12 habitat types in the NWFP identi-fied by Roberts (1977), three are found in Abbottabad.Plant researchers have reported 80 endemic species inthe Hazara area (Nasir and Ali 1982). Of these species,more than 50% are said to occur in Abbottabad. Thedistrict supports approximately 1,300 plant varieties, 18
wild mammal species, 149 resident and migratory birdtypes, and 19 different reptiles.
ON-GROUND STATUSsnHABITAT TYPESThree major habitat types have been identified in Abbottabad district:(i) the subtropical broad-leaved zone, confined to sheltered ravines,which carries 40 species of trees, shrubs and woody climbers; (ii) the
B iodiversity, Parks

8/9/2019 Abbottabad Soed
http://slidepdf.com/reader/full/abbottabad-soed 64/150
50 Abbottabad State of the Environment and Development
Biodiversity, Parks and Protected Areas
subtropical chir pine zone, where chir is thedominant vegetation but a sprinkling of otherassociated plant species is also found; and (iii)the moist temperate zone, covering 26% of the
district, which is an important biotope for wildlifeand supports coniferous forests with patches ofbroad-leaved species. The moist temperatezone, which covers the entire Galliyat tract, ishome to the common leopard, common red fox,Murree vole and woolly flying squirrel, as well asthe kalij and koklass pheasants.
snSPECIES DIVERSITY An estimated 1,300 plant varieties are found inAbbottabad district. In addition, the area is hometo 18 mammal species, seven of which are
endangered: the common leopard, common redfox, Himalayan palm civet, jungle cat, Murreevole, musk deer and woolly flying squirrel. Of the149 types of resident and migratory birds foundin the district, 109 species have been recorded inAyubia National Park alone. Two of the NWFP’sfour pheasant species are found in the district,which is home to some 33% of all bird speciesfound in the province. Of these species, 14 areendangered, including the Eurasian woodcock,forest eagle owl, kalij pheasant ( Lophura leu- comelanos ), koklass pheasant ( Pucrasia
macrolopha ) and warbler (Roberts 1991).
According to the zoological survey department,19 reptile varieties (nine snakes and 10 lizards),nine indigenous fish species and three exoticfish species are found in Abbottabad. Agricul-tural varieties include six key species of agro-crops and seven key fruit varieties.
s
nPARKS AND PROTECTED AREAS
The NWFP Wildlife (Protection, Preservation,Conservation and Management) Act 1975
provides for the creation of various categories ofprotected areas: national parks, game reservesand wildlife sanctuaries. In Abbottabad district,two such protected areas have beendesignated: (i) the Ayubia National Park, spreadover 3,312 ha, which was established in 1984with the aim of preserving nature and naturalprocesses in a viable representative area of theGallies forests; and (ii) the Qalandarabad gamereserve, covering 8,940 ha, established in 1980
to protect the biodiversity of the area andpromote the sustainable use of game species byissuing shooting permits. Designated protectedareas cover only 6% of the landed area of the
district.s
nBIODIVERSITY LOSS: THE CASEOF THE POTATO
The fate of various potato varieties grown inAbbottabad illustrates the general state ofbiodiversity priorities in relation to economicconcerns. The potato is a major horticultural cropin Abbottabad and plays an important role in therural economy, where it is a cash crop of sortsdue to the immediate economic returns that itbrings. Common varieties grown in the past
originated from the white potato or Irish potato(Solanum tuberosum ), including the cultivarsAmalia, Aula, Christa, Cosima, Famosa, Franzi,Granola, Judika, Kondor, Lutina, Marion,Monalisa, Monza, Multa, Patrones (Dutch), Pinki,Ronea, Roxy, Sinduhri, Univita and Wilja, as wellas the local varieties, Kalsi and Lal-e-Faisal. Mostof these varieties are either no longer grown inthe district or cultivated only sporadically.
These varieties fell into disuse for a number ofreasons. Compared to the improved cultivars
introduced over the years, older varietiesproduce lower yields. In some cases, qualityseeds were not widely available. Other varietiesbecame prone to pest infestation and disease,or degenerated because rejuvenationtechniques were not applied. Meanwhile,lighter-skinned varieties also began to lose theirpopularity with the province’s consumers, whostarted to opt for red-skinned potatoes.
An indigenous variety under cultivation until theearly 1980s was the dark-skinned Kalsi.
Although this variety produces low yields, it pos-sesses high tolerance to freezing temperaturesand is resistant to blight. Despite these obviousadvantages, farmers in the area have long sinceabandoned cultivation of Kalsi, especially oncenew high-yielding cultivars became available.
The varieties now most commonly sown inAbbottabad include the Cardinal, Desiree,Diamant and Ultimus. These and other cultivars,
7
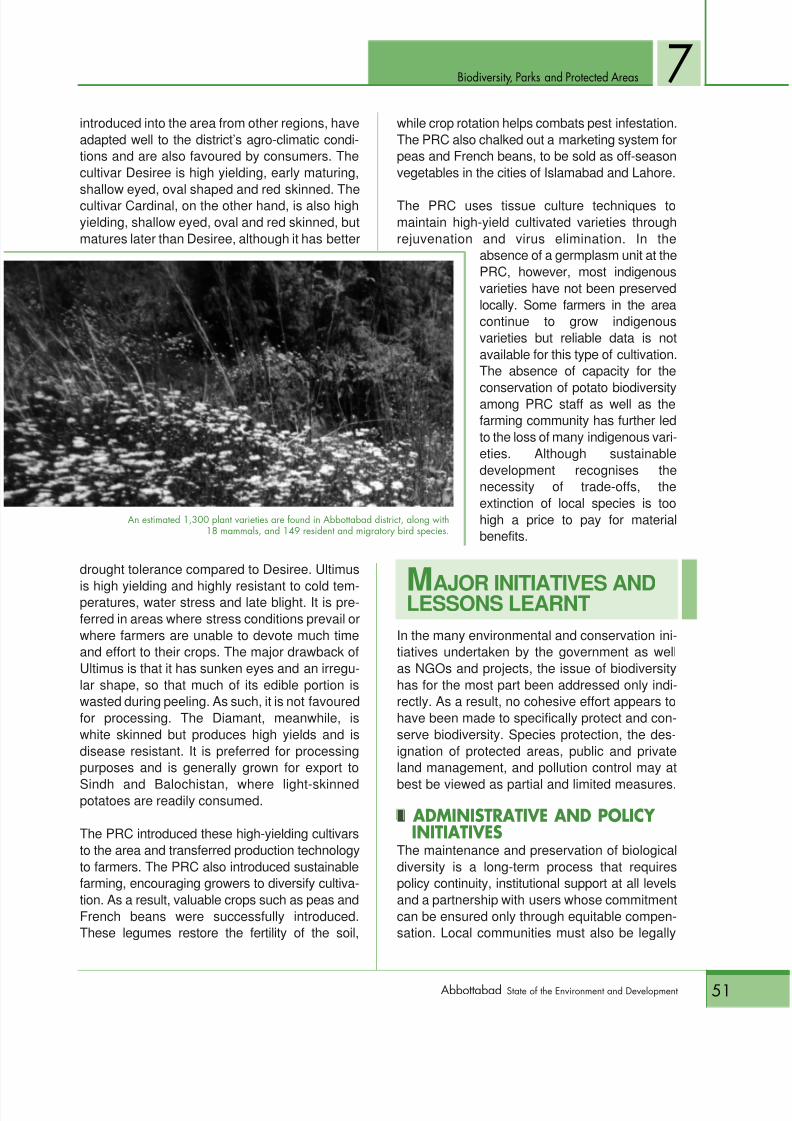
8/9/2019 Abbottabad Soed
http://slidepdf.com/reader/full/abbottabad-soed 65/150
51Abbottabad State of the Environment and Development
Biodiversity, Parks and Protected Areas
introduced into the area from other regions, haveadapted well to the district’s agro-climatic condi-tions and are also favoured by consumers. Thecultivar Desiree is high yielding, early maturing,
shallow eyed, oval shaped and red skinned. Thecultivar Cardinal, on the other hand, is also highyielding, shallow eyed, oval and red skinned, butmatures later than Desiree, although it has better
drought tolerance compared to Desiree. Ultimus
is high yielding and highly resistant to cold tem-peratures, water stress and late blight. It is pre-ferred in areas where stress conditions prevail orwhere farmers are unable to devote much timeand effort to their crops. The major drawback ofUltimus is that it has sunken eyes and an irregu-lar shape, so that much of its edible portion iswasted during peeling. As such, it is not favouredfor processing. The Diamant, meanwhile, iswhite skinned but produces high yields and isdisease resistant. It is preferred for processingpurposes and is generally grown for export to
Sindh and Balochistan, where light-skinnedpotatoes are readily consumed.
The PRC introduced these high-yielding cultivarsto the area and transferred production technologyto farmers. The PRC also introduced sustainablefarming, encouraging growers to diversify cultiva-tion. As a result, valuable crops such as peas andFrench beans were successfully introduced.These legumes restore the fertility of the soil,
while crop rotation helps combats pest infestation.The PRC also chalked out a marketing system forpeas and French beans, to be sold as off-seasonvegetables in the cities of Islamabad and Lahore.
The PRC uses tissue culture techniques tomaintain high-yield cultivated varieties throughrejuvenation and virus elimination. In the
absence of a germplasm unit at thePRC, however, most indigenousvarieties have not been preservedlocally. Some farmers in the areacontinue to grow indigenousvarieties but reliable data is notavailable for this type of cultivation.The absence of capacity for the
conservation of potato biodiversityamong PRC staff as well as thefarming community has further ledto the loss of many indigenous vari-eties. Although sustainabledevelopment recognises thenecessity of trade-offs, theextinction of local species is toohigh a price to pay for materialbenefits.
MAJOR INITIATIVES ANDLESSONS LEARNTIn the many environmental and conservation ini-tiatives undertaken by the government as wellas NGOs and projects, the issue of biodiversityhas for the most part been addressed only indi-rectly. As a result, no cohesive effort appears tohave been made to specifically protect and con-serve biodiversity. Species protection, the des-ignation of protected areas, public and privateland management, and pollution control may at
best be viewed as partial and limited measures.
sn ADMINISTRATIVE AND POLICY INITIATIVES
The maintenance and preservation of biologicaldiversity is a long-term process that requirespolicy continuity, institutional support at all levelsand a partnership with users whose commitmentcan be ensured only through equitable compen-sation. Local communities must also be legally
7
An estimated 1,300 plant varieties are found in Abbottabad district, along with18 mammals, and 149 resident and migratory bird species.
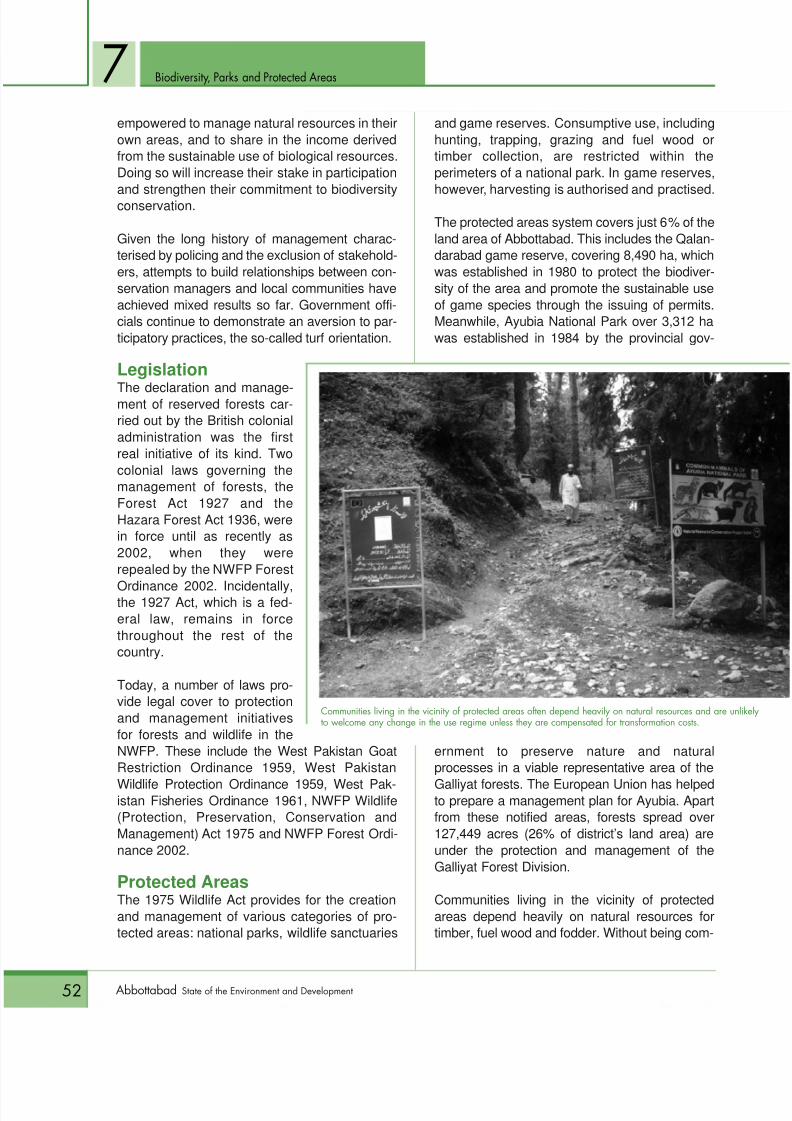
8/9/2019 Abbottabad Soed
http://slidepdf.com/reader/full/abbottabad-soed 66/150
52 Abbottabad State of the Environment and Development
Biodiversity, Parks and Protected Areas
empowered to manage natural resources in theirown areas, and to share in the income derivedfrom the sustainable use of biological resources.Doing so will increase their stake in participation
and strengthen their commitment to biodiversityconservation.
Given the long history of management charac-terised by policing and the exclusion of stakehold-ers, attempts to build relationships between con-servation managers and local communities haveachieved mixed results so far. Government offi-cials continue to demonstrate an aversion to par-ticipatory practices, the so-called turf orientation.
Legislation
The declaration and manage-ment of reserved forests car-ried out by the British colonialadministration was the firstreal initiative of its kind. Twocolonial laws governing themanagement of forests, theForest Act 1927 and theHazara Forest Act 1936, werein force until as recently as2002, when they wererepealed by the NWFP Forest
Ordinance 2002. Incidentally,the 1927 Act, which is a fed-eral law, remains in forcethroughout the rest of thecountry.
Today, a number of laws pro-vide legal cover to protectionand management initiativesfor forests and wildlife in theNWFP. These include the West Pakistan GoatRestriction Ordinance 1959, West Pakistan
Wildlife Protection Ordinance 1959, West Pak-istan Fisheries Ordinance 1961, NWFP Wildlife(Protection, Preservation, Conservation andManagement) Act 1975 and NWFP Forest Ordi-nance 2002.
Protected AreasThe 1975 Wildlife Act provides for the creationand management of various categories of pro-tected areas: national parks, wildlife sanctuaries
and game reserves. Consumptive use, includinghunting, trapping, grazing and fuel wood ortimber collection, are restricted within theperimeters of a national park. In game reserves,
however, harvesting is authorised and practised.The protected areas system covers just 6% of theland area of Abbottabad. This includes the Qalan-darabad game reserve, covering 8,490 ha, whichwas established in 1980 to protect the biodiver-sity of the area and promote the sustainable useof game species through the issuing of permits.Meanwhile, Ayubia National Park over 3,312 hawas established in 1984 by the provincial gov-
ernment to preserve nature and naturalprocesses in a viable representative area of the
Galliyat forests. The European Union has helpedto prepare a management plan for Ayubia. Apartfrom these notified areas, forests spread over127,449 acres (26% of district’s land area) areunder the protection and management of theGalliyat Forest Division.
Communities living in the vicinity of protectedareas depend heavily on natural resources fortimber, fuel wood and fodder. Without being com-
7
Communities living in the vicinity of protected areas often depend heavily on natural resources and are unliketo welcome any change in the use regime unless they are compensated for transformation costs.
8/9/2019 Abbottabad Soed
http://slidepdf.com/reader/full/abbottabad-soed 67/150
53Abbottabad State of the Environment and Development
Biodiversity, Parks and Protected Areas
pensated for transformation costs, they are notlikely to welcome any change in the use regime.The resentment bred among communities in theAyubia National Park area is a case in point. Cen-
tralised control over management and distributionof the benefits from the use of natural resourceshas frustrated local attempts to plan land usearound Ayubia. In addition, the construction of alarge number of houses and hotels around thepark threatens the very purpose for which it wasdemarcated as a protected area.
Policy and Implementation MilieuAs part of the larger fabric of insights regardingwork in this sector, the lessons learnt from theSDC experience are equally valid for future biodi-
versity management interventions in Abbottabad.A case study based on the SDC’s work shows thatthe management of natural resources and biodi-versity in a dysfunctional policy and implementa-tion milieu can only achieve limited success. Whenconservation issues come into conflict with thebasic needs of the people, conservation is invari-ably relegated to the backburner. In such a sce-nario, the macro framework needs to be reformedand institutional transformation is required.
The introduction of change must be in tune with
existing political and decision-making processes.At the same time, political and decision-makingprocesses themselves will have to change.Community-based systems for the managementof natural resources and biodiversity must bedeveloped, and local ownership for such initiativeshas to be translated into binding covenants,bolstered by political will and institutional support.In this connection, the Institutional TransformationCell, created by the NWFP government in 1998but disbanded four years later, was a step in theright direction.
The issues of governance, management anddevelopment are intricately intertwined. Sectoralpolicies that bypass the macro policy environ-ment can only yield limited results. Changingmanagement and development practicesrequires sustained, long-term commitment.While the district administration and civil societyshould be allied in this effort, donors also need toact in areas where they possess a relative
advantage. Strategies that are not backed bycommitment and resources are nothing but futileexercises. Public opinion looks for concreteevidence of action, and the eventual success of
conservation efforts derives from realistic action.The provincial government has to date taken stepsto address some of the issues related to biodiver-sity conservation. The provincial government’speople-oriented forest policy approved in 1999, thecreation in 1999 of a provincial forestrycommission and the forestry roundtable set up in1998, are cumulatively expected to foster a betterunderstanding of biodiversity concerns.
s
nFORESTRY SECTOR PROJECT
The NWFP Forestry Sector Project(1996–2002) was implemented by the provincialforest department with the financial assistanceof the ADB and the government of the Nether-lands. This project sought both institutionalreform and public-private partnerships to protectnatural resources and maintain biologicaldiversity. It is hoped that this dual approach willbe replicated elsewhere in the district.
s
nNATURAL RESOURCECONSERVATION PROJECT
The European Community-funded NRCP (1996– 2004) focuses on environmental rehabilitation inthe Gallies tract to create an ecological balancethat can support optimum and sustainable livingstandards for the people. Implemented by theforest department in conjunction with IUCN, thisproject seeks the cooperation of local communi-ties through social organisations. The most impor-tant output of the NRCP has been the preparationof a socially desirable, economically viable andecologically sustainable management plan for theAyubia National Park, developed in conjunction
with the European Union.
sn WORLD WIDE FUND FOR NATURE-PAKISTAN
From 1997 to 2000, WWF-Pakistan imple-mented a conservation project in the Galliyatarea. Known as ‘People and Plants: Conserva-tion and Training in Applied Ethno-Botany’, theproject’s aim was to promote an understandingof biodiversity preservation.
7

8/9/2019 Abbottabad Soed
http://slidepdf.com/reader/full/abbottabad-soed 68/150
54 Abbottabad State of the Environment and Development
A n estimated 117 km of rivers andstreams run through the district, inaddition to countless springs. The fish-
eries potential of these resources is yet to besystematically analysed. In 1998–99, the dis-trict produced 0.74 t of fish, marking a 56%decline from the previous year (1.66 t) and amassive 89% fall since 1996–97 (GoNWFP1999). The cash value of Abbottabad’s fisheriesoutput for the period 1998–99 is said to be Rs50,050 but this figure needs to be re-examinedsince the total provincial fisheries output duringthe same period is valued at Rs 40.397 million.
ON-GROUND STATUSOnly two water bodies in the district have been the subject oflimnological analysis. The first of these is the Thandianistream at Kalapani, which is rich in nutrients and offers anenvironment that is favourable for pisciculture, especially troutfarming. This stream ranks high on the habitat quality index
F isheries
8/9/2019 Abbottabad Soed
http://slidepdf.com/reader/full/abbottabad-soed 69/150
Fisheries
55Abbottabad State of the Environment and Development
8for the NWFP (Stockwell 1995). Indigenous fishspecies such as the masheer are also worthdeveloping, although care must be taken tostock the stream in accordance with its carrying
capacity.The other water body that has been analysedis the Daur river, which favours carp culture,particularly for species already found in theriver (Khan 1988). The remaining water bodiesin the district need to be limnologically studiedbefore measures can be taken for enrichment.In general, fish biodiversity increases from theupper to lower reaches of a catchment area.
MAJOR INITIATIVES ANDLESSONS LEARNTAt some point in the late 1950s, the then WestPakistan fisheries department conducted asurvey of fisheries resources in the country. Itsfindings are reproduced in research studiescarried out in the 1960s (Sadiq 1961; Ahmed1968). The survey revealed the existence of 30ponds used for fish culture in the Hazara andMardan areas, including a seven-tank fish farmat the army medical centre, rearing goldfish
along with masheer (Tor putitora ), mori (Cirri- nus mrigala ), rahu (Labeo rohita ) and tilapia(Tilapia nilotica , Tilapia mozambica , Tilapia zilli ., of which the first is most adaptable to localconditions).
In 1977–78, the fisheries department set up asmall carp hatchery at Lehrian. In the privatesector, an attempt was made to establish a troutfarm and hatchery at Kalapani, which was inoperation from 1990 to 1993 but was subse-quently abandoned. Today, under the adminis-
trative control of the district, a trout hatcheryoperates at Allai (Battagram).
Although Abbottabad provides good conditionsfor pisciculture development, no sustainedefforts have been made to tap this potential.The lack of attention to fisheries development is
all the more myopic considering that localdemand for fish is high. Despite the marketpotential, few income generating opportunitiesin this sector are available to the residents ofthe district. The fisheries department suffersfrom technical weaknesses as well as ashortage of staff, labouring under a legal andinstitutional framework that does not permitparticipatory management or communityinvolvement. Limited to policing and fishfarming, the department has paid scantattention to habitat construction, ecosystem
studies and protection measures. At the sametime, poor awareness of current issues in thesector has led to indiscriminate fishing, and thewidespread use of inhumane and destructivemethods.
Apart from two studies, limnological analyseshave not been undertaken on the rivers andstreams that flow through the district to under-stand how fisheries resources may be enriched.Meanwhile, the impact of waste and pollution,the diversion of water for agricultural purposes
and improper planning have undermined thehealth of the sector.
The key lesson learned from past experience isthat aquatic resources need to be explored anddeveloped as part of an integrated strategy toaddress poverty alleviation and curtail unduepressure on natural resources. The public-privatefish farming initiative launched in Madyan (Swat)needs to be studied for possible replication inAbbottabad. At the same time, adequate legisla-tive cover must be made available and participa-
tory interventions developed for the sector,backed by resources and capacity building.
8/9/2019 Abbottabad Soed
http://slidepdf.com/reader/full/abbottabad-soed 70/150
Brown Sectors
PART III
8/9/2019 Abbottabad Soed
http://slidepdf.com/reader/full/abbottabad-soed 71/150
57Abbottabad State of the Environment and Development
T
he mining sector in Abbottabad ischaracterised by considerable varia-tions in output over relatively short
periods of time. Both underground and open-pit methods are used, with scant regard to theenvironmental and public health impact ofthese operations. Oversight is practically non-existent and safety measures are ignored.Operations in this sector are undertaken with-out adequate information or training, and withblatant disregard for the law. Environmentalimpact assessments (EIAs) are rarely con-
ducted for new projects, while the licensingsystem is heavily biased in favour of com-mercial considerations.
ON-GROUND STATUSBetween 1996 and 2000, total output grew by almost 55%,falling 16% between 1996 and 1998 before increasing sub-stantially in the following year ( Table 13 ).
Mining
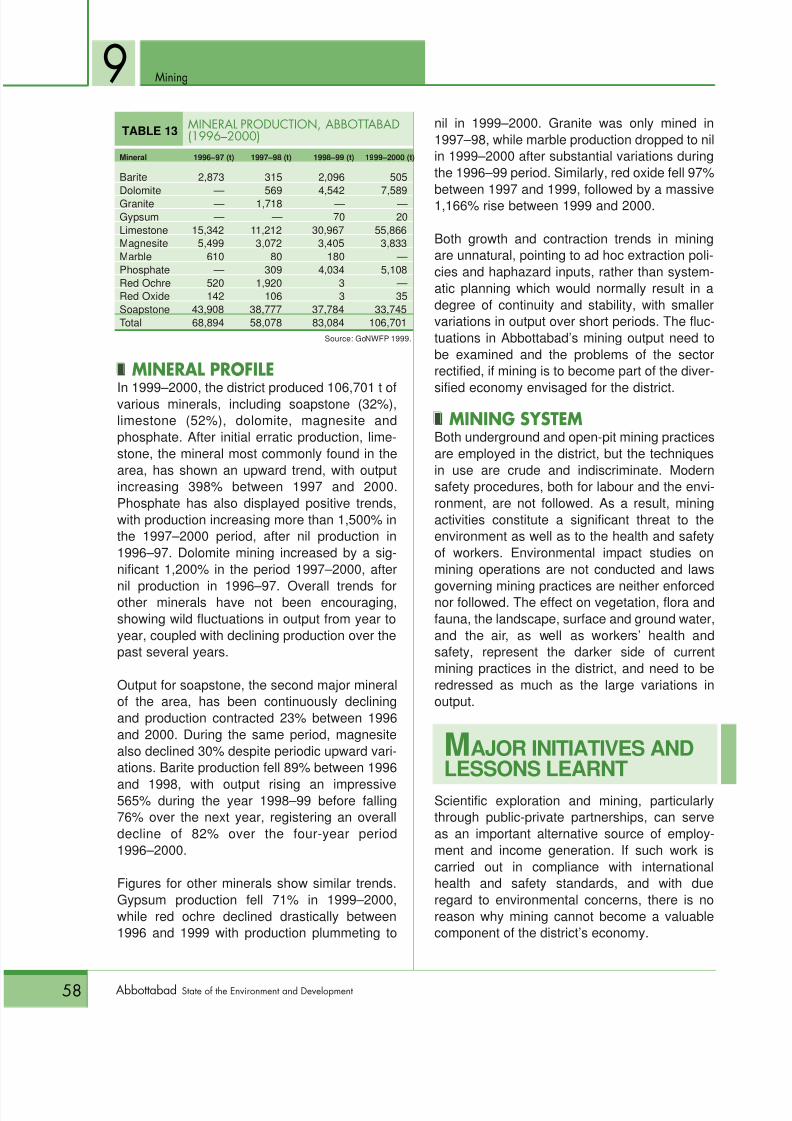
8/9/2019 Abbottabad Soed
http://slidepdf.com/reader/full/abbottabad-soed 72/150
58 Abbottabad State of the Environment and Development
9 Mining
s
nMINERAL PROFILE
In 1999–2000, the district produced 106,701 t ofvarious minerals, including soapstone (32%),limestone (52%), dolomite, magnesite andphosphate. After initial erratic production, lime-stone, the mineral most commonly found in thearea, has shown an upward trend, with outputincreasing 398% between 1997 and 2000.Phosphate has also displayed positive trends,with production increasing more than 1,500% inthe 1997–2000 period, after nil production in1996–97. Dolomite mining increased by a sig-nificant 1,200% in the period 1997–2000, after
nil production in 1996–97. Overall trends forother minerals have not been encouraging,showing wild fluctuations in output from year toyear, coupled with declining production over thepast several years.
Output for soapstone, the second major mineralof the area, has been continuously decliningand production contracted 23% between 1996and 2000. During the same period, magnesitealso declined 30% despite periodic upward vari-ations. Barite production fell 89% between 1996
and 1998, with output rising an impressive565% during the year 1998–99 before falling76% over the next year, registering an overalldecline of 82% over the four-year period1996–2000.
Figures for other minerals show similar trends.Gypsum production fell 71% in 1999–2000,while red ochre declined drastically between1996 and 1999 with production plummeting to
nil in 1999–2000. Granite was only mined in1997–98, while marble production dropped to nilin 1999–2000 after substantial variations duringthe 1996–99 period. Similarly, red oxide fell 97%
between 1997 and 1999, followed by a massive1,166% rise between 1999 and 2000.
Both growth and contraction trends in miningare unnatural, pointing to ad hoc extraction poli-cies and haphazard inputs, rather than system-atic planning which would normally result in adegree of continuity and stability, with smallervariations in output over short periods. The fluc-tuations in Abbottabad’s mining output need tobe examined and the problems of the sectorrectified, if mining is to become part of the diver-
sified economy envisaged for the district.snMINING SYSTEMBoth underground and open-pit mining practicesare employed in the district, but the techniquesin use are crude and indiscriminate. Modernsafety procedures, both for labour and the envi-ronment, are not followed. As a result, miningactivities constitute a significant threat to theenvironment as well as to the health and safetyof workers. Environmental impact studies onmining operations are not conducted and laws
governing mining practices are neither enforcednor followed. The effect on vegetation, flora andfauna, the landscape, surface and ground water,and the air, as well as workers’ health andsafety, represent the darker side of currentmining practices in the district, and need to beredressed as much as the large variations inoutput.
MAJOR INITIATIVES ANDLESSONS LEARNT
Scientific exploration and mining, particularlythrough public-private partnerships, can serveas an important alternative source of employ-ment and income generation. If such work iscarried out in compliance with internationalhealth and safety standards, and with dueregard to environmental concerns, there is noreason why mining cannot become a valuablecomponent of the district’s economy.
TABLE 13 MINERAL PRODUCTION, ABBOTTABAD(1996√2000)
Mineral 1996–97 (t) 1997–98 (t) 1998–99 (t) 1999–2000 (t)
Barite 2,873 315 2,096 505Dolomite — 569 4,542 7,589Granite — 1,718 — —Gypsum — — 70 20Limestone 15,342 11,212 30,967 55,866Magnesite 5,499 3,072 3,405 3,833Marble 610 80 180 —Phosphate — 309 4,034 5,108Red Ochre 520 1,920 3 —Red Oxide 142 106 3 35Soapstone 43,908 38,777 37,784 33,745Total 68,894 58,078 83,084 106,701
Source: GoNWFP 1999.
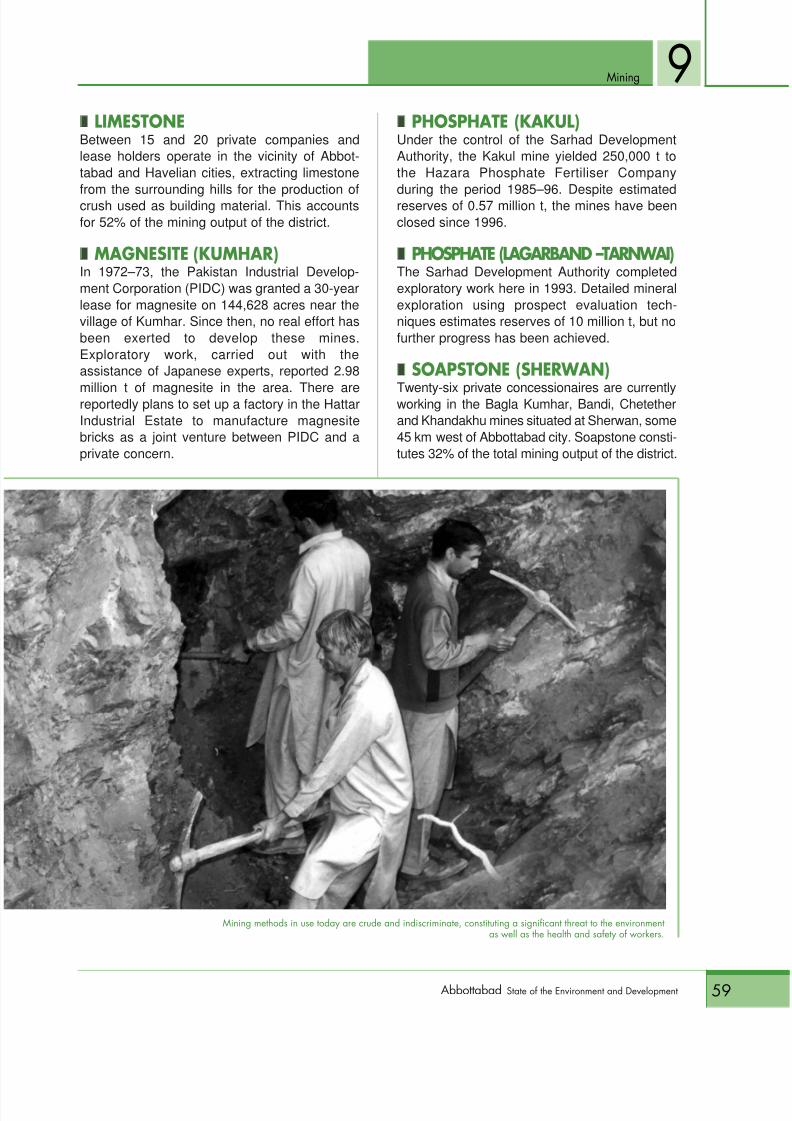
8/9/2019 Abbottabad Soed
http://slidepdf.com/reader/full/abbottabad-soed 73/150
8/9/2019 Abbottabad Soed
http://slidepdf.com/reader/full/abbottabad-soed 74/150
60 Abbottabad State of the Environment and Development
W ith no local power generation capacity tospeak of, the district depends on a varietyof external sources to meet its energy
requirements. These include electricity from the
national grid and natural gas supplied throughpipelines. In rural areas, meanwhile, residents relyheavily on wood, some of which comes fromAbbottabad’s forests while the remainder is imported.
ON-GROUND STATUSsnELECTRICITY Much of the electricity supplied to the district is used for lighting,serving the needs of nearly 75% of households ( Table 14 ).Abbottabad is linked to the national grid, a network of high-voltage
transmission lines spread across the country, with some 163,547power connections provided by the year 2000. Of these, over 88% aredomestic customers with the remainder divided between commercial,industrial and agricultural users. During 1999–2000, the Abbottabadoffice of the Peshawar Electric Supply Company sold 177.386 millionunits of electricity, while consumption during that period stood at228.381 million units. The discrepancy is accounted for by line lossesto the tune of 50.995 million units or 22%. Areas that lie on thedistrict’s borders with neighbouring Murree and Mansehra aresupplied electricity by those districts.
Energy
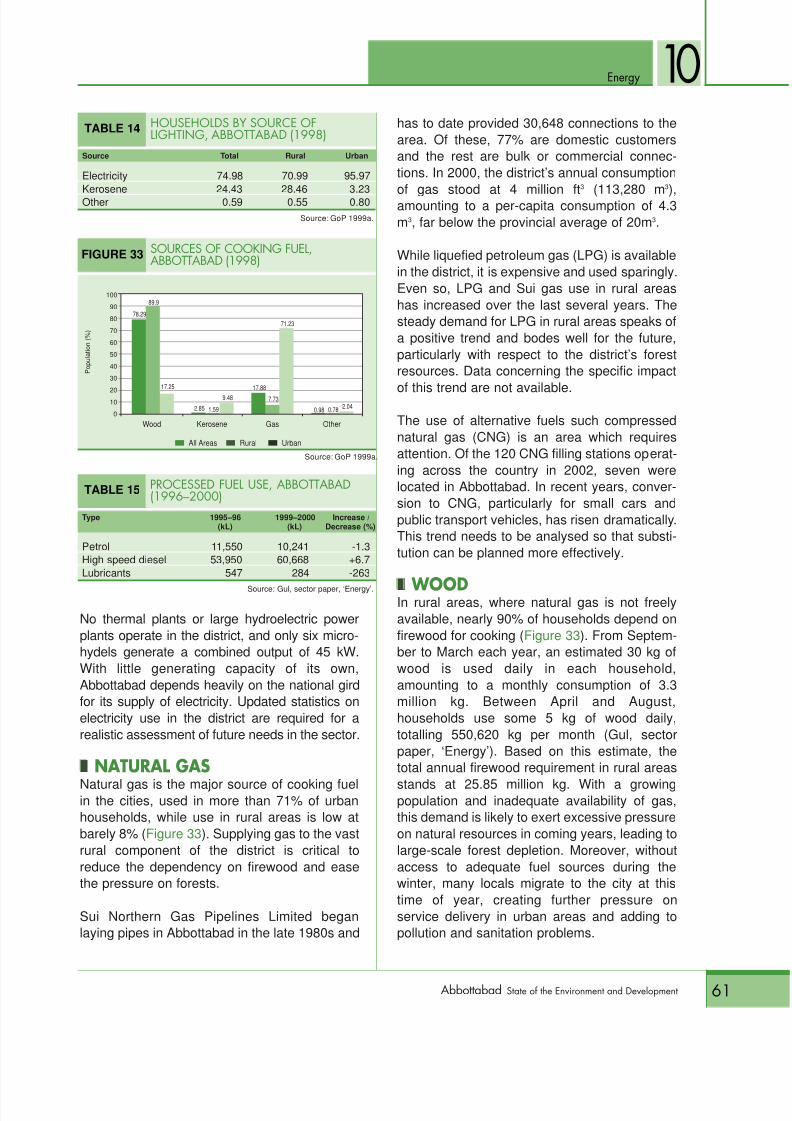
8/9/2019 Abbottabad Soed
http://slidepdf.com/reader/full/abbottabad-soed 75/150
Energy
61Abbottabad State of the Environment and Development
10
No thermal plants or large hydroelectric powerplants operate in the district, and only six micro-hydels generate a combined output of 45 kW.With little generating capacity of its own,Abbottabad depends heavily on the national girdfor its supply of electricity. Updated statistics onelectricity use in the district are required for arealistic assessment of future needs in the sector.
s
nNATURAL GAS
Natural gas is the major source of cooking fuelin the cities, used in more than 71% of urbanhouseholds, while use in rural areas is low atbarely 8% ( Figure 33 ). Supplying gas to the vastrural component of the district is critical toreduce the dependency on firewood and easethe pressure on forests.
Sui Northern Gas Pipelines Limited beganlaying pipes in Abbottabad in the late 1980s and
has to date provided 30,648 connections to thearea. Of these, 77% are domestic customersand the rest are bulk or commercial connec-tions. In 2000, the district’s annual consumption
of gas stood at 4 million ft3
(113,280 m3
),amounting to a per-capita consumption of 4.3m3, far below the provincial average of 20m 3.
While liquefied petroleum gas (LPG) is availablein the district, it is expensive and used sparingly.Even so, LPG and Sui gas use in rural areashas increased over the last several years. Thesteady demand for LPG in rural areas speaks ofa positive trend and bodes well for the future,particularly with respect to the district’s forestresources. Data concerning the specific impact
of this trend are not available.
The use of alternative fuels such compressednatural gas (CNG) is an area which requiresattention. Of the 120 CNG filling stations operat-ing across the country in 2002, seven werelocated in Abbottabad. In recent years, conver-sion to CNG, particularly for small cars andpublic transport vehicles, has risen dramatically.This trend needs to be analysed so that substi-tution can be planned more effectively.
s
n WOODIn rural areas, where natural gas is not freely
available, nearly 90% of households depend onfirewood for cooking ( Figure 33 ). From Septem-ber to March each year, an estimated 30 kg ofwood is used daily in each household,amounting to a monthly consumption of 3.3million kg. Between April and August,households use some 5 kg of wood daily,totalling 550,620 kg per month (Gul, sectorpaper, ‘Energy’). Based on this estimate, thetotal annual firewood requirement in rural areas
stands at 25.85 million kg. With a growingpopulation and inadequate availability of gas,this demand is likely to exert excessive pressureon natural resources in coming years, leading tolarge-scale forest depletion. Moreover, withoutaccess to adequate fuel sources during thewinter, many locals migrate to the city at thistime of year, creating further pressure onservice delivery in urban areas and adding topollution and sanitation problems.
TABLE 14 HOUSEHOLDS BY SOURCE OFLIGHTING, ABBOTTABAD (1998)
Source Total Rural Urban
Electricity 74.98 70.99 95.97Kerosene 24.43 28.46 3.23Other 0.59 0.55 0.80
Source: GoP 1999a.
TABLE 15 PROCESSED FUEL USE, ABBOTTABAD(1996√2000)
Type 1995–96 1999–2000 Increase /(kL) (kL) Decrease (%)
Petrol 11,550 10,241 -1.3High speed diesel 53,950 60,668 +6.7Lubricants 547 284 -263
Source: Gul, sector paper, ‘Energy’.
Wood Kerosene Gas Other
FIGURE 33 SOURCES OF COOKING FUEL,ABBOTTABAD (1998)
100
90
80
70
60
50
40
30
2010
0
s All Areas s Rural s Urban
P o p u l a t i o n
( % )
Source: GoP 1999a.
78.29
89.9
17.25
2.85 1.59
9.4817.88
7.73
71.23
0.98 0.78 2.04
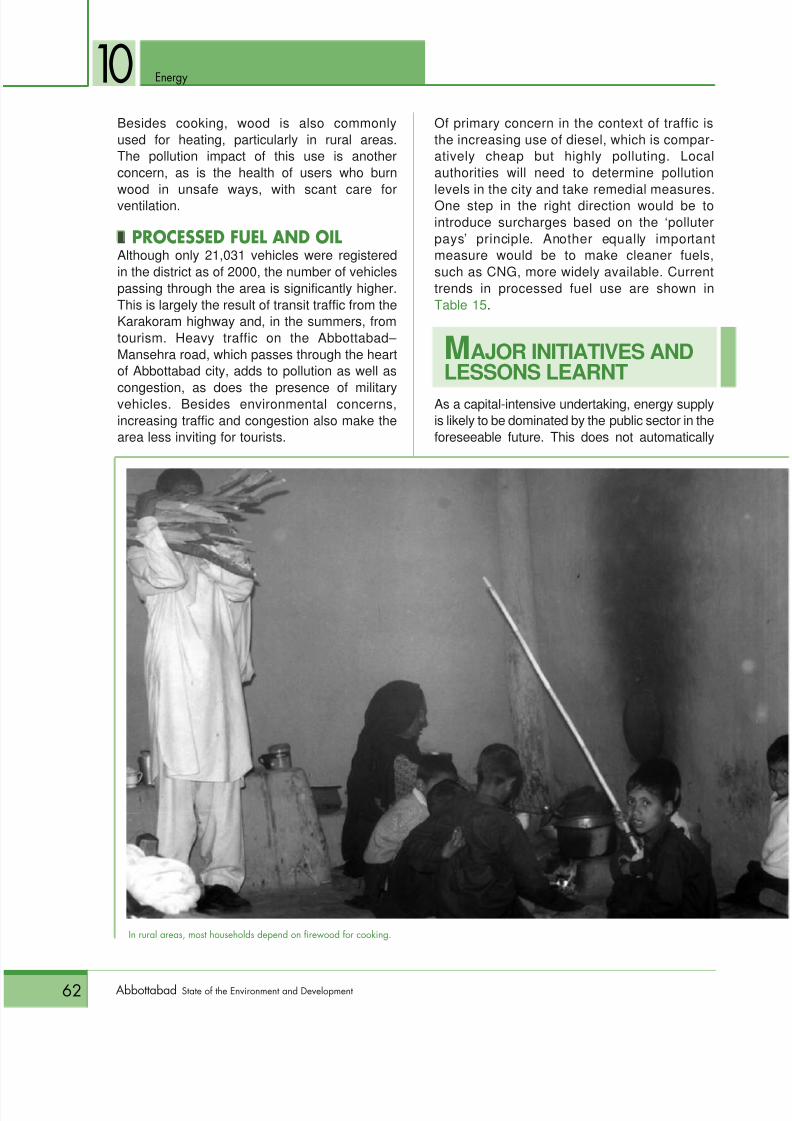
8/9/2019 Abbottabad Soed
http://slidepdf.com/reader/full/abbottabad-soed 76/150
Energy
62 Abbottabad State of the Environment and Development
10Besides cooking, wood is also commonlyused for heating, particularly in rural areas.The pollution impact of this use is anotherconcern, as is the health of users who burn
wood in unsafe ways, with scant care forventilation.
snPROCESSED FUEL AND OILAlthough only 21,031 vehicles were registeredin the district as of 2000, the number of vehiclespassing through the area is significantly higher.This is largely the result of transit traffic from theKarakoram highway and, in the summers, fromtourism. Heavy traffic on the Abbottabad– Mansehra road, which passes through the heartof Abbottabad city, adds to pollution as well as
congestion, as does the presence of militaryvehicles. Besides environmental concerns,increasing traffic and congestion also make thearea less inviting for tourists.
Of primary concern in the context of traffic isthe increasing use of diesel, which is compar-atively cheap but highly polluting. Localauthorities will need to determine pollution
levels in the city and take remedial measures.One step in the right direction would be tointroduce surcharges based on the ‘polluterpays’ principle. Another equally importantmeasure would be to make cleaner fuels,such as CNG, more widely available. Currenttrends in processed fuel use are shown inTable 15 .
MAJOR INITIATIVES ANDLESSONS LEARNT
As a capital-intensive undertaking, energy supplyis likely to be dominated by the public sector in theforeseeable future. This does not automatically
In rural areas, most households depend on firewood for cooking.

8/9/2019 Abbottabad Soed
http://slidepdf.com/reader/full/abbottabad-soed 77/150
Energy
63Abbottabad State of the Environment and Development
10preclude community involvement, particularly inareas such as conservation and rational use.
s
n AFFORESTATION AND SOIL
CONSERVATION, GALLIYAT PROJECTIn operation from 1988 to 1994, this projectcarried out afforestation and built check dams inthe Galliyat area. Similar work was undertakenby the Hazara Social Forestry Project (1991–96),Sokah Nulla Project (1983–96) and Environmen-tal Rehabilitation Project (1993–98) to improvefuel wood supply by planting nurseries. Timberexports grew substantially as a result of theseinitiatives, generating a substantial quantity ofwaste to be used as fuel.
Besides afforestation projects, SUNGI isworking to promote sustainable forest resourceuse through its ‘Pakistan Network of Rivers,Dams and People’ initiative.
snPAK-GERMAN SIRAN FORESTDEVELOPMENT PROJECT
In operation from 1992 to 1996, this project hadmultiple goals which included introducingmodern techniques to curb the destruction oftrees, relieving pressure on the ecosystem,promoting irrigation-based agriculture and
establishing hydropower systems. These basiccomponents were combined with social forestryand intensive forest management. The majorachievement of this venture was to involvewomen in natural resource management.Multipurpose trees were planted in variousvillages and a number of check dams wereconstructed.
s
nOTHER INITIATIVES
In the early 1980s, the NWFP government incollaboration with the Pakistan Council for
Renewable Energy and Technology (PCRET)set up 20 biogas plants outside the homes ofcattle keepers. Some 15 such units wereinstalled on an experimental basis through thefederal government’s now-defunct EnergyResource Cell. Between 1987 and 1996,PCRET built six micro hydropower plants in thedistrict, with a combined capacity of 45 kW,sufficient to meet the energy requirements ofapproximately 560 households.
Although most of the district is now connected tothe national grid through the Peshawar ElectricSupply Company Abbottabad office, distributionremains biased in favour of urban consumers.
Line losses, mostly as a result of illegal connec-tions, are estimated to be as high as 22%.Waste occurs at the level of consumers as well,because most buildings are not constructed tobe energy efficient.
Some parts of the district are linked to the Suinatural gas pipeline, while the government hasincreased the supply of LPG to areas notcovered by the pipeline, thus mitigating thepressure on forests to some extent. The supplyof kerosene has also improved.
Situated at the crossroads of major highways,Abbottabad experiences considerable transittraffic, most of which uses diesel. Conversion toCNG should be encouraged and efforts hereneed to be supported by mass awarenesscampaigns, widespread availability and institu-tional support. The use of bracket coal andfurnace oil by the army needs to be discour-aged, in view of the harmful impact of thesefuels on the environment.
Supplying LPG and natural gas to rural areas,where wood remains the major source of cookingfuel, is another way in which the supply ofenergy can be increased, while at the same timeeasing the pressure on natural resources. Eventhough much of the fuel wood in use today isimported from outside the district, the depend-ence of local communities on firewood must bechecked to ensure the long-term survival offorests in the district. In light of increasing povertyin rural areas, this dependence inevitably resultsin illegal felling.
As a parallel effort to reduce dependency onwood, the use of fuel-efficient cooking andheating devices needs to be introduced. Alter-native technologies, such as solar energy,water mills, biogas and windmills, are otheravenues that should be explored throughprivate-public partnerships, donor assistanceand local community efforts. Centraliseddecision making should be replaced by
8/9/2019 Abbottabad Soed
http://slidepdf.com/reader/full/abbottabad-soed 78/150
8/9/2019 Abbottabad Soed
http://slidepdf.com/reader/full/abbottabad-soed 79/150
65Abbottabad State of the Environment and Development
Solid Waste Management
Given the low level of industrial activity inthe district, most of the waste water
and solid waste generated inAbbottabad comes from homes and institutions.
ON-GROUND STATUS
sn WASTE WATER In rural areas, toilets and septic tanks are used whereverpiped water is available. The resulting effluent, along withother domestic waste water, is fed into the street nullah (drain). In densely populated villages situated in flat areas,
this effluent tends to stagnate. Pools of waste water serve asbreeding grounds for mosquitoes, exposing nearbycommunities to the risk of diseases such as dengue,filariasis and malaria.
In urban areas, where piped water is widely available, theproblem of waste water disposal is even more serious. Here,most waste water is discharged either directly as sullage orindirectly as settled sewage into nullahs passing throughresidential areas. In Abbottabad and Havelian, where
Waste Water and
8/9/2019 Abbottabad Soed
http://slidepdf.com/reader/full/abbottabad-soed 80/150
66 Abbottabad State of the Environment and Development
Waste Water and Solid Waste Management
settlements are built on flat ground, sewagefrequently collects in stagnant pools out in theopen.
In Abbottabad and Havelian, hospitals, markets,restaurants and small industries add to theproblem. The AMC alone discharges 18,000gal/hr of waste which bypasses the hospital’sown treatment plant and is discharged directlyinto the Banda Ali Khan stream. Alarmingly, thisstream is used by area residents for irrigation aswell as drinking. Even in Nathiagali, where theGDA is responsible for overall environmentalmanagement, waste water disposal is left up toindividual households and hotel owners, withthe result that untreated sewage and sullage is
allowed to flow down hillsides, posing a threat tothe health of the population and seriously under-mining the tourist appeal of the area.
Only nominal quantities of industrial waste aregenerated in the district. One area of concern isthe vehicle battery cleaning and repair industryoperating in Abbottabad city. Approximately 30such units cause lead contamination in thesurrounding streams and rivers.
s
nSOLID WASTE
In both Abbottabad and Havelian, solid wastefrom households is invariably dumped out in theopen, often in close proximity to the housesthemselves. Conservative estimates put theannual quantity of municipal waste generated at20,000 t, although a more exhaustive studyneeds to be undertaken.
No statistical information is available specificallyfor Abbottabad. On a country-wide basis, anaverage of 50,000 t of waste is generated daily,of which just 60% is collected by the municipal
authorities. In addition, 50% of the 8,000 tons ofhuman excrement generated each day acrossthe country is deposited by the roadside orincorporated into solid waste. The picture forAbbottabad is in all likelihood similar, if notworse.
Municipal authorities have placed skips forgarbage collection in most areas but this meas-ure has proved to be ineffective. The location of
skips is inconvenient, discouraging widespreaduse. Even where they are used, garbage collec-tion is patchy and haphazard. In addition, manymohallahs (neighbourhoods) cannot be
accessed by municipal waste collection vehiclesbecause unauthorised construction has resultedin streets that are too narrow for such vehiclesto enter. The net result is that garbage is left tocollect in piles, clogging nullahs and creatingideal conditions for the proliferation of diseasevectors. Even in Nathiagali, where rubbish binsare available, area residents rarely depositgarbage in these containers.
Medical waste and toxic waste from businessare not treated separately during collection and
disposal. Residual waste such as torn plasticbags, tires and cloth which scavengers areunable to sell is used as fuel and ends up pro-ducing harmful emissions. Burning, a commonmethod of waste disposal, also produces toxicgas emissions and seriously affects the healthof communities living in proximity to garbagedumps.
sn
MEDICAL WASTEHospital waste management has long been anissue of critical concern both for the health
sector and civic authorities. In fact, properdisposal of medical waste was specifically high-lighted as an area of concern in the SPCS,which emphasised the indigenous production ofincinerators. The AMC with 1,000 beds, nineother civil hospitals with a combined 728 beds,and clinics in the public and private sector, areinvariably located in the middle of populatedareas, attracting hundreds of patients daily. Thissituation has no doubt been exacerbated follow-ing the policy introduced in 2001 under which allgovernment doctors were asked to shift their
private practices to hospital premises. None ofthese establishments possesses the facilities orexpertise to ensure the safe disposal of medicalwaste. As a result, medical and municipal wasteare frequently mixed. More often than not, path-ogenic and radioactive waste is deposited alongwith ordinary municipal waste at public dumps.
An estimated 18,000 kg/day of biomedicalwaste is generated in the province, of which
11

8/9/2019 Abbottabad Soed
http://slidepdf.com/reader/full/abbottabad-soed 81/150
67Abbottabad State of the Environment and Development
Waste Water and Solid Waste Management
Abbottabad and Mansehra account for 2,860kg/day. This is not surprising, considering thatthe waste generated by the AMC alone isestimated at 800 kg/day. Estimates for other
hospitals and health centres operating in thearea are not available.
For its part, the provincial government has takensome measures to remedy the problem. Anincinerator was installed at the AMC in 2002,with a capacity of 150 kg per cycle and capable
of running four cycles a day, thereby able tohandle 600 kg of waste daily, or 75% of the totalwaste generated by the institution. The capacityof this incinerator needs to be improved,
particularly since 40% of the hospital’s waste isremoved illegally and sold to recyclers.
sn WASTE DISPOSALThe current system of solid waste disposal ishighly unsatisfactory. Abbottabad town’s solidwaste is deposited at a municipal dump site at
11
At the municipal dump site at Salhad, some waste is burned out in the open while the remainder is left to rot.

8/9/2019 Abbottabad Soed
http://slidepdf.com/reader/full/abbottabad-soed 82/150
68 Abbottabad State of the Environment and Development
Waste Water and Solid Waste Management
Salhad, some 3 km from the city in a ravineclose to the Karakoram highway. Some of thiswaste is burned while the remainder is left to rot.There are no landfills in the area, nor have
attempts been made to redistribute waste.Havelian’s disposal site is located near the Daurriverbed, some 2 km downstream from the town.
sn WASTE MANAGEMENTWaste management in Abbottabad city is theresponsibility of the TMA, which employs a staffof 129, equipped with two multi-loading trucks,12 skips, three tractor-trolleys and 70 wheelbar-rows, to handle solid waste disposal. TheAbbottabad cantonment board performs similarfunctions for areas under its jurisdiction.
In Havelian, the TMA has overall responsibilityfor waste collection, with a staff of 32 equippedwith one tractor, one trolley and 29 wheelbar-rows. It is estimated that 8 t of waste is collected
each week from Havelian. In addition, thecantonment authorities employ 45 sweepers forwaste collection. Nevertheless, waste water andsolid waste management is far from satisfactory.
The open garbage dump on the highwayoutside Abbottabad city cannot create a particu-larly good impression on visitors to the area.
MAJOR INITIATIVES ANDLESSONS LEARNT
Responsibility for waste management lies in thepublic sector, and is to be executed through cityand town authorities. A few initiatives have also
been undertaken by the non-government sector.The system of handling waste water and solidwaste poses serious threats to the environmentas well as human health, not to mention theaesthetic appeal of the district. A recent attempt
11
More often than not, pathogenic waste from medical facilities is deposited along with ordinary refuse at public dumpswhere animals are allowed to forage.
8/9/2019 Abbottabad Soed
http://slidepdf.com/reader/full/abbottabad-soed 83/150
69Abbottabad State of the Environment and Development
Waste Water and Solid Waste Management
by the district administration to relocate theexisting garbage dump near the Karakoramhighway has been stymied by conflicts over ofthe choice of a new site.
It is impossible to address solid waste andwaste water management issues without theinvolvement of communities that generate thewaste. Whether it is urban households, ruralcommunities or commercial enterprises, acooperative effort is needed to arrive at acommon approach that can be used to developnew initiatives.
The efficiency of existing players needs to beimproved through monitoring and evaluation. To
begin with, the treatment plant at the AMC,currently out of operation, needs to be broughtback online. The GDA must intervene moreactively in waste management in the Galliyatarea and the municipal dump next to theKarakoram highway should be moved to a moreacceptable location. At the same time, moreefficient waste disposal methods, such as land-fills and redistribution, need to be investigated.The Jougni waste water treatment plant in Kakulshould be reactivated.
Indiscriminate land use, ineffective oversight ofconstruction projects, and the lack of land use
planning, zoning and building codes, mean thathaphazard growth will continue occur with littleor no attention paid to critical issues such asadequate facilities for waste disposal. The
problem cannot be addressed in isolation or bya single agency. The long-term effect ofinappropriate waste disposal on public health,the environment and tourism cannot be ignored.
Between 80 and 90% of the local wastemanagement budget goes to pay the salaries ofstaff whose service delivery is erratic, patchyand unreliable. This in itself is a deplorablefailure of governance. In addition to improvingthe performance of municipal bodies, some ofthe cost and effort will have to be shared by
NGOs and local communities in order toaddress the problem realistically. The devolutionplan offers considerable opportunity foroversight at the mohallah (neighbourhood)level, besides allowing for advocacy to takeplace at the level of community representativesand leaders.
Finally, legal cover and oversight mechanismsare needed to check the pollution of rivers andstreams used for irrigation and drinking.Legislation will also be required to stop the
indiscriminate dumping of waste which clogsdrainage channels.
11
8/9/2019 Abbottabad Soed
http://slidepdf.com/reader/full/abbottabad-soed 84/150
70 Abbottabad State of the Environment and Development
and Zoning
An important consideration in planning forsustainable development for the district is
the problem posed by increasing urbani-sation, which results in haphazard residentialand commercial construction. In the absence ofarea-specific land use planning and zoning laws,ignorance regarding the environmental impact ofunregulated growth is widespread while publicattitudes are characterised by apathy. With theimplementation of devolution, an attempt hasbeen made to address this problem by assigning
responsibility for land use to the TMAs. Legalmechanisms, political will and capacity forimplementation are yet to be developed.
ON-GROUND STATUSThe population of the district is growing at an alarming rate.This has increased the pressure on already stretchedresources and services, nearly exhausting their capacity and
Land Use Planning
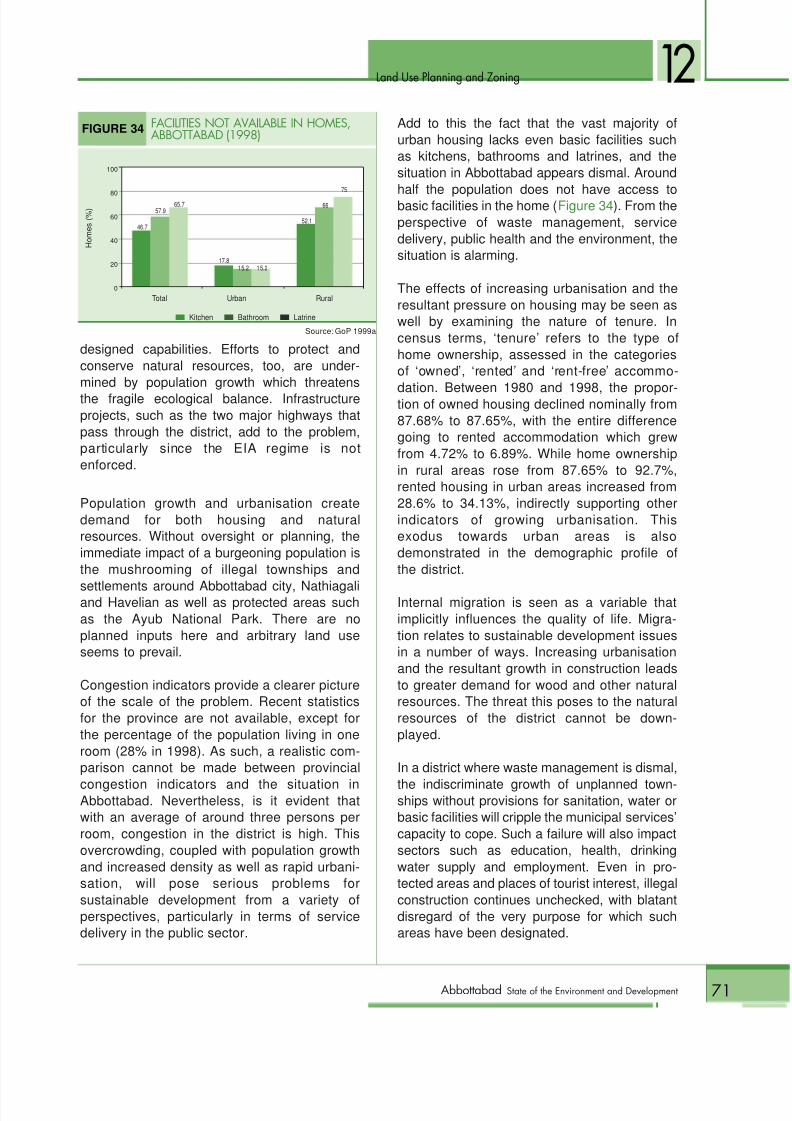
8/9/2019 Abbottabad Soed
http://slidepdf.com/reader/full/abbottabad-soed 85/150
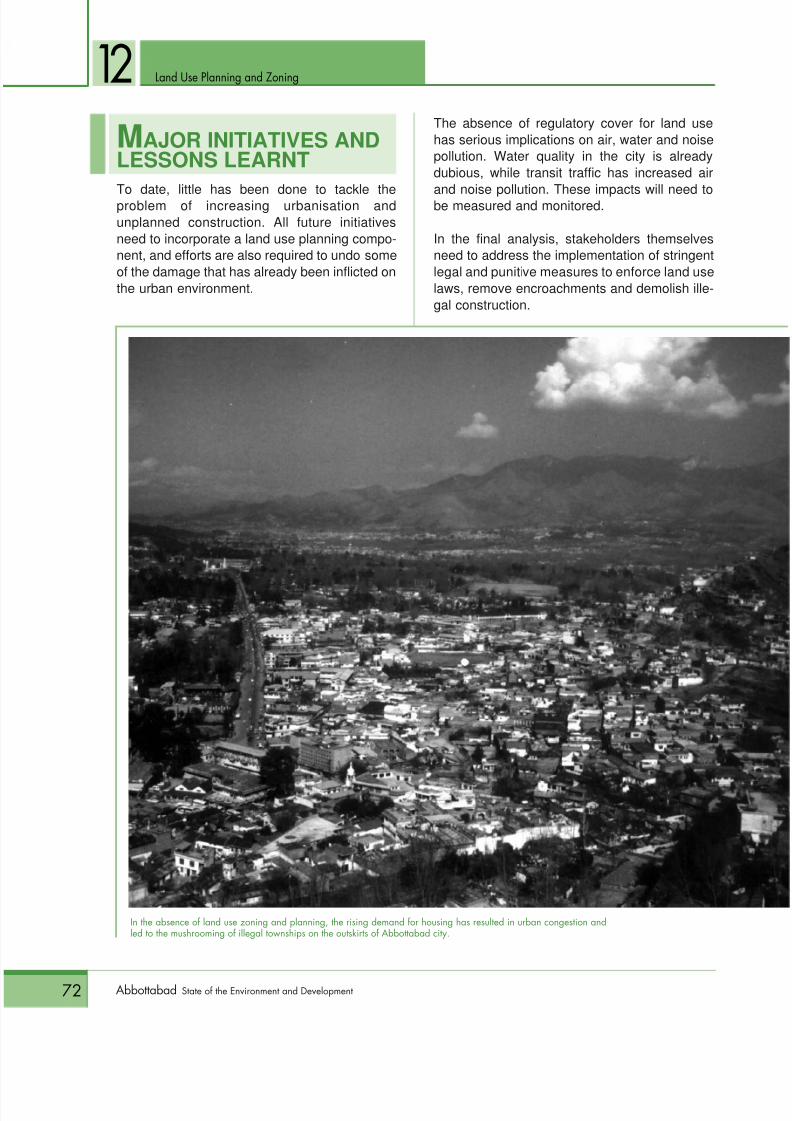
8/9/2019 Abbottabad Soed
http://slidepdf.com/reader/full/abbottabad-soed 86/150
Land Use Planning and Zoning
72 Abbottabad State of the Environment and Development
12MAJOR INITIATIVES ANDLESSONS LEARNT
To date, little has been done to tackle theproblem of increasing urbanisation andunplanned construction. All future initiativesneed to incorporate a land use planning compo-nent, and efforts are also required to undo someof the damage that has already been inflicted onthe urban environment.
The absence of regulatory cover for land usehas serious implications on air, water and noisepollution. Water quality in the city is alreadydubious, while transit traffic has increased air
and noise pollution. These impacts will need tobe measured and monitored.
In the final analysis, stakeholders themselvesneed to address the implementation of stringentlegal and punitive measures to enforce land uselaws, remove encroachments and demolish ille-gal construction.
In the absence of land use zoning and planning, the rising demand for housing has resulted in urban congestion andled to the mushrooming of illegal townships on the outskirts of Abbottabad city.

8/9/2019 Abbottabad Soed
http://slidepdf.com/reader/full/abbottabad-soed 87/150
Socio-EconomicSectors
PART IV

8/9/2019 Abbottabad Soed
http://slidepdf.com/reader/full/abbottabad-soed 88/150
74 Abbottabad State of the Environment and Development
Education enhances both the quality andproductivity of labour, and serves as a key indi-cator of socio-economic development. It is
instrumental in enabling economic growth by fosteringattitudes and behaviours that are compatible withmodern societal requirements.
ON-GROUND STATUSIn the year 1999–2000, some 1,549 primary schools (67% for boys,33% for girls), 107 middle schools (63% for boys, 27% for girls), 87high schools (74% for boys, 26% for girls) and 11 higher secondaryschools (64% for boys, 26% for girls) were operating in Abbottabad,
along with one intermediate college, three degree colleges and twopost-graduate colleges, all of them run by the government ( Figure 35 ).The formal sector is supplemented by 14 maktabs or religiousschools, 347 mosque schools and a substantial number of educa-tional institutions in the private sector. Three vocational schools, sixcommunity schools and two Japan International Cooperation Agencyschools are also operating in the district. A 1999 research studycarried out by the Frontier Education Foundation (FEF) showed thatthe private sector’s contribution to raising the enrolment ratio stood at13% (FEF 1999). This figure is expected to have risen over
E ducation

8/9/2019 Abbottabad Soed
http://slidepdf.com/reader/full/abbottabad-soed 89/150
Education
75Abbottabad State of the Environment and Development
13subsequent years, particularly at higher andtertiary levels. Private-sector enrolment for1998–99 at the primary level alone stood at17,707 in 120 schools.
s
nPRIMARY SCHOOL
During the period 1996–2000, the number ofgovernment primary schools in the districtincreased from 998 to 1,549, recording a 55.2%growth rate compared to a 38% rise for theprovince as a whole. The relative growth rate forboys’ schools, at 76.4% (compared to theprovincial 43%), was higher than for girls’schools which increased by 24.7% (comparedto 17.3% for the province). Interestingly, maleenrolment at the primary level grew only 5.5% in
the same period, while female enrolment wasdown 22.8%. This leads to the conclusion thatthe construction of additional buildings—attrac-tive ‘solutions’ politically and departmentally—isno answer to the endemic problems plaguingthe sector. More wide-ranging issues such asaccess and quality, as well as spatial andgender balance, need to be addressed.
sn
MIDDLE SCHOOLDuring 1996–99, the number of middle schoolsin the district went from 97 to 107, recording a
cumulative growth of 10.3%, compared to15.9% for the province. This number remainedunchanged during 1999–2000. The relativegrowth rate for girls’ schools, at 29% (compared
to the provincial 28.5%) was far higher than thenominal 1.5% increase recorded for boys’schools (compared to 10.5% for the province).In terms of impact, it is important to note that
female enrolment between 1996 and 1999increased by almost 20% (compared to theprovincial 22%). In contrast, enrolment formales fell 10% (compared to a 4% decline at theprovincial level), complicating the issue of build-ing additional infrastructure at this level. Thesetrends also highlight the need for more femalemiddle schools and for improving access toexisting schools.
s
nHIGH SCHOOL
The number of high schools in the district grew
from 80 to 87 during the period 1996–99,recording growth of 8.8% (compared to adecline of 10.5% for the province). Once again,the period 1999–2000 saw no increase in num-bers. Relative growth for girls’ schools, at 21.1%(compared to the provincial 15%), was farhigher than the 4.4% growth seen in the case ofboys’ schools (3.1% for the province). In termsof impact, it is important to note that inAbbottabad, female enrolment at this level rose40% (compared to 25.8% for the province),while male enrolment increased by only 14.8%
(4.9% for the province). This points to therelatively greater impact of infrastructuredevelopment at this level of education, and high-lights the need to evaluate progress in the
FIGURE 35 EDUCATIONAL INSTITUTIONS, ABBOTTABAD (1999√2000)
1,600
1,400
1,200
1,000
800
600
400
200
0
s Total s Male s Female
N u m
b e r o f
i n s t i t u t i o n s
Source: GoNWFP 1999.
1,549
1,039
510
107 67 4087 64
23 11 7 4 1 1 0 6 4 2 2 14
347
Primary Midddle High Higher Intermediate Government Postgraduate Maktab Mosqueschool school school secondary school college degree college college school school

8/9/2019 Abbottabad Soed
http://slidepdf.com/reader/full/abbottabad-soed 90/150
Education
76 Abbottabad State of the Environment and Development
13sector from the point of view of levels of educa-tion, as opposed to looking at the sector as awhole. The need to increase the number of girls’schools is an evident corollary of the preceding
analysis, and is supported by the statistics forfemale participation rates below.
snHIGHER SECONDARY SCHOOLThe number of higher secondary schools in theperiod 1996–99 grew by 38%, with three newschools added in 1998–99 (two for boys andone for girls). Male enrolment at this level fell10.4%, however, while female enrolmentincreased just 1%, evenwith the addion of moreschools. No new higher
secondary schools werebuilt during 1999–2000.
snINTERMEDIATECOLLEGEOnly one intermediatecollege for men exists inthe district. Overall enrol-ment at this level fell by26% (23% male and 30%female) in the period1996–99, compared to a
more modest decline of13.5% for the province(14% male and 1%female). In the context ofhigher education, reten-tion remains a centralconcern.
snDEGREE COLLEGEIn the period 1997–2000,the number ofgovernment degree col-
leges in the district grew by 50% (compared to8% for the province), with the addition of twonew colleges for men. Enrolment in the period1996–99 nevertheless fell 15% (male 15% andfemale 15%). As in the case of higher secondaryand intermediate schools, this explicitly identi-fies post-middle level education, particularly forwomen and in rural areas, as a problematicissue that needs to be addressed through amulti-pronged approach involving key stake-
holders, particularly parents. Long-term solu-tions are required that are not dependent solelyon service delivery through the public sector.
s
nPOSTGRADUATE STUDIESTwo colleges in the district offer postgraduate
courses, with a combined enrolment of 3,372students.
snPRIVATE SECTOR In addition to the public sector, an estimated120 privately-run primary schools were operat-ing in 1999, with a total enrolment of 17,707
(roughly 17% of overall enrolment at the pri-mary level), consisting of 63% male and 27%female students.
Besides government and private institutions,maktabs and mosque schools also operate inthe district. Their numbers fell from 532 to 378between 1996 and 1999, with most of the declineaccounted for by a 30% fall in the number ofmosque schools. As a consequence, enrolment
Responsibility for education can no longer be borne entirely by the public sector, nor can improvementsbe brought about solely by means of resource allocation.
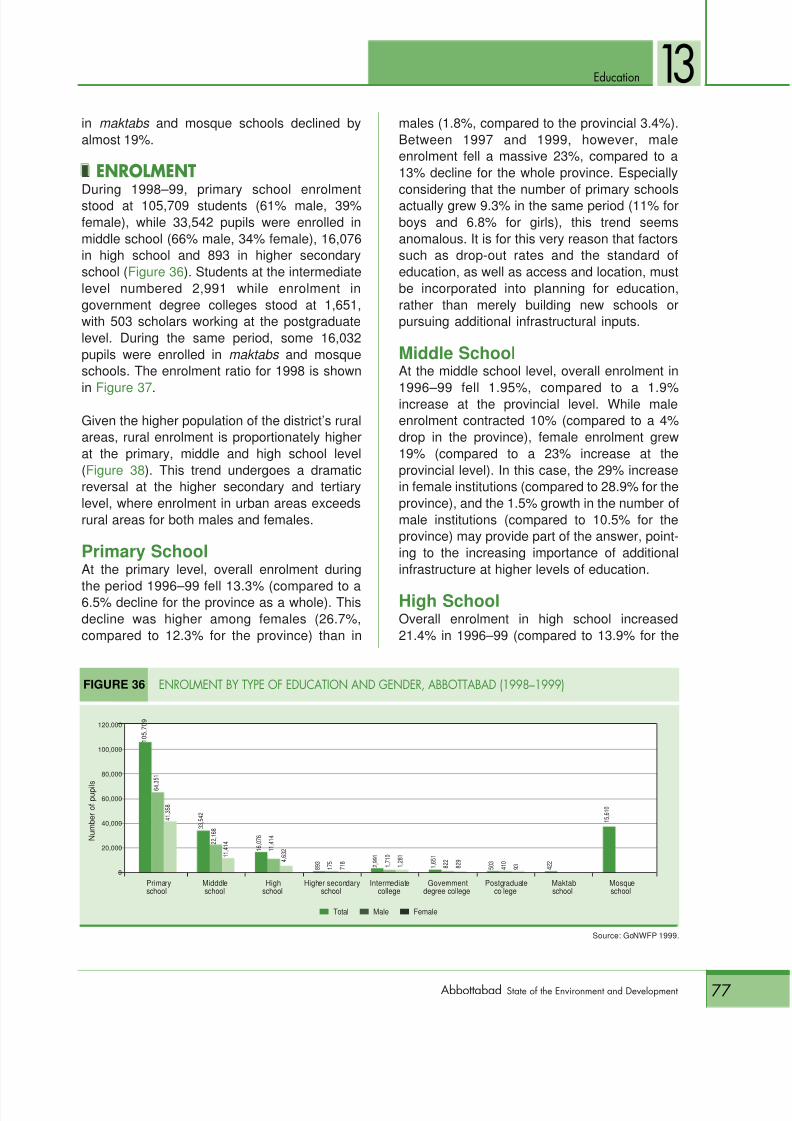
8/9/2019 Abbottabad Soed
http://slidepdf.com/reader/full/abbottabad-soed 91/150
Education
77Abbottabad State of the Environment and Development
13in maktabs and mosque schools declined byalmost 19%.
s
nENROLMENT
During 1998–99, primary school enrolmentstood at 105,709 students (61% male, 39%female), while 33,542 pupils were enrolled inmiddle school (66% male, 34% female), 16,076in high school and 893 in higher secondaryschool ( Figure 36 ). Students at the intermediatelevel numbered 2,991 while enrolment ingovernment degree colleges stood at 1,651,with 503 scholars working at the postgraduatelevel. During the same period, some 16,032pupils were enrolled in maktabs and mosqueschools. The enrolment ratio for 1998 is shown
in Figure 37 .
Given the higher population of the district’s ruralareas, rural enrolment is proportionately higherat the primary, middle and high school level(Figure 38 ). This trend undergoes a dramaticreversal at the higher secondary and tertiarylevel, where enrolment in urban areas exceedsrural areas for both males and females.
Primary SchoolAt the primary level, overall enrolment during
the period 1996–99 fell 13.3% (compared to a6.5% decline for the province as a whole). Thisdecline was higher among females (26.7%,compared to 12.3% for the province) than in
males (1.8%, compared to the provincial 3.4%).Between 1997 and 1999, however, maleenrolment fell a massive 23%, compared to a13% decline for the whole province. Especially
considering that the number of primary schoolsactually grew 9.3% in the same period (11% forboys and 6.8% for girls), this trend seemsanomalous. It is for this very reason that factorssuch as drop-out rates and the standard ofeducation, as well as access and location, mustbe incorporated into planning for education,rather than merely building new schools orpursuing additional infrastructural inputs.
Middle SchoolAt the middle school level, overall enrolment in
1996–99 fell 1.95%, compared to a 1.9%increase at the provincial level. While maleenrolment contracted 10% (compared to a 4%drop in the province), female enrolment grew19% (compared to a 23% increase at theprovincial level). In this case, the 29% increasein female institutions (compared to 28.9% for theprovince), and the 1.5% growth in the number ofmale institutions (compared to 10.5% for theprovince) may provide part of the answer, point-ing to the increasing importance of additionalinfrastructure at higher levels of education.
High SchoolOverall enrolment in high school increased21.4% in 1996–99 (compared to 13.9% for the
FIGURE 36 ENROLMENT BY TYPE OF EDUCATION AND GENDER, ABBOTTABAD (1998√1999)
120,000
100,000
80,000
60,000
40,000
20,000
0
s Total s Male s Female
N u m
b e r o f p u p i l s
Source: GoNWFP 1999.
6 4
, 3 5 1
4 1
, 3 5 8
3 3
, 5 4 2
2 2
, 1 6 8
1 1
, 4 1 4
1 6
, 0 7 6
1 1
, 4 1 4
4 , 6
3 2
8 9 3
1 7 5
7 1 8
2 , 9
9 1
1 , 7
1 0
1 , 2
8 1
1 , 6
5 1
8 2 2
8 2 9
5 0 3
4 1 0
9 3
4 2 2
1 5
, 6 1 0
Primary Midddle High Higher secondary Intermediate Government Postgraduate Maktab Mosqueschool school school school college degree college college school school
1 0 5 , 7 0 9

8/9/2019 Abbottabad Soed
http://slidepdf.com/reader/full/abbottabad-soed 92/150
Education
78 Abbottabad State of the Environment and Development
13province as a whole), with male enrolment up14.8% (compared to 9% for the province) andfemale enrolment showing a massive rise of40.2% (compared to a respectable 26% for the
province). Part of the explanation for this trendlies in the fact that the number of female highschools increased 21% (compared to 15% forthe province), while the number of male institu-tions grew a nominal 4.4% (compared to 3.10%at the provincial level). These statistics may wellconfirm the relative importance of additionalinfrastructure, primarily to widen access, at thislevel of education.
Higher Secondary andIntermediate School
Between 1996 and 1999, movement at thehigher secondary level was nominal,characterised by greater female participation.However, enrolment at the intermediate leveldropped 26% (compared to a 13.5% decline forthe province) with female enrolment sufferingmore heavily, falling 30% (compared to a mere1.1% decrease at the provincial level). Enrol-ment among men was also down, falling 23%compared to a 14% decline in the province. Theexistence of a single male intermediate schoolpoints to the gap at this level, where issues of
access and equity are of crucial importance.
CollegeThe problems facing higher education in thedistrict are further illustrated by enrolmenttrends in government degree colleges. Overallenrolment declined 15.1% during the period1996–99, compared to a fall of only 3.3% in theprovince as a whole. At this level, numbers fellmore or less the same among men and women,with female enrolment down 15.3% (comparedto only 0.9% in the province) and male
enrolment falling by 15% (compared to 4.3% atthe provincial level).
Overall figures for the district reveal thatenrolment between 1996 and 1999 has fallen atall levels except for high schools, and that thesituation is only partly mitigated by the improvedgender balance witnessed at the middle, highand higher secondary levels. While figures forthe district are not significantly poorer than
statistics for the province as a whole, theproblem of access at higher levels, in ruralareas and for women needs to be addressed.The relevance of the curriculum with regard tothe job market also needs to be assessed.
snPARTICIPATIONDuring 1999–2000, overall participation ratesat various levels are as follows: 79% at theprimary level (93% male and 66% female),40% at the middle level (50% male and 29%
female), 31% at high school level (41% maleand 20% female), and a mere 3.7% at thehigher secondary level ( Figure 39 ). Clearly,participation rates fall as the level of educationrises. For this reason, administrativemeasures aimed at improving higher-leveleducation need to start by examining thereality on the ground. It is only for participationat the primary and middle level thatAbbottabad outperforms the province, and
Total Male Female
FIGURE 37 ENROLMENT BY AREA AND GENDER,ABBOTTABAD (1998)
100
80
60
40
20
0
s All Areas s Rural s Urban
E n r o l m e n t
( % )
Source: GoNWFP 1999.
48.18 45.89
58.8256.02 55.27
59.06
40.11 36.7
58.49
Urban Rural
FIGURE 38 ENROLMENT BY LEVEL OF EDUCATIONAND AREA, ABBOTTABAD (1998√1999)
120
100
80
60
40
20
0
s Pimary s Middle s High s Higher Secondary
E n r o l m e n t
( % )
Source: GoNWFP 1999.
6.7
18
34.7
98 93.3
82
65.3
2
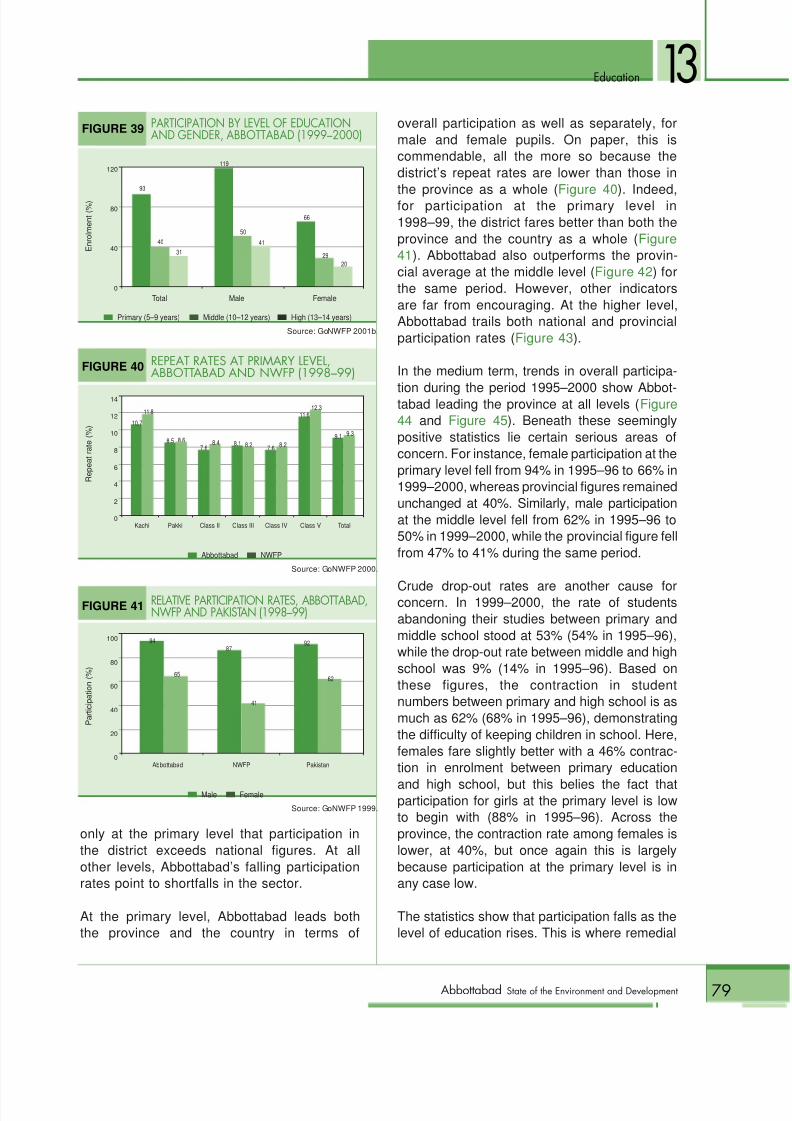
8/9/2019 Abbottabad Soed
http://slidepdf.com/reader/full/abbottabad-soed 93/150
Education
79Abbottabad State of the Environment and Development
13
only at the primary level that participation inthe district exceeds national figures. At allother levels, Abbottabad’s falling participationrates point to shortfalls in the sector.
At the primary level, Abbottabad leads boththe province and the country in terms of
overall participation as well as separately, formale and female pupils. On paper, this iscommendable, all the more so because thedistrict’s repeat rates are lower than those in
the province as a whole ( Figure 40 ). Indeed,for participation at the primary level in1998–99, the district fares better than both theprovince and the country as a whole ( Figure41 ). Abbottabad also outperforms the provin-cial average at the middle level ( Figure 42 ) forthe same period. However, other indicatorsare far from encouraging. At the higher level,Abbottabad trails both national and provincialparticipation rates ( Figure 43 ).
In the medium term, trends in overall participa-
tion during the period 1995–2000 show Abbot-tabad leading the province at all levels ( Figure44 and Figure 45 ). Beneath these seeminglypositive statistics lie certain serious areas ofconcern. For instance, female participation at theprimary level fell from 94% in 1995–96 to 66% in1999–2000, whereas provincial figures remainedunchanged at 40%. Similarly, male participationat the middle level fell from 62% in 1995–96 to50% in 1999–2000, while the provincial figure fellfrom 47% to 41% during the same period.
Crude drop-out rates are another cause forconcern. In 1999–2000, the rate of studentsabandoning their studies between primary andmiddle school stood at 53% (54% in 1995–96),while the drop-out rate between middle and highschool was 9% (14% in 1995–96). Based onthese figures, the contraction in studentnumbers between primary and high school is asmuch as 62% (68% in 1995–96), demonstratingthe difficulty of keeping children in school. Here,females fare slightly better with a 46% contrac-tion in enrolment between primary education
and high school, but this belies the fact thatparticipation for girls at the primary level is lowto begin with (88% in 1995–96). Across theprovince, the contraction rate among females islower, at 40%, but once again this is largelybecause participation at the primary level is inany case low.
The statistics show that participation falls as thelevel of education rises. This is where remedial
Total Male Female
FIGURE 39 PARTICIPATION BY LEVEL OF EDUCATIONAND GENDER, ABBOTTABAD (1999√2000)
120
80
40
0
s Primary (5–9 years) s Middle (10–12 years) s High (13–14 years)
E n r o l m e n t
( % )
Source: GoNWFP 2001b.
93
4031
119
50
41
66
2920
Kachi Pakki Class II Class III Class IV Class V Total
FIGURE 40 REPEAT RATES AT PRIMARY LEVEL,ABBOTTABAD AND NWFP (1998√99)
14
12
10
8
6
4
2
0
s Abbottabad s NWFP
R e p e a t r a t e
( % )
Source: GoNWFP 2000.
11.8
8.5 8.67.6
8.4 8.2 7.6 8.2
11.612.3
9.1 9.3
10.7
8.1
Abbottabad NWFP Pakistan
FIGURE 41 RELATIVE PARTICIPATION RATES, ABBOTTABAD,NWFP AND PAKISTAN (1998√99)
100
80
60
40
20
0
s Male s Female
P a r t i c i p a
t i o n
( % )
Source: GoNWFP 1999.
65
87
41
92
62
94
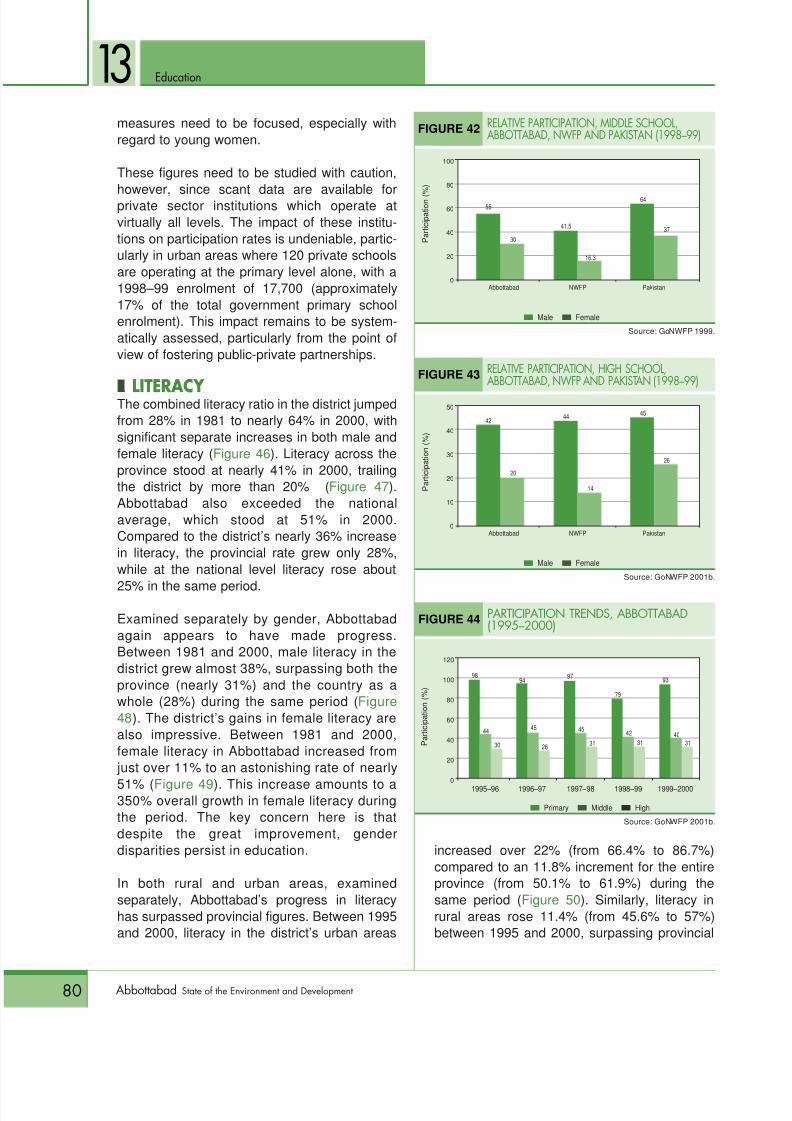
8/9/2019 Abbottabad Soed
http://slidepdf.com/reader/full/abbottabad-soed 94/150
Education
80 Abbottabad State of the Environment and Development
13measures need to be focused, especially withregard to young women.
These figures need to be studied with caution,
however, since scant data are available forprivate sector institutions which operate atvirtually all levels. The impact of these institu-tions on participation rates is undeniable, partic-ularly in urban areas where 120 private schoolsare operating at the primary level alone, with a1998–99 enrolment of 17,700 (approximately17% of the total government primary schoolenrolment). This impact remains to be system-atically assessed, particularly from the point ofview of fostering public-private partnerships.
s
nLITERACY The combined literacy ratio in the district jumped
from 28% in 1981 to nearly 64% in 2000, withsignificant separate increases in both male andfemale literacy ( Figure 46 ). Literacy across theprovince stood at nearly 41% in 2000, trailingthe district by more than 20% ( Figure 47 ).Abbottabad also exceeded the nationalaverage, which stood at 51% in 2000.Compared to the district’s nearly 36% increasein literacy, the provincial rate grew only 28%,while at the national level literacy rose about
25% in the same period.
Examined separately by gender, Abbottabadagain appears to have made progress.Between 1981 and 2000, male literacy in thedistrict grew almost 38%, surpassing both theprovince (nearly 31%) and the country as awhole (28%) during the same period ( Figure48 ). The district’s gains in female literacy arealso impressive. Between 1981 and 2000,female literacy in Abbottabad increased from
just over 11% to an astonishing rate of nearly
51% ( Figure 49 ). This increase amounts to a350% overall growth in female literacy duringthe period. The key concern here is thatdespite the great improvement, genderdisparities persist in education.
In both rural and urban areas, examinedseparately, Abbottabad’s progress in literacyhas surpassed provincial figures. Between 1995and 2000, literacy in the district’s urban areas
increased over 22% (from 66.4% to 86.7%)compared to an 11.8% increment for the entireprovince (from 50.1% to 61.9%) during thesame period ( Figure 50 ). Similarly, literacy inrural areas rose 11.4% (from 45.6% to 57%)between 1995 and 2000, surpassing provincial
1995–96 1996–97 1997–98 1998–99 1999–2000
FIGURE 44 PARTICIPATION TRENDS, ABBOTTABAD(1995√2000)
120
100
80
60
40
20
0
s Primary s Middle s High
P a r t i c i p a t i o n
( % )
Source: GoNWFP 2001b.
98
44
30
94
45
28
97
45
31
79
4231
93
4031
Abbottabad NWFP Pakistan
FIGURE 42 RELATIVE PARTICIPATION, MIDDLE SCHOOL,ABBOTTABAD, NWFP AND PAKISTAN (1998√99)
100
80
60
40
20
0
s Male s Female
P a r t i c i p a
t i o n (
% )
Source: GoNWFP 1999.
30
41.5
16.3
64
37
55
Abbottabad NWFP Pakistan
FIGURE 43 RELATIVE PARTICIPATION, HIGH SCHOOL,ABBOTTABAD, NWFP AND PAKISTAN (1998√99)
50
40
30
20
10
0
s Male s Female
P a r t i c i p a t i o n
( % )
Source: GoNWFP 2001b.
20
44
14
45
26
42
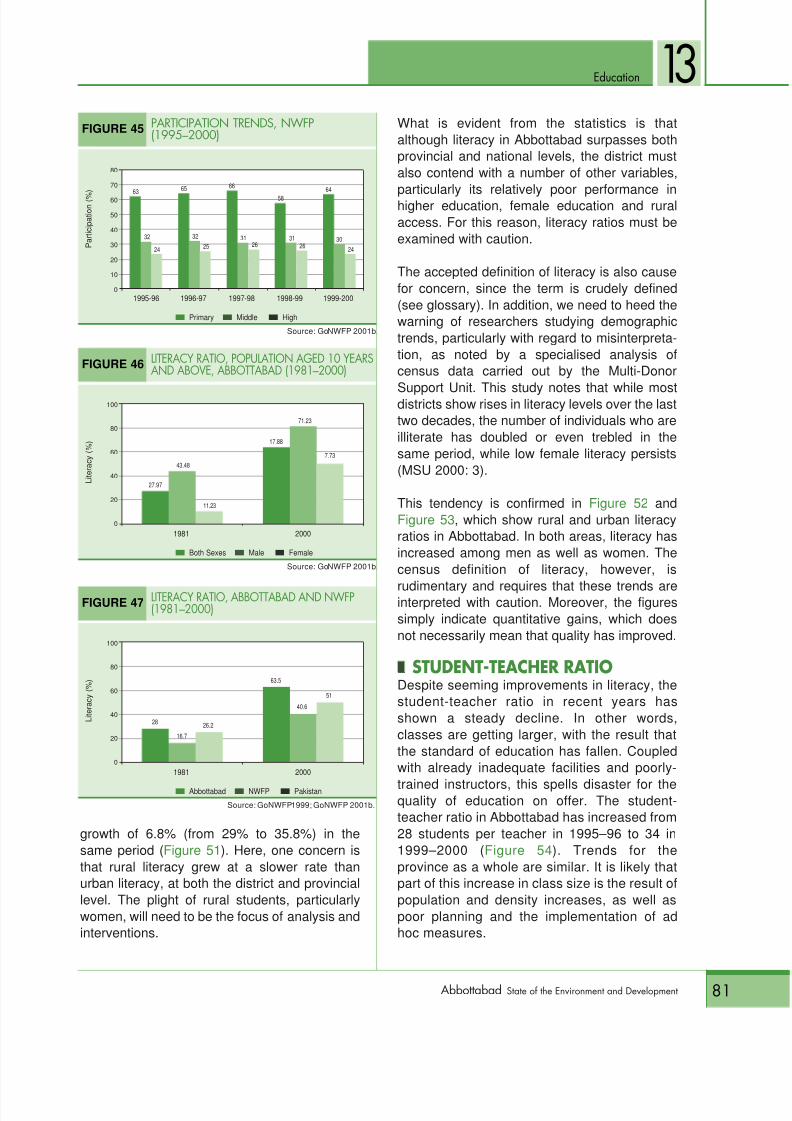
8/9/2019 Abbottabad Soed
http://slidepdf.com/reader/full/abbottabad-soed 95/150
Education
81Abbottabad State of the Environment and Development
13
growth of 6.8% (from 29% to 35.8%) in thesame period ( Figure 51 ). Here, one concern isthat rural literacy grew at a slower rate thanurban literacy, at both the district and provinciallevel. The plight of rural students, particularlywomen, will need to be the focus of analysis andinterventions.
What is evident from the statistics is thatalthough literacy in Abbottabad surpasses bothprovincial and national levels, the district mustalso contend with a number of other variables,
particularly its relatively poor performance inhigher education, female education and ruralaccess. For this reason, literacy ratios must beexamined with caution.
The accepted definition of literacy is also causefor concern, since the term is crudely defined(see glossary). In addition, we need to heed thewarning of researchers studying demographictrends, particularly with regard to misinterpreta-tion, as noted by a specialised analysis ofcensus data carried out by the Multi-Donor
Support Unit. This study notes that while mostdistricts show rises in literacy levels over the lasttwo decades, the number of individuals who areilliterate has doubled or even trebled in thesame period, while low female literacy persists(MSU 2000: 3).
This tendency is confirmed in Figure 52 andFigure 53 , which show rural and urban literacyratios in Abbottabad. In both areas, literacy hasincreased among men as well as women. Thecensus definition of literacy, however, is
rudimentary and requires that these trends areinterpreted with caution. Moreover, the figuressimply indicate quantitative gains, which doesnot necessarily mean that quality has improved.
snSTUDENT-TEACHER RATIODespite seeming improvements in literacy, thestudent-teacher ratio in recent years hasshown a steady decline. In other words,classes are getting larger, with the result thatthe standard of education has fallen. Coupledwith already inadequate facilities and poorly-
trained instructors, this spells disaster for thequality of education on offer. The student-teacher ratio in Abbottabad has increased from28 students per teacher in 1995–96 to 34 in1999–2000 ( Figure 54 ). Trends for theprovince as a whole are similar. It is likely thatpart of this increase in class size is the result ofpopulation and density increases, as well aspoor planning and the implementation of adhoc measures.
1995-96 1996-97 1997-98 1998-99 1999-200
FIGURE 45 PARTICIPATION TRENDS, NWFP(1995√2000)
80
70
60
50
40
30
20
10
0
s Primary s Middle s High
P a r t i c i p a
t i o n
( % )
Source: GoNWFP 2001b.
63
32
24
65
3225
66
3126
5864
3024
3126
1981 2000
FIGURE 46 LITERACY RATIO, POPULATION AGED 10 YEARSAND ABOVE, ABBOTTABAD (1981√2000)
100
80
60
40
20
0
s Both Sexes s Male s Female
L i t e r a c y
( % )
Source: GoNWFP 2001b.
27.97
43.48
11.23
17.88
7.73
71.23
1981 2000
FIGURE 47 LITERACY RATIO, ABBOTTABAD AND NWFP(1981√2000)
100
80
60
40
20
0
s Abbottabad s NWFP s Pakistan
L i t e r a c y ( % )
Source: GoNWFP1999; GoNWFP 2001b.
28
16.7
26.2
63.5
51
40.6
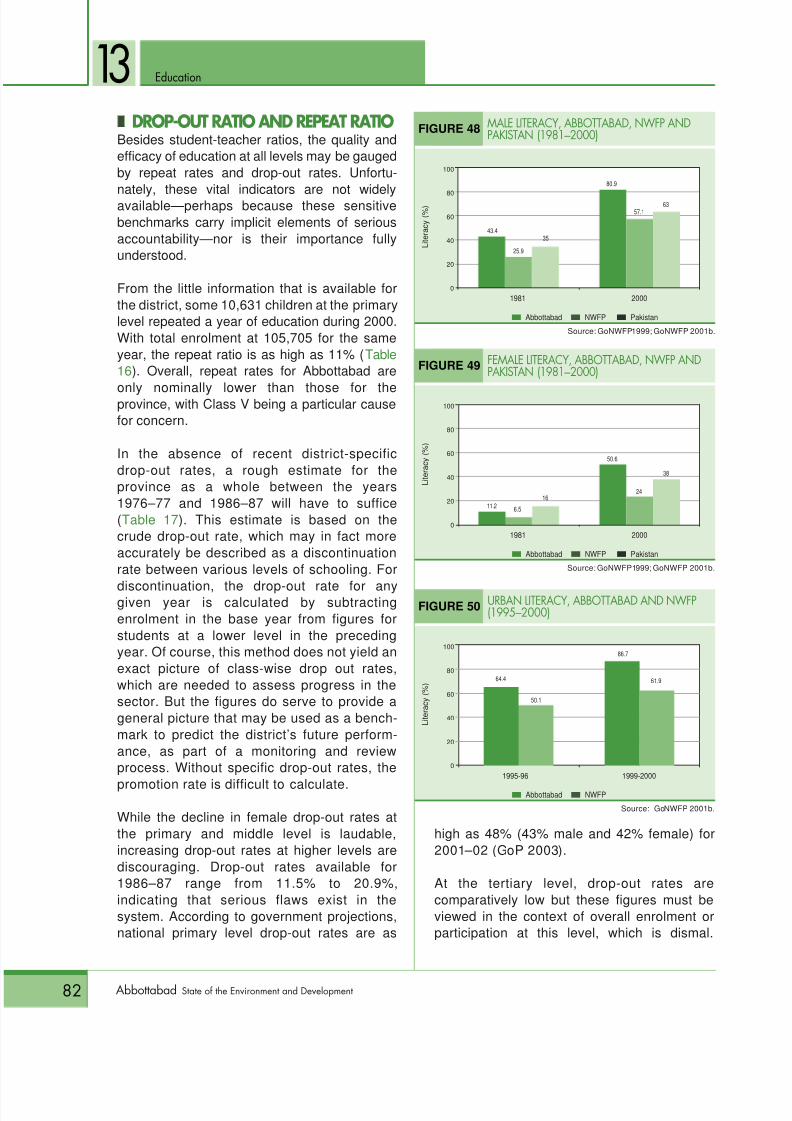
8/9/2019 Abbottabad Soed
http://slidepdf.com/reader/full/abbottabad-soed 96/150
Education
82 Abbottabad State of the Environment and Development
13snDROP-OUT RATIO AND REPEAT RATIOBesides student-teacher ratios, the quality andefficacy of education at all levels may be gaugedby repeat rates and drop-out rates. Unfortu-
nately, these vital indicators are not widelyavailable—perhaps because these sensitivebenchmarks carry implicit elements of seriousaccountability—nor is their importance fullyunderstood.
From the little information that is available forthe district, some 10,631 children at the primarylevel repeated a year of education during 2000.With total enrolment at 105,705 for the sameyear, the repeat ratio is as high as 11% ( Table16 ). Overall, repeat rates for Abbottabad are
only nominally lower than those for theprovince, with Class V being a particular causefor concern.
In the absence of recent district-specificdrop-out rates, a rough estimate for theprovince as a whole between the years1976–77 and 1986–87 will have to suffice(Table 17 ). This estimate is based on thecrude drop-out rate, which may in fact moreaccurately be described as a discontinuationrate between various levels of schooling. For
discontinuation, the drop-out rate for anygiven year is calculated by subtractingenrolment in the base year from figures forstudents at a lower level in the precedingyear. Of course, this method does not yield anexact picture of class-wise drop out rates,which are needed to assess progress in thesector. But the figures do serve to provide ageneral picture that may be used as a bench-mark to predict the district’s future perform-ance, as part of a monitoring and reviewprocess. Without specific drop-out rates, the
promotion rate is difficult to calculate.
While the decline in female drop-out rates atthe primary and middle level is laudable,increasing drop-out rates at higher levels arediscouraging. Drop-out rates available for1986–87 range from 11.5% to 20.9%,indicating that serious flaws exist in thesystem. According to government projections,national primary level drop-out rates are as
high as 48% (43% male and 42% female) for2001–02 (GoP 2003).
At the tertiary level, drop-out rates arecomparatively low but these figures must beviewed in the context of overall enrolment orparticipation at this level, which is dismal.
1981 2000
FIGURE 48 MALE LITERACY, ABBOTTABAD, NWFP ANDPAKISTAN (1981√2000)
100
80
60
40
20
0
s Abbottabad s NWFP s Pakistan
L i t e r a c y ( % )
Source: GoNWFP1999; GoNWFP 2001b.
43.4
25.9
35
80.9
6357.1
1981 2000
FIGURE 49 FEMALE LITERACY, ABBOTTABAD, NWFP ANDPAKISTAN (1981√2000)
100
80
60
40
20
0
s Abbottabad s NWFP s Pakistan
L i t e r a c y
( % )
Source: GoNWFP1999; GoNWFP 2001b.
11.2 6.5
16
50.6
38
24
1995-96 1999-2000
FIGURE 50 URBAN LITERACY, ABBOTTABAD AND NWFP(1995√2000)
100
80
60
40
20
0
s Abbottabad s NWFP
L i t e r a c y
( % )
Source: GoNWFP 2001b.
64.4
50.1
86.7
61.9
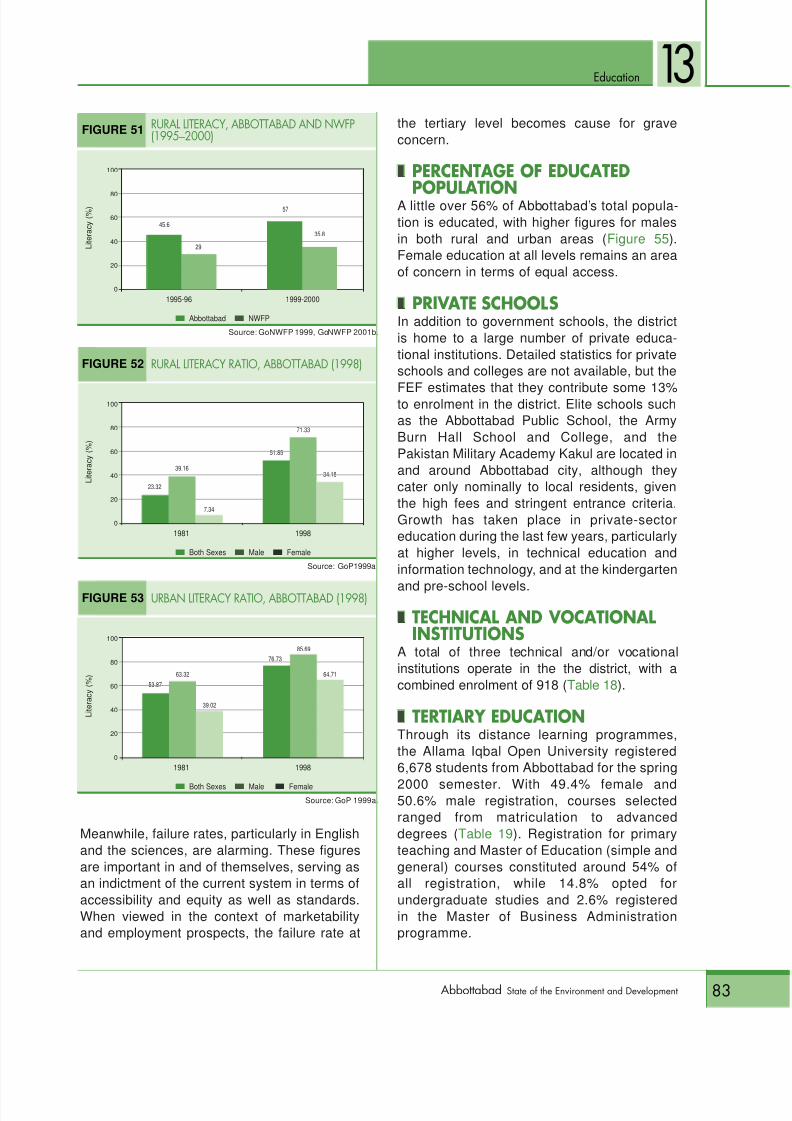
8/9/2019 Abbottabad Soed
http://slidepdf.com/reader/full/abbottabad-soed 97/150
Education
83Abbottabad State of the Environment and Development
13
Meanwhile, failure rates, particularly in Englishand the sciences, are alarming. These figuresare important in and of themselves, serving asan indictment of the current system in terms ofaccessibility and equity as well as standards.When viewed in the context of marketabilityand employment prospects, the failure rate at
the tertiary level becomes cause for graveconcern.
s
nPERCENTAGE OF EDUCATED
POPULATIONA little over 56% of Abbottabad’s total popula-tion is educated, with higher figures for malesin both rural and urban areas ( Figure 55 ).Female education at all levels remains an areaof concern in terms of equal access.
snPRIVATE SCHOOLSIn addition to government schools, the districtis home to a large number of private educa-tional institutions. Detailed statistics for privateschools and colleges are not available, but the
FEF estimates that they contribute some 13%to enrolment in the district. Elite schools suchas the Abbottabad Public School, the ArmyBurn Hall School and College, and thePakistan Military Academy Kakul are located inand around Abbottabad city, although theycater only nominally to local residents, giventhe high fees and stringent entrance criteria.Growth has taken place in private-sectoreducation during the last few years, particularlyat higher levels, in technical education andinformation technology, and at the kindergarten
and pre-school levels.snTECHNICAL AND VOCATIONAL
INSTITUTIONSA total of three technical and/or vocationalinstitutions operate in the the district, with acombined enrolment of 918 ( Table 18 ).
snTERTIARY EDUCATIONThrough its distance learning programmes,the Allama Iqbal Open University registered6,678 students from Abbottabad for the spring
2000 semester. With 49.4% female and50.6% male registration, courses selectedranged from matriculation to advanceddegrees ( Table 19 ). Registration for primaryteaching and Master of Education (simple andgeneral) courses constituted around 54% ofall registration, while 14.8% opted forundergraduate studies and 2.6% registeredin the Master of Business Administrationprogramme.
1995-96 1999-2000
FIGURE 51 RURAL LITERACY, ABBOTTABAD AND NWFP(1995√2000)
100
80
60
40
20
0
s Abbottabad s NWFP
L i t e r a c y
( % )
Source: GoNWFP 1999, GoNWFP 2001b.
45.6
29
57
35.8
1981 1998
FIGURE 52 RURAL LITERACY RATIO, ABBOTTABAD (1998)
100
80
60
40
20
0
s Both Sexes s Male s Female
L i t e r a c y
( % )
Source: GoP1999a.
23.32
39.16
7.34
51.85
34.18
71.33
1981 1998
FIGURE 53 URBAN LITERACY RATIO, ABBOTTABAD (1998)
100
80
60
40
20
0
s Both Sexes s Male s Female
L i t e r a c y ( % )
Source: GoP 1999a.
53.8763.32
39.02
76.73
64.71
85.69
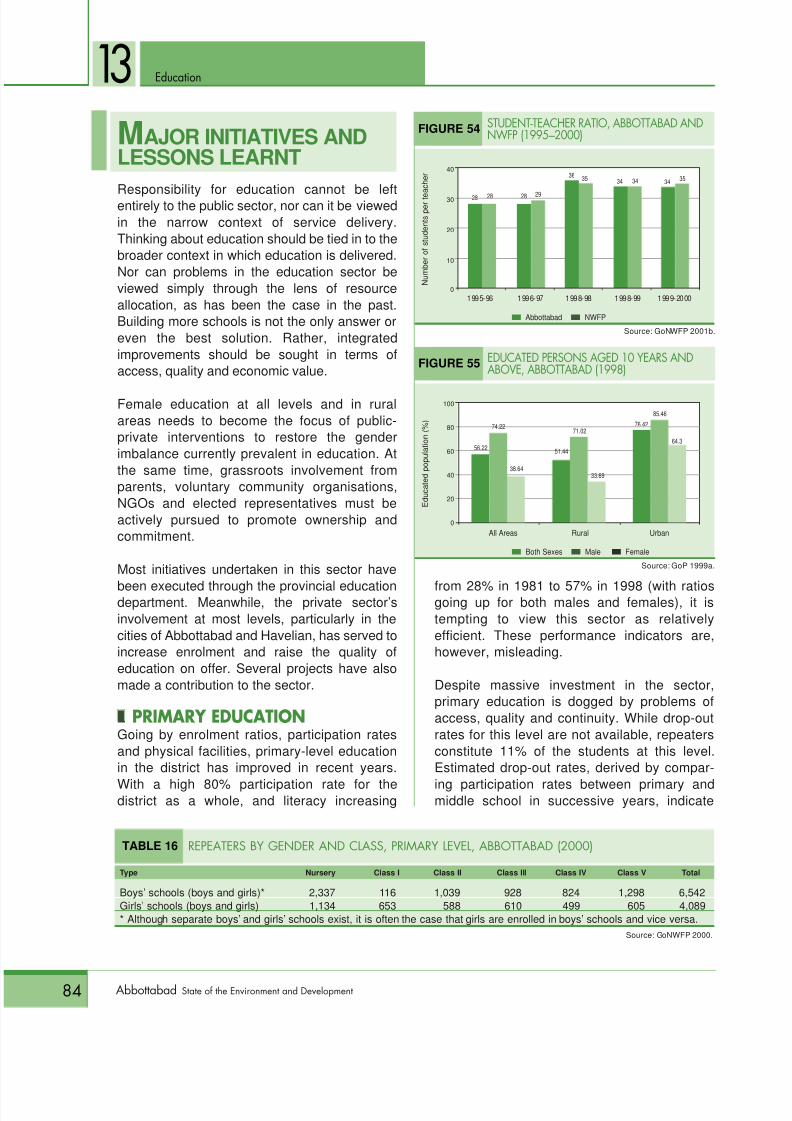
8/9/2019 Abbottabad Soed
http://slidepdf.com/reader/full/abbottabad-soed 98/150
Education
84 Abbottabad State of the Environment and Development
13MAJOR INITIATIVES ANDLESSONS LEARNT
Responsibility for education cannot be leftentirely to the public sector, nor can it be viewedin the narrow context of service delivery.Thinking about education should be tied in to thebroader context in which education is delivered.Nor can problems in the education sector beviewed simply through the lens of resourceallocation, as has been the case in the past.Building more schools is not the only answer oreven the best solution. Rather, integratedimprovements should be sought in terms ofaccess, quality and economic value.
Female education at all levels and in ruralareas needs to become the focus of public-private interventions to restore the genderimbalance currently prevalent in education. Atthe same time, grassroots involvement fromparents, voluntary community organisations,NGOs and elected representatives must beactively pursued to promote ownership andcommitment.
Most initiatives undertaken in this sector have
been executed through the provincial educationdepartment. Meanwhile, the private sector’sinvolvement at most levels, particularly in thecities of Abbottabad and Havelian, has served toincrease enrolment and raise the quality ofeducation on offer. Several projects have alsomade a contribution to the sector.
snPRIMARY EDUCATIONGoing by enrolment ratios, participation ratesand physical facilities, primary-level educationin the district has improved in recent years.
With a high 80% participation rate for thedistrict as a whole, and literacy increasing
from 28% in 1981 to 57% in 1998 (with ratiosgoing up for both males and females), it istempting to view this sector as relativelyefficient. These performance indicators are,however, misleading.
Despite massive investment in the sector,primary education is dogged by problems ofaccess, quality and continuity. While drop-outrates for this level are not available, repeatersconstitute 11% of the students at this level.Estimated drop-out rates, derived by compar-
ing participation rates between primary andmiddle school in successive years, indicate
1995-96 1996-97 1998-98 1998-99 1999-2000
FIGURE 54 STUDENT-TEACHER RATIO, ABBOTTABAD ANDNWFP (1995√2000)
40
30
20
10
0
s Abbottabad s NWFP
N u m
b e r o f s t u d e n t s p e r t e a c h e r
Source: GoNWFP 2001b.
28 28 28 29
3634 34 35
All Areas Rural Urban
FIGURE 55 EDUCATED PERSONS AGED 10 YEARS ANDABOVE, ABBOTTABAD (1998)
100
80
60
40
20
0
s Both Sexes s Male s Female
E d u c a t e d p o p u l a
t i o n
( % )
Source: GoP 1999a.
56.22
38.64
76.42
85.46
3435
74.22
51.44
71.02
33.69
64.3
TABLE 16 REPEATERS BY GENDER AND CLASS, PRIMARY LEVEL, ABBOTTABAD (2000)
Type Nursery Class I Class II Class III Class IV Class V Total
Boys’ schools (boys and girls)* 2,337 116 1,039 928 824 1,298 6,542Girls’ schools (boys and girls) 1,134 653 588 610 499 605 4,089* Although separate boys’ and girls’ schools exist, it is often the case that girls are enrolled in boys’ schools and vice versa.
Source: GoNWFP 2000.
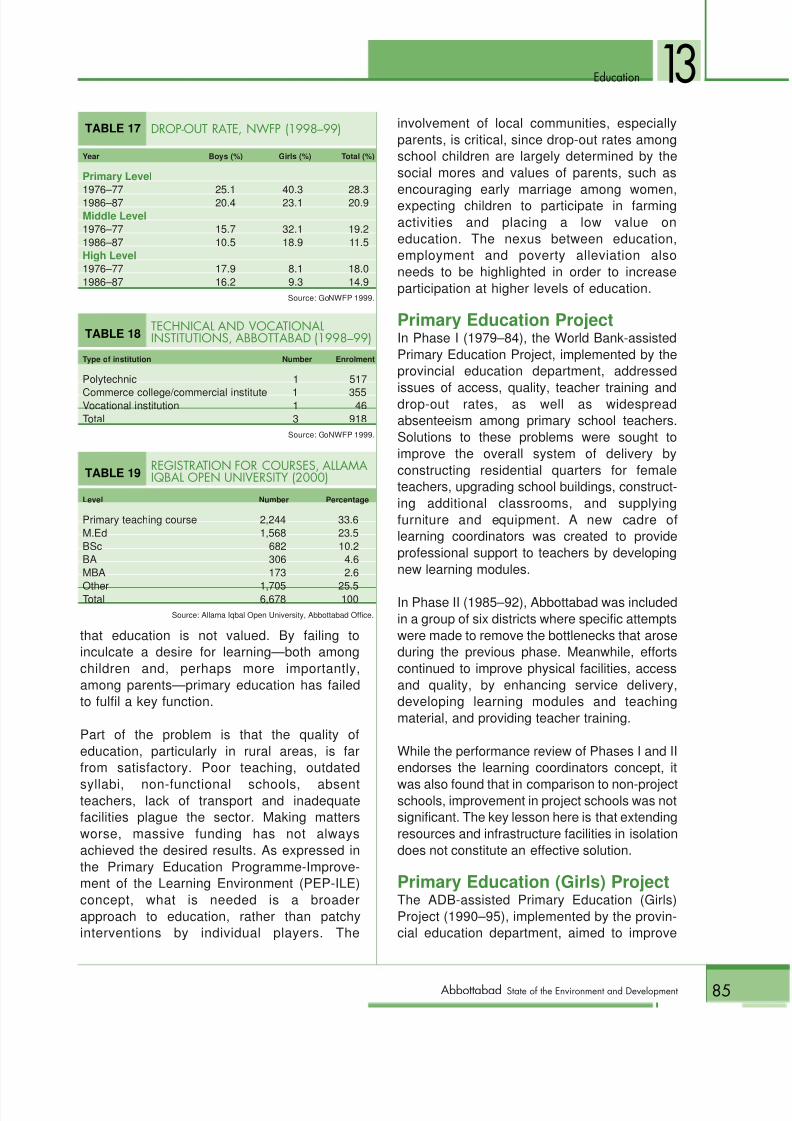
8/9/2019 Abbottabad Soed
http://slidepdf.com/reader/full/abbottabad-soed 99/150
Education
85Abbottabad State of the Environment and Development
13
that education is not valued. By failing toinculcate a desire for learning—both amongchildren and, perhaps more importantly,among parents—primary education has failedto fulfil a key function.
Part of the problem is that the quality ofeducation, particularly in rural areas, is farfrom satisfactory. Poor teaching, outdated
syllabi, non-functional schools, absentteachers, lack of transport and inadequatefacilities plague the sector. Making mattersworse, massive funding has not alwaysachieved the desired results. As expressed inthe Primary Education Programme-Improve-ment of the Learning Environment (PEP-ILE)concept, what is needed is a broaderapproach to education, rather than patchyinterventions by individual players. The
involvement of local communities, especiallyparents, is critical, since drop-out rates amongschool children are largely determined by thesocial mores and values of parents, such as
encouraging early marriage among women,expecting children to participate in farmingactivities and placing a low value oneducation. The nexus between education,employment and poverty alleviation alsoneeds to be highlighted in order to increaseparticipation at higher levels of education.
Primary Education ProjectIn Phase I (1979–84), the World Bank-assistedPrimary Education Project, implemented by theprovincial education department, addressed
issues of access, quality, teacher training anddrop-out rates, as well as widespreadabsenteeism among primary school teachers.Solutions to these problems were sought toimprove the overall system of delivery byconstructing residential quarters for femaleteachers, upgrading school buildings, construct-ing additional classrooms, and supplyingfurniture and equipment. A new cadre oflearning coordinators was created to provideprofessional support to teachers by developingnew learning modules.
In Phase II (1985–92), Abbottabad was includedin a group of six districts where specific attemptswere made to remove the bottlenecks that aroseduring the previous phase. Meanwhile, effortscontinued to improve physical facilities, accessand quality, by enhancing service delivery,developing learning modules and teachingmaterial, and providing teacher training.
While the performance review of Phases I and IIendorses the learning coordinators concept, it
was also found that in comparison to non-projectschools, improvement in project schools was notsignificant. The key lesson here is that extendingresources and infrastructure facilities in isolationdoes not constitute an effective solution.
Primary Education (Girls) ProjectThe ADB-assisted Primary Education (Girls)Project (1990–95), implemented by the provin-cial education department, aimed to improve
TABLE 17 DROP-OUT RATE, NWFP (1998√99)
Year Boys (%) Girls (%) Total (%)
Primary Level1976–77 25.1 40.3 28.31986–87 20.4 23.1 20.9Middle Level1976–77 15.7 32.1 19.21986–87 10.5 18.9 11.5High Level1976–77 17.9 8.1 18.01986–87 16.2 9.3 14.9
Source: GoNWFP 1999.
TABLE 18 TECHNICAL AND VOCATIONALINSTITUTIONS, ABBOTTABAD (1998√99)
Type of institution Number Enrolment
Polytechnic 1 517
Commerce college/commercial institute 1 355Vocational institution 1 46Total 3 918
Source: GoNWFP 1999.
TABLE 19 REGISTRATION FOR COURSES, ALLAMAIQBAL OPEN UNIVERSITY (2000)
Level Number Percentage
Primary teaching course 2,244 33.6M.Ed 1,568 23.5BSc 682 10.2BA 306 4.6MBA 173 2.6
Other 1,705 25.5Total 6,678 100Source: Allama Iqbal Open University, Abbottabad Office.
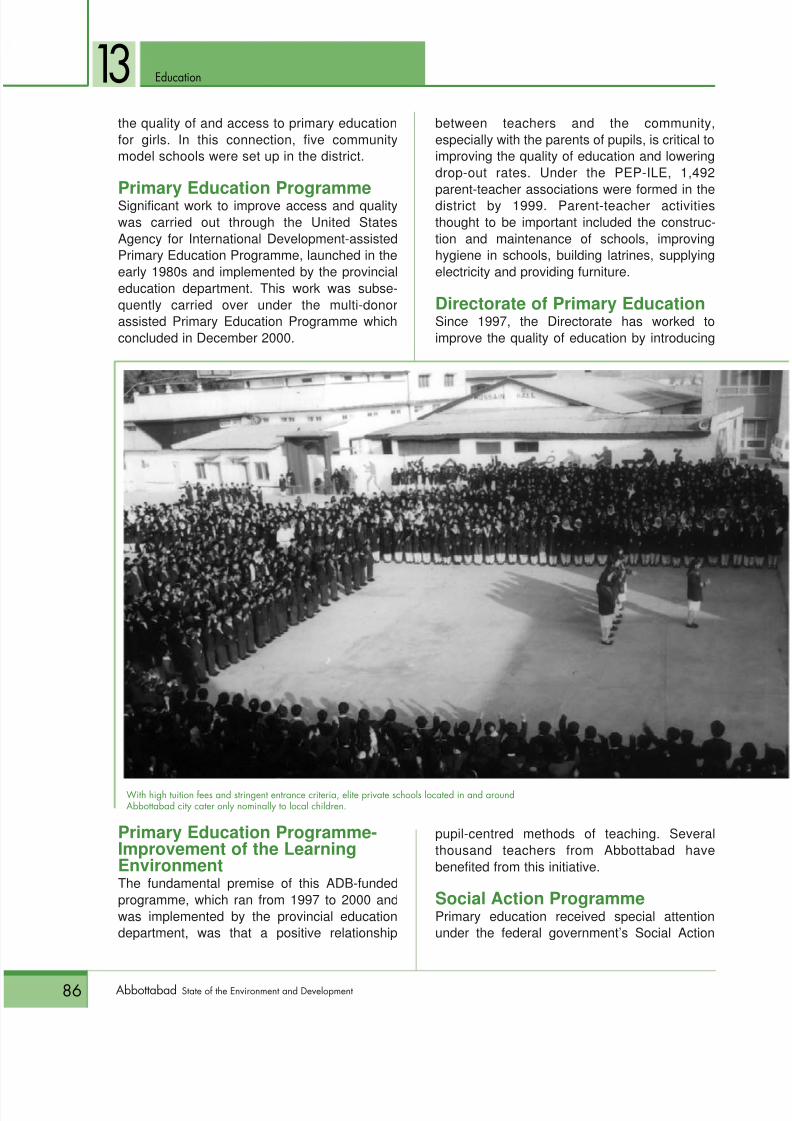
8/9/2019 Abbottabad Soed
http://slidepdf.com/reader/full/abbottabad-soed 100/150
Education
86 Abbottabad State of the Environment and Development
13the quality of and access to primary educationfor girls. In this connection, five communitymodel schools were set up in the district.
Primary Education ProgrammeSignificant work to improve access and qualitywas carried out through the United StatesAgency for International Development-assistedPrimary Education Programme, launched in theearly 1980s and implemented by the provincialeducation department. This work was subse-quently carried over under the multi-donorassisted Primary Education Programme whichconcluded in December 2000.
Primary Education Programme-Improvement of the LearningEnvironmentThe fundamental premise of this ADB-fundedprogramme, which ran from 1997 to 2000 andwas implemented by the provincial educationdepartment, was that a positive relationship
between teachers and the community,especially with the parents of pupils, is critical toimproving the quality of education and loweringdrop-out rates. Under the PEP-ILE, 1,492
parent-teacher associations were formed in thedistrict by 1999. Parent-teacher activitiesthought to be important included the construc-tion and maintenance of schools, improvinghygiene in schools, building latrines, supplyingelectricity and providing furniture.
Directorate of Primary EducationSince 1997, the Directorate has worked toimprove the quality of education by introducing
pupil-centred methods of teaching. Severalthousand teachers from Abbottabad havebenefited from this initiative.
Social Action ProgrammePrimary education received special attentionunder the federal government’s Social Action
With high tuition fees and stringent entrance criteria, elite private schools located in and aroundAbbottabad city cater only nominally to local children.
8/9/2019 Abbottabad Soed
http://slidepdf.com/reader/full/abbottabad-soed 101/150
8/9/2019 Abbottabad Soed
http://slidepdf.com/reader/full/abbottabad-soed 102/150
Education
88 Abbottabad State of the Environment and Development
13access and quality. It also provided in-servicetraining in modern teaching technologies toteachers in private schools.
Besides the formal sector, around 400 maktabs and masjid schools provide religious education.Meanwhile, technical and vocational training,albeit of low quality, is available through threeinstitutions: a polytechnic, a commerce collegeand a vocational institute. Having failed to caterto market demands, it is not surprising thatthese institutions have not made a meaningfulimpact. Technical and vocational educationneeds private-sector involvement as well asnon-governmental initiatives to provide up-to-date skills training geared towards the
employment market.
The Pakistan Literacy Commission hasestablished 11 literacy centres which areoperated by two NGOs, Naveed-e-Sahar and
Human Resource Development. Combinedenrolment in these centres is 351 students, 94%of whom are female.
While the private sector’s presence in educationis increasing, NGO involvement is conspicuousby its absence. This is all the moredisheartening since the voluntary organisationnetwork established by NGOs in rural areascould be effectively deployed to address manyof the problems that plague the educationsector. NGOs can utilise their social mobilisationstrengths to foster fruitful interaction betweenteachers, students and parents. Communityinvolvement in supervision, management andeven financing is an inescapable necessity that
has been ignored in the initiatives undertaken sofar. If properly addressed, stakeholder participa-tion can serve to bring about attitudinal andbehavioural changes with regard to therelevance and importance of education.
8/9/2019 Abbottabad Soed
http://slidepdf.com/reader/full/abbottabad-soed 103/150
89Abbottabad State of the Environment and Development
Population Welfare
The health of a population is a key developmentindicator. The World Health Organization
stresses health security as well healthaccountability. The former concept calls for equity inhealth care while the latter obligates all concerned totake into account the impact of development effortson health issues.
ON-GROUND STATUSA total of 110 public-sector medical facilities are operating in thedistrict, with a combined capacity of 1,754 beds ( Table 20 ). Although
most district statistics exclude the AMC, which is technically a projectof the federal government, it makes sense to include this facility in oursurvey because of its physical presence in the district and the fact thatit provides the local population with access to medical treatment.Besides employees of the AMC, some 476 government doctors, 264nurses and five lady health visitors were working in the district in theyear 2000. According to figures for the previous year, 109 com-pounders, 189 dais (traditional birth attendants) and 634 paramedicswere employed in Abbottabad’s public sector. The private health caresector is thriving, with 12 hospitals, eight x-ray facilities and 20
Health and
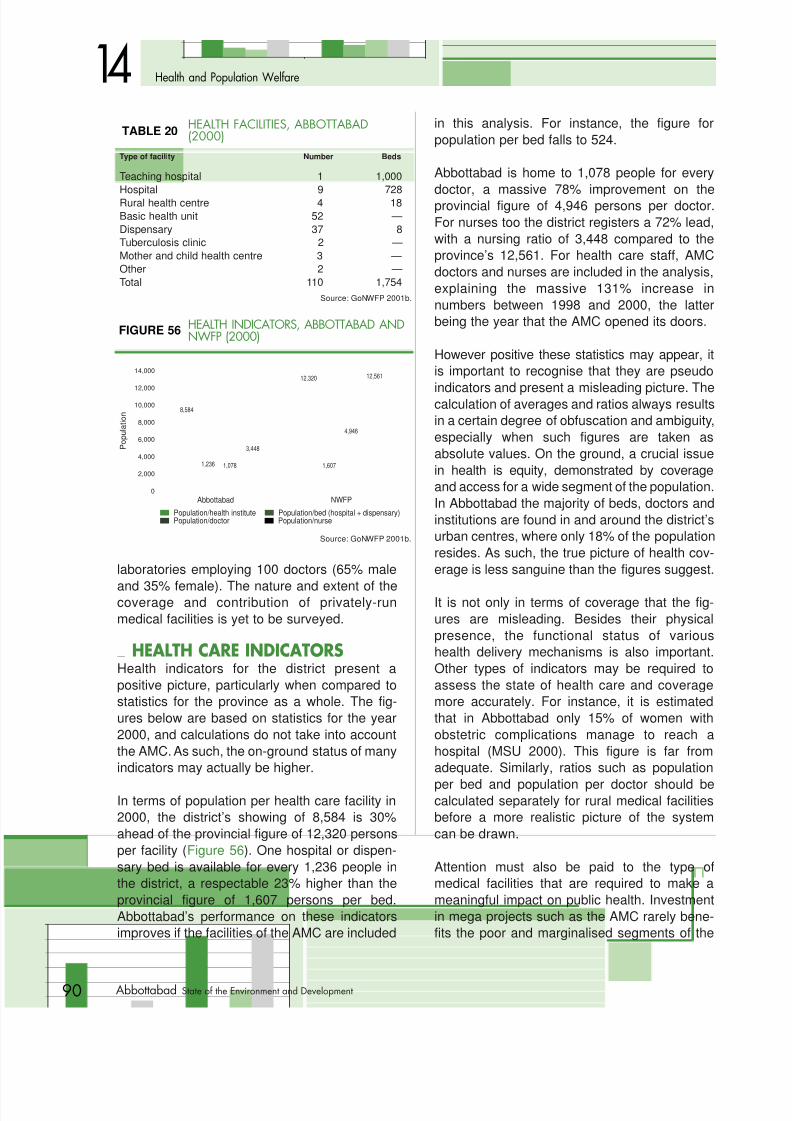
8/9/2019 Abbottabad Soed
http://slidepdf.com/reader/full/abbottabad-soed 104/150
90 Abbottabad State of the Environment and Development
14 Health and Population Welfare
laboratories employing 100 doctors (65% male
and 35% female). The nature and extent of thecoverage and contribution of privately-runmedical facilities is yet to be surveyed.
snHEALTH CARE INDICATORSHealth indicators for the district present apositive picture, particularly when compared tostatistics for the province as a whole. The fig-ures below are based on statistics for the year2000, and calculations do not take into accountthe AMC. As such, the on-ground status of manyindicators may actually be higher.
In terms of population per health care facility in2000, the district’s showing of 8,584 is 30%ahead of the provincial figure of 12,320 personsper facility ( Figure 56 ). One hospital or dispen-sary bed is available for every 1,236 people inthe district, a respectable 23% higher than theprovincial figure of 1,607 persons per bed.Abbottabad’s performance on these indicatorsimproves if the facilities of the AMC are included
in this analysis. For instance, the figure forpopulation per bed falls to 524.
Abbottabad is home to 1,078 people for every
doctor, a massive 78% improvement on theprovincial figure of 4,946 persons per doctor.For nurses too the district registers a 72% lead,with a nursing ratio of 3,448 compared to theprovince’s 12,561. For health care staff, AMCdoctors and nurses are included in the analysis,explaining the massive 131% increase innumbers between 1998 and 2000, the latterbeing the year that the AMC opened its doors.
However positive these statistics may appear, itis important to recognise that they are pseudo
indicators and present a misleading picture. Thecalculation of averages and ratios always resultsin a certain degree of obfuscation and ambiguity,especially when such figures are taken asabsolute values. On the ground, a crucial issuein health is equity, demonstrated by coverageand access for a wide segment of the population.In Abbottabad the majority of beds, doctors andinstitutions are found in and around the district’surban centres, where only 18% of the populationresides. As such, the true picture of health cov-erage is less sanguine than the figures suggest.
It is not only in terms of coverage that the fig-ures are misleading. Besides their physicalpresence, the functional status of varioushealth delivery mechanisms is also important.Other types of indicators may be required toassess the state of health care and coveragemore accurately. For instance, it is estimatedthat in Abbottabad only 15% of women withobstetric complications manage to reach ahospital (MSU 2000). This figure is far fromadequate. Similarly, ratios such as population
per bed and population per doctor should becalculated separately for rural medical facilitiesbefore a more realistic picture of the systemcan be drawn.
Attention must also be paid to the type ofmedical facilities that are required to make ameaningful impact on public health. Investmentin mega projects such as the AMC rarely bene-fits the poor and marginalised segments of the
TABLE 20 HEALTH FACILITIES, ABBOTTABAD(2000)
Type of facility Number Beds
Teaching hospital 1 1,000Hospital 9 728Rural health centre 4 18Basic health unit 52 —Dispensary 37 8Tuberculosis clinic 2 —Mother and child health centre 3 —Other 2 —Total 110 1,754
Source: GoNWFP 2001b.
8,584
1,236 1,078
3,448
12,320
1,607
4,946
12,561
Abbottabad NWFP
FIGURE 56 HEALTH INDICATORS, ABBOTTABAD ANDNWFP (2000)
14,000
12,000
10,000
8,000
6,000
4,000
2,000
0
P o p u l a
t i o n
Source: GoNWFP 2001b.
s Population/health institute s Population/bed (hospital + dispensary)s Population/doctor s Population/nurse
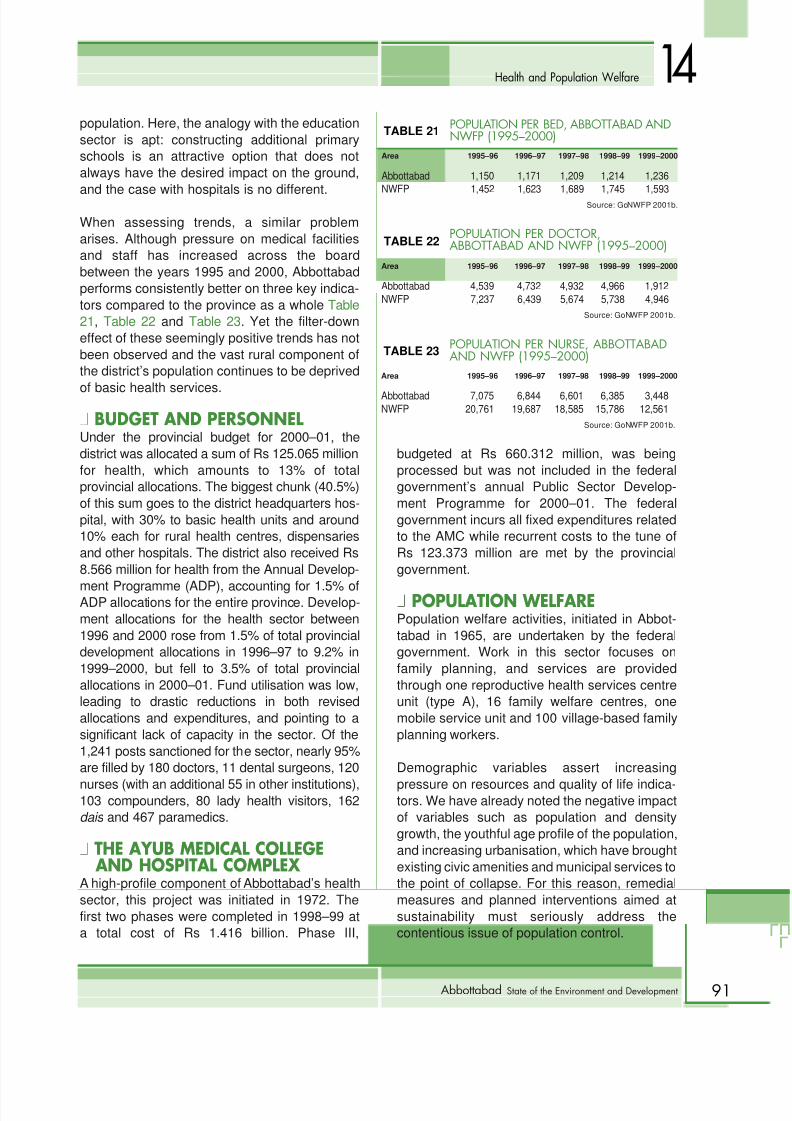
8/9/2019 Abbottabad Soed
http://slidepdf.com/reader/full/abbottabad-soed 105/150
91Abbottabad State of the Environment and Development
14Health and Population Welfare
population. Here, the analogy with the educationsector is apt: constructing additional primaryschools is an attractive option that does notalways have the desired impact on the ground,
and the case with hospitals is no different.When assessing trends, a similar problemarises. Although pressure on medical facilitiesand staff has increased across the boardbetween the years 1995 and 2000, Abbottabadperforms consistently better on three key indica-tors compared to the province as a whole Table21 , Table 22 and Table 23 . Yet the filter-downeffect of these seemingly positive trends has notbeen observed and the vast rural component ofthe district’s population continues to be deprived
of basic health services.snBUDGET AND PERSONNELUnder the provincial budget for 2000–01, thedistrict was allocated a sum of Rs 125.065 millionfor health, which amounts to 13% of totalprovincial allocations. The biggest chunk (40.5%)of this sum goes to the district headquarters hos-pital, with 30% to basic health units and around10% each for rural health centres, dispensariesand other hospitals. The district also received Rs8.566 million for health from the Annual Develop-
ment Programme (ADP), accounting for 1.5% ofADP allocations for the entire province. Develop-ment allocations for the health sector between1996 and 2000 rose from 1.5% of total provincialdevelopment allocations in 1996–97 to 9.2% in1999–2000, but fell to 3.5% of total provincialallocations in 2000–01. Fund utilisation was low,leading to drastic reductions in both revisedallocations and expenditures, and pointing to asignificant lack of capacity in the sector. Of the1,241 posts sanctioned for the sector, nearly 95%are filled by 180 doctors, 11 dental surgeons, 120
nurses (with an additional 55 in other institutions),103 compounders, 80 lady health visitors, 162dais and 467 paramedics.
snTHE AYUB MEDICAL COLLEGE AND HOSPITAL COMPLEX
A high-profile component of Abbottabad’s healthsector, this project was initiated in 1972. Thefirst two phases were completed in 1998–99 ata total cost of Rs 1.416 billion. Phase III,
budgeted at Rs 660.312 million, was beingprocessed but was not included in the federalgovernment’s annual Public Sector Develop-ment Programme for 2000–01. The federalgovernment incurs all fixed expenditures relatedto the AMC while recurrent costs to the tune ofRs 123.373 million are met by the provincialgovernment.
s
nPOPULATION WELFARE
Population welfare activities, initiated in Abbot-tabad in 1965, are undertaken by the federalgovernment. Work in this sector focuses onfamily planning, and services are providedthrough one reproductive health services centreunit (type A), 16 family welfare centres, onemobile service unit and 100 village-based familyplanning workers.
Demographic variables assert increasing
pressure on resources and quality of life indica-tors. We have already noted the negative impactof variables such as population and densitygrowth, the youthful age profile of the population,and increasing urbanisation, which have broughtexisting civic amenities and municipal services tothe point of collapse. For this reason, remedialmeasures and planned interventions aimed atsustainability must seriously address thecontentious issue of population control.
TABLE 21 POPULATION PER BED, ABBOTTABAD ANDNWFP (1995√2000)
Area 1995–96 1996–97 1997–98 1998–99 1999–2000
Abbottabad 1,150 1,171 1,209 1,214 1,236NWFP 1,452 1,623 1,689 1,745 1,593
Source: GoNWFP 2001b.
TABLE 23 POPULATION PER NURSE, ABBOTTABADAND NWFP (1995√2000)
Area 1995–96 1996–97 1997–98 1998–99 1999–2000
Abbottabad 7,075 6,844 6,601 6,385 3,448NWFP 20,761 19,687 18,585 15,786 12,561
Source: GoNWFP 2001b.
TABLE 22 POPULATION PER DOCTOR,ABBOTTABAD AND NWFP (1995√2000)
Area 1995–96 1996–97 1997–98 1998–99 1999–2000
Abbottabad 4,539 4,732 4,932 4,966 1,912NWFP 7,237 6,439 5,674 5,738 4,946
Source: GoNWFP 2001b.
8/9/2019 Abbottabad Soed
http://slidepdf.com/reader/full/abbottabad-soed 106/150
92 Abbottabad State of the Environment and Development
Health and Population Welfare
Abbottabad’s indicators for population are notparticularly gratifying. The average size ofhouseholds in the district grew from 6.2 personsin 1981 to 9.4 persons in 1998, an increase of
more than 3 persons per household, despite thefact that the average annual population growthrate declined from 2.52% in 1981 to 1.82% in1998. This increase in household size has adirect impact on the congestion ratio andproximate poverty indicators, illustrating thecross-sectoral influence of population growth.
The crude birth rate for Abbottabad is 35.61births per 1,000 population, exceeding theprovincial rate (28.5) and only nominally lowerthan the national rate (36). The district’s fertility
rate stands at 5.2 births per 1,000 women,exceeding the provincial figure (4.0) and alsomarginally ahead of the national rate (5.0). Inthis context, the national goal is to lower thepopulation rate to 2.1 births per 1,000 women bythe year 2020. If Abbottabad is to have any hopeof attaining this target, the district needs totackle the high fertility rate on an urgent footing.The importance of keeping population growth incheck extends beyond the district’s borders,because areas with fertility rates that are higherthan the national level “contribute to Pakistan’s
underdevelopment . . . and add to the popula-tion’s poverty and misery” (MSU 2000).
Across the board, the fertility rate—and there-fore overall population size—is determined toa great extent by the mean age at whichwomen are married. In Abbottabad, the meanage of marriage for women is 22.7 years,second only to Haripur (22.9 years) andfavourable in comparison with the province(21.5 years) as well as the country as a whole(22.5 years). This would explain Abbottabad’s
relatively lower population growth rates. Whilethis is a positive trend, the need to controlfertility is nonetheless important in the contextof Abbottabad because population density isincreasing all the same.
Besides the age at which women are married,the total fertility rate is determined by factorssuch as high-risk reproductive behaviour. An‘ever-married woman’ (EMW) is one whose
husband remains alive her entire life. InAbbottabad, 47% of EMW bear five or morechildren, only nominally lower than theprovincial figure of 48%. Related to this figure is
the average number of children born to mothersin various age groups. Here too Abbottabad’s4.5% of EMW is marginally lower than theprovince’s 4.9%. This indicator highlights thecross-sectoral linkages that are critical to thespirit of this strategy, because the averagenumber of children born is linked to theeducation level of mothers.
Unschooled women in Abbottabad bear anaverage of 4.7 children (5 in the province as awhole), while those who have studied below the
matriculation level bear 3.9 children (4.1 in theprovince). Among women who have studied tobelow the Bachelors level, the average dropseven further, to 3.5 (compared to 3.6 in theprovince). Women who have been educated upto and beyond the Bachelors level have by farthe fewest children, with 3.2 in Abbottabad (3.3in the province). These figures clearly indicatethe need to emphasise female education, notonly for its own sake but also to help lowerfertility levels (MSU 2000).
The number of mothers giving birth at the age of19 years or younger also affects fertility rates.Here, Abbottabad at 13.6% of EMW fares betterthan the province at 17%. Given the demographicpressures that the district already confronts, thisfigure needs to be reduced further.
Another indicator that determines fertility ratesis the percentage of mothers giving birthbeyond the age of 34 years. In this connection,Abbottabad’s 6.1% of EMW is lower than theprovince (9.5%). Education once again
emerges as an important factor, since areaswith low female literacy show high proportionsof women giving birth in their teens or beyondthe age of 35 years (MSU 2000: 4). This is amatter of concern not only from the perspectiveof population growth but also with regard tomaternal and child health. Very old and veryyoung women are exposed to far greater risk ofobstetric morbidity, leading to maternal andinfant mortality (MSU 2000: 4).
14
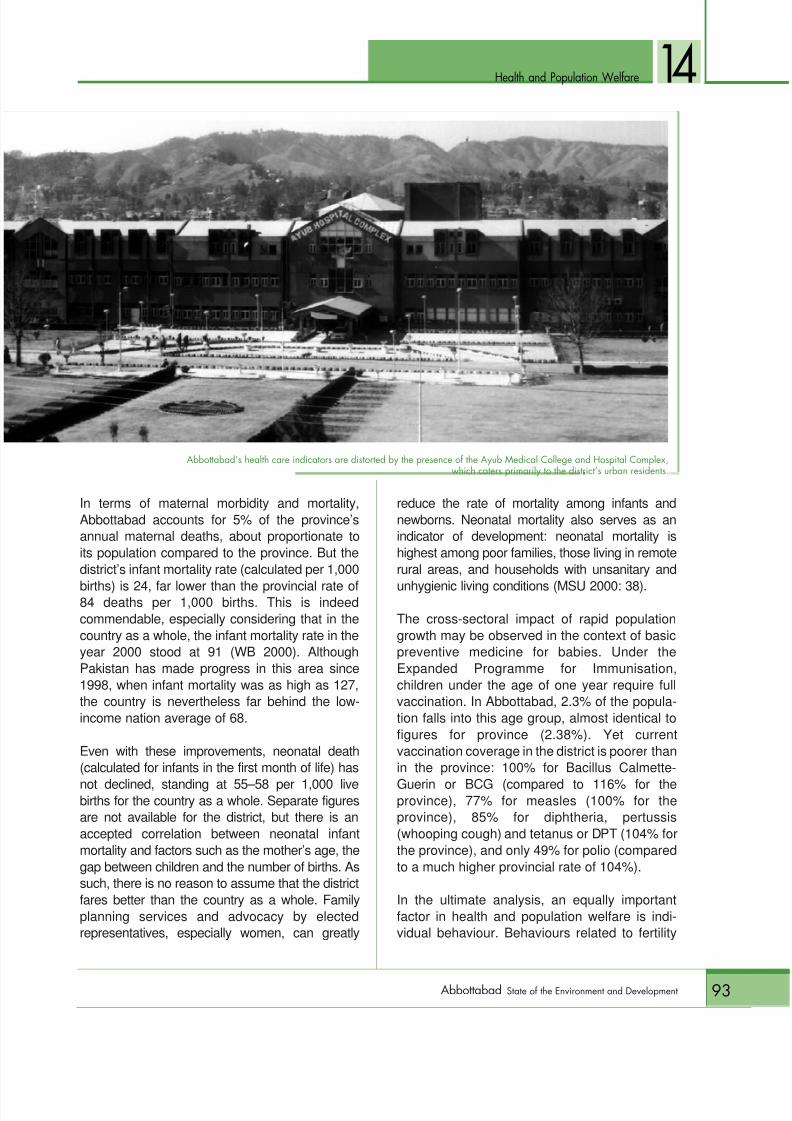
8/9/2019 Abbottabad Soed
http://slidepdf.com/reader/full/abbottabad-soed 107/150
93Abbottabad State of the Environment and Development
Health and Population Welfare
In terms of maternal morbidity and mortality,Abbottabad accounts for 5% of the province’sannual maternal deaths, about proportionate toits population compared to the province. But thedistrict’s infant mortality rate (calculated per 1,000
births) is 24, far lower than the provincial rate of84 deaths per 1,000 births. This is indeedcommendable, especially considering that in thecountry as a whole, the infant mortality rate in theyear 2000 stood at 91 (WB 2000). AlthoughPakistan has made progress in this area since1998, when infant mortality was as high as 127,the country is nevertheless far behind the low-income nation average of 68.
Even with these improvements, neonatal death(calculated for infants in the first month of life) has
not declined, standing at 55–58 per 1,000 livebirths for the country as a whole. Separate figuresare not available for the district, but there is anaccepted correlation between neonatal infantmortality and factors such as the mother’s age, thegap between children and the number of births. Assuch, there is no reason to assume that the districtfares better than the country as a whole. Familyplanning services and advocacy by electedrepresentatives, especially women, can greatly
reduce the rate of mortality among infants andnewborns. Neonatal mortality also serves as anindicator of development: neonatal mortality ishighest among poor families, those living in remoterural areas, and households with unsanitary and
unhygienic living conditions (MSU 2000: 38).
The cross-sectoral impact of rapid populationgrowth may be observed in the context of basicpreventive medicine for babies. Under theExpanded Programme for Immunisation,children under the age of one year require fullvaccination. In Abbottabad, 2.3% of the popula-tion falls into this age group, almost identical tofigures for province (2.38%). Yet currentvaccination coverage in the district is poorer thanin the province: 100% for Bacillus Calmette-
Guerin or BCG (compared to 116% for theprovince), 77% for measles (100% for theprovince), 85% for diphtheria, pertussis(whooping cough) and tetanus or DPT (104% forthe province), and only 49% for polio (comparedto a much higher provincial rate of 104%).
In the ultimate analysis, an equally importantfactor in health and population welfare is indi-vidual behaviour. Behaviours related to fertility
14
Abbottabad»s health care indicators are distorted by the presence of the Ayub Medical College and Hospital Complex,which caters primarily to the district»s urban residents.
8/9/2019 Abbottabad Soed
http://slidepdf.com/reader/full/abbottabad-soed 108/150
94 Abbottabad State of the Environment and Development
14 Health and Population Welfare
and its implications are often characterised by asense of fatalism. Particularly among poorly-educated segments of the population, suchmatters are left up to chance. To achieve the
national goal of 1% annual growth, effectiveimplementation of family planning and reproduc-tive health programmes across the board will berequired (MSU 2000: 1).
MAJOR INITIATIVESAND LESSONS LEARNTThe federal government has made a substantialinvestment in Abbottabad’s health care sectorwith the construction of the AMC, currently in its
third phase. In addition, six hospitals and anumber of rural health centres and basic healthunits operate in the district. In terms of indicators
such as population per doctor, per health instituteand per bed, the district performs far better thanthe province as a whole. Behind these seeminglypositive figures, key shortfalls persist.
To begin with, the figures are heavily biased infavour of urban areas and inflated by thepresence of the AMC. In fact, the vast majorityof Abbottabad’s rural population lacks access to
health care facilities. The basic health units,rural health centres and dispensaries inoperation are inefficient and desperately in needof staff, equipment and resources.
Salaries constitute a major component of thesector budget, with scarce funds left over forbasic medicines and supplies. Outlays fordevelopment expenditure, already inadequate,have been drastically cut in recent years. To addinsult to injury, under-utilisation is an issue ofgrave concern, limiting growth and pointing toserious capacity shortfalls in the public sector.
On the administrative level, political interferenceand centralised decision making continue to dog
the sector, along with the shortage ofoperational funds and qualified personnel.Alternative financing, community-based service
delivery, service charges and privatisation arekey areas that will need to be addressed if thesector is to become self-sufficient.
Already, urban areas of the district havewitnessed the emergence of a thriving privatehealth care sector. This serves as an indictmentof the public sector’s ability to address thehealth care needs of the population.
Across the board, the fertility rate—and thereforeoverall population size—is determined to a greatextent by the mean age at which women are married.In Abbottabad, the mean age of marriage for women is22.7 years, second only to Haripur district andfavourable in comparison with the province as well asthe country as a whole. This would explainAbbottabad’s relatively lower population growth rates.But the need to control fertility is nonethelessimportant for Abbottabad because population densityis increasing all the same.
8/9/2019 Abbottabad Soed
http://slidepdf.com/reader/full/abbottabad-soed 109/150
95Abbottabad State of the Environment and Development
Health and Population Welfare
In addition to the private sector, NGOs such asthe DUA Welfare Organisation have recentlyintroduced an innovative health care model,establishing rural health centres through
community mobilisation and membership. Withat least 2,000 members, these centres are selffinanced, charging Rs 120 in annual registrationfees and an out-patient fee of Rs 10 per visit.The centres are managed by a board of localCBOs. One such centre is already working inAbbottabad in conjunction with the SRSP. This
innovative approach needs to be examined as apossible means to improve health care cover-age in rural areas. NGOs such as the Society forPublic Awareness and Development Economics
(SPADE) and the Abbottonian MedicalAssociation are engaged in similar activities.
A key lesson for the health and populationwelfare sector is that interventions must beintegrated with cross-sectoral concerns such aseducation, nutrition and sanitation.
14
8/9/2019 Abbottabad Soed
http://slidepdf.com/reader/full/abbottabad-soed 110/150
96 Abbottabad State of the Environment and Development
and Communications
Communications networks are a fundamen-tal prerequisite for economic activity to take
place. Abbottabad once served as theprovincial summer capital as well as the headquar-ters of the now-defunct Hazara division. As a result,the district is relatively well served in terms of roadsand communications infrastructure.
ON-GROUND STATUSThe district is traversed by 571 km of roads in various categoriesalong with 50 major bridges ( Table 24 ). These figures do not
include roads maintained by local communities and the formerdistrict council, or urban roads maintained by the cantonmentboard and former Abbottabad Municipal Corporation, since recordsfor these components are not available. Between 1995 and 2000,the district’s roads network grew more than 46%, mostly as a resultof the massive 297% increase in ‘low type’ roads (where thethickness of the blacktop is kept at a minimum because traffic onsuch roads is low). A significant portion of this massive increase isaccounted for by the construction of new farm-to-market roads, themajority of which are low-type roads.
Infrastructure: Roads
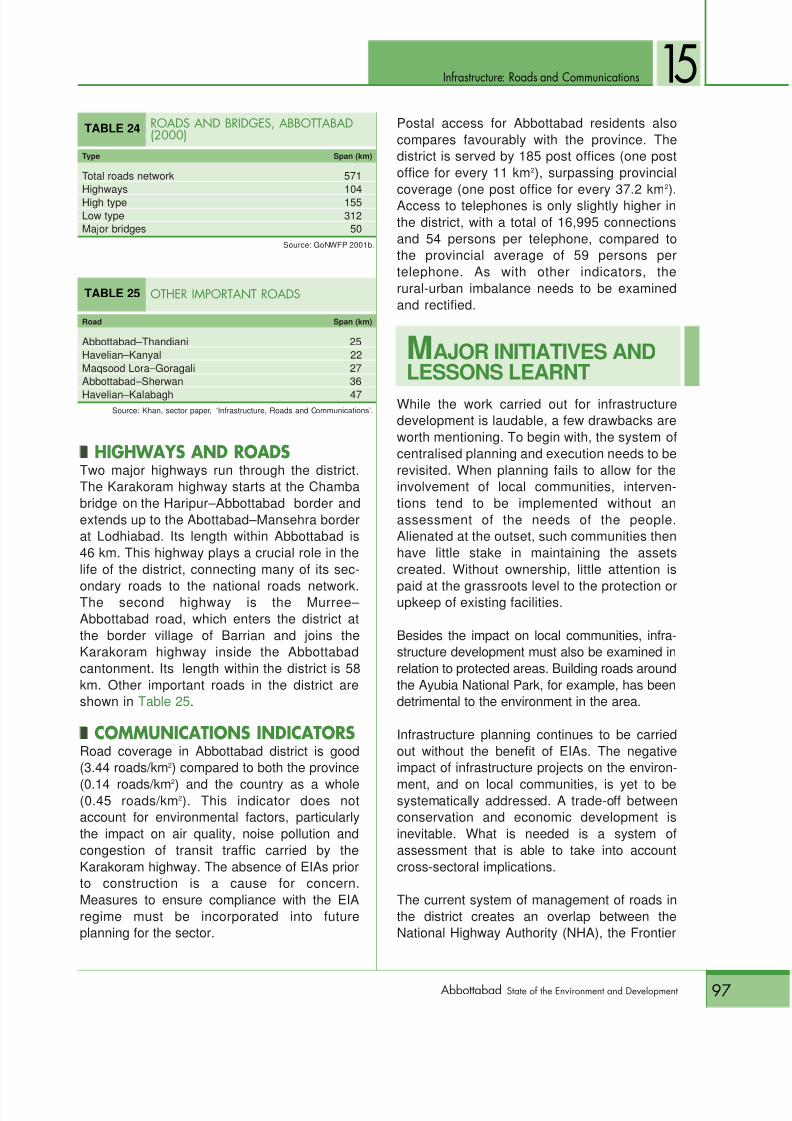
8/9/2019 Abbottabad Soed
http://slidepdf.com/reader/full/abbottabad-soed 111/150
Infrastructure: Roads and Communications
97Abbottabad State of the Environment and Development
15
snHIGHWAYS AND ROADSTwo major highways run through the district.The Karakoram highway starts at the Chambabridge on the Haripur–Abbottabad border andextends up to the Abottabad–Mansehra borderat Lodhiabad. Its length within Abbottabad is46 km. This highway plays a crucial role in thelife of the district, connecting many of its sec-
ondary roads to the national roads network.The second highway is the Murree– Abbottabad road, which enters the district atthe border village of Barrian and joins theKarakoram highway inside the Abbottabadcantonment. Its length within the district is 58km. Other important roads in the district areshown in Table 25 .
s
nCOMMUNICATIONS INDICATORS
Road coverage in Abbottabad district is good(3.44 roads/km 2) compared to both the province
(0.14 roads/km2
) and the country as a whole(0.45 roads/km 2). This indicator does notaccount for environmental factors, particularlythe impact on air quality, noise pollution andcongestion of transit traffic carried by theKarakoram highway. The absence of EIAs priorto construction is a cause for concern.Measures to ensure compliance with the EIAregime must be incorporated into futureplanning for the sector.
Postal access for Abbottabad residents alsocompares favourably with the province. Thedistrict is served by 185 post offices (one postoffice for every 11 km 2), surpassing provincial
coverage (one post office for every 37.2 km2
).Access to telephones is only slightly higher inthe district, with a total of 16,995 connectionsand 54 persons per telephone, compared tothe provincial average of 59 persons pertelephone. As with other indicators, therural-urban imbalance needs to be examinedand rectified.
MAJOR INITIATIVES ANDLESSONS LEARNT
While the work carried out for infrastructuredevelopment is laudable, a few drawbacks areworth mentioning. To begin with, the system ofcentralised planning and execution needs to berevisited. When planning fails to allow for theinvolvement of local communities, interven-tions tend to be implemented without anassessment of the needs of the people.Alienated at the outset, such communities thenhave little stake in maintaining the assetscreated. Without ownership, little attention is
paid at the grassroots level to the protection orupkeep of existing facilities.
Besides the impact on local communities, infra-structure development must also be examined inrelation to protected areas. Building roads aroundthe Ayubia National Park, for example, has beendetrimental to the environment in the area.
Infrastructure planning continues to be carriedout without the benefit of EIAs. The negativeimpact of infrastructure projects on the environ-
ment, and on local communities, is yet to besystematically addressed. A trade-off betweenconservation and economic development isinevitable. What is needed is a system ofassessment that is able to take into accountcross-sectoral implications.
The current system of management of roads inthe district creates an overlap between theNational Highway Authority (NHA), the Frontier
TABLE 24 ROADS AND BRIDGES, ABBOTTABAD(2000)
Type Span (km)
Total roads network 571Highways 104High type 155Low type 312Major bridges 50
Source: GoNWFP 2001b.
TABLE 25 OTHER IMPORTANT ROADS
Road Span (km)
Abbottabad–Thandiani 25Havelian–Kanyal 22Maqsood Lora–Goragali 27Abbottabad–Sherwan 36Havelian–Kalabagh 47
Source: Khan, sector paper, ‘Infrastructure, Roads and Communications’.

8/9/2019 Abbottabad Soed
http://slidepdf.com/reader/full/abbottabad-soed 112/150
Infrastructure: Roads and Communications
98 Abbottabad State of the Environment and Development
15Highway Authority, and the works and servicesdepartment. These overlaps need to be exam-ined, and a coordinative mechanism introducedto ensure efficiency and achieve synergy.
Finally, vested interests continue to dominatethe sector, with the result that infrastructuredevelopment is characterised by ad hocdecision making, nepotism, unrealistic planningand a lack of transparency. Not surprisingly,local communities tend to view public-sectorinfrastructure development with suspicion. Toincrease transparency and improve efficiency,the involvement of NGOs and the private sectorneeds to be encouraged.
s
n ANNUAL DEVELOPMENTPROGRAMME
Under the ADP, 10 projects in the district were invarious stages of completion by 2000–01,covering 125 km at a budgeted cost of Rs 336million. Of these, 74 km of roads werecompleted in 2000–01. Allocations for 2000–01amounted to Rs 48.778 million.
sn
COMMUNICATIONS AND WORKS DEPARTMENT
Much of the infrastructure development in the
district was carried out by the now-defunctcommunications and works department, whichwas responsible for the construction and mainte-nance of secondary and access roads as well asbridges. Following the devolution of local govern-ment, these responsibilities have passed to theNHA, and the works and services department.
While in operation, the communications andworks department constructed 46 major andminor roads with a combined span of 420 km, aswell as 29 bridges. In all, it completed 45
projects (totalling 364.349 km of roads) andconstructed the Abbottabad–Murree road up toBarrian (58 km), which has now been handedover to the NHA. It also built and maintainedseveral hundred culverts and drainage struc-tures which are now the responsibility of theworks and services department.
As far back as 1987, the communications andworks department proposed the construction of
an Abbottabad bypass to deal with the conges-tion caused by traffic on the Karakoramhighway. More than a decade later, no progresshas been made on this proposal, initially
budgeted at Rs 265 million.s
nDISTRICT COUNCILOnce a major player in infrastructure develop-ment, the former district council’s financialallocations prior to devolution amounted to ameagre Rs 0.3 million for roads. By 2001, thefederal Poverty Alleviation Programme (nowcalled the Khushhal Pakistan Programme orKPP) spent Rs 57 million in Abbottabad, ofwhich 40% was used to fund the construction offarm-to-market roads. The district council has
been disbanded following the devolution of localgovernment.
snDONORSTwo donor-funded projects with a 73%donor contribution and 27% governmentcontribution are operating in the district. Underthe Rural Access Roads Programme (previ-ously known as the Farm to Market RoadProject), a 45 km road from theThandiani–Pattan Khurd road to Paliar wasbuilt in 2001 at an estimated cost of Rs 234.5
million. In the same year, under the BADP,three roads were in various stages ofcompletion with a total span of 30.1 km and anestimated cost of Rs 136.94 million.
snNATIONAL HIGHWAY AUTHORITY The federal NHA has so far completedconstruction on two major highways passingthrough the district: the Karakoram highway (46km) and the Abbottabad–Murree road. The NHAalso built the Barrian-to-Murree portion of theAbbottabad–Murree road (7.8 km), while the 58
km stretch from Abbottabad to Barrian wascompleted by the communications and worksdepartment.
snOTHER INITIATIVESThe SRSP assists rural communities inimproving accessibility in their areas. As part ofits multi-sectoral intervention, the SRSP hasbeen involved in constructing rural roads inpartnership with local communities.
8/9/2019 Abbottabad Soed
http://slidepdf.com/reader/full/abbottabad-soed 113/150
99Abbottabad State of the Environment and Development
A ccess to clean drinking water is a vital quality oflife indicator. Supply to the district’s rural areas,the responsibility of the public health engineer-
ing department (PHED) prior to devolution, is now partof the duties of the works and services department.Within the cities of Abbottabad and Havelian, the TMAsand cantonment boards are entrusted with this task,while the Military Engineering Services supplies drink-ing water to the Pakistan Military Academy and relatedmilitary institutions in the district. A separate watersupply scheme is in place for Nathiagali, maintaineduntil 2001 by the now-defunct communications andworks department, while NGOs such as SUNGI and the
SRSP have also executed small water supply schemesacross the district in partnership with local communities.
ON-GROUND STATUSAccording to the 1998 census, only 32.73% of households haveaccess to drinking water inside the home, while the remaining 67.27%rely on an outdoor source ( Table 26 ). In-house connections are widelyavailable in urban areas (79.55%), with a large portion of this water
Drinking Water
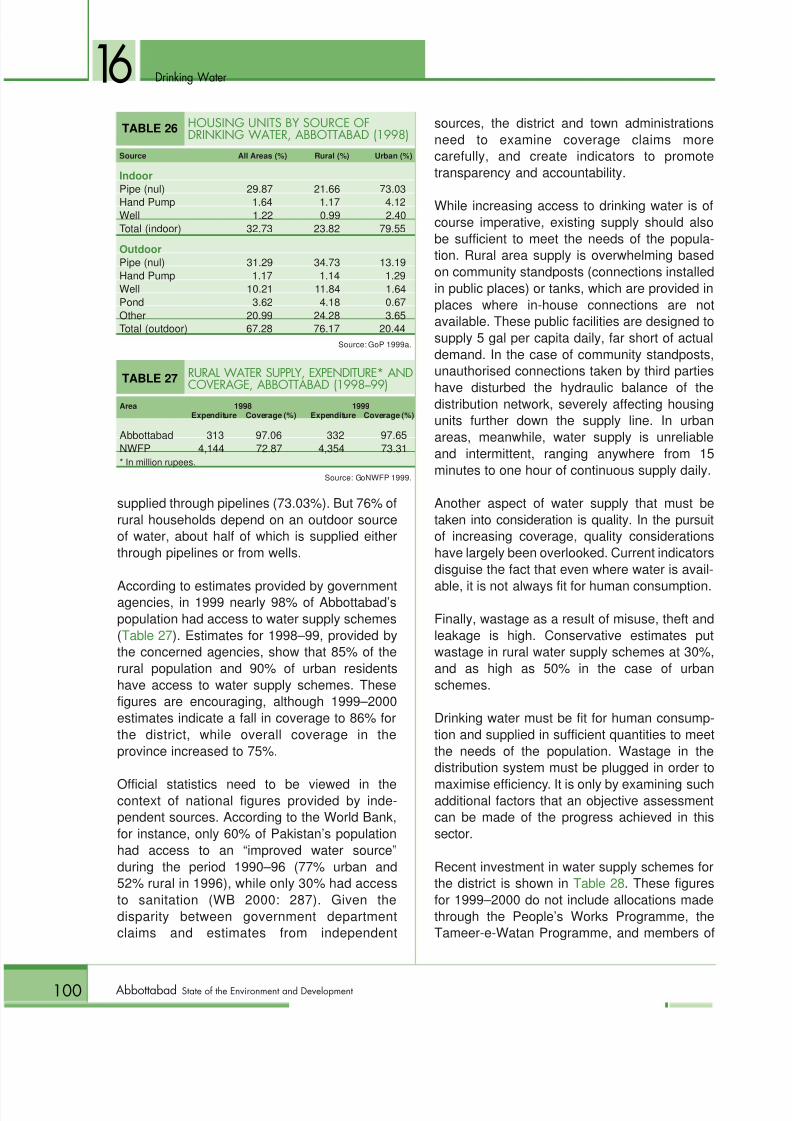
8/9/2019 Abbottabad Soed
http://slidepdf.com/reader/full/abbottabad-soed 114/150
100 Abbottabad State of the Environment and Development
16 Drinking Water
supplied through pipelines (73.03%). But 76% ofrural households depend on an outdoor sourceof water, about half of which is supplied eitherthrough pipelines or from wells.
According to estimates provided by governmentagencies, in 1999 nearly 98% of Abbottabad’spopulation had access to water supply schemes(Table 27 ). Estimates for 1998–99, provided bythe concerned agencies, show that 85% of therural population and 90% of urban residentshave access to water supply schemes. Thesefigures are encouraging, although 1999–2000estimates indicate a fall in coverage to 86% forthe district, while overall coverage in theprovince increased to 75%.
Official statistics need to be viewed in thecontext of national figures provided by inde-pendent sources. According to the World Bank,for instance, only 60% of Pakistan’s populationhad access to an “improved water source”during the period 1990–96 (77% urban and52% rural in 1996), while only 30% had accessto sanitation (WB 2000: 287). Given thedisparity between government departmentclaims and estimates from independent
sources, the district and town administrationsneed to examine coverage claims morecarefully, and create indicators to promotetransparency and accountability.
While increasing access to drinking water is ofcourse imperative, existing supply should alsobe sufficient to meet the needs of the popula-tion. Rural area supply is overwhelming basedon community standposts (connections installedin public places) or tanks, which are provided inplaces where in-house connections are notavailable. These public facilities are designed tosupply 5 gal per capita daily, far short of actualdemand. In the case of community standposts,unauthorised connections taken by third parties
have disturbed the hydraulic balance of thedistribution network, severely affecting housingunits further down the supply line. In urbanareas, meanwhile, water supply is unreliableand intermittent, ranging anywhere from 15minutes to one hour of continuous supply daily.
Another aspect of water supply that must betaken into consideration is quality. In the pursuitof increasing coverage, quality considerationshave largely been overlooked. Current indicatorsdisguise the fact that even where water is avail-
able, it is not always fit for human consumption.
Finally, wastage as a result of misuse, theft andleakage is high. Conservative estimates putwastage in rural water supply schemes at 30%,and as high as 50% in the case of urbanschemes.
Drinking water must be fit for human consump-tion and supplied in sufficient quantities to meetthe needs of the population. Wastage in thedistribution system must be plugged in order to
maximise efficiency. It is only by examining suchadditional factors that an objective assessmentcan be made of the progress achieved in thissector.
Recent investment in water supply schemes forthe district is shown in Table 28 . These figuresfor 1999–2000 do not include allocations madethrough the People’s Works Programme, theTameer-e-Watan Programme, and members of
TABLE 26 HOUSING UNITS BY SOURCE OFDRINKING WATER, ABBOTTABAD (1998)
Source All Areas (%) Rural (%) Urban (%)
IndoorPipe (nul) 29.87 21.66 73.03Hand Pump 1.64 1.17 4.12Well 1.22 0.99 2.40Total (indoor) 32.73 23.82 79.55
OutdoorPipe (nul) 31.29 34.73 13.19Hand Pump 1.17 1.14 1.29Well 10.21 11.84 1.64Pond 3.62 4.18 0.67Other 20.99 24.28 3.65Total (outdoor) 67.28 76.17 20.44
Source: GoP 1999a.
TABLE 27 RURAL WATER SUPPLY, EXPENDITURE* ANDCOVERAGE, ABBOTTABAD (1998√99)
Area 1998 1999Expenditure Coverage (%) Expenditure Coverage (%)
Abbottabad 313 97.06 332 97.65NWFP 4,144 72.87 4,354 73.31* In million rupees.
Source: GoNWFP 1999.
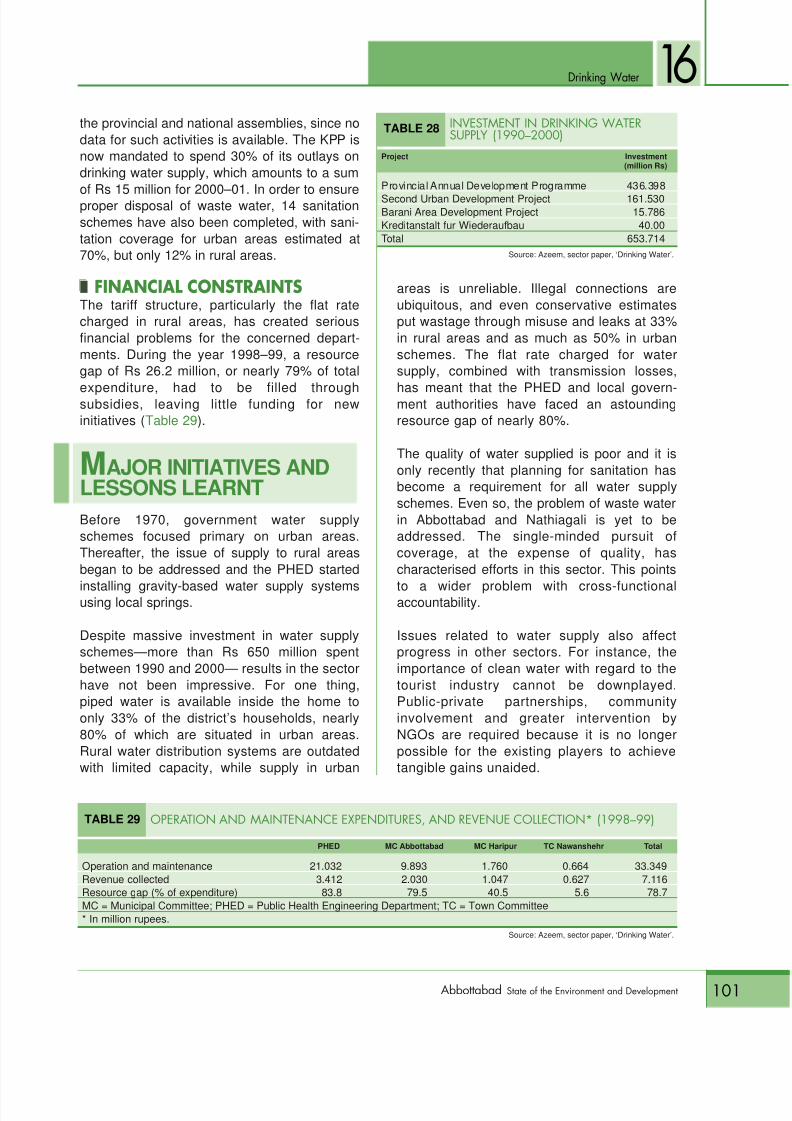
8/9/2019 Abbottabad Soed
http://slidepdf.com/reader/full/abbottabad-soed 115/150
101Abbottabad State of the Environment and Development
16Drinking Water
the provincial and national assemblies, since nodata for such activities is available. The KPP isnow mandated to spend 30% of its outlays ondrinking water supply, which amounts to a sum
of Rs 15 million for 2000–01. In order to ensureproper disposal of waste water, 14 sanitationschemes have also been completed, with sani-tation coverage for urban areas estimated at70%, but only 12% in rural areas.
snFINANCIAL CONSTRAINTSThe tariff structure, particularly the flat ratecharged in rural areas, has created seriousfinancial problems for the concerned depart-ments. During the year 1998–99, a resourcegap of Rs 26.2 million, or nearly 79% of total
expenditure, had to be filled throughsubsidies, leaving little funding for newinitiatives ( Table 29 ).
MAJOR INITIATIVES ANDLESSONS LEARNTBefore 1970, government water supplyschemes focused primary on urban areas.Thereafter, the issue of supply to rural areasbegan to be addressed and the PHED started
installing gravity-based water supply systemsusing local springs.
Despite massive investment in water supplyschemes—more than Rs 650 million spentbetween 1990 and 2000— results in the sectorhave not been impressive. For one thing,piped water is available inside the home toonly 33% of the district’s households, nearly80% of which are situated in urban areas.Rural water distribution systems are outdatedwith limited capacity, while supply in urban
areas is unreliable. Illegal connections areubiquitous, and even conservative estimatesput wastage through misuse and leaks at 33%in rural areas and as much as 50% in urbanschemes. The flat rate charged for watersupply, combined with transmission losses,
has meant that the PHED and local govern-ment authorities have faced an astoundingresource gap of nearly 80%.
The quality of water supplied is poor and it isonly recently that planning for sanitation hasbecome a requirement for all water supplyschemes. Even so, the problem of waste waterin Abbottabad and Nathiagali is yet to beaddressed. The single-minded pursuit ofcoverage, at the expense of quality, hascharacterised efforts in this sector. This points
to a wider problem with cross-functionalaccountability.
Issues related to water supply also affectprogress in other sectors. For instance, theimportance of clean water with regard to thetourist industry cannot be downplayed.Public-private partnerships, communityinvolvement and greater intervention byNGOs are required because it is no longerpossible for the existing players to achievetangible gains unaided.
TABLE 28 INVESTMENT IN DRINKING WATERSUPPLY (1990√2000)
Project Investment(million Rs)
Provincial Annual Development Programme 436.398Second Urban Development Project 161.530Barani Area Development Project 15.786Kreditanstalt fur Wiederaufbau 40.00Total 653.714
Source: Azeem, sector paper, ‘Drinking Water’.
TABLE 29 OPERATION AND MAINTENANCE EXPENDITURES, AND REVENUE COLLECTION* (1998√99)
PHED MC Abbottabad MC Haripur TC Nawanshehr Total
Operation and maintenance 21.032 9.893 1.760 0.664 33.349Revenue collected 3.412 2.030 1.047 0.627 7.116Resource gap (% of expenditure) 83.8 79.5 40.5 5.6 78.7MC = Municipal Committee; PHED = Public Health Engineering Department; TC = Town Committee* In million rupees.
Source: Azeem, sector paper, ‘Drinking Water’.
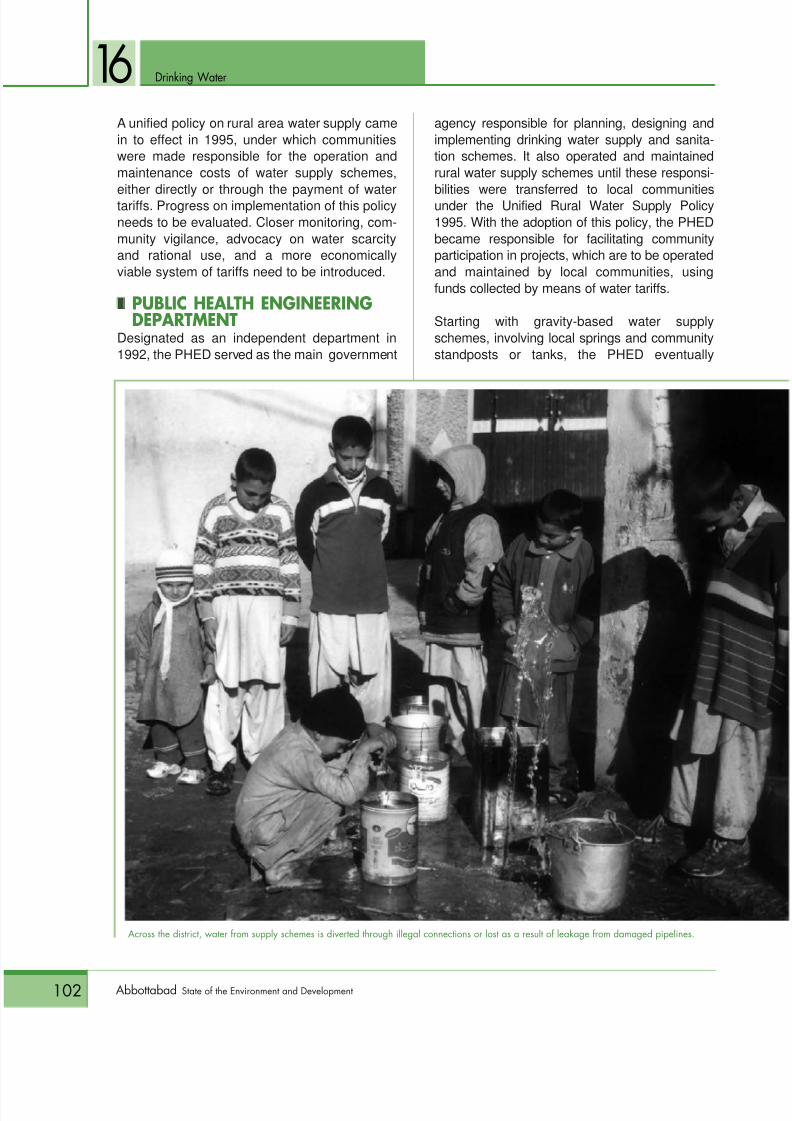
8/9/2019 Abbottabad Soed
http://slidepdf.com/reader/full/abbottabad-soed 116/150
102 Abbottabad State of the Environment and Development
16 Drinking Water
A unified policy on rural area water supply camein to effect in 1995, under which communitieswere made responsible for the operation andmaintenance costs of water supply schemes,
either directly or through the payment of watertariffs. Progress on implementation of this policyneeds to be evaluated. Closer monitoring, com-munity vigilance, advocacy on water scarcityand rational use, and a more economicallyviable system of tariffs need to be introduced.
snPUBLIC HEALTH ENGINEERINGDEPARTMENT
Designated as an independent department in1992, the PHED served as the main government
agency responsible for planning, designing andimplementing drinking water supply and sanita-tion schemes. It also operated and maintainedrural water supply schemes until these responsi-
bilities were transferred to local communitiesunder the Unified Rural Water Supply Policy1995. With the adoption of this policy, the PHEDbecame responsible for facilitating communityparticipation in projects, which are to be operatedand maintained by local communities, usingfunds collected by means of water tariffs.
Starting with gravity-based water supplyschemes, involving local springs and communitystandposts or tanks, the PHED eventually
Across the district, water from supply schemes is diverted through illegal connections or lost as a result of leakage from damaged pipelines.
8/9/2019 Abbottabad Soed
http://slidepdf.com/reader/full/abbottabad-soed 117/150
103Abbottabad State of the Environment and Development
Drinking Water
acquired the capacity to implement more complexschemes based on pumping ground water. In1997, the PHED’s institutional capacity wasstrengthened through the creation of a specialised
Community Motivation Team. By 2000–01, thePHED had completed 200 water supply schemesin the district, covering 85% of the ruralpopulation.
Under the devolution of local government, thePHED was merged with the works and servicesdepartment. The PHED’s functions have beentransferred to the works and servicesdepartment as well as the new town councils.
s
nOTHER INITIATIVES
In addition to the PHED, a number of otherplayers have worked in limited and strictlydemarcated areas. These include the districtcouncil, municipal committee, communicationsand works department, and district local govern-ment and rural development department, all ofwhich are now defunct. Entities which continueto operate under the devolved system includethe town committee Nawanshehr, cantonmentboard, GDA and Military Engineering Services.Most of these entities operate within specific
jurisdictions and are rarely in a position toundertake large-scale or complex initiatives.Their efforts are for the most part confined toroutine operational matters.
Several smaller projects have also beenimplemented. Under the provincialgovernment’s Second Urban DevelopmentProgramme, 17 tube wells were installed inAbbottabad and the entire distribution systemfor the city was replaced. The BADPundertook three water supply schemes andrehabilitated the supply system of Nawan-shehr town under a KfW grant-in-aid. Workwas also carried out under the People’s WorksProgramme, Tameer-e-Watan Programme and
KPP, in addition to various schemes initiatedby elected representatives with developmentfunds assigned to them by the federalgovernment. These initiatives have not beendocumented.
Under guidelines issued by the provincialplanning and development department, it is nowmandatory that sanitation is included in ruralwater supply initiatives. So far, 14 sanitationschemes have been completed in the district.
16
8/9/2019 Abbottabad Soed
http://slidepdf.com/reader/full/abbottabad-soed 118/150
104 Abbottabad State of the Environment and Development
N ow a major industry across the globe, tourismaccounts for 11% of world GDP and providesemployment to nearly 200 million people (IIED
2001). Currently, some 700 million tourists travel eachyear and this number is expected to double by 2020.For many societies, the benefits of this booming globalindustry can be significant. Tourism is today consideredto be a vital component in the wider effort to promotesustainable development in many parts of the world. InIndia, for instance, while income from the tourist tradeamounts to just 2.5% of GDP, it is estimated to accountfor as much as half of the economic activity of the hillregion of Uttar Pradesh (IIED 2001: 2). For areas such
as Abbottabad, tourism is potentially an importantmeans to diversify the district’s economy.
snEVOLVING CONCEPTS IN TOURISMAs new development concepts such as the national strategies forsustainable development (NSSD) paradigm have gained ground,ideas about tourism have also changed. It is important to understandthese changes as we try to chart a course that will enable the districtto develop its tourist industry in a sustainable manner.
E cotourism
8/9/2019 Abbottabad Soed
http://slidepdf.com/reader/full/abbottabad-soed 119/150
Ecotourism
105Abbottabad State of the Environment and Development
17As early as 1988, the World Tourism Organisa-tion defined the term sustainable tourism asactivity that leads to:
the management of all resources in such a
way that economic, social and aestheticneeds can be fulfilled while maintainingcultural integrity, essential ecologicalprocesses, biological diversity and lifesupport systems (IIED 2001).
In 1992, the Rio Earth Summit established the‘triple bottom line’ approach that takes intoaccount economic, social and environmentalsustainability. Since then, however, theemphasis has been on ‘greening’. Forexample, Agenda 21 for the Travel and
Tourism Industry refers to the interdepend-ence of development concerns and environ-mental protection, but the main thrust of thedocument is on environmental sustainability(WTTC et al 1996).
Parallel to these ideas, the concept of eco-tourism was developed. Ecotourism is definedas tourism that is nature oriented, and thatincorporates a desire to minimise negativesocial and environmental impacts. Thisconcept is particularly valuable in the context
of debates about the viability of top-downapproaches to conservation in and aroundprotected areas. Ecotourism revolves aroundnature, where the principal tourist activity is theobservation and appreciation of nature andtraditional cultures. As a form of economicactivity, it is more complex and far-sighted thanthe hustling and money orientation thatcharacterise traditional tourism. By taking intoconsideration conservation and the environ-ment, the socio-economic impact on localcommunities, and the interests of tourists
themselves, ecotourism fosters a symbioticrelationship between stakeholders.
This concept in turn spawned a broader interestin community-based tourism, often as a compo-nent of community-based natural resourcemanagement strategies. Obligations of donorsand governments under the United NationsConvention on Biological Diversity (UN 1992b),with its emphasis on sustainable use and
benefit sharing, have served to reinforce thistrend.
While ecotourism concepts appear highly
attractive on paper, disillusion with the term isspreading. Although many ecotourism strategiesincorporate pro-poor elements, poverty reduc-tion per se has not been a priority for thesustainable tourism agenda of Northern coun-tries. Significantly, though, in 1999 explicit refer-ence to pro-poor tourism was made at the 7thmeeting of the Commission for SustainableDevelopment, which urged governments to:
maximise the potential of tourism for eradi-cating poverty by developing appropriatestrategies in cooperation with all major
groups, indigenous and local communities(IIED 2001: 5).
Here, pro-poor tourism was defined as tourismthat benefits the poor.
Strategies to promote pro-poor tourism aim tounlock opportunities for disadvantaged commu-nities, with three core areas of focus: (i) increas-ing economic benefits, (ii) enhancing non-economic impacts and (iii) bringing about policyand process reform. The goal of achieving
sustainable development in Abbottabad can begreatly facilitated by a pro-poor orientation thatputs poverty at the centre of the sustainabilitydebate.
snHISTORY OF TOURISM IN THE DISTRICTMost of the area that falls within the limits ofAbbottabad district has historically been thefocus of resort tourism. As early as 1880, theBritish colonial administration establishedsummer camps for its troops in the Galliyatarea, with Dongagali, Nathiagali and Thandiani
being reserved for civil servants. Followingindependence from colonial rule, the canton-ments in the Galliyat areas were abandoned. In1961, the HHTIT was created to reduceexcessive tourist pressure on Murree byredeveloping these abandoned cantonments.Most of the development came in the form ofauctioning plots, and building a few internalroads and nondescript hotels. The onlysignificant input was the scheme to build a ski

8/9/2019 Abbottabad Soed
http://slidepdf.com/reader/full/abbottabad-soed 120/150
Ecotourism
106 Abbottabad State of the Environment and Development
17resort in 1969, although this initiative did notprogress beyond the installation of a chair lift atAyubia. In 1999, the GDA was established topromote tourism, taking over from the HHTIT.
The GDA has ambitious plans but is currentlystymied by procedural and organisationalconstraints limiting its role in tourism promotion.
ON-GROUND STATUSWhile accurate historical data on tourism in thedistrict are not available, a survey conducted bythe federal government’s tourism divisionshows that 99% of visitors to Abbottabad arePakistani and that tourists spend and average
of 1.5 nights in the area (GoP 1999b). Mostsuch visitors travel with their families or ingroups, and the majority hail from Sindh andthe Punjab.
According to this industry survey, in 1999 atotal of 38,400 visitors stayed in Abbottabadcity and Nathiagali, of whom only 1.3% wereforeign nationals ( Figure 57 and Figure 58 ).This figure is substantially lower than the86,300 tourists visiting the area in 1991. Thestatistics should be read with caution, however,
since they do not include day visitors or touristsopting for non-traditional accommodation oraccommodation rented on a seasonal basis.The figures also exclude day visitors, currentlyestimated at 1,000–1,800 visitors daily duringthe peak June–August season.
Some 54 major hotels operate in Abbottabad,Ayubia and Nathiagali, in addition to numerousguesthouses, non-traditional accommodationand smaller hotels. The district is traversed byan extensive roads network, with the Karakoram
highway, the Murree–Abbottabad road and anumber of smaller roads that link the district toAzad Kashmir, the Kaghan valley, the NorthernAreas and Swat. Telephone links are well estab-lished, with a digital exchange in Abbottabad cityand smaller exchanges across the district.
Despite these relative advantages, few touristschoose to reside in the district itself. Rather,Abbottabad is better known as a transit point for
more popular tourist hotspots such as Gilgit, theKaghan valley, Kashmir and Swat. Day visitors,meanwhile, prefer using Murree as a baserather than Abbottabad.
snTOURIST ATTRACTIONSThere exists tremendous potential to developpro-poor tourism in the district. Such prospectsare particularly bright for areas in and aroundthe Ayubia National Park, and the Birangali,Chhatri and Phalkot reserve forests. If properlydeveloped, these areas could serve to attract
nature tourists, ornithologists, hikers andtrekkers, creating employment opportunities forlocal communities.
Currently, Abbottabad city, Ayubia, Dongagali,Nathiagali and Thandiani are a few of thedistrict’s favoured tourist destinations.Abbottabad city is easily accessible, offersreasonable facilities, and is surrounded by theSarban and Shimla hills. The city is home to one
70,200 71,000 66,300 67,200
24,600 24,900 28,800 29,100
19,400 19,600
1991 1996 1997 1998 1999
FIGURE 57 HOTEL OCCUPANCY, ABBOTTABAD(1991√99)
90,000
80,000
10,00060,000
50,000
40,000
30,000
20,000
10,000
0
N u m
b e r o f
t o u r i s
t s
Source: GoP 1999b.
s Pakistani s Foreign s Total
900 900 300 200 300
14,500
15,200
9,200 9,700
4,5004,600
9,100 9,300
6,200 6,300
1991 1996 1997 1998 1999
FIGURE 58 HOTEL OCCUPANCY, NATHIAGALI(1991√99)
16,000
14,000
12,000
10,000
8,000
6,000
4,000
2,000
0
N u m
b e r o f
t o u r i s t s
Source: GoP 1999b.
s Pakistani s Foreign s Total
700
500 100 100 200

8/9/2019 Abbottabad Soed
http://slidepdf.com/reader/full/abbottabad-soed 121/150
Ecotourism
107Abbottabad State of the Environment and Development
17main park, two gardens and a golf club, as wellas numerous sites of tourist interest.
Ayubia
With four mini-resorts spread over an area of 26km2, Ayubia is perhaps best known for the chairlift at Ghora Dhaka, which was a pioneeringrecreational facility at the time of its inception in1967 and continues to attract visitors today.
The GalliyatDongagali, at an elevation of 2,460 m, is situatedon the slopes of the Mukshpuri hill. It serves asan entry point for the Ayubia National Park,spread over 3,312 ha. Nathiagali is situated 3 kmfrom Dongagali and, at 2,510 m, is the most pic-
turesque hill station in the Galliyat area. It is cov-ered in pine, walnut, oak and maple trees, andenjoys a favourable climate. Its pine forests arecrossed by a number of trails and tracks that areideally suited for both short and long treks. TheBritish built a small timbered church and animposing governor’s house in Nathiagali, alongwith a number of small cottages.
ThandianiSituated at an elevation of 2,750 m, Thandianicommands spectacular views of the surrounding
landscape. It is reputedly the coolest hill station inthe country. As the least developed tourist spot inthe area, Thandiani is ideally suited for ecotourism.
MAJOR INITIATIVES ANDLESSONS LEARNTIn the absence of significant industrial activity andwith poor prospects for the expansion of agricul-ture, tourism can serve as a key component ofsustainable development in Abbottabad. It is a
reflection of administrative failure and short-sight-edness that little or no development has takenplace in this sector, with little hope for significantgrowth in the near future. A number of initiativeshave been undertaken but execution andimplementation have been far from satisfactory.
The British colonial administration establishedcamps for its for troops and civil servants in threelocations. These cantonments were abandoned
following Independence. In 1961, the HHTIT wasestablished to develop the tourist potential ofthese abandoned cantonments, partially as ameans to reduce excessive tourist pressure on
Murree. Besides the indiscriminate auctioning ofbuildings and plots, and the haphazard construc-tion of roads and a few nondescript structures,the only worthwhile contribution made by theHHTIT was an attempt to build a ski resort atAyubia. Ultimately, the project was confined tothe installation of a chair lift, which remains apopular tourist attraction to this day.
In 1999, the government established the GDA todevelop the tourist potential of the Galliyat area.Its operations have been mired in procedural
and bureaucratic wrangling. Management of theGDA has now been handed over to the newdistrict government, and the hope is that this willallow the GDA to function more effectively in thefuture.
A number of other public-sector initiatives haveeither directly or indirectly impacted the tourismsector. The construction of modern roads,establishment of hotels and guesthouses, andprovision of communications facilities create abroadly supportive canvas. The Pakistan
Tourism Development Corporation operatesthree rest houses in Nathiagali, a motel inAyubia and a tourist information centre inAbbottabad city. The Sarhad Tourism Corpora-tion operates three rest houses in Nathiagali,with plans to develop another such facility inDongagali. The wildlife department managesthe Ayubia National Park, providing additionalsupport to tourism in the district.
In the private sector, the Adventure Foundation,Pakistan, a non-commercial organisation,
provides outdoor education and adventuretraining for young people, and offers a numberof courses through its centre in Kakul. Hoteliers,transporters and the business community form acore group of concerned stakeholders.
Despite these initiatives, the overall picture forthe sector is far from satisfactory. Availablefigures indicate a persistent decline in tourism inthe district over recent years. Day visitors,
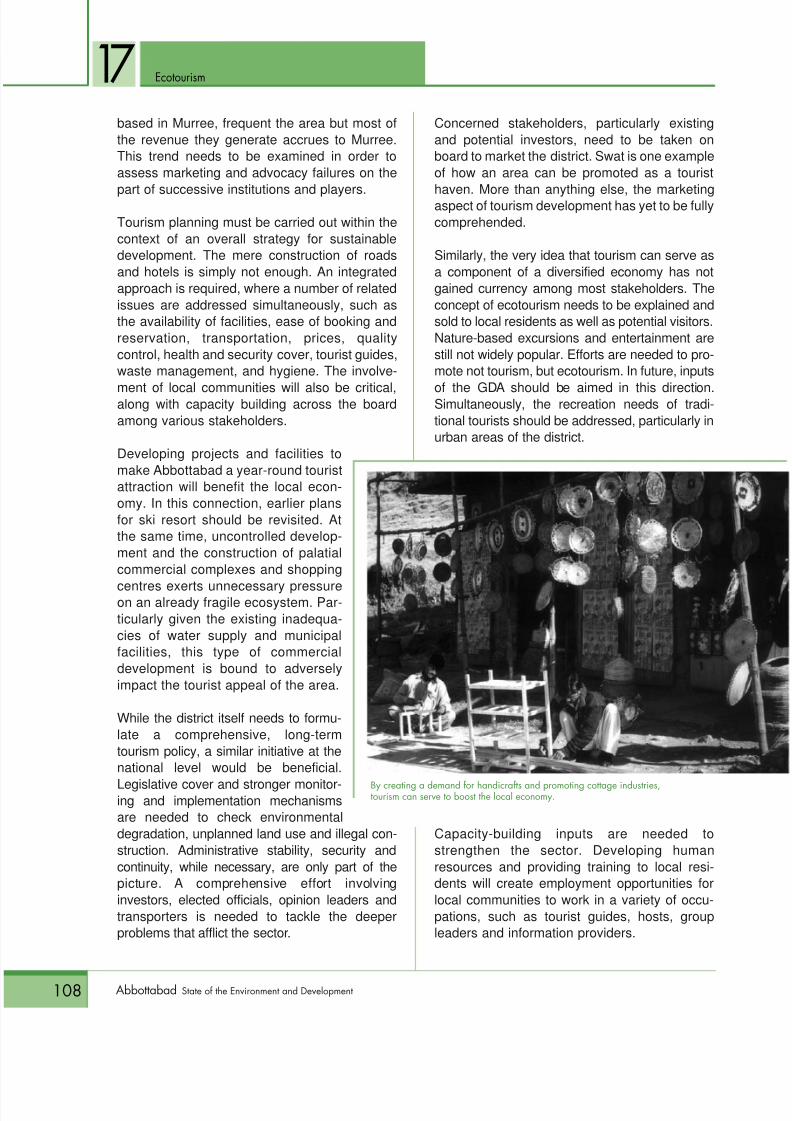
8/9/2019 Abbottabad Soed
http://slidepdf.com/reader/full/abbottabad-soed 122/150
Ecotourism
108 Abbottabad State of the Environment and Development
17based in Murree, frequent the area but most ofthe revenue they generate accrues to Murree.This trend needs to be examined in order toassess marketing and advocacy failures on the
part of successive institutions and players.Tourism planning must be carried out within thecontext of an overall strategy for sustainabledevelopment. The mere construction of roadsand hotels is simply not enough. An integratedapproach is required, where a number of relatedissues are addressed simultaneously, such asthe availability of facilities, ease of booking andreservation, transportation, prices, qualitycontrol, health and security cover, tourist guides,waste management, and hygiene. The involve-
ment of local communities will also be critical,along with capacity building across the boardamong various stakeholders.
Developing projects and facilities tomake Abbottabad a year-round touristattraction will benefit the local econ-omy. In this connection, earlier plansfor ski resort should be revisited. Atthe same time, uncontrolled develop-ment and the construction of palatialcommercial complexes and shopping
centres exerts unnecessary pressureon an already fragile ecosystem. Par-ticularly given the existing inadequa-cies of water supply and municipalfacilities, this type of commercialdevelopment is bound to adverselyimpact the tourist appeal of the area.
While the district itself needs to formu-late a comprehensive, long-termtourism policy, a similar initiative at thenational level would be beneficial.
Legislative cover and stronger monitor-ing and implementation mechanismsare needed to check environmentaldegradation, unplanned land use and illegal con-struction. Administrative stability, security andcontinuity, while necessary, are only part of thepicture. A comprehensive effort involvinginvestors, elected officials, opinion leaders andtransporters is needed to tackle the deeperproblems that afflict the sector.
Concerned stakeholders, particularly existingand potential investors, need to be taken onboard to market the district. Swat is one exampleof how an area can be promoted as a tourist
haven. More than anything else, the marketingaspect of tourism development has yet to be fullycomprehended.
Similarly, the very idea that tourism can serve asa component of a diversified economy has notgained currency among most stakeholders. Theconcept of ecotourism needs to be explained andsold to local residents as well as potential visitors.Nature-based excursions and entertainment arestill not widely popular. Efforts are needed to pro-mote not tourism, but ecotourism. In future, inputs
of the GDA should be aimed in this direction.Simultaneously, the recreation needs of tradi-tional tourists should be addressed, particularly inurban areas of the district.
Capacity-building inputs are needed tostrengthen the sector. Developing humanresources and providing training to local resi-dents will create employment opportunities forlocal communities to work in a variety of occu-pations, such as tourist guides, hosts, groupleaders and information providers.
By creating a demand for handicrafts and promoting cottage industries,tourism can serve to boost the local economy.
8/9/2019 Abbottabad Soed
http://slidepdf.com/reader/full/abbottabad-soed 123/150
109Abbottabad State of the Environment and Development
Development
Abbottabad district is poorly positionedin terms of employment opportunities
while the workforce by and large lacksthe skills required in today’s market. The mainsources of employment in the district areagriculture, construction, trade, transport, andthe seasonal hotel and restaurant business.With few manufacturing industries in operationand meagre prospects for agriculturalexpansion, the economic future of the district isnot promising. The challenge for Abbottabad
lies in developing enterprise, creatingemployment opportunities and diversifying therural economy to encompass productive,value-added activities.
E nterprise
8/9/2019 Abbottabad Soed
http://slidepdf.com/reader/full/abbottabad-soed 124/150
110 Abbottabad State of the Environment and Development
Enterprise Development
ON-GROUND STATUSOfficial unemployment in the district stands at
31.14% with considerable underemploymentand only 29% of the population categorised asemployed. What is worse, unemployment willgrow in future years since more than 40% ofthe district’s current population is below theage of 15. As these young people enter the jobmarket, further pressure will be exerted on analready fragile economy. Proximate povertyindicators for the district are not encouragingand poverty estimates, albeit crude, areequally dismal.
Broad issues in enterprise development thatthe district government will need to addressinclude capacity development, opportunityidentification and sectoral allocations. Evengovernment efforts and funding are noguarantee of success. For example, in 1992–93the federal government’s self-employmentscheme disbursed Rs 180 million in Abbottabadfor the establishment of 43 enterprises, 32 ofwhich stand abandoned today.
NGOs have only recently started implementing
enterprise development programmes. Thismove came in part as result of problemscreated by earlier attempts at credit provision. Itwas noted that loans taken by NGO-formedcommunity organisations ended up beinginvested in activities with low value addition,with little consequent impact on povertyalleviation. Today, the work undertaken bySUNGI and the SRSP needs to be analysedbefore proceeding further in the sector.Investment in enterprises involving localmaterials should be targeted more vigorously.
MAJOR INITIATIVES ANDLESSONS LEARNTPoverty alleviation is a central concern insustainable development strategic thinking. InAbbottabad’s case, limited prospects in theagriculture sector, the depletion of forests, thefailure to capitalise on the area’s tourist poten-
tial and the general dearth of economic activitymake microenterprise development all themore important. Unfortunately, the significanceof this sector has not been recognised and
microenterprise development has generallyoccurred as an adjunct to natural resourcemanagement initiatives.
Ultimately, environmental conservation isinextricably linked to poverty. The poorer thecommunity, the greater its dependence onnatural resources. As an area with fewemployment opportunities for the people,Abbottabad confronts this problem continually.Although inputs are underway to exploit theincome-generating potential of the district, such
efforts are for the most part patchy andconfined to mainstream sectors.
In addition to the government, several NGOsand development projects are working inenterprise development. While Abbottabadhas benefited from multi-sectoral initiatives,microenterprise has only recently begun toreceive individual attention, largely throughthe work of NGOs operating in the area.Today, efforts are needed to improve coordi-nation, guidance and oversight. At the same
time, the active participation must be sought ofall segments of society.
snBANKSFollowing the success of NGO-supportedmicrocredit initiatives, banks have also enteredthe fray. By making it mandatory for banks to setaside a part of their portfolio for microcredit andloans to small operations, the State Bank ofPakistan greatly facilitated progress in thissector.
While other banks have been slow to enter thefield, the Bank of Khyber (BoK) has alreadyestablished a specialised microenterprise unitwhich uses the SUNGI and SRSP to channelloans to rural communities. Since 1996, the BoKhas disbursed a total of Rs 18.65 million to 465individuals in Abbottabad district, with autilisation portfolio as follows: shops (60%),livestock (20%) and agriculture (20%). In Baghvillage, a total of 65 small loans amounting to
18
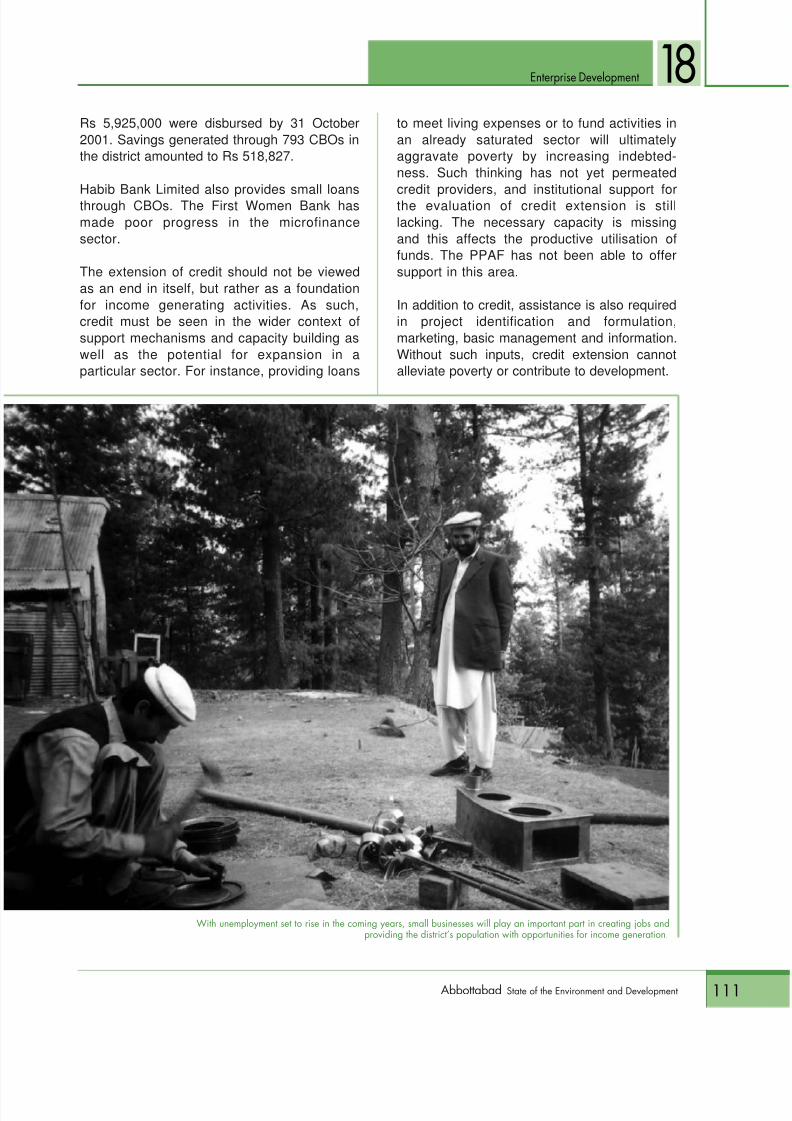
8/9/2019 Abbottabad Soed
http://slidepdf.com/reader/full/abbottabad-soed 125/150
8/9/2019 Abbottabad Soed
http://slidepdf.com/reader/full/abbottabad-soed 126/150
112 Abbottabad State of the Environment and Development
Enterprise Development
snEXPORT PROMOTION BUREAUThe EPB established an Abbottabad office in1993 and has since held 30 seminars andexhibitions to promote export awareness in the
district. As a result, 200 new exporters havebeen registered and it is estimated that theHazara region witnessed an 11% increase inexports between 1993 and 2001. For the future,the EPB plans to seek the involvement of theprivate sector with particular focus on industriesoperated by women.
snSARHAD RURAL SUPPORTPROGRAMME
A major component of the SRSP’s activitiesconsists of enterprise development through
training and capacity building. The SRSP serves
as the implementing agency for the BADP. Inaddition, it is implementing a programme fundedby the Pakistan Poverty Alleviation Fund(PPAF). Under the PPAF, the SRSP hasestablished an Enterprise Development Sectionin Abbottabad and launched an enterpriseprogramme to identify new, viable projects.
The SRSP provides loans from its own creditpool and also facilitates the BoK in channellingloans to rural communities. Its extensive networkof CBOs and its impressive 80% credit recoveryrate makes it a key partner in future developmentefforts in the sector.
Despite its laudable efforts, the SRSPremains stymied by difficulties of access to
information about markets and relevanttechnologies.
s
nSMALL INDUSTRIES
DEVELOPMENT BOARDIn the mid-1970s, the provincial government’sSmall Industries Development Board set up aSmall Industries Estate (SIE) at Mandian inAbbottabad, where all 109 plots were allotted tovarious parties. The site was subsequentlydeveloped and the SIE was formally inaugu-rated in 1981. Since then, progress on the SIEhas been dismal. In 1994–95, only 28 units werein operation, providing employment to some 571individuals. Subsequently, activity in the SIEdeclined further, with just 25 units operating in
2000, employing fewer than 500 workers.
snOTHER INITIATIVESIn conjunction with its microcredit programme,SUNGI provides marketing support fortraditional crafts industries such as embroiderythrough a commercial outlet it has acquired inIslamabad. It also facilitates the BoK inchannelling loans to rural communities.
A number of other NGOs and developmentprojects have expanded their operations toinclude a microcredit or enterprise develop-ment component. The BADP, which launchedits activities in Abbottabad in 1997 to promotefruit and vegetable cultivation and livestockrearing, today uses the SRSP to implementcredit-related decisions. Similarly, the NRCP,essentially a forestry initiative, is working on a
18
The extension of credit should not be viewed as an endin itself but rather as a foundation for incomegeneration. Credit must be seen in the wider context ofsupport mechanisms and capacity building as well asthe potential for expansion in a particular sector.Providing loans to meet living expenses or to fund
activities in an already saturated sector will ultimatelyaggravate poverty by increasing indebtedness.
8/9/2019 Abbottabad Soed
http://slidepdf.com/reader/full/abbottabad-soed 127/150
113Abbottabad State of the Environment and Development
Enterprise Development
strategy for enterprise development withsupport from IUCN. It faces hurdles in the formof information, capacity and technology short-falls. The Community Infrastructure Project too
is expanding its activities beyond infrastruc-ture development and is currently looking toprovide credit facilities for enterprise develop-ment. The PHP, funded by the SDC, alsooperates in the area, helping to finance fruittree nursery production with the support oflocal communities.
Smaller NGOs such as SPADE have launchedvarious programmes aimed at enterprisedevelopment. SPADE has established an
Afghan carpet weaving training centre for localwomen. This type of initiative in particularshould be explored further, as part of a multi-pronged strategy to transfer skills and provide a
sustainable source of income generation.In the public sector, two technical training centresmanaged by the Directorate of Manpower andTraining operate in the district, one each inAbbottabad and Havelian. These centres providetraining in automobile repair and computers. NearNarian, the Army Welfare Trust runs a women’svocational centre where basic sewing skills aretaught. In addition, the social welfare departmentruns several vocation centres for women.
18
8/9/2019 Abbottabad Soed
http://slidepdf.com/reader/full/abbottabad-soed 128/150
114 Abbottabad State of the Environment and Development
T he culture of the Hazara area, which todaycovers the districts of Abbottabad, Battagram,Haripur, Kohistan and Mansehra, is strongly
influenced by its past. Hazara was ruled by theDurrani dynasty from 1747 to 1818, by the Sikhsbetween 1819 and 1849, and finally by the British inthe period 1849–1947. These changing rulers lefttheir mark on the cultural and social life of the region.
HISTORICAL CONTEXTThe early history and culture of the area is not well documented.Around 200 AD, the region was part of the Kushan empire of
Gandhara. Little more is known about the history of the area until the18th century.
During Durrani rule, the cultural milieu was influenced by tribaldivisions. Prominent tribes, among them the Abbassis, Dhunds,Jadoons, Karlals and Tanolis, occupied their own territories. Eachtribe developed distinct financial, educational and ritual systems,along with social structures designed to facilitate the division of labour.Women played a subordinate role in this culture. Many of thesetraditions persists to this day.
C ulture
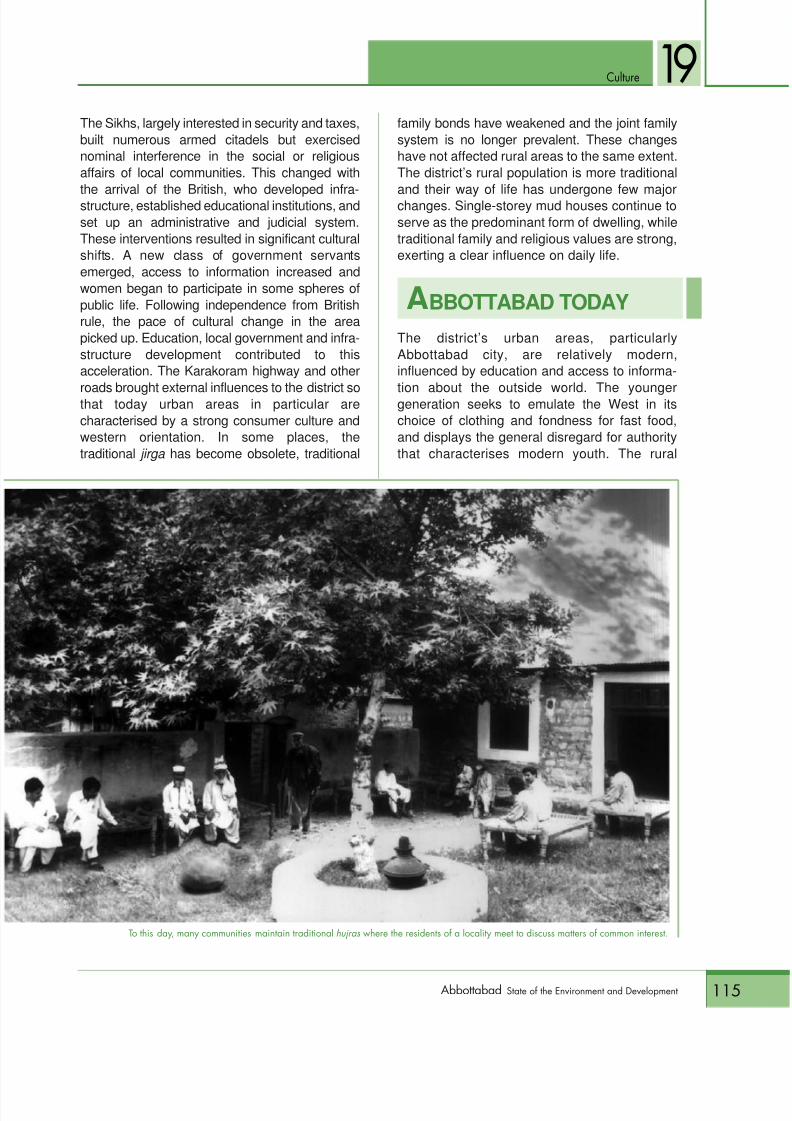
8/9/2019 Abbottabad Soed
http://slidepdf.com/reader/full/abbottabad-soed 129/150
Culture
115Abbottabad State of the Environment and Development
19The Sikhs, largely interested in security and taxes,built numerous armed citadels but exercisednominal interference in the social or religiousaffairs of local communities. This changed with
the arrival of the British, who developed infra-structure, established educational institutions, andset up an administrative and judicial system.These interventions resulted in significant culturalshifts. A new class of government servantsemerged, access to information increased andwomen began to participate in some spheres ofpublic life. Following independence from Britishrule, the pace of cultural change in the areapicked up. Education, local government and infra-structure development contributed to thisacceleration. The Karakoram highway and other
roads brought external influences to the district sothat today urban areas in particular arecharacterised by a strong consumer culture andwestern orientation. In some places, thetraditional jirga has become obsolete, traditional
family bonds have weakened and the joint familysystem is no longer prevalent. These changeshave not affected rural areas to the same extent.The district’s rural population is more traditional
and their way of life has undergone few majorchanges. Single-storey mud houses continue toserve as the predominant form of dwelling, whiletraditional family and religious values are strong,exerting a clear influence on daily life.
ABBOTTABAD TODAYThe district’s urban areas, particularlyAbbottabad city, are relatively modern,influenced by education and access to informa-
tion about the outside world. The youngergeneration seeks to emulate the West in itschoice of clothing and fondness for fast food,and displays the general disregard for authoritythat characterises modern youth. The rural
To this day, many communities maintain traditionalhujras where the residents of a locality meet to discuss matters of common interest.
8/9/2019 Abbottabad Soed
http://slidepdf.com/reader/full/abbottabad-soed 130/150
Culture
116 Abbottabad State of the Environment and Development
19areas, while more traditional, are alsobeginning to change. An ever-expanding roadsnetwork increases access to and from remoteareas. Growing numbers of villagers are now
employed outside the place of their birth andbring back with them experience andknowledge of urban centres within Pakistan aswell as influences from abroad.
Men continue to dress in the traditional shalwar (baggy trousers) and kamiz (loose, long shirt) inthe summer, worn with patti coats and sweatersin the winter ( patti is a type of woollen clothmanufactured in Chitral and the NorthernAreas). Women wear what is known as thesothan (a term for shalwar in the local Hindko
language) and kurta (loose shirt), with shawlsand sweaters in the winter.
Children’s recreational activities include gulli danda (a game played using a stick andstones, popular throughout the subcontinent)and hide-and-seek. Batti (lifting millstones)and other feats of strength are popularpastimes among youth and adults. In somevillages, unique marriage rites are still
prevalent, such as the tamman , a ritual whichrequires the bridegroom to shoot at a thin wireplaced high on a tree by the bride’s family. Thegroom’s friends become involved in the
challenge and, once successful, they areofficially received by the bride’s party.
Animal transport has more or less disappeared,replaced even in rural areas by Suzukis (smallpick-up trucks) that have been modified toaccommodate passengers. Processed andmanufactured goods are widely available inrural areas, and the mahiya (folk song) and turi (trumpet) have been replaced by a boomingvideo and music business.
Global political events have also influencedcultural practice in the area. The Afghan jihad against Soviet invasion which began in 1979 hashad visible effects on the local population. Amongother things, the clergy is increasing in influence.
Today, the cultural milieu of the district is in astate of flux. This needs to be understood andturned to the benefit of future developmentalinterventions in the district.
8/9/2019 Abbottabad Soed
http://slidepdf.com/reader/full/abbottabad-soed 131/150
117Abbottabad State of the Environment and Development
L ower-tier sustainable development strategydocuments, both in Pakistan and elsewhere inthe world, are increasingly focusing on the
participation of women in the development process.
The SPCS, finalised in 1996, includes the topic ofwomen and development in its discussion on povertyalleviation and population. Internationally, the consul-tation process emphasised by Local Agenda 21explicitly identifies women as significant contributorsto development. Similarly, the Beijing Platform forAction (UN 1995) calls for a focus on women and theenvironment, underscoring the fact that positivemeasures have to be taken towards implementation,
with both the government and civil society playing anactive part in the process. The Pakistan NationalConservation Strategy mid-term review (Hanson et al2000) also focuses on the need for gender equity. Therecent shift towards the NSSD paradigm, with itsparticular stress on poverty alleviation, has mademainstreaming women’s participation an inescapablecontingency.
Gender
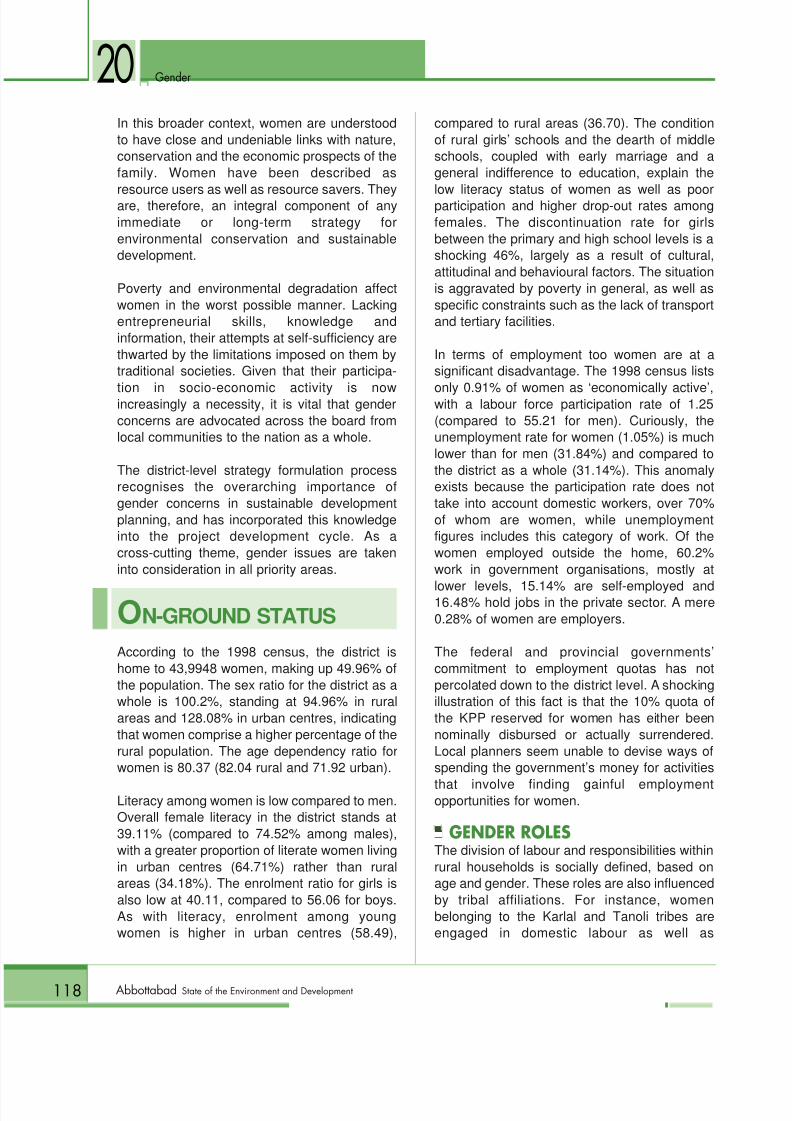
8/9/2019 Abbottabad Soed
http://slidepdf.com/reader/full/abbottabad-soed 132/150
118 Abbottabad State of the Environment and Development
Gender
In this broader context, women are understoodto have close and undeniable links with nature,conservation and the economic prospects of thefamily. Women have been described as
resource users as well as resource savers. Theyare, therefore, an integral component of anyimmediate or long-term strategy forenvironmental conservation and sustainabledevelopment.
Poverty and environmental degradation affectwomen in the worst possible manner. Lackingentrepreneurial skills, knowledge andinformation, their attempts at self-sufficiency arethwarted by the limitations imposed on them bytraditional societies. Given that their participa-
tion in socio-economic activity is nowincreasingly a necessity, it is vital that genderconcerns are advocated across the board fromlocal communities to the nation as a whole.
The district-level strategy formulation processrecognises the overarching importance ofgender concerns in sustainable developmentplanning, and has incorporated this knowledgeinto the project development cycle. As across-cutting theme, gender issues are takeninto consideration in all priority areas.
ON-GROUND STATUSAccording to the 1998 census, the district ishome to 43,9948 women, making up 49.96% ofthe population. The sex ratio for the district as awhole is 100.2%, standing at 94.96% in ruralareas and 128.08% in urban centres, indicatingthat women comprise a higher percentage of therural population. The age dependency ratio forwomen is 80.37 (82.04 rural and 71.92 urban).
Literacy among women is low compared to men.Overall female literacy in the district stands at39.11% (compared to 74.52% among males),with a greater proportion of literate women livingin urban centres (64.71%) rather than ruralareas (34.18%). The enrolment ratio for girls isalso low at 40.11, compared to 56.06 for boys.As with literacy, enrolment among youngwomen is higher in urban centres (58.49),
compared to rural areas (36.70). The conditionof rural girls’ schools and the dearth of middleschools, coupled with early marriage and ageneral indifference to education, explain the
low literacy status of women as well as poorparticipation and higher drop-out rates amongfemales. The discontinuation rate for girlsbetween the primary and high school levels is ashocking 46%, largely as a result of cultural,attitudinal and behavioural factors. The situationis aggravated by poverty in general, as well asspecific constraints such as the lack of transportand tertiary facilities.
In terms of employment too women are at asignificant disadvantage. The 1998 census lists
only 0.91% of women as ‘economically active’,with a labour force participation rate of 1.25(compared to 55.21 for men). Curiously, theunemployment rate for women (1.05%) is muchlower than for men (31.84%) and compared tothe district as a whole (31.14%). This anomalyexists because the participation rate does nottake into account domestic workers, over 70%of whom are women, while unemploymentfigures includes this category of work. Of thewomen employed outside the home, 60.2%work in government organisations, mostly at
lower levels, 15.14% are self-employed and16.48% hold jobs in the private sector. A mere0.28% of women are employers.
The federal and provincial governments’commitment to employment quotas has notpercolated down to the district level. A shockingillustration of this fact is that the 10% quota ofthe KPP reserved for women has either beennominally disbursed or actually surrendered.Local planners seem unable to devise ways ofspending the government’s money for activities
that involve finding gainful employmentopportunities for women.
snGENDER ROLESThe division of labour and responsibilities withinrural households is socially defined, based onage and gender. These roles are also influencedby tribal affiliations. For instance, womenbelonging to the Karlal and Tanoli tribes areengaged in domestic labour as well as
20
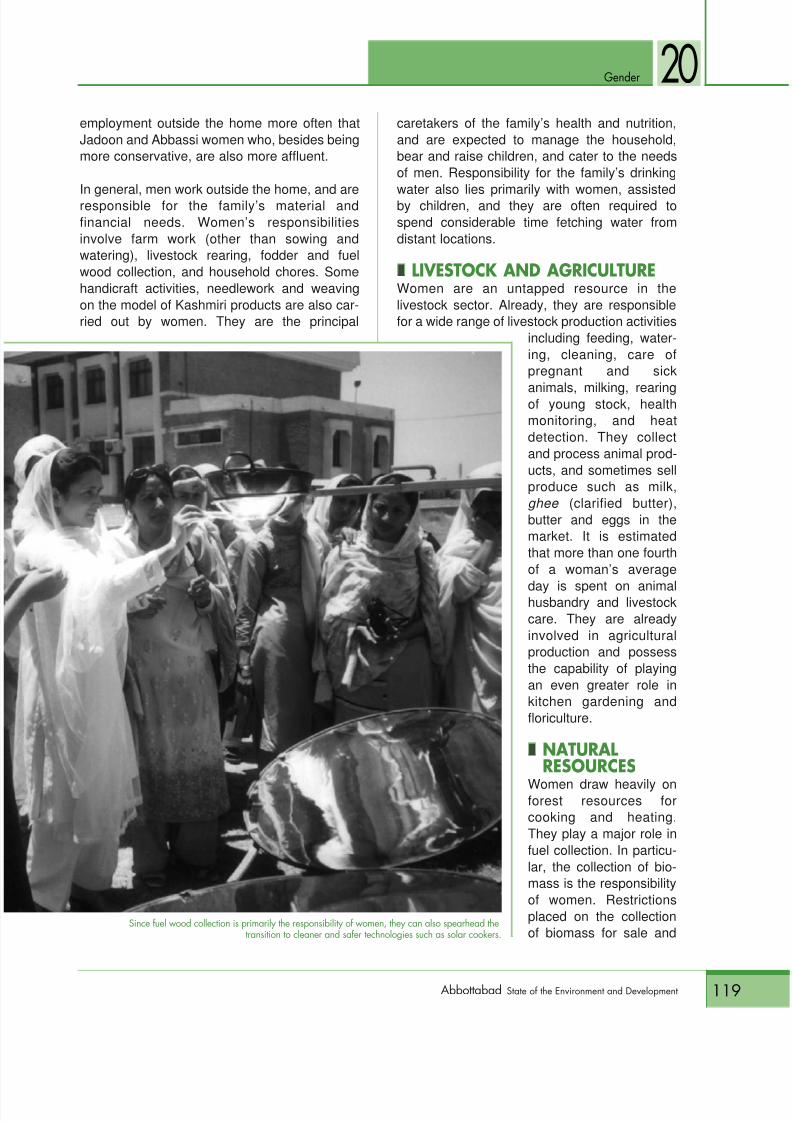
8/9/2019 Abbottabad Soed
http://slidepdf.com/reader/full/abbottabad-soed 133/150
119Abbottabad State of the Environment and Development
20Gender
employment outside the home more often thatJadoon and Abbassi women who, besides beingmore conservative, are also more affluent.
In general, men work outside the home, and areresponsible for the family’s material andfinancial needs. Women’s responsibilitiesinvolve farm work (other than sowing andwatering), livestock rearing, fodder and fuelwood collection, and household chores. Somehandicraft activities, needlework and weavingon the model of Kashmiri products are also car-ried out by women. They are the principal
caretakers of the family’s health and nutrition,and are expected to manage the household,bear and raise children, and cater to the needsof men. Responsibility for the family’s drinking
water also lies primarily with women, assistedby children, and they are often required tospend considerable time fetching water fromdistant locations.
snLIVESTOCK AND AGRICULTUREWomen are an untapped resource in thelivestock sector. Already, they are responsiblefor a wide range of livestock production activities
including feeding, water-ing, cleaning, care ofpregnant and sick
animals, milking, rearingof young stock, healthmonitoring, and heatdetection. They collectand process animal prod-ucts, and sometimes sellproduce such as milk,ghee (clarified butter),butter and eggs in themarket. It is estimatedthat more than one fourthof a woman’s average
day is spent on animalhusbandry and livestockcare. They are alreadyinvolved in agriculturalproduction and possessthe capability of playingan even greater role inkitchen gardening andfloriculture.
s
nNATURALRESOURCES
Women draw heavily onforest resources forcooking and heating.They play a major role infuel collection. In particu-lar, the collection of bio-mass is the responsibilityof women. Restrictionsplaced on the collectionof biomass for sale and
Since fuel wood collection is primarily the responsibility of women, they can also spearhead thetransition to cleaner and safer technologies such as solar cookers.
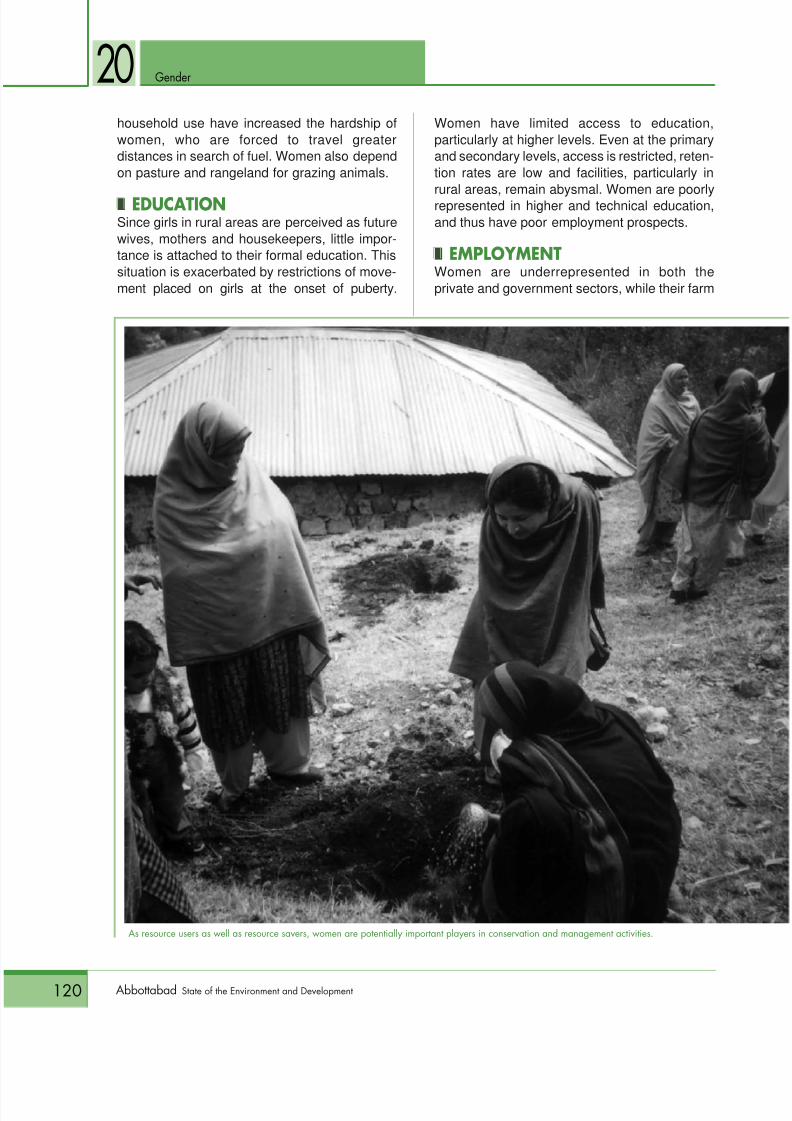
8/9/2019 Abbottabad Soed
http://slidepdf.com/reader/full/abbottabad-soed 134/150
120 Abbottabad State of the Environment and Development
Gender
household use have increased the hardship ofwomen, who are forced to travel greaterdistances in search of fuel. Women also dependon pasture and rangeland for grazing animals.
s
nEDUCATION
Since girls in rural areas are perceived as futurewives, mothers and housekeepers, little impor-tance is attached to their formal education. Thissituation is exacerbated by restrictions of move-ment placed on girls at the onset of puberty.
Women have limited access to education,particularly at higher levels. Even at the primaryand secondary levels, access is restricted, reten-tion rates are low and facilities, particularly in
rural areas, remain abysmal. Women are poorlyrepresented in higher and technical education,and thus have poor employment prospects.
snEMPLOYMENTWomen are underrepresented in both theprivate and government sectors, while their farm
20
As resource users as well as resource savers, women are potentially important players in conservation and management activities.

8/9/2019 Abbottabad Soed
http://slidepdf.com/reader/full/abbottabad-soed 135/150

8/9/2019 Abbottabad Soed
http://slidepdf.com/reader/full/abbottabad-soed 136/150
Inter-SectoralThemes
PART V
8/9/2019 Abbottabad Soed
http://slidepdf.com/reader/full/abbottabad-soed 137/150
123Abbottabad State of the Environment and Development
T he preparation of the ASSD sector papersbrought to the fore a number of cross-cuttingthemes. These were issues that went beyond
the scope of a particular sector and were important
across sectors. Such issues need to be addressedand kept in mind while considering strategic interven-tions and implementation options in all sectors.
GOVERNANCEExplicitly addressed in the SPCS, the topic of good governance isequally important for the ASSD. As a cross-cutting theme, governanceimpacts all sectors, whether it is the efficiency of natural resourcemanagement departments, the effectiveness of agriculture, livestock
and dairy extension services, or education, infrastructure, health,tourism, biodiversity and mining.
The devolution of powers to the district level and the delegation ofdecision-making in vital sectors are expected to provide impetus fordistrict-level initiatives such as the ASSD, as part of a broaderattempt to improve governance. The key issue here is that goodgovernance—through transparency, accountability and a participa-tory orientation—can promote the move towards sustainability byoptimising the performance and utilisation of existing resources.
C ross-Cutting Themes
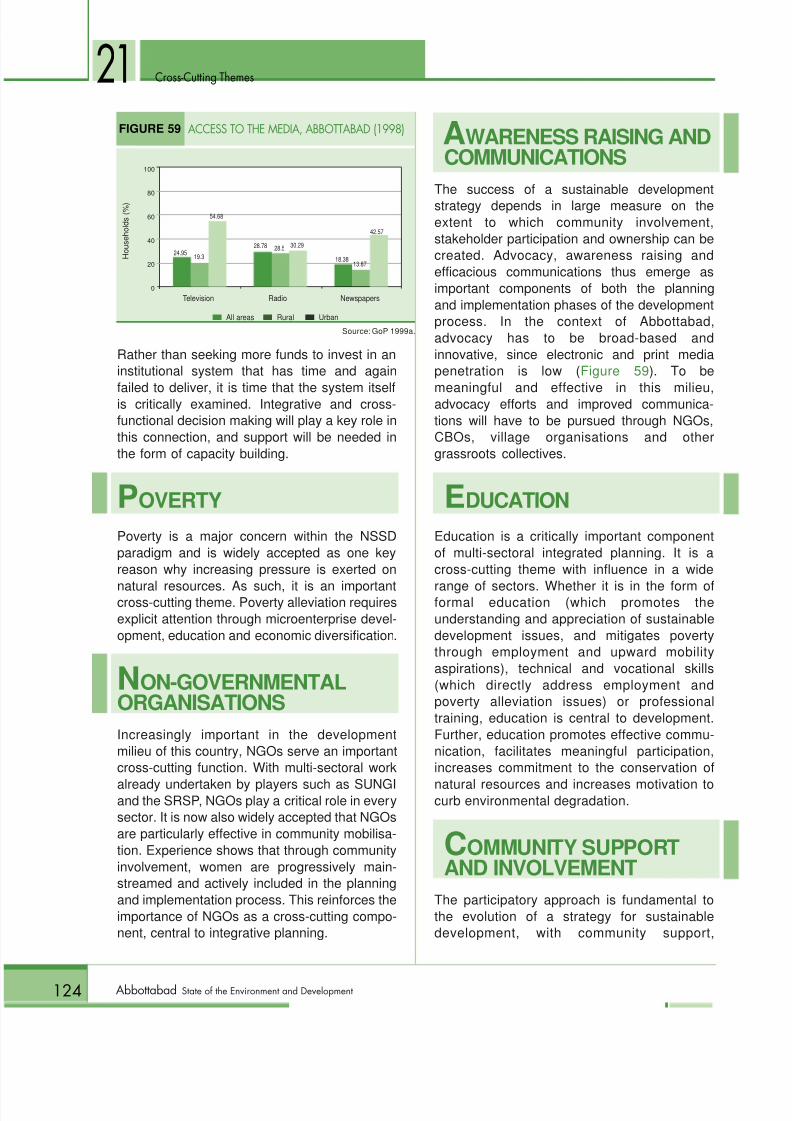
8/9/2019 Abbottabad Soed
http://slidepdf.com/reader/full/abbottabad-soed 138/150
124 Abbottabad State of the Environment and Development
21 Cross-Cutting Themes
Rather than seeking more funds to invest in aninstitutional system that has time and again
failed to deliver, it is time that the system itselfis critically examined. Integrative and cross-functional decision making will play a key role inthis connection, and support will be needed inthe form of capacity building.
P OVERTYPoverty is a major concern within the NSSDparadigm and is widely accepted as one keyreason why increasing pressure is exerted on
natural resources. As such, it is an importantcross-cutting theme. Poverty alleviation requiresexplicit attention through microenterprise devel-opment, education and economic diversification.
NON-GOVERNMENTALORGANISATIONSIncreasingly important in the developmentmilieu of this country, NGOs serve an importantcross-cutting function. With multi-sectoral work
already undertaken by players such as SUNGIand the SRSP, NGOs play a critical role in everysector. It is now also widely accepted that NGOsare particularly effective in community mobilisa-tion. Experience shows that through communityinvolvement, women are progressively main-streamed and actively included in the planningand implementation process. This reinforces theimportance of NGOs as a cross-cutting compo-nent, central to integrative planning.
AWARENESS RAISING ANDCOMMUNICATIONS
The success of a sustainable developmentstrategy depends in large measure on theextent to which community involvement,stakeholder participation and ownership can becreated. Advocacy, awareness raising andefficacious communications thus emerge asimportant components of both the planningand implementation phases of the developmentprocess. In the context of Abbottabad,advocacy has to be broad-based andinnovative, since electronic and print mediapenetration is low ( Figure 59 ). To be
meaningful and effective in this milieu,advocacy efforts and improved communica-tions will have to be pursued through NGOs,CBOs, village organisations and othergrassroots collectives.
EDUCATIONEducation is a critically important componentof multi-sectoral integrated planning. It is across-cutting theme with influence in a wide
range of sectors. Whether it is in the form offormal education (which promotes theunderstanding and appreciation of sustainabledevelopment issues, and mitigates povertythrough employment and upward mobilityaspirations), technical and vocational skills(which directly address employment andpoverty alleviation issues) or professionaltraining, education is central to development.Further, education promotes effective commu-nication, facilitates meaningful participation,increases commitment to the conservation of
natural resources and increases motivation tocurb environmental degradation.
COMMUNITY SUPPORTAND INVOLVEMENT
The participatory approach is fundamental tothe evolution of a strategy for sustainabledevelopment, with community support,
Television Radio Newspapers
FIGURE 59 ACCESS TO THE MEDIA, ABBOTTABAD (1998)
100
80
60
40
20
0
s All areas s Rural s Urban
H o u s e h o l d s
( % )
Source: GoP 1999a.
24.95 19.3
28.78 28.5 30.29
18.38
42.57
13.87
54.68
8/9/2019 Abbottabad Soed
http://slidepdf.com/reader/full/abbottabad-soed 139/150
125Abbottabad State of the Environment and Development
Cross-Cutting Themes
mobilisation and involvement emerging aspowerful and significant cross-cutting themes.It is now widely accepted that no sector canachieve discernible and sustainable progress
without the active involvement of stakeholders,beneficiaries and local communities. To thisend, the formation of village organisations andother similar collectives is already beingincorporated into development planning by anumber of agencies. The ASSD process itselfgrew out of elaborate consultative workinvolving local communities. Any effectiveimplementation of ASSD strategic interven-tions will have to take into account the cross-sectoral impact of community involvement.
P OPULATION GROWTHParticularly important in relation to the increas-ing pressure on natural resources and uncon-trolled urbanisation, population growth is amajor cross-cutting theme with relevance to allsectors.
GENDERGender is a critical issue that is central to any sus-
tainable development process. In recognition ofthis fact, the ASSD consultation process arranged15 separate meetings with women’s groups andcommissioned a sectoral paper on gender.
Gender issues are usually perceived as awomen-specific issues. In fact, gender concernsfocus on community growth and cohesiveness,where the recognition of each gender’s contribu-tion to survival and harmonious existence isemphasised, and where people co-exist throughparticipation and sharing.
OTHER THEMESOther cross-cutting themes are (i) the involve-ment of opinion leaders (social and religious) inthe consultation and ownership aspects of thestrategic planning process, and (ii) training andcapacity building at all levels.
21
8/9/2019 Abbottabad Soed
http://slidepdf.com/reader/full/abbottabad-soed 140/150
ANNEXESTechnical Terms and Concepts
Bibliography
Map of District Abbottabad
8/9/2019 Abbottabad Soed
http://slidepdf.com/reader/full/abbottabad-soed 141/150
Technical Terms and Concepts
127Abbottabad State of the Environment and Development
EMPLOYMENT ANDDEMOGRAPHICSThese definitions are taken from the Govern-ment of Pakistan’s District Census Report of Abbottabad (GoP 1999a).
Age Dependency RatioThe ratio of persons falling within the agegroups defined as ‘dependent’ (under 15 yearsof age and over 64 years) to persons defined as‘economically active’ (15–64 years).
Economically Active PopulationPersons aged 10–64 years who are engaged inwork for pay or profit (including unpaid familyhelpers); includes unemployed individualsseeking work as well as laid-off workers. Alsosee ‘labour force’.
Economically Inactive PopulationIndividuals below the age of 10 years and above64, who are not part of the labour force; includesdomestic workers students and others. Calcu-lated as a percentage of the economically activepopulation.
Employed Population by IndustryClassifies employment by major industrialgroups. Consists of five major categories and 10informal occupations grouped under the cate-
gory ‘other’, which is not adequately defined inthe census. The five major categories are:1. agriculture, forestry, hunting and fishing:
covers agriculture, livestock, hunting,forestry, logging and fishing;
2. construction: covers building and projectconstruction as well as the construction,repair and maintenance of streets, roads,highways and bridges; irrigation, flood con-trol, drainage, reclamation and hydroelec-
tric projects; and docks and communica-tions projects;
3. wholesale and retail trade, restaurants andhotels;
4. transport, storage and communications(postal service, telegraph, telephone); and
5. community, social and personal service:covers public administration and defence
service; sanitary services; social and com-munity service; recreation and cultural serv-ices; and personal and domestic services.
Employed Population byOccupationClassifies the working population on the basis of10 major occupational groups:1. legislators, senior officials and managers;2. professionals;3. technicians and associate professionals;4. clerks;
5. service workers and retail sales workers;6. skilled agricultural and fisheries workers;7. crafts and related trades;8. plant and machine operators and assem-
blers;9. ‘elementary’ occupations; includes mining,
construction, manufacturing and transport;and
10. workers not classified by occupation.
For the purposes of our analysis, we havegrouped smaller categories into a single group
(‘other’) and considered only five major cate-gories, as follows:1. Professionals: includes physics, mathemat-
ics, engineering and life sciences profes-sions; health care providers; teachers; andother professionals;
2. Plant and machine operators and assem-blers: includes plant operators, machineoperators and assemblers, mobile plantoperators, and drivers;
CONCEPTSANNEX 1: TECHNICAL TERMS AND
8/9/2019 Abbottabad Soed
http://slidepdf.com/reader/full/abbottabad-soed 142/150
8/9/2019 Abbottabad Soed
http://slidepdf.com/reader/full/abbottabad-soed 143/150
8/9/2019 Abbottabad Soed
http://slidepdf.com/reader/full/abbottabad-soed 144/150
Technical Terms and Concepts
130 Abbottabad State of the Environment and Development
Intensity of CropsIndicates the extent to which the cultivated areawas used for cropping. Represents the totalarea sown in the kharif and rabi seasons during
a given year. Calculated as:
Intensity of Land UseIndicates the extent to which cultivable land isused for agricultural production. Calculated as:
Irrigated AreaCultivated area irrigated by artificial meansduring the year under report.
Kharif Summer crop season from April to September(term used in South Asia).
Land UtilisationClassification of a farm area according to use.
Net Area SownFarm land sown at least once during the yearunder report ( kharif and rabi ), including land onwhich fruit trees may have been planted in thepast, but bear fruit in the year under report.
Rabi Winter crop season from October to March(term used in South Asia).
FORESTSAfforestationThe establishment of trees on an area that haslacked forest cover for a very long time or hasnever been forested.
AgroforestryA collective name for land use systems and prac-tices where woody perennials are integrated with
crops and/or animals on the same land manage-ment unit. Integration may be carried out eitherin terms of spatial mixture or temporal sequence.There are normally both ecological and
economic interactions between the woody andnon-woody components in agroforestry.
Cantonment Location ForestCarved out of reserved forests, these are stateowned and managed by selected state institutions.DeforestationClearing an area of forest on a permanent basisfor another use.
DegradationThe diminution of biological diversity or
productivity; reduction in grade, quality, yield.
DepletionThe gradual reduction or destruction of thesupply of natural resources.
Designated ForestAreas exclusively set aside for management asforest. Includes state managed, private andcommunal forests. The term denotes a legalcategory. Designated forests may or may notactually support forest cover.
Forest AreaIn the non-technical sense, merely that areawhich is under forest. The technical definitionincludes all of the following: forest land,whether state land or private land; staterangeland; and state land or private land that ispredominantly maintained in one or moresuccessive stands of trees, successive crops offorage, or wilderness.
Forest CoverForest stands or cover types consisting of aplant community made up of trees and otherwoody vegetation, growing more or less closelytogether.
Forest Cover TypesAs opposed to administrative types, forest typesare classified according to similar characteris-tics and species composition.
cultivated areatotal cultivable area
x 100
total cropped areatotal cultivable area
x 100
8/9/2019 Abbottabad Soed
http://slidepdf.com/reader/full/abbottabad-soed 145/150
Technical Terms and Concepts
131Abbottabad State of the Environment and Development
Forest LandActual area within designated forests supportingforest cover.
Guzara ForestPrivately-owned forests close to populatedareas, managed through state intervention andintended to meet local community requirementsfor timber, fuel wood and grazing.
Mazrooa ForestPrivately-owned forest that are un-demarcated,non-designated and unplanned; excludes areasalready designated as guzara forest.
Open
Term used to describe forest density. Openforest is an area where the tree canopy is openand trees are sporadic, as opposed to compactor dense growth.
Reserved ForestState-owned forests far from populated areas,intended to cater to the state’s requirements.
Seigniorage FeeA portion of the sales proceeds from reservedforests adjacent to guzara forests to which
guzara owners are entitled.
SilvicultureThe theory and practise of controlling theestablishment, growth, composition, health andquality of forests and woodlands. Silviculture
entails the manipulation of forest and woodlandvegetation to meet the diverse needs andvalues of landowners and local communities.
LIVESTOCK AND FODDER
Animal UnitCalculated on the basis of different combina-tions for various animals. For cows, 1 animalunit = one mature cow with calf (a combinedweight of approximately 455 kg).
Dry MatterUsed to calculate feed requirement per animalunit. For a well-nourished grazing animal, thefeeding requirement amounts to 24 lbs. or 10.9kg of dry matter per day.
RangelandAny land supporting vegetation suitable forwildlife or domestic livestock grazing, includinggrasslands, woodlands, shrub lands and forestlands.
8/9/2019 Abbottabad Soed
http://slidepdf.com/reader/full/abbottabad-soed 146/150
Bibliography
132 Abbottabad State of the Environment and Development
Ahmed, Nazir. 1963. Fishery Gazetteer of West Pakistan . Lahore: Government Printing Press.——— . 1968. Preliminary Report on the Survey of Fresh Water Fishery Resources . Lahore:
Government Printing Press.
Asian Development Bank (ADB). 2001. “Project completion report on the NWFP Barani AreaDevelopment Project.” Unpublished.
Aslam, M.A. 2000. Scoping Study for IUCN’s Possible Involvement Within the Climate ChangeSector in South/South East Asia . Bangkok: IUCN, Asia Region.
Cyan, M.R. 2000. “Crafting the hinges of a decentralise state. Institutional and policy arrangementsfor the intergovernmental interface between the second and third tiers.” Peshawar: Planning,Environment and Development Department. Unpublished internal research paper.
Frontier Education Foundation (FEF). 1999. Educational Institutions in Private Sector of the NWFP .Peshawar: FEF.
Government of Balochistan and IUCN Pakistan. 2000. Balochistan Conservation Strategy . Karachi:IUCN.
Government of the North-West Frontier Province (GoNWFP). 1999. NWFP Development Statistics:1999 . Peshawar: Bureau of Statistics, Planning and Development Department, GoNWFP.
——— . 2000. Annual Schools Census (1999–2000) . Peshawar: Directorate of Primary Education,Education Department, GoNWFP.
——— . 2001a. Agriculture Statistics, NWFP for 1999–2000 . Peshawar: Agriculture Statistics Wing, Agriculture (Extension) Department, GoNWFP.
——— . 2001b. Half Decade Review 2000: District Wise Statistical Analysis of NWFP (1995–96 to2000) . Peshawar: Bureau of Statistics, GoNWFP.
GoNWFP and IUCN. 1996. Sarhad Provincial Conservation Strategy . Peshawar: IUCN.
——— . 2004. Chitral—An Integrated Development Vision (Chitral Conservation Strategy) .Karachi: IUCNP and GoNWFP.
GoNWFP and A. Khan. 1999. People’s Perception of Good Governance in Abbottabad and BannuDistricts of NWFP, Pakistan. Peshawar: Department of Geography, Urban and RegionalPlanning.
Government of Pakistan (GoP). 1999a. District Census Report of Abbottabad . Islamabad:Population Census Organisation, Statistical Division, GoP.
——— . 1999b. Lodging Industry in Pakistan . Islamabad: Tourism Division, GoP.——— . 2000a. Devolution Plan . Islamabad: National Reconstruction Bureau.
——— . 2001a. Environmental Challenges and Responses . Islamabad: Ministry of Environment,Local Government and Rural Development, GoP.
——— . 2001b. Interim-Poverty Reduction Strategy Paper . Islamabad: PRSP Secretariat,Ministry of Finance.
——— . 2003. Poverty Reduction Strategy Paper . Islamabad: PRSP Secretariat, Ministry of Finance.
ANNEX 2: BIBLIOGRAPHY
8/9/2019 Abbottabad Soed
http://slidepdf.com/reader/full/abbottabad-soed 147/150
8/9/2019 Abbottabad Soed
http://slidepdf.com/reader/full/abbottabad-soed 148/150
Bibliography
134 Abbottabad State of the Environment and Development
SUNGI Development Foundation. 2000. SUNGI Baseline Report 1998 . Abbottabad: Research,Monitoring and Evaluation Programme, SUNGI.
United Nations (UN). 1992a. Agenda 21: The United Nations Programme of Action from Rio. NewYork: United Nations Department of Public Information.
——— . 1992b. Convention on Biological Diversity . Rio de Janeiro, 5 June 1992.
——— . 1995. Beijing Declaration and Platform for Action . Fourth World Conference on Women, 15September 1995.
United Nations Development Programme (UNDP). 1996. “Governance programme.” Islamabad.
World Bank (WB). 2000. World Development Indicators . Washington DC: WB.
World Travel and Tourism Council (WTTC), World Tourism Organization and Earth Council. 1996. Agenda 21 for the Travel and Tourism Industry: Towards Environmentally SustainableTourism . Madrid: World Tourism Organization.
S ECTOR PAPERS Agha, T. “Gender and Environment.” Azeem, T. “Drinking Water.”Elahi, Z. “Poverty Alleviation and Enterprise Development.”Gul, H. “Energy.”Haye, A. “Waste Water and Solid Waste Management.”Hussain, S. “Forests and Watersheds.”Iqbal, M. “Education.”Khan, B. “Infrastructure, Roads and Communications.”Khan, J.N. “Ecotourism.”Khan, K. “Fisheries.”Khan, S. “Health and Population.”Khan, S.T.H. “Agriculture and Horticulture.”Khan, M. “Livestock and Poultry.”Mansoor, M. “Mining.”Rafiq, S. “Grazing Lands and Fodder Reserves.”Shah, A.A. “Culture.”Zaman, S. “Biodiversity, Parks and Protected Areas.”
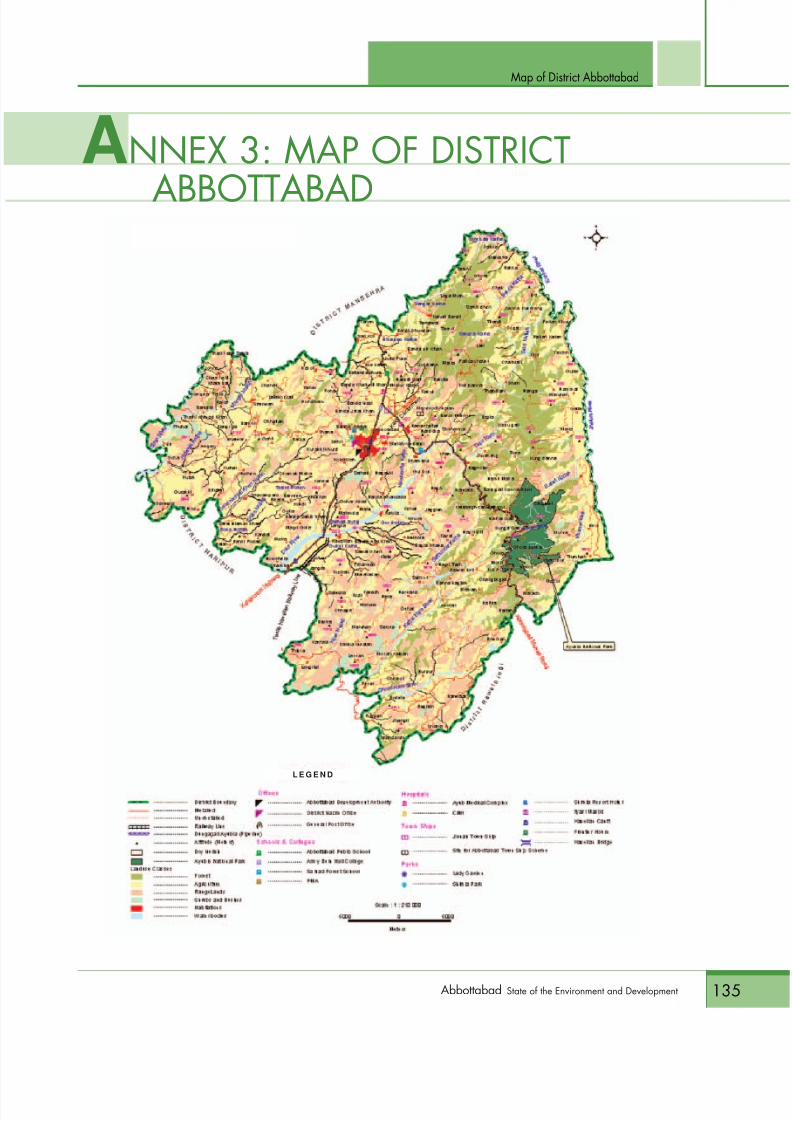
8/9/2019 Abbottabad Soed
http://slidepdf.com/reader/full/abbottabad-soed 149/150
Map of District Abbottabad
135Abbottabad State of the Environment and Development
L E G E N D
ANNEX 3: MAP OF DISTRICTABBOTTABAD
8/9/2019 Abbottabad Soed
http://slidepdf.com/reader/full/abbottabad-soed 150/150