Embed Size (px)
Citation preview
econstor www.econstor.eu
Der Open-Access-Publikationsserver der ZBW – Leibniz-Informationszentrum WirtschaftThe Open Access Publication Server of the ZBW – Leibniz Information Centre for Economics
Standard-Nutzungsbedingungen:
Die Dokumente auf EconStor dürfen zu eigenen wissenschaftlichenZwecken und zum Privatgebrauch gespeichert und kopiert werden.
Sie dürfen die Dokumente nicht für öffentliche oder kommerzielleZwecke vervielfältigen, öffentlich ausstellen, öffentlich zugänglichmachen, vertreiben oder anderweitig nutzen.
Sofern die Verfasser die Dokumente unter Open-Content-Lizenzen(insbesondere CC-Lizenzen) zur Verfügung gestellt haben sollten,gelten abweichend von diesen Nutzungsbedingungen die in der dortgenannten Lizenz gewährten Nutzungsrechte.
Terms of use:
Documents in EconStor may be saved and copied for yourpersonal and scholarly purposes.
You are not to copy documents for public or commercialpurposes, to exhibit the documents publicly, to make thempublicly available on the internet, or to distribute or otherwiseuse the documents in public.
If the documents have been made available under an OpenContent Licence (especially Creative Commons Licences), youmay exercise further usage rights as specified in the indicatedlicence.
zbw Leibniz-Informationszentrum WirtschaftLeibniz Information Centre for Economics
Nguefack-Tsague, Georges; Klasen, Stephan; Zucchini, Walter
Working Paper
On weighting the components of the HumanDevelopment Index: A statistical justification
Courant Research Centre: Poverty, Equity and Growth - Discussion Papers, No. 37
Provided in Cooperation with:Courant Research Centre 'Poverty, Equity and Growth in Developing andTransition Countries', University of Göttingen
Suggested Citation: Nguefack-Tsague, Georges; Klasen, Stephan; Zucchini, Walter (2010) : Onweighting the components of the Human Development Index: A statistical justification, CourantResearch Centre: Poverty, Equity and Growth - Discussion Papers, No. 37
This Version is available at:http://hdl.handle.net/10419/90541
Courant Research Centre ‘Poverty, Equity and Growth in Developing and Transition Countries: Statistical Methods and
Empirical Analysis’ Georg-August-Universität Göttingen
(founded in 1737)
No. 37
On weighting the components of the Human Development Index: A statistical justification
Georges Nguefack-Tsague, Stephan Klasen,
Walter Zucchini
May 2010
Discussion Papers
Platz der Göttinger Sieben 3 ⋅ 37073 Goettingen ⋅ Germany Phone: +49-(0)551-3914066 ⋅ Fax: +49-(0)551-3914059
Email: [email protected] Web: http://www.uni-goettingen.de/crc-peg
1
On weighting the components of the Human Development Index: A statistical justification
Georges Nguefack-Tsague University of Yaoundé I, Cameroon Stephan Klasen and Walter Zucchini
Courant Research Center ‘Poverty, equity, and growth in developing and transition countries’
University of Göttingen, Germany
May, 2010 A version of the paper will appear soon in the Journal of Human Development and
Capabilities.
Abstract The Human Development Index (HDI) published in the Human Development Report (HDR) of the United Nations Development Program is calculated as a simple average of the Life Expectancy Index (LEI), the Education Index (EI) and the Gross Domestic Product Index (GDPI). This paper provides statistical support for the use of this seemingly arbitrary equal weighting of the three components by treating human development as a latent concept imperfectly captured by its three component indices. We show that a principal component analysis (PCA) based on the correlation matrix of the components leads to practically the same weights. Specifically we show that, for the period 1975 to 2005, the first principal component accounts for between 78% and 90% of the total variability in the data, and that its coefficients are positive and nearly equal. By normalizing the coefficients, the simple average weighting (1/3, 1/3, 1/3) scheme is obtained. The ranks of countries obtained using the PCA weightings are very similar to those based on the HDI. An advantage of the simple equal weighting is that one can define a simple index to measure the balance of a country's development, given its HDI which we show below. Keywords: Human Development Index, Human Development Report, United Nations Development Program, principal component analysis, correlation matrix,. JEL Codes: I31, C43, O1 Acknowledgements We thank Mark McGillivray, Tomson Ogwang and three referees for helpful comments on earlier versions of this paper.
2
Introduction It is now widely accepted that gross domestic product (GDP) or gross national income (GNI) per capita is an inadequate indicator of the development level of a country as many important dimensions of well-being are imperfectly captured by it (e.g. Sen, 1998 , UNDP, 1990). In its annual Human Development Report (HDR) the United Nations Development Program (UNDP) publishes the Human Development Index (HDI), which is a composite index for human development. Based loosely on Sen’s capability approach, the HDI quantifies the average achievement of a country in three dimensions, namely a long and healthy life, measured by the Life Expectancy Index (LEI); knowledge, measured by an Education Index (EI); and a decent standard of living, measured by the GDP Index (GDPI), and is meant to capture those dimensions of well-being that are closely correlated with income (such as housing, nutrition, clothing, etc). Each variable involved in each index is normalized to the range 0-1 by subtracting a pre-defined minimum value from the score for the country and dividing this by the difference between a pre-defined maximum and minimum values. For the standard of living indicator, the logarithm of adjusted GDP per capita (PPP US$) is used to capture the declining marginal human development relevance of income HDI is a simple average of the three indices. Details for each index can be found in the technical note of the yearly Human Development Report (e.g. UNDP, 2008). The HDI, which was introduced in the 1990’s, has been revised several times. It shares some features of some other well-being indicators, such as the Physical Quality of Life Index (PQLI) introduced by Morris (1979) and analyzed by Larson and Wilford (1979), which also combines three social indicators (infant mortality, adult literacy and life expectation). Surveys of the literature on the HDI are given in Kelly (1991), Anand and Sen (1992, 2000), and McGillivray and White (1993). The HDI, being based on only three aspects of well-being, is not a measure capturing all aspects of human development, and its deficiencies have been widely discussed in the literature (e.g. McGillivray (1991), Trabold-Nubler (1991), Streeten, P. (1995), Morse (2003)). It does not take into account other dimensions of well-being, such as security, political participation and human rights (Anand and Sen (1992, 2000), Ranis et al. (2006)), or the distribution of human development within a country (Sagar and Najam, 1998, 1999, Grimm et al. 2008).1
Another criticism of the HDI is that it uses an essentially arbitrary weighting scheme of the three component indices, namely a simple average (Kelly (1991), Noorbakhsh, 1998; Srinivasan (1994), Ravallion (1997), Grimm et al. (2008)). Some also argue that the implicit trade-offs implied by these weights are not transparent and may imply questionable value judgments (e.g. Ravallion, 1997; Decancq and Lugo, 2008). Clark and McGillivray (2007) propose allowing the components and weights to vary across countries, to take account of the preference of local people or policies makers. Many other weighting schemes are of course possible, but none have emerged as clear favourites and the UNDP has stuck to the equal weighting rule. Despite these criticisms, there are several possible justifications for such an equal weighting. Haq (2003) argues that there is no a priori rationale for assigning different weights to the constituent indices, and recommends the use of equal weights on the principle of insufficient reason to discriminate among the indices. A related argument is that the equal weighting rule makes the indicator particularly straight-forward and easy to communicate, which has been an important goal of the promoters of the HDI.2
1 To take into account inequality within countries in its three dimensions, Grimm et al. (2008) propose and apply a method for computing the three component indices and the HDI for each quintile of the income distribution.
Another justification is proposed by Chowdhury and Squire (2006). Based on the responses in an opinion survey conducted electronically among researchers from 60 countries about preferred weights for the HDI they concluded that “results of the opinion survey suggest that a simple scheme based on equal weights is not only convenient but also consistent with the views of experts”.
2 See UNDP (2008) for a short discussion and robustness analysis of this equal weighting rule.
3
A last strand of justification for the equal weighting has been based on statistical techniques such as principal component analyses (PCA), a data reduction technique that exploits the correlation between different indicators to create new latent variables. Ogwang (1994) and Ogwang and Abdou (2003) justify the HDR’s equally weight scheme by PCA (based on the covariance matrix) with 1997 data. Noorbackhsh (1998) similarly considers PCA using data for 1992 as one option for deriving weights for the components in the HDI. The use of PCA and associated techniques to derive an index is not new; Ram (1982) suggested its use to derive weights for the components of the Physical Quality of Life Index (which can, in part, be seen as a precursor to the HDI), augmented by GDP per capita; Del Valle Irala and Puerta Gil (1999), for example, proposed a weighted principal components analysis (WPCA) for measuring human development; McGillivray (2005) used PCA to generate a non-income well-being index based on a range of well-being indicators to study which countries perform better in the first principal component than predicted by per-capita incomes. Maasoumi and Nickelsburg (1988) applied multivariate techniques for measuring inequality for Michigan data. Klasen (2000) applied PCA for measuring poverty using South Africa data. Following Filmer and Pritchett (2001), it is now common to use PCA to generate an income proxy using asset variables in the Demographic and Health Surveys.3
Of course, such a purely statistical approach also requires a substantive justification, as noted by several authors (e.g. Brandolini, 2007).4 The justification that can be invoked for using PCA for setting the weights is that "human development" is an inherently latent concept that cannot easily be captured by a single indicator. Instead, there are several indicators, such as education, longevity, and income, that express important aspects of this latent concept, but none of them fully captures it on its own. As a result, it is at the intersection of these indicators that the concept of human development must be found. Human development, in this view, is therefore about the combination of achievements in the dimension indices. The first principal component, which is designed to optimally5
exploit the correlation between the highly correlated variables, provides such a one-dimensional summary. The weights thus derived measure the contribution of each indicator to that latent concept. Following this line of argument, understanding the statistical correlation between the components of the HDI and using it to derive the weights for the component index is of inherent importance as it helps to recover the latent human development concept. We will argue below that this will also allow us to define a measure of evenness in human development which quantifies the extent to which human development is balanced in its three components.
This conception of human development differs from viewing the components of the HDI as independently important dimensions of human development. In the latter view, each dimension should have a normatively derived weight that is entirely independent of the correlation with other dimensions. If, for example, the education component happened to be entirely uncorrelated to the two other dimensions of the HDI, the latent concept approach would assign zero weight to this component while a multidimensional human development concept would assign a
3 Related work includes Decancq, Decoster, and Schokkaert (2007) who study the trend in standard of living, health and education between 1975 and 2000 and stress on the trade-offs between the three dimensions. Brandolini (2007) considers the weighting structure and functioning forms of various indices related to well being with an application to some European countries. Kirshnakumar and Nadar (2008) provide an overview of statistical methods of deriving weights based on multivariate statistics, including PCA. On the use PCA to generate an income proxy, see also Kolenikov and Angeles (2009). 4 Brandolini (2007) states that “we should be cautious in entrusting a mathematical algorithm with a fundamentally normative task.” Decancq, Decoster, and Schoekart (2007) make a related argument. We thank a referee for pointing us to these particular sources. 5 The sense in which "optimal" is meant will be outlined later. Other statistical models, such as factor analysis (FA) could be applied as well. However, we rely on PCA because this is the most common method used to generate latent well-being measures, including applications to the HDI.
4
normatively derived weight, regardless of its correlation. While the multidimensional approach to human development clearly has merits, we argue that treating human development as a latent concept equally has merits and has some advantages over the alternative. Conceptually, one might argue that the essence of human development is about the complementary achievements in its components. Thus a component that is entirely uncorrelated with the other components (as in our example) does not provide this complementarity and thus should therefore not carry a weight. How important should education be as a component of human development if it does not at all relate to improved health and improved other functionings proxied by the income component? Is it worth the same for a person (or country) where longevity is very low as to one where it is very high? Isn’t human development really about the intersection of complementary achievements in education, health, and income-related functionings? Thus we argue that even in a case of an uncorrelated component (or one with low correlation), our approach might be relevant in a latent approach to human development; provided that a test for dimension reduction indicates that it is possible.6
Empirically, however, we live in a world where the three components considered in the HDI are very highly positively correlated and, furthermore, the correlations have remained consistently high over a period of 30 years. As a result, most of the information the components contain can be summarized in a single dimension which thus empirically captures the latent human development concept well.
That the PCA weights are almost equal year after year is a consequence of the fact that the pairwise correlations between components are similar, which, taken together with the fact that they are high is consistent with our argument that these indices can be regarded as manifestations in different dimensions of an underlying latent variable.7
An advantage of the current HDI weighting is that it also leads to a very simple Balance of Development Index (BODI) which measures, for a given HDI, whether the three component indices are equal (BODI=1), as different as it is possible for them to be (BODI=0), or between these extremes. This we will illustrate below. In this paper we are therefore not concerned with the computation of the three HDI component indices, or with the issue of whether they provide a sufficiently comprehensive coverage of the diverse constituents of well-being. We will focus instead on the weighting of these three component indices, i.e. the use of equal weights. The UNDP argues that the simple average scheme is used, not just for simplicity, but because the three dimensions are equally important. We investigate whether this weighting is also supported from a purely statistical point of view as an appropriate procedure to capture the latent concept of human development. The approach used in this paper differs from the others that also used PCA to derive weights for the HDI in several ways. First, we will formally examine whether a dimension-reduction technique such as PCA is appropriate from a statistical point of view. Second, our method to justify HDR weighting scheme relies on data not only from one point in time, but across years (1975-
6 If the test for dimension reduction (see below) indicated that such a dimension reduction is not possible (which would likely be the case if one component was entirely uncorrelated with the others) and one believed that, for conceptual reasons, that component was an essential dimension of human development (and thus we are back to the dimension view of human development), PCA would indeed be an inappropriate procedure. But as we argue above, this is empirically just not the case. 7 One may argue, in addition, that human development is really about more than the three components of the HDI which, for pragmatic reasons, now make up this measure. The three are just place-holders of a much larger set of relevant (and closely correlated) components of the latent concept of human development. Thus a PCA to derive the weights for this much larger latent concept is entirely appropriate as long as the left-out dimensions would also be correlated with the included ones (which is highly likely).
5
2005). Third, we will base the PCA on the correlation matrix rather than on the covariance matrix; we argue that this former is more appropriate in this context and shows better results. In fact, we show that the country ranks obtained by using the first principal component scores based on the correlation matrix are in excellent agreement (as evidenced by Kendall’s tau) with those given in the HDR. Fourth, we will explicitly examine country-level unevenness in the components that make up the HDI using the Balance of Development Index (BODI). The rest of this paper is organized as follows. Section 2 presents the methodology and results. Discussions and summary are provided in Section 3.. 2- Methodology and Results We use data for the years 1975-2005. Data from 1975-1995 were obtained from Human Development Report Office (HDRO) and are calculated using a consistent method that has been used since 1999. For data for years 1997-2005, there is a two-year time lag between the reference date of most data and the release date of the HDR, and so these data were obtained from the HDRs released in the years 1999-2007. This same methodology was used throughout. PCA is a technique designed to reduce the dimensionality of multivariate observations with minimal loss of information. The first principal component is the linear combination of the original variables that has the largest variance; the second principal component has the largest variance among all linear combinations that are uncorrelated with the first principal component, and so on. In general, there are as many principal components as original variables. However, it is often the case that the first few principal components explain a large percentage of the variation in the original data. In cases where the variables are all highly correlated a single principal component provides an adequate summary of the original data. If the correlations are all high, positive, and if the variables measure different aspects of a related concept, such as "intelligence", “quality of life”, or "human development", it is reasonable to interpret the first principal component as a measure of the latent concept. In our case this effectively reduces our three-dimensional data to a one-dimensional measure that can be used to rank countries. Provided that its coefficients are positive PCA gives estimates of the optimal weights for each of the three original variables, in our case the three component indices. There are two versions of PCA, one derived from the covariance matrix and the other on the correlation matrix, and these lead to different weights for the principal components. It is not always clear which version is more appropriate in a particular application. Correlation-based PCA is usually advised in the literature and is used as default in most standard statistical software packages. The main reason for this is the fact that the weights resulting from a correlation-based PCA remain unchanged if the unit used to measure one of the original variables is changed, whereas the weights change if covariance-based PCA is applied. In others words, a correlation-based CPA is preferable if we wish the results to be invariant to possible multiplications of the original data. This is particularly true when, as is the case here, the dimension indices used are indeed linear transformations of the original variables. So if, say, the denominator were to change in a particular component (e.g. because the gap between the maximum and the minimum performance were reset) we would prefer a method that is not sensitive to such change8
8 We thank a referee for pointing this out to us. See also Noorbakhsh (1998) for a discussion of the ‘implicit’ weights related to the minima and maxima and ways to address this.
. For more detailed discussions about the choice of approach see, e.g., Everitt and Dunn (1992, 2001), Khattree and Naik (2000) and Jollife (1986, 2002). A drawback of correlation-based PCA is that statistical
6
inference is more complex than in the covariance-based PCA9
. (See e.g. Khattree and Naik, 2000, p.37). However, since we are not concerned with inference on eigenvalues or eigenvectors, and since the variances of the indices are slightly different (see Tables 1a, 1b) it seems appropriate here to perform correlation-based PCA.
Another issue to take into account in performing PCA is the selection of the number of components. A popular method, applicable to both covariance- and correlation-based PCA, is to choose the minimum number of principal components that explain a specified percentage of the total variation in the data, for example at least 75% (e.g. Krzanowski, 1990). Other selection methods are described e.g. in Kaiser (1960), Jolliffe (1972) and Marshall and Olkin (1979). It turns out that all the methods proposed in these papers would give the same results in our case, i.e. suggest to just use the first principal component. The final step in PCA is the interpretation of the chosen components. Since the derived components are linear combinations of the original variables, one can surmise that these combinations carry some concrete interpretations (Krzanowski, 1990). In our case, we argue that the first principal component captures the latent concept human development. When for a selected component (e.g. first principal component), its coefficients are all positive (as in our case here), one can recover the weights or the contribution of each indicator to this latent concept.10
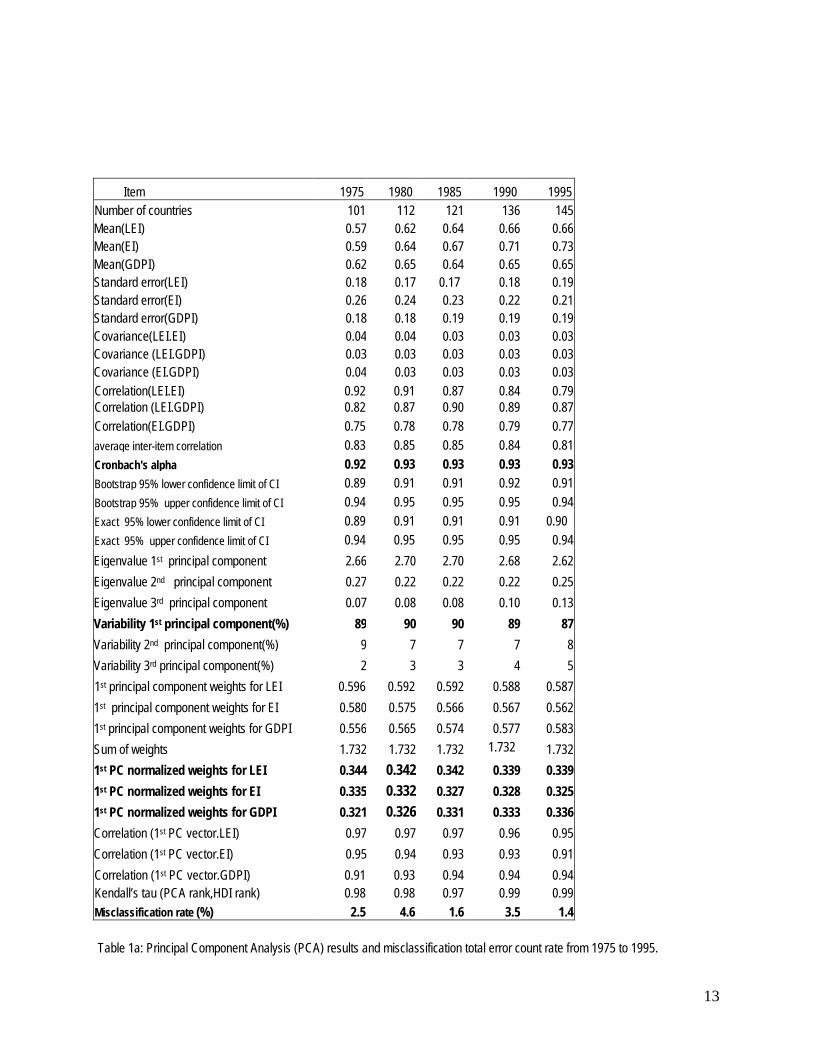
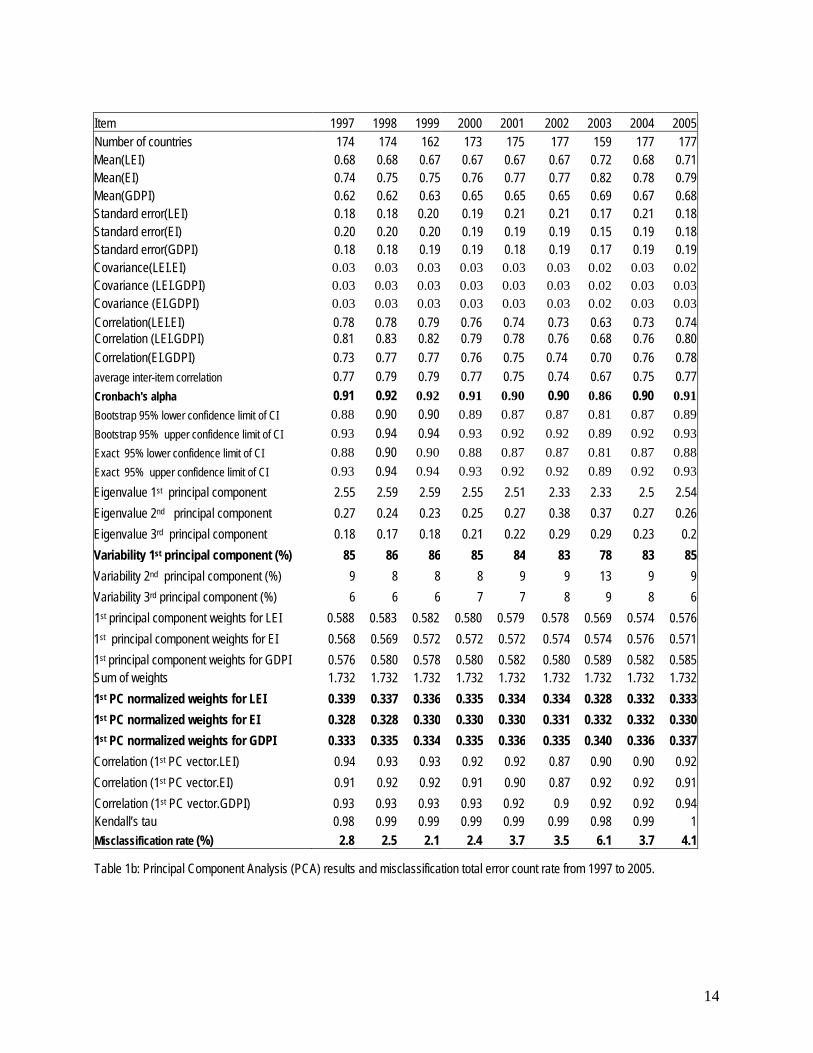
Irrespective of the approach used for weights one should first check data whether dimension reduction is appropriate, though this is seldom done in practice. In our case we propose to regard human development as a latent concept that is imperfectly measured by LEI, EI and GDPI. This is analogous to latent constructs such as "size", or "quality of life" which, for certain purposes, are also quantified by means of one-dimensional summaries of various aspects of the construct of interest. One can check the internal consistency of the indices (LEI, EI and GDPI) using a formal test (Allen and Yen, 2002). A popular measure of internal consistency is Cronbach's alpha (Cronbach, 1951) which measures how well a set of variables can be reduced to lower dimension, usually a one-dimensional latent construct (Krus and Helmstadter, 1987). The maximum achievable value of the coefficient is 1 and, as a rule of thumb in social science research, a Cronbach's alpha of 0.70 or higher is regarded as being large enough to justify the application of a dimension reducing technique such as PCA. Procedures for making inferences (e.g. the exact confidence intervals) on the Cronbach's alpha can be found in Feldt et al. (1987). As is shown in Tables 1a and 1b Cronbach's alpha for the three HDI components lie between 0.86 and 0.93, i.e. well above 0.7, which thus justifies dimension reduction. The percentage variance accounted for by the first principal component has remained at a high level (between 78% and 90%) over the entire 31-year period 1975-2005; the average, over these years was 85.7% of the variance. The first principal component explains a high percentage of the variability in the data in all years. The lowest percentage (78%) occurs in 2003; the percentages for the other years range between 83% and 90%. Thus the first principal component score provides a fairly accurate one-dimensional summary of the overall human development of the country, and can be used to rank countries (which it is not possible to do using all three component indices separately.) Principal component scores, and the resulting country ranks were computed for each year shown in Tables 1a and 1b. Altogether this suggests that dimension reduction using PCA, and relying on just the first principal component to capture the latent concept of ‘human development’ is justified (see Tables 1a, 1b; see also McGillivray, 2005).
9 Ogasawara (2004) provides asymptotic standard errors for component loadings derived from the correlation matrix, though the multivariate normality assumption made in the approach is difficult to verify in practice. 10 A drawback of PCA is that it difficult to assess the precision of the results. Bootstrap methods have been applied in the context of PCA by Efron and Tibshirani (1991, 1993).
7
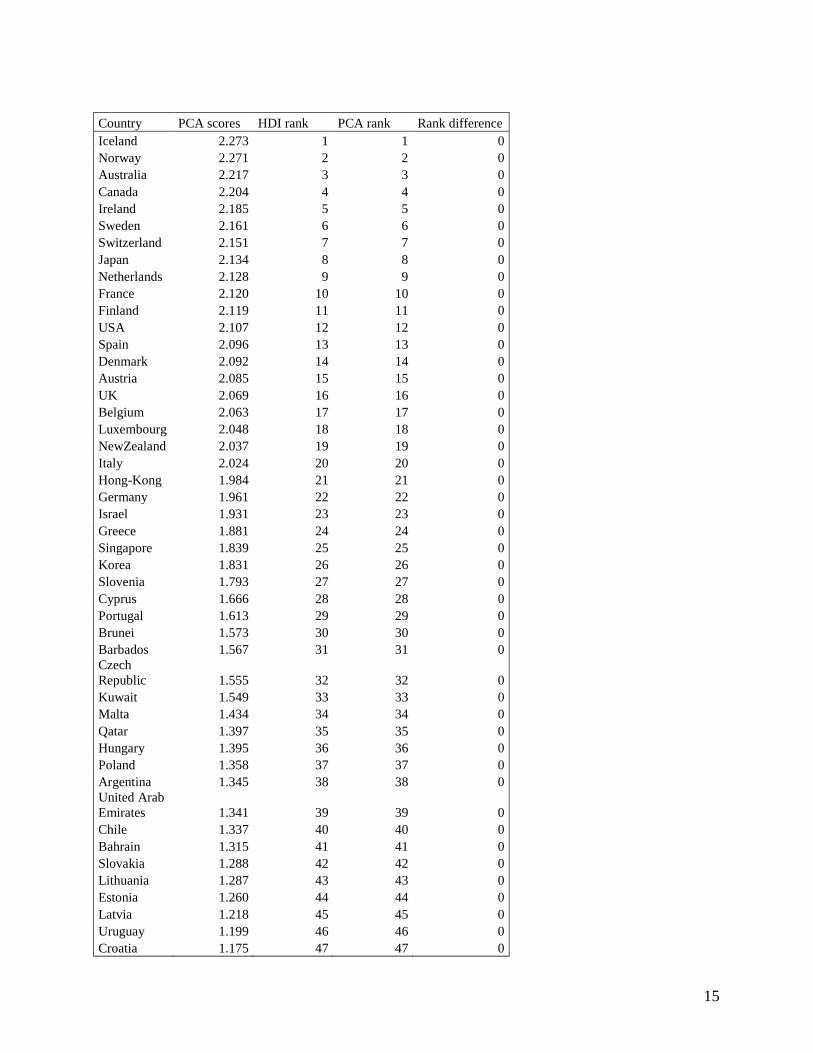
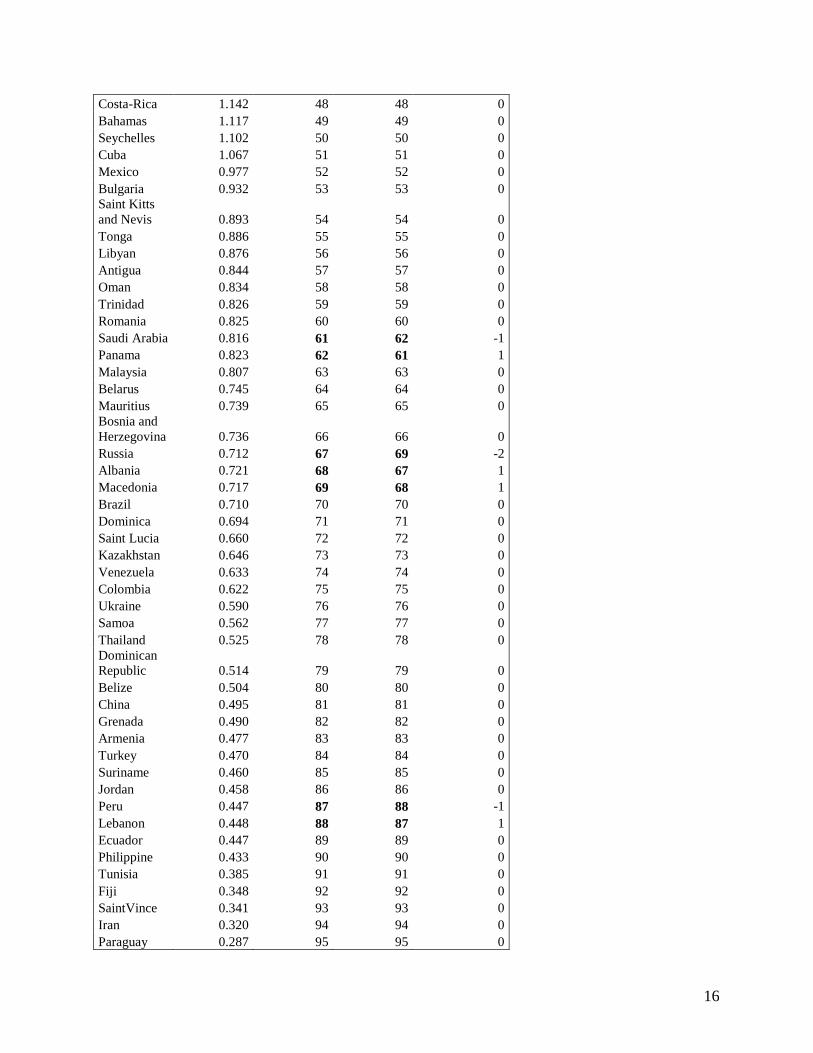
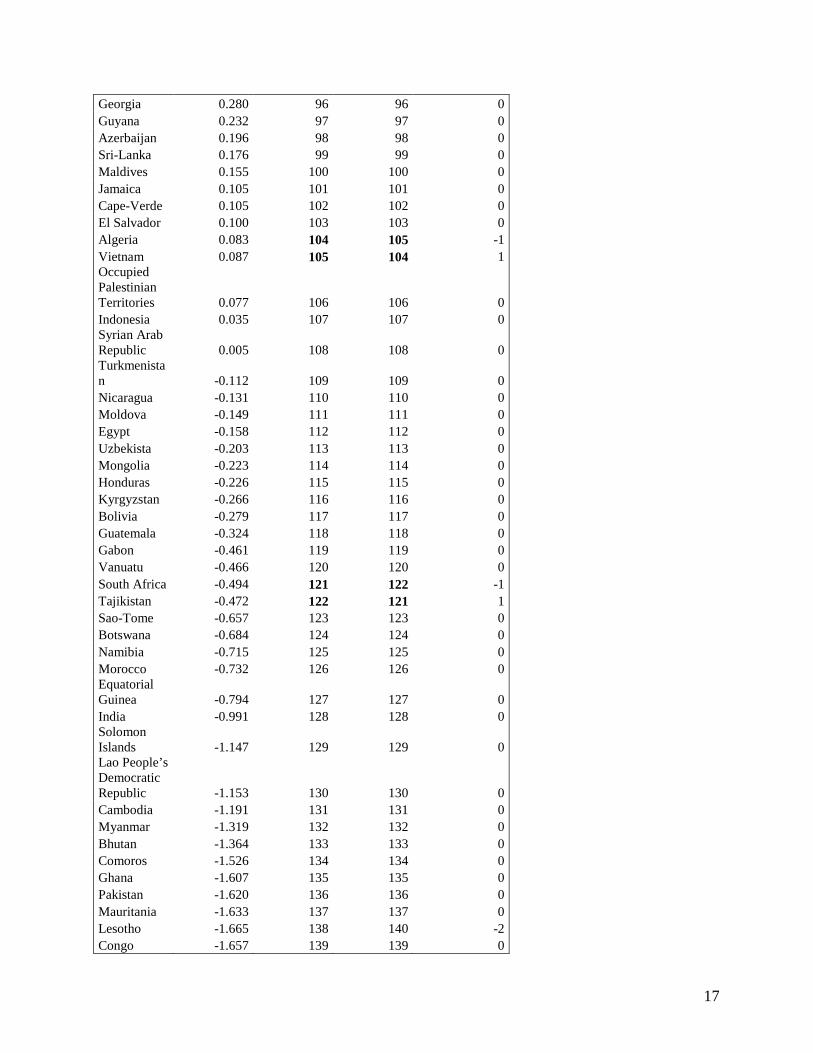
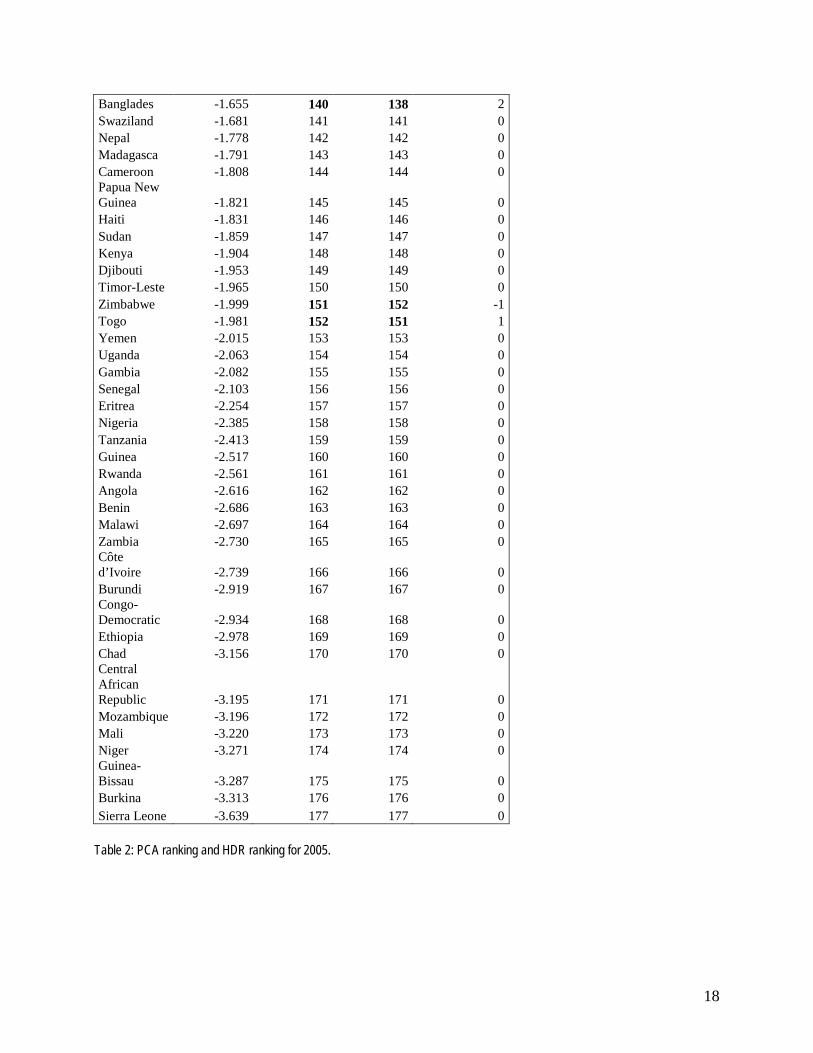
The results for 2005 using PCA are shown in Table 2 together with the HDR ranks that are based on the HDI (using equal weights). For example both methods rank Iceland highest; its first principal component score is 2.273 and its HDI is 0.968. The rankings are identical for most countries; the few differences that do occur are small. As an objective measure of the closeness of the two rankings we used Kendall’s tau rank correlation coefficient, which takes on the value 1 if the two rankings agree perfectly. The values of tau ranged from 0.97 to 1.00 (Tables 1a, 1b), thereby formally confirming that the results derived by PCA using the correlation matrix and the first principal component produce a nearly identical ranking to equal weights used by the HDI. This close correspondence is not so surprising as we also note (Tables 1a,1b) that the normalized weights of the first principal components are very close to 1/3, 1/3, 1/3 in all years; for example, those for 2005, are 0.333, 0.330, 0.337.11
These statistics therefore provide an empirical justification for the UNDP's use of a simple average to compute the HDI to capture the latent concept of human development; in effect this is equivalent to applying the normalized weights for the first principal component of a correlation-based PCA.
A question arises as to why it is the case that the PCA based on the correlation matrix generates virtually equal weights. This is related to the correlation between the components. The pairwise correlations between the three indices LEI, EI and GDPI are not only high but are also quite similar. It can be shown that, if these correlations were all exactly equal, then the weights assigned by the first principal component to each component index be would be precisely 1/3, leading to the current HDI weighting scheme.12
As we are considering human development here as a latent concept which sees the components as complementary ingredients to this latent concept, the question arises to what extent the components are indeed equal in individual countries. As we have just discussed, the correlation between components is very high; still, there can be outliers and in some countries, the components might be far from equal. One of the ways to assess this is our proposed Balance of Development Index (BODI). The balance of development in a country with a given HDI (assuming equal weights) can be assessed using the sum of squared deviations of the component indices from the HDI, namely ((LEI-HDI)2 + (EI-HDI)2 + (GDPI-HDI)2). To scale it so that it takes on values between 0 and 1, and to have 1 as the "perfectly balanced" case, we suggest defining the "Balance of Development Index" as follows: BODI = 1-1.5( (LEI-HDI)2 + (EI-HDI)2 + (GDPI-HDI)2 ) 11 Minute changes in the weights do occur but it is hard to interpret them as they might be driven by measurement issues in the underlying data or small substantive changes in the relationship between the components. See also the discussion of the BODI below. 12 We investigated this further by considering an HDI which would use per-capita income for the income index rather than its log transformation as the third component. The correlation coefficient between per-capita income and the two other components is about 0.1 lower than with the log transformation (around 0.65 rather than 0.75, while the correlation between health and education is also around 0.7. In this case the weights become only slightly different, with a lower weight for the income component. For the weights to differ substantially, the correlation of one component with the others would need to be quite different. As a result, the fact that the correlation between life expectancy and education has falling over the years only has a minor impact on the weights (and is partly counteracted by rising correlation among the other components). More substantial changes in correlations would be needed to affect the weights more seriously. For example, to generate weights of 0.4, 0.4, and 0.2 for life expectancy, education, and income, respectively, the income component would need to have a correlation coefficient with the other two components of only around 0.25 (assuming the education and health have a correlation of 0.8).
8
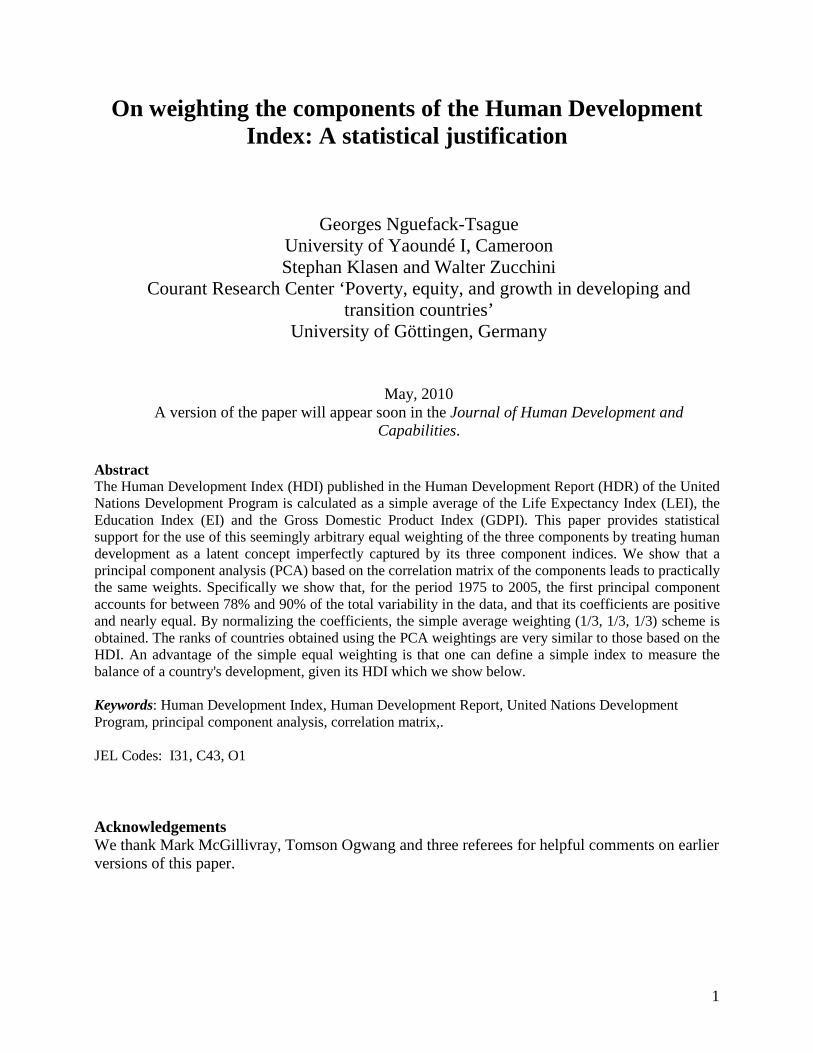
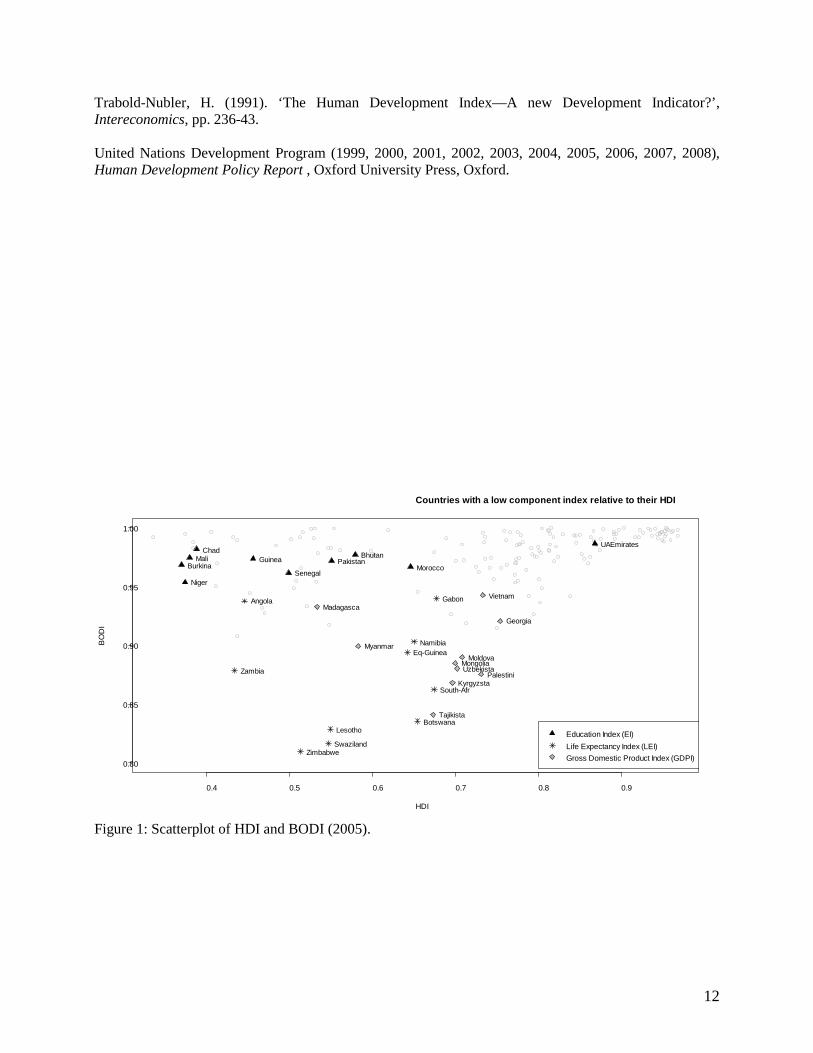
where BODI=1 indicates that all the component indices are equal, and BODI=0 indicates that they are as different as it is possible for them to be. Figure 1 gives a scatterplot of HDI against BODI using data for 2005. For each component index it names the 10 countries whose index value deviates most from its overall HDI. It appears that imbalance in the HDI occurs mainly due to two features: Comparatively low life expectancy in Southern Africa, largely related to the AIDS pandemic, and comparatively low incomes for a range of transition countries whose education and longevity levels are still quite high. In contrast, the imbalance due to relatively low education indicators is rather low and outside of these two special cases (AIDS crisis in Southern Africa and low incomes in some transition countries), the BODI is close to one, suggesting relatively even outcomes in the three components.13
3- Discussion and Summary The results presented here confirm that the use of the correlation-based PCA generates weights that are nearly indistinguishable from the equal weighting of the components of the HDI. This finding holds not only in a single cross-section; the estimates are remarkably stable over 30 years. The ranking of countries would change very little if one were to use PCA weights instead of the current HDI weights. This is of course a consequence of the fact that the component indices of the HDI are highly correlated. If one treats human development as a latent concept that is imperfectly captured by the three indicators, our results provide strong justification for equal weighting. With such an equal weighting index, one can then also nicely create a measure of evenness in development and our assessment shows that, with two notable exceptions of Southern Africa and some transition countries, development achievement in the three components are relatively even in a large sample of countries. Two open questions remain. First, our PCA yields results that are very close but not identical to equal weighting. Should one therefore use PCA to derive the weights or simply stick to equal weights? We would suggest the latter because this provides consistency over time. The PCA weights change every year, even if only slightly. They also depend on the sample of countries that are included each year. That would lead to an unnecessary complication and difficulty in interpretation. Since equal weights are so close to the PCA weights, the simplicity and interpretability of the former make them the obvious choice. Second, how are we to interpret equal weights? If we think of human development as a latent concept captured imperfectly by the three indicators, our results imply that the three component indices i.e. longevity, education, and (log of) income, contribute equally to this latent concept. 13 Whether this evenness is driven mainly by direct linkages between the components or efforts that end up promoting the three components in a balanced fashion is beyond the scope of this paper but is, in a sense, one of the recurring themes of the Human Development Reports. Clearly the deviations from the strong linkage are relatively recent phenomena, related to the AIDS crisis and the income implosion in transition countries.
9
References
Allen, M.J., and Yen, W. M. (2002), Introduction to measurement theory, Long Grove, IL: Waveland Press.
Anand, S. and Sen, A. (1992), ‘Human Development Index: Methodology and Measurement’, Background paper for Human Development Report 1993, United Nations Development Program, New York. Anand, S. and Sen, A. (2000), ‘The Income Component of the Human Development Index’, Journal of Human Development 1(1), pp. 83-106. Brandolini, A. (2007), ‘On applying synthetic indices of multidimensional well-being: health and income inequalities in selected EU countries’, Temi di discussion (Economic working papers) 668, Bank of Italy, Economic Research Department. Chowdhury, S. and Squire, L. (2006), ‘Setting weights for aggregate indices: An application to the commitment to development index and human development index’, Journal of Development Studies 42(5), pp. 761-771. Clark, D. and McGillivray, M. (2007), Measuring Human Well-being: Key Findings and Policy Lessons, United Nations University Press, Policy Brief (3), Helsinki. Cronbach, L. J. (1951), ‘Coefficient alpha and the internal structure of tests’, Psychometrika 16(3), pp. 297-334. Decancq, K., Decoster, A. & Schokkaert, E. (2007), ‘The evolution in world inequality in well-being’, Discussion Paper Series 07/04, Center for Economic Studies, Katholieke Universiteit Leuven. Decancq, K. and Lugo, M. A. (2008), ‘Setting weights in multidimensional indices of well-being and deprivation’, OPHI Working Paper No. 18.
Del Valle Irala, T. and Puerta Gil C. (1999), ‘New Methodologies for Calculating the HDI’, Paper presented at the First Global Forum on Human Development, 29-31 July 1999, New York. Efron, B., Tibshirani, R. (1991), ‘Statistical data analysis in the computer age’, Science 253, pp. 390-395. Efron, B., Tibshirani, R. (1993), An introduction to the bootstrap, Chapman and Hall/CRC, Boca Raton. Everitt, B. S. and Dunn, G. (1992), Applied Multivariate Data Analysis, Oxford University Press, Oxford. Everitt, B. S. and Dunn, G. (2001), Applied Multivariate Data Analysis, 2nd Edition, Arnold, London.
Feldt, L. S., Woodruff, D. J., and Salih, F. A. (1987), ‘Statistical inferences for coefficient alpha’, Applied Psychological Measurement 11, pp. 93-103.
Filmer D. and Pritchett, L. H. (2001) ‘Estimating Wealth Effects without Expenditure Data — or Tears: An Application to Educational Enrolments in States of India’, Demography 38: 115 - 32.
10
Grimm, M., Harttgen, K., Klasen, S. And Misselhorn, M. (2008), ‘A Human Development Index by Income Groups’, World Development 36(12), pp. 2527-2546 Haq, M. (2003), ‘The Birth of the Human Development Index’, Ch.2.1 in Readings in Human Development, Fukuda-Parr, S. and Shiva Kumar, A.K. (eds.), Oxford University Press, Oxford.
Jolliffe, I. T. (1972), ‘Discarding variables in a principal component analysis, I: artificial data’, Applied Statistics 21, pp. 1960-1973 .
Jolliffe, I. T. (1986), Principal Component Analysis, Springer-Verlag, New York. Jolliffe I.T (2002). Principal Component Analysis, Series: Springer Series in Statistics, 2nd ed., Springer, New York.
Kaiser, H. F. (1960), ‘The application of electronics computers to factor analysis’, Educational and Psychologocal measurement 20, pp. 141-151
Kelly, A. C. (1991), ‘The Human Development Index: Handle with Care’, Population and Development Review 17(2), pp. 315–24. Khattree, R. and Naik, D. N. (2000), Multivariate Data Reduction and Discrimination with SAS Software, Cary, NC: SAS Institute Inc. Klasen, S. (2000), ‘Measuring Poverty and Deprivation in South Africa’, Review of Income and Wealth 46, pp. 33-58. Kolenikov, S. and G. Angeles (2009). ‘Socioeconomic status measurement with discrete proxy variables: Is principal component analysis a reliable answer?’, Review of Income and Wealth 55(1): 128-165. Krishnakumar, J. and Nadar, A. (2008), ‘On exact statistical properties of multidimensional indices based on principal components, factor analysis, MIMIC and structural equation models’, Social Indicators Research 86(3), pp. 481-496. Krus, D. J. and Helmstadter, G. C. (1987), ‘The relationship between correlations and internal consistencynotions of test reliability’, Educational and Psychological Measurement 47, pp. 911-915.
Krzanowski, W. J. (1990), Principles of multivariate analysis : A user’s perspective. Clarendon Press. Oxford.
Larson, D. A.. and Wilford, W. T. (1979), ‘The Physical Quality of Life Index: A Useful Social Indicator?’, World Development 7(7), pp. 581-584. Maasoumi, E. and Nickelsburg, G. (1988), ‘Multivariate Measures of Well-Being and an Analysis of Inequality in the Michigan Data’, Journal of Business & Economic Statistics, American Statistical Association 6(3), pp. 326-34.
Marshall, A. W. and Olkin, I. (1979), Inequalities : Theory of majorization and its applications, San Diego : Academic Press.
11
McGillivray, M. (1991), ‘The Human Development Index: Yet Another Redundant Composite Development Indicator?’, World Development 19 (10), pp. 1461-1468. McGillivray, M. (2005) ‘Measuring non-economic well-being achievement.’, Review of income and Wealth 51(2): 337-364. McGillivray, M. and White, H. (1993), ‘Measuring Development? The UNDP’s Human Adjusting Human Well-being Indices for Gender Disparity Development Index’, Journal of International Development 5(2), pp. 183-192. Morris, M. D. (1979), Measuring the Conditions of the World’s Poor: The Physical Quality of Life Index, Pergamon, New York.
Morse, S. (2003), ‘For Better or for Worse, till the Human Development Index do us Part?’, Ecological Economics 45, pp. 281–96.Noorbakhsh, F. (1998), ‘The Human Development Index: Some technical issues and alternative indices. Journal of International Development 10: 589-605.
Ogasawara, H. (2004), ‘Asymptotic biases of the unrotated/rotated solutions in principal component analysis. British Journal of Mathematical and Statistical Psychology 57(2), pp. 353-376.
Ogwang, T. (1994), ‘The Choice of Principal Variables for Computing the Human Development Index’, World Development 22 (12), pp. 2011-2114. Ogwang, T. and Abdou, A. (2003), ‘The Choice of Principal Variables for Computing Human Development Indicators’, Social Indicators Research 64, pp. 139-152. Ram, R. (1982), ‘Composite indices of physical quality of life, basic needs fulfillment, and income: A principal component representation’, Journal of Development Economics 11(2): 227-247. Ranis G., Stewart , F. and Samman, E. (2006), ‘Human Development: beyond the HDI’, QEH Working Paper Series - QEHWPS135. Ravallion, M. (1997), ‘Good and Bad Growth: The Human Development Reports’, World Development 25(5), pp. 631-38. Sagar, A. and Najam, A. (1998), ‘The Human Development Index: A Critical Review’, Ecological Economics 25, pp. 249-264. Sagar, A. and Najam, A. (1999), ‘ Shaping Human Development: Which Way Next?’, Third World Quarterly 20(4), pp. 743-51. Sen, A. (1998) Development as Freedom. New York: Knopf. Srinivasan, T.N. (1994), ‘Human Development: A New Paradigm or Reinvention of the Wheel?’, American Economic Review Papers and Proceedings 84, pp. 238-243. Streeten, P. (1995), ‘Human Development: The Debate about the Index’, International Social Science Journal 47, pp. 25-37.
12
Trabold-Nubler, H. (1991). ‘The Human Development Index—A new Development Indicator?’, Intereconomics, pp. 236-43. United Nations Development Program (1999, 2000, 2001, 2002, 2003, 2004, 2005, 2006, 2007, 2008), Human Development Policy Report , Oxford University Press, Oxford.
0.4 0.5 0.6 0.7 0.8 0.9
0.80
0.85
0.90
0.95
1.00
Countries with a low component index relative to their HDI
HDI
BO
DI
Burkina Guinea
Niger Senegal
Morocco Mali Bhutan
Chad Pakistan
UAEmirates
Swaziland
Botswana Lesotho
Zimbabwe
South-Afr
Eq-Guinea Namibia
Zambia
Angola Gabon
Tajikista
Palestini Kyrgyzsta
Moldova Uzbekista
Myanmar
Mongolia
Georgia
Madagasca Vietnam
Education Index (EI)Life Expectancy Index (LEI)Gross Domestic Product Index (GDPI)
Figure 1: Scatterplot of HDI and BODI (2005).
13
Item
1975 1980 1985 1990 1995 Number of countries 101 112 121 136 145 Mean(LEI) 0.57 0.62 0.64 0.66 0.66 Mean(EI) 0.59 0.64 0.67 0.71 0.73 Mean(GDPI) 0.62 0.65 0.64 0.65 0.65 Standard error(LEI) 0.18 0.17 0.17 0.18 0.19 Standard error(EI) 0.26 0.24 0.23 0.22 0.21 Standard error(GDPI) 0.18 0.18 0.19 0.19 0.19 Covariance(LEI.EI) 0.04 0.04 0.03 0.03 0.03 Covariance (LEI.GDPI) 0.03 0.03 0.03 0.03 0.03 Covariance (EI.GDPI) 0.04 0.03 0.03 0.03 0.03 Correlation(LEI.EI) 0.92 0.91 0.87 0.84 0.79 Correlation (LEI.GDPI) 0.82 0.87 0.90 0.89 0.87 Correlation(EI.GDPI) 0.75 0.78 0.78 0.79 0.77 average inter-item correlation 0.83 0.85 0.85 0.84 0.81 Cronbach's alpha 0.92 0.93 0.93 0.93 0.93 Bootstrap 95% lower confidence limit of CI 0.89 0.91 0.91 0.92 0.91 Bootstrap 95% upper confidence limit of CI 0.94 0.95 0.95 0.95 0.94 Exact 95% lower confidence limit of CI 0.89 0.91 0.91 0.91 0.90 Exact 95% upper confidence limit of CI 0.94 0.95 0.95 0.95 0.94 Eigenvalue 1st principal component 2.66 2.70 2.70 2.68 2.62 Eigenvalue 2nd principal component 0.27 0.22 0.22 0.22 0.25 Eigenvalue 3rd principal component 0.07 0.08 0.08 0.10 0.13 Variability 1st principal component(%) 89 90 90 89 87 Variability 2nd principal component(%) 9 7 7 7 8 Variability 3rd principal component(%) 2 3 3 4 5 1st principal component weights for LEI 0.596 0.592 0.592 0.588 0.587 1st principal component weights for EI 0.580 0.575 0.566 0.567 0.562 1st principal component weights for GDPI 0.556 0.565 0.574 0.577 0.583 Sum of weights 1.732 1.732 1.732 1.732
1.732 1st PC normalized weights for LEI 0.344 0.342 0.342 0.339 0.339 1st PC normalized weights for EI 0.335 0.332 0.327 0.328 0.325 1st PC normalized weights for GDPI 0.321 0.326 0.331 0.333 0.336 Correlation (1st PC vector.LEI) 0.97 0.97 0.97 0.96 0.95 Correlation (1st PC vector.EI) 0.95 0.94 0.93 0.93 0.91 Correlation (1st PC vector.GDPI) 0.91 0.93 0.94 0.94 0.94 Kendall’s tau (PCA rank,HDI rank) 0.98 0.98 0.97 0.99 0.99 Misclassification rate (%) 2.5 4.6 1.6 3.5 1.4
Table 1a: Principal Component Analysis (PCA) results and misclassification total error count rate from 1975 to 1995.
14
Item 1997 1998 1999 2000 2001 2002 2003 2004 2005 Number of countries 174 174 162 173 175 177 159 177 177 Mean(LEI) 0.68 0.68 0.67 0.67 0.67 0.67 0.72 0.68 0.71 Mean(EI) 0.74 0.75 0.75 0.76 0.77 0.77 0.82 0.78 0.79 Mean(GDPI) 0.62 0.62 0.63 0.65 0.65 0.65 0.69 0.67 0.68 Standard error(LEI) 0.18 0.18 0.20 0.19 0.21 0.21 0.17 0.21 0.18 Standard error(EI) 0.20 0.20 0.20 0.19 0.19 0.19 0.15 0.19 0.18 Standard error(GDPI) 0.18 0.18 0.19 0.19 0.18 0.19 0.17 0.19 0.19 Covariance(LEI.EI) 0.03 0.03 0.03 0.03 0.03 0.03 0.02 0.03 0.02 Covariance (LEI.GDPI) 0.03 0.03 0.03 0.03 0.03 0.03 0.02 0.03 0.03 Covariance (EI.GDPI) 0.03 0.03 0.03 0.03 0.03 0.03 0.02 0.03 0.03 Correlation(LEI.EI) 0.78 0.78 0.79 0.76 0.74 0.73 0.63 0.73 0.74 Correlation (LEI.GDPI) 0.81 0.83 0.82 0.79 0.78 0.76 0.68 0.76 0.80 Correlation(EI.GDPI) 0.73 0.77 0.77 0.76 0.75 0.74 0.70 0.76 0.78 average inter-item correlation 0.77 0.79 0.79 0.77 0.75 0.74 0.67 0.75 0.77 Cronbach's alpha 0.91 0.92 0.92 0.91 0.90 0.90 0.86 0.90 0.91 Bootstrap 95% lower confidence limit of CI 0.88 0.90 0.90 0.89 0.87 0.87 0.81 0.87 0.89 Bootstrap 95% upper confidence limit of CI 0.93 0.94 0.94 0.93 0.92 0.92 0.89 0.92 0.93 Exact 95% lower confidence limit of CI 0.88 0.90 0.90 0.88 0.87 0.87 0.81 0.87 0.88 Exact 95% upper confidence limit of CI 0.93 0.94 0.94 0.93 0.92 0.92 0.89 0.92 0.93 Eigenvalue 1st principal component 2.55 2.59 2.59 2.55 2.51 2.33 2.33 2.5 2.54 Eigenvalue 2nd principal component 0.27 0.24 0.23 0.25 0.27 0.38 0.37 0.27 0.26 Eigenvalue 3rd principal component 0.18 0.17 0.18 0.21 0.22 0.29 0.29 0.23 0.2 Variability 1st principal component (%) 85 86 86 85 84 83 78 83 85 Variability 2nd principal component (%) 9 8 8 8 9 9 13 9 9 Variability 3rd principal component (%) 6 6 6 7 7 8 9 8 6 1st principal component weights for LEI 0.588 0.583 0.582 0.580 0.579 0.578 0.569 0.574 0.576 1st principal component weights for EI 0.568 0.569 0.572 0.572 0.572 0.574 0.574 0.576 0.571 1st principal component weights for GDPI 0.576 0.580 0.578 0.580 0.582 0.580 0.589 0.582 0.585 Sum of weights 1.732 1.732 1.732 1.732 1.732 1.732 1.732 1.732 1.732 1st PC normalized weights for LEI 0.339 0.337 0.336 0.335 0.334 0.334 0.328 0.332 0.333 1st PC normalized weights for EI 0.328 0.328 0.330 0.330 0.330 0.331 0.332 0.332 0.330 1st PC normalized weights for GDPI 0.333 0.335 0.334 0.335 0.336 0.335 0.340 0.336 0.337 Correlation (1st PC vector.LEI) 0.94 0.93 0.93 0.92 0.92 0.87 0.90 0.90 0.92 Correlation (1st PC vector.EI) 0.91 0.92 0.92 0.91 0.90 0.87 0.92 0.92 0.91 Correlation (1st PC vector.GDPI) 0.93 0.93 0.93 0.93 0.92 0.9 0.92 0.92 0.94 Kendall’s tau 0.98 0.99 0.99 0.99 0.99 0.99 0.98 0.99 1 Misclassification rate (%) 2.8 2.5 2.1 2.4 3.7 3.5 6.1 3.7 4.1 Table 1b: Principal Component Analysis (PCA) results and misclassification total error count rate from 1997 to 2005.
15
Country PCA scores HDI rank PCA rank Rank difference Iceland 2.273 1 1 0 Norway 2.271 2 2 0 Australia 2.217 3 3 0 Canada 2.204 4 4 0 Ireland 2.185 5 5 0 Sweden 2.161 6 6 0 Switzerland 2.151 7 7 0 Japan 2.134 8 8 0 Netherlands 2.128 9 9 0 France 2.120 10 10 0 Finland 2.119 11 11 0 USA 2.107 12 12 0 Spain 2.096 13 13 0 Denmark 2.092 14 14 0 Austria 2.085 15 15 0 UK 2.069 16 16 0 Belgium 2.063 17 17 0 Luxembourg 2.048 18 18 0 NewZealand 2.037 19 19 0 Italy 2.024 20 20 0 Hong-Kong 1.984 21 21 0 Germany 1.961 22 22 0 Israel 1.931 23 23 0 Greece 1.881 24 24 0 Singapore 1.839 25 25 0 Korea 1.831 26 26 0 Slovenia 1.793 27 27 0 Cyprus 1.666 28 28 0 Portugal 1.613 29 29 0 Brunei 1.573 30 30 0 Barbados 1.567 31 31 0 Czech Republic 1.555 32 32 0 Kuwait 1.549 33 33 0 Malta 1.434 34 34 0 Qatar 1.397 35 35 0 Hungary 1.395 36 36 0 Poland 1.358 37 37 0 Argentina 1.345 38 38 0 United Arab Emirates 1.341 39 39 0 Chile 1.337 40 40 0 Bahrain 1.315 41 41 0 Slovakia 1.288 42 42 0 Lithuania 1.287 43 43 0 Estonia 1.260 44 44 0 Latvia 1.218 45 45 0 Uruguay 1.199 46 46 0 Croatia 1.175 47 47 0
16
Costa-Rica 1.142 48 48 0 Bahamas 1.117 49 49 0 Seychelles 1.102 50 50 0 Cuba 1.067 51 51 0 Mexico 0.977 52 52 0 Bulgaria 0.932 53 53 0 Saint Kitts and Nevis 0.893 54 54 0 Tonga 0.886 55 55 0 Libyan 0.876 56 56 0 Antigua 0.844 57 57 0 Oman 0.834 58 58 0 Trinidad 0.826 59 59 0 Romania 0.825 60 60 0 Saudi Arabia 0.816 61 62 -1 Panama 0.823 62 61 1 Malaysia 0.807 63 63 0 Belarus 0.745 64 64 0 Mauritius 0.739 65 65 0 Bosnia and Herzegovina 0.736 66 66 0 Russia 0.712 67 69 -2 Albania 0.721 68 67 1 Macedonia 0.717 69 68 1 Brazil 0.710 70 70 0 Dominica 0.694 71 71 0 Saint Lucia 0.660 72 72 0 Kazakhstan 0.646 73 73 0 Venezuela 0.633 74 74 0 Colombia 0.622 75 75 0 Ukraine 0.590 76 76 0 Samoa 0.562 77 77 0 Thailand 0.525 78 78 0 Dominican Republic 0.514 79 79 0 Belize 0.504 80 80 0 China 0.495 81 81 0 Grenada 0.490 82 82 0 Armenia 0.477 83 83 0 Turkey 0.470 84 84 0 Suriname 0.460 85 85 0 Jordan 0.458 86 86 0 Peru 0.447 87 88 -1 Lebanon 0.448 88 87 1 Ecuador 0.447 89 89 0 Philippine 0.433 90 90 0 Tunisia 0.385 91 91 0 Fiji 0.348 92 92 0 SaintVince 0.341 93 93 0 Iran 0.320 94 94 0 Paraguay 0.287 95 95 0
17
Georgia 0.280 96 96 0 Guyana 0.232 97 97 0 Azerbaijan 0.196 98 98 0 Sri-Lanka 0.176 99 99 0 Maldives 0.155 100 100 0 Jamaica 0.105 101 101 0 Cape-Verde 0.105 102 102 0 El Salvador 0.100 103 103 0 Algeria 0.083 104 105 -1 Vietnam 0.087 105 104 1 Occupied Palestinian Territories 0.077 106 106 0 Indonesia 0.035 107 107 0 Syrian Arab Republic 0.005 108 108 0 Turkmenistan -0.112 109 109 0 Nicaragua -0.131 110 110 0 Moldova -0.149 111 111 0 Egypt -0.158 112 112 0 Uzbekista -0.203 113 113 0 Mongolia -0.223 114 114 0 Honduras -0.226 115 115 0 Kyrgyzstan -0.266 116 116 0 Bolivia -0.279 117 117 0 Guatemala -0.324 118 118 0 Gabon -0.461 119 119 0 Vanuatu -0.466 120 120 0 South Africa -0.494 121 122 -1 Tajikistan -0.472 122 121 1 Sao-Tome -0.657 123 123 0 Botswana -0.684 124 124 0 Namibia -0.715 125 125 0 Morocco -0.732 126 126 0 Equatorial Guinea -0.794 127 127 0 India -0.991 128 128 0 Solomon Islands -1.147 129 129 0 Lao People’s Democratic Republic -1.153 130 130 0 Cambodia -1.191 131 131 0 Myanmar -1.319 132 132 0 Bhutan -1.364 133 133 0 Comoros -1.526 134 134 0 Ghana -1.607 135 135 0 Pakistan -1.620 136 136 0 Mauritania -1.633 137 137 0 Lesotho -1.665 138 140 -2 Congo -1.657 139 139 0
18
Banglades -1.655 140 138 2 Swaziland -1.681 141 141 0 Nepal -1.778 142 142 0 Madagasca -1.791 143 143 0 Cameroon -1.808 144 144 0 Papua New Guinea -1.821 145 145 0 Haiti -1.831 146 146 0 Sudan -1.859 147 147 0 Kenya -1.904 148 148 0 Djibouti -1.953 149 149 0 Timor-Leste -1.965 150 150 0 Zimbabwe -1.999 151 152 -1 Togo -1.981 152 151 1 Yemen -2.015 153 153 0 Uganda -2.063 154 154 0 Gambia -2.082 155 155 0 Senegal -2.103 156 156 0 Eritrea -2.254 157 157 0 Nigeria -2.385 158 158 0 Tanzania -2.413 159 159 0 Guinea -2.517 160 160 0 Rwanda -2.561 161 161 0 Angola -2.616 162 162 0 Benin -2.686 163 163 0 Malawi -2.697 164 164 0 Zambia -2.730 165 165 0 Côte d’Ivoire -2.739 166 166 0 Burundi -2.919 167 167 0 Congo-Democratic -2.934 168 168 0 Ethiopia -2.978 169 169 0 Chad -3.156 170 170 0 Central African Republic -3.195 171 171 0 Mozambique -3.196 172 172 0 Mali -3.220 173 173 0 Niger -3.271 174 174 0 Guinea-Bissau -3.287 175 175 0 Burkina -3.313 176 176 0 Sierra Leone -3.639 177 177 0
Table 2: PCA ranking and HDR ranking for 2005.
19
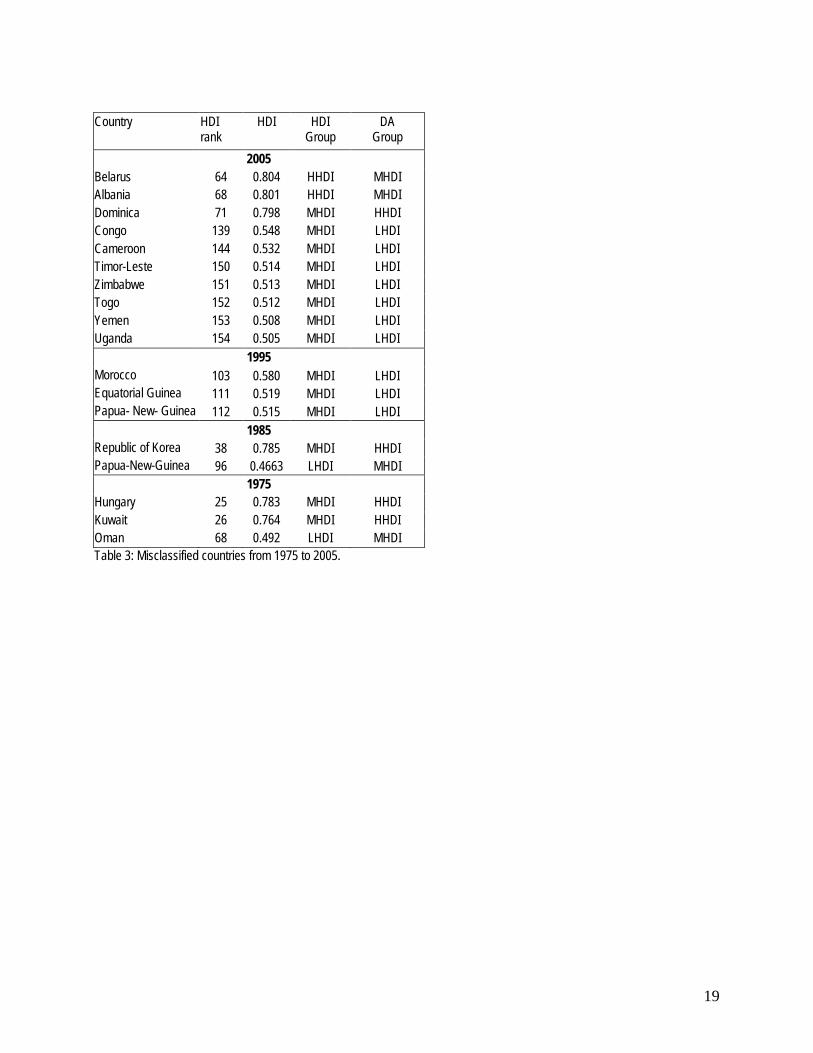
Country HDI
rank HDI HDI
Group DA
Group 2005
Belarus 64 0.804 HHDI MHDI Albania 68 0.801 HHDI MHDI Dominica 71 0.798 MHDI HHDI Congo 139 0.548 MHDI LHDI Cameroon 144 0.532 MHDI LHDI Timor-Leste 150 0.514 MHDI LHDI Zimbabwe 151 0.513 MHDI LHDI Togo 152 0.512 MHDI LHDI Yemen 153 0.508 MHDI LHDI Uganda 154 0.505 MHDI LHDI
1995 Morocco 103 0.580 MHDI LHDI Equatorial Guinea 111 0.519 MHDI LHDI Papua- New- Guinea 112 0.515 MHDI LHDI
1985 Republic of Korea 38 0.785 MHDI HHDI Papua-New-Guinea 96 0.4663 LHDI MHDI
1975 Hungary 25 0.783 MHDI HHDI Kuwait 26 0.764 MHDI HHDI Oman 68 0.492 LHDI MHDI Table 3: Misclassified countries from 1975 to 2005.