Embed Size (px)
DESCRIPTION
Social Services Report on Poverty in Australia 2012
Citation preview
Poverty in Australia
The first in a series of ‘Poverty and Inequality in Australia’ reports
from the Australian Council of Social Service
Poverty in Australia: ACOSS Paper 194
First published in 2012 by the
Australian Council of Social Service
Locked Bag 4777
Strawberry Hills, NSW, 2012 Australia
Email: [email protected]
Website: www.acoss.org.au
ISSN: 1326 7124
ISBN: 978 0 85871 082 5
© Australian Council of Social Service
This publication is copyright. Apart from fair dealing for the purpose of private study, research, criticism,
or review, as permitted under the Copyright Act, no part may be reproduced by any process without
written permission. Enquiries should be addressed to the Publications Officer, Australian Council of
Social Service. Copies are available from the address above.
It was prepared by Senior Policy Officer Peter Davidson with assistance from Penny Dorsch and
Hannah Gissane. The research was commissioned from Peter Saunders, Bruce Bradbury and Melissa
Wong from the Social Policy Research Centre at the University of NSW.
ACOSS would like to acknowledge the support of the Morawetz Social Justice Fund, Jobs Australia,
Anglicare Australia, Society of St Vincent de Paul National Council, and The Salvation Army (Eastern
and Southern Territories).
Australian Council of Social Service 1
Contents
Preface 2
1. Introduction 6
2. Summary of findings: people living below the poverty line 7
3. The risk and profile of poverty 10
4. Gender 14
5. Age 16
6. Family Type 18
7. Country of birth 21
8. Labour force status 23
9. Main income source 26
10. Location 28
11. Poverty among people on social security payments 31
11. Trends in the risk of poverty from 2003 to 2010 (50% of median income
poverty line) 37
2 Australian Council of Social Service
Preface
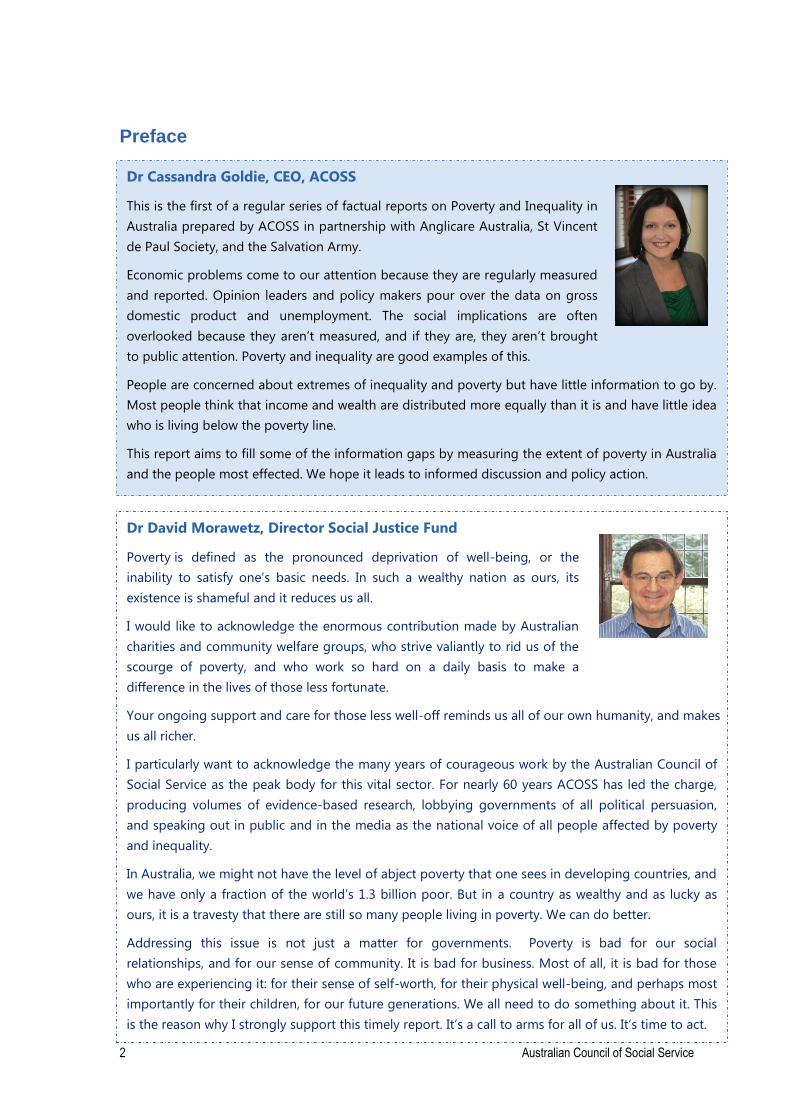
Dr Cassandra Goldie, CEO, ACOSS
This is the first of a regular series of factual reports on Poverty and Inequality in
Australia prepared by ACOSS in partnership with Anglicare Australia, St Vincent
de Paul Society, and the Salvation Army.
Economic problems come to our attention because they are regularly measured
and reported. Opinion leaders and policy makers pour over the data on gross
domestic product and unemployment. The social implications are often
overlooked because they aren’t measured, and if they are, they aren’t brought
to public attention. Poverty and inequality are good examples of this.
People are concerned about extremes of inequality and poverty but have little information to go by.
Most people think that income and wealth are distributed more equally than it is and have little idea
who is living below the poverty line.
This report aims to fill some of the information gaps by measuring the extent of poverty in Australia
and the people most effected. We hope it leads to informed discussion and policy action.
Dr David Morawetz, Director Social Justice Fund
Poverty is defined as the pronounced deprivation of well-being, or the
inability to satisfy one's basic needs. In such a wealthy nation as ours, its
existence is shameful and it reduces us all.
I would like to acknowledge the enormous contribution made by Australian
charities and community welfare groups, who strive valiantly to rid us of the
scourge of poverty, and who work so hard on a daily basis to make a
difference in the lives of those less fortunate.
Your ongoing support and care for those less well-off reminds us all of our own humanity, and makes
us all richer.
I particularly want to acknowledge the many years of courageous work by the Australian Council of
Social Service as the peak body for this vital sector. For nearly 60 years ACOSS has led the charge,
producing volumes of evidence-based research, lobbying governments of all political persuasion,
and speaking out in public and in the media as the national voice of all people affected by poverty
and inequality.
In Australia, we might not have the level of abject poverty that one sees in developing countries, and
we have only a fraction of the world’s 1.3 billion poor. But in a country as wealthy and as lucky as
ours, it is a travesty that there are still so many people living in poverty. We can do better.
Addressing this issue is not just a matter for governments. Poverty is bad for our social
relationships, and for our sense of community. It is bad for business. Most of all, it is bad for those
who are experiencing it: for their sense of self-worth, for their physical well-being, and perhaps most
importantly for their children, for our future generations. We all need to do something about it. This
is the reason why I strongly support this timely report. It’s a call to arms for all of us. It’s time to act.
Australian Council of Social Service 3
David Thompson, Jobs Australia
Jobs Australia, a long standing principal sponsor of Anti-Poverty Week, first
published these poems (and many others just like them) in 2010 to bring home the
meaning of poverty experienced by many Australians. A lack of money – as we can
see from the poems – inspires not just shame, anxiety, and occasionally stoic
resignation, but also a powerful sense that things could be different. The basic
decencies of respectful encounters with institutions, which can cost nothing, matter
a lot. And it is plain to see that people living in poverty have immense reserves of
energy and drive to make a decent living for themselves, and a future for their
children, if only they are given the right chances.
It is not them or us, they are us.
Missing
I haven’t seen a film for 8-9 years. / It’s $12 – / I just can’t. / I have no social life/unless it’s free./I
can’t afford to go to a café / and drink coffee – / I just can’t. / I tried putting $3 a day into my budget.
I felt a little more human, / existing within society… / I had to stop doing it,/I couldn’t live
anymore./Like being invited out to dinner / or a friend saying, / ‘do you want to catch up for a meal?’
I just can’t, no. / I miss it. Tracey
Dole bludger
I’m desperate for money./ If there were any jobs…/ …I’d be started at 9 o’clock this morning./ I have
to tell everyone I’m a dole bludger and / I don’t have any money./ Nobody wants to know a
dole bludger. / My family thinks I’m still working./ I got sacked four years ago. / I didn’t tell them I’m
a dole bludger. / Mum would get upset,/ she wants my future to be secure. /To be able to tell my
family that I’ve got a job…./ a proper job…. / Nobody wants to know a / dole bludger. Bettina
Dr John Falzon, CEO, St Vincent de Paul Society National Council
The truth told by those on the margins is louder than the lies told about them.
Our problem in Australia is not the “idleness of the poor.” Our problem is
inequality. This is a social question, not a question of behaviour. We do irreparable
harm when we turn it into a question of individual behaviour, blaming people for
their own poverty. It is a matter of deep shame for a wealthy nation like ours that
our unemployment benefits, for example, have been kept deliberately low as a
means of humiliating the very people they were originally designed to assist.
Charities like the St Vincent de Paul Society will always be there for the people who are waging a
daily battle from below the poverty line, but the message we are hearing is that people do not want
charity. They want justice. And we support them in this struggle for their rights.
We support helping people into the paid workforce. The time has come, however, to abandon the
foolish notion that forcing them into deeper poverty improves their chances of employment. You
don’t build people up by putting them down. You don’t help them get work by forcing them into
poverty.
We stand with all who are trying to create a good society; a society that does not accept the scourge
of rising inequality and exclusion from the essentials of life; a society that does not humiliate people.
New passions are springing up. They point to glaring contradictions. They also offer the promise that
another kind of society is possible, and can be created collectively under the guiding stars of struggle
and hope.
4 Australian Council of Social Service
Kasy Chambers, Executive Director Anglicare Australia
Anglicare Australia seeks to engage with all Australians to build communities of
resilience, hope and justice. Underpinning that mission is our belief there is a
place for everyone; and that everyone can participate and have a stake in our
society.
But experience across the Anglicare network, working with almost 420,000 Australians, is that this is
not the case. Poverty in modern Australia is a profoundly isolating experience. It traps people out of
work, and limits their connection to others. It robs people of their stake in the wider world and the
rest of us of their contribution.
We don’t really know – nationally – who poverty affects. Anglicare Australia’s annual rental housing
snapshot this year found virtually no affordable private housing for people living on the lowest
government payments right across Australia. But the situation for a family trying to live on a
minimum wage was little better.
The impact of growing inequity in the paid work force – and the insecurity and poverty that comes
with many short term jobs – is showing up at Anglicare services which deliver financial counselling,
emergency relief and family support. We need to pay more attention to the shape of poverty in
Australia, and its enduring nature.
This Poverty Report is important because it will give us robust, up to date and reliable information on
the extent and depth of poverty in Australia. It will start to fill in the gaps between our international
affluence and the economic and social adjustment that are reflected in the everyday work of
Anglicare agencies in communities across Australia.
That is why Anglicare Australia – drawing on support from Anglicare Southern Queensland, Anglicare
Victoria and Anglicare Diocese of Sydney – is so pleased to contribute this project. Australia needs
the information and the insights that come with this and subsequent reports to steer the policies that
allow all Australians, particularly the most vulnerable and disadvantaged, to play their part in our
society.
We stand with all who are trying to create a good society; a society that does not accept the scourge
of rising inequality and exclusion from the essentials of life; a society that does not humiliate people.
New passions are springing up. They point to glaring contradictions. They also offer the promise that
another kind of society is possible, and can be created collectively under the guiding stars of struggle
and hope.
Australian Council of Social Service 5
Major Brad Halse, The Salvation Army
The Salvation Army in Australia provides hundreds of social programs through a
huge network of support services, community centres and churches across the
nation. The Salvation Army annually provides more than a million occasions of
service. This includes more than 150,000 people provided with emergency relief,
and more than 160,000 meals in any given year.
These numbers verify that for a large number of people in the community, poverty is a reality. They
struggle to meet everyday expenses and financial commitments. Of significant concern is that these
individuals also experience severe levels of deprivation (access to services and activities), which
further compromises living standards and inclusion in the Australian community. Another concern is
the disengagement of children due to costs associated with activities. More than half of adult
respondents in a recent Salvation Army study reported being unable to afford to pay for out-of-
school activities, and nearly 40% could not afford for their children to participate in school activities.
People are regularly going without items, services and activities that are essential for living and
participating in community life.
Income poverty is just one aspect of broader disadvantage that organisations and charities, such as
The Salvation Army, work with daily. People living in poverty are forced to make critical choices about
their daily living circumstances, and miss out on opportunities and activities that most of the
community would take for granted.
The Salvation Army urges the Federal Government to implement change now to help reduce poverty
in this country. It is not enough to maintain the status quo.
6 Australian Council of Social Service
1. Introduction
Despite 20 years of economic growth, many people in Australia do not have at least a
decent basic standard of living.
One simple way to measure this that’s widely used by Governments and expert
bodies such as the OECD is the number of people living below a poverty line. This
report uses two poverty lines, 50% of median household income (half of the ‘middle’
income for all households) and 60% of median income.
The lower of these poverty lines (which is used by the OECD) equates to a very
austere living standard: a disposable income of less than $358 per week for a single
adult (higher for larger households to take account of their greater costs). This
research also takes account of people’s housing costs in measuring poverty.
New figures released in this report for 2010 show that one in eight people,
including one in six children, were living at or below this poverty line.
People in poverty
In 2010:
The poverty line (50% of median income) for a single adult was $358 per
week, for a couple with 2 children it was $752.
2,265,000 people (12.8% of all people) were living below the poverty line,
after taking account of their housing costs.
575,000 children (17.3% of all children) were living below the poverty line.
37% of people on social security payments lived below the poverty line
including 52% of those on Newstart Allowance, 45% of those on Parenting
Payment, 42% of those on Disability Support Pension, 24% of those on
Carer Payment, and 14% of those on Age Pension
62% of people below the poverty line had social security as their main
income and 29% had wages as their main income
The level of poverty was 12.6% in capital cities compared to 13.1% outside
capital cities
The proportion of people in poverty rose by approximately one third of a percent
from 2003 to 2010.
Australian Council of Social Service 7
2. Summary of findings: people living below the poverty line
The key finding is that in 2010, after taking account of housing costs, an estimated
2,265,000 people or 12.8% of all people, including 575,000 children (17.3% of all
children), lived in households below the most austere poverty line widely used in
international research. This is set at 50% of the median (middle) disposable income
for all Australian households. In the case of a single adult, in 2010 this poverty line
was $358 per week. In the case of a couple with two children it was $752 (Table 1).
This is the main poverty line used in this report.
A less austere but still low poverty line, that is used to define poverty in Britain,
Ireland and the European Union, is 60% of median income. In the case of a single
adult, this poverty line in Australia was $430 per week in 2010.
When this higher poverty line is used, 3,705,000 people, including 869,000 children,
were found to be living in poverty. This represented 20.9% of all people and 26.1% of
children. A major reason for the large increase in the number of people living below
this income (compared with the lower poverty line) is that many households on social
security payments have incomes (typically pension payments plus small amounts of
private income) that lie in between the two poverty lines.
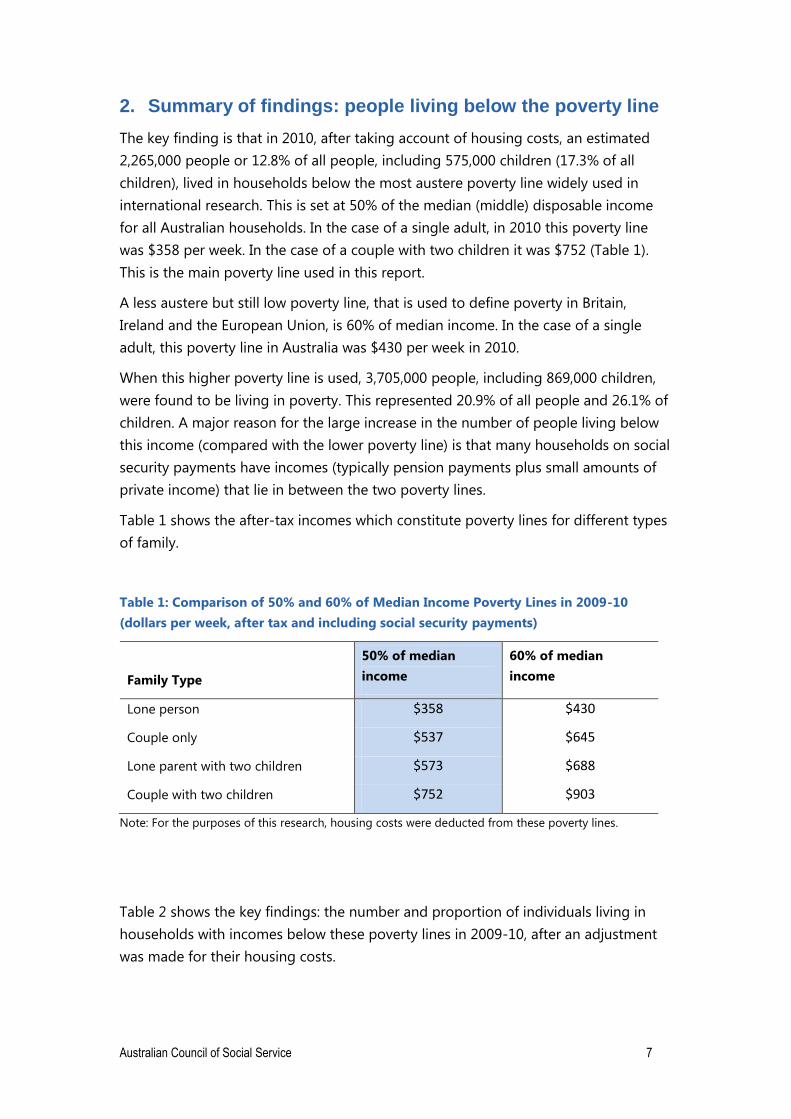
Table 1 shows the after-tax incomes which constitute poverty lines for different types
of family.
Table 1: Comparison of 50% and 60% of Median Income Poverty Lines in 2009-10
(dollars per week, after tax and including social security payments)
Family Type
50% of median
income
60% of median
income
Lone person $358 $430
Couple only $537 $645
Lone parent with two children $573 $688
Couple with two children $752 $903
Note: For the purposes of this research, housing costs were deducted from these poverty lines.
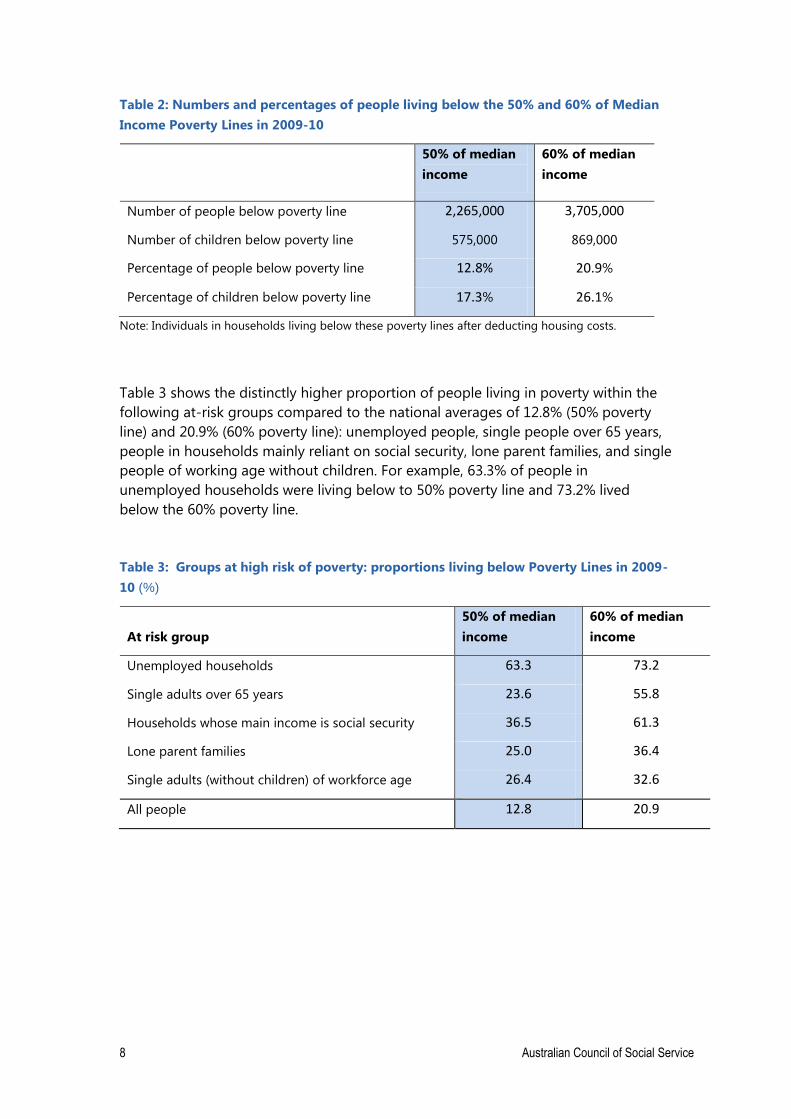
Table 2 shows the key findings: the number and proportion of individuals living in
households with incomes below these poverty lines in 2009-10, after an adjustment
was made for their housing costs.
8 Australian Council of Social Service
Table 2: Numbers and percentages of people living below the 50% and 60% of Median
Income Poverty Lines in 2009-10
50% of median
income
60% of median
income
Number of people below poverty line 2,265,000 3,705,000
Number of children below poverty line 575,000 869,000
Percentage of people below poverty line 12.8% 20.9%
Percentage of children below poverty line 17.3% 26.1%
Note: Individuals in households living below these poverty lines after deducting housing costs.
Table 3 shows the distinctly higher proportion of people living in poverty within the
following at-risk groups compared to the national averages of 12.8% (50% poverty
line) and 20.9% (60% poverty line): unemployed people, single people over 65 years,
people in households mainly reliant on social security, lone parent families, and single
people of working age without children. For example, 63.3% of people in
unemployed households were living below to 50% poverty line and 73.2% lived
below the 60% poverty line.
Table 3: Groups at high risk of poverty: proportions living below Poverty Lines in 2009-
10 (%)
At risk group
50% of median
income
60% of median
income
Unemployed households 63.3 73.2
Single adults over 65 years 23.6 55.8
Households whose main income is social security 36.5 61.3
Lone parent families 25.0 36.4
Single adults (without children) of workforce age 26.4 32.6
All people 12.8 20.9
Australian Council of Social Service 9
How poverty is measured in this report
A key internationally accepted tool to measure disadvantage in wealthy countries is
to work out the proportion of the population living below a poverty line. Poverty lines
are usually based on the disposable (after tax) income of households.
In Australian and international poverty research, the poverty line for a single adult is
usually calculated as a proportion of the disposable income of a ‘middle income’
(median) household – in this case 50% and 60%. There are different poverty lines to
take account of the number of adults and children in a household. The research used
in this report takes into account people’s housing costs as well as their incomes. This
makes a difference because people who have low housing costs (such as those who
own their homes outright) are able to achieve a higher standard of living on the same
income than those with higher housing costs (for example, tenants and mortgagers).
The research takes housing costs into account by deducting housing costs (rent,
mortgage payments and rates) from income before calculating the median income
on which the poverty lines are based (which reduces the poverty lines) ad deducting
each household’s housing costs from their income (which reduces household
incomes). In this way, it compares different households’ ability to meet their basic
living costs apart from housing1.
This research was conducted for us by Social Policy Research Centre at the University
of New South Wales2. The data source is the Australian Bureau of Statistics (ABS)
Income and Expenditure surveys for 2009-10 and previous years3.
Poverty lines provide one indicator of low income and disadvantage. Other
commonly used indicators of hardship include whether people can afford essentials
such as access to dental care when needed and financial stress4.
Ultimately, the experience of living on a low income is a personal one that can best
be expressed through people’s lived experience. Personal stories show that people in
poverty are not all the same. They come from diverse backgrounds and there are
many different reasons for poverty. Some come from disadvantaged backgrounds,
some have long term illnesses or disabilities, others were once well off but a family
crisis or illness changed their lives for the worse. One thing that unites people who do
not have access to a decent standard of living is that they aspire to a ‘normal’ life
where income is secure, they are respected and have a place in society.
________________________________
1 Households reporting zero or negative incomes and self-employed households were excluded from the
sample due to uncertainty about the accuracy of their incomes as measured in the survey. 2 A detailed report of the methodology will be posted at www.acoss.org.au
3 Regrettably, these surveys do not include information that would allow an opportunity to identify
poverty among Aboriginal and Torres Strait Islander peoples. 4 For more information on ‘deprivation based’ measures of financial hardship, see ACOSS (2011),
‘Missing out’ at www.acoss.org.au/publications
10 Australian Council of Social Service
3. The risk and profile of poverty
This report looks beyond the overall numbers to identify the groups affected by
poverty, and where they live. We do this in two ways.
First, we show the risk of poverty faced by different groups (such as different types of
family): for example, the proportion of individuals in lone parent families who live
below the poverty line.
Second, we profile the population of people living below poverty lines: for example,
the proportion of people living below poverty lines who are in lone parent families.
Looking at poverty from these two perspectives yields different results. For example,
the risk of poverty within lone parent families is higher than among couples with
children. But because there are more couples with children than lone parent families,
a higher proportion of people below poverty lines come from partnered families.
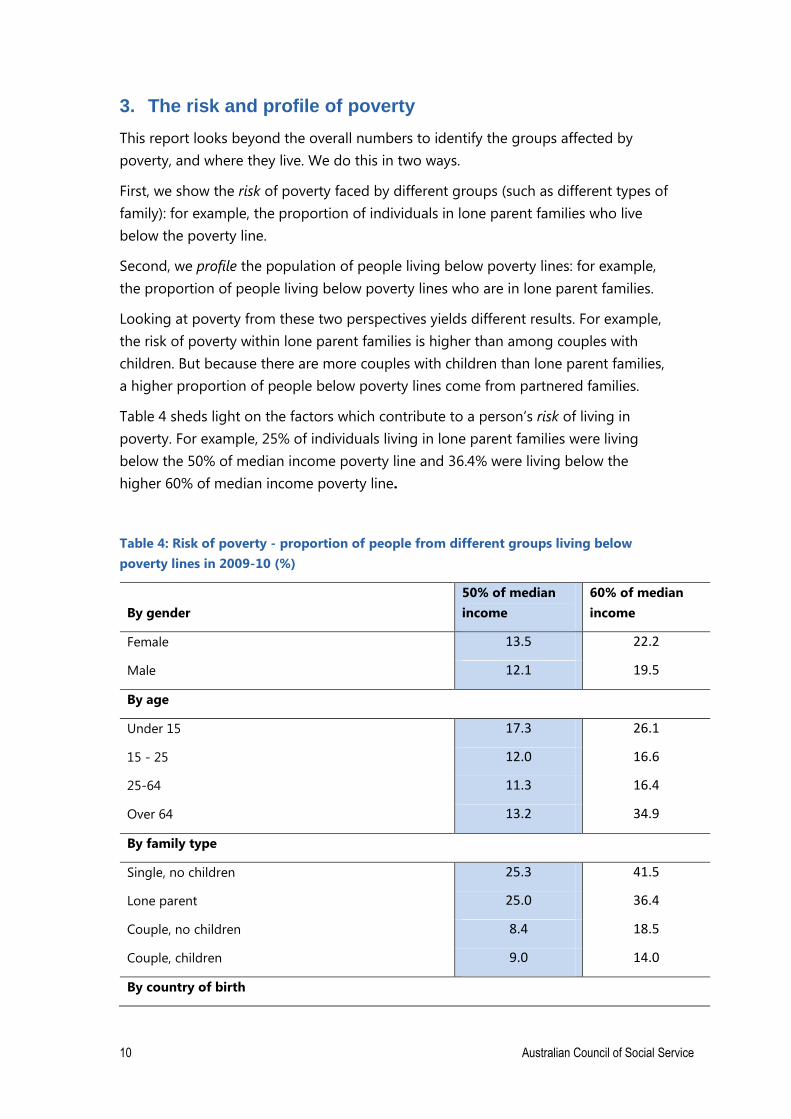
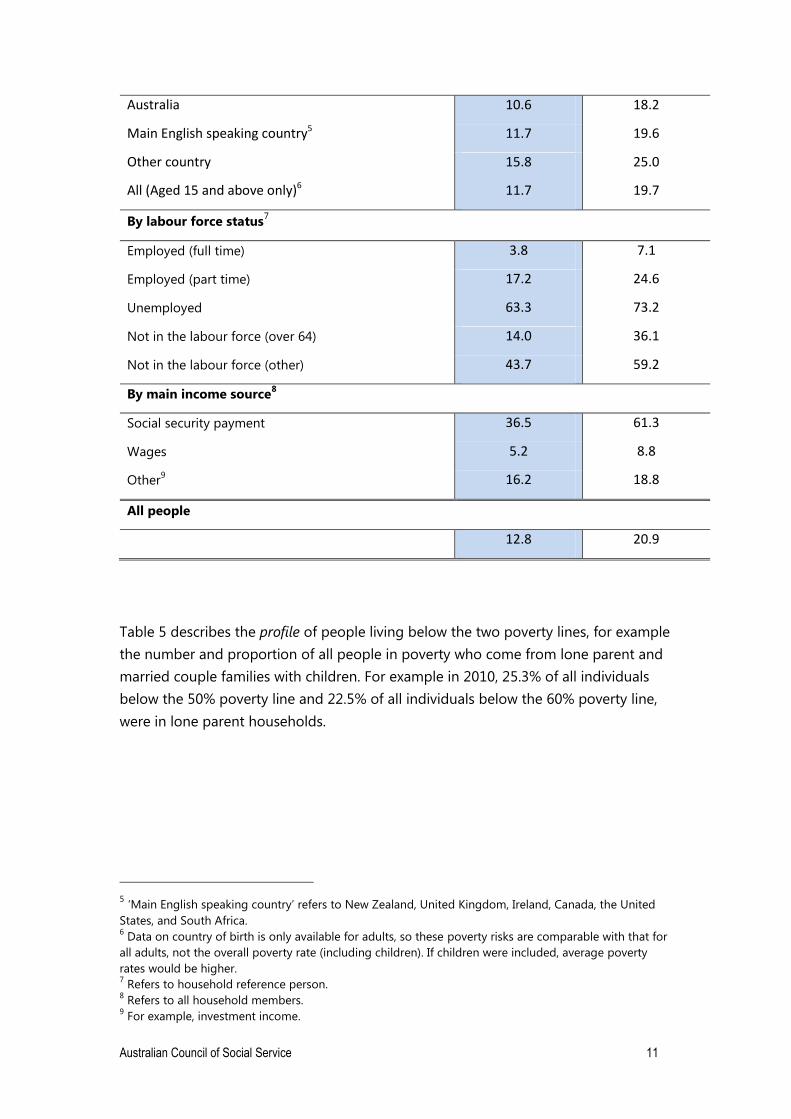
Table 4 sheds light on the factors which contribute to a person’s risk of living in
poverty. For example, 25% of individuals living in lone parent families were living
below the 50% of median income poverty line and 36.4% were living below the
higher 60% of median income poverty line.
Table 4: Risk of poverty - proportion of people from different groups living below
poverty lines in 2009-10 (%)
By gender
50% of median
income
60% of median
income
Female 13.5 22.2
Male 12.1 19.5
By age
Under 15 17.3 26.1
15 - 25 12.0 16.6
25-64 11.3 16.4
Over 64 13.2 34.9
By family type
Single, no children 25.3 41.5
Lone parent 25.0 36.4
Couple, no children 8.4 18.5
Couple, children 9.0 14.0
By country of birth
Australian Council of Social Service 11
Australia 10.6 18.2
Main English speaking country5 11.7 19.6
Other country 15.8 25.0
All (Aged 15 and above only)6 11.7 19.7
By labour force status7
Employed (full time) 3.8 7.1
Employed (part time) 17.2 24.6
Unemployed 63.3 73.2
Not in the labour force (over 64) 14.0 36.1
Not in the labour force (other) 43.7 59.2
By main income source8
Social security payment 36.5 61.3
Wages 5.2 8.8
Other9 16.2 18.8
All people
12.8 20.9
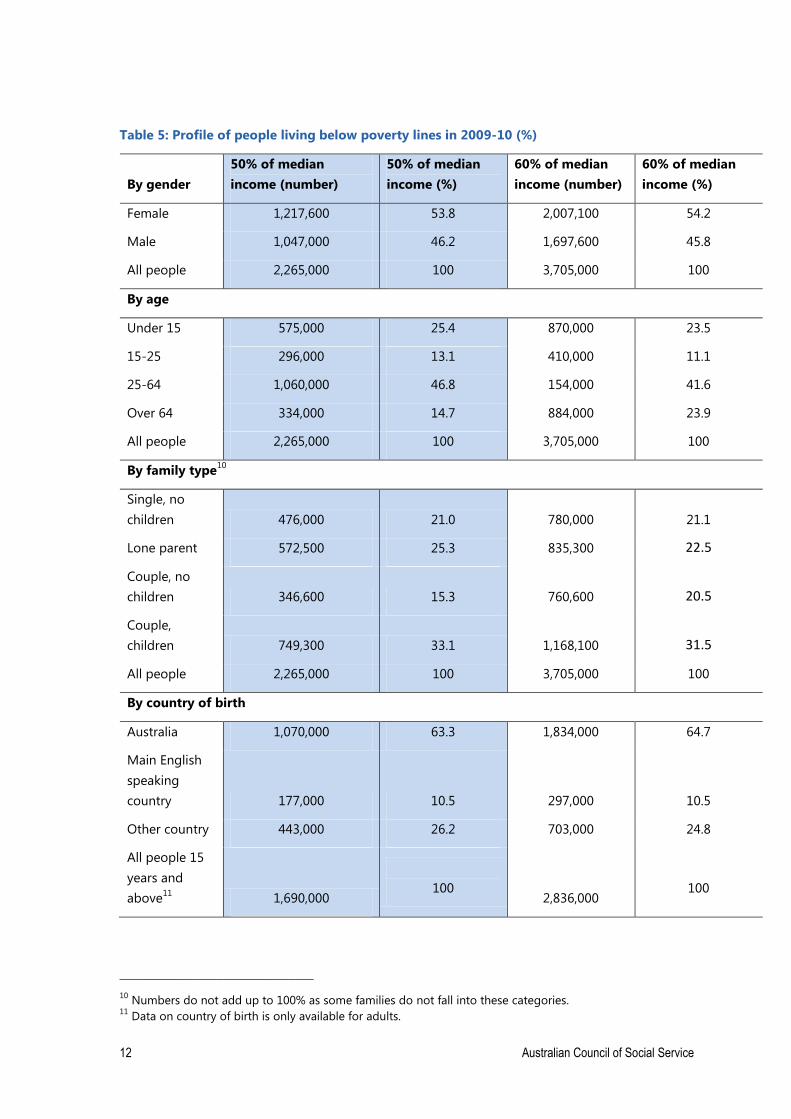
Table 5 describes the profile of people living below the two poverty lines, for example
the number and proportion of all people in poverty who come from lone parent and
married couple families with children. For example in 2010, 25.3% of all individuals
below the 50% poverty line and 22.5% of all individuals below the 60% poverty line,
were in lone parent households.
________________________________
5 ‘Main English speaking country’ refers to New Zealand, United Kingdom, Ireland, Canada, the United
States, and South Africa. 6 Data on country of birth is only available for adults, so these poverty risks are comparable with that for
all adults, not the overall poverty rate (including children). If children were included, average poverty
rates would be higher. 7 Refers to household reference person.
8 Refers to all household members.
9 For example, investment income.
12 Australian Council of Social Service
Table 5: Profile of people living below poverty lines in 2009-10 (%)
By gender
50% of median
income (number)
50% of median
income (%)
60% of median
income (number)
60% of median
income (%)
Female 1,217,600 53.8 2,007,100 54.2
Male 1,047,000 46.2 1,697,600 45.8
All people 2,265,000 100 3,705,000 100
By age
Under 15 575,000 25.4 870,000 23.5
15-25 296,000 13.1 410,000 11.1
25-64 1,060,000 46.8 154,000 41.6
Over 64 334,000 14.7 884,000 23.9
All people 2,265,000 100 3,705,000 100
By family type10
Single, no
children 476,000 21.0 780,000 21.1
Lone parent 572,500 25.3 835,300 22.5
Couple, no
children 346,600 15.3 760,600 20.5
Couple,
children 749,300 33.1 1,168,100 31.5
All people 2,265,000 100 3,705,000 100
By country of birth
Australia 1,070,000 63.3 1,834,000 64.7
Main English
speaking
country 177,000 10.5 297,000 10.5
Other country 443,000 26.2 703,000 24.8
All people 15
years and
above11
1,690,000
100 2,836,000
100
________________________________
10 Numbers do not add up to 100% as some families do not fall into these categories.
11 Data on country of birth is only available for adults.
Australian Council of Social Service 13
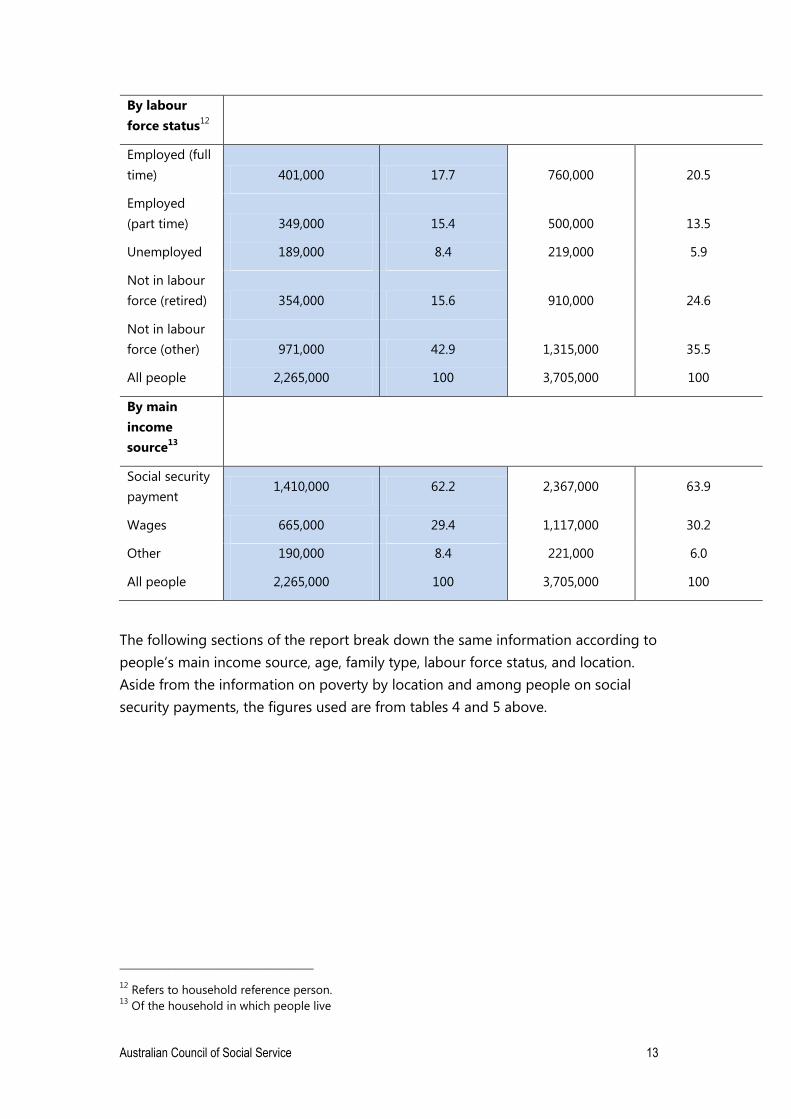
By labour
force status12
Employed (full
time) 401,000 17.7 760,000 20.5
Employed
(part time) 349,000 15.4 500,000 13.5
Unemployed 189,000 8.4 219,000 5.9
Not in labour
force (retired) 354,000 15.6 910,000 24.6
Not in labour
force (other) 971,000 42.9 1,315,000 35.5
All people 2,265,000 100 3,705,000 100
By main
income
source13
Social security
payment 1,410,000 62.2 2,367,000 63.9
Wages 665,000 29.4 1,117,000 30.2
Other 190,000 8.4 221,000 6.0
All people 2,265,000 100 3,705,000 100
The following sections of the report break down the same information according to
people’s main income source, age, family type, labour force status, and location.
Aside from the information on poverty by location and among people on social
security payments, the figures used are from tables 4 and 5 above.
________________________________
12 Refers to household reference person.
13 Of the household in which people live
14 Australian Council of Social Service
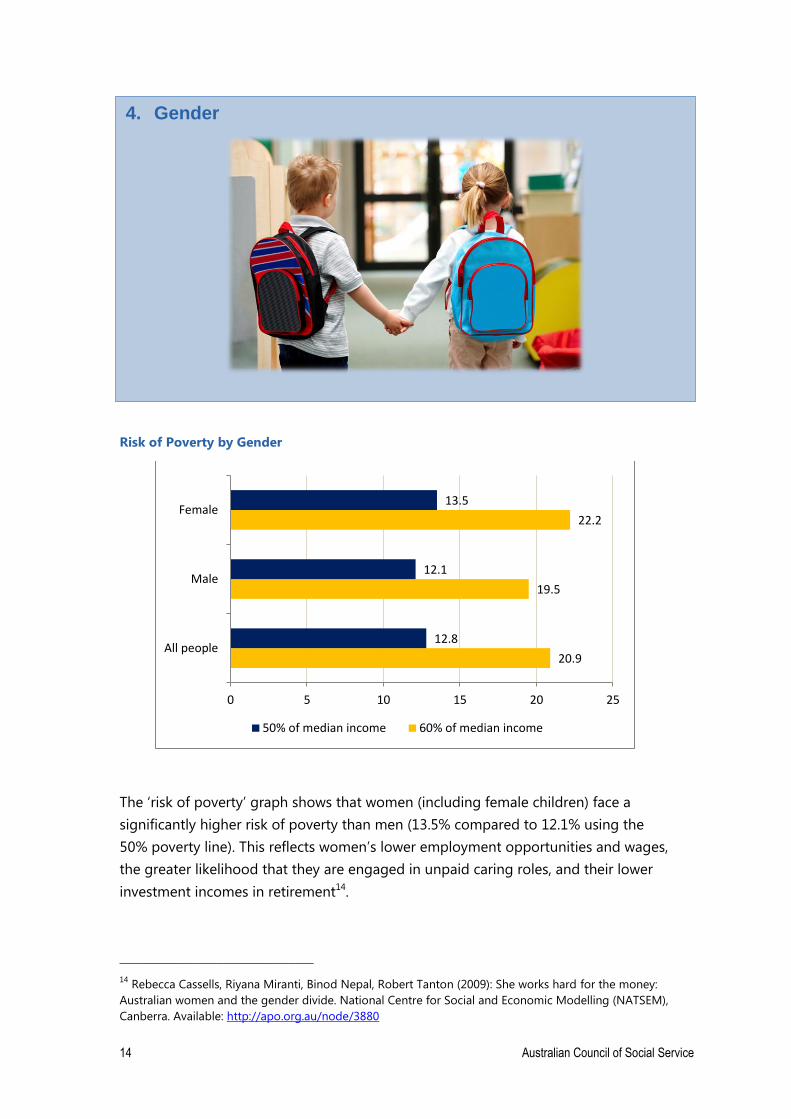
Risk of Poverty by Gender
The ‘risk of poverty’ graph shows that women (including female children) face a
significantly higher risk of poverty than men (13.5% compared to 12.1% using the
50% poverty line). This reflects women’s lower employment opportunities and wages,
the greater likelihood that they are engaged in unpaid caring roles, and their lower
investment incomes in retirement14.
________________________________
14 Rebecca Cassells, Riyana Miranti, Binod Nepal, Robert Tanton (2009): She works hard for the money:
Australian women and the gender divide. National Centre for Social and Economic Modelling (NATSEM),
Canberra. Available: http://apo.org.au/node/3880
20.9
19.5
22.2
12.8
12.1
13.5
0 5 10 15 20 25
All people
Male
Female
50% of median income 60% of median income
4. Gender
Australian Council of Social Service 15
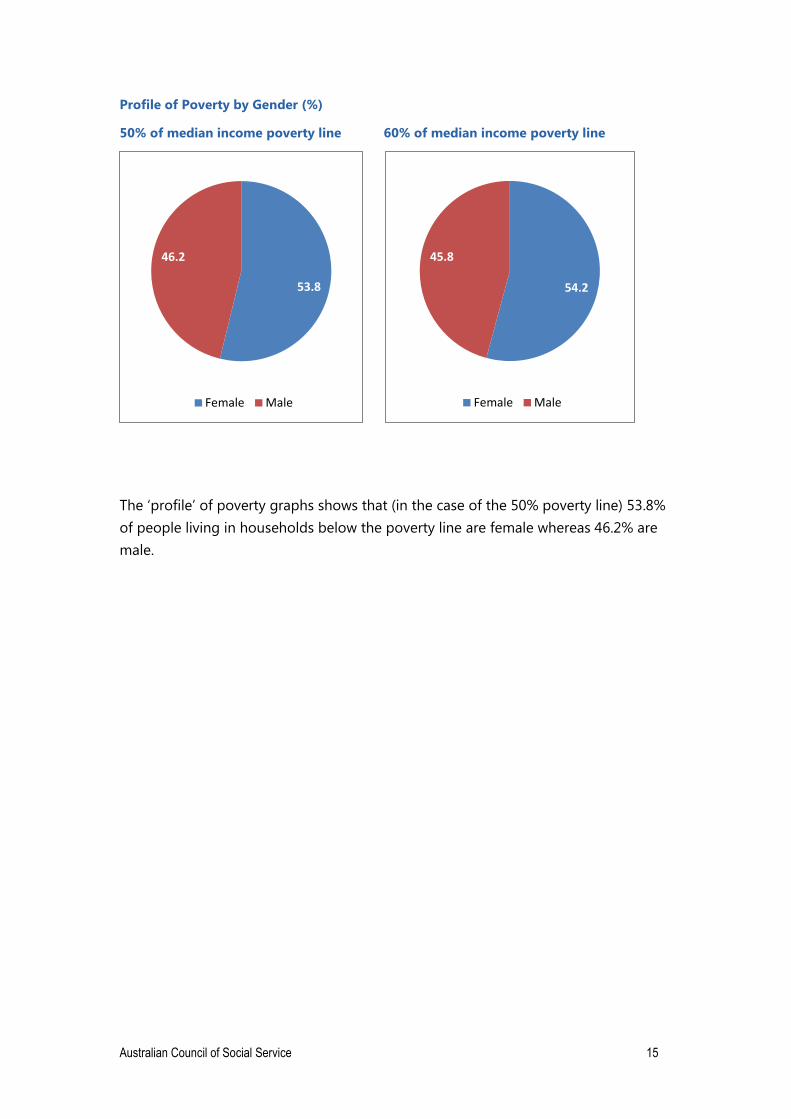
Profile of Poverty by Gender (%)
50% of median income poverty line 60% of median income poverty line
The ‘profile’ of poverty graphs shows that (in the case of the 50% poverty line) 53.8%
of people living in households below the poverty line are female whereas 46.2% are
male.
53.8
46.2
Female Male
54.2
45.8
Female Male
16 Australian Council of Social Service
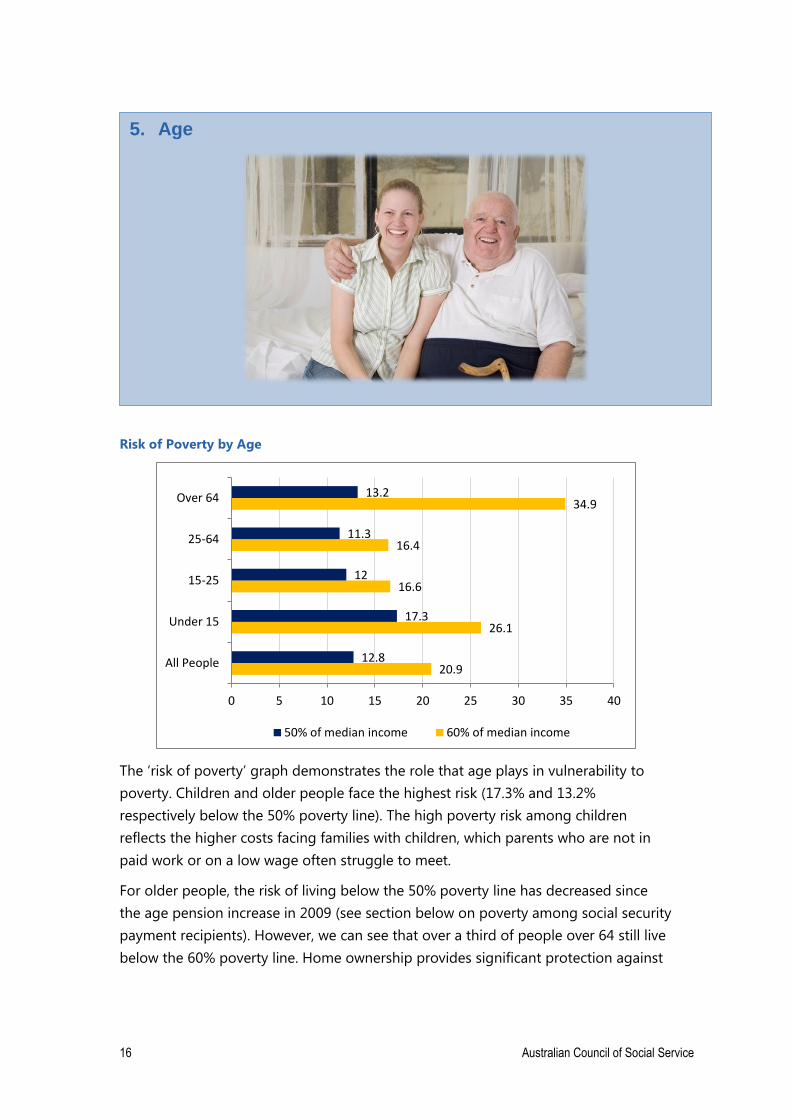
Risk of Poverty by Age
The ‘risk of poverty’ graph demonstrates the role that age plays in vulnerability to
poverty. Children and older people face the highest risk (17.3% and 13.2%
respectively below the 50% poverty line). The high poverty risk among children
reflects the higher costs facing families with children, which parents who are not in
paid work or on a low wage often struggle to meet.
For older people, the risk of living below the 50% poverty line has decreased since
the age pension increase in 2009 (see section below on poverty among social security
payment recipients). However, we can see that over a third of people over 64 still live
below the 60% poverty line. Home ownership provides significant protection against
20.9
26.1
16.6
16.4
34.9
12.8
17.3
12
11.3
13.2
0 5 10 15 20 25 30 35 40
All People
Under 15
15-25
25-64
Over 64
50% of median income 60% of median income
5. Age
Australian Council of Social Service 17
Mary – Age Pension
Mary is a 78 year old pensioner who lives in Perth. Due to the cost of high rent
and utility prices life has become a battle for survival. During winter Mary would
turn her heating on for only one hour a day. She would spend much of the day
in bed to keep warm. Her food budget each week is $40. This is a diet of baked
beans, bread, and small amount of fruit, and vegetables. Once a month she
buys a small piece of chicken. Once a week she eats a hot meal provided at a
local church.
Mary considers herself lucky as at least she has a roof over her head.
poverty for many older people (and the lower housing costs that result are taken into
account in this research) but the minority who rent face a higher poverty risk15.
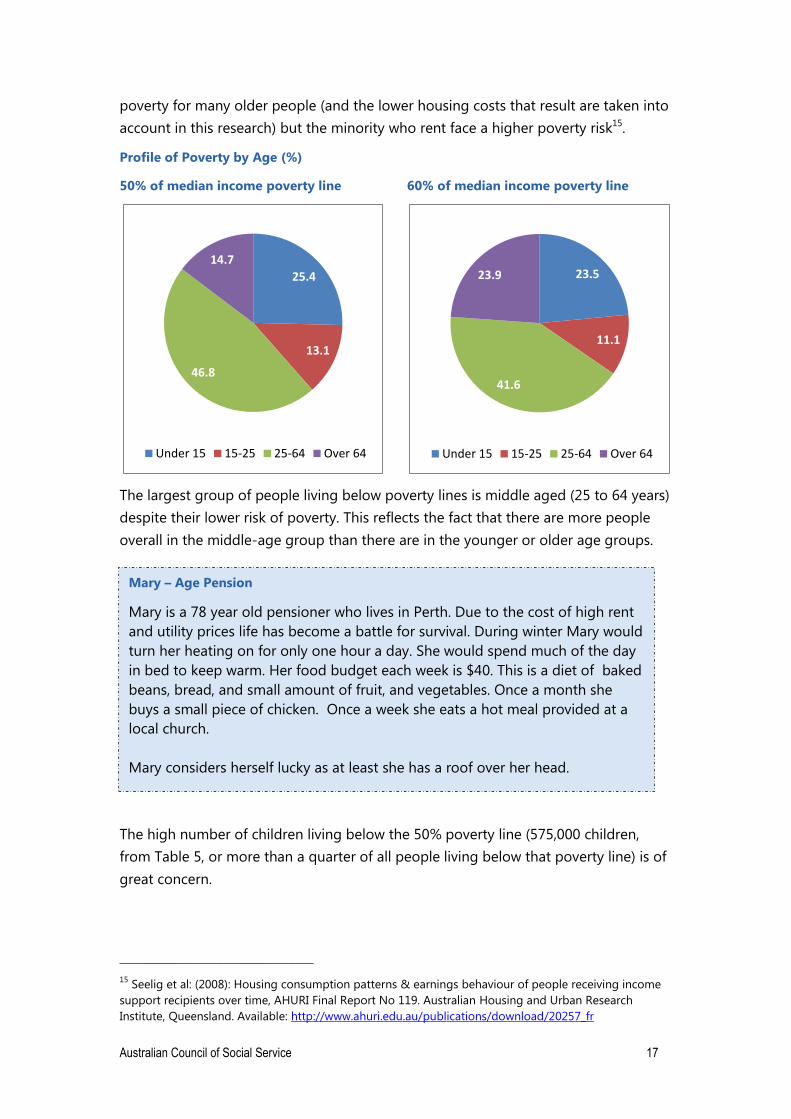
Profile of Poverty by Age (%)
50% of median income poverty line 60% of median income poverty line
The largest group of people living below poverty lines is middle aged (25 to 64 years)
despite their lower risk of poverty. This reflects the fact that there are more people
overall in the middle-age group than there are in the younger or older age groups.
The high number of children living below the 50% poverty line (575,000 children,
from Table 5, or more than a quarter of all people living below that poverty line) is of
great concern.
________________________________
15 Seelig et al: (2008): Housing consumption patterns & earnings behaviour of people receiving income
support recipients over time, AHURI Final Report No 119. Australian Housing and Urban Research
Institute, Queensland. Available: http://www.ahuri.edu.au/publications/download/20257_fr
25.4
13.1
46.8
14.7
Under 15 15-25 25-64 Over 64
23.5
11.1
41.6
23.9
Under 15 15-25 25-64 Over 64
18 Australian Council of Social Service
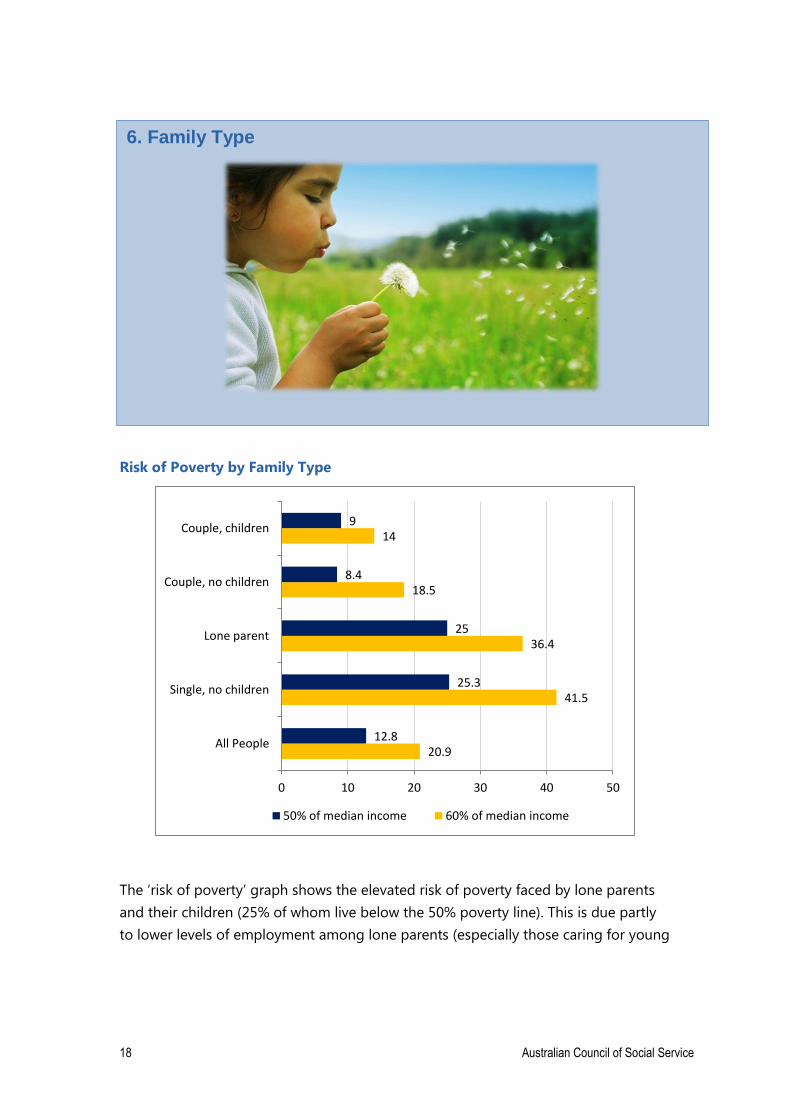
Risk of Poverty by Family Type
The ‘risk of poverty’ graph shows the elevated risk of poverty faced by lone parents
and their children (25% of whom live below the 50% poverty line). This is due partly
to lower levels of employment among lone parents (especially those caring for young
20.9
41.5
36.4
18.5
14
12.8
25.3
25
8.4
9
0 10 20 30 40 50
All People
Single, no children
Lone parent
Couple, no children
Couple, children
50% of median income 60% of median income
6. Family Type
Australian Council of Social Service 19
children on their own) and partly to the levels of social security payments for these
families16.
Single people with and without children generally face a higher risk of poverty than
couples (25.3% and 25% compared with 8.4% and 9%), reflecting in part the
economies of scale (for example, sharing housing costs and other bills) available to
people living with partners.
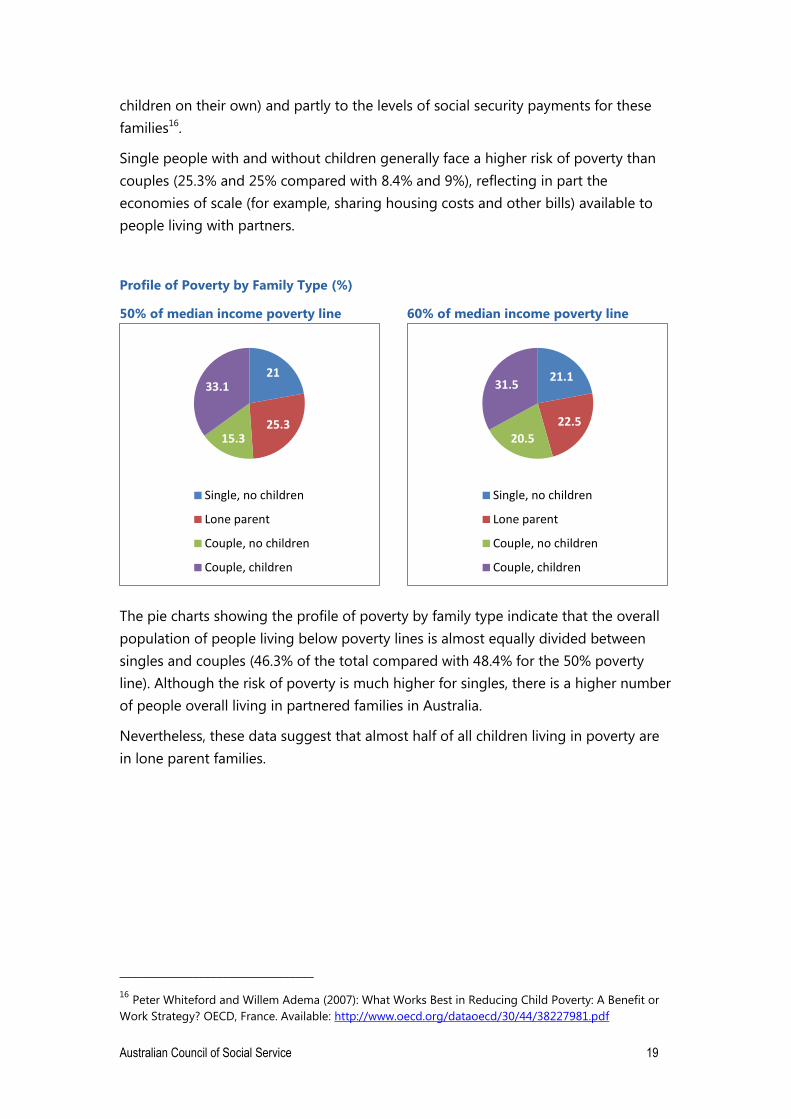
Profile of Poverty by Family Type (%)
50% of median income poverty line 60% of median income poverty line
The pie charts showing the profile of poverty by family type indicate that the overall
population of people living below poverty lines is almost equally divided between
singles and couples (46.3% of the total compared with 48.4% for the 50% poverty
line). Although the risk of poverty is much higher for singles, there is a higher number
of people overall living in partnered families in Australia.
Nevertheless, these data suggest that almost half of all children living in poverty are
in lone parent families.
________________________________
16 Peter Whiteford and Willem Adema (2007): What Works Best in Reducing Child Poverty: A Benefit or
Work Strategy? OECD, France. Available: http://www.oecd.org/dataoecd/30/44/38227981.pdf
21.1
22.5
20.5
31.5
Single, no children
Lone parent
Couple, no children
Couple, children
21
25.3 15.3
33.1
Single, no children
Lone parent
Couple, no children
Couple, children
20 Australian Council of Social Service
Cherie – single parent
I am a single mum who has been raising an eight year old son singlehandedly for the past
five years. In short it hasn’t been easy. Trying to provide the basics for my child, whilst
playing the role of two parents, juggling part time wage, and being the main care giver has
got to be the toughest job in the world.
I’m doing my best and fight back against the persistent thoughts that it’s not good
enough. The weekly battle to pay rent, ongoing bills, and basic living expenses is enough
stress for anyone receiving low income, let alone when you’ve got a child who’s totally
dependent on you for their well- being.
I have had to swallow my pride at times and turn to family and charities for that extra bit of
help when a big bill comes in or an emergency comes up, to prevent from being chucked
out in the streets. Still I feel so lucky that I am alive and have a healthy, beautiful son that I
will watch grow into an adult, who despite the struggles will one day give back to our
community for the support he is now being afforded.
Below the minimum wage*
Centrelink is less than the minimum wage.
I’m raising a child,
supporting two people –
how can that possibly be enough?
Permanently below the poverty level.
What sort of logic…?
I’m expected to do this for
16 years.
I live on very little.
My food budget has disappeared,
my son’s health is affected.
Cheap food,
carbohydrates,
you get fat.
No vegetables in nearly
3 weeks.
No haircut in
6 months.
A haircut means
no money for food.
Next month…
I might have enough
to buy decent amounts of food.
I don’t know…
I live on very little.
Louise
________________________________________________
* Kate Connelly (2010): What body part do I need to sell?
Jobs Australia
Australian Council of Social Service 21
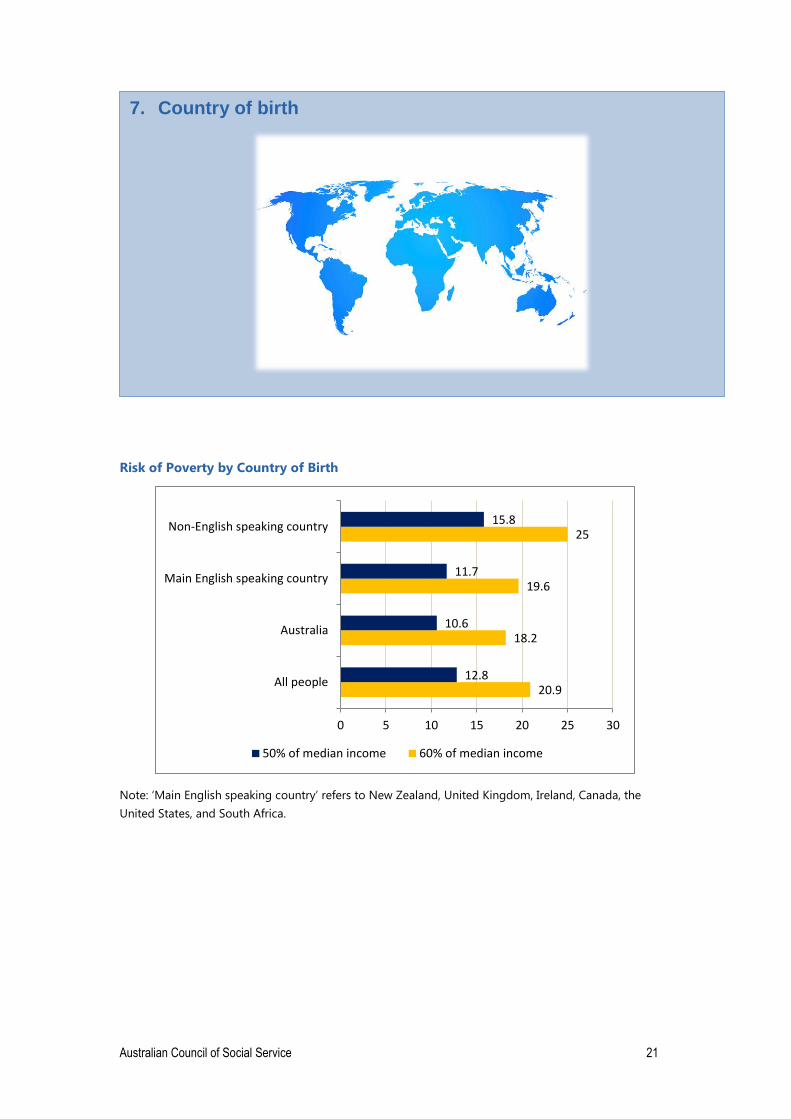
Risk of Poverty by Country of Birth
Note: ‘Main English speaking country’ refers to New Zealand, United Kingdom, Ireland, Canada, the
United States, and South Africa.
20.9
18.2
19.6
25
12.8
10.6
11.7
15.8
0 5 10 15 20 25 30
All people
Australia
Main English speaking country
Non-English speaking country
50% of median income 60% of median income
7. Country of birth
22 Australian Council of Social Service
The ‘risk of poverty’ graph shows that adults born in countries where English is not
the main language faced a much higher risk of poverty (15.8% using the 50% poverty
line) than those born in Australia (10.6%), or in an English speaking country (11.7%)17.
This is likely to reflect the difficulties that migrants from non-English speaking
countries face in securing well paid employment in Australia which include (in many,
though not all cases) language barriers, limited skills that are recognised in Australia,
and discrimination18.
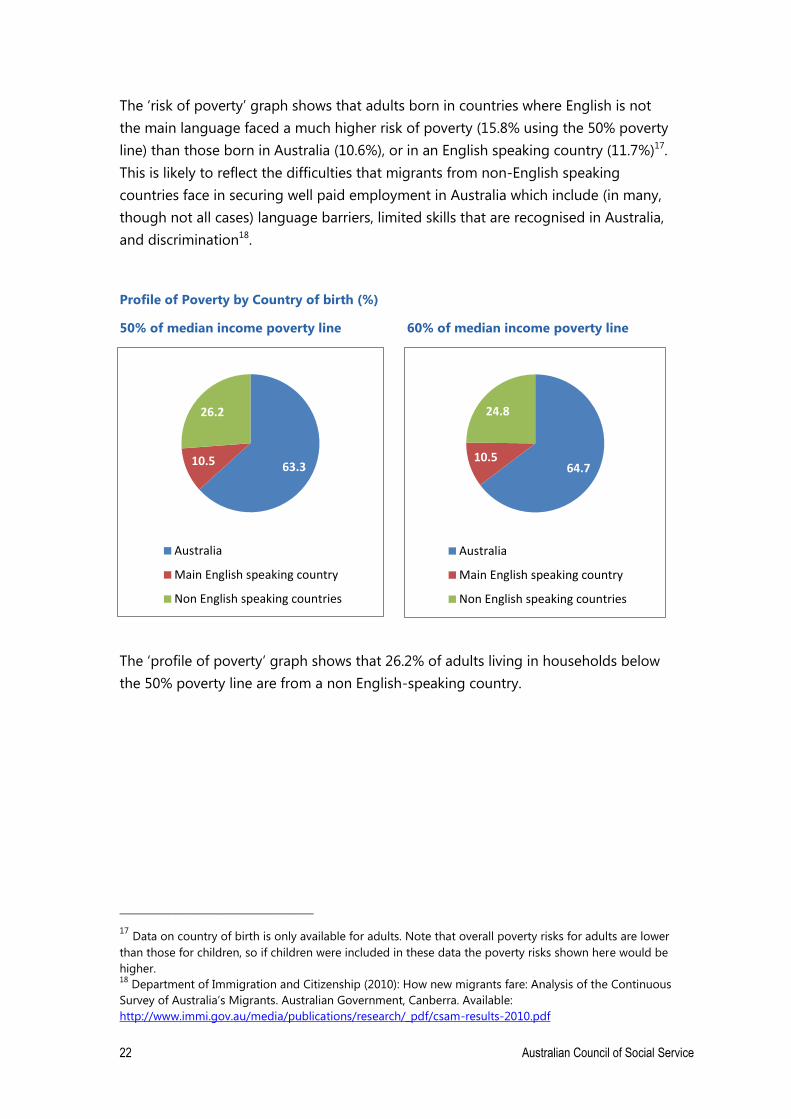
Profile of Poverty by Country of birth (%)
50% of median income poverty line 60% of median income poverty line
The ‘profile of poverty’ graph shows that 26.2% of adults living in households below
the 50% poverty line are from a non English-speaking country.
________________________________
17 Data on country of birth is only available for adults. Note that overall poverty risks for adults are lower
than those for children, so if children were included in these data the poverty risks shown here would be
higher. 18
Department of Immigration and Citizenship (2010): How new migrants fare: Analysis of the Continuous
Survey of Australia’s Migrants. Australian Government, Canberra. Available:
http://www.immi.gov.au/media/publications/research/_pdf/csam-results-2010.pdf
63.3 10.5
26.2
Australia
Main English speaking country
Non English speaking countries
64.7 10.5
24.8
Australia
Main English speaking country
Non English speaking countries
Australian Council of Social Service 23
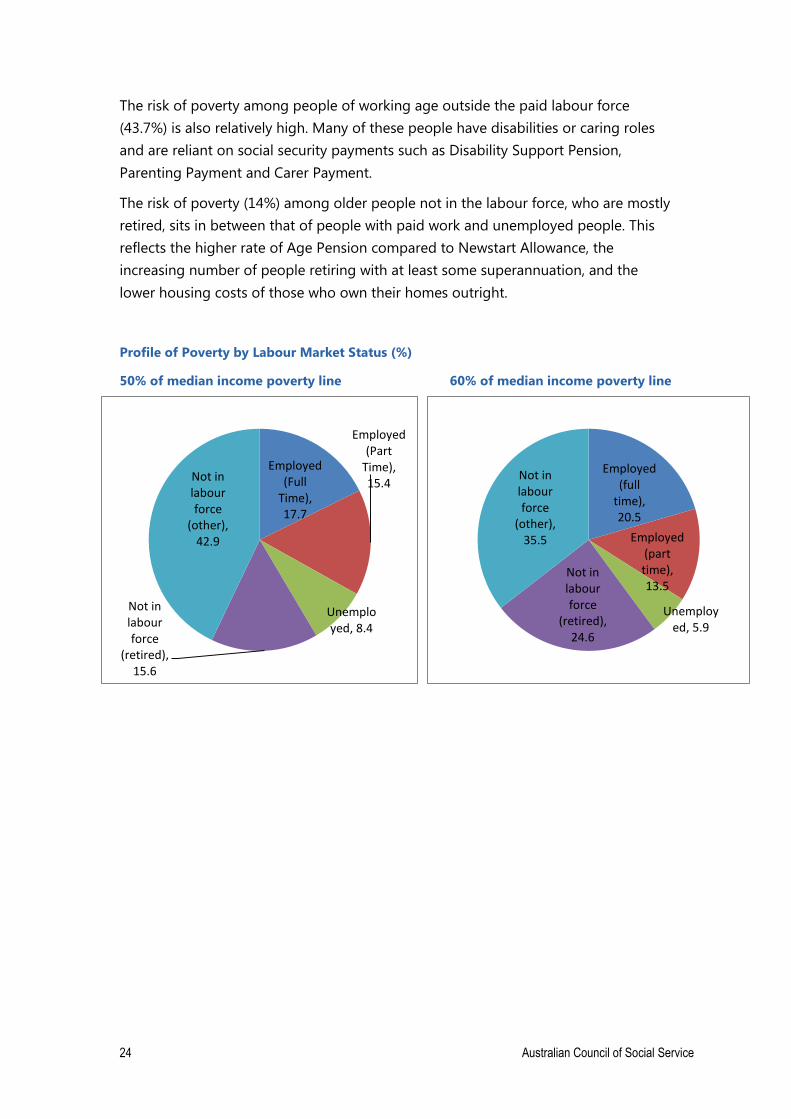
Risk of Poverty by Labour Market Status (%)
The graph on risk of poverty shows that unemployed people face a far higher risk of
poverty (63.3% below the 50% poverty line) than those who are employed or out of
the labour force. This partly reflects the level of the Newstart Allowance for
unemployed people (discussed later) which is less than half the disposable income of
a person on a fulltime minimum wage.
20.9
7.1
24.6
73.2
36.1
59.2
12.8
3.8
17.2
63.3
14
43.7
0 10 20 30 40 50 60 70 80
All People
Employed (full time)
Employed (part time)
Unemployed
Not in the labour force (over 64)
Not in the labour force (other)
50% of median income 60% of median income
8. Labour force status
24 Australian Council of Social Service
Employed (Full
Time), 17.7
Employed (Part
Time), 15.4
Unemployed, 8.4
Not in labour force
(retired), 15.6
Not in labour force
(other), 42.9
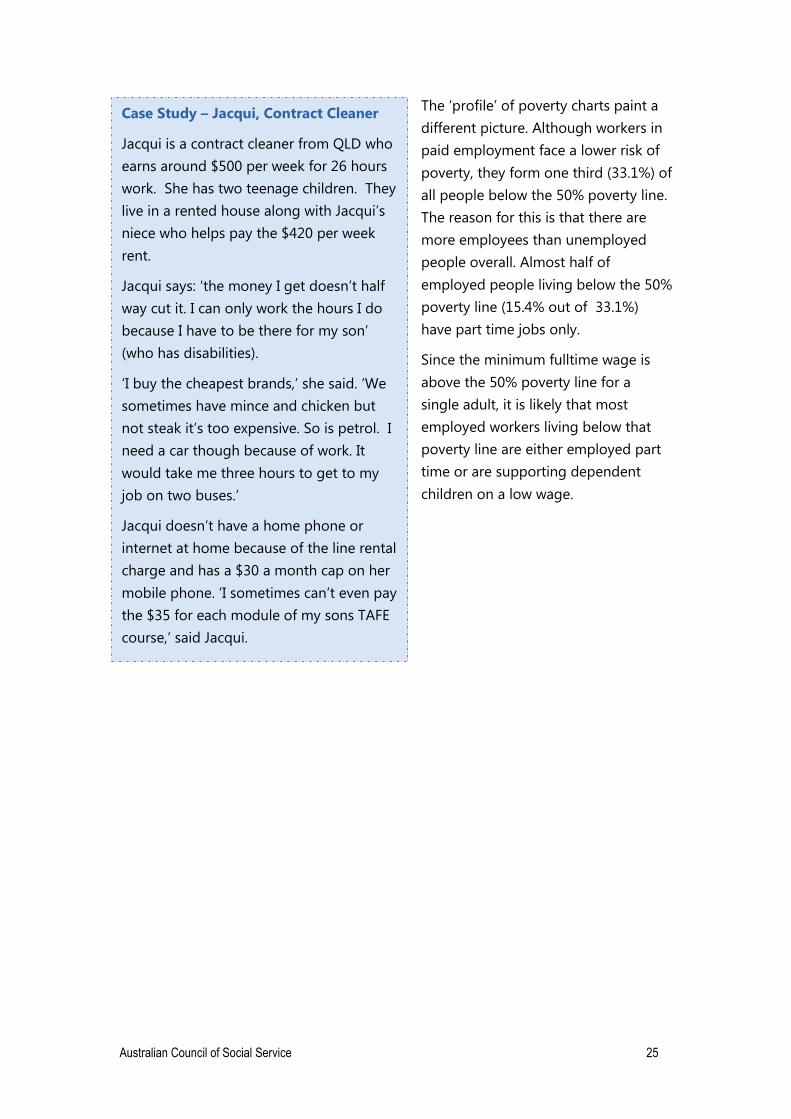
The risk of poverty among people of working age outside the paid labour force
(43.7%) is also relatively high. Many of these people have disabilities or caring roles
and are reliant on social security payments such as Disability Support Pension,
Parenting Payment and Carer Payment.
The risk of poverty (14%) among older people not in the labour force, who are mostly
retired, sits in between that of people with paid work and unemployed people. This
reflects the higher rate of Age Pension compared to Newstart Allowance, the
increasing number of people retiring with at least some superannuation, and the
lower housing costs of those who own their homes outright.
Profile of Poverty by Labour Market Status (%)
50% of median income poverty line 60% of median income poverty line
Employed (full
time), 20.5
Employed (part time), 13.5
Unemployed, 5.9
Not in labour force
(retired), 24.6
Not in labour force
(other), 35.5
Australian Council of Social Service 25
Case Study – Jacqui, Contract Cleaner
Jacqui is a contract cleaner from QLD who
earns around $500 per week for 26 hours
work. She has two teenage children. They
live in a rented house along with Jacqui’s
niece who helps pay the $420 per week
rent.
Jacqui says: ‘the money I get doesn’t half
way cut it. I can only work the hours I do
because I have to be there for my son’
(who has disabilities).
‘I buy the cheapest brands,’ she said. ‘We
sometimes have mince and chicken but
not steak it’s too expensive. So is petrol. I
need a car though because of work. It
would take me three hours to get to my
job on two buses.’
Jacqui doesn’t have a home phone or
internet at home because of the line rental
charge and has a $30 a month cap on her
mobile phone. ‘I sometimes can’t even pay
the $35 for each module of my sons TAFE
course,’ said Jacqui.
The ‘profile’ of poverty charts paint a
different picture. Although workers in
paid employment face a lower risk of
poverty, they form one third (33.1%) of
all people below the 50% poverty line.
The reason for this is that there are
more employees than unemployed
people overall. Almost half of
employed people living below the 50%
poverty line (15.4% out of 33.1%)
have part time jobs only.
Since the minimum fulltime wage is
above the 50% poverty line for a
single adult, it is likely that most
employed workers living below that
poverty line are either employed part
time or are supporting dependent
children on a low wage.
26 Australian Council of Social Service
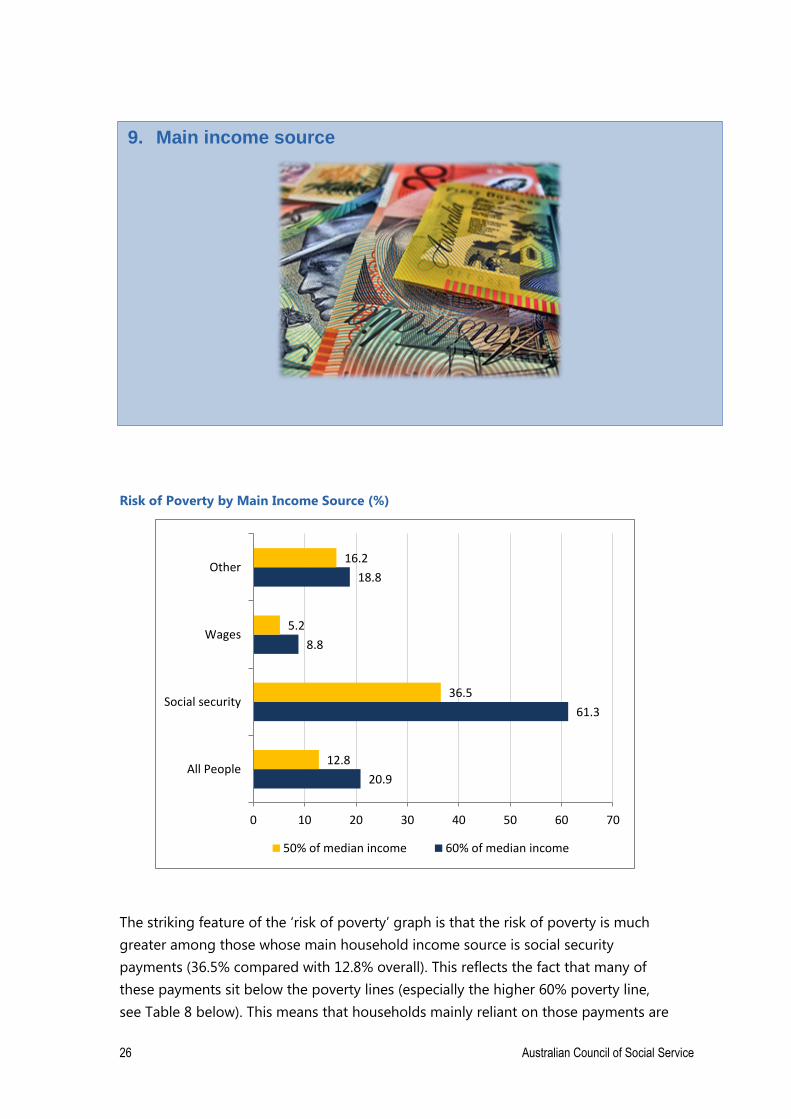
Risk of Poverty by Main Income Source (%)
The striking feature of the ‘risk of poverty’ graph is that the risk of poverty is much
greater among those whose main household income source is social security
payments (36.5% compared with 12.8% overall). This reflects the fact that many of
these payments sit below the poverty lines (especially the higher 60% poverty line,
see Table 8 below). This means that households mainly reliant on those payments are
20.9
61.3
8.8
18.8
12.8
36.5
5.2
16.2
0 10 20 30 40 50 60 70
All People
Social security
Wages
Other
50% of median income 60% of median income
9. Main income source
Australian Council of Social Service 27
Ahmed, Newstart Recipient
28 year old Ahmed has been on different income support payments since 2005,
including four years on Youth Allowance while undertaking a science degree which
he completed in late 2011. Ahmed was able to top up his Youth Allowance with 20
hours a week paid work as a security guard.
Since completing his degree in a specialist research area, he has struggled to find a
job and does unpaid voluntary work at two different research institutions in the hope
that some paid work will come his way.
In the meantime he is left to survive on Newstart Allowance, which is barely covering
his rent and basic living expenses. Recently he moved in with his partner who only
last week gave birth to their first child. He is hopeful that life will get better.
63.9
30.2
6
Social security payment Wages Other
62.2
29.4
8.4
Social security payment Wages Other
likely to be living below the poverty line unless they have other sources of income
such as part time earnings or superannuation.
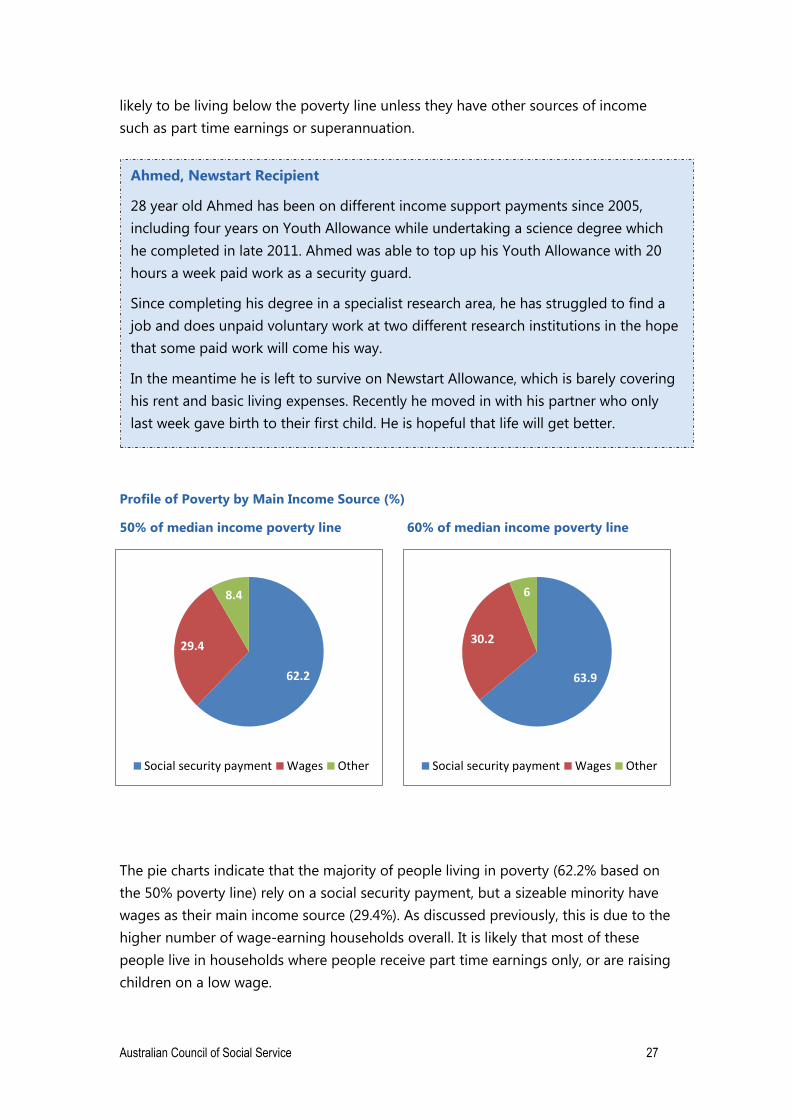
Profile of Poverty by Main Income Source (%)
50% of median income poverty line 60% of median income poverty line
The pie charts indicate that the majority of people living in poverty (62.2% based on
the 50% poverty line) rely on a social security payment, but a sizeable minority have
wages as their main income source (29.4%). As discussed previously, this is due to the
higher number of wage-earning households overall. It is likely that most of these
people live in households where people receive part time earnings only, or are raising
children on a low wage.
28 Australian Council of Social Service
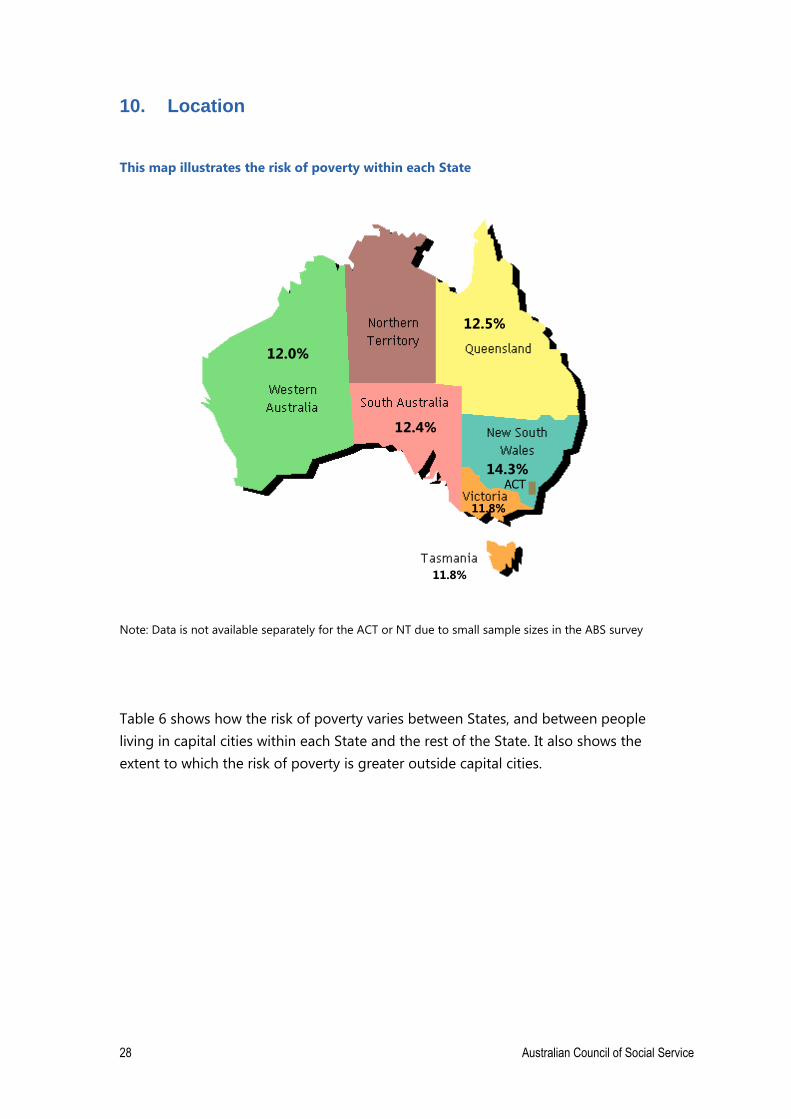
10. Location
This map illustrates the risk of poverty within each State
Note: Data is not available separately for the ACT or NT due to small sample sizes in the ABS survey
Table 6 shows how the risk of poverty varies between States, and between people
living in capital cities within each State and the rest of the State. It also shows the
extent to which the risk of poverty is greater outside capital cities.
12.0%
12.5%
12.4%
14.3%
11.8%
11.8%
ACT
Australian Council of Social Service 29
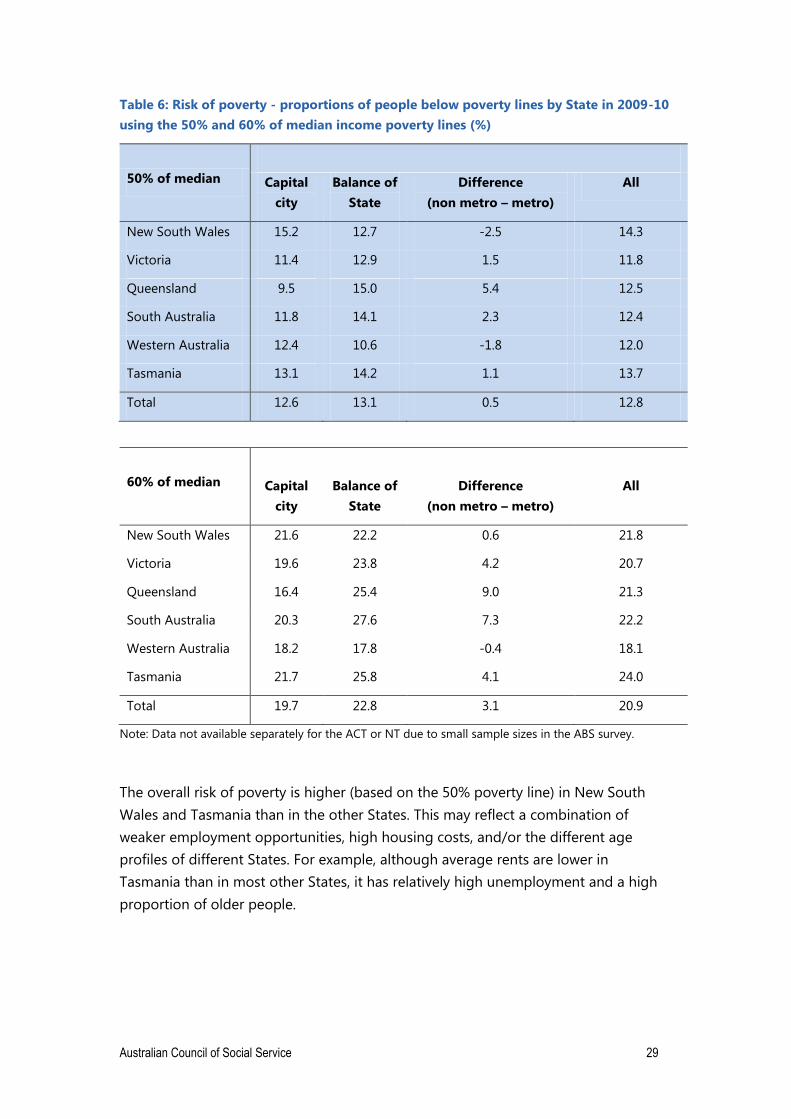
Table 6: Risk of poverty - proportions of people below poverty lines by State in 2009-10
using the 50% and 60% of median income poverty lines (%)
50% of median
Capital
city
Balance of
State
Difference
(non metro – metro)
All
New South Wales 15.2 12.7 -2.5 14.3
Victoria 11.4 12.9 1.5 11.8
Queensland 9.5 15.0 5.4 12.5
South Australia 11.8 14.1 2.3 12.4
Western Australia 12.4 10.6 -1.8 12.0
Tasmania 13.1 14.2 1.1 13.7
Total 12.6 13.1 0.5 12.8
60% of median
Capital
city
Balance of
State
Difference
(non metro – metro)
All
New South Wales 21.6 22.2 0.6 21.8
Victoria 19.6 23.8 4.2 20.7
Queensland 16.4 25.4 9.0 21.3
South Australia 20.3 27.6 7.3 22.2
Western Australia 18.2 17.8 -0.4 18.1
Tasmania 21.7 25.8 4.1 24.0
Total 19.7 22.8 3.1 20.9
Note: Data not available separately for the ACT or NT due to small sample sizes in the ABS survey.
The overall risk of poverty is higher (based on the 50% poverty line) in New South
Wales and Tasmania than in the other States. This may reflect a combination of
weaker employment opportunities, high housing costs, and/or the different age
profiles of different States. For example, although average rents are lower in
Tasmania than in most other States, it has relatively high unemployment and a high
proportion of older people.
30 Australian Council of Social Service
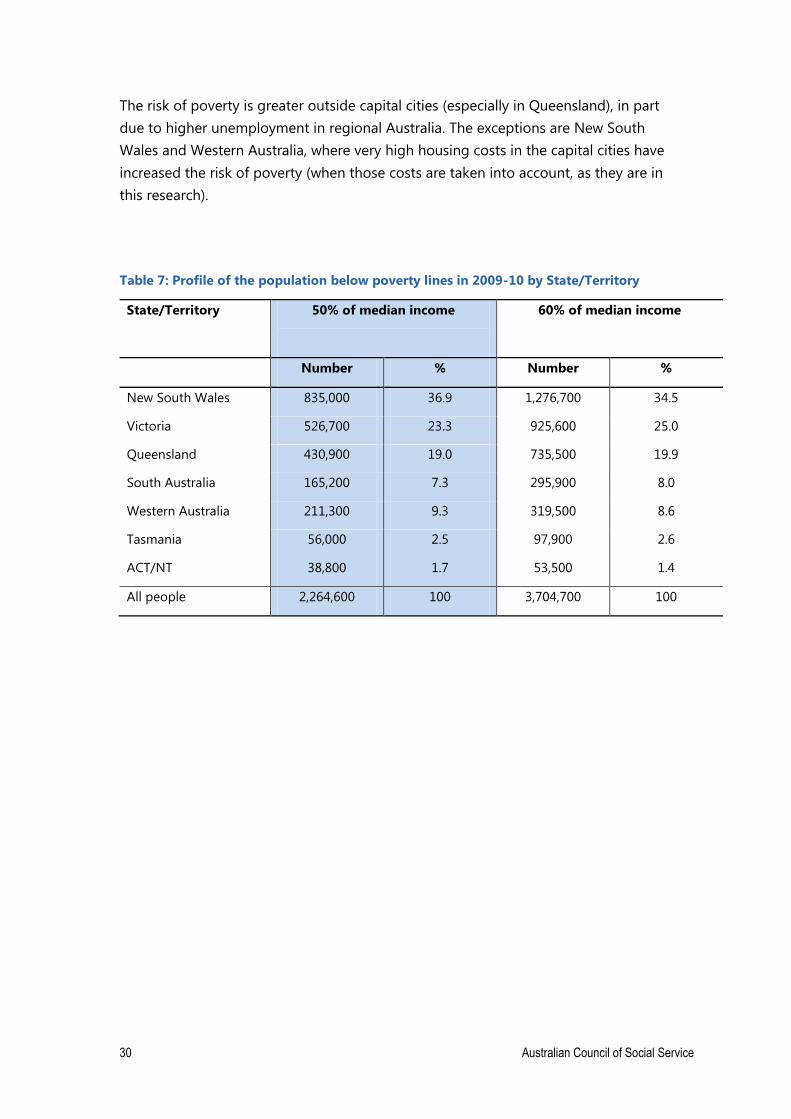
The risk of poverty is greater outside capital cities (especially in Queensland), in part
due to higher unemployment in regional Australia. The exceptions are New South
Wales and Western Australia, where very high housing costs in the capital cities have
increased the risk of poverty (when those costs are taken into account, as they are in
this research).
Table 7: Profile of the population below poverty lines in 2009-10 by State/Territory
State/Territory 50% of median income
60% of median income
Number % Number %
New South Wales 835,000 36.9 1,276,700 34.5
Victoria 526,700 23.3 925,600 25.0
Queensland 430,900 19.0 735,500 19.9
South Australia 165,200 7.3 295,900 8.0
Western Australia 211,300 9.3 319,500 8.6
Tasmania 56,000 2.5 97,900 2.6
ACT/NT 38,800 1.7 53,500 1.4
All people 2,264,600 100 3,704,700 100
Australian Council of Social Service 31
Marjorie’s story
Earlier this year, Marjorie was
informed by Centrelink that they were
taking away her wife's pension 14
weeks (bereavement payment) after
her husband's passing after being his
principle carer for 13 years of his
illness. Because she is 63 years old
she is not entitled to the Age pension
and has been forced to live on much
less on the Widows Allowance
payment of $486 per fortnight.
Marjorie said: ‘This news was
devastating, especially soon after such
a big loss in my life. If it wasn’t for the
loving support and help of my children
I simply don’t know how I could
survive on so little money.’
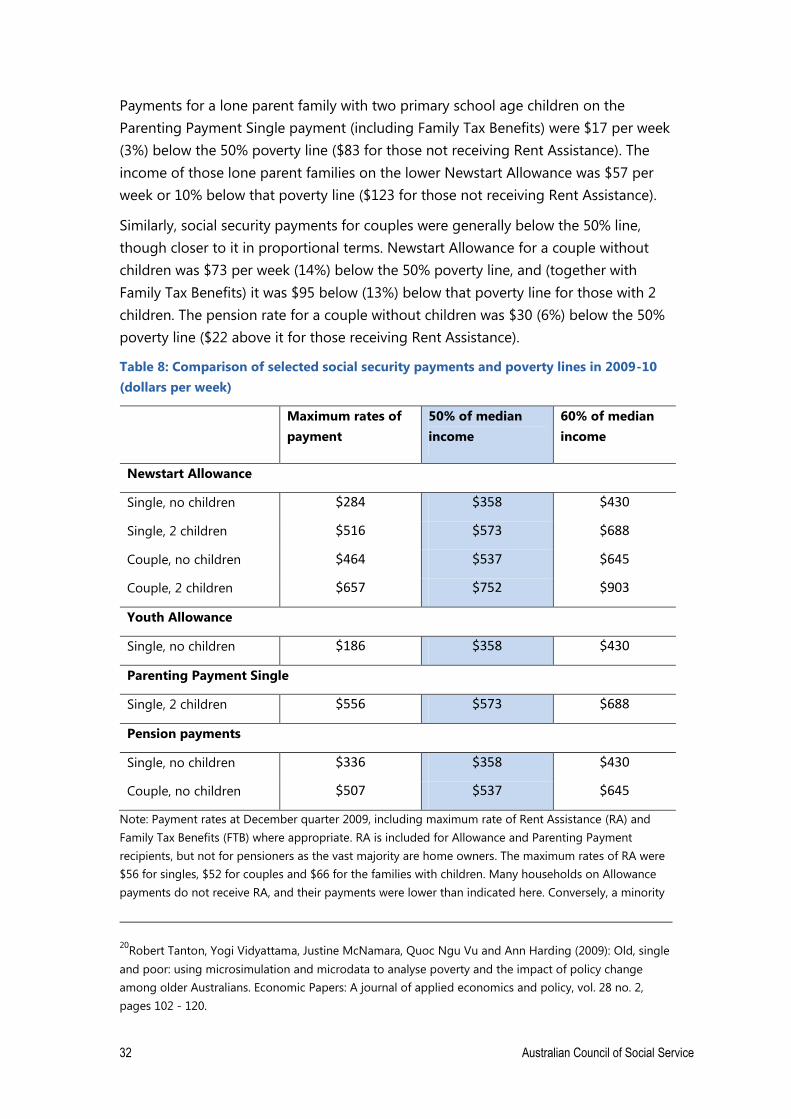
Table 8 compares the maximum rates of
major social security payments with the
poverty lines. It indicates how far above or
below poverty lines people relying fully on
these payments (those with no other source
of income) lie19.
It shows that Newstart Allowance for single
adults was $74 per week (21%) below the
50% of median income poverty line. Youth
Allowance for independent young people
was $172 per week (48%) below the poverty
line. The difference between these payments
and the poverty line is $56 per week greater
in cases where households are not eligible
for Rent Assistance.
Following a $32 per week pension increase
(above inflation) in September 2009, the
single pension rate was closer to, but still
$22 per week (6%) below, the 50% poverty
line. A study by NATSEM estimated at
the time that an increase of that size would reduce the risk of poverty among
single age pensioners by around 10 percentage points20. For those receiving
Rent Assistance, it was $34 per week above the 50% line but $38 below the 60% line.
________________________________
19 Note that the maximum social security payment rates include Family Tax Benefits (for families with
children) and Rent Assistance (RA) in some cases (see Table 8).
11. Poverty among people on social security payments
32 Australian Council of Social Service
Payments for a lone parent family with two primary school age children on the
Parenting Payment Single payment (including Family Tax Benefits) were $17 per week
(3%) below the 50% poverty line ($83 for those not receiving Rent Assistance). The
income of those lone parent families on the lower Newstart Allowance was $57 per
week or 10% below that poverty line ($123 for those not receiving Rent Assistance).
Similarly, social security payments for couples were generally below the 50% line,
though closer to it in proportional terms. Newstart Allowance for a couple without
children was $73 per week (14%) below the 50% poverty line, and (together with
Family Tax Benefits) it was $95 below (13%) below that poverty line for those with 2
children. The pension rate for a couple without children was $30 (6%) below the 50%
poverty line ($22 above it for those receiving Rent Assistance).
Table 8: Comparison of selected social security payments and poverty lines in 2009-10
(dollars per week)
Maximum rates of
payment
50% of median
income
60% of median
income
Newstart Allowance
Single, no children $284 $358 $430
Single, 2 children $516 $573 $688
Couple, no children $464 $537 $645
Couple, 2 children $657 $752 $903
Youth Allowance
Single, no children $186 $358 $430
Parenting Payment Single
Single, 2 children $556 $573 $688
Pension payments
Single, no children $336 $358 $430
Couple, no children $507 $537 $645
Note: Payment rates at December quarter 2009, including maximum rate of Rent Assistance (RA) and
Family Tax Benefits (FTB) where appropriate. RA is included for Allowance and Parenting Payment
recipients, but not for pensioners as the vast majority are home owners. The maximum rates of RA were
$56 for singles, $52 for couples and $66 for the families with children. Many households on Allowance
payments do not receive RA, and their payments were lower than indicated here. Conversely, a minority
20Robert Tanton, Yogi Vidyattama, Justine McNamara, Quoc Ngu Vu and Ann Harding (2009): Old, single
and poor: using microsimulation and microdata to analyse poverty and the impact of policy change
among older Australians. Economic Papers: A journal of applied economics and policy, vol. 28 no. 2,
pages 102 - 120.
Australian Council of Social Service 33
of pensioners receive RA, in which case their payments were higher than indicated. The Youth Allowance
rate is for a young person 18 to 24 years living away from home. All children are aged 6-11 years. Some
lone parents receive the higher Parenting Payment Single payment while others receive the lower
Newstart Allowance payment. Pension payments include Age, Disability, and Carer pensions.
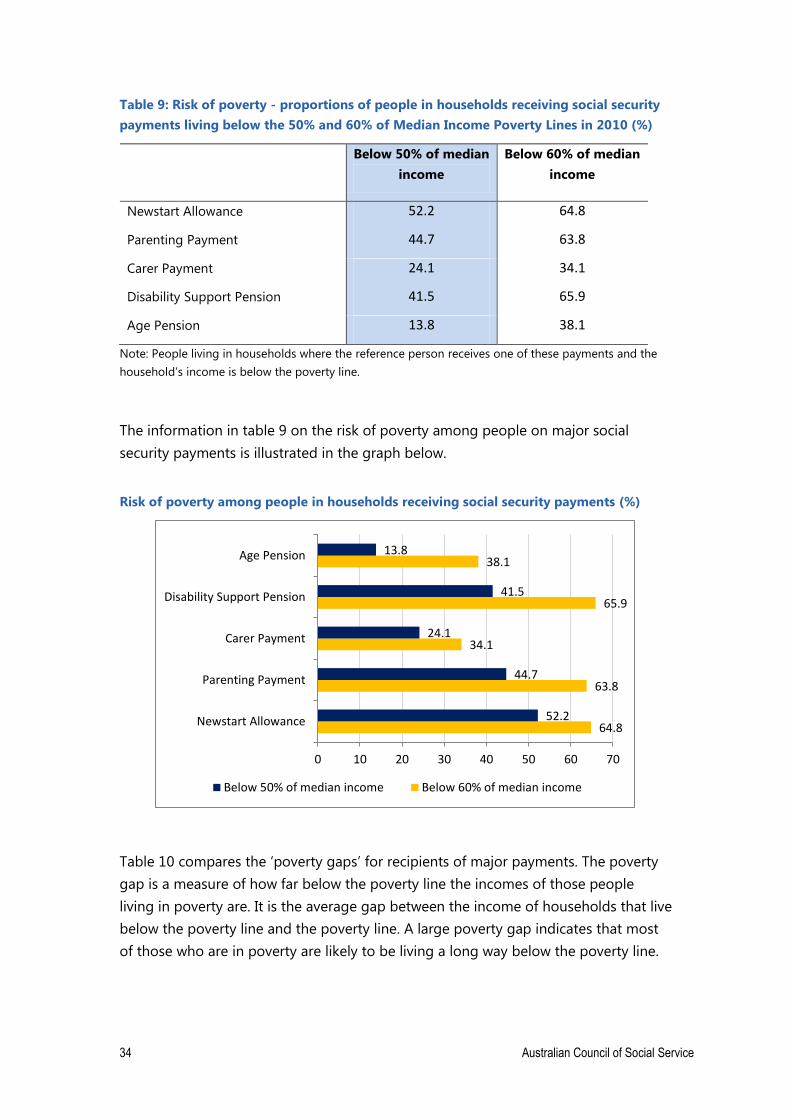
Table 9 compares the risk of poverty among recipients of different income support
payments. Just over half (52.2%) of people in households where the ‘reference
person’ receives Newstart Allowance (for unemployed people) are in households with
incomes below the 50% poverty line. This reflects the low level of that payment (as
shown in Table 8) and the fact that only about one in five recipients has earnings
from employment. Also, an above-average proportion of Newstart recipients rent
their accommodation and therefore face high housing costs21.
Almost half (44.7%) of people in households with Parenting Payment (most of whom
are lone parents) are below the poverty line. This group is also more likely than the
average household to rent their housing, and around one in three has earnings from
employment. Along with Newstart recipients, people on Parenting Payment did not
receive the September 2009 pension increase so their maximum rate of payment is
significantly lower than other pensions.
A slightly lower proportion (41.2%) of people in households with Disability Support
Pension were below the poverty line. While this group benefited from the 2009
pension increase, only about in ten has part-time earnings.
Age pensioners had a lower risk of poverty (13.8%) than recipients of the other
payments listed in table 9, which reflects lower housing costs (for the majority who
own their homes outright), the pension increase in 2009, and income from
superannuation and other investments.
The risk of poverty among people in households with Carer Payment (24.1%) sits
between that for Age Pensioners and the other payments. Carer Payment recipients
are unlikely to have paid employment because they are caring fulltime for a relative
with a disability, though they have a higher level of home ownership than recipients
of the other working-age payments.
In all cases, over one third of people in households with these social security
payments had incomes below the higher 60% poverty line. This reflects the fact that
the maximum rate of their social security payments sat below that poverty line, as
shown in Table 8.
________________________________
21 FaHCSIA (2012): Income support customers: a statistical overview 2011. Statistical Paper no. 10.
Department of Families and Housing, Community Services and Indigenous Affairs, Canberra. Available:
http://www.fahcsia.gov.au/sites/default/files/documents/07_2012/stps10.pdf
34 Australian Council of Social Service
Table 9: Risk of poverty - proportions of people in households receiving social security
payments living below the 50% and 60% of Median Income Poverty Lines in 2010 (%)
Below 50% of median
income
Below 60% of median
income
Newstart Allowance 52.2 64.8
Parenting Payment 44.7 63.8
Carer Payment 24.1 34.1
Disability Support Pension 41.5 65.9
Age Pension 13.8 38.1
Note: People living in households where the reference person receives one of these payments and the
household’s income is below the poverty line.
The information in table 9 on the risk of poverty among people on major social
security payments is illustrated in the graph below.
Risk of poverty among people in households receiving social security payments (%)
Table 10 compares the ‘poverty gaps’ for recipients of major payments. The poverty
gap is a measure of how far below the poverty line the incomes of those people
living in poverty are. It is the average gap between the income of households that live
below the poverty line and the poverty line. A large poverty gap indicates that most
of those who are in poverty are likely to be living a long way below the poverty line.
64.8
63.8
34.1
65.9
38.1
52.2
44.7
24.1
41.5
13.8
0 10 20 30 40 50 60 70
Newstart Allowance
Parenting Payment
Carer Payment
Disability Support Pension
Age Pension
Below 50% of median income Below 60% of median income
Australian Council of Social Service 35
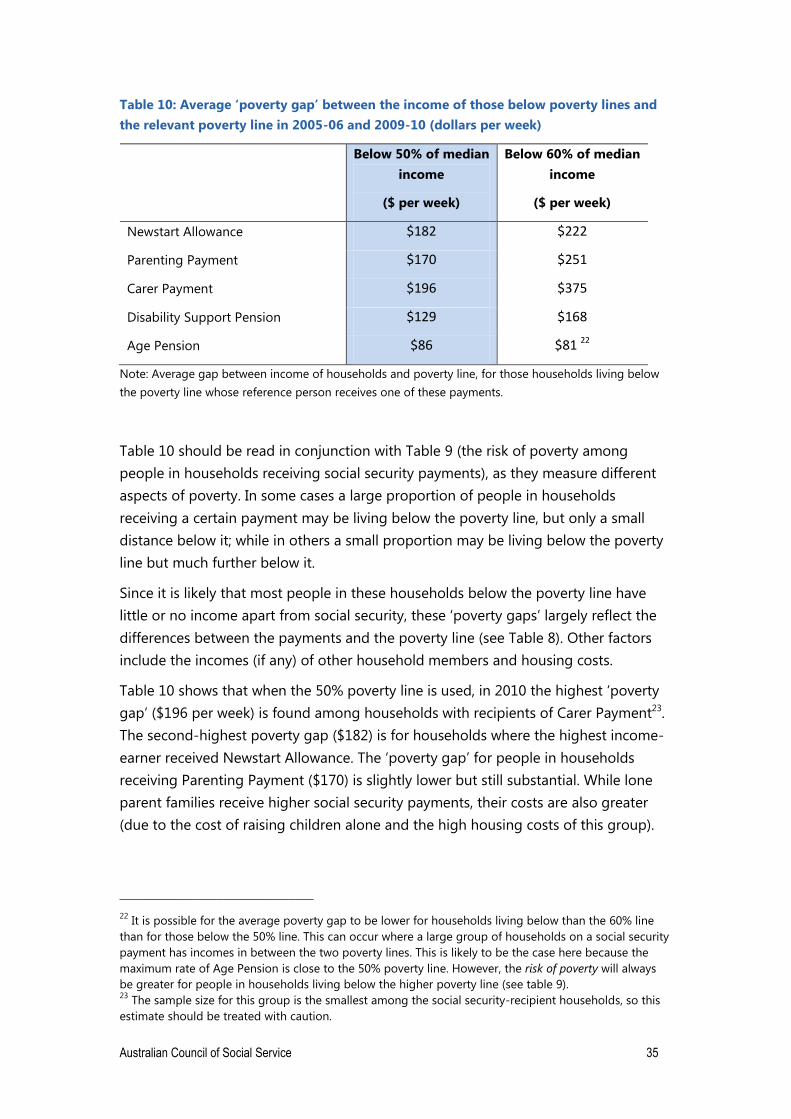
Table 10: Average ‘poverty gap’ between the income of those below poverty lines and
the relevant poverty line in 2005-06 and 2009-10 (dollars per week)
Below 50% of median
income
($ per week)
Below 60% of median
income
($ per week)
Newstart Allowance $182 $222
Parenting Payment $170 $251
Carer Payment $196 $375
Disability Support Pension $129 $168
Age Pension $86 $81 22
Note: Average gap between income of households and poverty line, for those households living below
the poverty line whose reference person receives one of these payments.
Table 10 should be read in conjunction with Table 9 (the risk of poverty among
people in households receiving social security payments), as they measure different
aspects of poverty. In some cases a large proportion of people in households
receiving a certain payment may be living below the poverty line, but only a small
distance below it; while in others a small proportion may be living below the poverty
line but much further below it.
Since it is likely that most people in these households below the poverty line have
little or no income apart from social security, these ‘poverty gaps’ largely reflect the
differences between the payments and the poverty line (see Table 8). Other factors
include the incomes (if any) of other household members and housing costs.
Table 10 shows that when the 50% poverty line is used, in 2010 the highest ‘poverty
gap’ ($196 per week) is found among households with recipients of Carer Payment23.
The second-highest poverty gap ($182) is for households where the highest income-
earner received Newstart Allowance. The ‘poverty gap’ for people in households
receiving Parenting Payment ($170) is slightly lower but still substantial. While lone
parent families receive higher social security payments, their costs are also greater
(due to the cost of raising children alone and the high housing costs of this group).
________________________________
22 It is possible for the average poverty gap to be lower for households living below than the 60% line
than for those below the 50% line. This can occur where a large group of households on a social security
payment has incomes in between the two poverty lines. This is likely to be the case here because the
maximum rate of Age Pension is close to the 50% poverty line. However, the risk of poverty will always
be greater for people in households living below the higher poverty line (see table 9). 23
The sample size for this group is the smallest among the social security-recipient households, so this
estimate should be treated with caution.
36 Australian Council of Social Service
The poverty gaps are also substantial among Disability Support Pensioners at ($129
per week) and Age Pensioners ($86), though lower than for the other payment
recipients. This reflects the smaller gaps between the maximum rates of those
payments and the 50% poverty line (see Table 8).
Australian Council of Social Service 37
11. Trends in the risk of poverty from 2003 to 2010 (50% of
median income poverty line)
A comparison of data from a series of ABS Surveys of Income and Housing (SIH)
shows that the risk of poverty in Australia rose between 2003 and 2010.
Unfortunately, due to changes in the way the ABS defined ‘income’ from one survey
to the next, these data are not strictly comparable from 2003 all the way though to
2010 (hence the break in the graph around 2005). For the same reason, the ‘risk of
poverty’ rate for 2010 in this historical comparison is slightly different (12.2%) to the
poverty rate used elsewhere in this Report (12.8%)24.
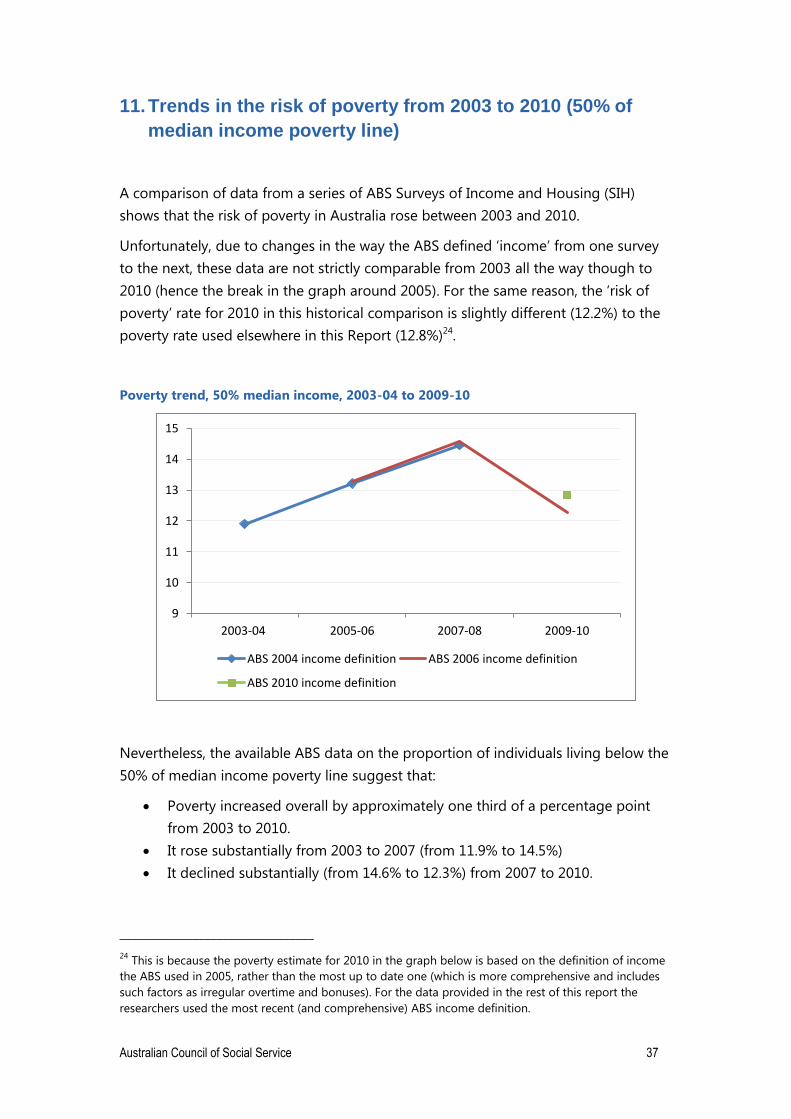
Poverty trend, 50% median income, 2003-04 to 2009-10
Nevertheless, the available ABS data on the proportion of individuals living below the
50% of median income poverty line suggest that:
Poverty increased overall by approximately one third of a percentage point
from 2003 to 2010.
It rose substantially from 2003 to 2007 (from 11.9% to 14.5%)
It declined substantially (from 14.6% to 12.3%) from 2007 to 2010.
________________________________
24 This is because the poverty estimate for 2010 in the graph below is based on the definition of income
the ABS used in 2005, rather than the most up to date one (which is more comprehensive and includes
such factors as irregular overtime and bonuses). For the data provided in the rest of this report the
researchers used the most recent (and comprehensive) ABS income definition.
9
10
11
12
13
14
15
2003-04 2005-06 2007-08 2009-10
ABS 2004 income definition ABS 2006 income definition
ABS 2010 income definition
38 Australian Council of Social Service
The main reason for the increase in poverty from 2003 to 2007 is likely to be that
community incomes (represented by the ‘median income’ measure on which the
poverty lines are based) rose strongly over this period but a growing minority of
people (those below the poverty line) fell behind. For example, the real incomes of
people on some social security payments fell behind because their payments were
only indexed to the CPI and not to wages. Over this period, the impact of the rise in
overall community incomes on poverty levels was greater than the poverty-reducing
impact of the fall in unemployment.
The reasons for the dip in poverty between 2007 and 2010 are likely to include the
economic downturn in 2008-09 (which depressed median incomes without
substantially increasing unemployment) and the increases in pension payments for
single people in September 2009 which lifted many people with small amounts of
non-pension income (such as interest from investments) above the 50% of median
income poverty line.