Embed Size (px)
Citation preview

Activated Sludge Process Control:
Nitrification60th Annual KWWOA Conference, Session 1: April 11, 2017
Dan Miklos, Senior Associate, Midwest Region, Hazen and Sawyer
Agenda
Overview of the Utopia Plant Upgrade Path
• Nitrification Limits with wet weather flow improvements
• Nitrification Limits and Phosphorus
• Total Nitrogen and Phosphorus
Process Control for Nitrification:
• How much do I waste?
• What should the dissolved oxygen be?
• What should the RAS rate be?
Process Upgrades
• Anaerobic selector
• How to optimize sludge quality with an anaerobic selector.
• Step feed for peak flows
• How Step Feed can reduce solids loading to the secondary
clarifiers.
Questions

Regulatory Compliance in Kentucky
• The Division of Water was created by Executive Order on August 1,
1980, by combining the divisions of Water Quality, Water Resources,
and Sanitary Engineering. The Division regulates the withdrawal and
diversion of all public waters, construction and maintenance of dams,
and all construction activities across, along, or in the floodplain of any
water body in the state. The Division is responsible for programs for the
certification of wastewater treatment plant operators, drinking water
treatment plant operators, and water well drillers.
• The Division of Water is the administering agency for the National
Pollutant Discharge Elimination System (NPDES). Program delegation
was made on September 30, 1983, by the U.S. Environmental
Protection Agency, Region IV. Kentucky’s program is entitled the
Kentucky Pollutant Discharge Elimination System (KPDES).
1972 Clean Water Act and NPDES Program
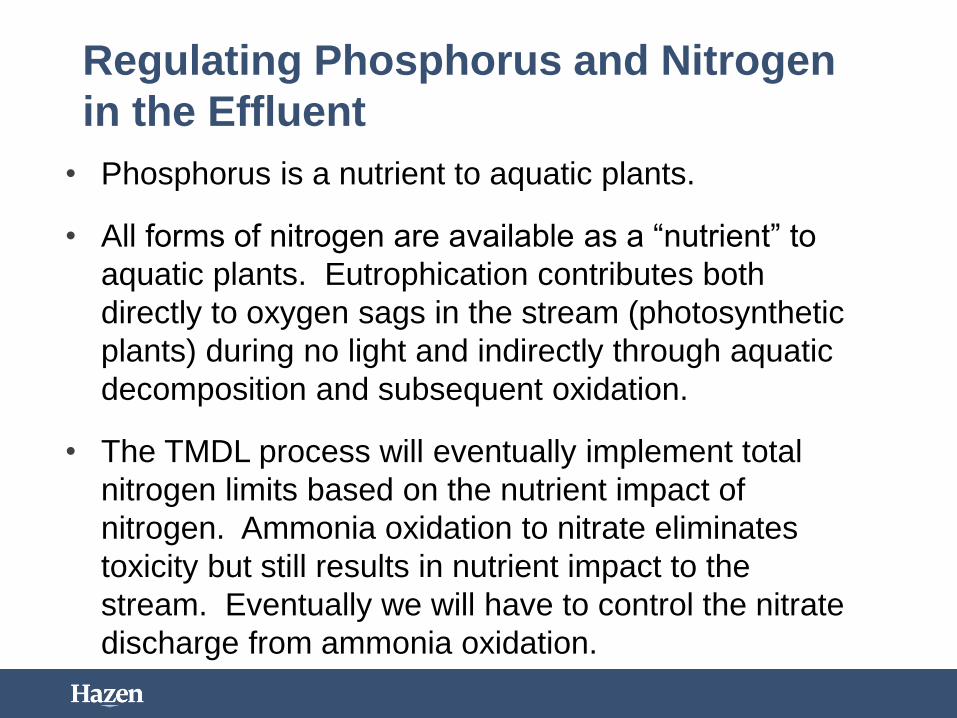
Regulating Phosphorus and Nitrogen
in the Effluent
• Phosphorus is a nutrient to aquatic plants.
• All forms of nitrogen are available as a “nutrient” to
aquatic plants. Eutrophication contributes both
directly to oxygen sags in the stream (photosynthetic
plants) during no light and indirectly through aquatic
decomposition and subsequent oxidation.
• The TMDL process will eventually implement total
nitrogen limits based on the nutrient impact of
nitrogen. Ammonia oxidation to nitrate eliminates
toxicity but still results in nutrient impact to the
stream. Eventually we will have to control the nitrate
discharge from ammonia oxidation.
Evolution of the Utopia Plant
Tightening Regulations and changes in KPDES limits:
• Unit process type, size, and process control (and even facility name)
Utopia Sewer Plant
• Activated Sludge Process Control with Nitrification Limits
• Upgrade for improved settling and peak flows
Utopia Wastewater Treatment Plant
• Activated Sludge Process Control with Nitrification & Phosphorus Limits
Utopia Water Reclamation Facility
• Activated Sludge Process Control with Total Nitrogen & Phosphorus
Limits
Responding to the 1972 Clean Water Act and changing KPDES limits

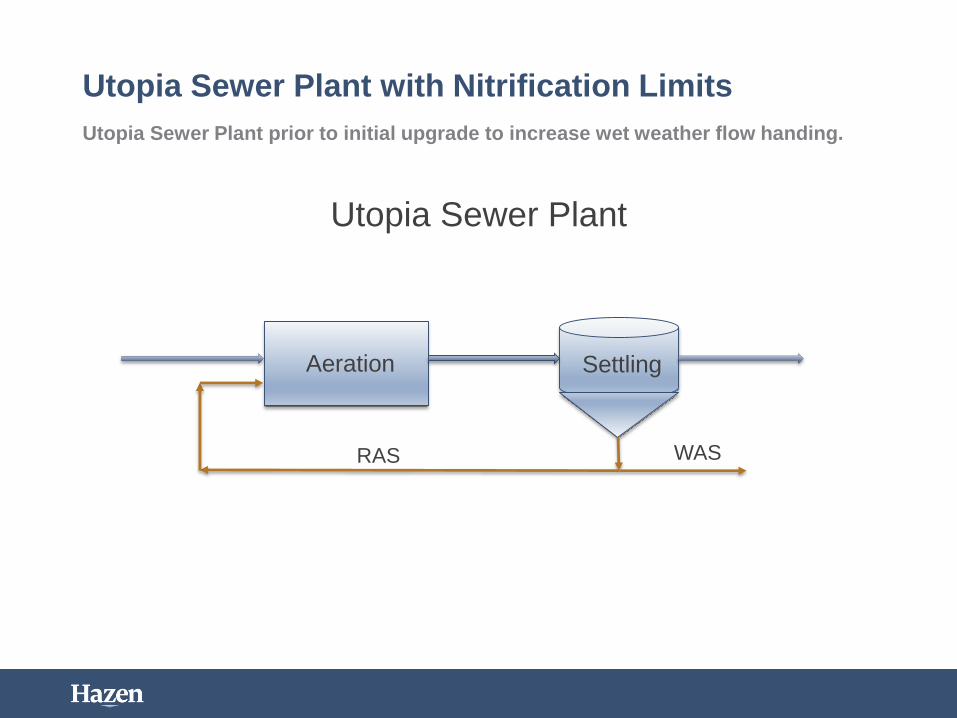
Utopia Sewer Plant with Nitrification Limits
Utopia Sewer Plant prior to initial upgrade to increase wet weather flow handing.
Aeration Settling
Utopia Sewer Plant
RAS WAS

Utopia Sewer Plant
First Upgrade to Sewer Plant
• The Utopia plant has SSO (sanitary sewer overflows).
• Although the sewer system was separate, it was old and
leaky. The engineering consultant recommended to first
increase flows through the plant.
• Settling was not optimum, and an anaerobic selector was
installed to improved settleability to improve flow handling
capability and in general improve effluent quality.
• Step Feed was provided to reduce solids loading to the
clarifiers during wet weather peak flows.
• Effluent quality was improved to meet: 15 mg/L cBOD5, 18
mg/L TSS and 1.5 mg/L ammonia.
Upgrade Path for increased flow through plant
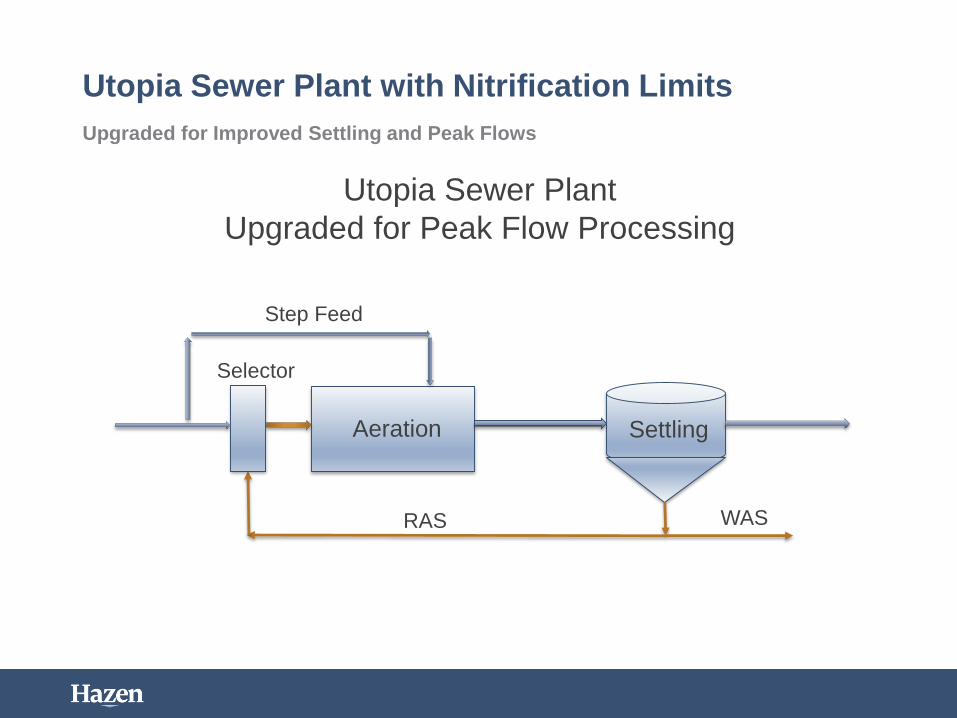
Utopia Sewer Plant with Nitrification Limits
Upgraded for Improved Settling and Peak Flows
Aeration Settling
RAS WAS
Selector
Step Feed
Utopia Sewer Plant
Upgraded for Peak Flow Processing

Utopia Wastewater Treatment Plant
Second Upgrade to Utopia Wastewater Treatment Plant
• The Utopia plant had increased wet weather peak flow
processing, allowing time for sewer rehabilitation to slowly
reduce I&I without breaking the bank.
• Phosphorus limits (1 mg/L) were imposed in the new
KPDES permit.
• Settling has been improved with an anaerobic selector and
step feed allowed the staff to further increase flows through
the facility during wet weather.
• The first upgrade had provided for increasing the size of
the anaerobic selector to an anaerobic biological
phosphorus tank.
• Effluent quality was improved to meet: 15 mg/L cBOD5, 18
mg/L TSS and 1.5 mg/L ammonia.
Upgrade Path for maintaining flow rates and provide for biological
phosphorus removal
Utopia Wastewater Treatment Plant
Second Upgrade to Utopia Wastewater Treatment Plant
• The first upgrade also provided for peak flow bypassing of
the anaerobic selector and enabled the plant to temporarily
suspended anaerobic selector operation during peak flows
and protect the biosolids conditioning during peak flows.
• The anaerobic biological phosphorous selector tank (or Bio
P Tank) as called by staff received only RAS flow during
wet weather.
• Effluent quality was improved to meet: 15 mg/L cBOD5, 18
mg/L TSS, 1.5 mg/L ammonia and 1 mg/L phosphorus.
Upgrade Path for maintaining flow rates and provide for biological
phosphorus removal

Utopia Wastewater Treatment Plant with Nitrification and
Phosphorus LimitsSecond Upgrade for Phosphorus Limits
Aeration Settling
RAS WAS
Anaerobic
Bio P Tank
Step Feed
Utopia Wastewater Treatment Plant
Upgraded for Biological Phosphorus Removal
Utopia Water Reclamation Facility
Third Upgrade to Water Reclamation Facility
• Sewer improvements continued and another KDPES cycle
had also imposed total nitrogen limits in addition to cBOD5,
TSS, ammonia and phosphorus.
• Total Nitrogen Limits of 7 mg/L were imposed in the new
KPDES permit. The total of ammonia, nitrate and nitrite
could not exceed 7 mg/L. Ammonia could not exceed 1.5
mg/L while nitrate and nitrite could not cause the total to
exceed 7 mg/L.
• Settling was excellent and the previous biological
phosphorus removal operation prepared staff for an even
tighter process control program.
• Effluent quality was improved to meet: 15 mg/L cBOD5, 18
mg/L TSS, 1.5 mg/L ammonia with TN less than 7 mg/L.
Upgrade Path for maintaining flow rates and provide both total nitrogen and
biological phosphorus removal

Utopia Wastewater Treatment Plant with Total Nitrogen and
Phosphorus LimitsThird Upgrade for Total Nitrogen and Phosphorus Limits
Aeration Settling
RAS WAS
Anaerobic
Bio P Tank
Step Feed
Anoxic
Reaeration
Utopia Wastewater Treatment Plant
Upgraded for full BNR Operation
Utopia Water Reclamation Facility
Process Control had to also improve to take advantage
of each upgrade at Utopia.
Construction provided additional unit process tankage
to improve:
1. Settleability to improve settling effluent quality.
2. Step feed to decrease solids loading to the clarifiers while
increasing wet weather flows.
3. Biological Phosphorus tankage to provide effluent quality
less than 1 mg/L P with minimal chemical addition.
4. Total Nitrogen operation required additional tankage,
monitoring and control to meet permit requirements.
Process Control following each phase of construction improvements.
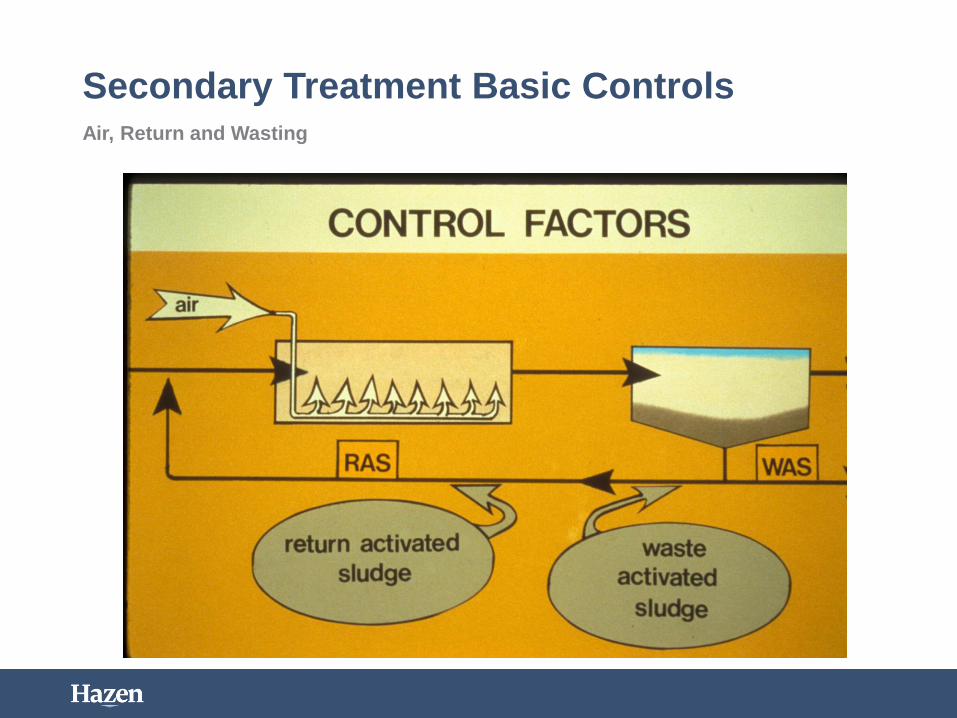
Secondary Treatment Basic ControlsAir, Return and Wasting
Utopia Sewer Plant with Nitrification Limits
Utopia Sewer Plant prior to initial upgrade to increase wet weather flow handing.
Aeration Settling
Utopia Sewer Plant
RAS WAS
Remaining Ammonia Removal - Nitrification
• The WWPT nitrogen removal must count on
additional microbiology other than assimilation
(cBOD5) if an effluent ammonia limit is to be met.
• Municipal plants rely on a separate culture of
nitrifying bacteria must be optimized for ammonia
removal (to remove ammonia that is left after
assimilation and growth).
• Nitrification converts ammonia to nitrite, then nitrite to
nitrate.

Ammonia Oxidation - Nitrification
• Nitrifiers are thought to typically range from 1-4% of the
population.
• AOB (referred to in general as Nitrosomonas) is responsible for
the loss in alkalinity with the production of nitrous acid
(destroying approximately 7.14 mg/L of alkalinity for mg/L of
ammonia oxidized).
• Nitrification can be stopped with a loss in available alkalinity.
Total alkalinity results below pH operating range (total alkalinity
is titrated to a pH of 4.5 S.U. Alkalinity below 6.8 S.U. begins
inhibiting nitrification rates.
Ammonia Oxidation - Nitrification
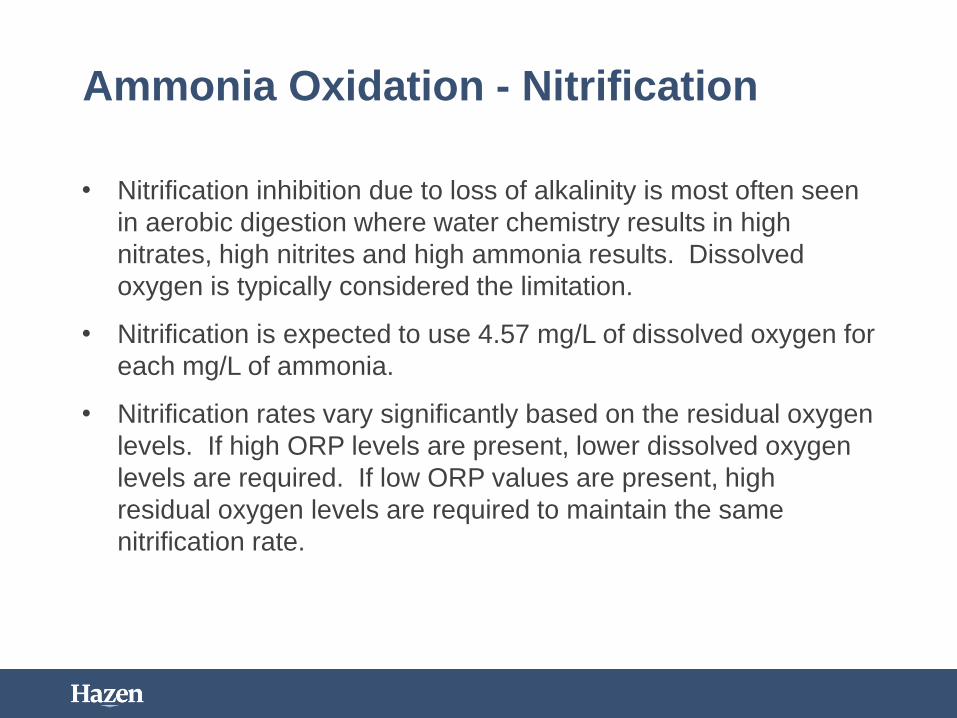
• Nitrification inhibition due to loss of alkalinity is most often seen
in aerobic digestion where water chemistry results in high
nitrates, high nitrites and high ammonia results. Dissolved
oxygen is typically considered the limitation.
• Nitrification is expected to use 4.57 mg/L of dissolved oxygen for
each mg/L of ammonia.
• Nitrification rates vary significantly based on the residual oxygen
levels. If high ORP levels are present, lower dissolved oxygen
levels are required. If low ORP values are present, high
residual oxygen levels are required to maintain the same
nitrification rate.

Oxygen Supply and Oxygen Demand

How much do I waste?Control by…….
1. F/M is a concept/condition. The measured values for both food
and biomass are problematic due to timing and accuracy.
1. cBOD5 as food
2. MLVSS as Microorganisms
2. Sludge Quality – dependent on other factors, but MLSS must be
in an acceptable range. If driven by filaments, out of range.
3. Constant MLSS – if loading is variable, constant MLSS will cause
performance changes. If loading increases, the process will need
to adjust and increase biomass to adequately treat.
4. Aerobic SRT – assuming nitrification is a compliance objective,
using the aerobic volume of the biomass will provide the critical
biomass concentration based on tank volume, temperature and
biomass concentration. Those three (3) conditions must be taken
into consideration when adjusting for treatment.
5. Nitrification is the controlling MLSS concentration factor even if
biological phosphorus removal and total nitrogen control are
necessary.
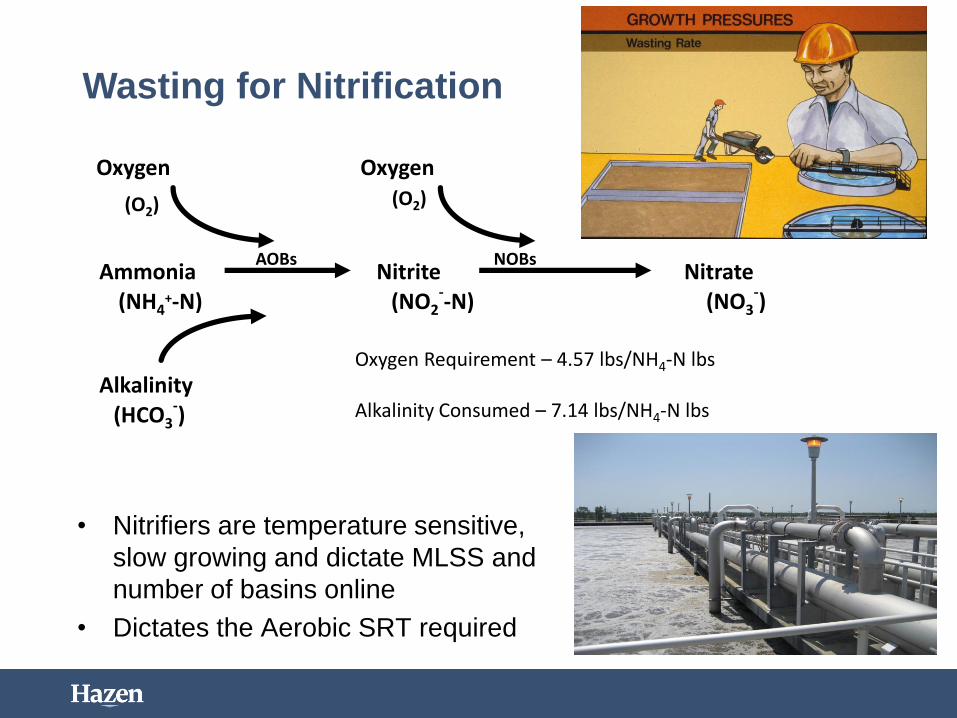
Wasting for Nitrification
AmmoniaAOBs
NitriteNOBs
Nitrate(NH4
+-N) (NO2--N)
(O2) (O2)
(NO3-)
Alkalinity(HCO3
-)
Oxygen Oxygen
• Nitrifiers are temperature sensitive,
slow growing and dictate MLSS and
number of basins online
• Dictates the Aerobic SRT required
Oxygen Requirement – 4.57 lbs/NH4-N lbs
Alkalinity Consumed – 7.14 lbs/NH4-N lbs
Easy
More Difficult
Nitrification

Nitrification Requirements
Key Factors:1. Slow growth requires adequate aerobic SRT
2. DO typically > 2 mg/L
3. pH 6.8 - 7.5 S.U.
Target effluent alkalinity of > 75 mg/L as CaCO3

Solids Retention Time (SRT)
Definition: Average amount of time “bugs” spend in the
aeration basin
Dependent on (controlled by) wasting rate
SRT (d) = solids in bioreactors (lbs) ÷ solids wasted (lbs/d)
• Nitrifiers are “slow growers” and therefore dictate system
aerobic SRT (temperature dependent)
• Aerobic SRT vs. Total SRT
• Total SRT provides additional tank volume and mass if nutrient
control tankage is in operation. Additional bioreactors used in
nutrient control are typically are mixed and not aerated.
Tracking total SRT versus Aerobic SRT is necessary.
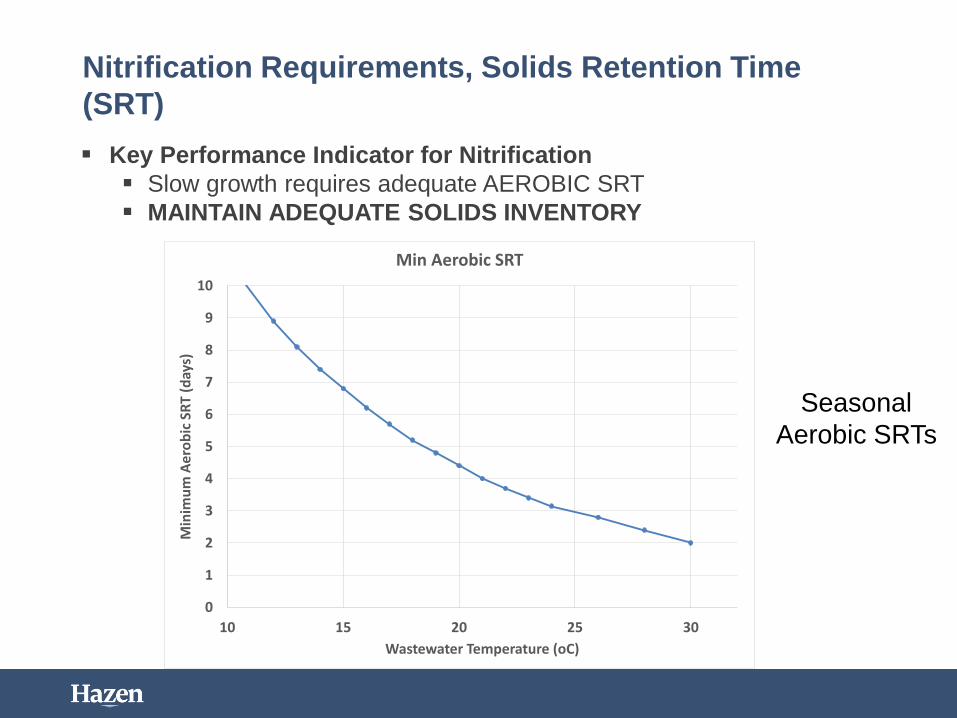
Nitrification Requirements, Solids Retention Time
(SRT)
Key Performance Indicator for Nitrification
Slow growth requires adequate AEROBIC SRT
MAINTAIN ADEQUATE SOLIDS INVENTORY
0
1
2
3
4
5
6
7
8
9
10
10 15 20 25 30
Min
imu
m A
ero
bic
SR
T (d
ays)
Wastewater Temperature (oC)
Min Aerobic SRT
Seasonal
Aerobic SRTs

27

Dissolved Oxygen and ORP
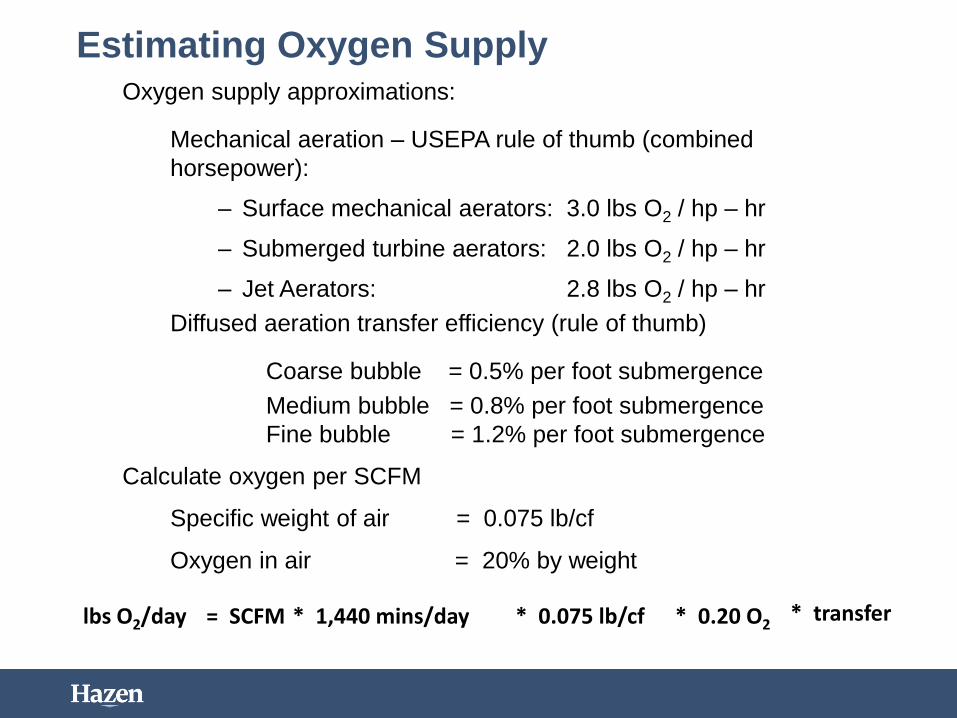
Estimating Oxygen SupplyOxygen supply approximations:
Mechanical aeration – USEPA rule of thumb (combined
horsepower):
– Surface mechanical aerators: 3.0 lbs O2 / hp – hr
– Submerged turbine aerators: 2.0 lbs O2 / hp – hr
– Jet Aerators: 2.8 lbs O2 / hp – hr
Diffused aeration transfer efficiency (rule of thumb)
Coarse bubble = 0.5% per foot submergence
Medium bubble = 0.8% per foot submergence
Fine bubble = 1.2% per foot submergence
Calculate oxygen per SCFM
Specific weight of air = 0.075 lb/cf
Oxygen in air = 20% by weight
= SCFM * 1,440 mins/day * 0.075 lb/cf * 0.20 O2lbs O2/day * transfer
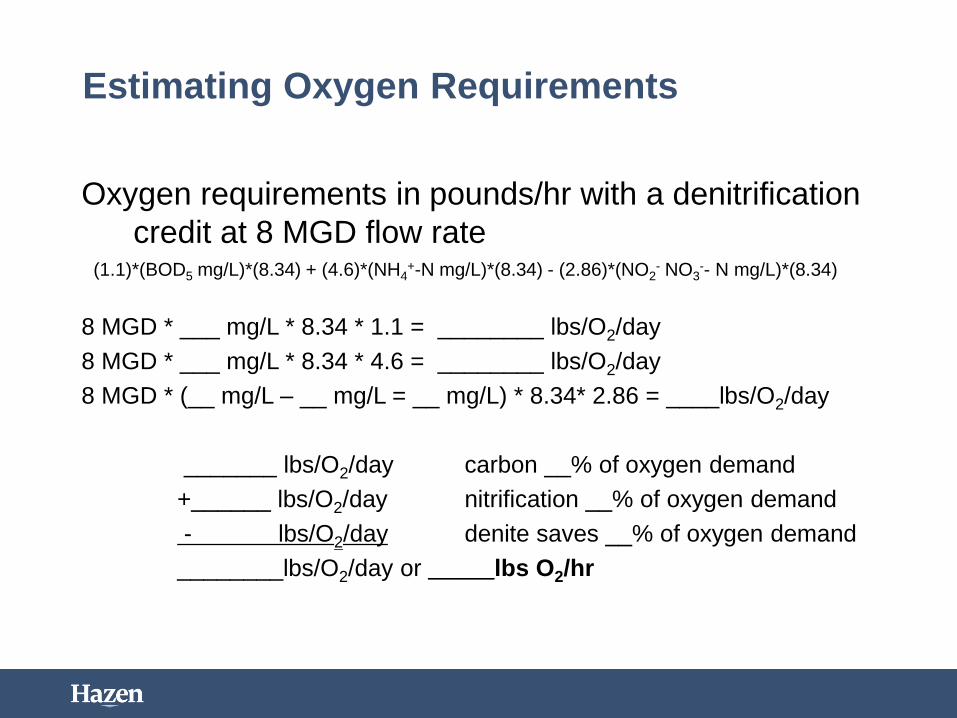
Estimating Oxygen Requirements
Oxygen requirements in pounds/hr with a denitrification
credit at 8 MGD flow rate(1.1)*(BOD5 mg/L)*(8.34) + (4.6)*(NH4
+-N mg/L)*(8.34) - (2.86)*(NO2- NO3
-- N mg/L)*(8.34)
8 MGD * ___ mg/L * 8.34 * 1.1 = ________ lbs/O2/day
8 MGD * ___ mg/L * 8.34 * 4.6 = ________ lbs/O2/day
8 MGD * (__ mg/L – __ mg/L = __ mg/L) * 8.34* 2.86 = ____lbs/O2/day
_______ lbs/O2/day carbon __% of oxygen demand
+______ lbs/O2/day nitrification __% of oxygen demand
- lbs/O2/day denite saves __% of oxygen demand
________lbs/O2/day or _____lbs O2/hr

How extra air do I need (dissolved oxygen)
Floc Condition based on Load/Oxygen/Time
The 3-D Floc concept distinguishes between floc condition and the
liquid dissolved oxygen. Nitrification rates with the same dissolved
oxygen in the liquid vary due to load, time and floc condition.
Anaerobic AerobicAnoxic
Aerobic Fully aerobic, no load at the end of aeration. All nitrifiers throughout the floc have oxygen and are nitrifying. High nitrification rate.
F/M: 0.1 D.O.: 1.0 mg/L ORP: +200 mv
AnoxicOnly partially aerobic due to high load and anaerobic floc condition at the beginning of aeration (E/F). Not all nitrifiers in the floc have oxygen and are not capable of nitrifying.
F/M: 0.4 D.O.: 1.0 mg/L ORP: +10 mv
Aerobic Largely aerobic, high load at the end aerated high D.O. section. Nitrifiers throughout the majority of the floc have oxygen and are nitrifying. High nitrification rate.
F/M: 0.2 D.O.: 5.0 mg/L ORP: +150 mv

Floc Condition with Tapered Aeration
Maintain Aerobic Condition
32
Aerobic
100% Open 80% Open 35% Open 10% Open
Anoxic
Anaerobic AerobicAnoxic
Aerated
Anoxic
0 mg/L
6 mg/L
3 mg/L

Floc Condition with less Tapered Aeration
Over-Aerated Aerobic Condition
33
Aerobic
100% Open 80% Open 60% Open 40% Open
Aerobic
Anaerobic AerobicAnoxic
Aerated
Anoxic
0 mg/L
6 mg/L
3 mg/L
Sludge Quality was not optimum
• Plant design discharged RAS directly into the
aeration tank.
• F/M was low due to the dilution of influent prior to
contact with the RAS.
• Dissolved oxygen was marginal where RAS and
Influent mixed in the aeration tank.
• If sludge wasting did not keep up, the SVI increased
and sludge quality impacted final effluent quality.
MLSS concentrations were kept low to minimize bulking

Utopia Sewer Plant with Nitrification Limits
Utopia Sewer Plant prior to initial upgrade to increase wet weather flow handing.
Aeration Settling
Utopia Sewer Plant
RAS WAS
Optimize Anaerobic Selector
• RAS is combined with influent before dilution in
aeration tank.
• Anaerobic selector improves sludge quality by
providing floc formers a competitive advantage for
soluble cBOD5 uptake under zero dissolved oxygen
conditions. Filaments cannot compete.
• Too high of aerobic conditions in aeration will not
provide optimum conditions in a small selector zone
(only 30 minutes of detention time).
Sludge quality improved if not in over aerated condition before discharging
into the selector

Utopia Sewer Plant with Nitrification Limits
Upgraded for Improved Settling and Peak Flows
Aeration Settling
RAS WAS
Selector
Step Feed
Utopia Sewer Plant
Upgraded for Peak Flow Processing

Floc Condition with Anaerobic Selector
Tapered Air with same Aerobic SRT
Anaerobic
Anaerobic
Selector
ZoneAerobic
Aerobic
100% Open 60% Open 35% Open 10% OpenAerated
Anoxic
Anoxic
0 mg/L
6 mg/L
3 mg/L
Anoxic
Optimize Anaerobic Selector
• RAS concentration also requires more optimization.
• Thin RAS will reduce anaerobic detention time in the
selector.
• Thin RAS also carries too much dissolved oxygen
and nitrates. The anaerobic selector can be washed
out.
• Some sludge blanket required to start allowing RAS
to lower in ORP.
Sludge quality will not improve if RAS is too low in
concentration/too high of a flow rate
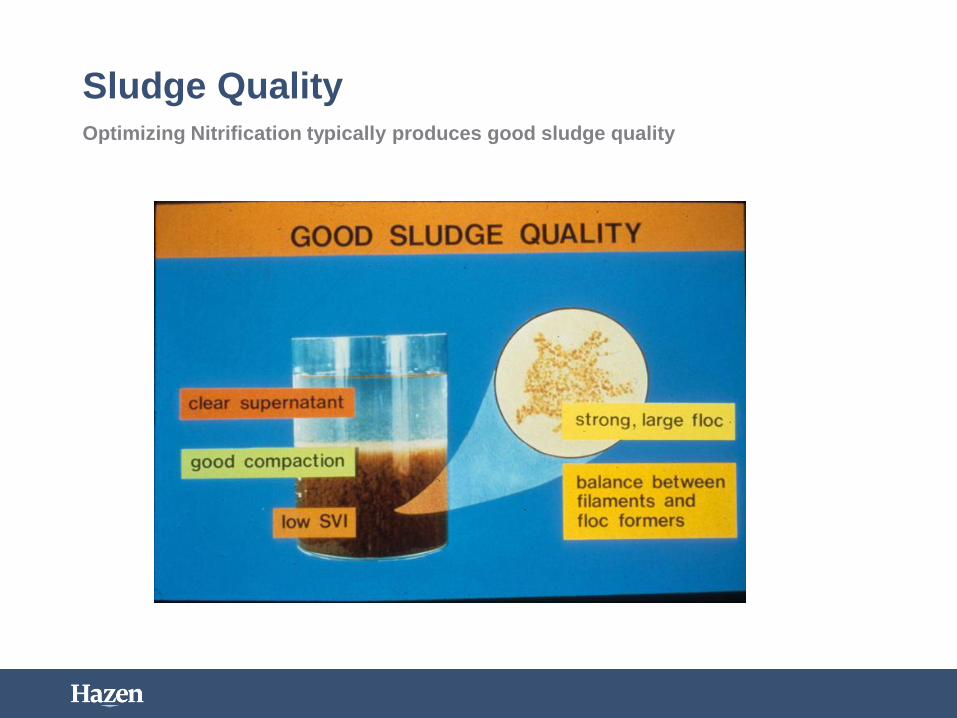
Sludge QualityOptimizing Nitrification typically produces good sludge quality
Traditional Concepts – Sludge Quality
What is good sludge quality?
A sludge that settles well and produces an effluent low in BOD5
and Suspended Solids.
• “Normal Sludge Quality”: non-bulking but still has some
filaments for structure - 100-500 microns in diameter.
Good balance between environmental and physical conditions.
• “Bulking Sludge Quality”: Feathery floc, with 30 minute SVI's above 200 mls/gm.
• “Pin Floc”: Little growth pressures, small and dense floc
- 50-70 microns with 30 minute SVI's near 50 mls/gm.
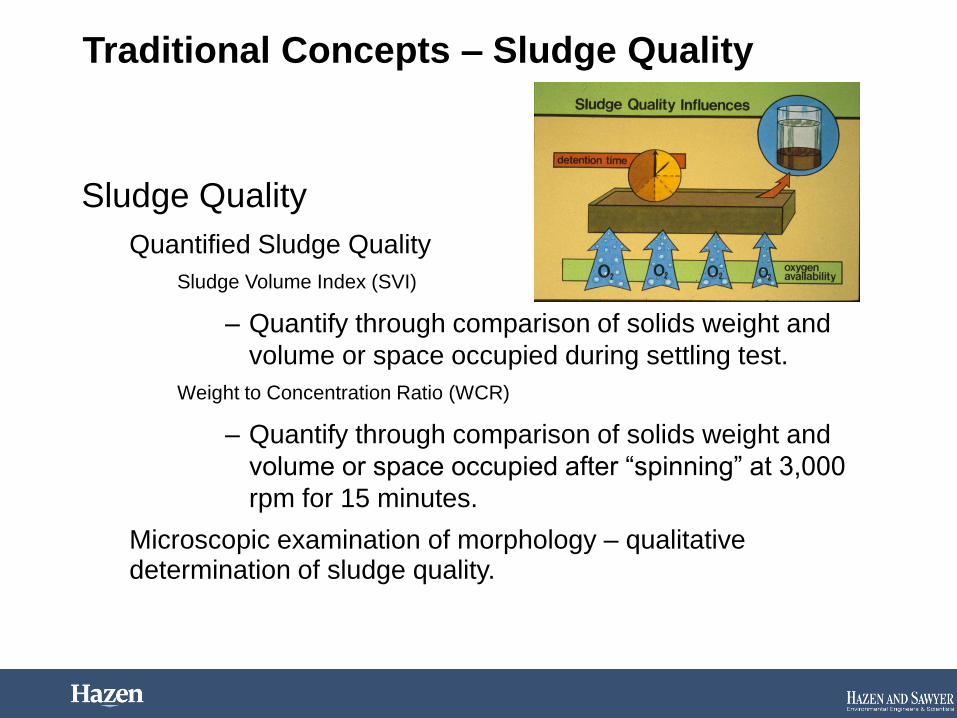
Traditional Concepts – Sludge Quality
Sludge Quality
Quantified Sludge Quality
Sludge Volume Index (SVI)
– Quantify through comparison of solids weight and
volume or space occupied during settling test.
Weight to Concentration Ratio (WCR)
– Quantify through comparison of solids weight and
volume or space occupied after “spinning” at 3,000
rpm for 15 minutes.
Microscopic examination of morphology – qualitative determination of sludge quality.
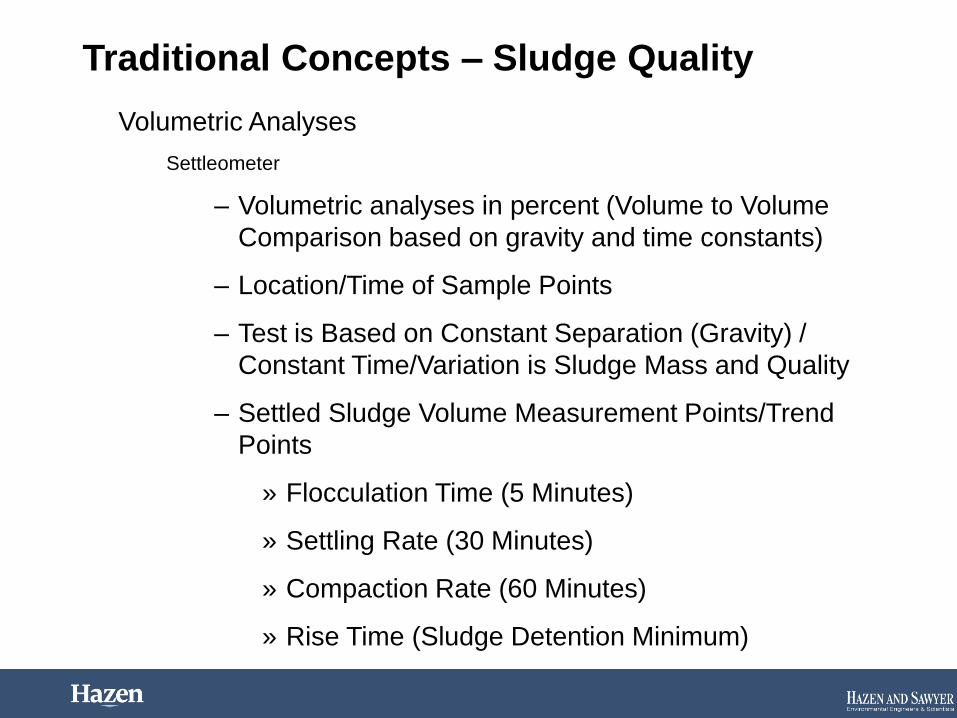
Traditional Concepts – Sludge Quality
Volumetric Analyses
Settleometer
– Volumetric analyses in percent (Volume to Volume
Comparison based on gravity and time constants)
– Location/Time of Sample Points
– Test is Based on Constant Separation (Gravity) /
Constant Time/Variation is Sludge Mass and Quality
– Settled Sludge Volume Measurement Points/Trend
Points
» Flocculation Time (5 Minutes)
» Settling Rate (30 Minutes)
» Compaction Rate (60 Minutes)
» Rise Time (Sludge Detention Minimum)
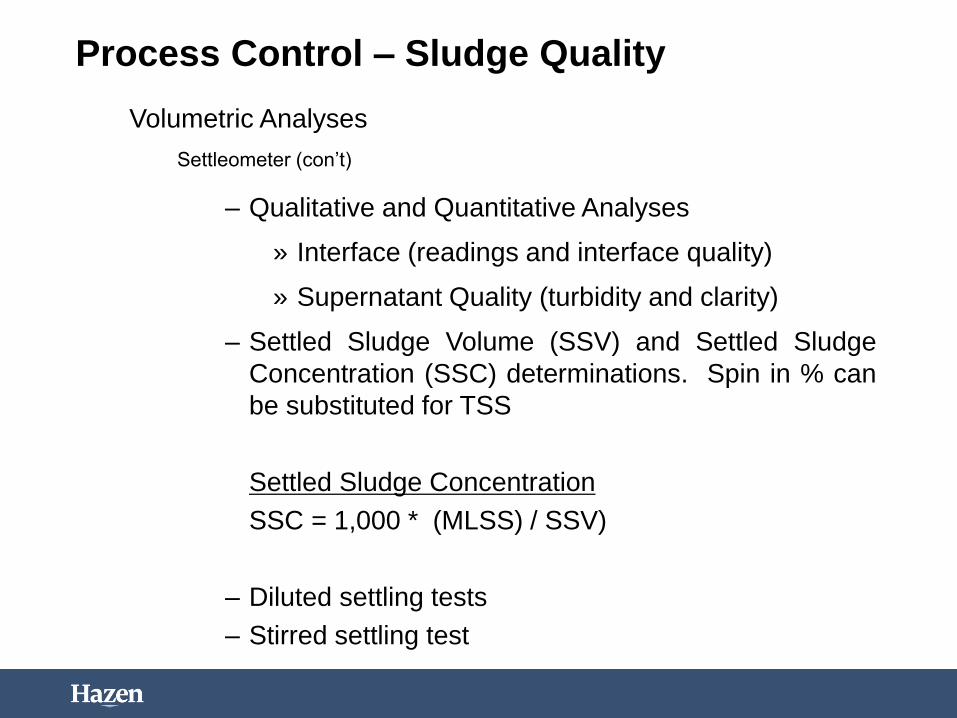
Process Control – Sludge Quality
Volumetric Analyses
Settleometer (con’t)
– Qualitative and Quantitative Analyses
» Interface (readings and interface quality)
» Supernatant Quality (turbidity and clarity)
– Settled Sludge Volume (SSV) and Settled Sludge
Concentration (SSC) determinations. Spin in % can
be substituted for TSS
Settled Sludge Concentration
SSC = 1,000 * (MLSS) / SSV)
– Diluted settling tests
– Stirred settling test

Traditional Concepts – Sludge QualitySettling Curve for SVI of 120 mls/gm
Mins SSV SSC
0 1000 2,500 mg/L
5 700 3,571 mg/L
10 550 4,545 mg/L
15 400 6,250 mg/L
20 350 7,143 mg/L
25 325 7,692 mg/L
30 300 8,333 mg/L
35 275 9,091 mg/L
40 250 10,000 mg/L
45 225 11,111 mg/L
50 215 11,628 mg/L
55 205 12,195 mg/L
60 200 12,500 mg/L
65 200 12,500 mg/L
70 200 12,500 mg/L
75 195 12,821 mg/L
80 195 12,821 mg/L
85 195 12,821 mg/L
90 190 13,158 mg/L
95 190 13,158 mg/L
100 190 13,158 mg/L
− Knee of the curve. Thickened 4 times in 45 minutes. After
another 45 minutes, only thickened 1.3 times.

Lab Settleability Compared to Clarifier Performance
The Laboratory settling shows biological performance (Sludge
Quality) without process interference / performance limiting factors
from full scale operation:
• Hydraulic Loading
• Solids Loading
• Sludge Withdrawal
• Tank Geometry including Depth
• Velocity Currents
• Particle collision (flocculation zone)
• Baffling

MLSS Settleability and RAS Flow Rate
MLSS does not rise after 2+ hours of settling.
MLSS of 2,500 settles to 500 SSV or mls
(200 SVI).
Settled Sludge Concentration is 5,000 mg/L.
If RAS can be maintained at 5,000 mg/L, if influent
flow is 8 MGD, RAS flow is 8 MGD.
47
RAS Flow in Equilibrium
(8 MGD * 2,500 mg/L)
(5,000 mg/L – 2,500 MLSS mg/L)________________________
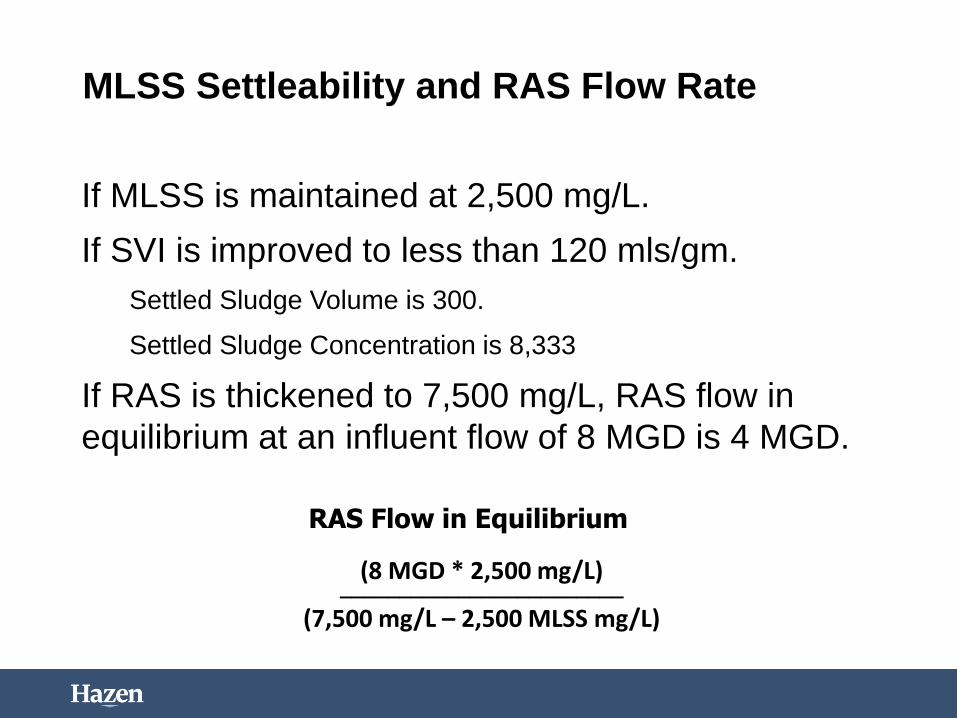
MLSS Settleability and RAS Flow Rate
If MLSS is maintained at 2,500 mg/L.
If SVI is improved to less than 120 mls/gm.
Settled Sludge Volume is 300.
Settled Sludge Concentration is 8,333
If RAS is thickened to 7,500 mg/L, RAS flow in
equilibrium at an influent flow of 8 MGD is 4 MGD.
RAS Flow in Equilibrium
(8 MGD * 2,500 mg/L)
(7,500 mg/L – 2,500 MLSS mg/L)________________________
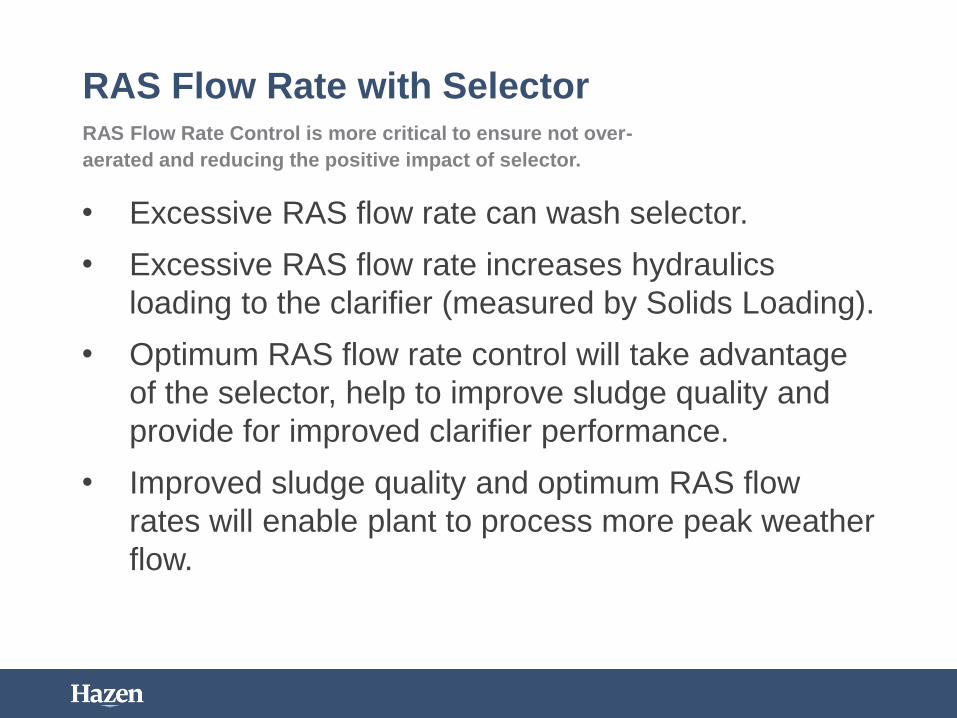
RAS Flow Rate with Selector
• Excessive RAS flow rate can wash selector.
• Excessive RAS flow rate increases hydraulics
loading to the clarifier (measured by Solids Loading).
• Optimum RAS flow rate control will take advantage
of the selector, help to improve sludge quality and
provide for improved clarifier performance.
• Improved sludge quality and optimum RAS flow
rates will enable plant to process more peak weather
flow.
RAS Flow Rate Control is more critical to ensure not over-
aerated and reducing the positive impact of selector.
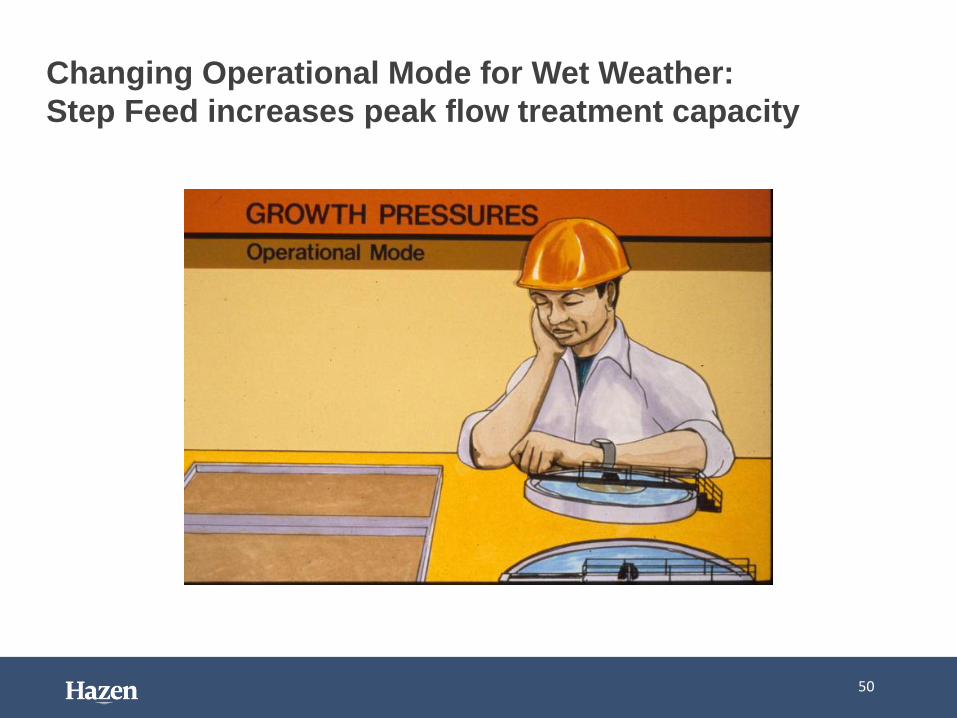
Changing Operational Mode for Wet Weather:
Step Feed increases peak flow treatment capacity
50
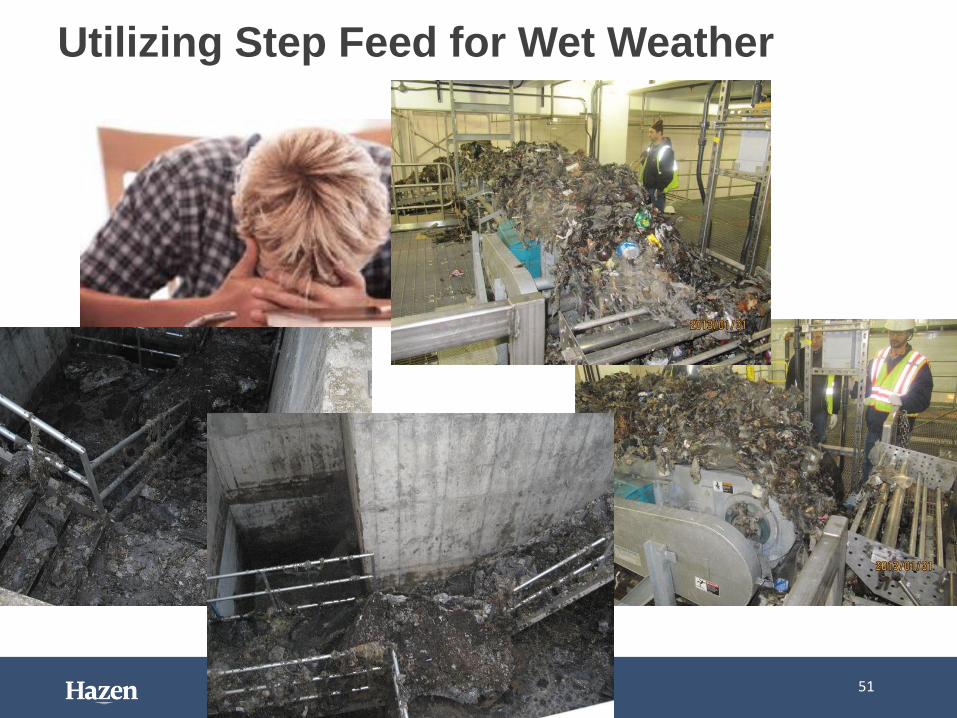
Utilizing Step Feed for Wet Weather
51

Assume Utopia has 2 aeration tanks
8 MGD Dry Weather – Plug Flow
52
4 MGD
4 MGD

Step Feed for Wet Weather
8 MGD Dry Weather – Plug Flow
53
4 MGD
Influent
4 MGD
influent
8 MGD RAS
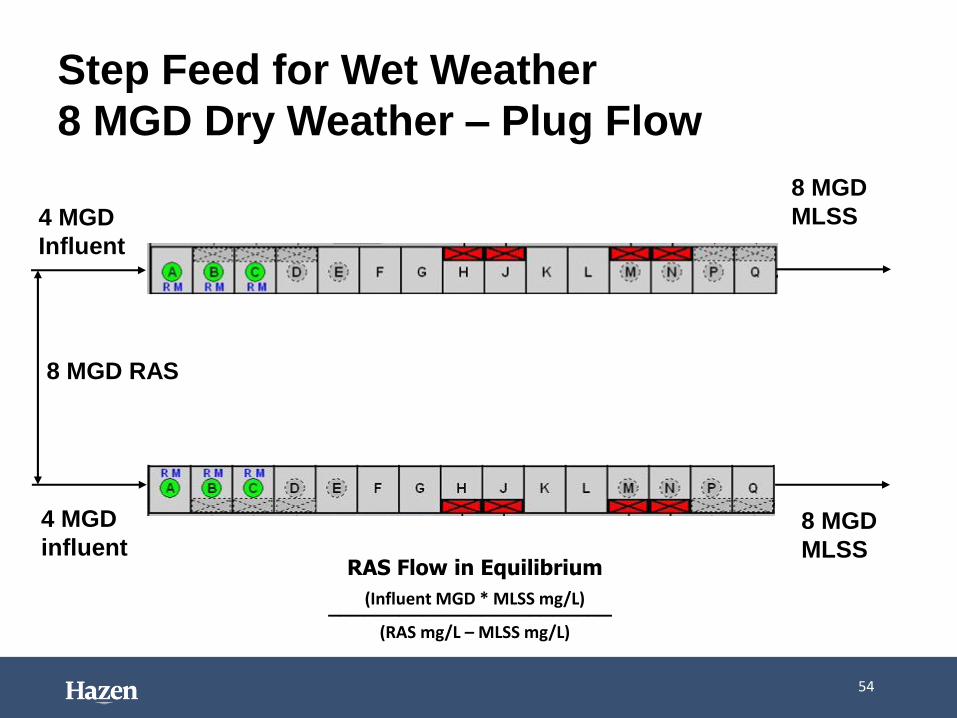
Step Feed for Wet Weather
8 MGD Dry Weather – Plug Flow
54
4 MGD
Influent
4 MGD
influent
8 MGD RAS
8 MGD
MLSSRAS Flow in Equilibrium
(Influent MGD * MLSS mg/L)
(RAS mg/L – MLSS mg/L)
________________________
8 MGD
MLSS

Step Feed for Wet Weather
8 MGD Dry Weather – Plug Flow
55
4 MGD
Influent
4 MGD
influent
8 MGD RAS @ 5,000 mg/L
8 MGD
MLSSRAS Flow in Equilibrium
(8 MGD * 2,500 mg/L)
(5,000 mg/L – 2,500 MLSS mg/L)
________________________
8 MGD
MLSS
13,900 lbs/hr
MLSS
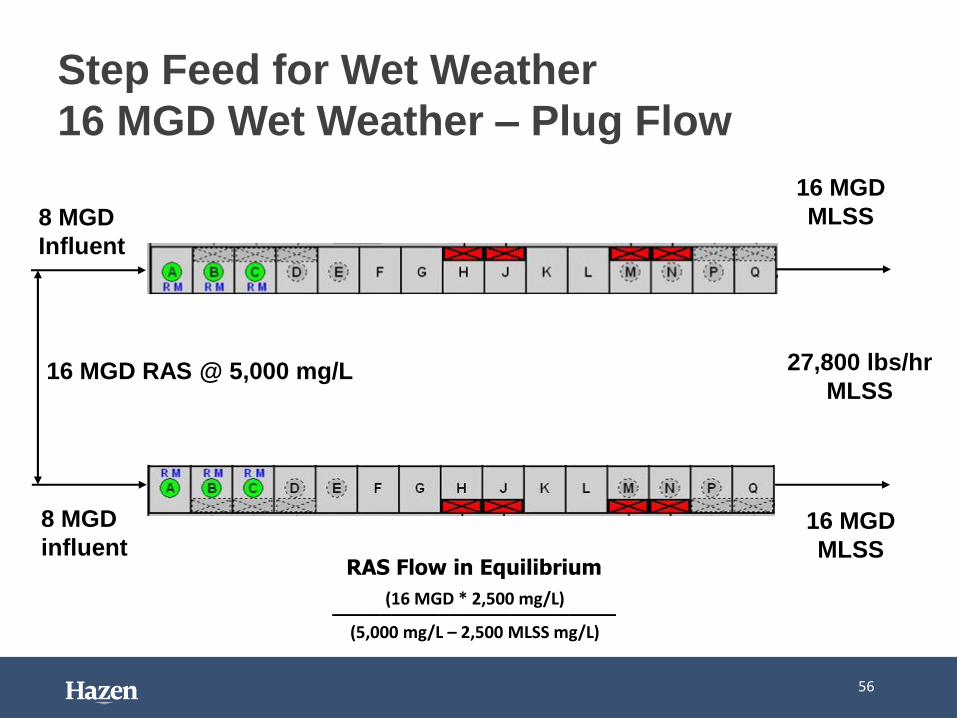
Step Feed for Wet Weather
16 MGD Wet Weather – Plug Flow
56
8 MGD
Influent
8 MGD
influent
16 MGD RAS @ 5,000 mg/L
16 MGD
MLSSRAS Flow in Equilibrium
(16 MGD * 2,500 mg/L)
(5,000 mg/L – 2,500 MLSS mg/L)
________________________
16 MGD
MLSS
27,800 lbs/hr
MLSS
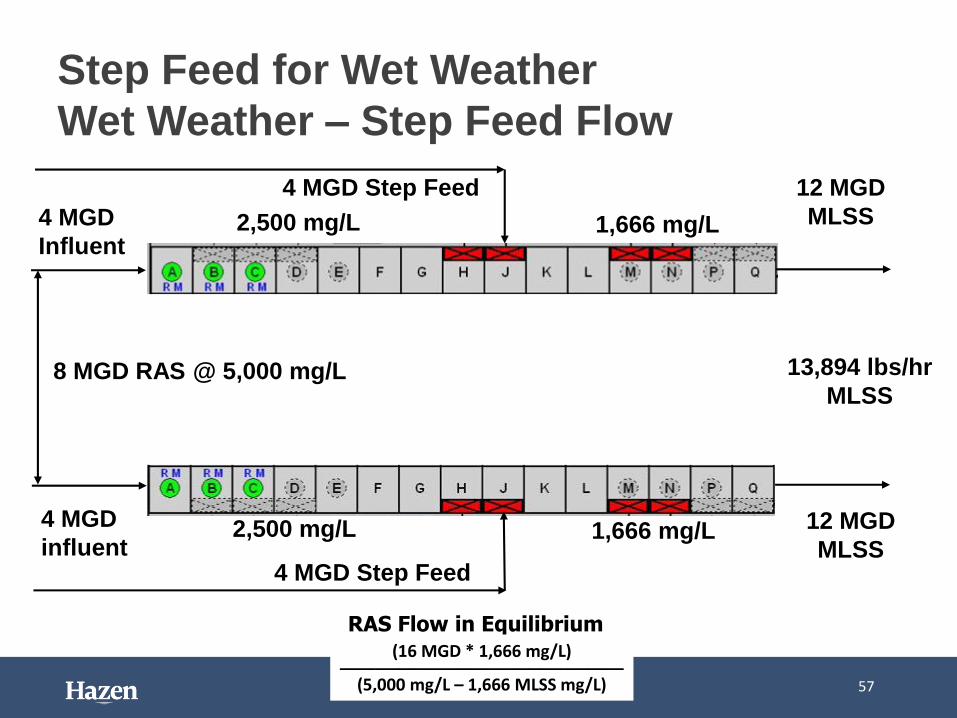
Step Feed for Wet Weather
Wet Weather – Step Feed Flow
57
4 MGD
Influent
4 MGD
influent
8 MGD RAS @ 5,000 mg/L
12 MGD
MLSS
RAS Flow in Equilibrium(16 MGD * 1,666 mg/L)
(5,000 mg/L – 1,666 MLSS mg/L)
________________________
12 MGD
MLSS
13,894 lbs/hr
MLSS
4 MGD Step Feed
4 MGD Step Feed
2,500 mg/L 1,666 mg/L
2,500 mg/L 1,666 mg/L
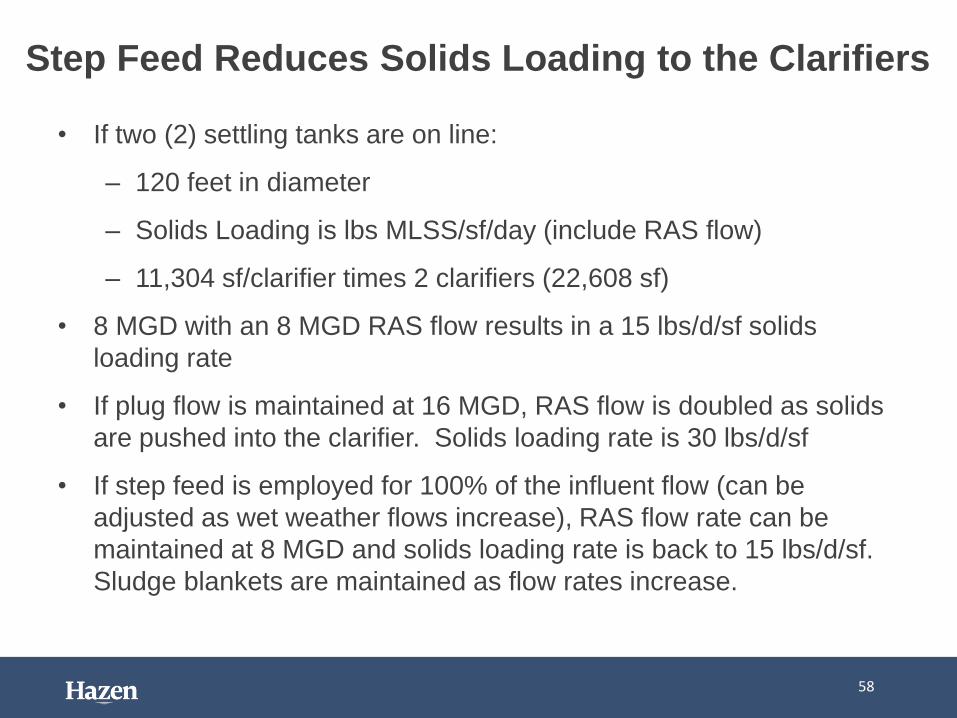
• If two (2) settling tanks are on line:
– 120 feet in diameter
– Solids Loading is lbs MLSS/sf/day (include RAS flow)
– 11,304 sf/clarifier times 2 clarifiers (22,608 sf)
• 8 MGD with an 8 MGD RAS flow results in a 15 lbs/d/sf solids
loading rate
• If plug flow is maintained at 16 MGD, RAS flow is doubled as solids
are pushed into the clarifier. Solids loading rate is 30 lbs/d/sf
• If step feed is employed for 100% of the influent flow (can be
adjusted as wet weather flows increase), RAS flow rate can be
maintained at 8 MGD and solids loading rate is back to 15 lbs/d/sf.
Sludge blankets are maintained as flow rates increase.
Step Feed Reduces Solids Loading to the Clarifiers
58
• Plant upgrade will include additional “bio P” tankage.
• Utopia staff must adjust process control to optimize
biological phosphorus removal while minimizing
chemical feed.
• Staff has already begun “bio P” process control by
optimizing the anaerobic selector process and improving
sludge quality.
59
Utopia’s new KPDES includes phosphorusUtopia plans to use Enhanced Biological Phosphorous Removal.


![Kobe University Repository : Thesisremoval—the anaerobic-anoxic-oxic activated sludge process (A2O)—has also been developed [14] (Fig. I-6). In the anaerobic tank, phosphorus is](https://img.pdfslide.tips/doc/110x75/60aab0ac56d8124a197d7cce/kobe-university-repository-removalathe-anaerobic-anoxic-oxic-activated-sludge.jpg)


![三tt口 ],11...sakuntala.saijai@gmail.com [Background] Organic hydroponics consist of nitrification process enriching nitrifying-microorganisms and crop cultivation maintaining the](https://img.pdfslide.tips/doc/110x75/5e7c57d0bfdfb06d7b179f70/tt-11-sakuntalasaijaigmailcom-background-organic-hydroponics-consist.jpg)


![6. Activated Sludge Process : Introductionwemt.snu.ac.kr/lecture 2012-2/ENV/Ch 6/nCh 6 [호환 모드].pdf · 6. Activated Sludge Process : Introduction • The Activated sludge Process:](https://img.pdfslide.tips/doc/110x75/5cc4ba0288c993ab2a8c5e09/6-activated-sludge-process-2012-2envch-6nch-6-pdf-6-activated.jpg)