Embed Size (px)
Citation preview

CheM © [2015], Copyright CCAAS Naoki Nagayama et.al., CheM 2015, 74-80
74
http://ccaasmag.org/CHEM
Activation Energy for Photoconduction in Molecular Crystals
Naoki Nagayama, Takashi Yamamoto, and Toshio Naito*
* Graduate School of Science and Engineering, Ehime University, Matsuyama 790-8577, Japan.
Tel: 81-89-927-9604, E-mail: [email protected]
Received: 2015-10-02 || Accepted: 2015-11-18 || Available online: 2015-11-22
Abstract
The carrier dynamics of photoconduction (PC) are
complicated because the systems contain optically and
thermally excited carriers with different relaxation
mechanisms. In addition, molecular crystals generally
have highly anisotropic and correlated electronic
systems. Accordingly, the photoconduction mecha-
nism of molecular crystals is full of unanswered basic
problems such as how to distinguish PC from a
coexistent thermal carrier’s contribution originating
from heating effects involved with irradiation. In this
work, the activation energy (Ea) for PC of molecular
crystals was found to decrease monotonically with an
increase in the intensity (I) of light. The values of Ea
upon irradiation were not related to band gaps, unlike
those for dark conductions. Based on the observed
I-dependence of the photocurrent (Iph), the
I-dependence of the Ea is explained quantitatively.
This Ea analysis makes it possible to clearly
distinguish PC from the coexistent conduction
originating from thermal carriers.
Keywords: Organic charge-transfer salt; Carrier
dynamics; Heating effect; Metal-dithiolene complex;
-conductor.
1. Introduction
Photoconduction (PC) is a well-known phenomenon
observed in a variety of compounds [1-5]. In addition to
unique experimental tools for studying carrier dynamics
in unusual conductors [1-3], PC is applied in various
imaging and sensor devices such as copy machines,
charge-coupled devices (CCD), complementary
metal-oxide-semiconductors (CMOS), and photovoltaic
cells [4,5]. Since such devices play an indispensable role
in daily life, clarifying the mechanism of PC is important
in order to develop more efficient photoconductors. The
carrier dynamics of PC are complicated, because the
systems contain both thermally and optically activated
carriers at the same time. As a result, in addition to the
relaxation of electrical conduction, that of optical and
thermal excitations takes places simultaneously in
photocarrier systems. Recently organic photoconductors
have attracted more and more attention because of their
possibility of light, flexible, and inexpensive products
with low power consumption. PC in organic compounds
can simultaneously involve different but nearly
degenerate energy bands. They generally exhibit marked
anisotropy in electrical conduction. Additionally, they are
characterized by strong electron-electron and electron-
phonon interactions, which often produce various kinds
of relaxation processes and meta-stable states. All of
these characteristics make the PC behavior more
complicated than other groups of materials. Thus, there
remain a number of basic problems and open questions
about the PC mechanism of organic compounds, which
includes how to distinguish PC from a coexistent thermal
carrier’s contribution originating from inevitable heating
effects. In order to solve these unanswered problems,
study on PC in single crystals is more advantageous than
that in thin films, because the former samples are
structurally well-defined, serving as a simplest model.
Therefore understanding and findings on single
crystalline samples can provide an important clue for
general and basic understanding of PC mechanism in
organic materials. In this perspective, the samples
selected in this study exhibit unusually large
photoresponse, i.e. photocurrent Iph, and marked
dependence on light-intensity I. Such samples have been
recently found among [Ni(dmit)2] salts, where dmit =
1,3-dithiole-2-thione-4,5-dithiolate (Figure 1). The
[Ni(dmit)2] radical anion salts have been paid particular
attention for long time as building blocks for molecular
optical materials, magnets, metals and superconductors
[6-18]. NMQ[Ni(dmit)2] (1) (NMQ = N-methyl
quinolinium; Figure 1) is a highly insulating molecular
salt when in the dark, but exhibits unusually high PC. At
200 K, it demonstrates ~880 times higher conductivity
when exposed to UV radiation (375 nm, 15.7 mWcm-2
)
than when in the dark [19].

CheM © [2015], Copyright CCAAS Naoki Nagayama et.al., CheM 2015, 74-80
75
http://ccaasmag.org/CHEM
Figure 1. Molecular structures.
The salt is a band insulator [Figure 2(a)]
having a two-dimensional network of
Ni(dmit)2 moieties [Figure 2(b)] which is
used as the PC conduction pathway. In
addition, there exists a non-linear dependence
of Iph on I. In conventional photoconductors,
whether they are organic or not, Iph is
proportional to I. Because the detailed
I-dependence of Iph including linearity can be
controlled by irradiation conditions in salt 1, it
is the sample of choice for covering different
patterns of Iph(I) of different photoconductive
materials. Herein are reported the
I-dependence of effective Ea for PC of
molecular crystals, and a quantitative
interpretation of the Ea behavior based on the
observed I-dependence of Iph. In the discus-
sion below, only the total number of carriers
in the PC is considered; the photoexcited
states are not considered in detail. This is
advantageous for application of the analysis
presented below to as wide a variety of
photoconductive materials as possible.
2. Materials and Methods
The single crystals of salts 1 and 2
(MV[Ni(dmit)2]2, MV = methyl viologen,
Figure 1) were prepared according to
previous reports [19, 23]. Electrical resistivity
measurements were carried out on single
crystals via a two-probe method in air using a
homemade cryostat and a UV laser (375 nm,
max 20 mW) with adjustable focus and
intensity. Many samples were studied in order
to examine sample-dependence and
reproducibility, as well as durability to
irradiation in air. The electrical resistivity was
measured along the longitudinal direction of
the single crystal (//b-axis for both salts 1 and 2), which coincides
with most conductive directions. At a given temperature the
current-voltage curves were measured from -10 V to +10 V with an
interval of 2 V, and Iph was the observed current under an applied
voltage of 10 V. Gold wires (25 m in diameter) and gold paste
(No.8560, Tokuriki Chemical Research Co., Ltd.) were used as
electrical contacts. In order to change the value of d (mm), the
distance L between the two electrical leads were decreased stepwise
by adding the Au paste after each measurement (Figure 3). Full
experimental details are provided in the Supporting Information.
Figure 2. Properties of salt 1 under dark conditions [19]. (a)
temperature-dependence of surface resistivity Rsq (inset) and
magnetic susceptibility (main panel), (b) two-dimensional
(honeycomb) network of Ni(dmit)2 moieties in the bc-plane,
which serves as a conduction pathway for PC. Broken lines
indicate strong intermolecular interactions because of MO
overlap. In (b), yellow, brown, grey, and open spheres
designate sulfur, carbon, nitrogen/nickel, and hydrogen atoms,
respectively. All figures are slightly modified, with
permission.
CheM © [2015], Copyright CCAAS Naoki Nagayama et.al., CheM 2015, 74-80
76
http://ccaasmag.org/CHEM
Figure 3. Changing (decreasing) distance (L) between
electrical leads on the single crystal of salt 1.
3. Results and Discussion
3.1 Dependence of photocurrent on light-intensity,
and on distance between electrical leads. In contrast
with dark conductivity, even under a constant applied
voltage, Iph generally depends on experimental conditions
such as radiation wavelength/power [Figure 4(a)]/etc.
and the net distance (d) between electrical leads [Figure
4(b)]. This is because the number and relaxation time ()
of photocarriers depend on light intensity, wavelength
and so on. For instance, the longer d becomes, the fewer
photocarriers arrive at the opposite lead before they
optically relax and disappear.
In Fig. 4(b) the best-fit curve uses the following
equation,
𝑰𝒑𝒉𝑰𝒅𝒂𝒓𝒌
⁄ = 𝒚𝟎 + 𝑨𝐞𝐱𝐩 (−𝒅
𝝉)
, where y0, A, and = 1.08, 3.65, 0.56 (mm), respectively.
With regard to the non-linear dependence of Iph on I,
Iph is well described by a polynomial of I for salt 1
[Figure 4(a)]
𝐼𝑝ℎ = ∑ 𝐾i𝐼i
𝑖=0 (1), where Ki (i = 0,1,2,…) are experimentally-determined
constants (fitting parameters dependent on temperature T)
and K0 is equal to the observed current under dark
conditions Idark.
𝐾0 = 𝐼dark (2)
Depending on the irradiation conditions, some of the
coefficients Ki can be zero.
3.2 Dependence of activation energy on
light-intensity. The activation energy Ea of salt 1
decreases under 375 nm UV light with increasing I
(Figure 5).
In order to discuss the Ea behavior of the salt when
irradiated, both optically- and thermally-excited carriers
should be assumed to serve equally. Therefore, the
effective Ea [Ea(I)] can be described by:
𝐸𝑎(𝐼) = 𝑁𝑡ℎ(𝐼)
𝑁𝑡ℎ(𝐼)+𝑁𝑝ℎ(𝐼)𝐸𝑎,0 (3)
where Nth(I), Nph(I) and Ea,0 indicate the number of
thermally activated carriers, the number of optically
excited carriers, and the activation energy under dark
Figure 4. (a) Iph/Idark vs. I curve at 298 K with
different distances between the electrical leads (gold
wires) for the same single crystal. Closed circles:
observed; curves: best-fit curves using polynomials
similar to Eq. (1) (see Eq. (S1) and Table S1 in
Supporting Information). In order to estimate the net
effect of differences in travel path length of the
photocarriers, d does not include the spot diameter
(2r = 0.1 mm) of the UV laser (375 ±5 nm; see
inset). (b) Iph/Idark vs. d curve at 298 K (375 ±5 nm, I
= 12.6 Wcm-2
) for the same sample with that of
Figure 4(a). Closed circles: observed, and curve:
best-fit curve using the equation discussed in this
section on the left.

CheM © [2015], Copyright CCAAS Naoki Nagayama et.al., CheM 2015, 74-80
77
http://ccaasmag.org/CHEM
conditions [~ (0.24 ± 0.02) eV], respectively. First,
it should be noted that dark- and photo-conductivity
(dark and ph, respectively) are proportional to the
dark- and photo-current (Idark and Iph, respectively)
under a constant applied voltage, and that the currents
are proportional to the respective number of carriers:
𝜎 ∝ 𝐼 (4a)
𝐼 ∝ 𝑁 (4b)
where , I, and N can designate dark and ph, Idark and Iph,
and Nth(I) and {Nth(I) + Nph(I)}, respectively.
Figure 5. I-dependence of Ea(I) for salt 1. Data observed
in air (for corresponding data for other samples, see
Figure S2 in Supporting Information). Best fit curves
generated using Eq. (10a) with fitting parameters in
Table S2 in the Supporting Information.
Under dark conditions, the sample is in a thermal
equilibrium, and thus the number of thermally excited
carriers Nth(0) follows a Boltzmann distribution [20].
Under radiation, the sample is no longer in a thermal
equilibrium, and some of the electrons are excited to
unoccupied states [21]. In such a state, the sample
temperature is not always equal to that of the
surroundings, because of the heat involved with radiation.
Thus, Nth is a function of I, which can be described by:
𝑁𝑡ℎ(𝐼) = 𝑎 + 𝑏𝐼 (5)
where 𝑎 and 𝑏 are constants. The first constant
corresponds to the number of carriers under dark
conditions, while the latter is primarily dependent upon
the heat capacity of the sample, including the electrical
contacts, under a given set of radiation conditions. Nth
can be described by Eq. (5) because the heat involved
with radiation is proportional to I under a given set of
experimental conditions.
Considering Eq. (4b),
{𝑁𝑡ℎ(𝐼) + 𝑁𝑝ℎ(𝐼)} ∝ 𝐼𝑝ℎ (6)
Then, as the observed Iph obeys Eq. (1),
𝑁𝑡ℎ(𝐼) + 𝑁𝑝ℎ(𝐼) = 𝐴 ∑ 𝐾i𝐼i
𝑖=0 (7)
where A is a proportionality constant, and
𝐴 =𝐿2
𝑉𝜇𝑒 (8)
where L, V, , e indicate distance between the two
electrical leads, applied voltage, mobility of the carriers,
and elementary charge, respectively, as shown in
Supporting Information.
Substitution of Eqs. (5) and (7) in Eq. (3) gives
𝐸𝑎(𝐼) = 𝑎+𝑏𝐼
𝐴 ∑ 𝐾i𝐼i 𝐸𝑎,0 (10a)
Eq. (10a) may be transformed into a linear relationship in
order to unambiguously fit the observed behavior as
follows:
𝐸𝑎(𝐼) ∑ 𝐾i𝐼i
𝑖=0 = 1
𝐴(𝑎 + 𝑏𝐼)𝐸𝑎,0 = 𝑎′ + 𝑏′𝐼 (10b)
where 𝑎′ =𝐸𝑎,0
𝐴𝑎, and 𝑏′ =
𝐸𝑎,0
𝐴𝑏.
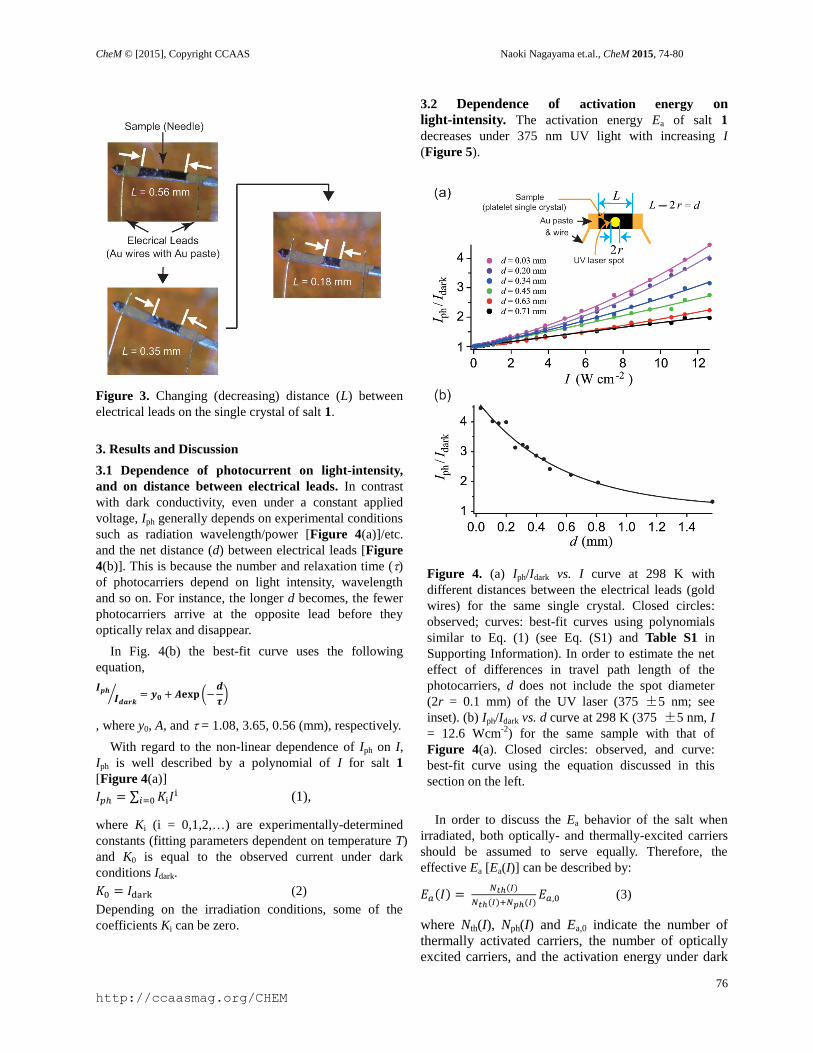
3.3 Comparison of observed behavior with theory.
The validity of the discussion thus far can be evaluated
by comparing Eq. (10b) and the observed behavior. All of
the parameters Ki in Eq. (10b) can be determined directly
from the observation of Iph vs. I, i.e. the relationship in Eq.
(1), as shown in Figure 4. (The parameters obtained
from the curve-fitting (Ki, a’, and b’) are in Table S2 in
the Supporting Information.) Similarly, the I-dependence
of Ea can be directly observed, as shown in Figure 5.
Thus, using Eq. (10b) and the values of Ki, a curve-fitting
analysis was carried out on the I-dependence of
𝐸𝑎(𝐼) ∑ 𝐾i𝐼i (Figure 6). All of the relationships were
found to be linear, which means that Eq. (10b) is
consistent with the observed behavior.
3.4 Separation of thermally activated carriers from
optically activated carriers. Here if is known, this
analysis enables Nth(I) [Eq. (5)] and Nph(I) [Eq. (11)] to
be found unambiguously using the values of AKi, 𝑎′, 𝑏′,
and 𝐸𝑎,0 as shown below. Otherwise, it is always
difficult to distinguish unavoidable thermal effects from
purely optical effects in these kinds of experiments.
𝑁𝑝ℎ(𝐼) = {𝑁𝑡ℎ(𝐼) + 𝑁𝑝ℎ(𝐼)} − 𝑁𝑡ℎ(𝐼)
= 𝐴(𝐾0 + 𝐾1𝐼 + 𝐾2𝐼2 + 𝐾3𝐼3 + ⋯ ) − (𝑎 + 𝑏𝐼)
= (𝐴𝐾1 − 𝑏)𝐼 + 𝐴𝐾2𝐼2 + 𝐴𝐾3𝐼3 + ⋯ (∵ 𝐴𝐾0 −
𝑎 = 0) (11)
If Eq. (1) is replaced with other types of equations, the
discussion thus far remains essentially unaltered, except
CheM © [2015], Copyright CCAAS Naoki Nagayama et.al., CheM 2015, 74-80
78
http://ccaasmag.org/CHEM
for the details of Eqs. (7), (10a), and (10b). In fact, salt 1
gave different I-dependences of Iph [Eq. (1)] under
different measurement conditions. However, the analysis
here still can be applied to give similarly consistent
results (See Figures S2 and S3 in Supporting
Information).
Figure 6. I-dependence of Ea(I)(Ki I i
) for the same
sample with that in Figure 5. Data observed in air (for
corresponding data for other samples, see Figure S3 in
Supporting Information). Best fit lines generated using
Eq. (10b). Fitting parameters are in Table S2 in the
Supporting Information.
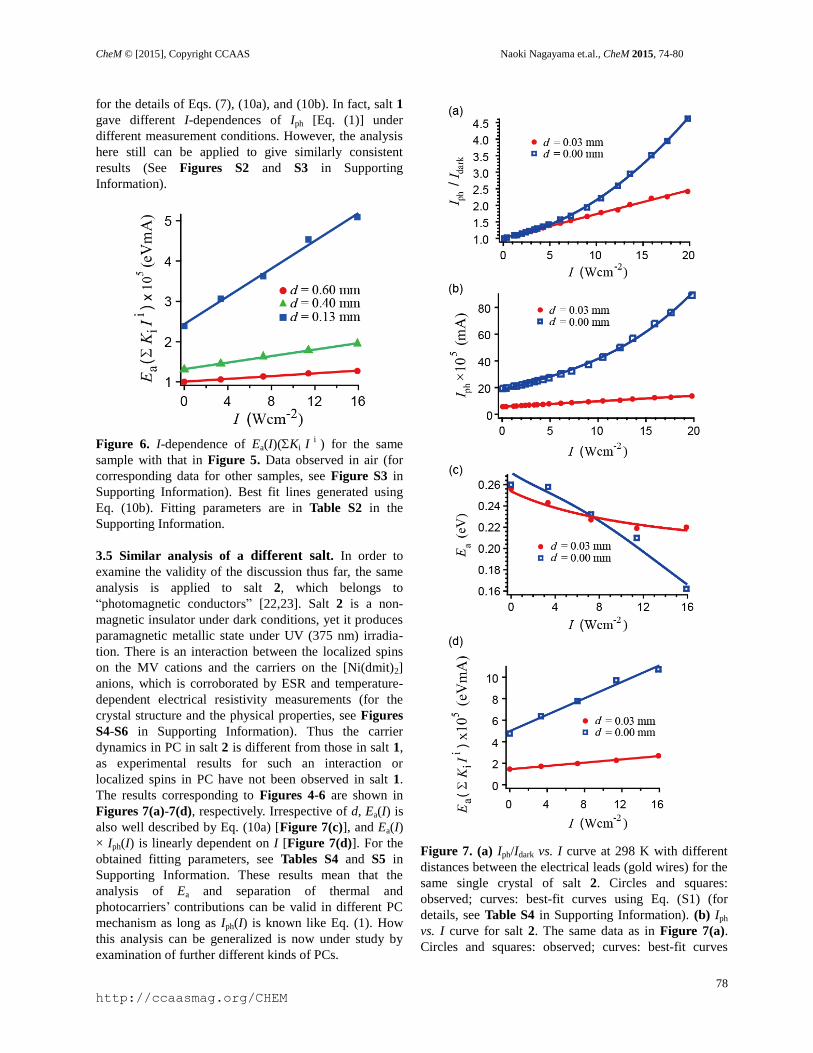
3.5 Similar analysis of a different salt. In order to
examine the validity of the discussion thus far, the same
analysis is applied to salt 2, which belongs to
“photomagnetic conductors” [22,23]. Salt 2 is a non-
magnetic insulator under dark conditions, yet it produces
paramagnetic metallic state under UV (375 nm) irradia-
tion. There is an interaction between the localized spins
on the MV cations and the carriers on the [Ni(dmit)2]
anions, which is corroborated by ESR and temperature-
dependent electrical resistivity measurements (for the
crystal structure and the physical properties, see Figures
S4-S6 in Supporting Information). Thus the carrier
dynamics in PC in salt 2 is different from those in salt 1,
as experimental results for such an interaction or
localized spins in PC have not been observed in salt 1.
The results corresponding to Figures 4-6 are shown in
Figures 7(a)-7(d), respectively. Irrespective of d, Ea(I) is
also well described by Eq. (10a) [Figure 7(c)], and Ea(I)
× Iph(I) is linearly dependent on I [Figure 7(d)]. For the
obtained fitting parameters, see Tables S4 and S5 in
Supporting Information. These results mean that the
analysis of Ea and separation of thermal and
photocarriers’ contributions can be valid in different PC
mechanism as long as Iph(I) is known like Eq. (1). How
this analysis can be generalized is now under study by
examination of further different kinds of PCs.
Figure 7. (a) Iph/Idark vs. I curve at 298 K with different
distances between the electrical leads (gold wires) for the
same single crystal of salt 2. Circles and squares:
observed; curves: best-fit curves using Eq. (S1) (for
details, see Table S4 in Supporting Information). (b) Iph
vs. I curve for salt 2. The same data as in Figure 7(a).
Circles and squares: observed; curves: best-fit curves
CheM © [2015], Copyright CCAAS Naoki Nagayama et.al., CheM 2015, 74-80
79
http://ccaasmag.org/CHEM
using Eq. (1) (for details, see Table S5 in Supporting
Information). (c) Ea(I) vs. I curve for salt 2. Data
observed in air. Best fit curves generated using Eq. (10a)
with fitting parameters in Table S5 in the Supporting
Information. (d) I-dependence of Ea(I)(Ki I i
) for the
same sample with that in Figures 7(a) - 7(c). Data
observed in air. Best fit lines generated using Eq. (10b).
(Fitting parameters are in Table S5 in the Supporting
Information.)
4. Conclusion
In the temperature-dependence of PC of some molecular
crystals, finite values of Ea were observed to be
dependent on I and could be explained on the assumption
that thermally activated and optically activated carriers
equally serve as carriers. Examination of the
I-dependences of Ea and Iph makes it possible to
experimentally distinguish PC from the coexistent
conduction originating from thermal carriers. This
analysis considered to be applied to other
photoconductive materials as long as the I-dependences
of Iph and values of are known.
Acknowledgement
The authors gratefully acknowledge financial support
from Grant-in-Aid for Research Promotion, Ehime
University, and also technical support from the Integrated
Center for Sciences, Ehime University.
References
[1] Zaitsev-Zotov, S. V.; Nasretdinova, V. F.; Minakova,
V. E. Charge-density physics revealed by
photoconduction. Physica B, 2015, 460, 174-179.
[2] Nasretdinova, V. F.; Yakimov, E. B.; Zaitsev-Zotov, S.
V. Indium doping-induced change in the
photoconduction spectra of o-TaS3. Physica B, 2015,
460, 180-184.
[3] Minakova, V. E.; Nasretdinova, V. F.; Zaitsev-Zotov,
S. V. Photoconduction in the Peierls conductor
monoclinic TaS3. Physica B, 2015, 460, 185-190.
[4] Garreau, A.; Duvail, Jean-Luc Recent Advances in
Optically Active Polymer-Based Nanowires and
Nanotubes. Adv. Opt. Mater., 2014, 2, 1122-1140.
[5] Weiss, David S.; Abkowitz, M. Advances in Organic
Photoconductor Technology. Chem. Rev. 2010, 110,
479-526.
[6] Kato, R. Development of -Electron Systems Based
on [M(dmit)2] (M = Ni and Pd; dmit =
1,3-dithiole-2-thione-4,5-dithiolate) Anion Radicals.
Bull. Chem. Soc. Jpn., 2014, 87, 355-374.
[7] Cassoux, P. Molecular (super)conductors derived
from bis-dithiolate metal complexes. Coord. Chem.
Rev. 1999, 185-186, 213-232.
[8] Cassoux, P.; Valade, L.; Kobayashi, H.; Kobayashi, A.;
Clark, R.A.; Underhill, A.E. Molecular metals and
superconductors derived from metal complexes of
1,3-dithiole-2-thione-4,5-dithiolate (dmit). Coord.
Chem. Rev. 1991, 110, 115-160.
[9] Ishiguro, T.; Anzai, H. Organic superconductors:
present status and clue to future. Mol. Cryst. Liq.
Cryst. 1989, 171, 333-42.
[10] Ishiguro, T. Superconductivity in organic charge
transfer salts. Physica C: Superconductivity and Its
Applications (Amsterdam, Netherlands), 1988,
153-155(Pt. III), 1055-61.
[11] Eur. J. Inorg. Chem. 2014, 2014, 3780-4038 (Cluster
Issue on “Molecular Conductors”), issue edited by
Ouahab, L.; Mori, T..
[12] Crystals, 2012, 2, (Special Issue “Molecular
Conductors”), issue Edited by Kato, R..
[13] Kobayashi, H.; Kobayashi, A.; Tajima, H. Studies on
Molecular Conductors: From Organic
Semiconductors to Molecular Metals and
Superconductors. Chemistry - An Asian Journal 2011,
6, 1688-1704.
[14] Naito, T. ed., Molecular Electronic and Related
Materials; Control and Probe with Light, Transworld
Research Network, 2010.
[15] J. Phys. Soc. Jpn., 2006, 75, 011001-011008
(Special Topics “Photo-Induced Phase Transitions
and Their Dynamics”), Edited by Kuwata-Gonokami,
M.; Koshihara, S..
[16] J. Phys. Soc. Jpn., 2006, 75, 051001-051016
(Special Topics “Organic Conductors”), Edited by
Kagoshima, S.; Kanoda, K.; Mori, T..
[17] Coronado, E.; Galan-Mascaros, Jose R. Hybrid
molecular conductors. J. Mater. Chem. 2005, 15,
66-74.
[18] Chem. Rev. (Washington, DC, United States), 2004,
104, 4887-5782 (Molecular Conductors), Edited by
Batail, P..
[19] Naito, T.; Karasudani, T.; Nagayama, N.; Ohara, K.;
Konishi, K.; Mori, S.; Takano, T.; Takahashi, Y.;
Inabe, T.; Kinose, S.; Nishihara, S.; Inoue, K. Giant
Photoconductivity in NMQ[Ni(dmit)2]. Eur. J. Inorg.
Chem., 2014, 2014, 4000-4009.
[20] If the possibility that there are different bands for
thermally-excited carriers is considered, Nth requires
their summation. However, in any case, Nth is
constant at a given temperature and I. Thus, this
CheM © [2015], Copyright CCAAS Naoki Nagayama et.al., CheM 2015, 74-80
80
http://ccaasmag.org/CHEM
correction does not alter the succeeding discussion.
[21] Here, details concerning the electronic structure of
the photoexcited state are not required, nor are details
concerning optical excitations. This is because only
the total number of carriers is required in the
following discussion [Eq. (6)], and the total number is
obtained from experimentation [Eq. (7)]. Similarly,
the discussion here is independent of the PC
mechanism.
[22] Naito, T.; Karasudani, T.; Mori, S.; Ohara, K.;
Konishi, K.; Takano, T.; Takahashi, Y.; Inabe, T.;
Nishihara, S.; Inoue, K. Molecular photoconductor
with simultaneously photocontrollable localized spins.
J. Am. Chem. Soc., 2012, 134, 18656-18666.
[23] Naito, T.; Karasudani, T.; Ohara, K.; Takano, T.;
Takahashi, Y.; Inabe, T.; Furukawa, K.; Nakamura, T.
Simultaneous control of carriers and localized spins
with light in organic materials. Adv. Mater., 2012, 24,
6153-6157.