Embed Size (px)
Citation preview
Adaptive threshold adjustment for signal-distortion-free digital-coherent optical demodu-
lation system Akito Chiba*, Takahide Sakamoto and Tetsuya Kawanishi
Advanced Device Research Group, New Generation Network Research Center, National Institute of Information and Communications Technology,
4-2-1, Nukui-Kitamadchi, Koganei, Tokyo 184-8795, Japan. *Corresponding author: [email protected]
Abstract: Optical quadrature amplitude modulation (QAM) attracts con-siderable attention in the enhancement of communications capacity, due to its high spectral efficiency. However, this modulation format is more sensi-tive to signal distortion than conventional formats, making it more difficult to create, transmit, and detect signals. In this paper, we propose an adaptive scheme for demodulation of the distorted optical signals with paying atten-tion to use of DSP-technology. The scheme is based on the adjustment of the thresholds against the signal distortion. Successful demodulation of op-tical QAM signals is demonstrated with a sufficiently low bit-error rate.
©2008 Optical Society of America
OCIS codes: (060.1660) Coherent communications; (060.2330) Fiber optics communications; (060.2360) Fiber optics links and subsystems.
References and links
1. M. Nakazawa, M. Yoshida, K. Kasai, and J. Hongou, “20 Msymbol/s, 64 and 128 QAM coherent optical transmission over 525km using heterodyne detection with frequency-stabilized laser,” Elecron. Lett. 42, 57-58 (2006).
2. N. Kikuchi, K. Mandai, K. Sekine, and S. Sasaki, “First experimental demonstration of single-polarization 50-Gbit/s 32-level (QASK and 8-DPSK) incoherent optical multilevel transmission,” in Optical Fiber Com-munication Conference and Exposition and The National Fiber Optic Engineers Conference, OSA Technical Digest Series (CD) (Optical Society of America, 2007), paper PDP21.
3. M. Nakazawa, J. Hongou, K. Kasai, and M. Yoshida, “Polarization-multiplexed 1 Gsymbols/s, 64 QAM (12Gbit/s) coherent optical transmission over 150km with an optical bandwidth of 2 GHz,” in Optical Fiber Communication Conference and Exposition and The National Fiber Optic Engineers Conference, OSA Technical Digest Series (CD) (Optical Society of America, 2007), paper PDP26.
4. Y. Kamio, M. Nakamura, and T. Miyazaki, “Pre-equalization for 10 Gsymbol/s 16-QAM in a vector modu-lator,” in Proceedings of IEEE/LEOS summer topical meetings (IEEE, 2008), paper MC1.2.
5. M. Nakamura, Y. Kamio, and T. Miyazaki, “Real-time 40-Gbit/s 16-QAM self-homodyne using a polariz-ing-multiplexed pilot-carrier,” in Proceedings of IEEE/LEOS summer topical meetings (IEEE, 2008), paper WC2.3.
6. M. Seimetz, “Laser linewidth limitations for optical systems with high-order modulation employing feed forward digital carrier phase estimation,” in Optical Fiber Communication Conference and Exposition and The National Fiber Optic Engineers Conference, OSA Technical Digest Series (CD) (Optical Society of America, 2008) paper OTuM2.
7. K. Kasai, M. Yoshida and M. Nakazawa, “Optical Phase-locked Loop for Coherent Transmission over 500 km,” in Optical Fiber Communication Conference and Exposition and The National Fiber Optic Engineers Conference, OSA Technical Digest Series (CD) (Optical Society of America, 2007) , paper JWA49.
8. A. P. T. Lau and J. M. Kahn, “Signal design and detection in presence of nonlinear phase noise,” J. light-wave tech. 25, 3008-3016 (2007).
9. M. S. Alfiad, D. van den Borne, F. N. Hauske, A. Napoli, B. Lankl, A. M. J. Koonen, and H. de Waardt, “Dispersion tolerant 21.4-Gb/s DQPSK using simplified Gaussian Joint-Symbol MLSE,” in Optical Fiber Communication Conference and Exposition and The National Fiber Optic Engineers Conference, OSA Technical Digest Series (CD) (Optical Society of America, 2008), paper OthO3.
10. M. G. Taylor, “Coherent detection for optical communications using digital signal processing,” in Optical Fiber Communication Conference and Exposition and The National Fiber Optic Engineers Conference, OSA Technical Digest Series (CD) (Optical Society of America, 2007), paper OMP1.
#99776 - $15.00 USD Received 4 Aug 2008; revised 19 Nov 2008; accepted 23 Nov 2008; published 16 Dec 2008
(C) 2008 OSA 22 December 2008 / Vol. 16, No. 26 / OPTICS EXPRESS 21647

11. D. -S. Ly-Gagnon, K. Katoh, and K. Kikuchi, “Unrepeatered optical transmission of 20 Gbit/s quadrature phase-shift keying signals over 210km using homodyne phase-diversity receiver and digital signal process-ing,” Electron. Lett. 41, 206-207 (2005).
12. H. Noguchi, N. Yoshida, H. Uchida, M. Ozaki, S. Kanemitsu, and S. Wada, “A 40Gb/s CDR with adaptive decision-point control using eye-opening monitor feedback,” in Proceedings of IEEE International Confer-ence on Solid-State Circuits, ISSCC2008 (Institute of Electrical and Electronics Engineers, San Francisco, 2008), pp. 228-229.
13. A. Chiba, T. Sakamoto, and T. Kawanishi, “Adaptive symbol discrimination method for distorted multilevel optical signal and its application to decoding of high-speed optical quadrature amplitude modulation,” in Op-tical Fiber Communication Conference and Exposition and The National Fiber Optic Engineers Conference, OSA Technical Digest Series (CD) (Optical Society of America, 2008) paper JWA63.
14. A. Chiba, T. Sakamoto, and T. Kawanishi, “Simple, low fluctuation voltage signal generation for 8-Gb/s qu-adrature amplitude modulation using dual-parallel Mach-Zehnder modulator,” IEICE Elec. Express 5, 497-502 (2008).
15. T. Sakamoto, A. Chiba and T. Kawanishi, “50Gb/s 16 QAM by a quad-parallel Mach-Zehnder modulator,” in Proceedings of ECOC2007 (Berlin, German, 2007), paper PD2.8.
1. Introduction
Advanced modulation formats such as quadrature amplitude modulation (QAM) and ampli-tude- and phase-shift keying (APSK) are well known as being spectrally efficient, compared with conventional modulation format employing on-off keying. In particular, QAM is already employed in wireless communications. This modulation format is based on independent con-trol of the optical amplitudes corresponding to the in-phase (I) component and quadrature (Q) component, making it appropriate for the LiNbO3-based optical I-Q modulators convention-ally used in the current optical communication. And because of the promise of significant capacity increases in optical communications originating from the high efficiency in the utili-zation of the optical frequency resource, some attempts [1-6] have been made on the applica-tion of this modulation format to optical communication.
One of the issues is the distortion of the modulated optical signal. In wireless communica-tions, the carrier wave is created with high precision in its phase so that orthogonality between the I and Q components is sufficiently ensured. In contrast, in the case of optical modulation, the orthogonality depends on the optical path-length difference determined by the bias volt-ages of the optical modulator, which should be highly stabilized. Otherwise distortion of op-tical signal occurs in the constellation map, which leads to errors at demodulation. Intensity-dependent optical phase fluctuation originating from nonlinear optical effects in an optical fiber also causes optical signal distortion and it brings so complicated behavior in combination with contribution of chromatic dispersion, whereas none of these effects exist in the propaga-tion of wireless signals. Furthermore, misalignment and imperfections in the components of the demodulator as well as the phase stability of the local oscillator can be origins of distor-tion. The latter has already been achieved [7] though some obstacles still remain for practical applications.
Optical signal distortion mentioned above can be categorized into the following two kinds: One is phase fluctuation: i.e. time-dependent phase deviation against the carrier, the other is time-independent phase deviation of the optical signal against the optical carrier. The former category includes the phase fluctuations due to the optical nonlinearity or the local oscillator, which rotates symbols around the origin of the constellation map, and the degree of rotation depends on symbol location for the effect due to fiber nonlinearity. By the phase fluctuation, each symbol distribution becomes large along with orthogonal direction of radius vector. Then tail of symbols far from the origin may tend to be out of discrimination area when we adopted lattice-like thresholds in the constellation map: i.e. independent demodulation of I- and Q- components. On the other hand, the drift of optical path length in the modulator and the imperfections of the demodulator belong to the latter category. The deviations in this cat-egory bring time-independent shift of symbol orientation against the carrier, which influences orthogonality of whole symbols: the QAM symbols which compose a quadrangle are on points of not squares but parallelograms if the deviation is due to misalignment of a conven-tional I-Q optical modulator. Then when we adopted the lattice-like thresholds, the symbol alignment is not parallel that also means zig-zag alignment, along with the thresholds of an-
#99776 - $15.00 USD Received 4 Aug 2008; revised 19 Nov 2008; accepted 23 Nov 2008; published 16 Dec 2008
(C) 2008 OSA 22 December 2008 / Vol. 16, No. 26 / OPTICS EXPRESS 21648

other axis so that it would be an origin of increasing the error rate for the optical signal pos-sessing such a deviation.
In previous attempts, for compensating the deviation in the former category, feasibility of using maximum likelihood sequence detection (MLSE) for equalization of the received signal is investigated [8, 9]. The MLSE is a powerful method though the method is based on estima-tion from the received data so that it usually uses look-up tables for evaluation of conditional probability so that many data for the tables have to be prepared beforehand, to compensate also for the latter deviation by the MLSE simultaneously. For compensation of the latter cat-egory, pre- and post-compensation technique [8] widely investigated in ultrafast optical com-munication for enhancement of dispersion tolerance is applied, besides precise adjustment of the parts of the modulator and demodulator. However, such adjustment would be a barrier to practical application besides difficulty of compensation of the phase fluctuation due to fiber nonlinearity. Consequently techniques to reduce the required degree of adjustment would be useful in optical communications based on the advanced modulation formats.
Except for the MLSE-based method, the above attempts are based on independent de-modulation of I and Q components; that is, thresholds resemble a lattice in the constellation map. Another approach, being converse to the conventional method for demodulation, is the adjustment of the thresholds so as to fit into the distorted optical signal. This approach forces demodulation of optical signals whose I and Q components are not independent. This is con-sidered unrealistic since it increases the complexity on the demodulation system; however, with the progress in digital signal processing (DSP), the possibility of constructing a less-complicated DSP-based receiver, so-called digital-coherent demodulation technique, has in-creased [10]. For example, electronic dispersion compensation, carrier-phase estimation [11] and clock-data recovery with adaptive decision-point control [12] have already been demon-strated and ease with which they can be combined would be a strong determinant of the suc-cess of the demodulation technique. The MLSE also belongs to the DSP-based technique though, by the reason described above, simpler approach for multilevel signal demodulation would be desired for decreasing both processing load and preparation of reference data.
In this paper, we investigate a DSP-based demodulation technique for distorted optical signals, which was proposed previously [13]. The technique is based on adaptive setting of the thresholds according to the degree of distortions of the optical signal so that tolerance against the derivation of the symbol can be ensured. For time-dependent distortion, the pro-posed method can set discrimination areas in I-Q map for each symbol so that the method would also enhance tolerance against nonlinearity to some extent. As a result, optical QAM signal can be successfully discriminated despite incomplete orthogonal alignment of the sym-bol distribution of the signal in the constellation map. Since this method does not require the look-up table, optical signal having any complicate alignment would be also discriminated if sufficiently-high optical signal-noise ratio (OSNR) is ensured. The level of optical QAM sig-nal distortion admitted by the proposed method is also discussed from experimental evalua-tions.
2. Threshold determination
The proposed method is based on evaluation of the optical signal distribution in the constella-tion map [13]. For an optical QAM signal, the procedures are summarized by the following four steps: (1) obtaining the signal distribution in the constellation map from the histogram evaluated, (2) searching for the peaks of the histogram in the constellation map and finding the peak positions referred to as symbol locations in the map, (3) setting thresholds by using the symbol locations obtained by the step (2), and (4) discrimination of the received signal conversion) according to the thresholds determined in step (3).
#99776 - $15.00 USD Received 4 Aug 2008; revised 19 Nov 2008; accepted 23 Nov 2008; published 16 Dec 2008
(C) 2008 OSA 22 December 2008 / Vol. 16, No. 26 / OPTICS EXPRESS 21649

iA�
iB�
Fig. 1. Schematic for deciding thresholds after evaluation of the optical signal histograms in the constellation map. (a) Calculation of intersection of lines (solid squares (1a)–(1i)) com-posed of the symbol positions corresponding to the peaks in the histogram (solid circles (A)–(P)). (b) Calculation of midpoint (open squares (2a)–(2l)) between symbols located at the edges of whole symbols. (c) Thresholds determined by connecting the joints of (1a)–(1i) and (2a)–(2l).
Steps (1) and (2) can be performed by the conventional methods. The results explained in
the following section were obtained from a histogram evaluated by segmenting a constellation map into 80×80 parts. Smoothening of the histogram was performed to reduce its fine discon-tinuities and to search for the peaks (black points (A)-(P) in Fig. 1).
In step (3), the joints of the thresholds are first obtained by using the peak positions. The points of the joints are the intersections of the diagonals of each of the quadrangles created by the points (solid squares (1a)–(1i) in Fig. 1(a)). And to determine the thresholds for the sym-bols at the edges of the whole symbols in the constellation map, the midpoints between these symbols are also calculated and adopted as joints (open squares (2a)–(2l) in Fig. 1(b)). Fi-nally the thresholds are set by connecting these joints adequately, as shown in Fig. 1(c). In fact, these joints are used for demodulation, as described in the following step. The procedure is based on the fact that two signals that have the same variance in the histogram should be discriminated by the threshold set at the average of signal amplitude at the peaks in the histo-gram. Then the thresholds obtained are not optimized when the variance of each symbol is not the same. However, by incorporating each variance into the procedure, such as by interior division calculation, adequate thresholds can be attained.
The received signal is demodulated in step (4). In this procedure the constellation map is divided into several areas determined by the thresholds, and the received signal is demodu-lated by identifying the area where the received signal is included. For demodulation, the divided square areas are separated into two triangles, each of which can be determined by a set of two vectors and obtained from the relative difference between the two joints in each part, where the suffix i determines the area. By using these vectors, the signal vector composed of the real and imaginary parts of the received signal can be expressed as
)( iiiii ABAs���
� −+= βα (1)
where αi and βi are parameters. The received signal is recognized as the i-th symbol if both αi and βi are greater than zero and less than one and their sum satisfies this condition, and vice versa. So the signal can be demodulated by checking this condition for all the areas in the constellation map.
In the above procedure, we assume that the modulation format of the optical signal is QAM, however, it should be noted that the above procedure would be applicable not only to QAM but also, if necessary, to other optical modulation formats as well, by adopting an addi-tional step. This step is to prepare dummy symbols to be used for the creation of the joints of the thresholds. For example, in the case of APSK, the symbols are only distributed along the two axes in the constellation map so that the joints cannot be defined only using the above step (2). However, for instance, by using the sum of a signal and a 1-baud delayed signal as
#99776 - $15.00 USD Received 4 Aug 2008; revised 19 Nov 2008; accepted 23 Nov 2008; published 16 Dec 2008
(C) 2008 OSA 22 December 2008 / Vol. 16, No. 26 / OPTICS EXPRESS 21650

dummy symbols for the creation of the joints, due to the random statistics of the information superposed on the optical signal, signal demodulation would be possible because the distribu-tions of the true and dummy symbols would be the same as that for an optical QAM signal.
3. Evaluation of the threshold determination method
In this section, the effectiveness of the proposed method is discussed by comparison with a conventional method where the I and Q components of the received optical signal are de-modulated independently; that is, on the constellation map, thresholds are set as a lattice by the method. As the conventional method, we used the following thresholds for A/D conver-sion of each component into a four-level signal:
Ts −<≤−1 (2)
0<≤− sT (3)
Ts <≤0 (4)
1<≤ sT (5) where s indicates an I or Q component of the demodulation signal normalized by half its peak-to-peak value. T is a parameter for the threshold and was set to minimize the bit error rate (BER) of the received signal. In the following the obtained BER is denoted as BERconv, whe-reas BER obtained by the proposed method is denoted as BERadap.
Numerically-generated signal emulating the QAM data were used for testing the above two demodulation methods. As a simple case where Q-component of the signal is tilted is considered below though, it should be noted that, for alternate distribution of the symbols like the closest packing structure in the constellation map, the significant results would be ob-tained by the proposed method. The analysis for the signal having such a symbol distribution will be considered elsewhere.
In and Qn, the I- and Q-components of the data symbols with an order No. of n for dis-criminating the symbols along I- (or Q-) axis are described as follows:
,)90(
)90(
sin0
cos11
)(
)(
0⎥⎦
⎤⎢⎣
⎡
ΔΔ
+⎥⎦
⎤⎢⎣
⎡
==
⎥⎦
⎤⎢⎣
⎡=⎥
⎦
⎤⎢⎣
⎡
Q
I
Q
I
AQ
Io
n
on
n
n
θθ
θθ
θθ (6)
where θ indicates orthogonality between I- and Q-components; i.e. in the case of θ = 90ο, each symbols are on intersection of a lattice so that its orthogonality is perfectly endured. A0 is a root of average of squared absolute value of complex amplitude, which is for normalization of the signal. Assuming that each symbol appears with the same probability, it can be written as the following:
.)()(4
1 3
0
3
0
2
0 ∑∑= =
+=n m
nm jQIA θθ (7)
ΔI and ΔQ in Eq. (6) indicate optical signal noise of each symbol. For simplicity, in the fol-lowing simulation we assumed that ΔI and ΔQ of each symbol follow normal distribution with the same variance σ. We prepared the numerical QAM data signal with OSNRs ranging from 3.0 dB to 20.0 dB, which correspond to 1/σ2 ranging from 24.95 to 1.25×10³ when we assume that a modulation rate of 2.0 Gbaud and optical reference bandwidth of 12.5 GHz. Inset of Fig. 2 shows BER characteristics of the emulated optical QAM signal with θ of 75 deg. for each demodulation method. The inset indicates that BER conv is gently decreased with increasing the OSNR, whe-reas BERadap is exponentially decreased with increasing the OSNR in dB. By comparison, for
#99776 - $15.00 USD Received 4 Aug 2008; revised 19 Nov 2008; accepted 23 Nov 2008; published 16 Dec 2008
(C) 2008 OSA 22 December 2008 / Vol. 16, No. 26 / OPTICS EXPRESS 21651

BER of 10-3, power penalty of more than –10 dB was observed by the proposed method against the conventional method. Figure 2 shows a plot of BERadap against BERconv for the same condition of OSNR, and for θ of 90.0 deg., 85 deg., 80 deg., and 75 deg., respectively. The thin-solid line in Fig. 2 corresponds to the case where the obtained BERs are consistent without dependence on the demodulation method. Thus, the plots below the solid line indi-cate that the proposed method is superior to the conventional method. In this plot, solid plots are the BERs evaluated for the QAM signal whose OSNR was 12 dB, and the other plots were obtained from the QAM signal with decreasing OSNR with a 0.5-dB step. As described above, in the case of θ = 90 deg., each method showed few difference, however, decrease of BERadap was so rapid against BER conv when θ was 75 deg. Observed BERadap and BER conv was 5.0×10⁻⁵ and 1.97×10⁻² respectively, for the θ of 75 deg and OSNR of 12 dB, indicated as a black square in the figure. The figure also shows that slope of the BERadap increases with decreasing the orthogonality. Then the proposed method would remarkably improve the error rate for θ far from 90o and sufficiently high OSNR (below the dashed line in the figure), whe-reas the difference between the BERs is slight (along with the thin-solid line in the figure). And BER improvement was less than 0.1 when the difference of θ against 90o is less than or around 5 degree besides the OSNR is sufficiently ensured or OSNR is not sufficiently high (within the area enclosed by the thin solid line, dashed line, bottom and right edge of the graph).
Fig. 2. Obtained BER for the numerically-generated QAM data with several OSNR by the con-ventional method (BERconv, horizontal axis) and the proposed method (BERadap, vertical axis). Circles, triangles inverted triangles and squares are for orthogonality θ of 90, 85, 80 and 75 deg., respectively. Solid symbols are results for OSNR of 12 dB. Thin solid line indicates that ob-tained BERadap is the same as BERconv, and the dashed line corresponds to the case where BERadap is less than BERconv by a ratio of 0.1. Inset: characteristic of BERconv (open squares) and BERadap (solid squares) against OSNR of the emulated QAM signal with an orthogonality of θ of 75 deg.
We also evaluated the method for experimentally-acquired optical QAM signal which was generated by applying two 2-Gbaud four-level electric signals to a conventional Mach-
#99776 - $15.00 USD Received 4 Aug 2008; revised 19 Nov 2008; accepted 23 Nov 2008; published 16 Dec 2008
(C) 2008 OSA 22 December 2008 / Vol. 16, No. 26 / OPTICS EXPRESS 21652
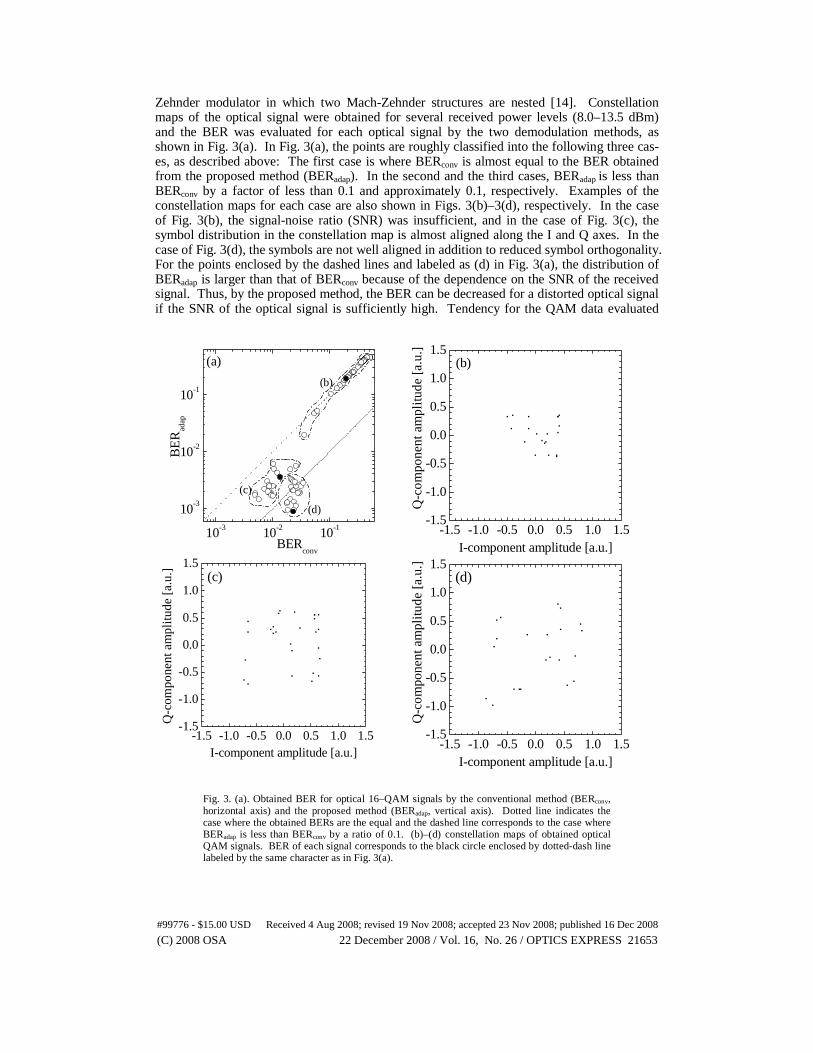
Zehnder modulator in which two Mach-Zehnder structures are nested [14]. Constellation maps of the optical signal were obtained for several received power levels (8.0–13.5 dBm) and the BER was evaluated for each optical signal by the two demodulation methods, as shown in Fig. 3(a). In Fig. 3(a), the points are roughly classified into the following three cas-es, as described above: The first case is where BERconv is almost equal to the BER obtained from the proposed method (BERadap). In the second and the third cases, BERadap is less than BERconv by a factor of less than 0.1 and approximately 0.1, respectively. Examples of the constellation maps for each case are also shown in Figs. 3(b)–3(d), respectively. In the case of Fig. 3(b), the signal-noise ratio (SNR) was insufficient, and in the case of Fig. 3(c), the symbol distribution in the constellation map is almost aligned along the I and Q axes. In the case of Fig. 3(d), the symbols are not well aligned in addition to reduced symbol orthogonality. For the points enclosed by the dashed lines and labeled as (d) in Fig. 3(a), the distribution of BERadap is larger than that of BERconv because of the dependence on the SNR of the received signal. Thus, by the proposed method, the BER can be decreased for a distorted optical signal if the SNR of the optical signal is sufficiently high. Tendency for the QAM data evaluated
Fig. 3. (a). Obtained BER for optical 16–QAM signals by the conventional method (BERconv, horizontal axis) and the proposed method (BERadap, vertical axis). Dotted line indicates the case where the obtained BERs are the equal and the dashed line corresponds to the case where BERadap is less than BERconv by a ratio of 0.1. (b)–(d) constellation maps of obtained optical QAM signals. BER of each signal corresponds to the black circle enclosed by dotted-dash line labeled by the same character as in Fig. 3(a).
10-3 10-2 10-1
10-3
10-2
10-1
(d)
(c)
BE
Rad
ap
BERconv
(a)
(b)
-1.5 -1.0 -0.5 0.0 0.5 1.0 1.5-1.5
-1.0
-0.5
0.0
0.5
1.0
1.5
Q-c
ompo
nent
am
plit
ude
[a.u
.]
I-component amplitude [a.u.]
(c)
-1.5 -1.0 -0.5 0.0 0.5 1.0 1.5-1.5
-1.0
-0.5
0.0
0.5
1.0
1.5
Q-c
ompo
nent
am
plitu
de [
a.u.
]
I-component amplitude [a.u.]
(d)
-1.5 -1.0 -0.5 0.0 0.5 1.0 1.5-1.5
-1.0
-0.5
0.0
0.5
1.0
1.5
Q-c
ompo
nent
am
plitu
de [
a.u.
]
I-component amplitude [a.u.]
(b)
#99776 - $15.00 USD Received 4 Aug 2008; revised 19 Nov 2008; accepted 23 Nov 2008; published 16 Dec 2008
(C) 2008 OSA 22 December 2008 / Vol. 16, No. 26 / OPTICS EXPRESS 21653

from an experiment is almost agree well with the results obtained from the numerical simu-lated QAM signals, in spite of no effect regarding the nonlinearity is included in the symbol preparation in the above simulation. However, as described in introduction, the signal distor-tion originating from nonlinearity brings broadening of each symbol so that optical QAM sig-nal may be distorted by the nonlinearity via long-haul transmission. This effect would be sig-nificant for applying to optical communication so that this will be investigated elsewhere.
4. Example results obtained by proposed demodulation method
In this section the demodulation results obtained by the proposed method are described. Fig-ure 4(a) shows a constellation map of a 12.5-Gbaud optical QAM signal generated from a quad-parallel Mach-Zehnder modulator driven by four non-return-to-zero (NRZ) electric sig-nals [15]. Figure 4(a) contains an optical signal data with a sample number of 65270 corre-sponding to 261080 bit. The contour of the whole signal is distorted from a square shape. Since the arrangement of the symbol resembles a non orthogonal lattice, demodulation would be difficult by the conventional method. Figure 4(b) shows the thresholds for the optical QAM signal drawn by dashed white lines on a histogram of the optical QAM signal in the constellation map, both are obtained from 20000 symbols (80000 bits) at the top of the data sequence. As can be seen, adaptive setting of the thresholds against the signal was achieved. For demodulation, all of the acquired symbols shown in Fig. 4(a) were divided into blocks, each of which contains less than 20000 symbols. The symbol number per block would be decreased more though, for simple evaluation of features of the method we adopted the num-ber enough for thresholds setting. Threshold setting and demodulation were performed for each block and, for the first, second, third and fourth block of the data shown in Fig. 4(a), number of samples were 19748, 19996, 19996 and 5530 respectively, and evaluated BERs were 5.06×10⁻⁵, 3.75×10⁻⁵, 3.75×10⁻⁵ and 0.0 respectively, so that a BER of 3.83×10⁻⁵ was obtained from the all of the data. Actually the optical QAM signal shown in Fig. 4(a) was acquired within 5.2 μs in which temporal stability was sufficiently ensured, so that few thre-shold differences were observed between the blocks. Consequently the threshold obtained from the first block would be applied to demodulate data in the other blocks. Figure 4(c) shows a constellation map of the 19799-samples optical QAM signal generated by the method described in the previous section. The signal also has distortion, however, we succeeded in demodulating it with a BER of 3.4×10⁻³. Both of these BERs are less than the forward error correction (FEC) limit of 2×10⁻³. Therefore, these results imply the possibility of error-free operation of the demodulation system in combination with a FEC system.
Fig. 4. (a). Constellation map of an optical QAM signal generated by a QPMZM and thresholds (white-dashed line) and normalized histograms of the optical signal (b) shown in Fig. 4(a) and (c) generated by a optical I-Q modulator driven by two four-level signals.
#99776 - $15.00 USD Received 4 Aug 2008; revised 19 Nov 2008; accepted 23 Nov 2008; published 16 Dec 2008
(C) 2008 OSA 22 December 2008 / Vol. 16, No. 26 / OPTICS EXPRESS 21654

5. Implementation of the method using DSP
As described in the section 2, the proposed method includes the calculation of the histogram of the received signal. This operation requires large memory capacity making it seemingly difficult to realize with current DSP technology. For the construction, this operation should be replaced by the evaluation of the average for each symbol. Figure 5 shows a block dia-gram for implementing the proposed method on a DSP system. In this implementation, the evaluation of the each symbol location in the constellation map is processed in parallel. The symbol position can be estimated by conditional averaging of the signal, where the signal near each initial temporary value is only accumulated for the averaging. The initial temporary val-ues are set from the signal corresponding to the corner symbols in the constellation maps. By renewing the value by averaging, the position of the each symbol in the constellation map can be determined. Step (3) and (4) can be achieved by DSP since they use conventional calcula-tions such as summation and multiplication.
Fig. 5. Example block diagram for proposed demodulation method.
6. Conclusion
In conclusion, we succeeded in the demodulation of a distorted multilevel optical signal. We also tested the validity of the method for some optical QAM signals. In comparison with con-ventional methods, although impact on bit-error rate with decreasing the sample number to obtain thresholds should be investigated, the proposed method enables us the demodulation of signals with a sufficiently low BER, especially for the signal with insufficient orthogonality between its I and Q components but with sufficient SNR for discrimination. Then error-free operation can be achieved in combination with FEC. The proposed method provides a possi-bility to construct a compact, stable demodulation system that matches other digital-coherent demodulation techniques already reported, making this method useful for increasing tolerance to the optical signal power, besides allowing larger tolerances in the design of the transmitter and receiver.
Acknowledgment
The authors wish to thank Dr. Tsuchiya of NICT for his encouragement and fruitful discus-sions, and reviewers for their essentially significant comments and encouragements.
#99776 - $15.00 USD Received 4 Aug 2008; revised 19 Nov 2008; accepted 23 Nov 2008; published 16 Dec 2008
(C) 2008 OSA 22 December 2008 / Vol. 16, No. 26 / OPTICS EXPRESS 21655