Embed Size (px)
Citation preview
University of Groningen
Adolescent Heavy Drinking Does Not Affect Maturation of Basic Executive FunctioningBoelema, Sarai R.; Harakeh, Zeena; van Zandvoort, Martine J. E.; Reijneveld, Sijmen;Verhulst, Frank C.; Ormel, Johan; Vollebergh, Wilma A. M.Published in:PLoS ONE
DOI:10.1371/journal.pone.0139186
IMPORTANT NOTE: You are advised to consult the publisher's version (publisher's PDF) if you wish to cite fromit. Please check the document version below.
Document VersionPublisher's PDF, also known as Version of record
Publication date:2015
Link to publication in University of Groningen/UMCG research database
Citation for published version (APA):Boelema, S. R., Harakeh, Z., van Zandvoort, M. J. E., Reijneveld, S. A., Verhulst, F. C., Ormel, J., &Vollebergh, W. A. M. (2015). Adolescent Heavy Drinking Does Not Affect Maturation of Basic ExecutiveFunctioning: Longitudinal Findings from the TRAILS Study. PLoS ONE, 10(10), [0139186]. DOI:10.1371/journal.pone.0139186
CopyrightOther than for strictly personal use, it is not permitted to download or to forward/distribute the text or part of it without the consent of theauthor(s) and/or copyright holder(s), unless the work is under an open content license (like Creative Commons).
Take-down policyIf you believe that this document breaches copyright please contact us providing details, and we will remove access to the work immediatelyand investigate your claim.
Downloaded from the University of Groningen/UMCG research database (Pure): http://www.rug.nl/research/portal. For technical reasons thenumber of authors shown on this cover page is limited to 10 maximum.
Download date: 11-02-2018
RESEARCH ARTICLE
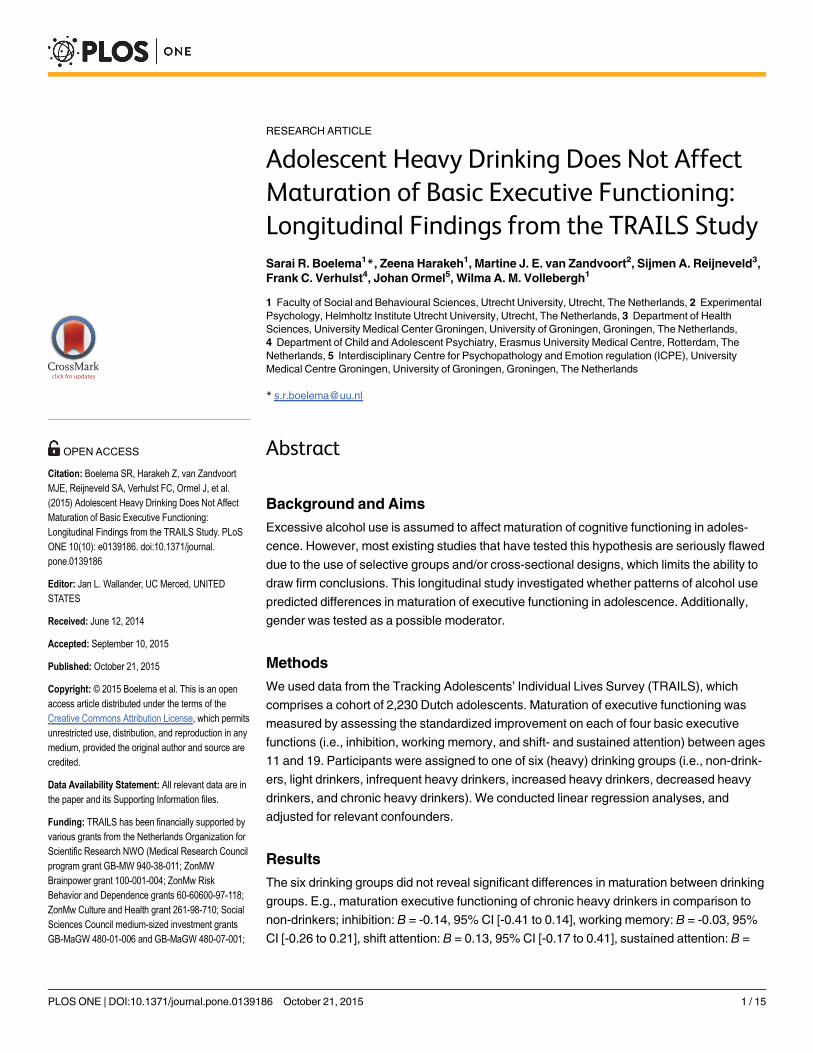
Adolescent Heavy Drinking Does Not AffectMaturation of Basic Executive Functioning:Longitudinal Findings from the TRAILS StudySarai R. Boelema1*, Zeena Harakeh1, Martine J. E. van Zandvoort2, Sijmen A. Reijneveld3,Frank C. Verhulst4, Johan Ormel5, Wilma A. M. Vollebergh1
1 Faculty of Social and Behavioural Sciences, Utrecht University, Utrecht, The Netherlands, 2 ExperimentalPsychology, Helmholtz Institute Utrecht University, Utrecht, The Netherlands, 3 Department of HealthSciences, University Medical Center Groningen, University of Groningen, Groningen, The Netherlands,4 Department of Child and Adolescent Psychiatry, Erasmus University Medical Centre, Rotterdam, TheNetherlands, 5 Interdisciplinary Centre for Psychopathology and Emotion regulation (ICPE), UniversityMedical Centre Groningen, University of Groningen, Groningen, The Netherlands
Abstract
Background and Aims
Excessive alcohol use is assumed to affect maturation of cognitive functioning in adoles-
cence. However, most existing studies that have tested this hypothesis are seriously flawed
due to the use of selective groups and/or cross-sectional designs, which limits the ability to
draw firm conclusions. This longitudinal study investigated whether patterns of alcohol use
predicted differences in maturation of executive functioning in adolescence. Additionally,
gender was tested as a possible moderator.
Methods
We used data from the Tracking Adolescents’ Individual Lives Survey (TRAILS), which
comprises a cohort of 2,230 Dutch adolescents. Maturation of executive functioning was
measured by assessing the standardized improvement on each of four basic executive
functions (i.e., inhibition, working memory, and shift- and sustained attention) between ages
11 and 19. Participants were assigned to one of six (heavy) drinking groups (i.e., non-drink-
ers, light drinkers, infrequent heavy drinkers, increased heavy drinkers, decreased heavy
drinkers, and chronic heavy drinkers). We conducted linear regression analyses, and
adjusted for relevant confounders.
Results
The six drinking groups did not reveal significant differences in maturation between drinking
groups. E.g., maturation executive functioning of chronic heavy drinkers in comparison to
non-drinkers; inhibition: B = -0.14, 95% CI [-0.41 to 0.14], working memory: B = -0.03, 95%
CI [-0.26 to 0.21], shift attention: B = 0.13, 95% CI [-0.17 to 0.41], sustained attention: B =
PLOSONE | DOI:10.1371/journal.pone.0139186 October 21, 2015 1 / 15
OPEN ACCESS
Citation: Boelema SR, Harakeh Z, van ZandvoortMJE, Reijneveld SA, Verhulst FC, Ormel J, et al.(2015) Adolescent Heavy Drinking Does Not AffectMaturation of Basic Executive Functioning:Longitudinal Findings from the TRAILS Study. PLoSONE 10(10): e0139186. doi:10.1371/journal.pone.0139186
Editor: Jan L. Wallander, UC Merced, UNITEDSTATES
Received: June 12, 2014
Accepted: September 10, 2015
Published: October 21, 2015
Copyright: © 2015 Boelema et al. This is an openaccess article distributed under the terms of theCreative Commons Attribution License, which permitsunrestricted use, distribution, and reproduction in anymedium, provided the original author and source arecredited.
Data Availability Statement: All relevant data are inthe paper and its Supporting Information files.
Funding: TRAILS has been financially supported byvarious grants from the Netherlands Organization forScientific Research NWO (Medical Research Councilprogram grant GB-MW 940-38-011; ZonMWBrainpower grant 100-001-004; ZonMw RiskBehavior and Dependence grants 60-60600-97-118;ZonMw Culture and Health grant 261-98-710; SocialSciences Council medium-sized investment grantsGB-MaGW 480-01-006 and GB-MaGW 480-07-001;
0.12, 95% CI [-0.60 to 0.36]. Furthermore, gender was not found to be a significant
moderator.
Conclusions
Four years of weekly heavy drinking (i.e., chronic heavy drinkers) did not result in measur-
able impairments in four basic executive functions. Thus, regular heavy drinking in adoles-
cence does not seem to affect these basic behavioural measures of executive functioning.
IntroductionIn adolescence, significant increases in alcohol consumption are usually found, with prevalencerates of last month alcohol use rising from 16.1% at age 12 to 84.8% at age 16 in Dutch adoles-cents [1]. Alcohol drinking in adolescence has been associated with several negative conse-quences. Of particular concern are the neurotoxic effects of alcohol, since the significantmaturation of both brain structure [2] and function [3,4] are assumed to underlie a specific vul-nerability of the developing adolescent brain to the adverse effects of alcohol [5]. However, thefindings from empirical studies that tried to assess these effects so far remain inconclusive dueto a number of methodological pitfalls.
Most studies that compared alcohol abusing adolescents with non-abusing adolescents on abroad range of neurocognitive functions, such as language and general intelligence [6], atten-tion and intelligence [7], learning, memory, and visuospatial functioning [8], are not convinc-ing in their conclusions because of their cross-sectional designs. As a result, the reverse effect ofneurocognitive impairments on heavy alcohol use is neglected [9,10]. Furthermore, studieswere conducted among adolescents diagnosed with Alcohol Use Disorder (AUD), which limitsthe generalizability of the findings because this specific group has behavioural problems associ-ated with controlling their behaviour (according to DSM-IV-criteria [11]) and often psychiat-ric comorbidity [12]. This amplifies the limitations to assessing causal relations. In contrast,population studies have shown almost no significant differences between excessive drinkersand controls on neurocognitive functioning [13,14]. However, these population studies areagain limited by cross-sectional designs and small sample sizes. Also, definitions of excessive orheavy drinking are not consistent across the studies.
To the best of our knowledge, only three small scale studies (n = 75 and 40 respectively)have analysed the effects of alcohol use on neurocognitive maturation in adolescence using alongitudinal design with pre- and post-measurements of neurocognitive functioning in a gen-eral population [15–17]. The results of these studies do not support the damaging effects ofalcohol use in adolescence either. One study found differences between heavy drinkers (averagedrinks per month: 9.9 for girls and 6.1 for boys) and controls on only one out of seven neuro-cognitive tasks, and this difference was significant for girls only. However, there was a relationbetween hangover symptoms and sustained attention in boys [16]. Two other studies showedincreased brain activation with fMRI measurements (but not in all hypothesized brain areas) inadolescents who transitioned to heavy drinking (drinks per drinking day: 4.2 and 6.1 respec-tively), while no differences between drinkers and non-drinkers were found on task perfor-mance [15,17]. Thus, empirical research on the effects of heavy alcohol use on neurocognitivematuration does not result in undisputed findings and calls for large scale population studieson this subject.
Heavy Drinking and Executive Functioning
PLOS ONE | DOI:10.1371/journal.pone.0139186 October 21, 2015 2 / 15
Social Sciences Council project grants GB-MaGW452-04-314 and GB-MaGW 452-06-004; NWO large-sized investment grant 175.010.2003.005; NWOLongitudinal Survey and Panel Funding 481-08-013),the Dutch Ministry of Justice (WODC), the EuropeanScience Foundation (EuroSTRESS project FP-006),Biobanking and Biomolecular Resources ResearchInfrastructure BBMRI-NL (CP 32), the participatinguniversities, and Accare Center for Child andAdolescent Psychiatry. The funders had no role instudy design, data collection and analysis, decision topublish, or preparation of the manuscript.
Competing Interests: The authors have declaredthat no competing interests exist
The aim of the present study was to investigate whether adolescent alcohol users show a dis-tinctive maturation of basic executive functions compared to non-drinkers in a large popula-tion-based sample. We focus on Executive Functioning (EF), since this set of cognitive controlfunctions mediates the ability to guide and direct behaviour and is therefore essential for suc-cess in school and at work [18]. Furthermore, executive functioning is hypothesised to developspecifically during adolescence [4], as it parallels the maturation of the parietal and prefrontalcortices [19]. As a result of this prolonged maturational trajectory, executive functioning isassumed particularly vulnerable to the effects of alcohol. We used four measures of EF, inhibi-tion, working memory, sustained attention, and shift attention, as our main outcomes in thisstudy. We used computerised tasks to assess basics forms of these functions, which allowed usto use the same tasks in both early and late adolescence, and compare maturation of task per-formance between adolescents with different drinking habits. We conducted a pre-exposuremeasure of executive functioning at age 11 and follow-up measurement at emerging adulthood(age 19). Furthermore, since girls are supposedly more vulnerable due to differences in neuro-maturation, hormonal fluctuations, and alcohol metabolism [20], gender was considered as apossible moderator.
Methods
Study designThe present study used data from the first, second (for descriptive statistics only), third, andfourth wave of the TRacking Adolescents’ Individual Lives Survey (TRAILS). This is a prospec-tive cohort study of Dutch pre-adolescents at age 11. The target sample involved children livingin the North of the Netherlands, covering urban and rural areas Demographic informationfrom five municipalities for all inhabitants born between October 1, 1989, and September 30,1990, in two of the municipalities, and October 1, 1990, and September 30, 1991, in the otherthree was obtained. These children attended 135 schools that were approached for participa-tion, of which 13 refused to participate (excluding 338 children). Next, parents of eligible chil-dren were informed about the study and then invited to participate. After excluding 210children who were unable to participate because of serious health or language problems, weinvited 2,935 eligible children and their parents to enter the study. Seventy-six percent of eligi-ble adolescents and their parents agreed to participate and were enrolled in the study at base-line (T1) (n = 2,230, mean age 11.1 years, SD = 0.56, 49.2% male) (for more details on theprocedure see: [21,22]. At baseline, children of lower socioeconomic background, boys, andchildren with poor school performance were slightly less likely to participate. Participants andnonparticipants did not differ in emotional and behaviour problems (De Winter et al., 2005).At the third (T3) wave (n = 1,816, mean age 16.3 years, SD = 0.70, 47.7% male), the responserate was 81.4%. At the fourth (T4) wave (n = 1,596, mean age 19.2 years, SD = 0.57, 46% male),the response rate was 70%.
ProcedureOn the first assessment, trained undergraduate psychology students administered neuropsy-chological tests in adolescents’ schools or designated testing centres (for more information, see[23]. Participants who were unable to attend these assessments were tested at home. On thefirst to third assessments, adolescents completed self-report questionnaires in groups in school,supervised by an assistant. Their parents also completed a written questionnaire. On the fourthassessment, most adolescents were no longer in secondary education. Therefore, trained pro-fessional interviewers conducted the neuropsychological test battery individually at partici-pants’ homes or in a nearby community centre (for more information, see [3]. Parents and
Heavy Drinking and Executive Functioning
PLOS ONE | DOI:10.1371/journal.pone.0139186 October 21, 2015 3 / 15
their children were asked to fill out a computerised questionnaire (or, per request, a paper-and-pencil questionnaire). The Dutch Central Committee on Research Involving Human Sub-jects approved the study. Parents and adolescents’ written informed consent was obtained. Theconfidentiality of the study was emphasised.
MeasuresAlcohol use. Descriptive statistic: At T1, adolescents were asked: “How often have you
been drinking alcohol (for example, a bottle of beer or a glass of wine)?” up until that timepoint, on a 5-point scale ranging from 0 to 7 times or more. We dichotomised these answersinto ‘never or once’ and ‘twice or more’. At T2-T4, adolescents were asked to report their aver-age drinking habits between the previous data collection wave and the present. They wereasked four questions: “On how many week(end) days do you normally drink alcohol” and “Onan average week(end) day on which you drink alcohol, how much alcohol (glasses, cans, bot-tles) do you drink?” By multiplying and adding the answers, average weekly quantity of alcoholuse can be computed. A Dutch standard drink contains 10 grams of alcohol. Furthermore, atT2-T4 adolescents were asked how many times they had been drunk in the last 12 months. Wedichotomised these answers into never and once or more. These measures of alcohol use wereused as descriptive statistics.
Drinking groups: Since the legal age for buying alcohol in the Netherlands was 16 years attime of the data collection, we used data from T3 and T4 to determine group assignment. As tobe expected, prevalence rates of frequent heavy drinking (see below) at T2 were indeed verysmall (<3%). For constructing drinking groups we used measures of both quantity and fre-quency of alcohol use. The average amount of glasses on a weekend day (since previous mea-surement wave) was used since weekend quantity of alcohol use has been shown to be a usefuland specific measure of alcohol use at this age [24]. We furthermore used the question “Onhow many occasions in the last month have you had an alcoholic beverage to drink?” Groupassignment was done in two steps; in a first step, participants were classified into four groupsaccording to their answers to these questions per measurement wave. In the second step, thesegroups per measurement wave were combined, resulting in six final drinking groups.
In step one, per measurement wave, we started with identifying participants that were notdrinking; those who indicated that they did not consume alcohol on a regular weekend day.Next, for the respondents who consumed alcohol, we set a cut off score at 6 glasses on a week-end day for boys and 5 glasses for girls [25]. Participants who indicated that they drank alcoholon a regular weekend day, but less than the cut off, were qualified as drinking, not heavy drink-ing. For participants scoring above the cut off (i.e., drinking 5–6 glasses or more on a regularweekend day), we looked at frequency of alcohol consumption. Those scoring above the cut offbut drinking on an irregular bases (last month prevalence< 4 times heavy drinking) were con-sidered to be infrequent heavy drinking. Finally, respondents falling above the cut off anddrinking regularly (last month prevalence� 4 times drinking, i.e., weekly drinking) were classi-fied as heavy drinking.
In step two, these categorizations per measurement wave were combined into longitudinaldrinking groups. Participants were divided into six groups: non-drinker, light drinker, infre-quent heavy drinker, increasing heavy drinker, decreasing heavy drinker, and chronic heavydrinker. For example, a participant not drinking at T3 and heavy drinking at T4 was longitudi-nally classified as increasing heavy drinker. For all possible combinations and descriptive statis-tics, see Table 1.
Executive functioning. Baseline executive functioning was examined at T1, using threecomputerised reaction time tasks from the Amsterdam Neuropsychological Tasks (ANT) [26].
Heavy Drinking and Executive Functioning
PLOS ONE | DOI:10.1371/journal.pone.0139186 October 21, 2015 4 / 15
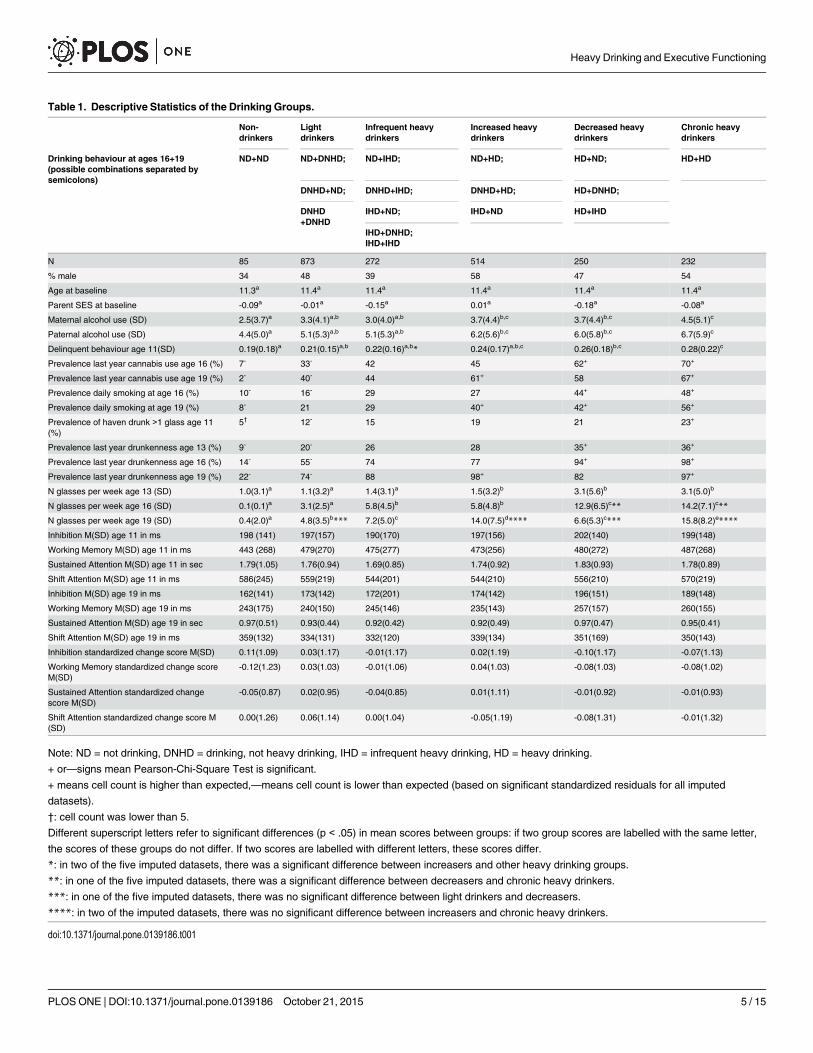
Table 1. Descriptive Statistics of the Drinking Groups.
Non-drinkers
Lightdrinkers
Infrequent heavydrinkers
Increased heavydrinkers
Decreased heavydrinkers
Chronic heavydrinkers
Drinking behaviour at ages 16+19(possible combinations separated bysemicolons)
ND+ND ND+DNHD; ND+IHD; ND+HD; HD+ND; HD+HD
DNHD+ND; DNHD+IHD; DNHD+HD; HD+DNHD;
DNHD+DNHD
IHD+ND; IHD+ND HD+IHD
IHD+DNHD;IHD+IHD
N 85 873 272 514 250 232
% male 34 48 39 58 47 54
Age at baseline 11.3a 11.4a 11.4a 11.4a 11.4a 11.4a
Parent SES at baseline -0.09a -0.01a -0.15a 0.01a -0.18a -0.08a
Maternal alcohol use (SD) 2.5(3.7)a 3.3(4.1)a,b 3.0(4.0)a,b 3.7(4.4)b,c 3.7(4.4)b,c 4.5(5.1)c
Paternal alcohol use (SD) 4.4(5.0)a 5.1(5.3)a,b 5.1(5.3)a,b 6.2(5.6)b,c 6.0(5.8)b,c 6.7(5.9)c
Delinquent behaviour age 11(SD) 0.19(0.18)a 0.21(0.15)a,b 0.22(0.16)a,b* 0.24(0.17)a,b,c 0.26(0.18)b,c 0.28(0.22)c
Prevalence last year cannabis use age 16 (%) 7- 33- 42 45 62+ 70+
Prevalence last year cannabis use age 19 (%) 2- 40- 44 61+ 58 67+
Prevalence daily smoking at age 16 (%) 10- 16- 29 27 44+ 48+
Prevalence daily smoking at age 19 (%) 8- 21 29 40+ 42+ 56+
Prevalence of haven drunk >1 glass age 11(%)
5† 12- 15 19 21 23+
Prevalence last year drunkenness age 13 (%) 9- 20- 26 28 35+ 36+
Prevalence last year drunkenness age 16 (%) 14- 55- 74 77 94+ 98+
Prevalence last year drunkenness age 19 (%) 22- 74- 88 98+ 82 97+
N glasses per week age 13 (SD) 1.0(3.1)a 1.1(3.2)a 1.4(3.1)a 1.5(3.2)b 3.1(5.6)b 3.1(5.0)b
N glasses per week age 16 (SD) 0.1(0.1)a 3.1(2.5)a 5.8(4.5)b 5.8(4.8)b 12.9(6.5)c** 14.2(7.1)c**
N glasses per week age 19 (SD) 0.4(2.0)a 4.8(3.5)b*** 7.2(5.0)c 14.0(7.5)d**** 6.6(5.3)c*** 15.8(8.2)e****
Inhibition M(SD) age 11 in ms 198 (141) 197(157) 190(170) 197(156) 202(140) 199(148)
Working Memory M(SD) age 11 in ms 443 (268) 479(270) 475(277) 473(256) 480(272) 487(268)
Sustained Attention M(SD) age 11 in sec 1.79(1.05) 1.76(0.94) 1.69(0.85) 1.74(0.92) 1.83(0.93) 1.78(0.89)
Shift Attention M(SD) age 11 in ms 586(245) 559(219) 544(201) 544(210) 556(210) 570(219)
Inhibition M(SD) age 19 in ms 162(141) 173(142) 172(201) 174(142) 196(151) 189(148)
Working Memory M(SD) age 19 in ms 243(175) 240(150) 245(146) 235(143) 257(157) 260(155)
Sustained Attention M(SD) age 19 in sec 0.97(0.51) 0.93(0.44) 0.92(0.42) 0.92(0.49) 0.97(0.47) 0.95(0.41)
Shift Attention M(SD) age 19 in ms 359(132) 334(131) 332(120) 339(134) 351(169) 350(143)
Inhibition standardized change score M(SD) 0.11(1.09) 0.03(1.17) -0.01(1.17) 0.02(1.19) -0.10(1.17) -0.07(1.13)
Working Memory standardized change scoreM(SD)
-0.12(1.23) 0.03(1.03) -0.01(1.06) 0.04(1.03) -0.08(1.03) -0.08(1.02)
Sustained Attention standardized changescore M(SD)
-0.05(0.87) 0.02(0.95) -0.04(0.85) 0.01(1.11) -0.01(0.92) -0.01(0.93)
Shift Attention standardized change score M(SD)
0.00(1.26) 0.06(1.14) 0.00(1.04) -0.05(1.19) -0.08(1.31) -0.01(1.32)
Note: ND = not drinking, DNHD = drinking, not heavy drinking, IHD = infrequent heavy drinking, HD = heavy drinking.
+ or—signs mean Pearson-Chi-Square Test is significant.
+ means cell count is higher than expected,—means cell count is lower than expected (based on significant standardized residuals for all imputed
datasets).
†: cell count was lower than 5.
Different superscript letters refer to significant differences (p < .05) in mean scores between groups: if two group scores are labelled with the same letter,
the scores of these groups do not differ. If two scores are labelled with different letters, these scores differ.
*: in two of the five imputed datasets, there was a significant difference between increasers and other heavy drinking groups.
**: in one of the five imputed datasets, there was a significant difference between decreasers and chronic heavy drinkers.
***: in one of the five imputed datasets, there was no significant difference between light drinkers and decreasers.
****: in two of the imputed datasets, there was no significant difference between increasers and chronic heavy drinkers.
doi:10.1371/journal.pone.0139186.t001
Heavy Drinking and Executive Functioning
PLOS ONE | DOI:10.1371/journal.pone.0139186 October 21, 2015 5 / 15
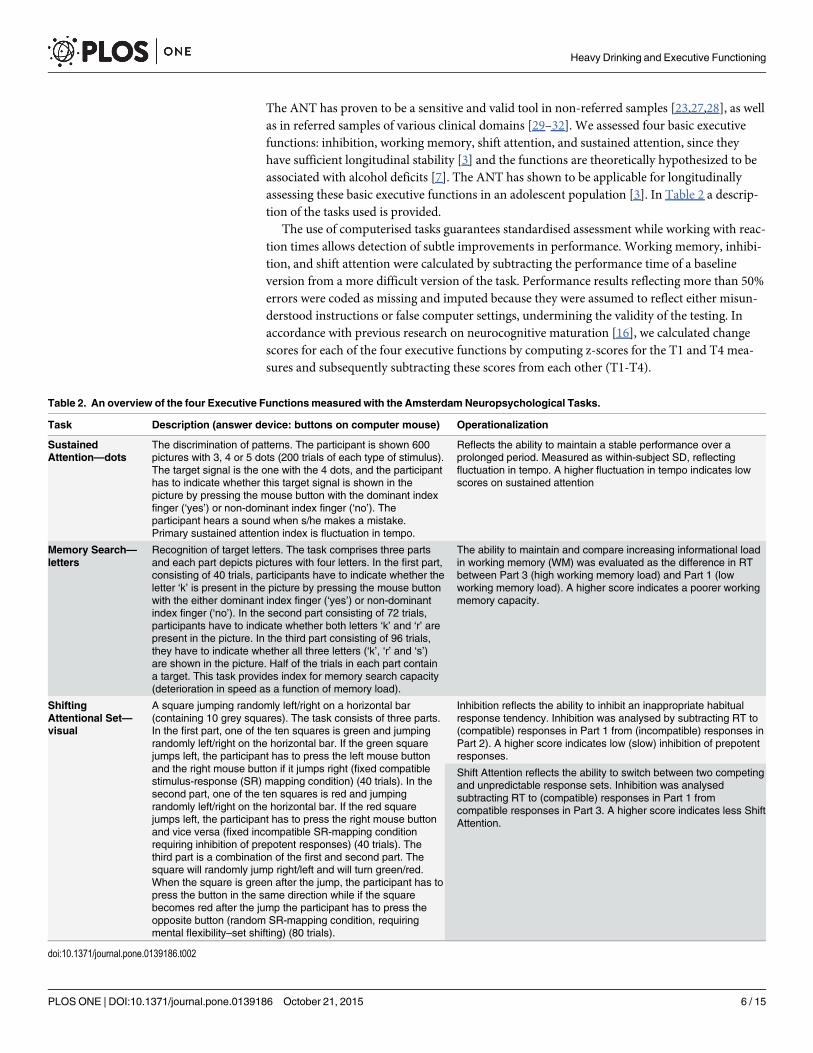
The ANT has proven to be a sensitive and valid tool in non-referred samples [23,27,28], as wellas in referred samples of various clinical domains [29–32]. We assessed four basic executivefunctions: inhibition, working memory, shift attention, and sustained attention, since theyhave sufficient longitudinal stability [3] and the functions are theoretically hypothesized to beassociated with alcohol deficits [7]. The ANT has shown to be applicable for longitudinallyassessing these basic executive functions in an adolescent population [3]. In Table 2 a descrip-tion of the tasks used is provided.
The use of computerised tasks guarantees standardised assessment while working with reac-tion times allows detection of subtle improvements in performance. Working memory, inhibi-tion, and shift attention were calculated by subtracting the performance time of a baselineversion from a more difficult version of the task. Performance results reflecting more than 50%errors were coded as missing and imputed because they were assumed to reflect either misun-derstood instructions or false computer settings, undermining the validity of the testing. Inaccordance with previous research on neurocognitive maturation [16], we calculated changescores for each of the four executive functions by computing z-scores for the T1 and T4 mea-sures and subsequently subtracting these scores from each other (T1-T4).
Table 2. An overview of the four Executive Functionsmeasured with the Amsterdam Neuropsychological Tasks.
Task Description (answer device: buttons on computer mouse) Operationalization
SustainedAttention—dots
The discrimination of patterns. The participant is shown 600pictures with 3, 4 or 5 dots (200 trials of each type of stimulus).The target signal is the one with the 4 dots, and the participanthas to indicate whether this target signal is shown in thepicture by pressing the mouse button with the dominant indexfinger (‘yes’) or non-dominant index finger (‘no’). Theparticipant hears a sound when s/he makes a mistake.Primary sustained attention index is fluctuation in tempo.
Reflects the ability to maintain a stable performance over aprolonged period. Measured as within-subject SD, reflectingfluctuation in tempo. A higher fluctuation in tempo indicates lowscores on sustained attention
Memory Search—letters
Recognition of target letters. The task comprises three partsand each part depicts pictures with four letters. In the first part,consisting of 40 trials, participants have to indicate whether theletter ‘k’ is present in the picture by pressing the mouse buttonwith the either dominant index finger (‘yes’) or non-dominantindex finger (‘no’). In the second part consisting of 72 trials,participants have to indicate whether both letters ‘k’ and ‘r’ arepresent in the picture. In the third part consisting of 96 trials,they have to indicate whether all three letters (‘k’, ‘r’ and ‘s’)are shown in the picture. Half of the trials in each part containa target. This task provides index for memory search capacity(deterioration in speed as a function of memory load).
The ability to maintain and compare increasing informational loadin working memory (WM) was evaluated as the difference in RTbetween Part 3 (high working memory load) and Part 1 (lowworking memory load). A higher score indicates a poorer workingmemory capacity.
ShiftingAttentional Set—visual
A square jumping randomly left/right on a horizontal bar(containing 10 grey squares). The task consists of three parts.In the first part, one of the ten squares is green and jumpingrandomly left/right on the horizontal bar. If the green squarejumps left, the participant has to press the left mouse buttonand the right mouse button if it jumps right (fixed compatiblestimulus-response (SR) mapping condition) (40 trials). In thesecond part, one of the ten squares is red and jumpingrandomly left/right on the horizontal bar. If the red squarejumps left, the participant has to press the right mouse buttonand vice versa (fixed incompatible SR-mapping conditionrequiring inhibition of prepotent responses) (40 trials). Thethird part is a combination of the first and second part. Thesquare will randomly jump right/left and will turn green/red.When the square is green after the jump, the participant has topress the button in the same direction while if the squarebecomes red after the jump the participant has to press theopposite button (random SR-mapping condition, requiringmental flexibility–set shifting) (80 trials).
Inhibition reflects the ability to inhibit an inappropriate habitualresponse tendency. Inhibition was analysed by subtracting RT to(compatible) responses in Part 1 from (incompatible) responses inPart 2). A higher score indicates low (slow) inhibition of prepotentresponses.
Shift Attention reflects the ability to switch between two competingand unpredictable response sets. Inhibition was analysedsubtracting RT to (compatible) responses in Part 1 fromcompatible responses in Part 3. A higher score indicates less ShiftAttention.
doi:10.1371/journal.pone.0139186.t002
Heavy Drinking and Executive Functioning
PLOS ONE | DOI:10.1371/journal.pone.0139186 October 21, 2015 6 / 15
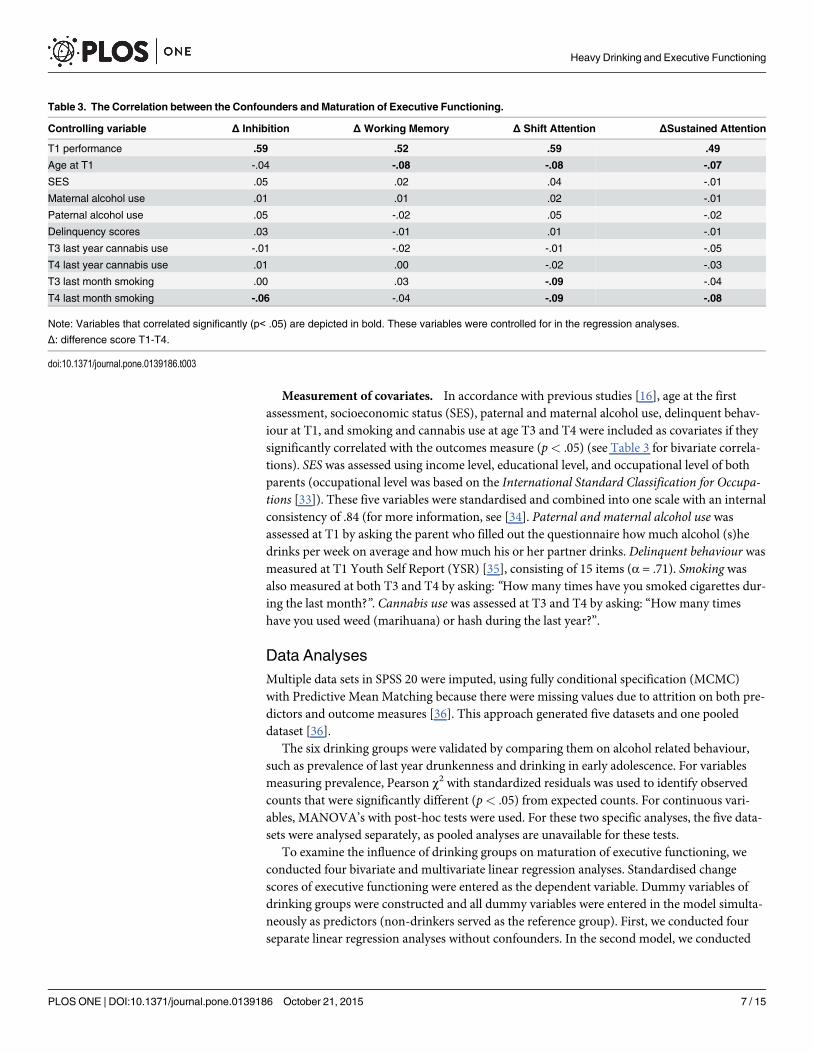
Measurement of covariates. In accordance with previous studies [16], age at the firstassessment, socioeconomic status (SES), paternal and maternal alcohol use, delinquent behav-iour at T1, and smoking and cannabis use at age T3 and T4 were included as covariates if theysignificantly correlated with the outcomes measure (p< .05) (see Table 3 for bivariate correla-tions). SES was assessed using income level, educational level, and occupational level of bothparents (occupational level was based on the International Standard Classification for Occupa-tions [33]). These five variables were standardised and combined into one scale with an internalconsistency of .84 (for more information, see [34]. Paternal and maternal alcohol use wasassessed at T1 by asking the parent who filled out the questionnaire how much alcohol (s)hedrinks per week on average and how much his or her partner drinks. Delinquent behaviour wasmeasured at T1 Youth Self Report (YSR) [35], consisting of 15 items (α = .71). Smoking wasalso measured at both T3 and T4 by asking: “How many times have you smoked cigarettes dur-ing the last month?”. Cannabis use was assessed at T3 and T4 by asking: “How many timeshave you used weed (marihuana) or hash during the last year?”.
Data AnalysesMultiple data sets in SPSS 20 were imputed, using fully conditional specification (MCMC)with Predictive Mean Matching because there were missing values due to attrition on both pre-dictors and outcome measures [36]. This approach generated five datasets and one pooleddataset [36].
The six drinking groups were validated by comparing them on alcohol related behaviour,such as prevalence of last year drunkenness and drinking in early adolescence. For variablesmeasuring prevalence, Pearson χ2 with standardized residuals was used to identify observedcounts that were significantly different (p< .05) from expected counts. For continuous vari-ables, MANOVA’s with post-hoc tests were used. For these two specific analyses, the five data-sets were analysed separately, as pooled analyses are unavailable for these tests.
To examine the influence of drinking groups on maturation of executive functioning, weconducted four bivariate and multivariate linear regression analyses. Standardised changescores of executive functioning were entered as the dependent variable. Dummy variables ofdrinking groups were constructed and all dummy variables were entered in the model simulta-neously as predictors (non-drinkers served as the reference group). First, we conducted fourseparate linear regression analyses without confounders. In the second model, we conducted
Table 3. The Correlation between the Confounders and Maturation of Executive Functioning.
Controlling variable Δ Inhibition Δ Working Memory Δ Shift Attention ΔSustained Attention
T1 performance .59 .52 .59 .49
Age at T1 -.04 -.08 -.08 -.07
SES .05 .02 .04 -.01
Maternal alcohol use .01 .01 .02 -.01
Paternal alcohol use .05 -.02 .05 -.02
Delinquency scores .03 -.01 .01 -.01
T3 last year cannabis use -.01 -.02 -.01 -.05
T4 last year cannabis use .01 .00 -.02 -.03
T3 last month smoking .00 .03 -.09 -.04
T4 last month smoking -.06 -.04 -.09 -.08
Note: Variables that correlated significantly (p< .05) are depicted in bold. These variables were controlled for in the regression analyses.
Δ: difference score T1-T4.
doi:10.1371/journal.pone.0139186.t003
Heavy Drinking and Executive Functioning
PLOS ONE | DOI:10.1371/journal.pone.0139186 October 21, 2015 7 / 15
four multivariate linear regression analyses adjusting for control variables. Main effects ofdrinking groups and drinking patters�gender interaction were entered in separate blocks andinterpreted accordingly. To reduce Type 1 error, we set α at< .01. For the regression analyses,data from the pooled dataset were used for interpretation.
Results
Descriptive statisticsDescriptive statistics are depicted in Table 1. There were no differences between the groups forbaseline executive functioning, SES, and age. Pearson χ2 yielded significant differences betweengroups for prevalence rates of other substance use, drinking in early adolescence, and drunken-ness. Non-drinkers and light drinkers scored lower than expected on all variables while thechronic heavy drinkers scored higher on all variables.
A MANOVA indicated significant differences between groups on all continuous measures(p< .001). Parental alcohol use and delinquency scores in pre-adolescence were largest in thefrequent heavy drinking groups (i.e., increasers, decreasers, chronic heavy drinkers). Also,those who later would be classified as frequent heavy drinkers consumed significantly morealcohol at age 13 than the future non-drinkers, light drinkers, and infrequent heavy drinkers.Chronic drinkers, as to be expected, drank most at ages 16 and 19 with an average weekly con-sumption finally exceeding 14 glasses. Taken together, the results indicate significant differ-ences between the drinking groups on all measures of alcohol related behaviour, validating ouridentification of the six drinking patterns. The patterns become more differentiated as the ado-lescents get older.
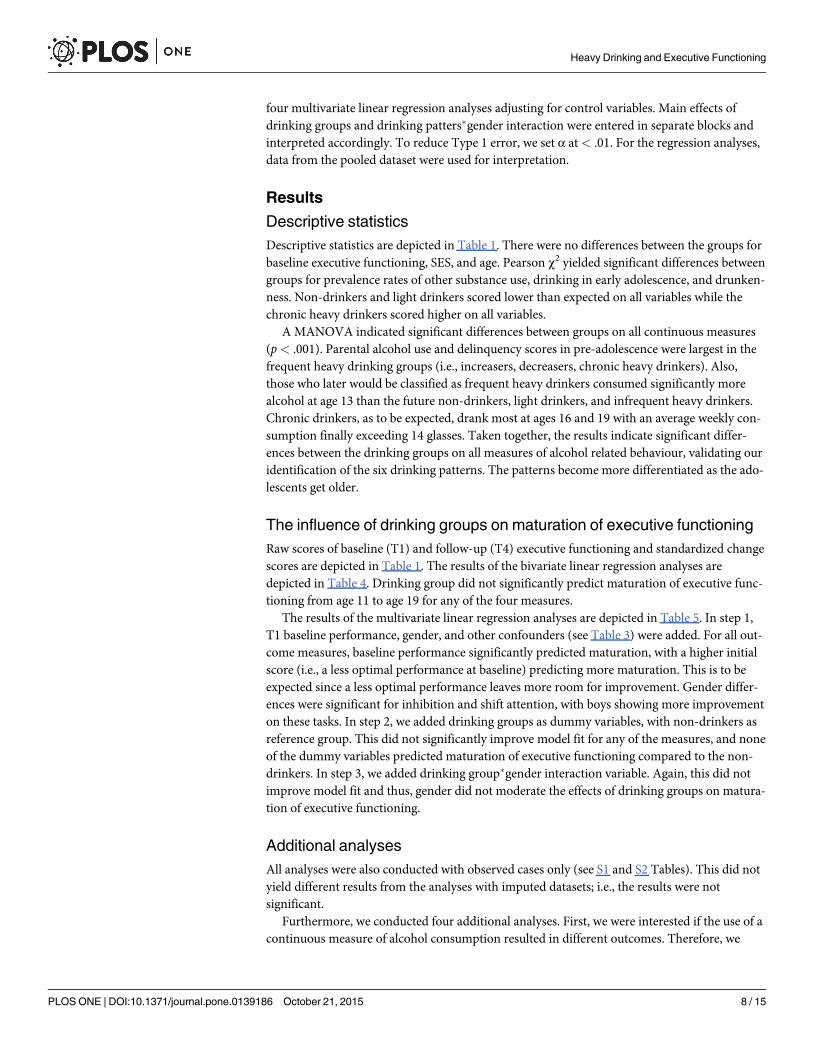
The influence of drinking groups on maturation of executive functioningRaw scores of baseline (T1) and follow-up (T4) executive functioning and standardized changescores are depicted in Table 1. The results of the bivariate linear regression analyses aredepicted in Table 4. Drinking group did not significantly predict maturation of executive func-tioning from age 11 to age 19 for any of the four measures.
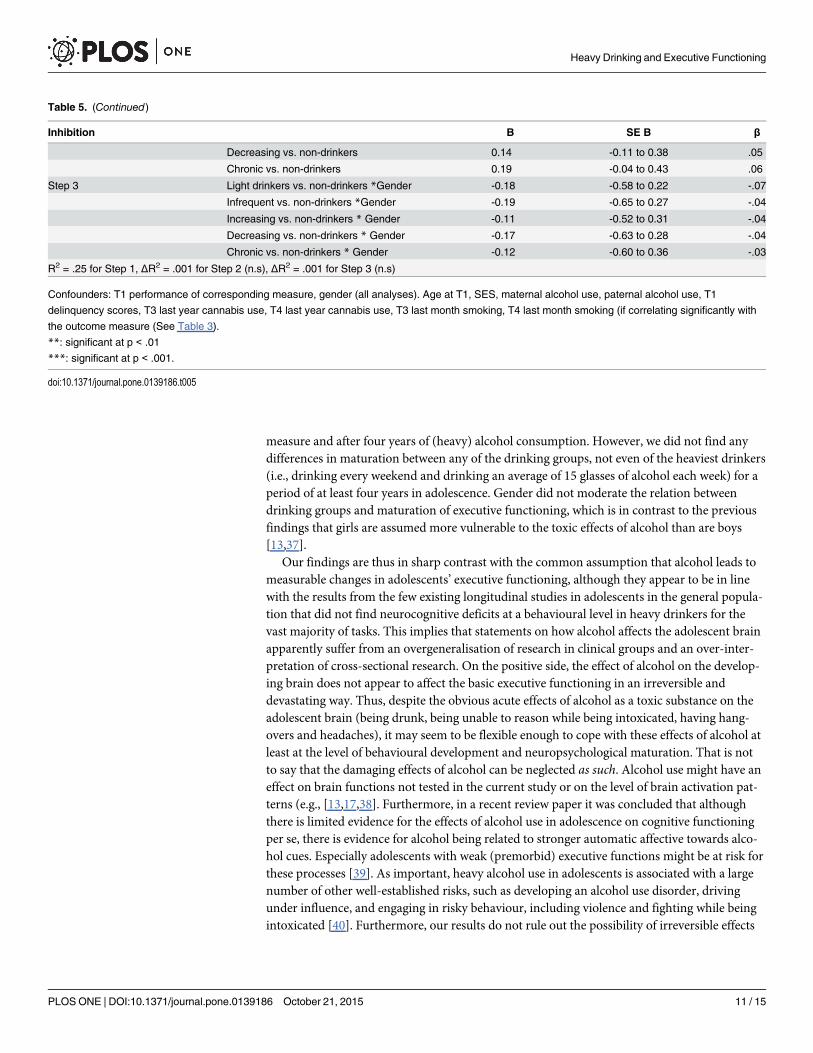
The results of the multivariate linear regression analyses are depicted in Table 5. In step 1,T1 baseline performance, gender, and other confounders (see Table 3) were added. For all out-come measures, baseline performance significantly predicted maturation, with a higher initialscore (i.e., a less optimal performance at baseline) predicting more maturation. This is to beexpected since a less optimal performance leaves more room for improvement. Gender differ-ences were significant for inhibition and shift attention, with boys showing more improvementon these tasks. In step 2, we added drinking groups as dummy variables, with non-drinkers asreference group. This did not significantly improve model fit for any of the measures, and noneof the dummy variables predicted maturation of executive functioning compared to the non-drinkers. In step 3, we added drinking group�gender interaction variable. Again, this did notimprove model fit and thus, gender did not moderate the effects of drinking groups on matura-tion of executive functioning.
Additional analysesAll analyses were also conducted with observed cases only (see S1 and S2 Tables). This did notyield different results from the analyses with imputed datasets; i.e., the results were notsignificant.
Furthermore, we conducted four additional analyses. First, we were interested if the use of acontinuous measure of alcohol consumption resulted in different outcomes. Therefore, we
Heavy Drinking and Executive Functioning
PLOS ONE | DOI:10.1371/journal.pone.0139186 October 21, 2015 8 / 15
conducted linear regression analyses where the average number of glasses per week at T3, atT4, and the sum of these two measures as predictors. This did not result in significant findings(p>.01). Second, we tested whether the findings changed when drinking groups were formedaccording to the definition of heavy drinking by the National Institute on Alcohol Abuse andAlcoholism (i.e.,>3/4 glasses daily and>7/14 glasses weekly for women and men respec-tively). The analysis did not yield significant results (p>.01). Third, non-drinkers may consistof a non-normative group of adolescents; therefore, we also examined whether the findingschanged when we used light drinkers or infrequent heavy drinkers as reference group insteadof non-drinkers. The results were not significant (p>.01). Finally, since there are differences inmaturation in executive functioning between males and females, we also undertook separateanalyses for boys and girls, instead of using gender as a moderator. The results were not signifi-cant (p>.01). (Data of additional analyses not presented, information available by first authoron request).
DiscussionOur longitudinal study did not show any measurable differences between groups of alcoholusers with respect to maturation of executive functioning, contrary to the hypothesis that thedeveloping adolescent brain is particularly vulnerable to neurocognitive aversive effects of alco-hol (e.g.,[5]. The present study found expected maturation on all the executive functioningtests that we used (inhibition, working memory, and sustained and shift attention) [3],–herebymeasuring executive functioning over a time span of eight years, i.e., with a pre-exposure
Table 4. Standardised maturation of Executive Functioning (T1-T4) predicted by drinking groups(T3-T4) without controlling for covariates.
Inhibition B 99%CI B β
Light drinkers vs. non-drinkers -0.08 -0.35 to 0.18 -.04
Infrequent vs. non-drinkers -0.12 -0.42 to 0.18 -.03
Increasing vs. non-drinkers -0.09 -0.37 to 0.19 -.03
Decreasing vs. non-drinkers -0.22 -0.56 to 0.13 -.06
Chronic vs. non-drinkers -0.18 -0.51 to 0.14 -.05
Working Memory
Light drinkers vs. non-drinkers 0.15 -0.08 to 0.39 .07
Infrequent vs. non-drinkers 0.11 -0.15 to 0.37 .03
Increasing vs. non-drinkers 0.17 -0.08 to 0.42 .07
Decreasing vs. non-drinkers 0.04 -0.23 to 0.31 .01
Chronic vs. non-drinkers 0.04 -0.28 to 0.32 .01
Shift Attention
Light drinkers vs. non-drinkers 0.06 -0.22 to 0.33 .02
Infrequent vs. non-drinkers 0.00 -0.29 to 0.29 .00
Increasing vs. non-drinkers -0.05 -0.34 to 0.23 -.02
Decreasing vs. non-drinkers -0.08 -0.39 to 0.23 -.02
Chronic vs. non-drinkers -0.01 -0.33 to 0.31 -.00
Sustained Attention
Light drinkers vs. non-drinkers 0.07 -0.15 to 0.29 .04
Infrequent vs. non-drinkers 0.01 -0.23 to 0.26 .01
Increasing vs. non-drinkers 0.06 -0.17 to 0.29 .03
Decreasing vs. non-drinkers 0.04 -0.21 to 0.30 .01
Chronic vs. non-drinkers 0.04 -0.23 to 0.30 .01
doi:10.1371/journal.pone.0139186.t004
Heavy Drinking and Executive Functioning
PLOS ONE | DOI:10.1371/journal.pone.0139186 October 21, 2015 9 / 15
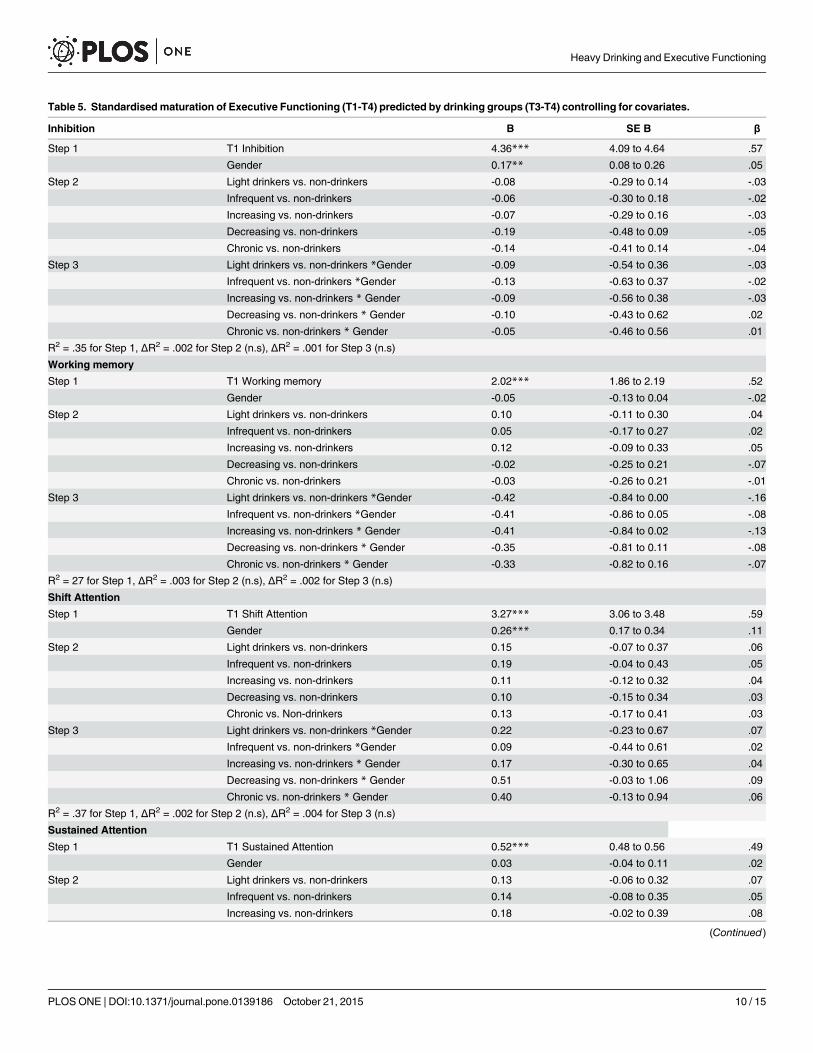
Table 5. Standardised maturation of Executive Functioning (T1-T4) predicted by drinking groups (T3-T4) controlling for covariates.
Inhibition B SE B β
Step 1 T1 Inhibition 4.36*** 4.09 to 4.64 .57
Gender 0.17** 0.08 to 0.26 .05
Step 2 Light drinkers vs. non-drinkers -0.08 -0.29 to 0.14 -.03
Infrequent vs. non-drinkers -0.06 -0.30 to 0.18 -.02
Increasing vs. non-drinkers -0.07 -0.29 to 0.16 -.03
Decreasing vs. non-drinkers -0.19 -0.48 to 0.09 -.05
Chronic vs. non-drinkers -0.14 -0.41 to 0.14 -.04
Step 3 Light drinkers vs. non-drinkers *Gender -0.09 -0.54 to 0.36 -.03
Infrequent vs. non-drinkers *Gender -0.13 -0.63 to 0.37 -.02
Increasing vs. non-drinkers * Gender -0.09 -0.56 to 0.38 -.03
Decreasing vs. non-drinkers * Gender -0.10 -0.43 to 0.62 .02
Chronic vs. non-drinkers * Gender -0.05 -0.46 to 0.56 .01
R2 = .35 for Step 1, ΔR2 = .002 for Step 2 (n.s), ΔR2 = .001 for Step 3 (n.s)
Working memory
Step 1 T1 Working memory 2.02*** 1.86 to 2.19 .52
Gender -0.05 -0.13 to 0.04 -.02
Step 2 Light drinkers vs. non-drinkers 0.10 -0.11 to 0.30 .04
Infrequent vs. non-drinkers 0.05 -0.17 to 0.27 .02
Increasing vs. non-drinkers 0.12 -0.09 to 0.33 .05
Decreasing vs. non-drinkers -0.02 -0.25 to 0.21 -.07
Chronic vs. non-drinkers -0.03 -0.26 to 0.21 -.01
Step 3 Light drinkers vs. non-drinkers *Gender -0.42 -0.84 to 0.00 -.16
Infrequent vs. non-drinkers *Gender -0.41 -0.86 to 0.05 -.08
Increasing vs. non-drinkers * Gender -0.41 -0.84 to 0.02 -.13
Decreasing vs. non-drinkers * Gender -0.35 -0.81 to 0.11 -.08
Chronic vs. non-drinkers * Gender -0.33 -0.82 to 0.16 -.07
R2 = 27 for Step 1, ΔR2 = .003 for Step 2 (n.s), ΔR2 = .002 for Step 3 (n.s)
Shift Attention
Step 1 T1 Shift Attention 3.27*** 3.06 to 3.48 .59
Gender 0.26*** 0.17 to 0.34 .11
Step 2 Light drinkers vs. non-drinkers 0.15 -0.07 to 0.37 .06
Infrequent vs. non-drinkers 0.19 -0.04 to 0.43 .05
Increasing vs. non-drinkers 0.11 -0.12 to 0.32 .04
Decreasing vs. non-drinkers 0.10 -0.15 to 0.34 .03
Chronic vs. Non-drinkers 0.13 -0.17 to 0.41 .03
Step 3 Light drinkers vs. non-drinkers *Gender 0.22 -0.23 to 0.67 .07
Infrequent vs. non-drinkers *Gender 0.09 -0.44 to 0.61 .02
Increasing vs. non-drinkers * Gender 0.17 -0.30 to 0.65 .04
Decreasing vs. non-drinkers * Gender 0.51 -0.03 to 1.06 .09
Chronic vs. non-drinkers * Gender 0.40 -0.13 to 0.94 .06
R2 = .37 for Step 1, ΔR2 = .002 for Step 2 (n.s), ΔR2 = .004 for Step 3 (n.s)
Sustained Attention
Step 1 T1 Sustained Attention 0.52*** 0.48 to 0.56 .49
Gender 0.03 -0.04 to 0.11 .02
Step 2 Light drinkers vs. non-drinkers 0.13 -0.06 to 0.32 .07
Infrequent vs. non-drinkers 0.14 -0.08 to 0.35 .05
Increasing vs. non-drinkers 0.18 -0.02 to 0.39 .08
(Continued)
Heavy Drinking and Executive Functioning
PLOS ONE | DOI:10.1371/journal.pone.0139186 October 21, 2015 10 / 15
measure and after four years of (heavy) alcohol consumption. However, we did not find anydifferences in maturation between any of the drinking groups, not even of the heaviest drinkers(i.e., drinking every weekend and drinking an average of 15 glasses of alcohol each week) for aperiod of at least four years in adolescence. Gender did not moderate the relation betweendrinking groups and maturation of executive functioning, which is in contrast to the previousfindings that girls are assumed more vulnerable to the toxic effects of alcohol than are boys[13,37].
Our findings are thus in sharp contrast with the common assumption that alcohol leads tomeasurable changes in adolescents’ executive functioning, although they appear to be in linewith the results from the few existing longitudinal studies in adolescents in the general popula-tion that did not find neurocognitive deficits at a behavioural level in heavy drinkers for thevast majority of tasks. This implies that statements on how alcohol affects the adolescent brainapparently suffer from an overgeneralisation of research in clinical groups and an over-inter-pretation of cross-sectional research. On the positive side, the effect of alcohol on the develop-ing brain does not appear to affect the basic executive functioning in an irreversible anddevastating way. Thus, despite the obvious acute effects of alcohol as a toxic substance on theadolescent brain (being drunk, being unable to reason while being intoxicated, having hang-overs and headaches), it may seem to be flexible enough to cope with these effects of alcohol atleast at the level of behavioural development and neuropsychological maturation. That is notto say that the damaging effects of alcohol can be neglected as such. Alcohol use might have aneffect on brain functions not tested in the current study or on the level of brain activation pat-terns (e.g., [13,17,38]. Furthermore, in a recent review paper it was concluded that althoughthere is limited evidence for the effects of alcohol use in adolescence on cognitive functioningper se, there is evidence for alcohol being related to stronger automatic affective towards alco-hol cues. Especially adolescents with weak (premorbid) executive functions might be at risk forthese processes [39]. As important, heavy alcohol use in adolescents is associated with a largenumber of other well-established risks, such as developing an alcohol use disorder, drivingunder influence, and engaging in risky behaviour, including violence and fighting while beingintoxicated [40]. Furthermore, our results do not rule out the possibility of irreversible effects
Table 5. (Continued)
Inhibition B SE B β
Decreasing vs. non-drinkers 0.14 -0.11 to 0.38 .05
Chronic vs. non-drinkers 0.19 -0.04 to 0.43 .06
Step 3 Light drinkers vs. non-drinkers *Gender -0.18 -0.58 to 0.22 -.07
Infrequent vs. non-drinkers *Gender -0.19 -0.65 to 0.27 -.04
Increasing vs. non-drinkers * Gender -0.11 -0.52 to 0.31 -.04
Decreasing vs. non-drinkers * Gender -0.17 -0.63 to 0.28 -.04
Chronic vs. non-drinkers * Gender -0.12 -0.60 to 0.36 -.03
R2 = .25 for Step 1, ΔR2 = .001 for Step 2 (n.s), ΔR2 = .001 for Step 3 (n.s)
Confounders: T1 performance of corresponding measure, gender (all analyses). Age at T1, SES, maternal alcohol use, paternal alcohol use, T1
delinquency scores, T3 last year cannabis use, T4 last year cannabis use, T3 last month smoking, T4 last month smoking (if correlating significantly with
the outcome measure (See Table 3).
**: significant at p < .01
***: significant at p < .001.
doi:10.1371/journal.pone.0139186.t005
Heavy Drinking and Executive Functioning
PLOS ONE | DOI:10.1371/journal.pone.0139186 October 21, 2015 11 / 15
of alcohol in the long run, either after continuation of heavy drinking of a longer period oftime, or the possibility that adolescent heavy drinking might set the stage for deficits in neuro-cognitive functioning that would manifest at some point later in life.
Strengths and limitationsOur approach has several strengths and limitations. Strengths are the large population sampleand the longitudinal design. To the best of our knowledge, this study was the first to assess heavydrinking in relation to maturation of executive functioning in a longitudinal population cohort ofadolescents, covering about eight years, which is longer than in any of the other previous studies.We controlled for several significant confounders that correlated with our dependent variable.We conducted our study in the Netherlands, where legal drinking age is much younger than forexample in the United States and alcohol consumption in adolescence is very common, optimis-ing the chances for finding effects of heavy drinking on maturation of executive functioning.
The first limitation concerns the basic tasks used to measure executive functioning. Wemeasured the behavioural consequences of heavy and regular alcohol use with straightforwardreaction time tasks, with each task measuring specific sub-components of executive function-ing [3]. This does not entail any knowledge on whether the underlying neuro-anatomy isaffected and to what extent. For example, equal task performance in heavy drinkers and con-trols can still be accompanied by differences in neural activation while performing this task[13,38]. It is unclear what these differences represent, but they suggest that alterations in neuralprocessing do not necessarily appear at a behavioural level [15]. In addition, the possibilityexists that more complex neuropsychological tasks might have been more sensitive in pickingup such alterations. However, an important advantage of starting with the basics was that itallowed using exactly the same tasks at both age 11 and 19, which is a requirement for findinglongitudinal change. More complex and strategy-based tasks usually have more stringent agerestrictions, and tasks that are both feasible for early adolescents yet still challenging in lateadolescence are difficult to find [41]. Furthermore, using straightforward tasks circumvents theproblem of ‘task impurity’. Since more complex tasks are assumed to rely on multiple cognitiveprocesses and their integration [16,18,42], it is difficult to identify processes that are responsi-ble for a suboptimal performance [43]. The reaction time tasks we used were not designed todetect deficits, but are able to detect differences between groups on the level of performance.Our findings indicate no performance differences between drinking adolescents and abstainingpeers on basic functions, making deficits in these skills unlikely.
The second limitation could be that drinking groups were constructed manually using self-reported measures of alcohol use, although this is common in longitudinal research on adoles-cent alcohol use [15,16]. Self-report questionnaires have proved to be reliable for assessingalcohol use in adolescence [44]. In addition, our drinking groups showed good and consistentdifferentiation on validating measures. Although these concern measures obtained from therespondents themselves and not external or independent validators, these findings are reassur-ing. Chronic drinkers score highest on all alcohol-related behaviours and reveal a heavy drink-ing pattern at two consecutive waves, which cover at least four years of regular heavy drinking.We are therefore confident that we have adequately identified the most risky drinkers.
The final limitation of longitudinal designs is that attrition may have biased the findings,with most at-risk participants dropping out, resulting in an underestimation of effects and pos-sible loss of power. However, using multiple imputation, missing data on alcohol use and exec-utive functioning were imputed based on a wide variety of associated variables. This techniqueimproves validity of datasets with missing data [45]. Therefore, in our study, attrition bias isunlikely to explain the absence of significant results.
Heavy Drinking and Executive Functioning
PLOS ONE | DOI:10.1371/journal.pone.0139186 October 21, 2015 12 / 15
ImplicationsWe did not find the effects of adolescent alcohol use on maturation of executive functioning inadolescence. Four years of self-reported weekly heavy drinking did not result in deviancies inbehavioural performance on a variety of straightforward executive functioning tasks. However,these finding should not be seen as reassuring about adolescent alcohol use as there are numer-ous other risk related to heavy drinking, such as developing an alcohol use disorder, drivingunder influence, and engaging in risky behaviour that include violence and fighting whilebeing intoxicated [40]. Consideration of these risks calls for continuous prevention efforts tar-geting heavy alcohol use in adolescents.
Supporting InformationS1 Database. Database (SPSS file) for data availability.(SAV)
S1 Table. Standardised maturation of Executive Functioning (T1-T4) predicted by drink-ing groups (T3-T4) without controlling for covariates for observed cases only.(DOCX)
S2 Table. Standardised maturation of Executive Functioning (T1-T4) predicted by drink-ing groups (T3-T4) controlling for covariates for observed cases only.(DOCX)
AcknowledgmentsThis research is part of the TRacking Adolescents' Individual Lives Survey (TRAILS). Partici-pating centres of TRAILS include various departments of the University Medical Center andUniversity of Groningen, the Erasmus University Medical Center Rotterdam, the University ofUtrecht, the Radboud Medical Center Nijmegen, and the Parnassia Bavo group, all in the Neth-erlands. We are grateful to all adolescents, their parents and teachers who participated in thisresearch and to everyone who worked on this project and made it possible.
Author ContributionsConceived and designed the experiments: JO, FCV, MZ, WAMV. Performed the experiments:SRB. Analyzed the data: SRB, ZH. Wrote the paper: SRB, ZH, MZ, SAR, FCV, JO, WAMV.
References1. Verdurmen J, Monshouwer K, van Dorsselaer S, Lokman S, Smit-Vermeulen E, VolleberghW. Jeugd
en riskant gedrag 2011: kerngegevens uit het Peilstationsonderzoek scholieren. Utrecht: Trimbos-instituut; 2012.
2. Giedd JN, Blumenthal J, Jeffries NO, Castellanos FX, Liu H, Zijdenbos A, et al. Brain development dur-ing childhood and adolescence: a longitudinal MRI study. Nat Neurosci. 1999; 2: 861–863. PMID:10491603
3. Boelema SR, Harakeh Z, Ormel J, Hartman CA, VolleberghWA, van Zandvoort MJ. Executive Func-tioning shows differential maturation from early to late adolescence: Longitudinal findings from aTRAILS Study. Neuropsychology. 2014; 28: 177–187. doi: 10.1037/neu0000049 PMID: 24364395
4. Crone EA. Executive functions in adolescence: inferences from brain and behavior. 2009;12: 825–830.
5. Clark DB, Thatcher DL, Tapert SF. Alcohol, psychological dysregulation, and adolescent brain develop-ment. Alcohol Clin Exp Res. 2008; 32: 375–385. doi: 10.1111/j.1530-0277.2007.00601.x PMID:18241320
6. Moss HB, Kirisci L, Gordon HW, Tarter RE. A Neuropsychologic profile of adolescent alcoholics. Alco-hol Clin Exp Res. 1994; 18: 159–163. PMID: 8198214
Heavy Drinking and Executive Functioning
PLOS ONE | DOI:10.1371/journal.pone.0139186 October 21, 2015 13 / 15
7. Tarter RE, Mezzich AC, Hsieh YC, Parks SM. Cognitive capacity in female adolescent substance abus-ers. Drug Alcohol Depend. 1995; 39: 15–21. PMID: 7587969
8. Brown SA, Tapert SF, Granholm E, Delis DC. Neurocognitive functioning of adolescents: Effects of pro-tracted alcohol use. Alcohol Clin Exp Res. 2000; 24: 164–171. PMID: 10698367
9. Tapert SF, Baratta MV, Abrantes AM, Brown SA. Attention dysfunction predicts substance involvementin community youths. J Am Acad Child Adolesc Psychiatry. 2002; 41: 680–686. PMID: 12049442
10. Tarter RE, Kirisci L, Mezzich A, Cornelius JR, Pajer K, Vanyukov M, et al. Neurobehavioral disinhibitionin childhood predicts early age at onset of substance use disorder. Am J Psychiatry. 2003; 160: 1078–1085. PMID: 12777265
11. American Psychiatric Association. Diagnostic and statistical manual of mental disorders: DSM-IV-TR.4, text rev ed. Arlington, VA: American Psychiatric Publishing; 2000.
12. Hermens DF, Lagopoulos J, Tobias-Webb J, De Regt T, Dore G, Juckes L, et al. Pathways to alcohol-induced brain impairment in young people: A review. Cortex. 2013; 49: 3–17. doi: 10.1016/j.cortex.2012.05.021 PMID: 22789780
13. Squeglia LM, Schweinsburg AD, Pulido C, Tapert SF. Adolescent binge drinking linked to abnormalspatial working memory brain activation: differential gender effects. Alcohol Clin Exp Res. 2011; 35:1831–1841. doi: 10.1111/j.1530-0277.2011.01527.x PMID: 21762178
14. Schweinsburg AD, McQueeny T, Nagel BJ, Eyler LT, Tapert SF. A preliminary study of functional mag-netic resonance imaging response during verbal encoding among adolescent binge drinkers. Alcohol.2010; 44: 111–117. doi: 10.1016/j.alcohol.2009.09.032 PMID: 20113879
15. Squeglia LM, Pulido C, Wetherill RR, Jacobus J, Brown GG, Tapert SF. Brain response to workingmemory over three years of adolescence: influence of initiating heavy drinking. J Stud Alcohol Drugs.2012; 73: 749–760. PMID: 22846239
16. Squeglia LM, Spadoni AD, Infante MA, Myers MG, Tapert SF. Initiating moderate to heavy alcohol usepredicts changes in neuropsychological functioning for adolescent girls and boys. Psychol AddictBehav. 2009; 23: 715–722. doi: 10.1037/a0016516 PMID: 20025379
17. Wetherill RR, Squeglia LM, Yang TT, Tapert SF. A longitudinal examination of adolescent responseinhibition: neural differences before and after the initiation of heavy drinking. Psychopharmacology(Berl). 2013; 230: 663–671.
18. Jurado MB, Rosselli M. The elusive nature of executive functions: a review of our current understand-ing. Neuropsychol Rev. 2007; 17: 213–233. PMID: 17786559
19. Blakemore S, Choudhury S. Development of the adolescent brain: implications for executive functionand social cognition. J. Child Psychol. Psychiatry. 2006; 47: 296–312.
20. Medina KL, Schweinsburg AD, Cohen-Zion M, Nagel BJ, Tapert SF. Effects of alcohol and combinedmarijuana and alcohol use during adolescence on hippocampal volume and asymmetry. NeurotoxicolTeratol. 2007; 29: 141–152. PMID: 17169528
21. DeWinter AF, Oldehinkel AJ, Veenstra R, Brunnekreef JA, Verhulst FC, Ormel J. Evaluation of non-response bias in mental health determinants and outcomes in a large sample of pre-adolescents. Eur JEpidemiol. 2005; 20: 173–181. PMID: 15792285
22. Ormel J, Oldehinkel AJ, Sijtsema J, van Oort F, Raven D, Veenstra R, et al. The TRacking Adolescents'Individual Lives Survey (TRAILS): Design, Current Status, and Selected Findings. J Am Acad ChildAdolesc Psychiatry. 2012; 51: 1020–1036. doi: 10.1016/j.jaac.2012.08.004 PMID: 23021478
23. Brunnekreef J, De Sonneville LMJ, Althaus M, Minderaa RB, Oldehinkel AJ, Verhulst FC, et al. Informa-tion processing profiles of internalizing and externalizing behavior problems: evidence from a popula-tion-based sample of preadolescents. J. Child Psychol. Psychiatry. 2007; 48: 185–193.
24. Weingardt KR, Baer JS, Kivlahan DR, Roberts LJ, Miller ET, Marlatt GA. Episodic heavy drinkingamong college students: Methodological issues and longitudinal perspectives. Psychol Addict Behav.1998; 12: 155–167.
25. Koning IM, van den Eijnden RJJM, Verdurmen JEE, Engels RCME, VolleberghWAM. A cluster ran-domized trial on the effects of a parent and student intervention on alcohol use in adolescents fouryears after baseline; no evidence of catching-up behavior. Addict Behav. 2013; 38: 2032–2039. doi: 10.1016/j.addbeh.2012.12.013 PMID: 23391851
26. De Sonneville LMJ. Amsterdam Neuropsychological Tasks: A computer-aided assessment program:Computers in psychology, vol. 6. In: den Brinker BPLM, Beek PJ, Brand AN, Maarse FJ, Mulder LJM,editors. Cognitive ergonomics, clinical assessment and computer-assisted learning. Lisse: Swets &Zeitlinger; 1999. pp. 187–203.
27. De Sonneville LMJ, Verschoor CA, Njiokiktjien C, Veld VO, Toorenaar N, Vranken M. Facial identityand facial emotions: speed, accuracy, and processing strategies in children and adults. J Clin Exp Neu-ropsyc. 2002; 24: 200–213.
Heavy Drinking and Executive Functioning
PLOS ONE | DOI:10.1371/journal.pone.0139186 October 21, 2015 14 / 15
28. Stins JF, Sonneville LMJ, Groot AS, Polderman TC, Baal CGCM, Boomsma DI. Heritability of selectiveattention and working memory in preschoolers. Behav Genet. 2005; 35: 407–416. PMID: 15971022
29. Altink ME, Slaats-Willemse DIE, Rommelse NNJ, Buschgens CJM, Fliers EA, Arias-Vásquez A, et al.Effects of maternal and paternal smoking on attentional control in children with and without ADHD. EurChild Adolesc Psychiatry. 2009; 18: 465–475. doi: 10.1007/s00787-009-0001-3 PMID: 19288168
30. Huijbregts SCJ, De Sonneville LMJ, Van Spronsen FJ, Berends IE, Licht R, Verkerk PH, et al. Motorfunction under lower and higher controlled processing demands in early and continuously treated phe-nylketonuria. Neuropsychology. 2003; 17: 369–379. PMID: 12959503
31. Rowbotham I, Pit-ten Cate IM, Sonuga-Barke EJS, Huijbregts SCJ. Cognitive control in adolescentswith neurofibromatosis type 1. Neuropsychology. 2009; 23: 50–60. doi: 10.1037/a0013927 PMID:19210032
32. Van Rijn S, Aleman A, De Sonneville L, Swaab H. Cognitive mechanisms underlying disorganization ofthought in a genetic syndrome (47, XXY). Schizophr Res. 2009; 112: 91–98. doi: 10.1016/j.schres.2009.04.017 PMID: 19447011
33. GanzeboomHBG, Treiman DJ. Internationally comparable measures of occupational status for the1988 International Standard Classification of Occupations. Soc Sci Res. 1996; 25: 201–239.
34. Veenstra R, Lindenberg S, Oldehinkel AJ, DeWinter AF, Verhulst FC, Ormel J. Bullying and victimiza-tion in elementary schools: a comparison of bullies, victims, bully/victims, and uninvolved preadoles-cents. Dev Psychol. 2005; 41: 672–682. PMID: 16060813
35. Achenbach TM. Manual for the Youth Self Report and 1991 Profile. Burlingtion, VT: University of Ver-mont, Department of Psychiatry; 1991.
36. Van Buuren S. Multiple imputation of discrete and continuous data by fully conditional specification.Stat Methods Med Res. 2007; 16: 219–242. PMID: 17621469
37. Caldwell LC, Schweinsburg AD, Nagel BJ, Barlett VC, Brown SA, Tapert SF. Gender and adolescentalcohol use disorders on BOLD (Blood Oxygen Level Dependent) response to spatial working memory.Alcohol Alcohol. 2005; 40: 194–200. PMID: 15668210
38. Maurage P, Joassin F, Speth A, Modave J, Philippot P, Campanella S. Cerebral effects of binge drink-ing: respective influences of global alcohol intake and consumption pattern. Clin Neurophysiol. 2012;123: 892–901. doi: 10.1016/j.clinph.2011.09.018 PMID: 22055841
39. Wiers RW, Boelema SR, Nikolaou K, Gladwin TE. On the Development of Implicit and Control Pro-cesses in Relation to Substance Use in Adolescence. Current Addict Rep. 2015; 2: 141–155.
40. Hingson RW, ZhaW. Age of drinking onset, alcohol use disorders, frequent heavy drinking, and unin-tentionally injuring oneself and others after drinking. Pediatrics. 2009; 123: 1477–1484. doi: 10.1542/peds.2008-2176 PMID: 19482757
41. Best JR, Miller PH. A developmental perspective on executive function. Child Dev. 2010; 81: 1641–1660. doi: 10.1111/j.1467-8624.2010.01499.x PMID: 21077853
42. Tsuchida A, Fellows LK. Are core component processes of executive function dissociable within thefrontal lobes? Evidence from humans with focal prefrontal damage. Cortex. 2013; 49: 1790–1800. doi:10.1016/j.cortex.2012.10.014 PMID: 23206529
43. Best JR, Miller PH, Jones LL. Executive functions after age 5: Changes and correlates. Dev Rev. 2009;29: 180–200. PMID: 20161467
44. Koning IM, Harakeh Z, Engels RC, VolleberghWA. A comparison of self-reported alcohol use mea-sures by early adolescents: Questionnaires versus diary. J Subst Use. 2010; 15: 166–173.
45. Blankers M, Koeter MW, Schippers GM. Missing data approaches in eHealth research: simulationstudy and a tutorial for nonmathematically inclined researchers. JMIR. 2010; 12: e54. doi: 10.2196/jmir.1448 PMID: 21169167
Heavy Drinking and Executive Functioning
PLOS ONE | DOI:10.1371/journal.pone.0139186 October 21, 2015 15 / 15