Embed Size (px)
Citation preview
Adsorption and photocatalyticperformance ofbentonite-titanium dioxidecomposites for methylene blueand rhodamine B decoloration
Livy Laysandra a, Meri Winda Masnona Kartika Sari a, Felycia Edi Soetaredjo a,*,
Kuncoro Foe b, Jindrayani Nyoo Putro c, Alfin Kurniawan c, Yi-Hsu Ju c,
Suryadi Ismadji a,*aDepartment of Chemical Engineering, Widya Mandala Surabaya Catholic University, Kalijudan 37, Surabaya
60114, IndonesiabFaculty of Pharmacy, Widya Mandala Surabaya Catholic University, Pakuwon City, Kalisari 1, Surabaya 60112,
IndonesiacDepartment of Chemical Engineering, National Taiwan University of Science and Technology, No. 43, Sec 4,
Keelung Rd, Da’an District, Taipei City 106, Taiwan
*Corresponding author.
E-mail addresses: [email protected] (F.E. Soetaredjo), [email protected] (S. Ismadji).
Abstract
Bentonite − TiO2 composites were prepared by impregnation of TiO2 and
bentonite, followed by microwave irradiation processes. The composites were
characterized using FTIR, SEM, XRD, and nitrogen sorption methods. Anatase
phase of TiO2 in all composites are observed through XRD diffraction peaks and
surface morphology of the composites. The adsorption and photocatalytic
capabilities of the composites were tested in liquid phase adsorption of methylene
blue and Rhodamine B. The adsorption and photocatalytic degradation experi-
ments were conducted in the presence or absence of UV light irradiation. Langmuir
and Freundlich models were employed to correlate the experimental adsorption
data, and it was found that Langmuir gave better performance in correlating the
experimental data. Modification of Langmuir equation to accommodate
Received:16 July 2017
Revised:10 October 2017
Accepted:7 December 2017
Cite as: Livy Laysandra,Meri Winda Masnona KartikaSari, Felycia Edi Soetaredjo,Kuncoro Foe,Jindrayani Nyoo Putro,Alfin Kurniawan, Yi-Hsu Ju,Suryadi Ismadji. Adsorptionand photocatalyticperformance of bentonite-titanium dioxide compositesfor methylene blue andrhodamine B decoloration.Heliyon 3 (2017) e00488.doi: 10.1016/j.heliyon.2017.e00488
http://dx.doi.org/10.1016/j.heliyon.2017.e00488
2405-8440/© 2017 The Authors. Published by Elsevier Ltd. This is an open access article under the CC BY-NC-ND license
(http://creativecommons.org/licenses/by-nc-nd/4.0/).
photocatalytic degradation process was conducted, and the model could represent
the experimental results very well.
Keywords: Environmental science, Materials science, Chemical engineering
1. Introduction
Dyes usually used by various kinds of industries to color their products. Several
industries that intensively use dyes to color their products are textiles, foods,
pharmaceuticals, cosmetics, paints, pigments, ceramics, etc. During the industrial
processing, some of the excess dyes will end up as waste and will be discharged as
industrial effluent [1]. Industrial effluents containing dyes are dangerous to the
aquatic environment as well as to human being. Therefore, a proper treatment
should be conducted before these kinds of effluents can be discharged to the water
environment. The principal purposes of the treatment are to remove inorganic or
organic contaminants, and other pathogens microorganisms from water, so human
for their daily activities can safely use the water.
Different kinds of dyes, mostly are synthetic ones, are commercially available in
the markets. Synthetic dyes are classified into several categories: basic or cationic
dyes, the direct dyes, the acid dyes, premetallized dyes, sulfur dyes, azoic dyes, vat
dyes, collective dyes, and dyes for fabricated fibers. Basic dyes are water-soluble
cationic dyes applied to substrate with anionic character where electrostatic
attractions are formed. Some examples of basic dyes are Methylene Blue,
Rhodamine B Crystal Violet, Congo Red, Methyl Orange, etc. [2]. Some of these
synthetic dyes have been known to have potential hazards to human health, and
their effect is mainly carcinogenic, mutagenic and teratogenic [3].
Methylene blue is known as methylthioninium chloride is a basic cationic dye with
the molecular formula C16H18N3SCl. At room temperature, methylene blue is
solid, odorless, dark green powder and gives blue solution if dissolved in water.
This dye is usually used in biological and chemical processes [4]. Rhodamine B is
a basic cationic dye with the molecular formula C28H31ClN2O3 has a moderate
wash and light fastness properties of wool. It is also useful as an analytical reagent
for the detection and determination of metals [5, 6, 7].
Methylene blue can cause some health problems such as eye burns, which may be
responsible for permanent injury to the eyes of human and animals. On an
inhalation, it can give short periods of rapid or difficult breathing, while ingestion
through the mouth gives a burning sensation and may cause nausea, vomiting,
profuse sweating, mental confusion, and methemoglobinemia [8]. The long-term
exposure of Rhodamine B to human may cause in transient mucous membrane and
skin irritation. Rhodamine B potentially induces mutagenic activity and pose an
Article No~e00488
2 http://dx.doi.org/10.1016/j.heliyon.2017.e00488
2405-8440/© 2017 The Authors. Published by Elsevier Ltd. This is an open access article under the CC BY-NC-ND license
(http://creativecommons.org/licenses/by-nc-nd/4.0/).
adverse effect on aquatic life via obstructing light penetration and oxygen transfer
[9].
Many dyes and other organic contaminants are tough to degrade in nature and require
more advanced techniques for their removal [1]. The decolorization of dye has
received much attention. Thus various chemical, physical and biological treatment
methods have been developed for the removal of dyes from aqueous solutions. These
treatments include precipitation, coagulation-flocculation, reverse osmosis, oxidation
with ozone, chlorine or hydrogen peroxide, use of anion exchange membranes and
bacterial cells [10]. Adsorption is one of the most promising and widely used
techniques for the removal synthetic dyes from wastewater [3]. Adsorption has
proven to be a promising and cost-effective method. The price of adsorbent is an
important parameter that significantly influences the total cost of an adsorption
process system. Therefore the search of alternative adsorbents with high adsorption
capacities was still the focus of current studies [11].
Many kinds of non-conventional adsorbent materials have been tested for their
adsorption ability to remove dyes. As alternative adsorbents, non-conventional
materials must possess similar adsorption capability to those commercial
adsorbents, eco-friendly production, and also abundantly available [12]. The most
promising and the materials as the candidate for alternative adsorbents are clay
minerals. Bentonite is a clay material that can be found in many places around the
world, including in Indonesian. Bentonite is a smectite mineral composed of
aluminum silicate framework, and it has a layer structure with negative charge
evenly across its surface and possesses good cation exchange.
In the last few years, the study of decolorization of dyes using photocatalytic
process has been investigated [13]. Among different kinds of photocatalysts, TiO2
is the most widely used for wastewater treatment because of its high oxidizing
properties, super hydrophilicity and chemical stability [14]. However, this process
requires UV-light radiation to promote the electron from the valence band to the
conduction band and leave the hole (h +) in the valence band. If the hole meets the
water molecule in the presence of oxygen, it will produce hydroxyl radical (OH●),
and this hydroxyl radical will break down the organic molecule into the simple
compound [13]. The main drawback of using titanium as a photocatalyst is its
susceptibility to aggregation, reducing the surface area and efficiency [1]. To avoid
this problem, a suitable material as the support to immobilize titanium particles
should be developed, and clay materials are good candidates for this purpose [1].
In this study, bentonite was employed as the support to immobilize TiO2 particles.
The bentonite − TiO2 composite was subsequently used to adsorb and degrade
Methylene Blue and Rhodamine B. The adsorption, and photodegradation
performances of the adsorbents were observed at various temperatures. Since the
removal of Methylene Blue and Rhodamine B involves both of adsorption and
Article No~e00488
3 http://dx.doi.org/10.1016/j.heliyon.2017.e00488
2405-8440/© 2017 The Authors. Published by Elsevier Ltd. This is an open access article under the CC BY-NC-ND license
(http://creativecommons.org/licenses/by-nc-nd/4.0/).
photodegradation, a modification of Langmuir equation was also conducted to
represent the photo-degradation term.
2. Materials and methods
2.1. Materials
Ca-Bentonite used in this study was obtained from Pacitan, East Java, Indonesia.
Titanium dioxide (anatase phase) was purchased from Degussa. Methylene Blue
(MB) and Rhodamine B (RhB) were purchased from Merck, Germany.
2.2. Preparations of bentonite-titanium dioxide composite
Before use as the adsorbent, the bentonite was purified using H2O2 solution. The
purification of bentonite was conducted to remove organic impurities. The
purification was carried out in a sonicator for 6 hours at room temperature. After
the purification process had completed, bentonite was separated from the solution
and repeatedly washed with reverse osmosis water and dried in a forced circulation
oven (Memmert) at 105 °C for 24 h. The purified bentonite was pulverized in a
hammer mill and sieved using vibration screener (Retsch AS-200) to obtain a
particle size of 100/120 mesh.
Bentonite titanium dioxide nanocomposites (BTC) were synthesized at a different
weight ratio of TiO2 (5, 10, 20%) using impregnation method [15]. The
impregnation procedure is as follows: a known amount of titanium dioxide was
dispersed in water; subsequently, a known amount of bentonite was added to the
mixture and heated at 100 °C for 1 hour under continuous stirring. The BTC
mixture was then irradiated using a microwave oven at 700W for 10 minutes. After
the irradiation process had completed, the BTC was separated from the liquid and
dried at 105 °C for 24 h. The radiation process using microwave could improve the
adsorption capacity of adsorbent [16].
2.3. Characterizations of materials
The characterizations of bentonite and nanocomposites were conducted using
several methods such surface charge, FTIR (Fourier Transform Infra-Red
Spectrophotometry), SEM (Scanning Electron Microscopy), and XRD (X-Ray
Diffraction). In this study, the surface charge of bentonite and nanocomposites was
measured by a zeta meter (Zeta Potential Analyzer, Brookhaven 90Plus). The
pHpzc (the pH where the adsorbent has no charge) or isoelectric points of bentonite
and nanocomposites were 3.9 (bentonite (B)), 5.2 (B + 5% TiO2), 6.1 (B + 10%
TiO2), and 7.6 (B + 20% TiO2).
The FTIR analysis of bentonite and nanocomposites were conducted on a
Shimadzu FTIR 8400S spectrometer using KBr method. The FTIR spectra of the
Article No~e00488
4 http://dx.doi.org/10.1016/j.heliyon.2017.e00488
2405-8440/© 2017 The Authors. Published by Elsevier Ltd. This is an open access article under the CC BY-NC-ND license
(http://creativecommons.org/licenses/by-nc-nd/4.0/).
samples were acquired at a wavenumber of 4000 to 500 cm−1. The FTIR data were
collected in transmission mode. The adjustment of the baseline, normalization, and
smoothing of the FTIR spectra were conducted using IRsolution software package
(version 1.21). This software is available in the FTIR instrument.
The surface morphologies of bentonite and titanium nanocomposites were
determined by scanning electron microscopy method. The surface analysis was
carried out on a JEOL JSM-6500F field emission SEM at 20 kV. Before SEM
analysis, the samples were coated with a thin layer of platinum (3 nm). The coating
process was conducted for 90 s in argon atmosphere using a fine auto coater (JFC-
1600, JEOL, Ltd., Japan).
X-ray diffraction patterns of the samples were obtained at 40 kV and 30 mA using
XRD, Philips X'pert X-ray Diffractometer. Monochromatic high-intensity Cu Kα1(λ = 0.15405 nm) was employed as the source of radiation. The pore structures of
the samples were characterized by nitrogen sorption analysis. The nitrogen
sorption measurements were conducted at the boiling point of nitrogen gas (–176°C) using Micromeritics ASAP 2010 sorption analyzer. The adsorption and
desorption of the nitrogen were performed at relative pressure (p/p°) range of 0.005
to 0.995. The degassing of the samples were conducted at 200 °C under high
vacuum condition.
2.4. Adsorption and photocatalytic degradation experiment
Adsorption and photocatalytic processes were carried out isothermally in a water
bath shaker that has been modified by adding a UV lamp as the light source. The
adsorption and photodegradation processes were conducted with an initial
concentration of 200 ppm for both MB and RhB. For the isotherm process, the
various mass of Ca-bentonite or BTC (0.1 − 0.9 g) were added to a series of iodine
flasks, each flask containing 100 mL of MB or RhB solution. The adsorption and
photodegradation experiments were performed at three different temperatures (30
°C, 50 °C, and 70 °C) and pH 8. During the experiments, the iodine flasks
containing the mixture were shaken in a thermal controlled shaking water bath
(Memmert WB-14) with constant speed at 100 rpm for 2 h at desired temperature
with/without UV irradiation at 360 nm (To measure the adsorption performance of
the composites, the adsorption experiments was conducted in the dark without any
light disturbing.). After the adsorption and photodegradation process had
completed, samples were centrifuged (Heraeus Labofuge 200) at 3500 rpm for 2
min to separate the solution from the adsorbent [11]. The initial and equilibrium
concentrations of MB or RhB were determined by UV-Visible spectrophotometer
(UV mini 1240 Shimadzu) at the maximum wavelength (664.1 nm for MB and
554.0 nm for RhB).
Article No~e00488
5 http://dx.doi.org/10.1016/j.heliyon.2017.e00488
2405-8440/© 2017 The Authors. Published by Elsevier Ltd. This is an open access article under the CC BY-NC-ND license
(http://creativecommons.org/licenses/by-nc-nd/4.0/).
The amount of MB or RhB adsorbed by the adsorbent at equilibrium condition was
determined by equation (1) as follow:
qe ¼C0 � Ceð Þ
m×V (1)
Where qe is the amount of MB or RhB adsorbed at equilibrium (mmol/g), C0 and
Ce (mmol/L) represent the concentration of MB or RhB in the liquid phase at initial
and equilibrium condition, respectively. The volume of MB or RhB solution is
represented by symbol V (L) and m is the mass of adsorbent (g).
3. Results and discussion
3.1. FTIR analysis
In this study, FTIR spectroscopy was used to analyze the functional groups of the
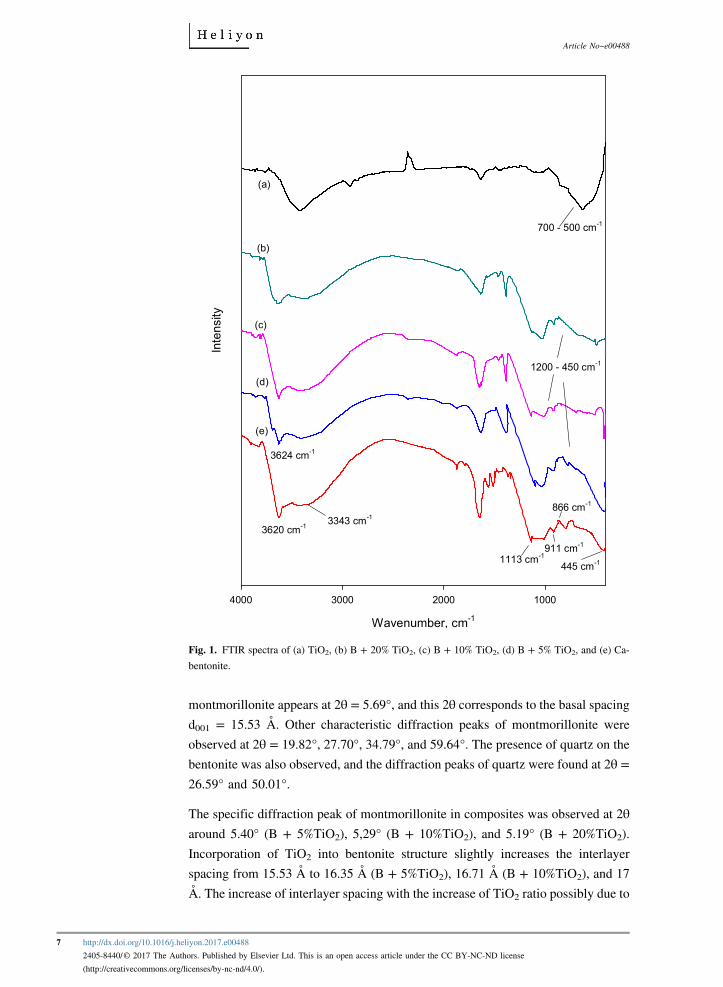
adsorbents. Fig. 1. Shows the FTIR spectra of TiO2, bentonite, B + 5%TiO2, B +
10% TiO2, and B + 20% TiO2. Broadband around 500 to 700 cm−1 possibly due to
the vibration of Ti-O bonds in the titanium dioxide lattice [17]. The vibration of
hydroxyl groups is observed at broad peaks around 3100 to 3600 cm−1 (Fig. 1a).
Typical infrared absorption bands of montmorillonite are observed on the bentonite
(Fig. 1e). Those bands are Al(Mg) − O − H stretching (3620 cm−1), intermolecular
hydrogen-bonded H − O − H stretching (3343 cm−1), Si–O–Si stretching vibrationat 1113 cm−1, Al-OH (911 cm−1), (Al, Mg)–O (866 cm−1), and Si–O bending
vibration (445 cm−1) [18]. Similar infrared absorption bands of montmorillonite
and TiO2 are observed for all of the bentonite − TiO2 composites as seen in Fig. 1.
Skeletal vibrations of clay particles and TiO2 for all composites are in the
wavenumbers between 1200–450 cm−1 [17].
3.2. Surface morphology analysis
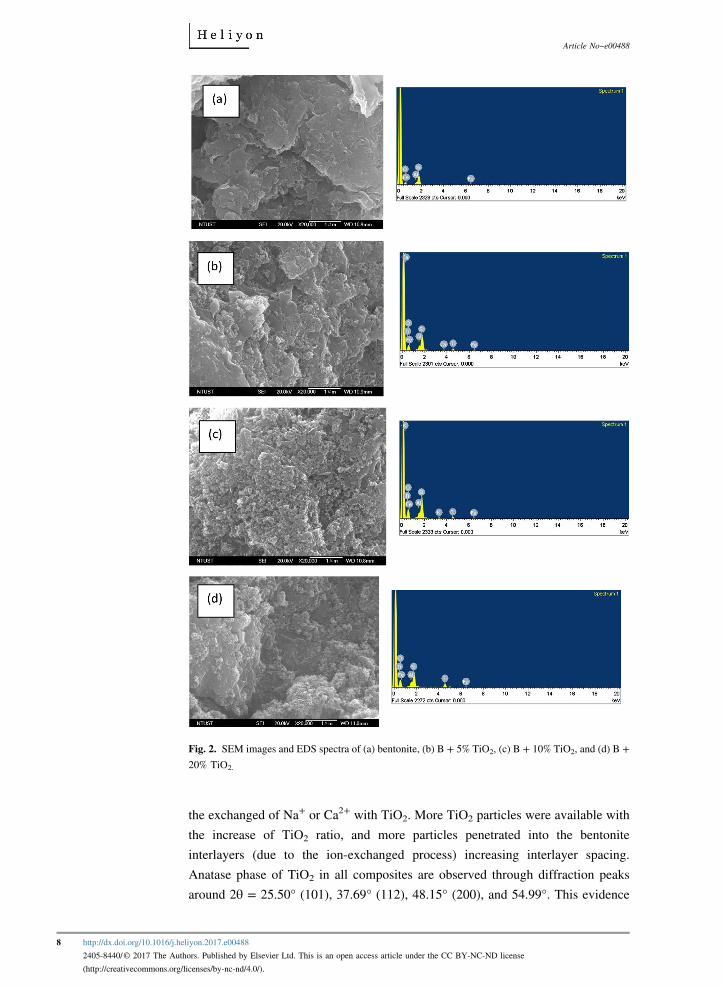
The surface morphology of bentonite and composites (B + 5%TiO2, B + 10%TiO2,
and B + 20%TiO2) was examined by SEM, and the results are depicted in Fig. 2.
From this Figure, it can be seen that bentonite possesses different surface
morphology with bentonite − TiO2 composites. The surface morphology of
bentonite appears as a flake-like structure with a smooth surface in some part of the
particles, while the bentonite − TiO2 composite, some TiO2 particles have been
incorporated into the surface of bentonite (smaller TiO2 grains on the outer face of
bentonite). The EDS spectra reveal that the composite contains a significant
amount of titanium as indicated in Fig. 2.
3.3. X-ray diffraction
Fig. 3 shows the XRD patterns of bentonite and bentonite − TiO2 nanocomposites.
Based on the XRD pattern of bentonite, the specific diffraction peak for
Article No~e00488
6 http://dx.doi.org/10.1016/j.heliyon.2017.e00488
2405-8440/© 2017 The Authors. Published by Elsevier Ltd. This is an open access article under the CC BY-NC-ND license
(http://creativecommons.org/licenses/by-nc-nd/4.0/).
montmorillonite appears at 2θ = 5.69°, and this 2θ corresponds to the basal spacingd001 = 15.53 Å. Other characteristic diffraction peaks of montmorillonite were
observed at 2θ = 19.82°, 27.70°, 34.79°, and 59.64°. The presence of quartz on the
bentonite was also observed, and the diffraction peaks of quartz were found at 2θ =26.59° and 50.01°.
The specific diffraction peak of montmorillonite in composites was observed at 2θaround 5.40° (B + 5%TiO2), 5,29° (B + 10%TiO2), and 5.19° (B + 20%TiO2).
Incorporation of TiO2 into bentonite structure slightly increases the interlayer
spacing from 15.53 Å to 16.35 Å (B + 5%TiO2), 16.71 Å (B + 10%TiO2), and 17
Å. The increase of interlayer spacing with the increase of TiO2 ratio possibly due to
[(Fig._1)TD$FIG]
1000200030004000
3620 cm-1 3343 cm-1
3624 cm-1
1113 cm-1911 cm-1
866 cm-1
445 cm-1
700 - 500 cm-1
1200 - 450 cm-1
(a)
(b)
(c)
(d)
(e)
Fig. 1. FTIR spectra of (a) TiO2, (b) B + 20% TiO2, (c) B + 10% TiO2, (d) B + 5% TiO2, and (e) Ca-
bentonite.
Article No~e00488
7 http://dx.doi.org/10.1016/j.heliyon.2017.e00488
2405-8440/© 2017 The Authors. Published by Elsevier Ltd. This is an open access article under the CC BY-NC-ND license
(http://creativecommons.org/licenses/by-nc-nd/4.0/).
the exchanged of Na+ or Ca2+ with TiO2. More TiO2 particles were available with
the increase of TiO2 ratio, and more particles penetrated into the bentonite
interlayers (due to the ion-exchanged process) increasing interlayer spacing.
Anatase phase of TiO2 in all composites are observed through diffraction peaks
around 2θ = 25.50° (101), 37.69° (112), 48.15° (200), and 54.99°. This evidence
[(Fig._2)TD$FIG]
Fig. 2. SEM images and EDS spectra of (a) bentonite, (b) B + 5% TiO2, (c) B + 10% TiO2, and (d) B +
20% TiO2.
Article No~e00488
8 http://dx.doi.org/10.1016/j.heliyon.2017.e00488
2405-8440/© 2017 The Authors. Published by Elsevier Ltd. This is an open access article under the CC BY-NC-ND license
(http://creativecommons.org/licenses/by-nc-nd/4.0/).
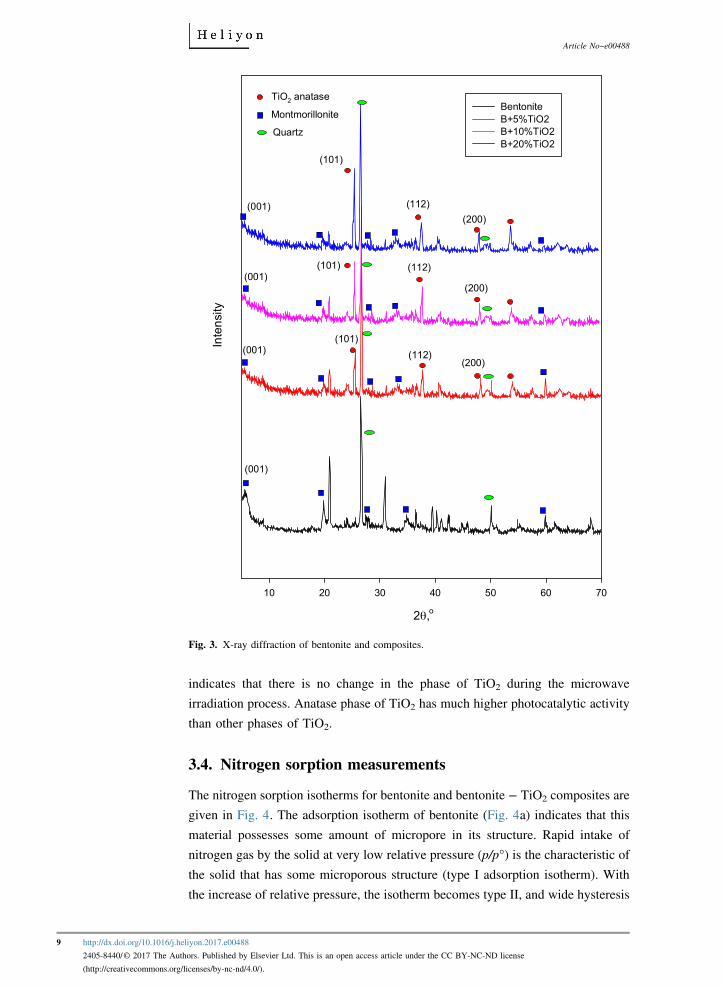
indicates that there is no change in the phase of TiO2 during the microwave
irradiation process. Anatase phase of TiO2 has much higher photocatalytic activity
than other phases of TiO2.
3.4. Nitrogen sorption measurements
The nitrogen sorption isotherms for bentonite and bentonite − TiO2 composites are
given in Fig. 4. The adsorption isotherm of bentonite (Fig. 4a) indicates that this
material possesses some amount of micropore in its structure. Rapid intake of
nitrogen gas by the solid at very low relative pressure (p/p°) is the characteristic of
the solid that has some microporous structure (type I adsorption isotherm). With
the increase of relative pressure, the isotherm becomes type II, and wide hysteresis
[(Fig._3)TD$FIG]
2θ, o10 20 30 40 50 60 70
Inte
nsity
BentoniteB+5%TiO2 B+10%TiO2B+20%TiO2
(001)
(101)
TiO2 anatase
Montmorillonite
(112)(200)
Quartz
(001)
(101)
(101)
(112)
(112)
(200)
(200)
(001)
(001)
Fig. 3. X-ray diffraction of bentonite and composites.
Article No~e00488
9 http://dx.doi.org/10.1016/j.heliyon.2017.e00488
2405-8440/© 2017 The Authors. Published by Elsevier Ltd. This is an open access article under the CC BY-NC-ND license
(http://creativecommons.org/licenses/by-nc-nd/4.0/).
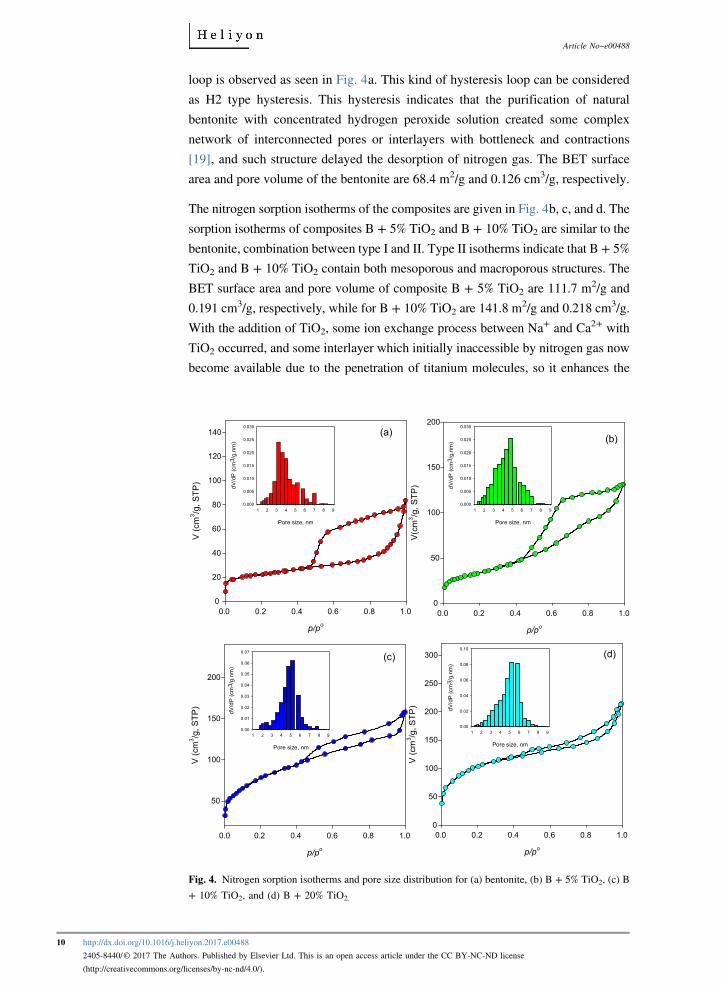
loop is observed as seen in Fig. 4a. This kind of hysteresis loop can be considered
as H2 type hysteresis. This hysteresis indicates that the purification of natural
bentonite with concentrated hydrogen peroxide solution created some complex
network of interconnected pores or interlayers with bottleneck and contractions
[19], and such structure delayed the desorption of nitrogen gas. The BET surface
area and pore volume of the bentonite are 68.4 m2/g and 0.126 cm3/g, respectively.
The nitrogen sorption isotherms of the composites are given in Fig. 4b, c, and d. The
sorption isotherms of composites B + 5% TiO2 and B + 10% TiO2 are similar to the
bentonite, combination between type I and II. Type II isotherms indicate that B + 5%
TiO2 and B + 10% TiO2 contain both mesoporous and macroporous structures. The
BET surface area and pore volume of composite B + 5% TiO2 are 111.7 m2/g and
0.191 cm3/g, respectively, while for B + 10% TiO2 are 141.8 m2/g and 0.218 cm3/g.
With the addition of TiO2, some ion exchange process between Na+ and Ca2+ with
TiO2 occurred, and some interlayer which initially inaccessible by nitrogen gas now
become available due to the penetration of titanium molecules, so it enhances the
[(Fig._4)TD$FIG]
(b)
p/po0.0 0.2 0.4 0.6 0.8 1.0
V(c
m3 /g
, STP
)
0
50
100
150
200
Pore size, nm
1 2 3 4 5 6 7 8 9
dV/d
P (c
m3 /
g.nm
)
0.000
0.005
0.010
0.015
0.020
0.025
0.030
(a)
p/po0.0 0.2 0.4 0.6 0.8 1.0
V (c
m3 /g
, STP
)
0
20
40
60
80
100
120
140
Pore size, nm
1 2 3 4 5 6 7 8 9
dV/d
P (c
m3 /
g.nm
)
0.000
0.005
0.010
0.015
0.020
0.025
0.030
(c)
p/po0.0 0.2 0.4 0.6 0.8 1.0
V (c
m3 /g
, STP
)
50
100
150
200
Pore size, nm
1 2 3 4 5 6 7 8 9
dV/d
P (c
m3 /
g.nm
)
0.00
0.01
0.02
0.03
0.04
0.05
0.06
0.07 (d)
p/po0.0 0.2 0.4 0.6 0.8 1.0
V (c
m3 /g
, STP
)
0
50
100
150
200
250
300
Pore size, nm
1 2 3 4 5 6 7 8 9
dV/d
P (c
m3 /
g.nm
)
0.00
0.02
0.04
0.06
0.08
0.10
Fig. 4. Nitrogen sorption isotherms and pore size distribution for (a) bentonite, (b) B + 5% TiO2, (c) B
+ 10% TiO2, and (d) B + 20% TiO2.
Article No~e00488
10 http://dx.doi.org/10.1016/j.heliyon.2017.e00488
2405-8440/© 2017 The Authors. Published by Elsevier Ltd. This is an open access article under the CC BY-NC-ND license
(http://creativecommons.org/licenses/by-nc-nd/4.0/).
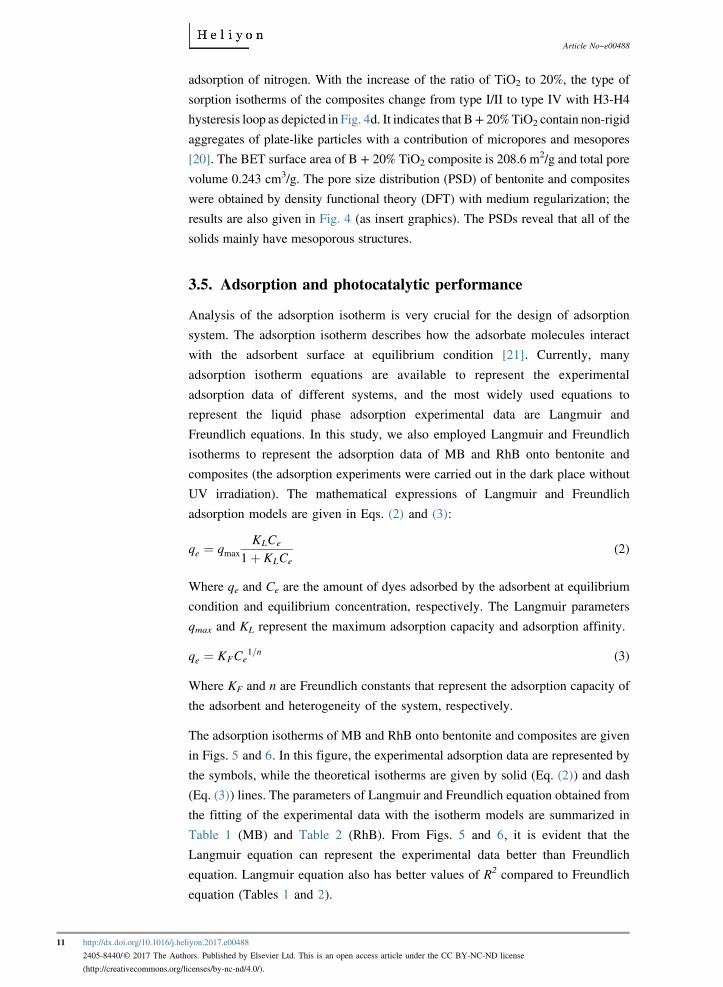
adsorption of nitrogen. With the increase of the ratio of TiO2 to 20%, the type of
sorption isotherms of the composites change from type I/II to type IV with H3-H4
hysteresis loop as depicted in Fig. 4d. It indicates that B+ 20%TiO2 contain non-rigid
aggregates of plate-like particles with a contribution of micropores and mesopores
[20]. The BET surface area of B + 20% TiO2 composite is 208.6 m2/g and total pore
volume 0.243 cm3/g. The pore size distribution (PSD) of bentonite and composites
were obtained by density functional theory (DFT) with medium regularization; the
results are also given in Fig. 4 (as insert graphics). The PSDs reveal that all of the
solids mainly have mesoporous structures.
3.5. Adsorption and photocatalytic performance
Analysis of the adsorption isotherm is very crucial for the design of adsorption
system. The adsorption isotherm describes how the adsorbate molecules interact
with the adsorbent surface at equilibrium condition [21]. Currently, many
adsorption isotherm equations are available to represent the experimental
adsorption data of different systems, and the most widely used equations to
represent the liquid phase adsorption experimental data are Langmuir and
Freundlich equations. In this study, we also employed Langmuir and Freundlich
isotherms to represent the adsorption data of MB and RhB onto bentonite and
composites (the adsorption experiments were carried out in the dark place without
UV irradiation). The mathematical expressions of Langmuir and Freundlich
adsorption models are given in Eqs. (2) and (3):
qe ¼ qmaxKLCe
1þ KLCe(2)
Where qe and Ce are the amount of dyes adsorbed by the adsorbent at equilibrium
condition and equilibrium concentration, respectively. The Langmuir parameters
qmax and KL represent the maximum adsorption capacity and adsorption affinity.
qe ¼ KFCe1=n (3)
Where KF and n are Freundlich constants that represent the adsorption capacity of
the adsorbent and heterogeneity of the system, respectively.
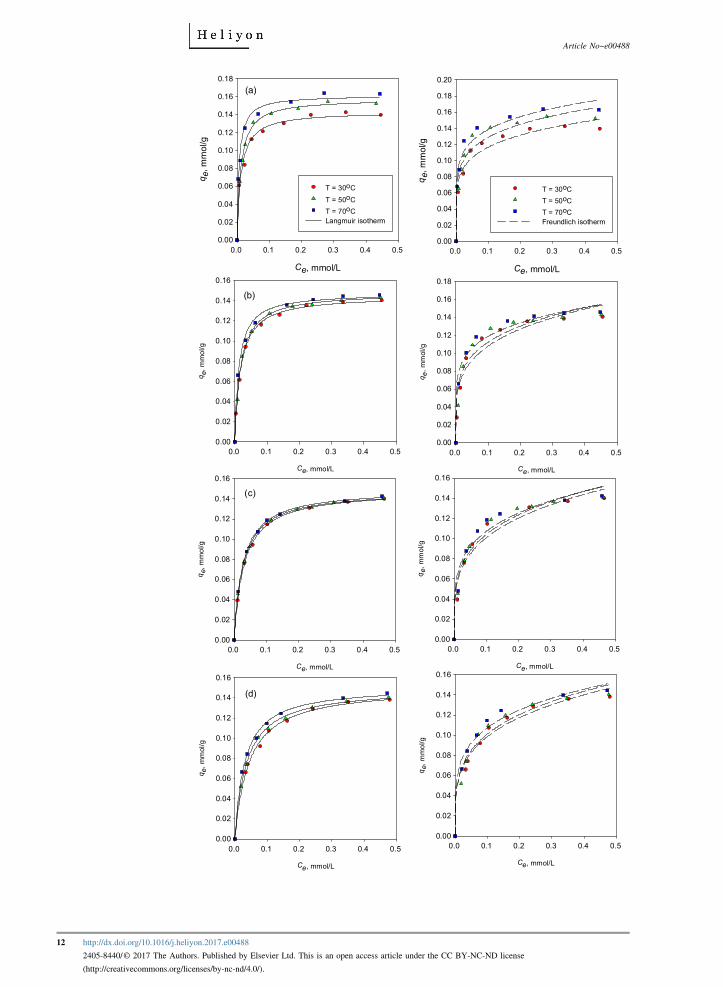
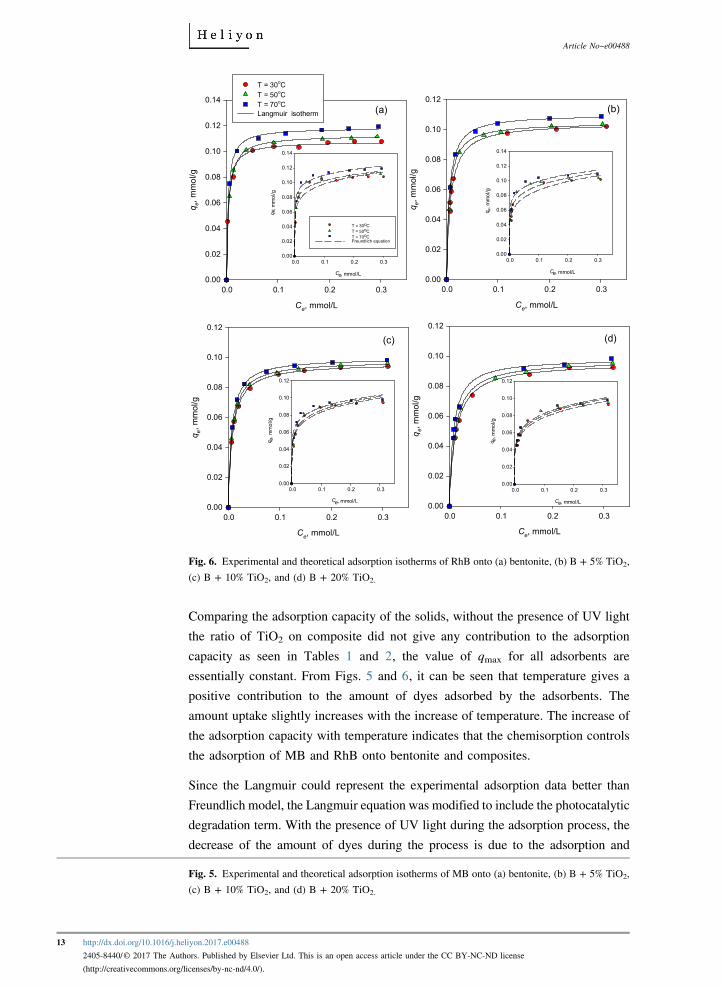
The adsorption isotherms of MB and RhB onto bentonite and composites are given
in Figs. 5 and 6. In this figure, the experimental adsorption data are represented by
the symbols, while the theoretical isotherms are given by solid (Eq. (2)) and dash
(Eq. (3)) lines. The parameters of Langmuir and Freundlich equation obtained from
the fitting of the experimental data with the isotherm models are summarized in
Table 1 (MB) and Table 2 (RhB). From Figs. 5 and 6, it is evident that the
Langmuir equation can represent the experimental data better than Freundlich
equation. Langmuir equation also has better values of R2 compared to Freundlich
equation (Tables 1 and 2).
Article No~e00488
11 http://dx.doi.org/10.1016/j.heliyon.2017.e00488
2405-8440/© 2017 The Authors. Published by Elsevier Ltd. This is an open access article under the CC BY-NC-ND license
(http://creativecommons.org/licenses/by-nc-nd/4.0/).
[(Fig._5)TD$FIG]
(a)
Ce, mmol/L
0.0 0.1 0.2 0.3 0.4 0.5
q e, m
mol
/g
0.00
0.02
0.04
0.06
0.08
0.10
0.12
0.14
0.16
0.18
T = 30oCT = 50oCT = 70oCLangmuir isotherm
Ce, mmol/L
0.0 0.1 0.2 0.3 0.4 0.5
q e, m
mol
/g
0.00
0.02
0.04
0.06
0.08
0.10
0.12
0.14
0.16
0.18
0.20
T = 30oCT = 50oCT = 70oCFreundlich isotherm
(b)
Ce, mmol/L
0.0 0.1 0.2 0.3 0.4 0.5
q e, m
mol
/g
0.00
0.02
0.04
0.06
0.08
0.10
0.12
0.14
0.16
Ce, mmol/L
0.0 0.1 0.2 0.3 0.4 0.5
q e, m
mol
/g
0.00
0.02
0.04
0.06
0.08
0.10
0.12
0.14
0.16
0.18
(c)
Ce, mmol/L
0.0 0.1 0.2 0.3 0.4 0.5
q e, m
mol
/g
0.00
0.02
0.04
0.06
0.08
0.10
0.12
0.14
0.16
Ce, mmol/L
0.0 0.1 0.2 0.3 0.4 0.5
q e, m
mol
/g
0.00
0.02
0.04
0.06
0.08
0.10
0.12
0.14
0.16
(d)
Ce, mmol/L
0.0 0.1 0.2 0.3 0.4 0.5
q e, m
mol
/g
0.00
0.02
0.04
0.06
0.08
0.10
0.12
0.14
0.16
Ce, mmol/L
0.0 0.1 0.2 0.3 0.4 0.5
q e, m
mol
/g
0.00
0.02
0.04
0.06
0.08
0.10
0.12
0.14
0.16
Article No~e00488
12 http://dx.doi.org/10.1016/j.heliyon.2017.e00488
2405-8440/© 2017 The Authors. Published by Elsevier Ltd. This is an open access article under the CC BY-NC-ND license
(http://creativecommons.org/licenses/by-nc-nd/4.0/).
Comparing the adsorption capacity of the solids, without the presence of UV light
the ratio of TiO2 on composite did not give any contribution to the adsorption
capacity as seen in Tables 1 and 2, the value of qmax for all adsorbents are
essentially constant. From Figs. 5 and 6, it can be seen that temperature gives a
positive contribution to the amount of dyes adsorbed by the adsorbents. The
amount uptake slightly increases with the increase of temperature. The increase of
the adsorption capacity with temperature indicates that the chemisorption controls
the adsorption of MB and RhB onto bentonite and composites.
Since the Langmuir could represent the experimental adsorption data better than
Freundlich model, the Langmuir equation was modified to include the photocatalytic
degradation term. With the presence of UV light during the adsorption process, the
decrease of the amount of dyes during the process is due to the adsorption and
Fig. 5. Experimental and theoretical adsorption isotherms of MB onto (a) bentonite, (b) B + 5% TiO2,
(c) B + 10% TiO2, and (d) B + 20% TiO2.
[(Fig._6)TD$FIG]
(a)
Ce, mmol/L
0.0 0.1 0.2 0.3
q e, m
mol
/g
0.00
0.02
0.04
0.06
0.08
0.10
0.12
0.14
T = 30oCT = 50oCT = 70oCLangmuir isotherm
Ce, mmol/L
0.0 0.1 0.2 0.3q e
, mm
ol/g
0.00
0.02
0.04
0.06
0.08
0.10
0.12
0.14
T = 30oCT = 50oCT = 70oCFreundlich equation
(b)
Ce, mmol/L
0.0 0.1 0.2 0.3
q e, m
mol
/g
0.00
0.02
0.04
0.06
0.08
0.10
0.12
Ce, mmol/L
0.0 0.1 0.2 0.3
q e, m
mol
/g
0.00
0.02
0.04
0.06
0.08
0.10
0.12
0.14
(c)
Ce, mmol/L
0.0 0.1 0.2 0.3
q e, m
mol
/g
0.00
0.02
0.04
0.06
0.08
0.10
0.12
Ce, mmol/L
0.0 0.1 0.2 0.3
q e, m
mol
/g
0.00
0.02
0.04
0.06
0.08
0.10
0.12
(d)
Ce, mmol/L
0.0 0.1 0.2 0.3
q e, m
mol
/g
0.00
0.02
0.04
0.06
0.08
0.10
0.12
Ce, mmol/L
0.0 0.1 0.2 0.3q e
, mm
ol/g
0.00
0.02
0.04
0.06
0.08
0.10
0.12
Fig. 6. Experimental and theoretical adsorption isotherms of RhB onto (a) bentonite, (b) B + 5% TiO2,
(c) B + 10% TiO2, and (d) B + 20% TiO2.
Article No~e00488
13 http://dx.doi.org/10.1016/j.heliyon.2017.e00488
2405-8440/© 2017 The Authors. Published by Elsevier Ltd. This is an open access article under the CC BY-NC-ND license
(http://creativecommons.org/licenses/by-nc-nd/4.0/).
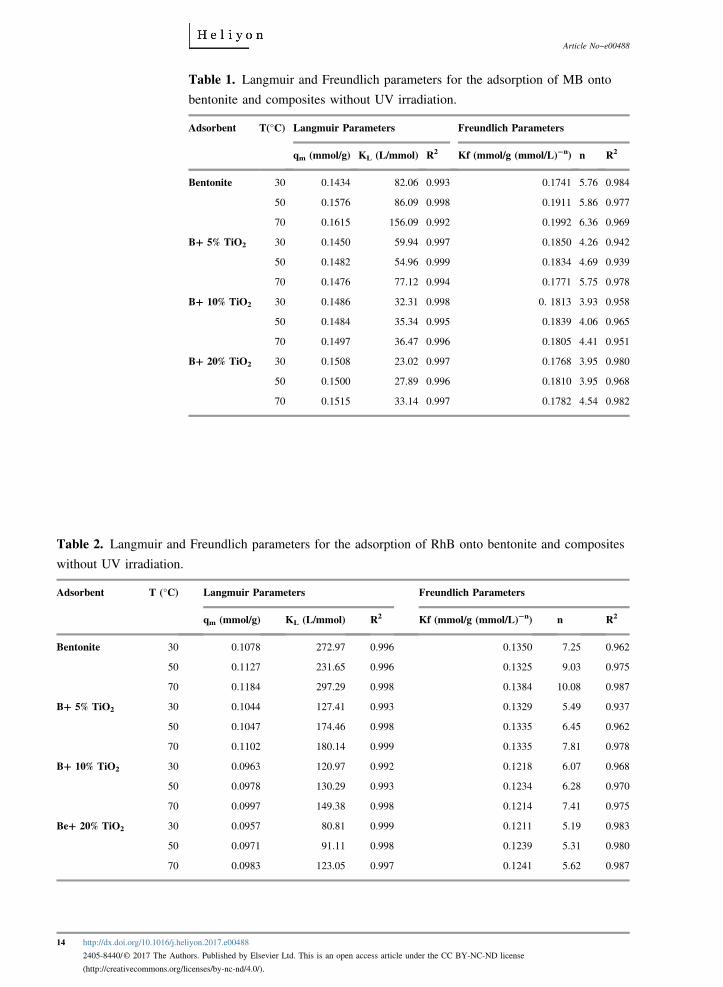
Table 1. Langmuir and Freundlich parameters for the adsorption of MB onto
bentonite and composites without UV irradiation.
Adsorbent T(°C) Langmuir Parameters Freundlich Parameters
qm (mmol/g) KL (L/mmol) R2 Kf (mmol/g (mmol/L)−n) n R2
Bentonite 30 0.1434 82.06 0.993 0.1741 5.76 0.984
50 0.1576 86.09 0.998 0.1911 5.86 0.977
70 0.1615 156.09 0.992 0.1992 6.36 0.969
B+ 5% TiO2 30 0.1450 59.94 0.997 0.1850 4.26 0.942
50 0.1482 54.96 0.999 0.1834 4.69 0.939
70 0.1476 77.12 0.994 0.1771 5.75 0.978
B+ 10% TiO2 30 0.1486 32.31 0.998 0. 1813 3.93 0.958
50 0.1484 35.34 0.995 0.1839 4.06 0.965
70 0.1497 36.47 0.996 0.1805 4.41 0.951
B+ 20% TiO2 30 0.1508 23.02 0.997 0.1768 3.95 0.980
50 0.1500 27.89 0.996 0.1810 3.95 0.968
70 0.1515 33.14 0.997 0.1782 4.54 0.982
Table 2. Langmuir and Freundlich parameters for the adsorption of RhB onto bentonite and composites
without UV irradiation.
Adsorbent T (°C) Langmuir Parameters Freundlich Parameters
qm (mmol/g) KL (L/mmol) R2 Kf (mmol/g (mmol/L)−n) n R2
Bentonite 30 0.1078 272.97 0.996 0.1350 7.25 0.962
50 0.1127 231.65 0.996 0.1325 9.03 0.975
70 0.1184 297.29 0.998 0.1384 10.08 0.987
B+ 5% TiO2 30 0.1044 127.41 0.993 0.1329 5.49 0.937
50 0.1047 174.46 0.998 0.1335 6.45 0.962
70 0.1102 180.14 0.999 0.1335 7.81 0.978
B+ 10% TiO2 30 0.0963 120.97 0.992 0.1218 6.07 0.968
50 0.0978 130.29 0.993 0.1234 6.28 0.970
70 0.0997 149.38 0.998 0.1214 7.41 0.975
Be+ 20% TiO2 30 0.0957 80.81 0.999 0.1211 5.19 0.983
50 0.0971 91.11 0.998 0.1239 5.31 0.980
70 0.0983 123.05 0.997 0.1241 5.62 0.987
Article No~e00488
14 http://dx.doi.org/10.1016/j.heliyon.2017.e00488
2405-8440/© 2017 The Authors. Published by Elsevier Ltd. This is an open access article under the CC BY-NC-ND license
(http://creativecommons.org/licenses/by-nc-nd/4.0/).
photocatalytic degradation processes. Before the photocatalytic degradation process
occurs, the first process is the adsorption of dye molecules on the surface of the
composite. When the dye molecules adsorbed on the surface near the TiO2 particles,
with the presence of UV light, the photocatalytic degradation process occurs. The
degradation process is initiated by the excitation of an electron from the valence band
of the TiO2 catalyst to the conduction band, thus generating a hole (h+) in the valence
band and make ●OH radical when contacted with water. Subsequently, the ●OH
radical attacks dye molecule and degradation process occur. After the degradation of
dye molecule has finished, some of the degradation product will be released to water,
and some possibly remain adsorbed on the surface of the adsorbent. This process
continues until the product of degradation covers the TiO2 particle and become
deactivated. However, if dye molecules are adsorbed on the surface far from the
location of TiO2 particle, the photocatalytic degradation process will not occur. The
photocatalytic degradation process enhances the uptake of dye molecules by the
adsorbent. Therefore the adsorption capacity of the adsorbent (qmax*) will increase.
Since the adsorption and photocatalytic degradation processes occur simultaneously,
the adsorption affinity is a combination between chemical reaction process and
chemical or physical adsorption. Therefore, energy of adsorption is a sum of isosteric
heat of adsorption and heat of chemical reaction, now in the temperature dependent
form the adsorption affinity can be written as
KL ¼ KoLexp
�QRT
þ�ΔHRT
� �(4)
In Eq. (4), KL° is a Langmuir constant at reference temperature that combines both
of adsorption and photocatalytic degradation process, R and T are ideal gas
constant and temperature of adsorption, respectively. Isosteric heat of adsorption is
represented by symbol Q and heat of chemical reaction is given by symbol ΔH.
It is evident (Fig. 2) that not all the surface of bentonite in the composites are
covered by TiO2 particles in where the photocatalytic degradation process occurs,
and some part of the surface still available for only the adsorption process. If the
available space for adsorption and photocatalytic degradation process is called as
the active site; the fraction of the active site for adsorption alone is θad and for
simultaneous adsorption and photocatalytic degradation is θdeg (Eq. (5)),
θad þ θdeg ¼ 1 (5)
Each of the available processes (adsorption or photocatalytic degradation) contributes
a certain amount of energy on the adsorption affinity, the contribution is linear with
the fraction of each active site, and Eq. (5) can be rewritten as Eq. (6):
KL ¼ KoLexp
�QRT
θad þ�ΔHRT
θdeg
� �(6)
Article No~e00488
15 http://dx.doi.org/10.1016/j.heliyon.2017.e00488
2405-8440/© 2017 The Authors. Published by Elsevier Ltd. This is an open access article under the CC BY-NC-ND license
(http://creativecommons.org/licenses/by-nc-nd/4.0/).
Substitution of Eq. (5) into (6) produces Eq. (7)
KL ¼ KoLexp
�QRT
θad þ�ΔHRT
1� θadð Þ� �
(7)
The modified Langmuir equation for adsorption and photocatalytic degradation can
be written as
q�e ¼ q�maxKoLexp
�QRT
θad þ�ΔHRT
1� θadð Þ� �
Ce= 1þ KoLexp
�QRT
θad þ�ΔHRT
ð1� θad
� �Ce
� �
(8)
Where qe* in Eq. (8) is the pseudo-total amount of dye adsorbed and degraded at
equilibrium condition.
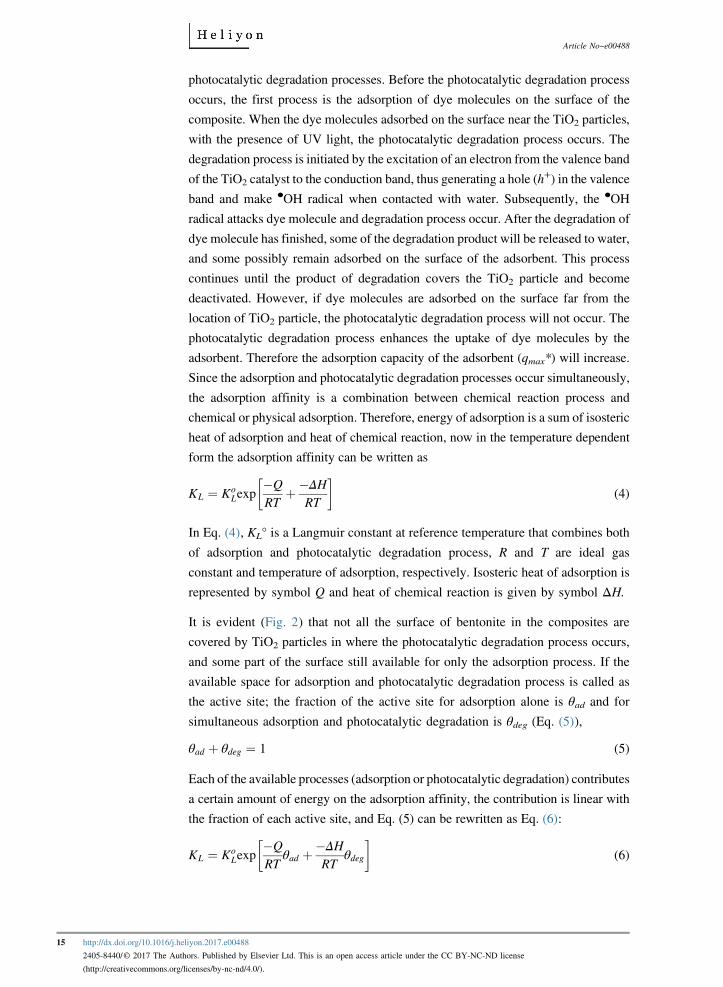
Figs. 7 and 8 show the experimental adsorption data of MB and RhB onto
composites under UV light irradiation. Theoretical plots of Eq. (8) are also given in
those figures. It is evident that the modified Langmuir equation can represent the
experimental adsorption data very well. The adsorption of MB and RhB onto
[(Fig._7)TD$FIG]
(a)
Ce, mmol/L
0.0 0.1 0.2 0.3 0.4 0.5
q e, m
mol
/g
0.00
0.05
0.10
0.15
0.20
0.25
T = 30oC
T = 50oC
T = 70oCModified Langmuir
(b)
Ce, mmol/L
0.0 0.1 0.2 0.3 0.4 0.5
q e, m
mol
/g
0.00
0.05
0.10
0.15
0.20
0.25
0.30
0.35
(c)
Ce, mmol/L
0.0 0.1 0.2 0.3 0.4 0.5
q e, m
mol
/g
0.00
0.05
0.10
0.15
0.20
0.25
0.30
0.35
Fig. 7. Adsorption isotherms and theoretical modified Langmuir model on the adsorption of MB under
UV light irradiation. (a) B + 5% TiO2, (b) B + 10% TiO2, and (c) B + 20% TiO2.
Article No~e00488
16 http://dx.doi.org/10.1016/j.heliyon.2017.e00488
2405-8440/© 2017 The Authors. Published by Elsevier Ltd. This is an open access article under the CC BY-NC-ND license
(http://creativecommons.org/licenses/by-nc-nd/4.0/).
bentonite − TiO2 composites under UV light irradiation can enhance the
“adsorption capacity” of the composites more than 30%. The parameters of
modified Langmuir equation obtained from the fitting of the experimental data are
summarized in Tables 3 and 4. It is evident that the ratio of TiO2 and temperature
play a significant role in the removal of MB and RhB from aqueous solution.
The adsorption and photocatalytic degradation of MB and RhB onto composites are
endothermic processes as indicated by positive values ofQ andΔH (Tables 3 and 4).
Since both of adsorption and photocatalytic degradation are endothermic processes,
the increase of temperature enhanced the amount uptake and degradation reaction. In
general, the values of Q and ΔH are essentially independent of temperature but
dependent on the adsorption system as seen in Tables 3 and 4 . This phenomenon is
consistent with many adsorption systems [22, 23].
The photocatalytic degradation of MB and RhB is a function of TiO2 ratio. The
fraction of the active site for photocatalytic degradation reaction (θdeg) increased
[(Fig._8)TD$FIG]
(a)
Ce, mmol/L
0.0 0.1 0.2 0.3
q e, m
mol
/g
0.00
0.05
0.10
0.15
0.20
0.25
T = 30oC
T = 50oCT = 70oCModified Langmuir
(b)
Ce, mmol/L
0.0 0.1 0.2 0.3
q e, m
mol
/g
0.00
0.05
0.10
0.15
0.20
0.25
(c)
Ce, mmol/L
0.0 0.1 0.2 0.3
q e, m
mol
/g
0.00
0.05
0.10
0.15
0.20
0.25
Fig. 8. Adsorption isotherms and theoretical modified Langmuir model on the adsorption of RhB under
UV light irradiation. (a) B + 5% TiO2, (b) B + 10% TiO2, and (c) B + 20% TiO2.
Article No~e00488
17 http://dx.doi.org/10.1016/j.heliyon.2017.e00488
2405-8440/© 2017 The Authors. Published by Elsevier Ltd. This is an open access article under the CC BY-NC-ND license
(http://creativecommons.org/licenses/by-nc-nd/4.0/).
with the increase of TiO2 ratio. As mentioned before, the presence of TiO2 in the
solid system will initiate the formation of ●OH radical and this radical acts as the
active site for photocatalytic degradation reaction. With the increase in the number
of TiO2 particles (an increase of TiO2 ratio), the number of free ●OH radical also
increase, and it enhanced the photocatalytic degradation of MB and RhB.
4. Conclusion
In this study, bentonite − TiO2 composites were prepared by impregnation followed
by microwave irradiation processes. Physical characteristics of the composites were
determined using FTIR analysis, XRD, SEM, and nitrogen sorption methods. The
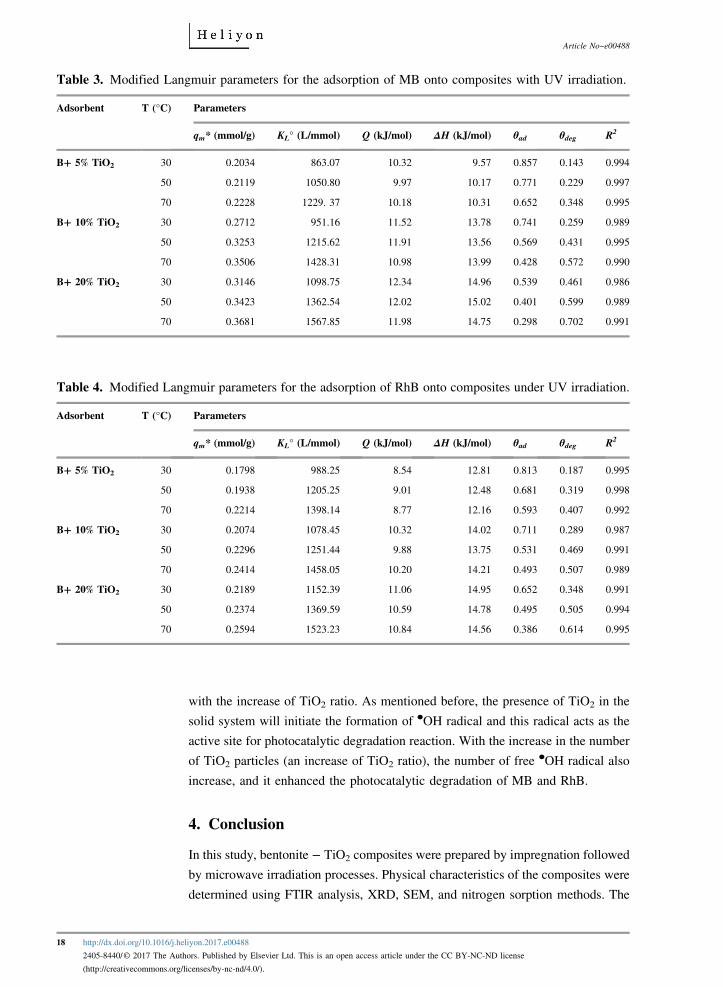
Table 3. Modified Langmuir parameters for the adsorption of MB onto composites with UV irradiation.
Adsorbent T (°C) Parameters
qm* (mmol/g) KL° (L/mmol) Q (kJ/mol) ΔH (kJ/mol) θad θdeg R2
B+ 5% TiO2 30 0.2034 863.07 10.32 9.57 0.857 0.143 0.994
50 0.2119 1050.80 9.97 10.17 0.771 0.229 0.997
70 0.2228 1229. 37 10.18 10.31 0.652 0.348 0.995
B+ 10% TiO2 30 0.2712 951.16 11.52 13.78 0.741 0.259 0.989
50 0.3253 1215.62 11.91 13.56 0.569 0.431 0.995
70 0.3506 1428.31 10.98 13.99 0.428 0.572 0.990
B+ 20% TiO2 30 0.3146 1098.75 12.34 14.96 0.539 0.461 0.986
50 0.3423 1362.54 12.02 15.02 0.401 0.599 0.989
70 0.3681 1567.85 11.98 14.75 0.298 0.702 0.991
Table 4. Modified Langmuir parameters for the adsorption of RhB onto composites under UV irradiation.
Adsorbent T (°C) Parameters
qm* (mmol/g) KL° (L/mmol) Q (kJ/mol) ΔH (kJ/mol) θad θdeg R2
B+ 5% TiO2 30 0.1798 988.25 8.54 12.81 0.813 0.187 0.995
50 0.1938 1205.25 9.01 12.48 0.681 0.319 0.998
70 0.2214 1398.14 8.77 12.16 0.593 0.407 0.992
B+ 10% TiO2 30 0.2074 1078.45 10.32 14.02 0.711 0.289 0.987
50 0.2296 1251.44 9.88 13.75 0.531 0.469 0.991
70 0.2414 1458.05 10.20 14.21 0.493 0.507 0.989
B+ 20% TiO2 30 0.2189 1152.39 11.06 14.95 0.652 0.348 0.991
50 0.2374 1369.59 10.59 14.78 0.495 0.505 0.994
70 0.2594 1523.23 10.84 14.56 0.386 0.614 0.995
Article No~e00488
18 http://dx.doi.org/10.1016/j.heliyon.2017.e00488
2405-8440/© 2017 The Authors. Published by Elsevier Ltd. This is an open access article under the CC BY-NC-ND license
(http://creativecommons.org/licenses/by-nc-nd/4.0/).
adsorption and photocatalytic degradation capability of the composites were tested
againstMB andRhB solution. The liquid phase adsorption experiment was conducted
with or without UV light irradiation. The UV light irradiation process can enhance the
uptake or degradation ofMB andRhBmore than 30% of the process without UV light
irradiation. Langmuir and Freundlich adsorption equations were employed to
correlate the experimental adsorption data, and Langmuir model gave a better
representation than Freundlich. To accommodate the photocatalytic degradation
process into the adsorption isotherm, the modification of Langmuir equation by the
inclusion of heat of reaction and fraction of the active site for photocatalytic
degradation process was conducted. The modified Langmuir model can represent the
experimental data well with reasonable parameters values.
Declarations
Author contribution statement
Livy Laysandra and Meri Winda Masnona Kartika Sari: Performed the
experiments.
Felycia Edi Soetaredjo: Conceived and designed the experiments; Wrote the paper.
Kuncoro Foe, Jindrayani Nyoo Putro and Alfin Kurniawan: Analyzed and
interpreted the data.
Yi-Hsu Ju: Contributed reagents, materials, analysis tools or data; Wrote the paper.
Suryadi Ismadji: Conceived and designed the experiments; Contributed reagents,
materials, analysis tools or data; Wrote the paper.
Funding statement
This work was supported by the Indonesia Ministry of Research and Technology
and Higher Education through Competency Grant
Competing interest statement
The authors declare no conflict of interest.
Additional information
No additional information is available for this paper.
References
[1] W. Hajjaji, S.O. Ganiyu, D.M. Tobaldi, S. Andrejkovičová, F.R.R.C. Pullar,J.A. Labrincha, Natural Portuguese clayey materials and derived TiO2-
Article No~e00488
19 http://dx.doi.org/10.1016/j.heliyon.2017.e00488
2405-8440/© 2017 The Authors. Published by Elsevier Ltd. This is an open access article under the CC BY-NC-ND license
(http://creativecommons.org/licenses/by-nc-nd/4.0/).
containing composites used for decolouring methylene blue (MB) and orange
II (OII) solutions, Appl. Clay Sci. 83–84 (2013) 91–98.
[2] R. Djellabi, M.F. Ghorab, G. Cerrato, S. Morandi, S. Gatto, V. Oldani, A.D.
Michele, C.L. Bianchi, Photoactive TiO2–montmorillonite composite for
degradation of organic dyes in water, J. Photochem. Photobiol. A: Chem. 295
(2014) 57–63.
[3] H. Mittala, S.S. Raya, A study on the adsorption of methylene blue onto gum
ghatti/TiO2 nanoparticles-based hydrogel nanocomposite, Int. J. Biol.
Macromol. 88 (2016) 66–80.
[4] S. Li, Removal of crystal violet from aqueous solution by sorption into semi-
interpenetrated networks hydrogels constituted of poly(acrylic acid-acrylam-
ide-methacrylate) and amylose, Biores. Technol. 101 (2010) 2197–2202.
[5] A.A. Attia, B.S. Girgis, N.A. Fathy, Removal of methylene blue by carbons
derived from peach stones by H3PO4 activation: Batch and column studies,
Dyes Pigments 76 (2008) 282–289.
[6] P. Sharma, H. Kaur, M. Sharma, V. Sahore, A review on applicability of
naturally available adsorbents for the removal of hazardous dyes from
aqueous waste, Environ. Monit. Assess. 183 (2011) 151–195.
[7] V.K. Gupta, I. Ali, V.K. Saini, Removal of Rhodamine B, Fast Green, and
Methylene Blue from Wastewater Using Red Mud, an Aluminum Industry
Waste, Ind. Eng. Chem. Res. 43 (2004) 1740–1747.
[8] W.S.W. Ngah, M.A.K.M. Hanafia, Removal of heavy metal ions from
wastewater by chemically modified plant wastes as adsorbents: a review,
Biores. Technol. 99 (2008) 3935–3948.
[9] Y. Gao, Y. Wang, H. Zhang, Removal of Rhodamine B with Fe-supported
bentonite as heterogeneous photo-Fenton catalyst under visible irradiation,
Appl. Catal. B: Env. 78 (2015) 29–36.
[10] V. Belessia, G. Romanosa, N. Boukosa, D. Lambropouloud, C. Trapalisa,
Removal of Reactive Red 195 from aqueous solutions by adsorption on the
surface of TiO2 nanoparticles, J. Hazard. Mater. 170 (2009) 836–844.
[11] A. Kurniawan, H. Sutiono, N. Indraswati, S. Ismadji, Removal of basic dyes
in binary system by adsorption using rarasaponin–bentonite: Revisited of
extended Langmuir model, Chem. Eng. J. 189-190 (2012) 264–274.
[12] N. Belhouchat, H. Zaghouane-Boudiaf, C. Viseras, Removal of anionic and
cationic dyes from aqueous solution with activated organo-bentonite/sodium
alginate encapsulated beads, Appl. Clay Sci. 135 (2017) 9–15.
Article No~e00488
20 http://dx.doi.org/10.1016/j.heliyon.2017.e00488
2405-8440/© 2017 The Authors. Published by Elsevier Ltd. This is an open access article under the CC BY-NC-ND license
(http://creativecommons.org/licenses/by-nc-nd/4.0/).
[13] J. Chanathaworn, C. Bunyakan, W. Wiyaratn, J. Chungsiriporn, Photo-
catalytic decolorization of basic dye by TiO2 nanoparticle in photoreactor,
Songklanakarin J. Sci. Technol. 34 (2012) 203–210.
[14] K. Nakataa, A. Fujishimaa, Design and applications, J. Photochem. Photobiol.
A: Chem. 13 (2012) 169–189.
[15] D.I. Petkowicz, R. Brambilla, C.U. Radtke, C.D.S. Silva, Z.N.d.R.B.C.
Pergher, J.H.Z. Santos, Photodegradation of methylene blue by in situ
generated titania supported on a NaA zeolite, Appl. Catal. A 357 (2009)
125–134.
[16] B. Damardji, H. Khalaf, L. Duclaux, B. David, Preparation of TiO2-pillared
montmorillonite as photocatalyst Part I. Microwave calcination, characterisa-
tion, and adsorption of a textile azo dye, Appl. Clay Sci. 44 (2008) 201–205.
[17] A.B. Dukic, K.R. Kumric, N.S. Vukelic, Z.S. Stojanovic, M.D. Stojmenovic,
S.S. Milosevic, L.L. Matovic, Influence of ageing of milled clay and its
composite with TiO2 on the heavy metal adsorption characteristics, Ceramic
Int. 41 (2015) 5129–5137.
[18] S. Ismadji, D.S. Tong, F.E. Soetaredjo, A. Ayucitra, W.H. Yu, C.H. Zhou,
Bentonite hydrochar composite for removal of ammonium from Koi fish tank,
Appl. Clay Sci. 119 (2016) 146–154.
[19] K. Bahranowski, A. Gawel, A. Klimek, A. Michalik-Zym, B.D. Naprus-
zewska, M. Nattich-Rak, M. Rogowska, E.M. Serwicka, Influence of
purification method of Na-montmorillonite on textural properties of clay
mineral composites with TiO2 nanoparticles, Appl. Clay Sci. 140 (2017)
75–80.
[20] J. Henych, M. Kormunda, M. Stastny, P. Janos, P. Vomacka, J. Matousek, V.
Stengl, Water-based synthesis of TiO2/CeO2 composites supported on
plasma-treated montmorillonite for parathion methyl degradation, Appl. Clay
Sci. 144 (2017) 26–35.
[21] E. Rossetto, D.I. Petkowicz, J.H.Z.d. Santos, S.B.C. Pergher, F.G. Penha,
Bentonites impregnated with TiO2 for photodegradation of methylene blue,
Appl. Clay Sci. 48 (2010) 602–606.
[22] F.P. Yesi, Y.H. Sisnandy, F.E. Ju, S. Soetaredjo, Ismadji, Adsorption of Acid
Blue 129 from Aqueous Solutions onto Raw and Surfactant-modified
Bentonite: Application of Temperature-dependent Forms of Adsorption
Isotherms, Ads. Sci. Technol. 28 (2010) 847–868.
[23] A. Kurniawan, A.N. Kosasih, J. Febrianto, Y.H. Ju, J. Sunarso, N. Indraswati,
S. Ismadji, Utilization of rarasaponin natural surfactant for organo-bentonite
Article No~e00488
21 http://dx.doi.org/10.1016/j.heliyon.2017.e00488
2405-8440/© 2017 The Authors. Published by Elsevier Ltd. This is an open access article under the CC BY-NC-ND license
(http://creativecommons.org/licenses/by-nc-nd/4.0/).
preparation: Application for methylene blue removal from aqueous effluent,
Chem. Eng. J. 172 (2011) 158–166.
Article No~e00488
22 http://dx.doi.org/10.1016/j.heliyon.2017.e00488
2405-8440/© 2017 The Authors. Published by Elsevier Ltd. This is an open access article under the CC BY-NC-ND license
(http://creativecommons.org/licenses/by-nc-nd/4.0/).