Embed Size (px)
Citation preview
Projekt współfinansowany ze środków Unii Europejskiej w ramach Europejskiego Funduszu Społecznego
ROZWÓJ POTENCJAŁU I OFERTY DYDAKTYCZNEJ POLITECHNIKI WROCŁAWSKIEJ
Wrocław University of Technology
Renewable Energy Systems
Halina Pawlak Kruczek
ADVANCED POWER
GENERATION TECHNOLOGY Advanced Technology in Electrical Power Generation
Wrocław 2011

Wrocław University of Technology
Renewable Energy Systems
Halina Pawlak Kruczek
ADVANCED POWER GENERATION
TECHNOLOGY Advanced Technology in Electrical Power Generation
Wrocław 2011

Copyright © by Wrocław University of Technology
Wrocław 2011
Reviewer: Czesław Kowalski
ISBN 978-83-62098-75-0
Published by PRINTPAP Łódź, www.printpap.pl
CO%TE%T
CHAPTER 1 – Introduction ....................................................................................................... 4 CHAPTER 2 Thermal power station ......................................................................................... 6 CHAPTER 3 Power generation fundamentals ......................................................................... 10
3.1 Fuels ............................................................................................................................... 10 Fossil fuel characteristics ................................................................................................. 10 3.1.1.Coal ......................................................................................................................... 13 3.1.2.Gas ........................................................................................................................... 19 3.1.3. Liquid fuels ............................................................................................................ 24 3.1.4. Biomass .................................................................................................................. 28
3.2.Combustion and Gasification ......................................................................................... 38 3.3 – Thermodynamics based for power systems ................................................................ 43
3.3.1 Vapor and combined power cycles ......................................................................... 43 3.3.2 The Carnot vapor cycle ........................................................................................... 43 3.3.3 Rankine cycle: the ideal cycle for vapor power cycles ........................................... 44 3.3.4 Energy analysis of the ideal Rankine cycle ............................................................. 45
3.4.– Improving of the Rankine cycle efficiency ................................................................ 50 3.4.1 Lowering the Condenser Pressure (Lowers Tlow, av) ................................................ 50 3.4.2.Superheating the steam to high temperatures (Increases Thigh, av) ........................... 51 3.4.3. Increasing the boiler pressure (Increases Thigh, av) .............................................. 52 3.4.4 The ideal reheat Rankine cycle ............................................................................... 54 3.4.5 The ideal regenerative Rankine cycle ..................................................................... 57
CHAPTER 4 Supercritical steam plant (PC/SC) ..................................................................... 60 CHAPTER 5 Cogeneration ...................................................................................................... 64 CHAPTER 6 Brayton cycle: the ideal cycle for gas-turbine engines ...................................... 68
6.1 Development of gas turbines .......................................................................................... 72 6.2. The Brayton cycle with regeneration ............................................................................ 73
CHAPTER 7 Combined gas-vapor power cycles .................................................................... 79 CHAPTER 8 IGCC – Integrated Gasification Combined Cycle ............................................. 82 CHAPTER 9 Hybrid Power Plant ............................................................................................ 88 CHAPTER 10 Technical solution of advanced power plants - boilers .................................... 89 CHAPTER 11 Summary .......................................................................................................... 93 Bibliography ............................................................................................................................. 94
3
CHAPTER 1 – Introduction
Energy plays a tremendous role in the mankind’s life. Its production and consumption creates the base for all the processes of life on Earth. The milestones of energy progress of the mankind were, particularly in the recent centuries, the following [1]: a) an application of wind power and of hydro energy by the end of an ancient era (water wheel), b) use of coal in the 18th and 19th century to drive the machines (steam engine) which revolutionised the world through the rapid development of the industry and transport; therefore the 19th century was named the century of coal, c) a wide application of oil at the end of 19th and particularly in the 20th century, and subsequently the rapid growth of natural gas use; the oil and gas replaced coal in many areas of application, d) a large scale application of electricity which became the most universal and most versatile type of energy; the nuclear energy was also employed for electricity generation in the second half of 20th century. The world’s energy resources have been divided into two categories: renewable and non-renewable. Non-renewable fuels, which constitute by now the basic source of world’s primary energy supply, comprise:
a) hard coal and brown coal (lignite), b) crude oil, including natural gas liquids, c) oil shales, d) tar sands and oil sands, e) natural gas, f) uranium.
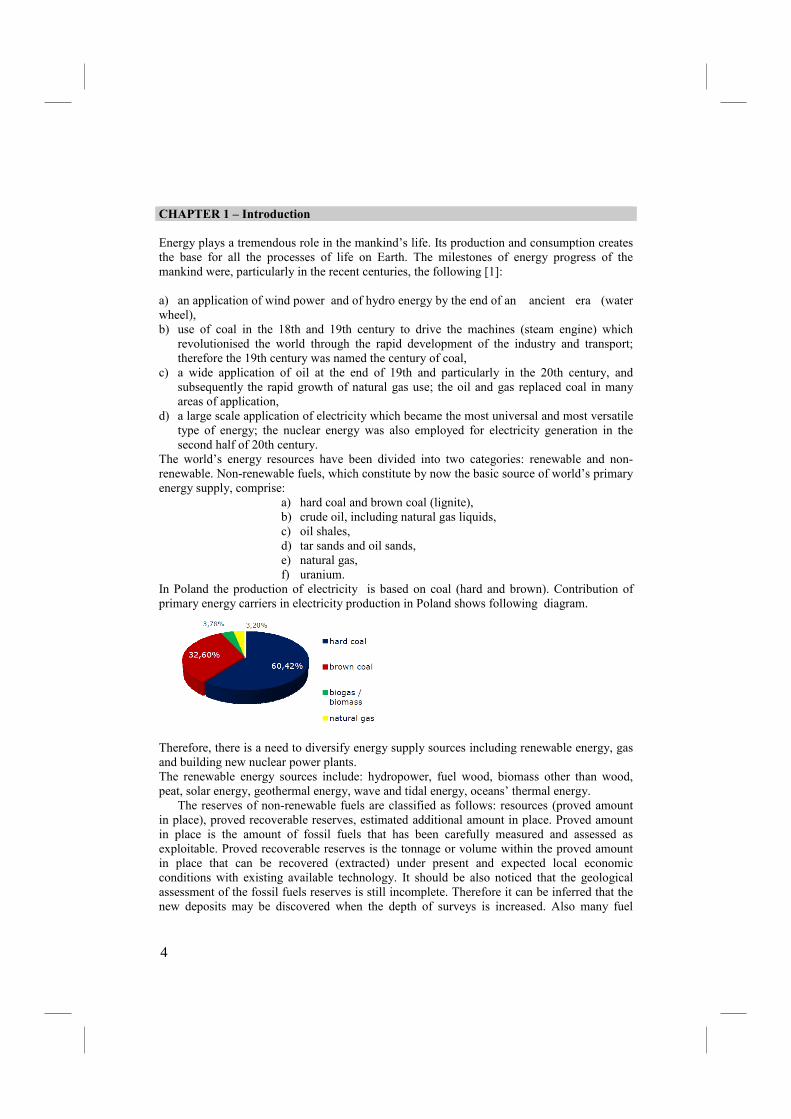
In Poland the production of electricity is based on coal (hard and brown). Contribution of primary energy carriers in electricity production in Poland shows following diagram.
Therefore, there is a need to diversify energy supply sources including renewable energy, gas and building new nuclear power plants. The renewable energy sources include: hydropower, fuel wood, biomass other than wood, peat, solar energy, geothermal energy, wave and tidal energy, oceans’ thermal energy. The reserves of non-renewable fuels are classified as follows: resources (proved amount in place), proved recoverable reserves, estimated additional amount in place. Proved amount in place is the amount of fossil fuels that has been carefully measured and assessed as exploitable. Proved recoverable reserves is the tonnage or volume within the proved amount in place that can be recovered (extracted) under present and expected local economic conditions with existing available technology. It should be also noticed that the geological assessment of the fossil fuels reserves is still incomplete. Therefore it can be inferred that the new deposits may be discovered when the depth of surveys is increased. Also many fuel
4
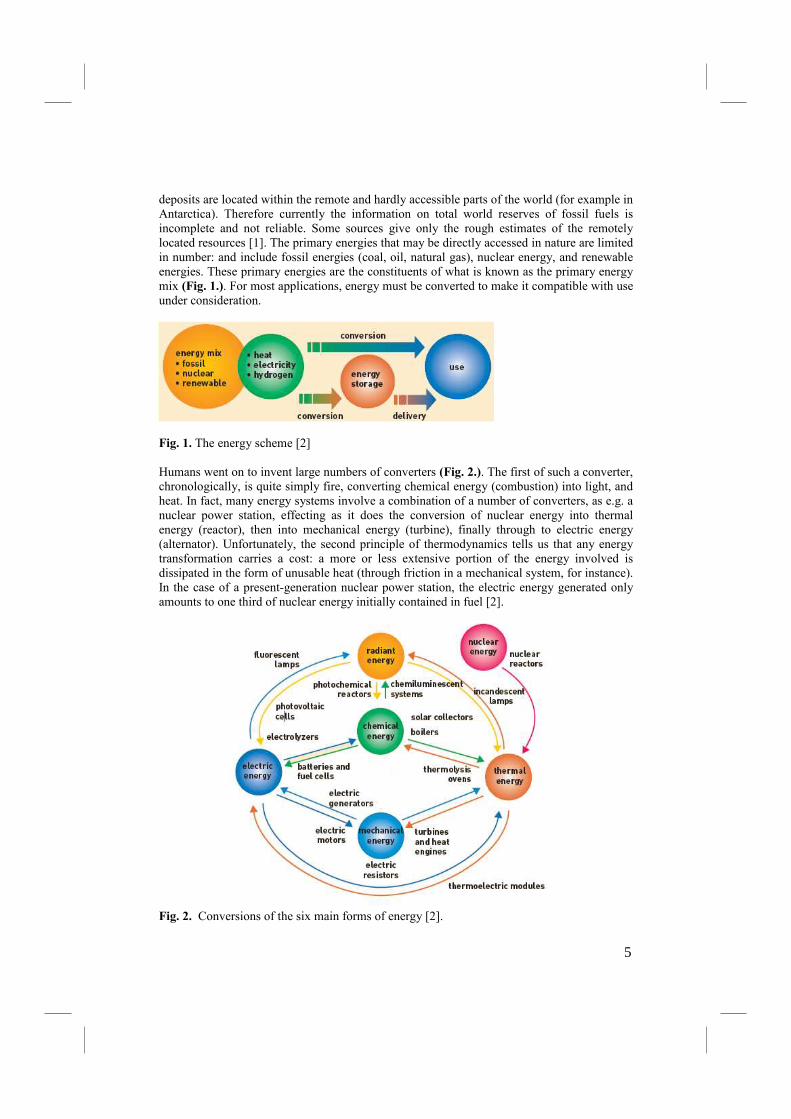
deposits are located within the remote and hardly accessible parts of the world (for example in Antarctica). Therefore currently the information on total world reserves of fossil fuels is incomplete and not reliable. Some sources give only the rough estimates of the remotely located resources [1]. The primary energies that may be directly accessed in nature are limited in number: and include fossil energies (coal, oil, natural gas), nuclear energy, and renewable energies. These primary energies are the constituents of what is known as the primary energy mix (Fig. 1.). For most applications, energy must be converted to make it compatible with use under consideration.
Fig. 1. The energy scheme [2] Humans went on to invent large numbers of converters (Fig. 2.). The first of such a converter, chronologically, is quite simply fire, converting chemical energy (combustion) into light, and heat. In fact, many energy systems involve a combination of a number of converters, as e.g. a nuclear power station, effecting as it does the conversion of nuclear energy into thermal energy (reactor), then into mechanical energy (turbine), finally through to electric energy (alternator). Unfortunately, the second principle of thermodynamics tells us that any energy transformation carries a cost: a more or less extensive portion of the energy involved is dissipated in the form of unusable heat (through friction in a mechanical system, for instance). In the case of a present-generation nuclear power station, the electric energy generated only amounts to one third of nuclear energy initially contained in fuel [2].
Fig. 2. Conversions of the six main forms of energy [2].
5
CHAPTER 2 Thermal power station
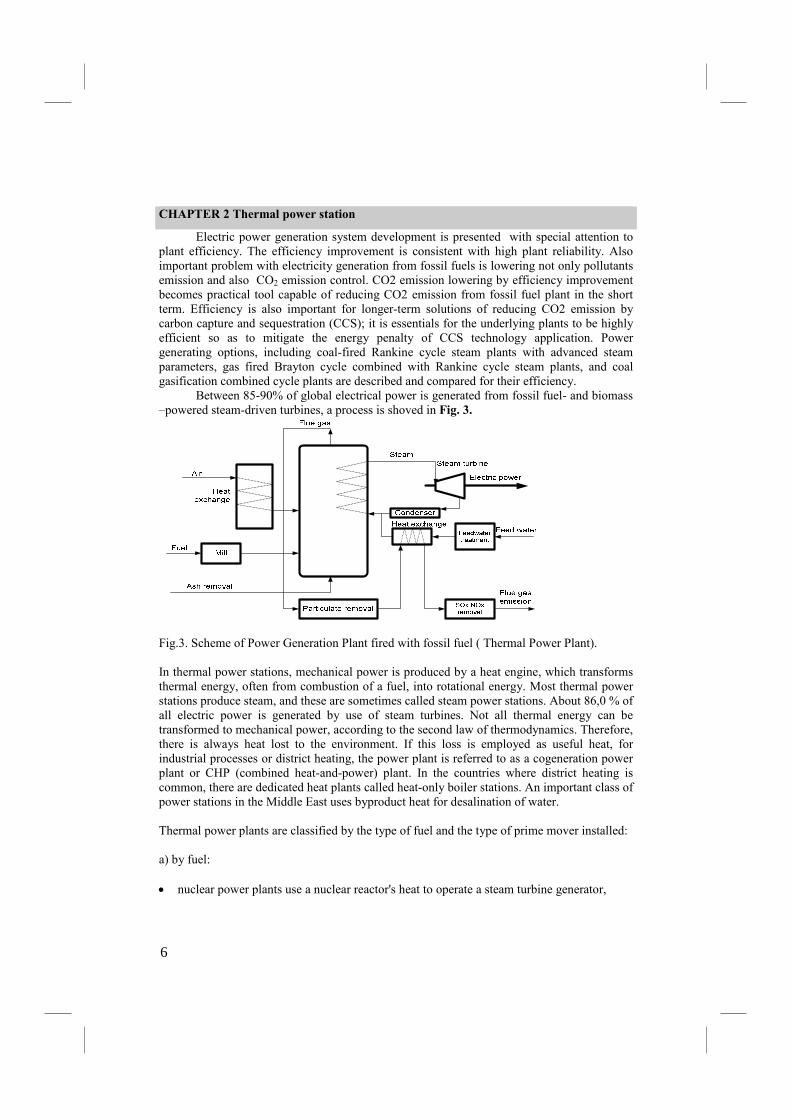
Electric power generation system development is presented with special attention to plant efficiency. The efficiency improvement is consistent with high plant reliability. Also important problem with electricity generation from fossil fuels is lowering not only pollutants emission and also CO2 emission control. CO2 emission lowering by efficiency improvement becomes practical tool capable of reducing CO2 emission from fossil fuel plant in the short term. Efficiency is also important for longer-term solutions of reducing CO2 emission by carbon capture and sequestration (CCS); it is essentials for the underlying plants to be highly efficient so as to mitigate the energy penalty of CCS technology application. Power generating options, including coal-fired Rankine cycle steam plants with advanced steam parameters, gas fired Brayton cycle combined with Rankine cycle steam plants, and coal gasification combined cycle plants are described and compared for their efficiency. Between 85-90% of global electrical power is generated from fossil fuel- and biomass –powered steam-driven turbines, a process is shoved in Fig. 3.
Fig.3. Scheme of Power Generation Plant fired with fossil fuel ( Thermal Power Plant). In thermal power stations, mechanical power is produced by a heat engine, which transforms thermal energy, often from combustion of a fuel, into rotational energy. Most thermal power stations produce steam, and these are sometimes called steam power stations. About 86,0 % of all electric power is generated by use of steam turbines. Not all thermal energy can be transformed to mechanical power, according to the second law of thermodynamics. Therefore, there is always heat lost to the environment. If this loss is employed as useful heat, for industrial processes or district heating, the power plant is referred to as a cogeneration power plant or CHP (combined heat-and-power) plant. In the countries where district heating is common, there are dedicated heat plants called heat-only boiler stations. An important class of power stations in the Middle East uses byproduct heat for desalination of water. Thermal power plants are classified by the type of fuel and the type of prime mover installed: a) by fuel: • nuclear power plants use a nuclear reactor's heat to operate a steam turbine generator,
6
• fossil fuelled power plants may also use a steam turbine generator or in the case of natural gas fired plants may use a combustion turbine, • geothermal power plants use steam extracted from hot underground rocks, • renewable energy plants may be fuelled by waste from sugar cane, municipal solid waste, landfill methane, or other forms of biomass, • waste heat from industrial processes is occasionally concentrated enough to use for power generation, usually in a steam boiler and turbine. b) by prime mover • steam turbine plants use the dynamic pressure generated by expanding steam to turn the blades of a turbine. Almost all large non-hydro plants use this system, • gas turbine plants use the dynamic pressure from flowing gases to directly operate the turbine. Natural-gas fuelled turbine plants can start rapidly and so are used to supply ,,peak’’ energy during periods of high demand, though at higher cost than base-loaded plants. These may be comparatively small units, and sometimes completely unmanned, being remotely operated. This type was pioneered by the UK, Princetown being the world's first, commissioned in 1959, • combined cycle plants have both a gas turbine fired by natural gas, and a steam boiler and steam turbine which use the exhaust gas from the gas turbine to produce electricity. This greatly increases the overall efficiency of the plant, and many new base load power plants are combined cycle plants fired by natural gas, • internal combustion reciprocating engines are used to provide power for isolated communities and are frequently used for small cogeneration plants. Hospitals, office buildings, industrial plants, and other critical facilities also use them to provide backup power in case of a power outage. These are usually fuelled by diesel oil, heavy oil, natural gas and landfill gas, • microturbines, Stirling engine and internal combustion reciprocating engines are low cost solutions for using opportunity fuels, such as landfill gas, digester gas from water treatment plants and waste gas from oil production.
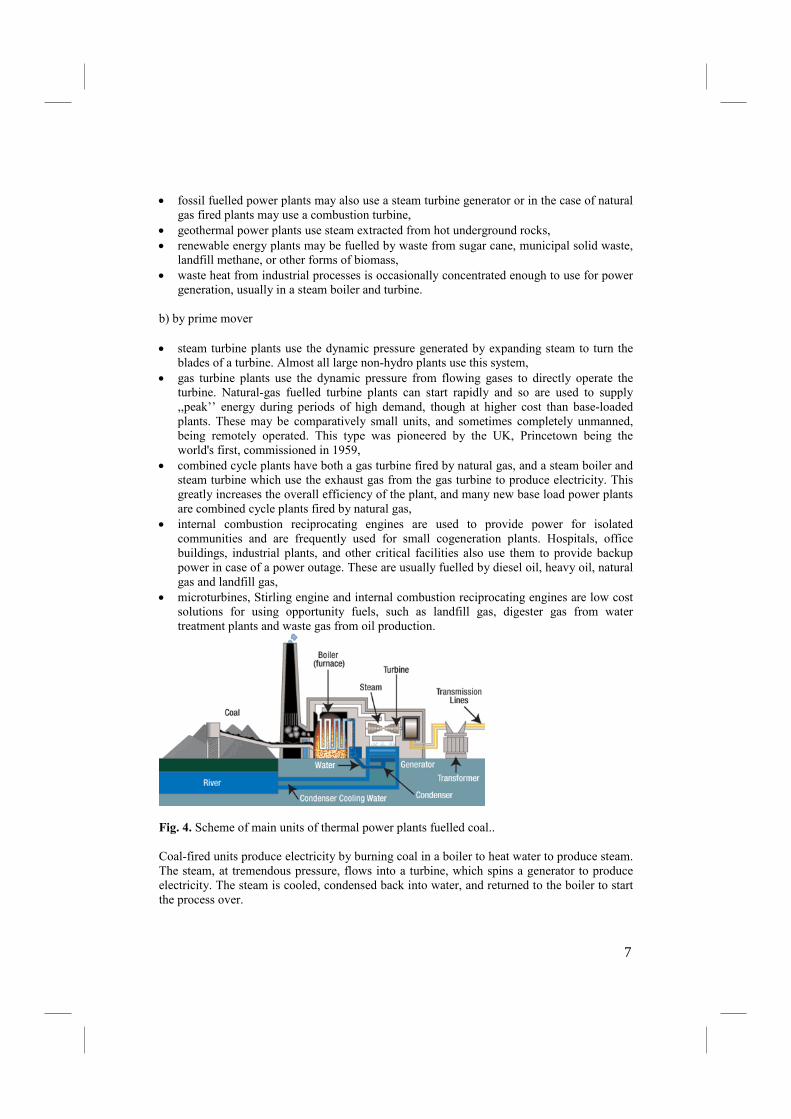
Fig. 4. Scheme of main units of thermal power plants fuelled coal.. Coal-fired units produce electricity by burning coal in a boiler to heat water to produce steam. The steam, at tremendous pressure, flows into a turbine, which spins a generator to produce electricity. The steam is cooled, condensed back into water, and returned to the boiler to start the process over.
7
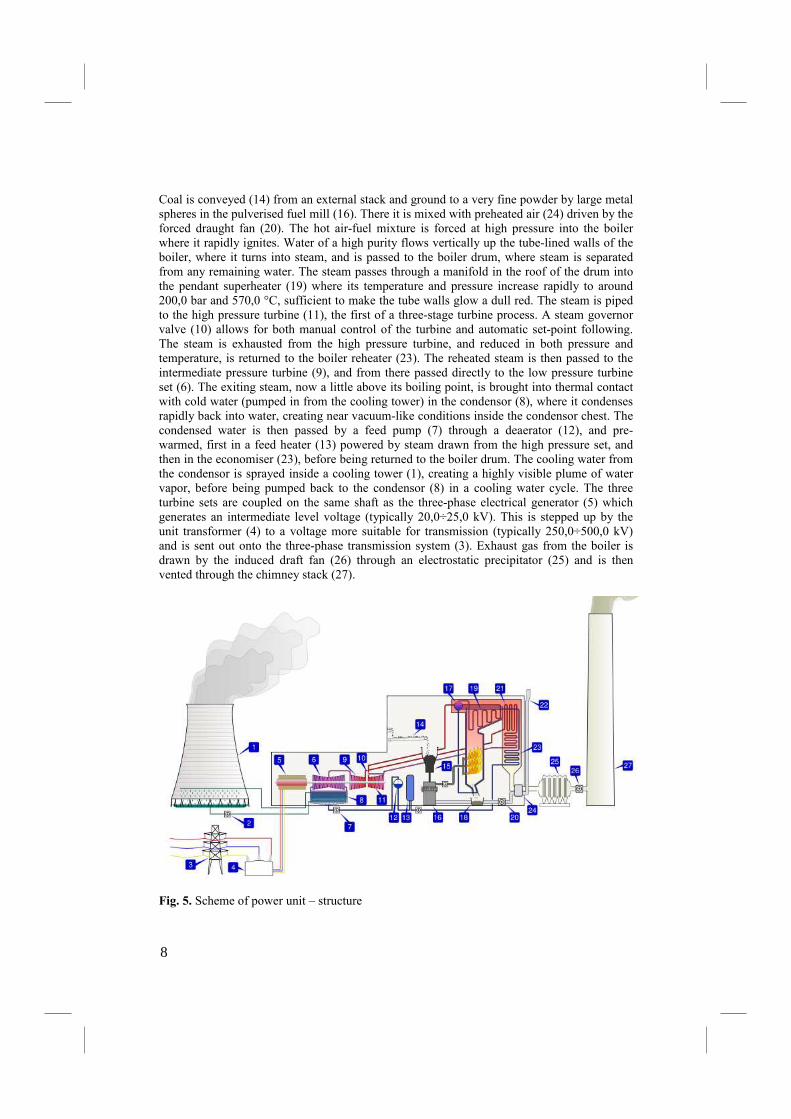
Coal is conveyed (14) from an external stack and ground to a very fine powder by large metal spheres in the pulverised fuel mill (16). There it is mixed with preheated air (24) driven by the forced draught fan (20). The hot air-fuel mixture is forced at high pressure into the boiler where it rapidly ignites. Water of a high purity flows vertically up the tube-lined walls of the boiler, where it turns into steam, and is passed to the boiler drum, where steam is separated from any remaining water. The steam passes through a manifold in the roof of the drum into the pendant superheater (19) where its temperature and pressure increase rapidly to around 200,0 bar and 570,0 °C, sufficient to make the tube walls glow a dull red. The steam is piped to the high pressure turbine (11), the first of a three-stage turbine process. A steam governor valve (10) allows for both manual control of the turbine and automatic set-point following. The steam is exhausted from the high pressure turbine, and reduced in both pressure and temperature, is returned to the boiler reheater (23). The reheated steam is then passed to the intermediate pressure turbine (9), and from there passed directly to the low pressure turbine set (6). The exiting steam, now a little above its boiling point, is brought into thermal contact with cold water (pumped in from the cooling tower) in the condensor (8), where it condenses rapidly back into water, creating near vacuum-like conditions inside the condensor chest. The condensed water is then passed by a feed pump (7) through a deaerator (12), and pre- warmed, first in a feed heater (13) powered by steam drawn from the high pressure set, and then in the economiser (23), before being returned to the boiler drum. The cooling water from the condensor is sprayed inside a cooling tower (1), creating a highly visible plume of water vapor, before being pumped back to the condensor (8) in a cooling water cycle. The three turbine sets are coupled on the same shaft as the three-phase electrical generator (5) which generates an intermediate level voltage (typically 20,0÷25,0 kV). This is stepped up by the unit transformer (4) to a voltage more suitable for transmission (typically 250,0÷500,0 kV) and is sent out onto the three-phase transmission system (3). Exhaust gas from the boiler is drawn by the induced draft fan (26) through an electrostatic precipitator (25) and is then vented through the chimney stack (27).
Fig. 5. Scheme of power unit – structure
8

1 – cooling tower 6 – low pressure turbine 11 – high pressure turbine 2 – cooling water pump 7 – boiler feed pump 12 – deaerator 3 – three-phase transmission line
8 – condenser 13 – feed heater
4 – unit transformer 9 – intermediate pressure turbine
14 – coal conveyor
5 – three-phase electric generator
10 – steam governor valve 15 – coal hopper
16 – pulverised fuel mill 17 – boiler drum 18 – ash hopper 19 – superheater 20 – forced draught fan 21 – reheater 22 – air intake 23 – economiser 24 – air preheater 25 – precipitator 26 – induced draught fan 27 – stack chimney
9
CHAPTER 3 Power generation fundamentals
In this chapter, the fundamentals of fossil-fuelled power generation are described. Subsequently, the chemistry of combustion and gasification of solid fossil fuels, the physics of the thermodynamic cycles used in standard and combined cycle power plants ( the Rankine steam cycle and the Brayton gas turbine cycle) are presented. 3.1 Fuels Fossil fuel characteristics Energy production from fossil fuel combustion results in the emission of greenhouse gasses, the dominant contributor being CO2. Public awareness and legislation have led to a policy of reduction of greenhouse gas emissions in most economically well developed countries, with the regulations partially driven by (international) initiatives such as the Kyoto protocol and the Intergovernmental Panel on Climate Change [3]. Most chemical fuels are found in nature in the form of crude oil, natural gas, and coal. These fuels are called fossil fuels because they are believed to have been formed by the decay of vegetable and animal matter over many thousands of years under conditions of high pressure and temperature and with a deficiency or absence of oxygen. Other fuels such as gasoline, syngas (synthetic gas), and coke may be derived from fossil fuels by some form of industrial or chemical processing.
Poland belongs to countries in Europe on average rich in fossil fuels. After the 2nd world war, as a result of search works conducted on a large scale, huge deposits of hard coal, considerable reserves of lignite coal, moderate reserves of natural gas and small reserves of petroleum were discovered. The part of deposits was discovered in mining regions already known, like hard coal in the upper-Silesian coal basin, or petroleum and natural gas in the eastern part of Carpatian, but the fundamental growth of resources was substantiated in new areas: Lublin coal basin, Jastrzębie Zdrój, central and western Poland, Foreland of Carpatian, Sudety monocline as well as Pomerania and the Baltic Sea. Hard coal is without a doubt a main mineral resource of our country and through many years after the 2nd world war was the base for the Polish economy, mainly for the heavy industry (smelting industry, chemical industry, energy understood widely). It decided about almost a full independence of Poland from supplies of natural gas and petroleum, mainly from the east, then Soviet Union and today Russia. According to examinations which were carried out in the Institute of Mineral Resources and Energy Economy PAoS, at the rational exploitation of coal with the respect of its stores, it will be possible to cover domestic needs for this raw material through about 70 years, however covering domestic needs from active at present levels of mines, at present not fully rational economy of resources, it will be enough for about 28 years. It is possible to lengthen this period to about 50 years after making new mining levels available and new deposits in those mines. If needs for hard coal will stay on the present level, a necessity of construction of new mines will occur in year 2025. On account of running out of reserves of the lignite coal in deposits exploited at present, after year 2015, its extraction will start to decrease. Construction of mines will become current in the new Legnica basin, with use of the potential of copper deposits exploitation fading out at that time in Lubin area. It is possible to predict, that deposits of the lignite coal, the ones substantiated already and the ones which will be discovered will make part of the base for manufacturing electric energy in the 21st century. Carrying drill activity connected with the search of petroleum and natural gas deposits may create risks for elements of the natural environment mainly as a result storing drilling wastewater and waste with unique properties.
10
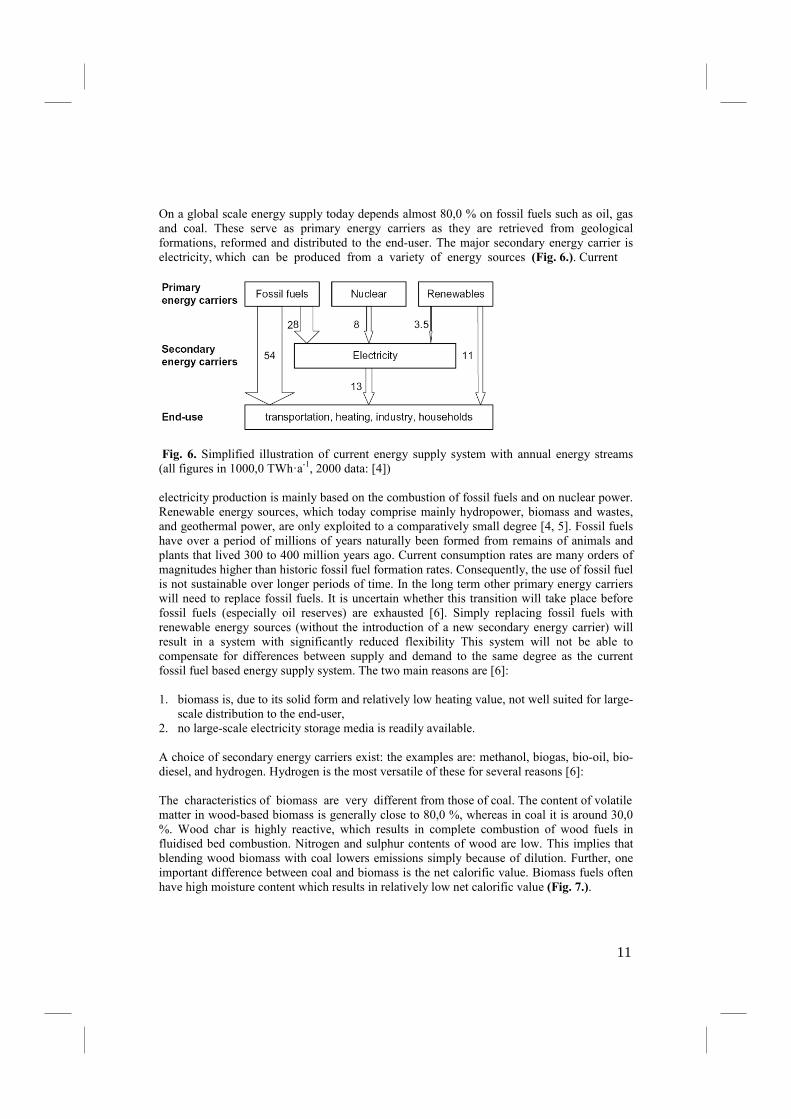
On a global scale energy supply today depends almost 80,0 % on fossil fuels such as oil, gas and coal. These serve as primary energy carriers as they are retrieved from geological formations, reformed and distributed to the end-user. The major secondary energy carrier is electricity, which can be produced from a variety of energy sources (Fig. 6.). Current
Fig. 6. Simplified illustration of current energy supply system with annual energy streams (all figures in 1000,0 TWh·a-1, 2000 data: [4]) electricity production is mainly based on the combustion of fossil fuels and on nuclear power. Renewable energy sources, which today comprise mainly hydropower, biomass and wastes, and geothermal power, are only exploited to a comparatively small degree [4, 5]. Fossil fuels have over a period of millions of years naturally been formed from remains of animals and plants that lived 300 to 400 million years ago. Current consumption rates are many orders of magnitudes higher than historic fossil fuel formation rates. Consequently, the use of fossil fuel is not sustainable over longer periods of time. In the long term other primary energy carriers will need to replace fossil fuels. It is uncertain whether this transition will take place before fossil fuels (especially oil reserves) are exhausted [6]. Simply replacing fossil fuels with renewable energy sources (without the introduction of a new secondary energy carrier) will result in a system with significantly reduced flexibility This system will not be able to compensate for differences between supply and demand to the same degree as the current fossil fuel based energy supply system. The two main reasons are [6]: 1. biomass is, due to its solid form and relatively low heating value, not well suited for large- scale distribution to the end-user, 2. no large-scale electricity storage media is readily available. A choice of secondary energy carriers exist: the examples are: methanol, biogas, bio-oil, bio-diesel, and hydrogen. Hydrogen is the most versatile of these for several reasons [6]: The characteristics of biomass are very different from those of coal. The content of volatile matter in wood-based biomass is generally close to 80,0 %, whereas in coal it is around 30,0 %. Wood char is highly reactive, which results in complete combustion of wood fuels in fluidised bed combustion. Nitrogen and sulphur contents of wood are low. This implies that blending wood biomass with coal lowers emissions simply because of dilution. Further, one important difference between coal and biomass is the net calorific value. Biomass fuels often have high moisture content which results in relatively low net calorific value (Fig. 7.).
11
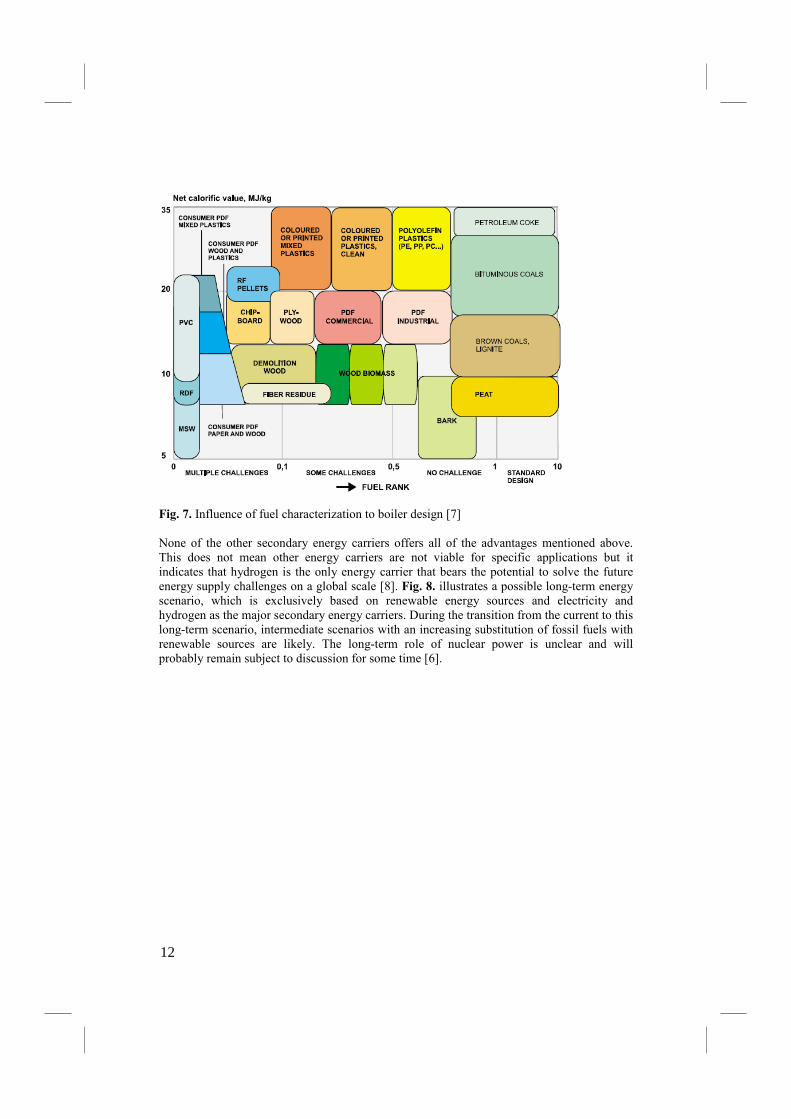
Fig. 7. Influence of fuel characterization to boiler design [7] None of the other secondary energy carriers offers all of the advantages mentioned above. This does not mean other energy carriers are not viable for specific applications but it indicates that hydrogen is the only energy carrier that bears the potential to solve the future energy supply challenges on a global scale [8]. Fig. 8. illustrates a possible long-term energy scenario, which is exclusively based on renewable energy sources and electricity and hydrogen as the major secondary energy carriers. During the transition from the current to this long-term scenario, intermediate scenarios with an increasing substitution of fossil fuels with renewable sources are likely. The long-term role of nuclear power is unclear and will probably remain subject to discussion for some time [6].
12
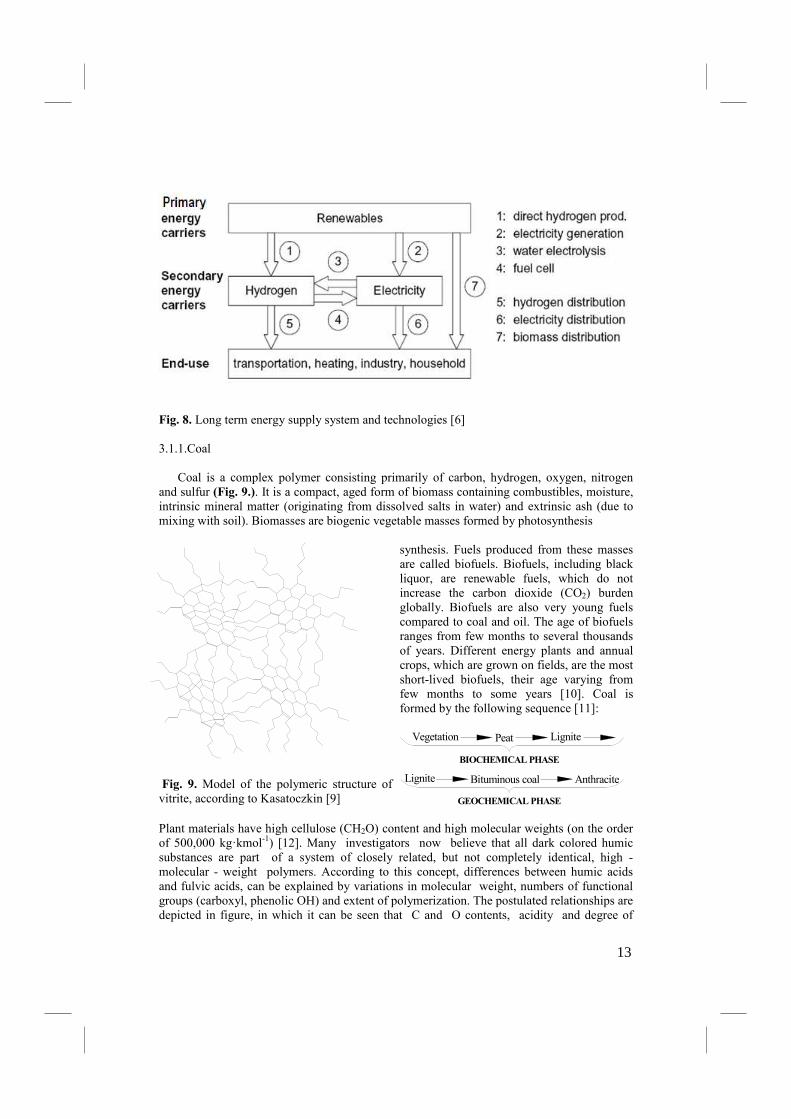
Fig. 8. Long term energy supply system and technologies [6]
3.1.1.Coal Coal is a complex polymer consisting primarily of carbon, hydrogen, oxygen, nitrogen and sulfur (Fig. 9.). It is a compact, aged form of biomass containing combustibles, moisture, intrinsic mineral matter (originating from dissolved salts in water) and extrinsic ash (due to mixing with soil). Biomasses are biogenic vegetable masses formed by photosynthesis
Fig. 9. Model of the polymeric structure of vitrite, according to Kasatoczkin [9]
synthesis. Fuels produced from these masses are called biofuels. Biofuels, including black liquor, are renewable fuels, which do not increase the carbon dioxide (CO2) burden globally. Biofuels are also very young fuels compared to coal and oil. The age of biofuels ranges from few months to several thousands of years. Different energy plants and annual crops, which are grown on fields, are the most short-lived biofuels, their age varying from few months to some years [10]. Coal is formed by the following sequence [11]:
Vegetation Peat Lignite
Lignite Bituminous coal Anthracite
BIOCHEMICAL PHASE
GEOCHEMICAL PHASE Plant materials have high cellulose (CH2O) content and high molecular weights (on the order of 500,000 kg·kmol-1) [12]. Many investigators now believe that all dark colored humic substances are part of a system of closely related, but not completely identical, high - molecular - weight polymers. According to this concept, differences between humic acids and fulvic acids, can be explained by variations in molecular weight, numbers of functional groups (carboxyl, phenolic OH) and extent of polymerization. The postulated relationships are depicted in figure, in which it can be seen that C and O contents, acidity and degree of
13
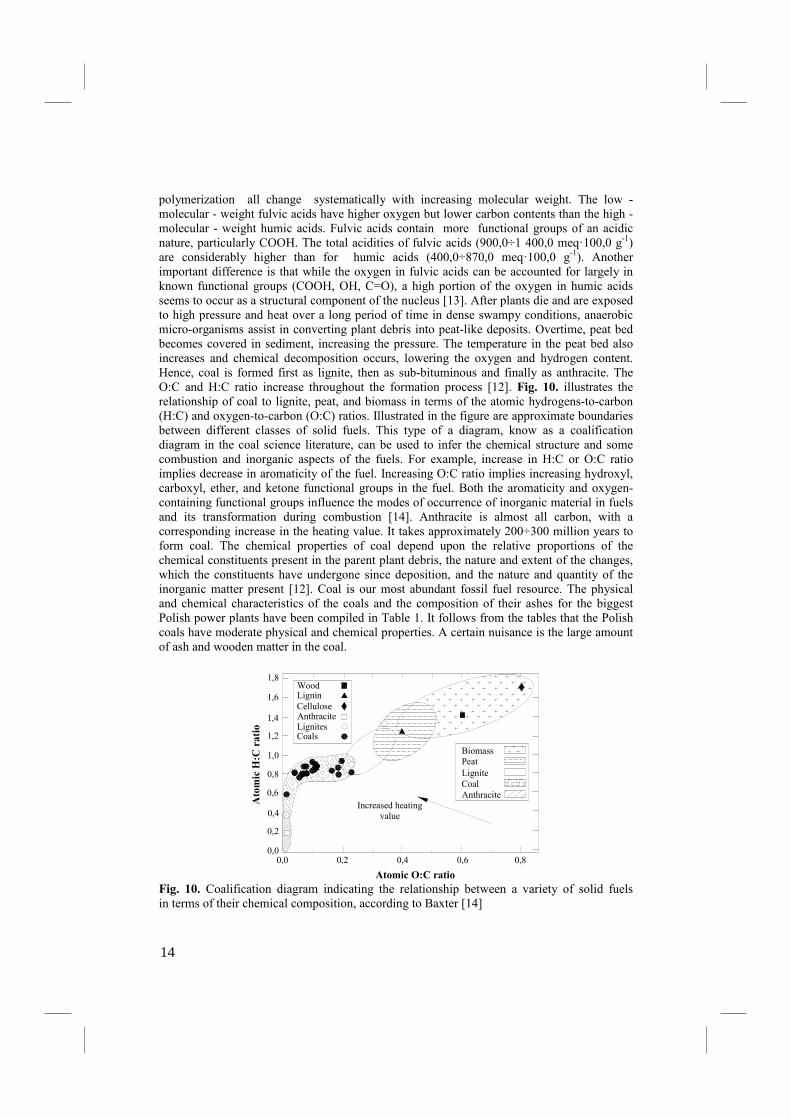
polymerization all change systematically with increasing molecular weight. The low - molecular - weight fulvic acids have higher oxygen but lower carbon contents than the high - molecular - weight humic acids. Fulvic acids contain more functional groups of an acidic nature, particularly COOH. The total acidities of fulvic acids (900,0÷1 400,0 meq·100,0 g-1) are considerably higher than for humic acids (400,0÷870,0 meq·100,0 g-1). Another important difference is that while the oxygen in fulvic acids can be accounted for largely in known functional groups (COOH, OH, C=O), a high portion of the oxygen in humic acids seems to occur as a structural component of the nucleus [13]. After plants die and are exposed to high pressure and heat over a long period of time in dense swampy conditions, anaerobic micro-organisms assist in converting plant debris into peat-like deposits. Overtime, peat bed becomes covered in sediment, increasing the pressure. The temperature in the peat bed also increases and chemical decomposition occurs, lowering the oxygen and hydrogen content. Hence, coal is formed first as lignite, then as sub-bituminous and finally as anthracite. The O:C and H:C ratio increase throughout the formation process [12]. Fig. 10. illustrates the relationship of coal to lignite, peat, and biomass in terms of the atomic hydrogens-to-carbon (H:C) and oxygen-to-carbon (O:C) ratios. Illustrated in the figure are approximate boundaries between different classes of solid fuels. This type of a diagram, know as a coalification diagram in the coal science literature, can be used to infer the chemical structure and some combustion and inorganic aspects of the fuels. For example, increase in H:C or O:C ratio implies decrease in aromaticity of the fuel. Increasing O:C ratio implies increasing hydroxyl, carboxyl, ether, and ketone functional groups in the fuel. Both the aromaticity and oxygen-containing functional groups influence the modes of occurrence of inorganic material in fuels and its transformation during combustion [14]. Anthracite is almost all carbon, with a corresponding increase in the heating value. It takes approximately 200÷300 million years to form coal. The chemical properties of coal depend upon the relative proportions of the chemical constituents present in the parent plant debris, the nature and extent of the changes, which the constituents have undergone since deposition, and the nature and quantity of the inorganic matter present [12]. Coal is our most abundant fossil fuel resource. The physical and chemical characteristics of the coals and the composition of their ashes for the biggest Polish power plants have been compiled in Table 1. It follows from the tables that the Polish coals have moderate physical and chemical properties. A certain nuisance is the large amount of ash and wooden matter in the coal.
1,6
1,8
1,2
1,0
1,4
0,2
0,4
0,6
0,8
0,00,0 0,2 0,4 0,6 0,8
Atomic O:C ratio
Wood
CoalsLignitesAnthraciteCelluloseLignin
Increased heating value
AnthraciteCoalLignitePeatBiomass
Atomic H:C ratio
Fig. 10. Coalification diagram indicating the relationship between a variety of solid fuels in terms of their chemical composition, according to Baxter [14]
14
Classical view of the combustion of coal particles
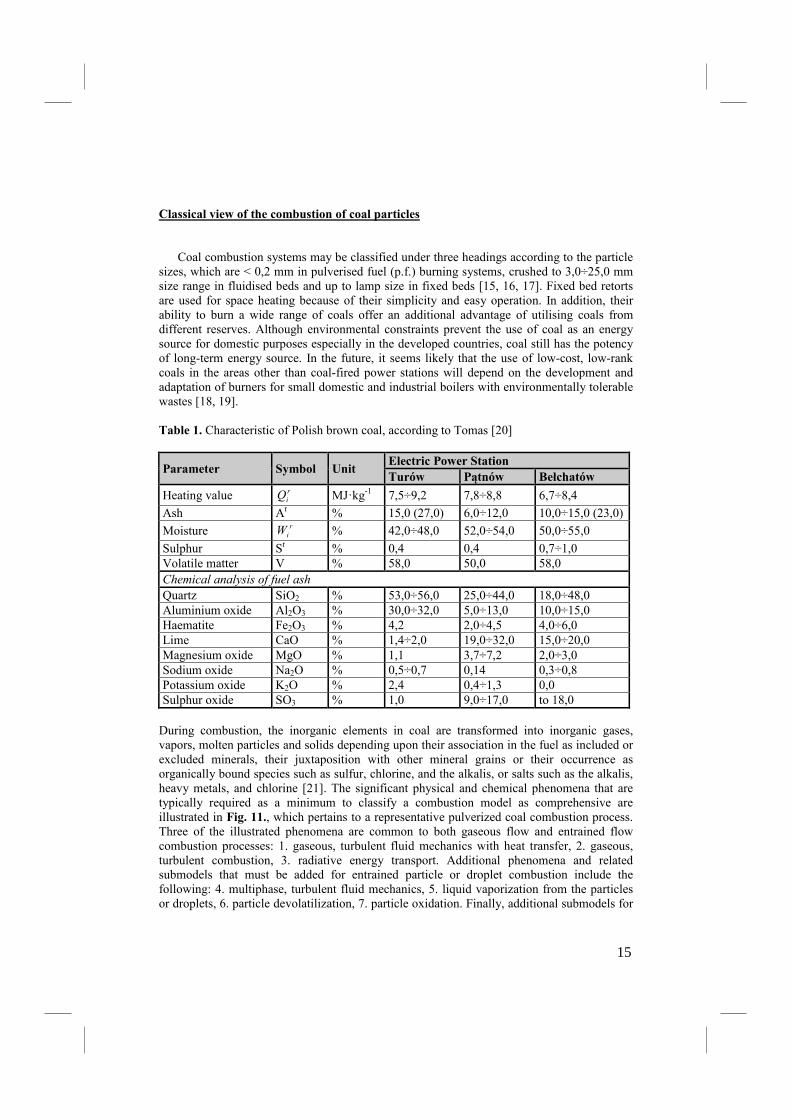
Coal combustion systems may be classified under three headings according to the particle sizes, which are < 0,2 mm in pulverised fuel (p.f.) burning systems, crushed to 3,0÷25,0 mm size range in fluidised beds and up to lamp size in fixed beds [15, 16, 17]. Fixed bed retorts are used for space heating because of their simplicity and easy operation. In addition, their ability to burn a wide range of coals offer an additional advantage of utilising coals from different reserves. Although environmental constraints prevent the use of coal as an energy source for domestic purposes especially in the developed countries, coal still has the potency of long-term energy source. In the future, it seems likely that the use of low-cost, low-rank coals in the areas other than coal-fired power stations will depend on the development and adaptation of burners for small domestic and industrial boilers with environmentally tolerable wastes [18, 19]. Table 1. Characteristic of Polish brown coal, according to Tomas [20]
Parameter Symbol Unit Electric Power Station
Turów Pątnów Bełchatów
Heating value r
iQ MJ·kg-1 7,5÷9,2 7,8÷8,8 6,7÷8,4
Ash Ar % 15,0 (27,0) 6,0÷12,0 10,0÷15,0 (23,0)
Moisture r
iW % 42,0÷48,0 52,0÷54,0 50,0÷55,0
Sulphur Sr % 0,4 0,4 0,7÷1,0 Volatile matter V % 58,0 50,0 58,0 Chemical analysis of fuel ash
Quartz SiO2 % 53,0÷56,0 25,0÷44,0 18,0÷48,0 Aluminium oxide Al2O3 % 30,0÷32,0 5,0÷13,0 10,0÷15,0 Haematite Fe2O3 % 4,2 2,0÷4,5 4,0÷6,0 Lime CaO % 1,4÷2,0 19,0÷32,0 15,0÷20,0 Magnesium oxide MgO % 1,1 3,7÷7,2 2,0÷3,0 Sodium oxide Na2O % 0,5÷0,7 0,14 0,3÷0,8 Potassium oxide K2O % 2,4 0,4÷1,3 0,0 Sulphur oxide SO3 % 1,0 9,0÷17,0 to 18,0 During combustion, the inorganic elements in coal are transformed into inorganic gases, vapors, molten particles and solids depending upon their association in the fuel as included or excluded minerals, their juxtaposition with other mineral grains or their occurrence as organically bound species such as sulfur, chlorine, and the alkalis, or salts such as the alkalis, heavy metals, and chlorine [21]. The significant physical and chemical phenomena that are typically required as a minimum to classify a combustion model as comprehensive are illustrated in Fig. 11., which pertains to a representative pulverized coal combustion process. Three of the illustrated phenomena are common to both gaseous flow and entrained flow combustion processes: 1. gaseous, turbulent fluid mechanics with heat transfer, 2. gaseous, turbulent combustion, 3. radiative energy transport. Additional phenomena and related submodels that must be added for entrained particle or droplet combustion include the following: 4. multiphase, turbulent fluid mechanics, 5. liquid vaporization from the particles or droplets, 6. particle devolatilization, 7. particle oxidation. Finally, additional submodels for
15
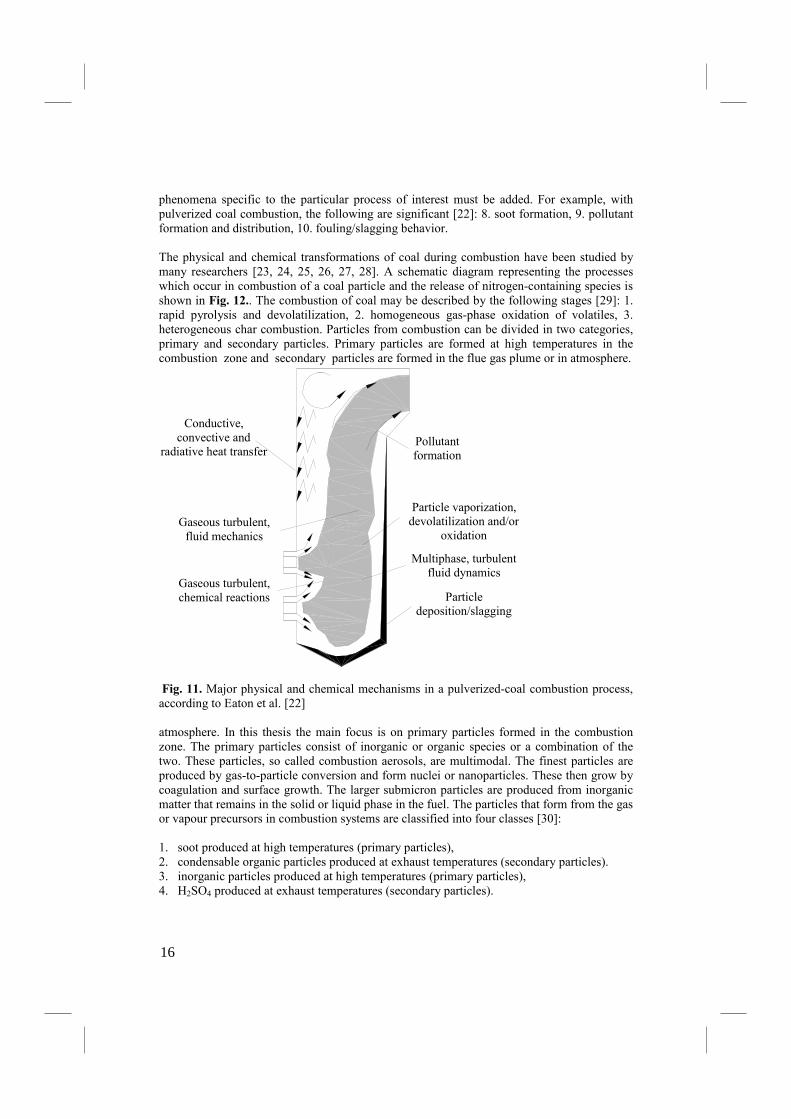
phenomena specific to the particular process of interest must be added. For example, with pulverized coal combustion, the following are significant [22]: 8. soot formation, 9. pollutant formation and distribution, 10. fouling/slagging behavior. The physical and chemical transformations of coal during combustion have been studied by many researchers [23, 24, 25, 26, 27, 28]. A schematic diagram representing the processes which occur in combustion of a coal particle and the release of nitrogen-containing species is shown in Fig. 12.. The combustion of coal may be described by the following stages [29]: 1. rapid pyrolysis and devolatilization, 2. homogeneous gas-phase oxidation of volatiles, 3. heterogeneous char combustion. Particles from combustion can be divided in two categories, primary and secondary particles. Primary particles are formed at high temperatures in the combustion zone and secondary particles are formed in the flue gas plume or in atmosphere.
Gaseous turbulent, chemical reactions
Gaseous turbulent, fluid mechanics
Conductive, convective and
radiative heat transferPollutant formation
Particle vaporization, devolatilization and/or
oxidation
Multiphase, turbulent fluid dynamics
Particle deposition/slagging
Fig. 11. Major physical and chemical mechanisms in a pulverized-coal combustion process, according to Eaton et al. [22]
atmosphere. In this thesis the main focus is on primary particles formed in the combustion zone. The primary particles consist of inorganic or organic species or a combination of the two. These particles, so called combustion aerosols, are multimodal. The finest particles are produced by gas-to-particle conversion and form nuclei or nanoparticles. These then grow by coagulation and surface growth. The larger submicron particles are produced from inorganic matter that remains in the solid or liquid phase in the fuel. The particles that form from the gas or vapour precursors in combustion systems are classified into four classes [30]: 1. soot produced at high temperatures (primary particles), 2. condensable organic particles produced at exhaust temperatures (secondary particles). 3. inorganic particles produced at high temperatures (primary particles), 4. H2SO4 produced at exhaust temperatures (secondary particles).
16
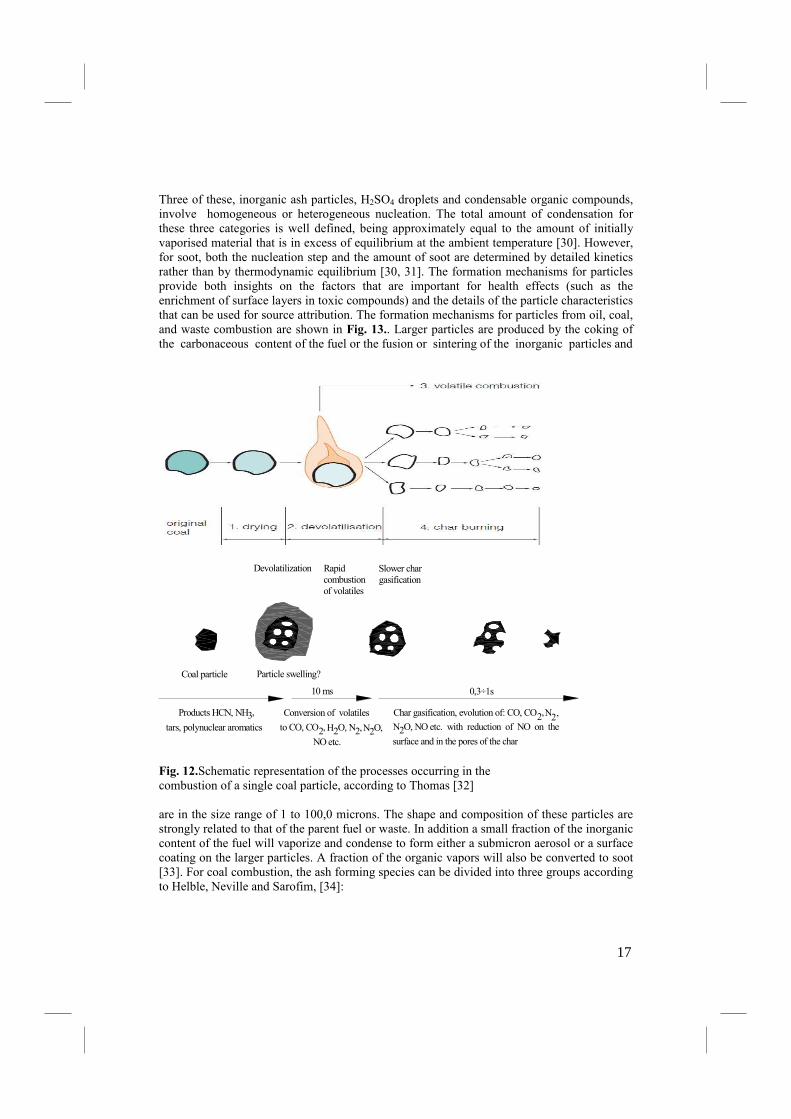
Three of these, inorganic ash particles, H2SO4 droplets and condensable organic compounds, involve homogeneous or heterogeneous nucleation. The total amount of condensation for these three categories is well defined, being approximately equal to the amount of initially vaporised material that is in excess of equilibrium at the ambient temperature [30]. However, for soot, both the nucleation step and the amount of soot are determined by detailed kinetics rather than by thermodynamic equilibrium [30, 31]. The formation mechanisms for particles provide both insights on the factors that are important for health effects (such as the enrichment of surface layers in toxic compounds) and the details of the particle characteristics that can be used for source attribution. The formation mechanisms for particles from oil, coal, and waste combustion are shown in Fig. 13.. Larger particles are produced by the coking of the carbonaceous content of the fuel or the fusion or sintering of the inorganic particles and
Slower char gasification
Rapid combustion of volatiles
Devolatilization
surface and in the pores of the char2O, NO etc. with reduction of NO on theN
N2,,2Char gasification, evolution of: CO, CO
NO etc.
O,2N,2O, N2H,2to CO, CO
Conversion of volatiles,3tars, polynuclear aromatics
Products HCN, NH
0,3÷1s10 ms
Particle swelling?Coal particle
Fig. 12.Schematic representation of the processes occurring in the combustion of a single coal particle, according to Thomas [32] are in the size range of 1 to 100,0 microns. The shape and composition of these particles are strongly related to that of the parent fuel or waste. In addition a small fraction of the inorganic content of the fuel will vaporize and condense to form either a submicron aerosol or a surface coating on the larger particles. A fraction of the organic vapors will also be converted to soot [33]. For coal combustion, the ash forming species can be divided into three groups according to Helble, Neville and Sarofim, [34]:
17
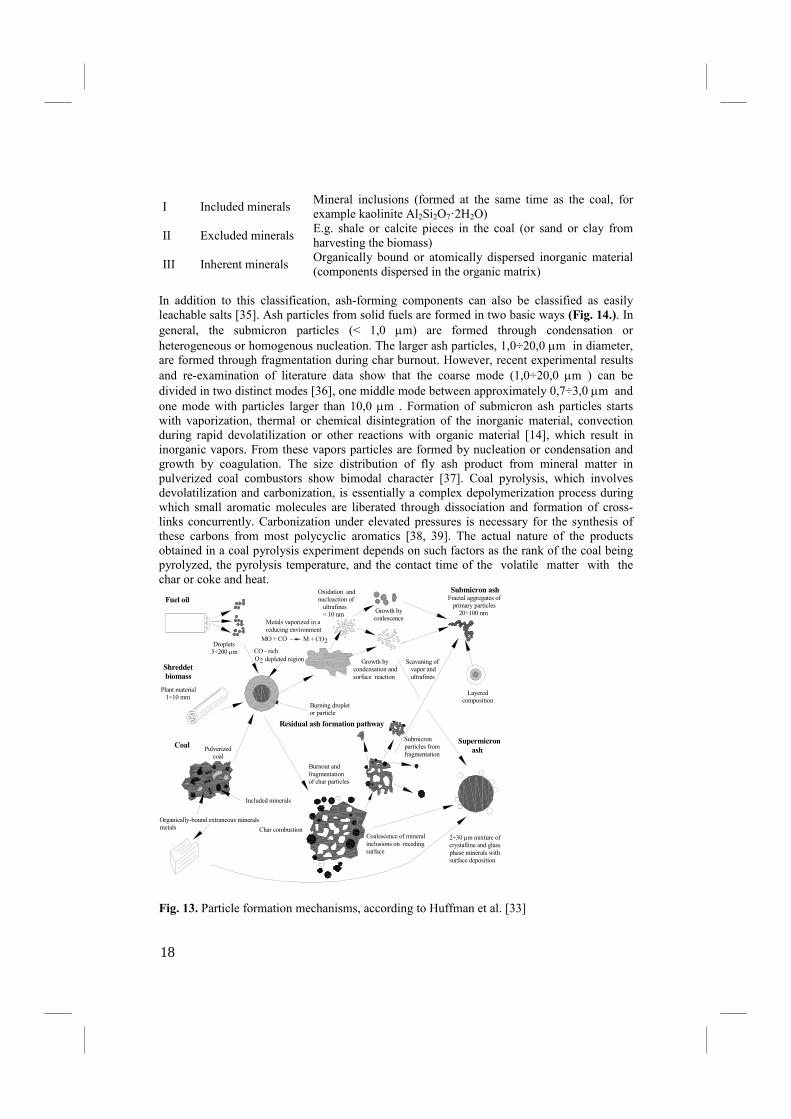
I Included minerals Mineral inclusions (formed at the same time as the coal, for example kaolinite Al2Si2O7·2H2O)
II Excluded minerals E.g. shale or calcite pieces in the coal (or sand or clay from harvesting the biomass)
III Inherent minerals Organically bound or atomically dispersed inorganic material (components dispersed in the organic matrix)
In addition to this classification, ash-forming components can also be classified as easily leachable salts [35]. Ash particles from solid fuels are formed in two basic ways (Fig. 14.). In general, the submicron particles (< 1,0 µm) are formed through condensation or heterogeneous or homogenous nucleation. The larger ash particles, 1,0÷20,0 µm in diameter, are formed through fragmentation during char burnout. However, recent experimental results and re-examination of literature data show that the coarse mode (1,0÷20,0 µm ) can be divided in two distinct modes [36], one middle mode between approximately 0,7÷3,0 µm and one mode with particles larger than 10,0 µm . Formation of submicron ash particles starts with vaporization, thermal or chemical disintegration of the inorganic material, convection during rapid devolatilization or other reactions with organic material [14], which result in inorganic vapors. From these vapors particles are formed by nucleation or condensation and growth by coagulation. The size distribution of fly ash product from mineral matter in pulverized coal combustors show bimodal character [37]. Coal pyrolysis, which involves devolatilization and carbonization, is essentially a complex depolymerization process during which small aromatic molecules are liberated through dissociation and formation of cross-links concurrently. Carbonization under elevated pressures is necessary for the synthesis of these carbons from most polycyclic aromatics [38, 39]. The actual nature of the products obtained in a coal pyrolysis experiment depends on such factors as the rank of the coal being pyrolyzed, the pyrolysis temperature, and the contact time of the volatile matter with the char or coke and heat.
depleted region2OCO - rich
2M + COMO + CO
Metals vaporized in a reducing environment
Scavaning of vapor and ultrafines
Growth by condensation and surface reaction
ParaSiO, Mg i in.
Oxidation and nucleaction of ultrafines < 10 nm
Growth by coalescence
Fractal aggregates of primary particles 20÷100 nm
Submicron ash
Layered composition
Fuel oil
Droplets5÷200 µm
Plant material 1÷10 mm
Shreddet
biomass
Organically-bound extraneous minerals metals
2÷30 µm mixture of crystalline and glass phase minerals with surface deposition
Coal Pulverized coal
Included minerals
Supermicron
ash
Burning dropletor particle
Residual ash formation pathway
Submicron particles from fragmentation
Burnout and fragmentation of char particles
Coalescence of mineral inclusions on receding surface
Char combustion
Fig. 13. Particle formation mechanisms, according to Huffman et al. [33]
18
Decreasing temperature
Submicron particles (0,1 µm)
Coagulation
Agglomerated ash (0,1÷1,0 µm)
Residual fly ash (1,0÷20 µm)
Heterogeneous condensation
Nucleaction
Inorganic vapors
Char burnout
Vaporization
Fragmenting char
Ash particle
Char particle
Mineral inclusion
Coal particle
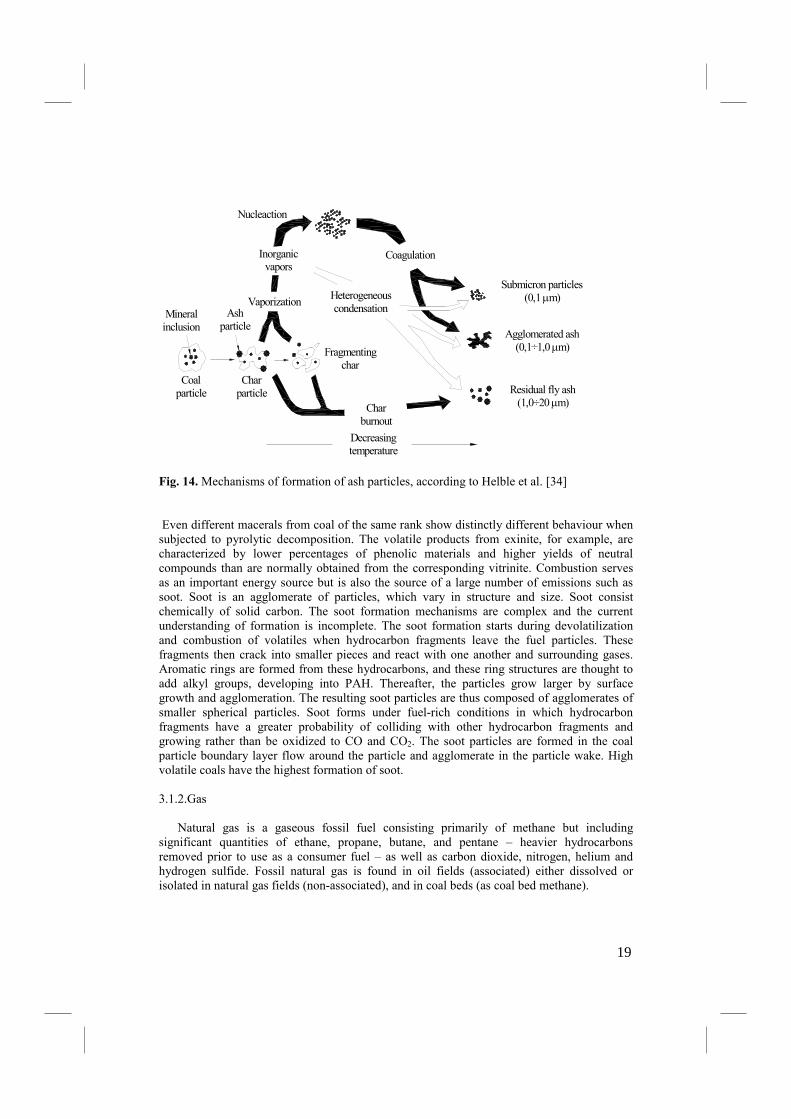
Fig. 14. Mechanisms of formation of ash particles, according to Helble et al. [34] Even different macerals from coal of the same rank show distinctly different behaviour when subjected to pyrolytic decomposition. The volatile products from exinite, for example, are characterized by lower percentages of phenolic materials and higher yields of neutral compounds than are normally obtained from the corresponding vitrinite. Combustion serves as an important energy source but is also the source of a large number of emissions such as soot. Soot is an agglomerate of particles, which vary in structure and size. Soot consist chemically of solid carbon. The soot formation mechanisms are complex and the current understanding of formation is incomplete. The soot formation starts during devolatilization and combustion of volatiles when hydrocarbon fragments leave the fuel particles. These fragments then crack into smaller pieces and react with one another and surrounding gases. Aromatic rings are formed from these hydrocarbons, and these ring structures are thought to add alkyl groups, developing into PAH. Thereafter, the particles grow larger by surface growth and agglomeration. The resulting soot particles are thus composed of agglomerates of smaller spherical particles. Soot forms under fuel-rich conditions in which hydrocarbon fragments have a greater probability of colliding with other hydrocarbon fragments and growing rather than be oxidized to CO and CO2. The soot particles are formed in the coal particle boundary layer flow around the particle and agglomerate in the particle wake. High volatile coals have the highest formation of soot. 3.1.2.Gas Natural gas is a gaseous fossil fuel consisting primarily of methane but including significant quantities of ethane, propane, butane, and pentane – heavier hydrocarbons removed prior to use as a consumer fuel – as well as carbon dioxide, nitrogen, helium and hydrogen sulfide. Fossil natural gas is found in oil fields (associated) either dissolved or isolated in natural gas fields (non-associated), and in coal beds (as coal bed methane).
19

When methane-rich gases are produced by the anaerobic decay of non-fossil organic matter (biomass), these are referred to as biogas (or natural biogas). Sources of biogas include swamps, marshes, and landfills, as well as sewage sludge and manure by way of anaerobic digesters, in addition to enteric fermentation particularly in cattle.
Since natural gas is not a pure product, when non-associated gas is extracted from a field under supercritical (pressure/temperature) conditions, it may partially condense upon isothermic depressurizing – an effect called retrograde condensation. The liquids thus formed may get trapped by depositing in the pores of the gas reservoir. One method to deal with this problem is to re-inject dried gas free of condensate to maintain the underground pressure and to allow re-evaporation and extraction of condensates. Natural gas is often informally referred to as simply gas, especially when compared to other energy sources such as electricity. Before natural gas can be used as a fuel, it must undergo extensive processing to remove almost all materials other than methane. The by-products of that processing include ethane, propane, butanes, pentanes and higher molecular weight hydrocarbons, elemental sulfur, and sometimes helium and nitrogen. The image below is a schematic block flow diagram (Fig. 15.) of a typical natural gas processing plant. It shows the various unit processes used to convert raw natural gas into sales gas pipelined to the end user markets. The block flow diagram also shows how processing of the raw natural gas yields byproduct sulfur, byproduct ethane, and natural gas liquids (NGL) propane, butanes and natural gasoline. Natural gas is a major source of electricity generation through the use of gas turbines and steam turbines. Particularly high efficiencies can be achieved through combining gas turbines with a steam turbine in combined cycle mode. Natural gas burns cleaner than other fossil fuels, such as oil and coal, and produces less carbon dioxide per unit energy released. For an equivalent amount of heat, burning natural gas produces about 30,0 % less carbon dioxide than burning petroleum and about 45,0 % less than burning coal. Combined cycle power generation using natural gas is thus the cleanest source of power available using fossil fuels, and this technology is widely used wherever gas can be obtained at a reasonable cost. Fuel cell technology may eventually provide cleaner options for converting natural gas into electricity, but as yet it is not price-competitive. Current fossil fuels consumption rates are many orders of magnitudes higher than historic fossil fuel formation rates. Thus necessity to produce secondary energy carriers became very important for the future. A choice of a secondary energy carriers exist: examples are: methanol, biogas, bio-oil, bio-diesel, and hydrogen. Hydrogen is the most versatile of these for several reasons: - hydrogen can be produced from virtually all other energy carriers - hydrogen offers possibilities for electricity production by fuel cell and its storage - hydrogen allows virtually emission-free end-use
20
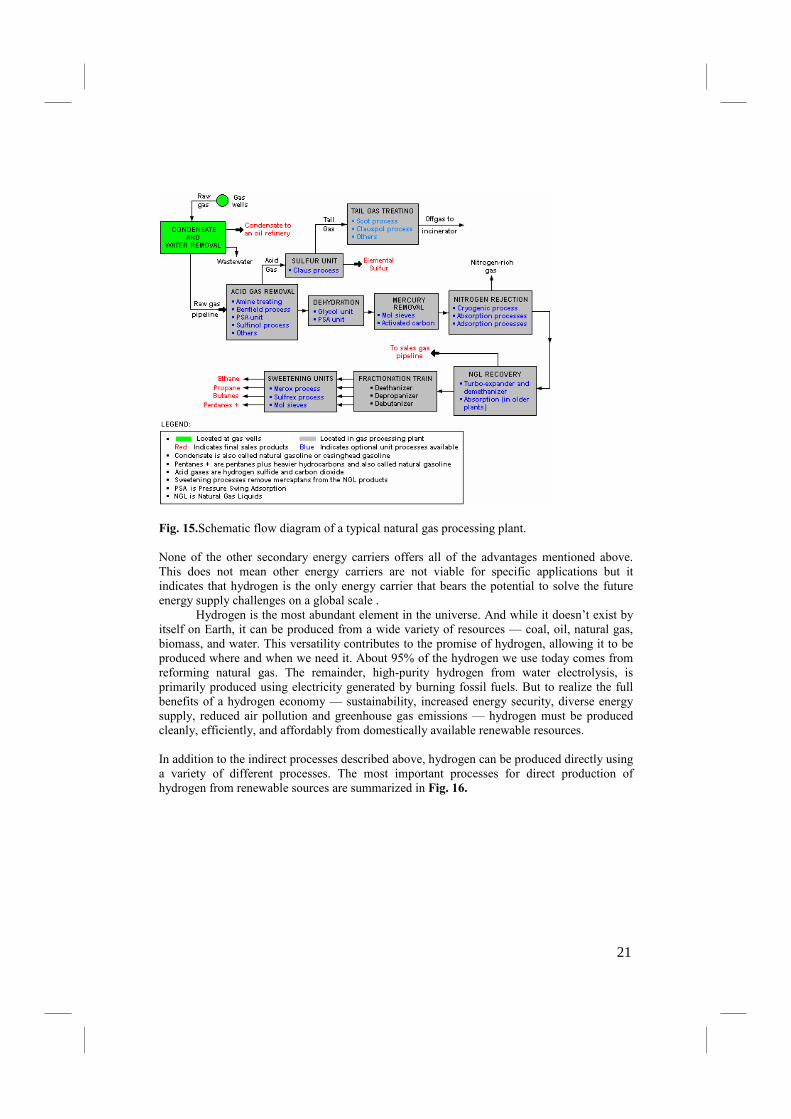
Fig. 15.Schematic flow diagram of a typical natural gas processing plant. None of the other secondary energy carriers offers all of the advantages mentioned above. This does not mean other energy carriers are not viable for specific applications but it indicates that hydrogen is the only energy carrier that bears the potential to solve the future energy supply challenges on a global scale .
Hydrogen is the most abundant element in the universe. And while it doesn’t exist by itself on Earth, it can be produced from a wide variety of resources — coal, oil, natural gas, biomass, and water. This versatility contributes to the promise of hydrogen, allowing it to be produced where and when we need it. About 95% of the hydrogen we use today comes from reforming natural gas. The remainder, high-purity hydrogen from water electrolysis, is primarily produced using electricity generated by burning fossil fuels. But to realize the full benefits of a hydrogen economy — sustainability, increased energy security, diverse energy supply, reduced air pollution and greenhouse gas emissions — hydrogen must be produced cleanly, efficiently, and affordably from domestically available renewable resources. In addition to the indirect processes described above, hydrogen can be produced directly using a variety of different processes. The most important processes for direct production of hydrogen from renewable sources are summarized in Fig. 16.
21
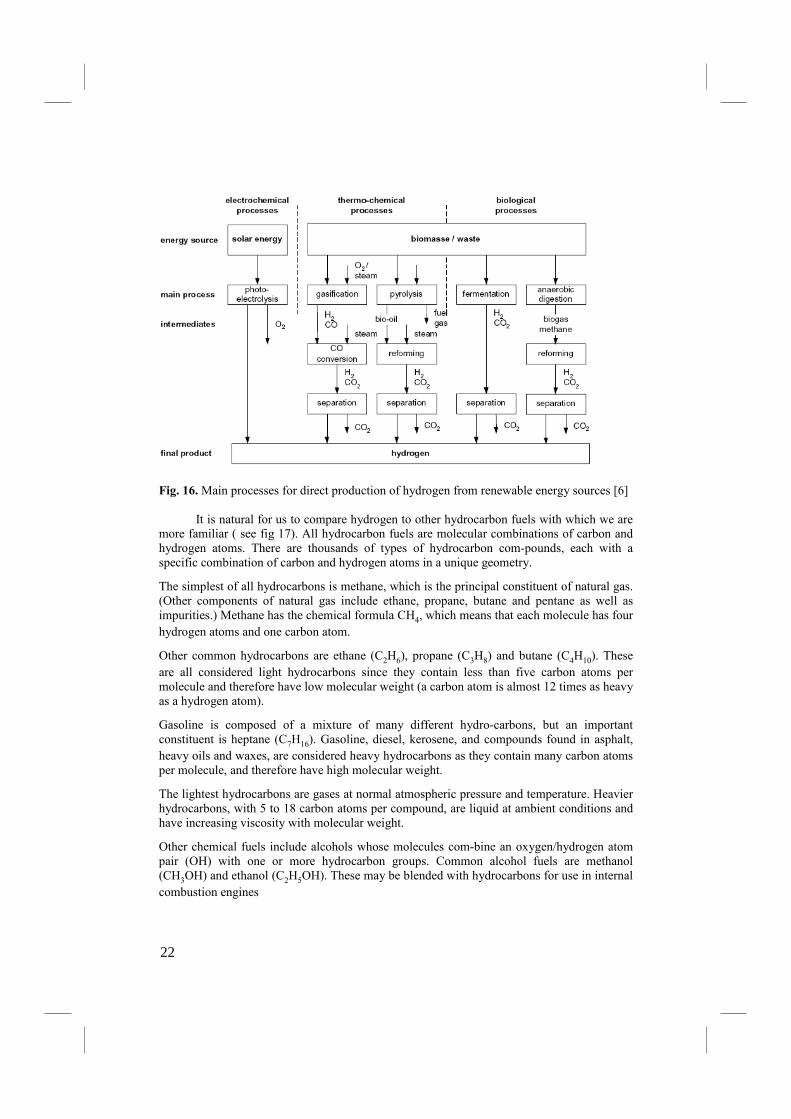
Fig. 16. Main processes for direct production of hydrogen from renewable energy sources [6]
It is natural for us to compare hydrogen to other hydrocarbon fuels with which we are more familiar ( see fig 17). All hydrocarbon fuels are molecular combinations of carbon and hydrogen atoms. There are thousands of types of hydrocarbon com-pounds, each with a specific combination of carbon and hydrogen atoms in a unique geometry.
The simplest of all hydrocarbons is methane, which is the principal constituent of natural gas. (Other components of natural gas include ethane, propane, butane and pentane as well as impurities.) Methane has the chemical formula CH4, which means that each molecule has four hydrogen atoms and one carbon atom.
Other common hydrocarbons are ethane (C2H6), propane (C3H8) and butane (C4H10). These are all considered light hydrocarbons since they contain less than five carbon atoms per molecule and therefore have low molecular weight (a carbon atom is almost 12 times as heavy as a hydrogen atom).
Gasoline is composed of a mixture of many different hydro-carbons, but an important constituent is heptane (C7H16). Gasoline, diesel, kerosene, and compounds found in asphalt, heavy oils and waxes, are considered heavy hydrocarbons as they contain many carbon atoms per molecule, and therefore have high molecular weight.
The lightest hydrocarbons are gases at normal atmospheric pressure and temperature. Heavier hydrocarbons, with 5 to 18 carbon atoms per compound, are liquid at ambient conditions and have increasing viscosity with molecular weight.
Other chemical fuels include alcohols whose molecules com-bine an oxygen/hydrogen atom pair (OH) with one or more hydrocarbon groups. Common alcohol fuels are methanol (CH3OH) and ethanol (C2H5OH). These may be blended with hydrocarbons for use in internal combustion engines
22

Fig.17. Chemical Structure of Common Fuels
Hydrogen has several unique properties, some quite different from conventional liquid fuels, which are summarized in Table 3.
Table 3.Hydrogen’s properties as a transportation fuel Characteristic Properties
Limits of flammability
Hydrogen has a wide range of flammability in comparison with other fuels. Hydrogen engines, therefore, can be operated more effectively on excessively lean mixtures than gasoline engines. As little as 4,0 % hydrogen by volume with air produces a combustible mixture.
Minimum ignition energy
For hydrogen, the minimum ignition energy is about an order of magnitude less than that required for gasoline. This enables lean mixtures and prompt ignition. However, hydrogen also can be ignited by hot spots on the cylinder.
Quenching gap or distance
The combustion flame typically travels closer to the cylinder wall than a gasoline flame. This can increase the tendency for backfire since the flame can more readily get past a nearly closed intake valve.
Self-ignition temperature The self-ignition temperature is relatively high. This allows larger compression ratios to be used in a hydrogen engine.
Flame speed
The flame speed is nearly an order of magnitude higher than that of gasoline. For stoichiometric mixtures, hydrogen engines can approach the thermodynamically ideal engine cycle. For leaner mixtures, however, flame velocity decreases significantly.
Diffusivity Hydrogen’s ability to disperse in air is considerably greater than gasoline’s.
Density Hydrogen has extremely low density, meaning very large volumes are necessary for storage and combustion.
23
3.1.3. Liquid fuels Liquid fuels are primarily derived from crude oil through cracking and fractional distillation. Cracking is a process by which long-chain hydrocarbons are broken up into smaller molecules. Fractional distillation separates high-boiling-point hydrocarbons from those with lower boiling points. Liquid fuels satisfy a wide range of combustion requirements and are particularly attractive for transportation applications because of their compactness and fluidity. Liquid fuel are those combustible or energy-generating molecules that can be harnessed to create mechanical energy, usually producing kinetic energy; they also must take the shape of their container. Most liquid fuels, in widespread use, are or derived from fossil fuel; however, there are several types, such as hydrogen fuel (for automotive uses), which are also categorized as a liquid fuel. It is the fumes of liquid fuels that are flammable instead of the fluid. Fossil fuels are also generally liquid fuels. The most notable of these is gasoline. Although unproven, it is generally accepted that they formed from the fossilized remains of dead plants and animals by exposure to heat and pressure in the Earth's crust over hundreds of millions of years; this is known as the biogenic theory and was first introduced by Mikhail Lomonosov in 1757. There is an opposing theory that the more volatile hydrocarbons, especially natural gas, are formed by biogenic processes, that is no living material was involved in their formation. The development of compact, efficient fuel processors to generate hydrogen is critical to the deployment of PEM fuel cell power systems. These fuel processors must have the ability to convert conventional fossil fuels, for which a supply and distribution infrastructure already exists. Further, the use of fuel cells in automotive applications requires that the fuel processing system be small, lightweight and modular in nature. Fig. 18. is a schematic of a typical fuel processing system for a PEM fuel cell. The first step in this process involves vaporization of a liquid hydrogen fuel such as methanol, ethanol, gasoline, diesel, mixtures of these, or others. Once fully vaporized, the hydrocarbon fuel is converted to syngas, a mixture of carbon monoxide and hydrogen. Options for this primary conversion step include partial oxidation, steam reforming or autothermal reforming. Since carbon monoxide (CO) poisons the fuel cell, the next step involves secondary conversion of CO to CO2 in a water-gas shift reactor, which has the added benefit of increasing the hydrogen content of the fuel stream. Additional CO removal to concentrations below 10-ppm is achieved in a third reactor using preferential oxidation or CO absorption. Each of the reported systems is based upon conventional fixed-bed reactor technology, which does not scale linearly with throughput because of inefficient heat and mass transfer. These conventional fuel processors are expected to be at least an order of magnitude larger than the microchannel-based fuel processor.
24
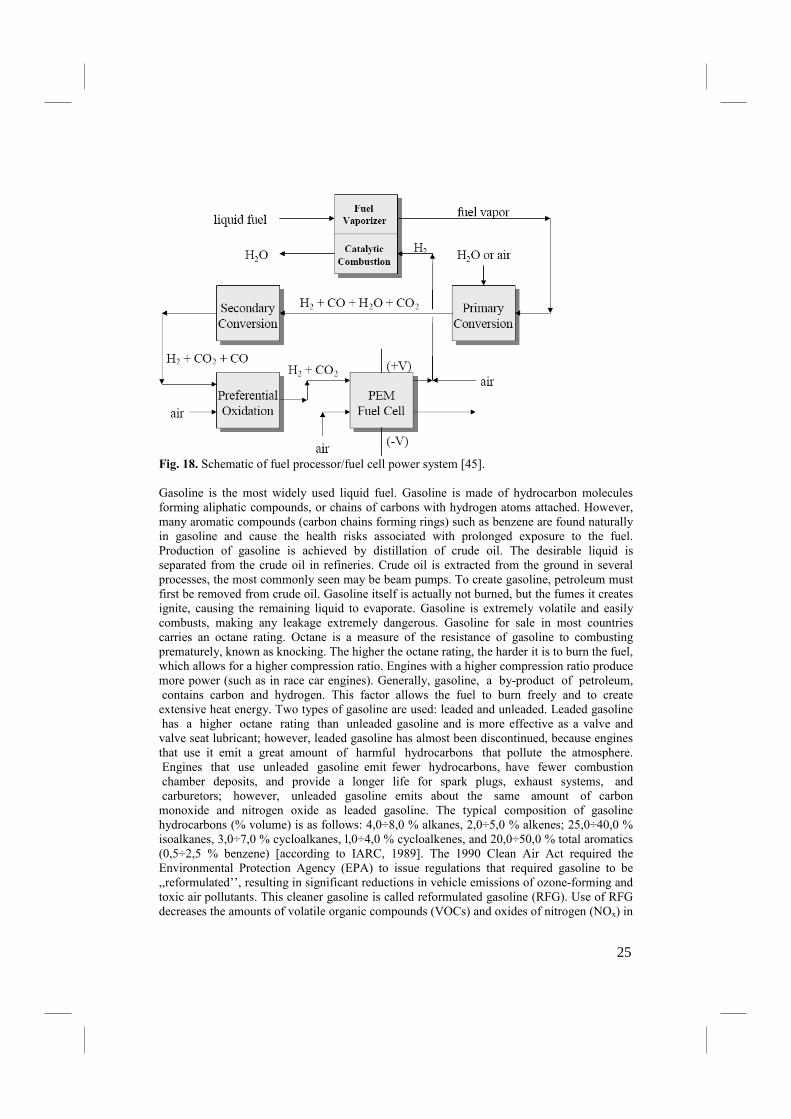
Fig. 18. Schematic of fuel processor/fuel cell power system [45]. Gasoline is the most widely used liquid fuel. Gasoline is made of hydrocarbon molecules forming aliphatic compounds, or chains of carbons with hydrogen atoms attached. However, many aromatic compounds (carbon chains forming rings) such as benzene are found naturally in gasoline and cause the health risks associated with prolonged exposure to the fuel. Production of gasoline is achieved by distillation of crude oil. The desirable liquid is separated from the crude oil in refineries. Crude oil is extracted from the ground in several processes, the most commonly seen may be beam pumps. To create gasoline, petroleum must first be removed from crude oil. Gasoline itself is actually not burned, but the fumes it creates ignite, causing the remaining liquid to evaporate. Gasoline is extremely volatile and easily combusts, making any leakage extremely dangerous. Gasoline for sale in most countries carries an octane rating. Octane is a measure of the resistance of gasoline to combusting prematurely, known as knocking. The higher the octane rating, the harder it is to burn the fuel, which allows for a higher compression ratio. Engines with a higher compression ratio produce more power (such as in race car engines). Generally, gasoline, a by-product of petroleum, contains carbon and hydrogen. This factor allows the fuel to burn freely and to create extensive heat energy. Two types of gasoline are used: leaded and unleaded. Leaded gasoline has a higher octane rating than unleaded gasoline and is more effective as a valve and valve seat lubricant; however, leaded gasoline has almost been discontinued, because engines that use it emit a great amount of harmful hydrocarbons that pollute the atmosphere. Engines that use unleaded gasoline emit fewer hydrocarbons, have fewer combustion chamber deposits, and provide a longer life for spark plugs, exhaust systems, and carburetors; however, unleaded gasoline emits about the same amount of carbon monoxide and nitrogen oxide as leaded gasoline. The typical composition of gasoline hydrocarbons (% volume) is as follows: 4,0÷8,0 % alkanes, 2,0÷5,0 % alkenes; 25,0÷40,0 % isoalkanes, 3,0÷7,0 % cycloalkanes, l,0÷4,0 % cycloalkenes, and 20,0÷50,0 % total aromatics (0,5÷2,5 % benzene) [according to IARC, 1989]. The 1990 Clean Air Act required the Environmental Protection Agency (EPA) to issue regulations that required gasoline to be ,,reformulated’’, resulting in significant reductions in vehicle emissions of ozone-forming and toxic air pollutants. This cleaner gasoline is called reformulated gasoline (RFG). Use of RFG decreases the amounts of volatile organic compounds (VOCs) and oxides of nitrogen (NOx) in
25
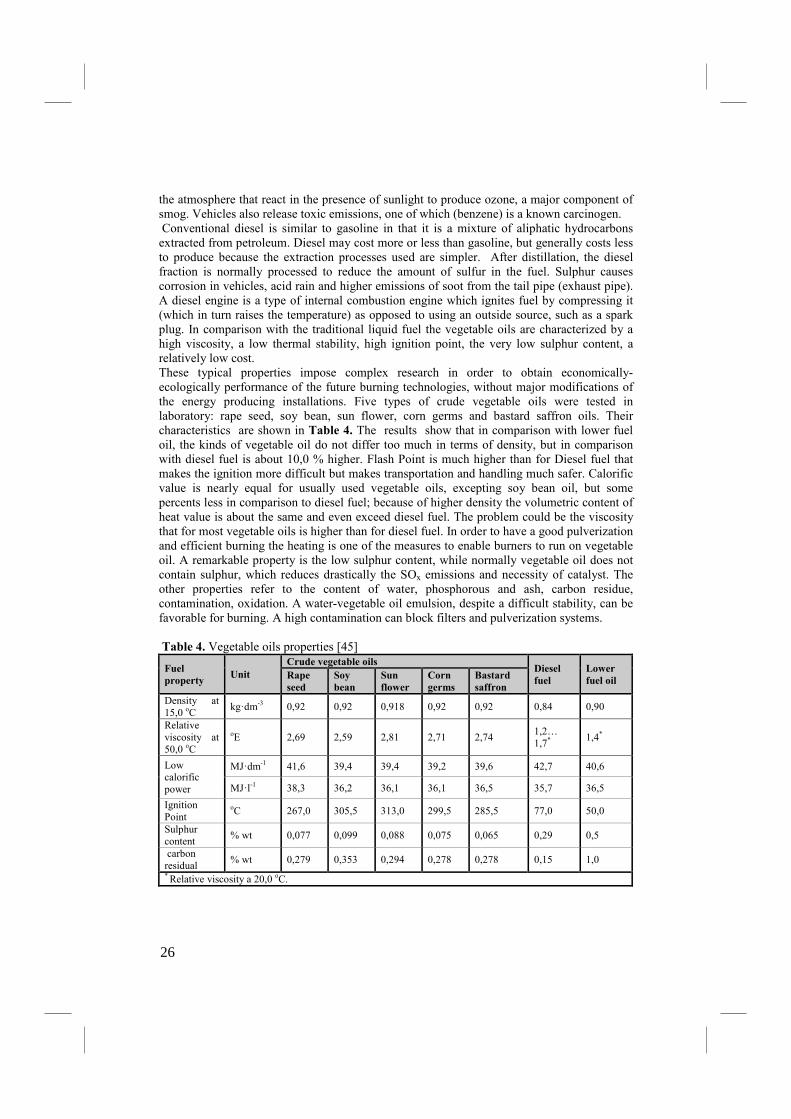
the atmosphere that react in the presence of sunlight to produce ozone, a major component of smog. Vehicles also release toxic emissions, one of which (benzene) is a known carcinogen. Conventional diesel is similar to gasoline in that it is a mixture of aliphatic hydrocarbons extracted from petroleum. Diesel may cost more or less than gasoline, but generally costs less to produce because the extraction processes used are simpler. After distillation, the diesel fraction is normally processed to reduce the amount of sulfur in the fuel. Sulphur causes corrosion in vehicles, acid rain and higher emissions of soot from the tail pipe (exhaust pipe). A diesel engine is a type of internal combustion engine which ignites fuel by compressing it (which in turn raises the temperature) as opposed to using an outside source, such as a spark plug. In comparison with the traditional liquid fuel the vegetable oils are characterized by a high viscosity, a low thermal stability, high ignition point, the very low sulphur content, a relatively low cost. These typical properties impose complex research in order to obtain economically-ecologically performance of the future burning technologies, without major modifications of the energy producing installations. Five types of crude vegetable oils were tested in laboratory: rape seed, soy bean, sun flower, corn germs and bastard saffron oils. Their characteristics are shown in Table 4. The results show that in comparison with lower fuel oil, the kinds of vegetable oil do not differ too much in terms of density, but in comparison with diesel fuel is about 10,0 % higher. Flash Point is much higher than for Diesel fuel that makes the ignition more difficult but makes transportation and handling much safer. Calorific value is nearly equal for usually used vegetable oils, excepting soy bean oil, but some percents less in comparison to diesel fuel; because of higher density the volumetric content of heat value is about the same and even exceed diesel fuel. The problem could be the viscosity that for most vegetable oils is higher than for diesel fuel. In order to have a good pulverization and efficient burning the heating is one of the measures to enable burners to run on vegetable oil. A remarkable property is the low sulphur content, while normally vegetable oil does not contain sulphur, which reduces drastically the SOx emissions and necessity of catalyst. The other properties refer to the content of water, phosphorous and ash, carbon residue, contamination, oxidation. A water-vegetable oil emulsion, despite a difficult stability, can be favorable for burning. A high contamination can block filters and pulverization systems.
Table 4. Vegetable oils properties [45]
Fuel
property Unit
Crude vegetable oils Diesel
fuel
Lower
fuel oil Rape
seed
Soy
bean
Sun
flower
Corn
germs
Bastard
saffron
Density at 15,0 oC
kg·dm-3 0,92 0,92 0,918 0,92 0,92 0,84 0,90
Relative viscosity at 50,0 oC
oE 2,69 2,59 2,81 2,71 2,74 1,2… 1,7*
1,4*
Low calorific power
MJ·dm-1 41,6 39,4 39,4 39,2 39,6 42,7 40,6
MJ·l-1 38,3 36,2 36,1 36,1 36,5 35,7 36,5
Ignition Point
oC 267,0 305,5 313,0 299,5 285,5 77,0 50,0
Sulphur content
% wt 0,077 0,099 0,088 0,075 0,065 0,29 0,5
carbon residual
% wt 0,279 0,353 0,294 0,278 0,278 0,15 1,0
* Relative viscosity a 20,0 oC.
26
Biodiesel is similar to diesel, but has differences akin to those between petrol and ethanol. For instance, biodiesel has a higher cetane rating (45,0÷60,0 compared to 45,0÷50,0 for crude-oil-derived diesel) and it acts as a cleaning agent to get rid of dirt and deposits. Generally, biodiesel is composed of long-chain fatty acids with an alcohol attached, often derived from vegetable oils. It is produced through the reaction of a vegetable oil with methyl alcohol or ethyl alcohol in the presence of a catalyst. Animal fats are another potential source.
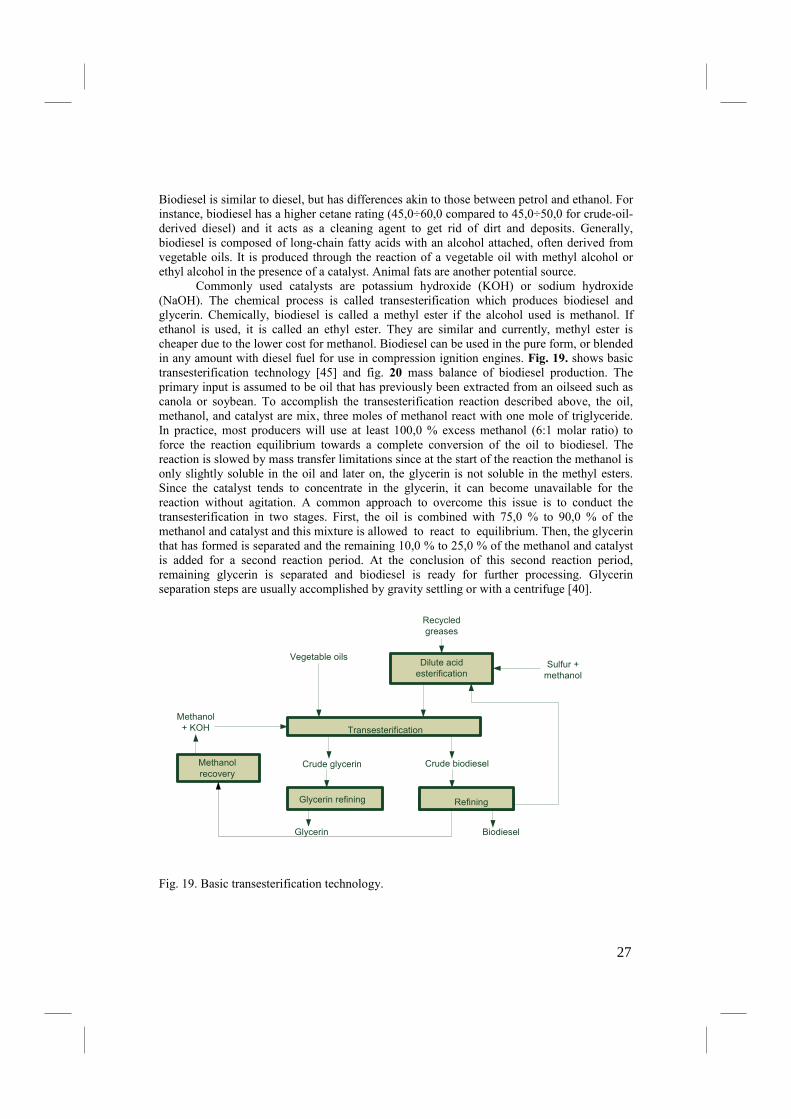
Commonly used catalysts are potassium hydroxide (KOH) or sodium hydroxide (NaOH). The chemical process is called transesterification which produces biodiesel and glycerin. Chemically, biodiesel is called a methyl ester if the alcohol used is methanol. If ethanol is used, it is called an ethyl ester. They are similar and currently, methyl ester is cheaper due to the lower cost for methanol. Biodiesel can be used in the pure form, or blended in any amount with diesel fuel for use in compression ignition engines. Fig. 19. shows basic transesterification technology [45] and fig. 20 mass balance of biodiesel production. The primary input is assumed to be oil that has previously been extracted from an oilseed such as canola or soybean. To accomplish the transesterification reaction described above, the oil, methanol, and catalyst are mix, three moles of methanol react with one mole of triglyceride. In practice, most producers will use at least 100,0 % excess methanol (6:1 molar ratio) to force the reaction equilibrium towards a complete conversion of the oil to biodiesel. The reaction is slowed by mass transfer limitations since at the start of the reaction the methanol is only slightly soluble in the oil and later on, the glycerin is not soluble in the methyl esters. Since the catalyst tends to concentrate in the glycerin, it can become unavailable for the reaction without agitation. A common approach to overcome this issue is to conduct the transesterification in two stages. First, the oil is combined with 75,0 % to 90,0 % of the methanol and catalyst and this mixture is allowed to react to equilibrium. Then, the glycerin that has formed is separated and the remaining 10,0 % to 25,0 % of the methanol and catalyst is added for a second reaction period. At the conclusion of this second reaction period, remaining glycerin is separated and biodiesel is ready for further processing. Glycerin separation steps are usually accomplished by gravity settling or with a centrifuge [40].
Dilute acid
esterification
Vegetable oilsSulfur +
methanol
Transesterification
Crude biodieselCrude glycerin
Glycerin refining Refining
BiodieselGlycerin
Methanol
recovery
Methanol
+ KOH
Recycled
greases
Fig. 19. Basic transesterification technology.
27
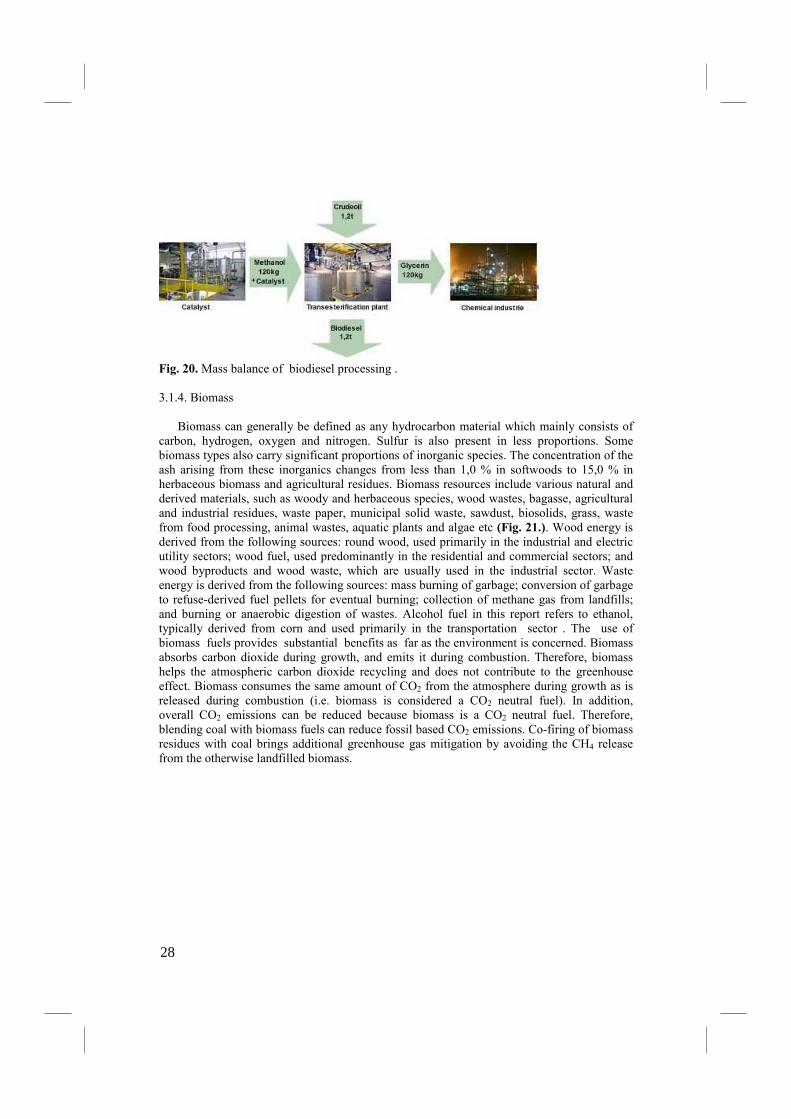
Fig. 20. Mass balance of biodiesel processing . 3.1.4. Biomass
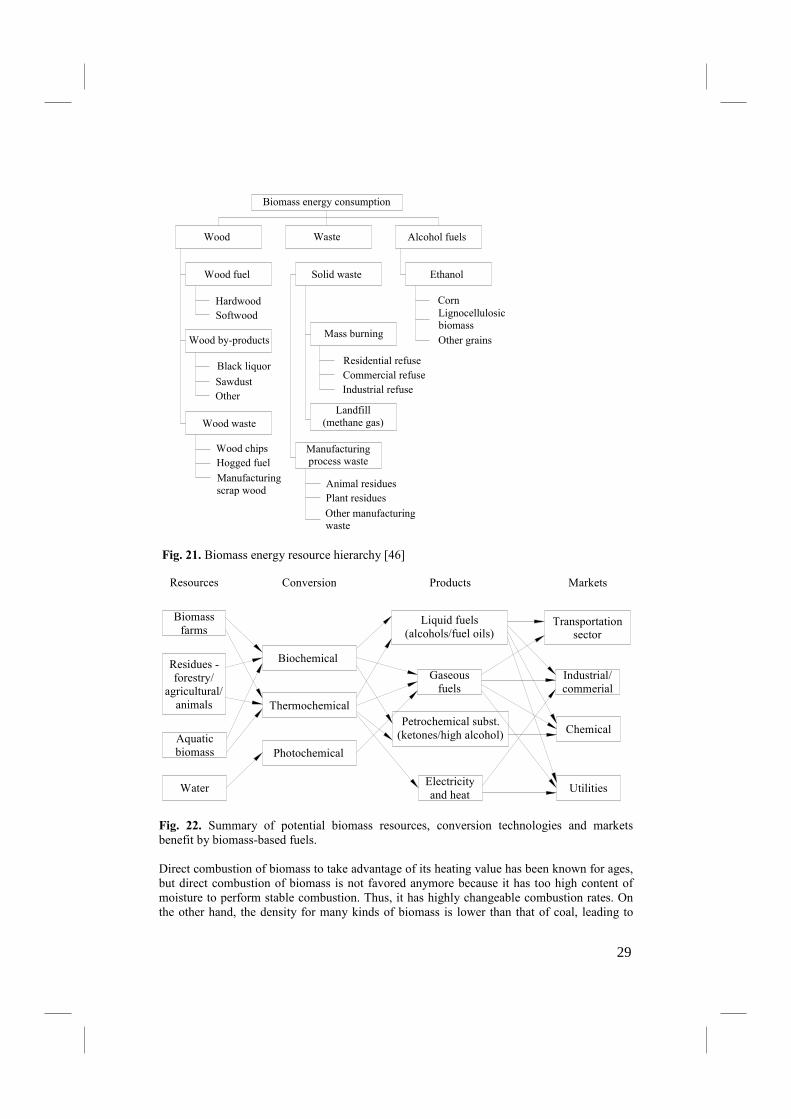
Biomass can generally be defined as any hydrocarbon material which mainly consists of carbon, hydrogen, oxygen and nitrogen. Sulfur is also present in less proportions. Some biomass types also carry significant proportions of inorganic species. The concentration of the ash arising from these inorganics changes from less than 1,0 % in softwoods to 15,0 % in herbaceous biomass and agricultural residues. Biomass resources include various natural and derived materials, such as woody and herbaceous species, wood wastes, bagasse, agricultural and industrial residues, waste paper, municipal solid waste, sawdust, biosolids, grass, waste from food processing, animal wastes, aquatic plants and algae etc (Fig. 21.). Wood energy is derived from the following sources: round wood, used primarily in the industrial and electric utility sectors; wood fuel, used predominantly in the residential and commercial sectors; and wood byproducts and wood waste, which are usually used in the industrial sector. Waste energy is derived from the following sources: mass burning of garbage; conversion of garbage to refuse-derived fuel pellets for eventual burning; collection of methane gas from landfills; and burning or anaerobic digestion of wastes. Alcohol fuel in this report refers to ethanol, typically derived from corn and used primarily in the transportation sector . The use of biomass fuels provides substantial benefits as far as the environment is concerned. Biomass absorbs carbon dioxide during growth, and emits it during combustion. Therefore, biomass helps the atmospheric carbon dioxide recycling and does not contribute to the greenhouse effect. Biomass consumes the same amount of CO2 from the atmosphere during growth as is released during combustion (i.e. biomass is considered a CO2 neutral fuel). In addition, overall CO2 emissions can be reduced because biomass is a CO2 neutral fuel. Therefore, blending coal with biomass fuels can reduce fossil based CO2 emissions. Co-firing of biomass residues with coal brings additional greenhouse gas mitigation by avoiding the CH4 release from the otherwise landfilled biomass.
28
Residential refuse
Manufacturingscrap wood
Wood chipsHogged fuel
Wood waste
OtherSawdust
Black liquor
Other manufacturing waste
Industrial refuseCommercial refuse
Animal residuesPlant residues
Manufacturingprocess waste
Landfill(methane gas)
Biomass energy consumption
Wood fuel
Wood by-products
SoftwoodHardwood
Wood
Solid waste
Mass burning
Waste
Ethanol
Lignocellulosic biomass
Other grains
Corn
Alcohol fuels
Fig. 21. Biomass energy resource hierarchy [46]
Transportation sector
Utilities
Industrial/commerial
Chemical
Liquid fuels (alcohols/fuel oils)
Gaseous fuels
Petrochemical subst.(ketones/high alcohol)
Electricity and heat
Water
Biomass farms
Residues -forestry/
agricultural/animals
Aquatic biomass
Biochemical
Thermochemical
Photochemical
Resources Conversion Products Markets
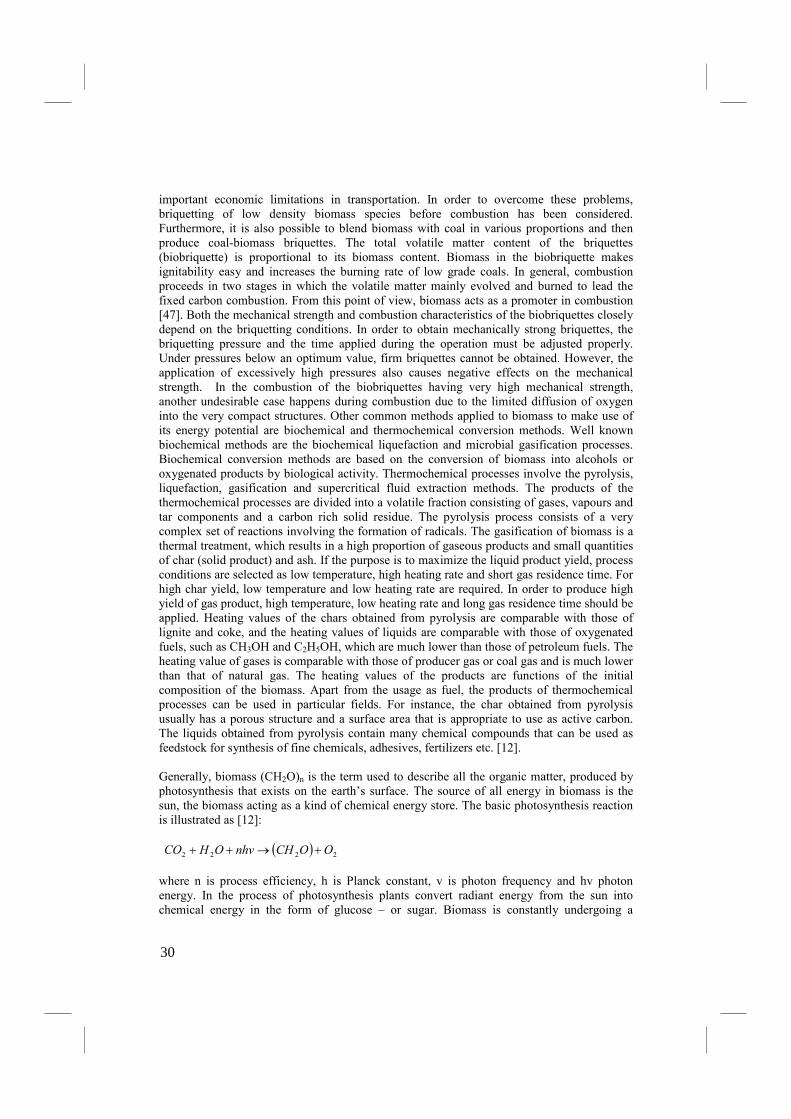
Fig. 22. Summary of potential biomass resources, conversion technologies and markets benefit by biomass-based fuels. Direct combustion of biomass to take advantage of its heating value has been known for ages, but direct combustion of biomass is not favored anymore because it has too high content of moisture to perform stable combustion. Thus, it has highly changeable combustion rates. On the other hand, the density for many kinds of biomass is lower than that of coal, leading to
29
important economic limitations in transportation. In order to overcome these problems, briquetting of low density biomass species before combustion has been considered. Furthermore, it is also possible to blend biomass with coal in various proportions and then produce coal-biomass briquettes. The total volatile matter content of the briquettes (biobriquette) is proportional to its biomass content. Biomass in the biobriquette makes ignitability easy and increases the burning rate of low grade coals. In general, combustion proceeds in two stages in which the volatile matter mainly evolved and burned to lead the fixed carbon combustion. From this point of view, biomass acts as a promoter in combustion [47]. Both the mechanical strength and combustion characteristics of the biobriquettes closely depend on the briquetting conditions. In order to obtain mechanically strong briquettes, the briquetting pressure and the time applied during the operation must be adjusted properly. Under pressures below an optimum value, firm briquettes cannot be obtained. However, the application of excessively high pressures also causes negative effects on the mechanical strength. In the combustion of the biobriquettes having very high mechanical strength, another undesirable case happens during combustion due to the limited diffusion of oxygen into the very compact structures. Other common methods applied to biomass to make use of its energy potential are biochemical and thermochemical conversion methods. Well known biochemical methods are the biochemical liquefaction and microbial gasification processes. Biochemical conversion methods are based on the conversion of biomass into alcohols or oxygenated products by biological activity. Thermochemical processes involve the pyrolysis, liquefaction, gasification and supercritical fluid extraction methods. The products of the thermochemical processes are divided into a volatile fraction consisting of gases, vapours and tar components and a carbon rich solid residue. The pyrolysis process consists of a very complex set of reactions involving the formation of radicals. The gasification of biomass is a thermal treatment, which results in a high proportion of gaseous products and small quantities of char (solid product) and ash. If the purpose is to maximize the liquid product yield, process conditions are selected as low temperature, high heating rate and short gas residence time. For high char yield, low temperature and low heating rate are required. In order to produce high yield of gas product, high temperature, low heating rate and long gas residence time should be applied. Heating values of the chars obtained from pyrolysis are comparable with those of lignite and coke, and the heating values of liquids are comparable with those of oxygenated fuels, such as CH3OH and C2H5OH, which are much lower than those of petroleum fuels. The heating value of gases is comparable with those of producer gas or coal gas and is much lower than that of natural gas. The heating values of the products are functions of the initial composition of the biomass. Apart from the usage as fuel, the products of thermochemical processes can be used in particular fields. For instance, the char obtained from pyrolysis usually has a porous structure and a surface area that is appropriate to use as active carbon. The liquids obtained from pyrolysis contain many chemical compounds that can be used as feedstock for synthesis of fine chemicals, adhesives, fertilizers etc. [12]. Generally, biomass (CH2O)n is the term used to describe all the organic matter, produced by photosynthesis that exists on the earth’s surface. The source of all energy in biomass is the sun, the biomass acting as a kind of chemical energy store. The basic photosynthesis reaction is illustrated as [12]:
( ) 2222 OOCHnhvOHCO +→++ where n is process efficiency, h is Planck constant, v is photon frequency and hv photon energy. In the process of photosynthesis plants convert radiant energy from the sun into chemical energy in the form of glucose – or sugar. Biomass is constantly undergoing a
30

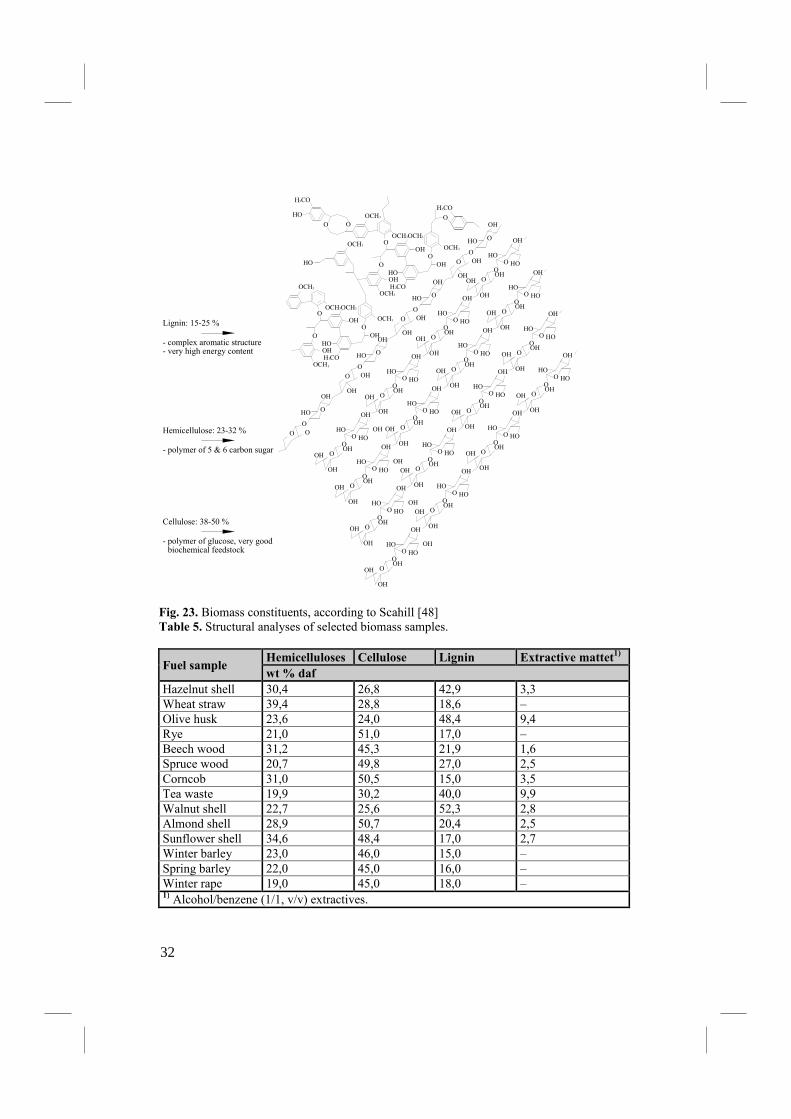
complex series of physical and chemical transformations and being regenerated while giving off energy in the form of heat to the atmosphere. To make use of biomass for our own energy needs we can simply tap into this energy source, in its simplest form we know, this is a basic open fire used to provide heat for cooking, warming water or warming the air in our home. More sophisticated technologies exist for extracting this energy and converting it into useful heat or power in an efficient way. Biomass is a versatile energy source. The components of biomass include cellulose, hemicelluloses, lignin (Fig. 23.), lipids, proteins, simple sugars, starches, water, ash, HC and other compounds. The concentrations of each class of compound varies depending on species, type of plant tissue, stage of growth, and growing conditions. The chemical structure and major organic components in biomass are extremely important in the development of processes for producing derived fuels and chemicals. The major organic components of biomass can be classified as cellulose, hemicellulose and lignin. Alpha cellulose is a polysaccharide having the general formula (C6H10O5)n and an average molecular weight range of 300,0÷500,0. Cotton is almost pure a-cellulose, whereas wood cellulose, the raw material for the pulp and paper industry, always occurs in association with hemicellulose and lignins. Cellulose is insoluble in water, forms the skeletal structure of most terrestrial biomass and constitutes approximately 50,0 % of the cell wall material. Starches are polysaccharides that have the general formula (C6H10O5)n. They are reserve sources of carbohydrate in some biomass and are also made up of some D-glucose units [41]. Hemi-celluloses are complex polysaccharides that take place in association with cellulose in the cell wall, but unlike cellulose, hemicelluloses are soluble in dilute alkali and consist of branched structures, which vary considerably among different woody and herbaceous biomass species. Many of them have the general formula (C5H8O4)n. Hemicelluloses usually carry 50,0÷200,0 monomeric units and a few simple sugar residues. The most abundant one is xylan. The xylans exist in softwoods and hardwoods up to about 10,0 % and 30,0 % of the dry weight of the species, respectively. The lignins are highly branched, substituted, mononuclear aromatic polymers in the cell walls of certain biomass, especially woody species, and are often bound to adjacent cellulose fibres to form a lignocellulosic complex. This complex and the lignins alone are often quite resistant to conversion by microbial systems and many chemical agents. The complex can be broken, and the lignin fraction separated, however, by treatment with strong sulphuric acid, in which the lignins are insoluble. The lignin contents on a dry basis in both softwoods and hardwoods generally range from 20,0 % to 40,0 % by weight and from 10,0 % to 40,0 % by weight in various herbaceous species, such as bagasse, corncobs, peanut shells, rice hulls and straws. The structural analyses of selected biomass samples are given in Table 5. Rye has a higher content of cellulose than the other species, but beyond that no significant differences are observed. All biofuels are highly volatile and have a relatively high hydrogen content. The portion of the volatiles in biofuels is around 70,0÷80,0 %. The carbon content and heat values are low compared to fossil fuels (Fig. 24.). A characteristic feature to solid biofuels is their low S and Na contents, but relatively high Cl and K contents. The net heating value of most biofuels is in the range from 6,0 to 10,0 MJ·kg-1 in as fired conditions. This is only about one third of the heating value of coal.
31
O
H CO3
O
O
OHO
OH
OH
OCH3
OCH OCH3
OCH3
OHH CO2
OCH3
OCH3HO
H CO3
O O
HO
O
O
OHO
OH
OH
OCH3
OHH CO3
OCH3
OCH3
Lignin: 15-25 %
- complex aromatic structure- very high energy content
3
OCH OCH33
OH
Hemicellulose: 23-32 %
- polymer of 5 & 6 carbon sugar
Cellulose: 38-50 %
- polymer of glucose, very good biochemical feedstock
OH
OH
OH
OHOH
HOHO
OH
O
OO
OH
OHOH
HOHO
OH
O
OO
OH
OHOH
HOHO
OH
O
OO
OH
OHOH
HOHO
OH
O
OO
OH
OH
OHOH
HOHO
OH
O
OO
OH
OHOH
HOHO
OH
O
OO
OH
OHOH
HOHO
OH
O
OO
OH
OHOH
HOHO
OH
O
OO
OH
OH
OHOH
HOHO
OH
O
OO
OH
OHOH
HOHO
OH
O
OO
OH
OHOH
HOHO
OH
O
OO
OH
OHOH
HOHO
OH
O
OO
OH
OH
OHOH
HOHO
OH
O
OO
OH
OHOH
HOHO
OH
O
OO
OH
OHOH
HOHO
OH
O
OO
OH
OHOH
HOHO
OH
O
OO
OO
O
OHO
O
OHO
O
OHO
O
HO
OHOH
O
HO
OH
O
HO
OH
O
HO
OH
O
Fig. 23. Biomass constituents, according to Scahill [48] Table 5. Structural analyses of selected biomass samples.
Fuel sample Hemicelluloses Cellulose Lignin Extractive mattet
1)
wt % daf
Hazelnut shell 30,4 26,8 42,9 3,3 Wheat straw 39,4 28,8 18,6 – Olive husk 23,6 24,0 48,4 9,4 Rye 21,0 51,0 17,0 – Beech wood 31,2 45,3 21,9 1,6 Spruce wood 20,7 49,8 27,0 2,5 Corncob 31,0 50,5 15,0 3,5 Tea waste 19,9 30,2 40,0 9,9 Walnut shell 22,7 25,6 52,3 2,8 Almond shell 28,9 50,7 20,4 2,5 Sunflower shell 34,6 48,4 17,0 2,7 Winter barley 23,0 46,0 15,0 – Spring barley 22,0 45,0 16,0 – Winter rape 19,0 45,0 18,0 – 1) Alcohol/benzene (1/1, v/v) extractives.
32
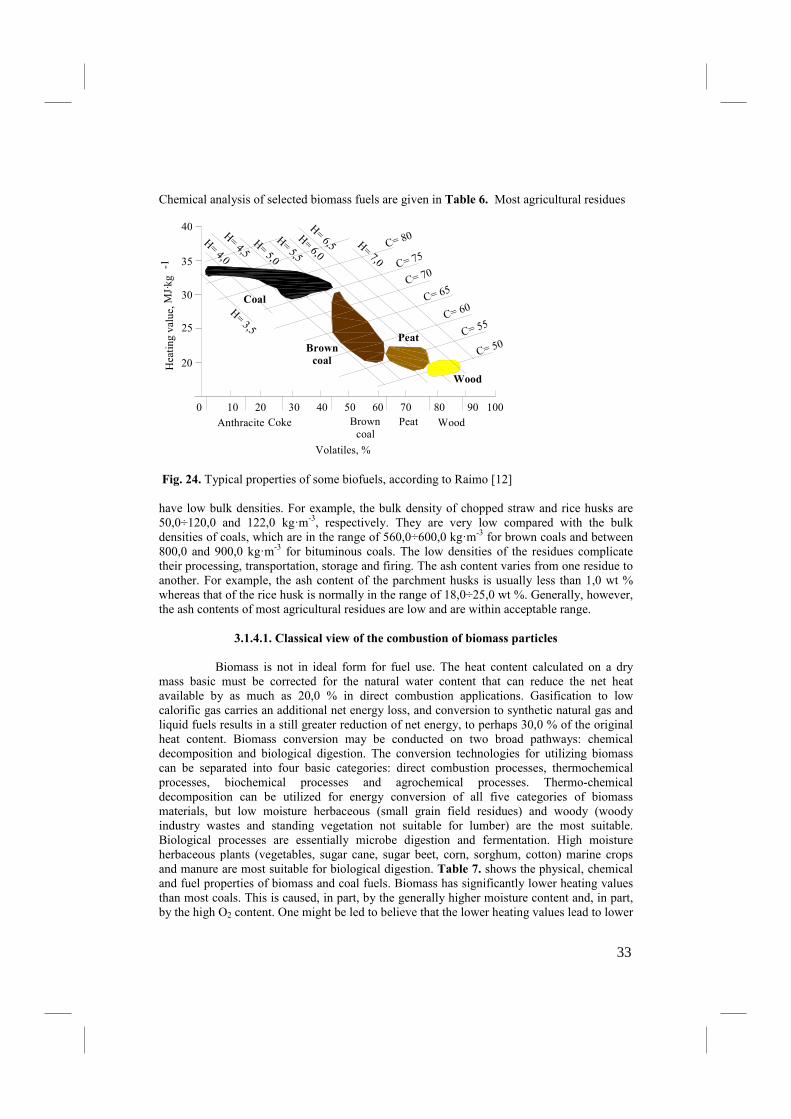
Chemical analysis of selected biomass fuels are given in Table 6. Most agricultural residues
Coal
Brown
coal
Peat
Wood
Anthracite
0 10 20 30 40 50 60 70 80 90 100
Coke
20
25
30
C= 80
H= 3,5
35
40H= 4,0
H= 4,5H= 5,0
H= 5,5
H= 6,0
H= 6,5 H= 7,0 C= 75
C= 70
C= 65
C= 60
C= 55
C= 50
Brown coal
Peat Wood
Volatiles, %
Heating
value,M
J·kg
-1
Fig. 24. Typical properties of some biofuels, according to Raimo [12] have low bulk densities. For example, the bulk density of chopped straw and rice husks are 50,0÷120,0 and 122,0 kg·m-3, respectively. They are very low compared with the bulk densities of coals, which are in the range of 560,0÷600,0 kg·m-3 for brown coals and between 800,0 and 900,0 kg·m-3 for bituminous coals. The low densities of the residues complicate their processing, transportation, storage and firing. The ash content varies from one residue to another. For example, the ash content of the parchment husks is usually less than 1,0 wt % whereas that of the rice husk is normally in the range of 18,0÷25,0 wt %. Generally, however, the ash contents of most agricultural residues are low and are within acceptable range.
3.1.4.1. Classical view of the combustion of biomass particles
Biomass is not in ideal form for fuel use. The heat content calculated on a dry mass basic must be corrected for the natural water content that can reduce the net heat available by as much as 20,0 % in direct combustion applications. Gasification to low calorific gas carries an additional net energy loss, and conversion to synthetic natural gas and liquid fuels results in a still greater reduction of net energy, to perhaps 30,0 % of the original heat content. Biomass conversion may be conducted on two broad pathways: chemical decomposition and biological digestion. The conversion technologies for utilizing biomass can be separated into four basic categories: direct combustion processes, thermochemical processes, biochemical processes and agrochemical processes. Thermo-chemical decomposition can be utilized for energy conversion of all five categories of biomass materials, but low moisture herbaceous (small grain field residues) and woody (woody industry wastes and standing vegetation not suitable for lumber) are the most suitable. Biological processes are essentially microbe digestion and fermentation. High moisture herbaceous plants (vegetables, sugar cane, sugar beet, corn, sorghum, cotton) marine crops and manure are most suitable for biological digestion. Table 7. shows the physical, chemical and fuel properties of biomass and coal fuels. Biomass has significantly lower heating values than most coals. This is caused, in part, by the generally higher moisture content and, in part, by the high O2 content. One might be led to believe that the lower heating values lead to lower
33
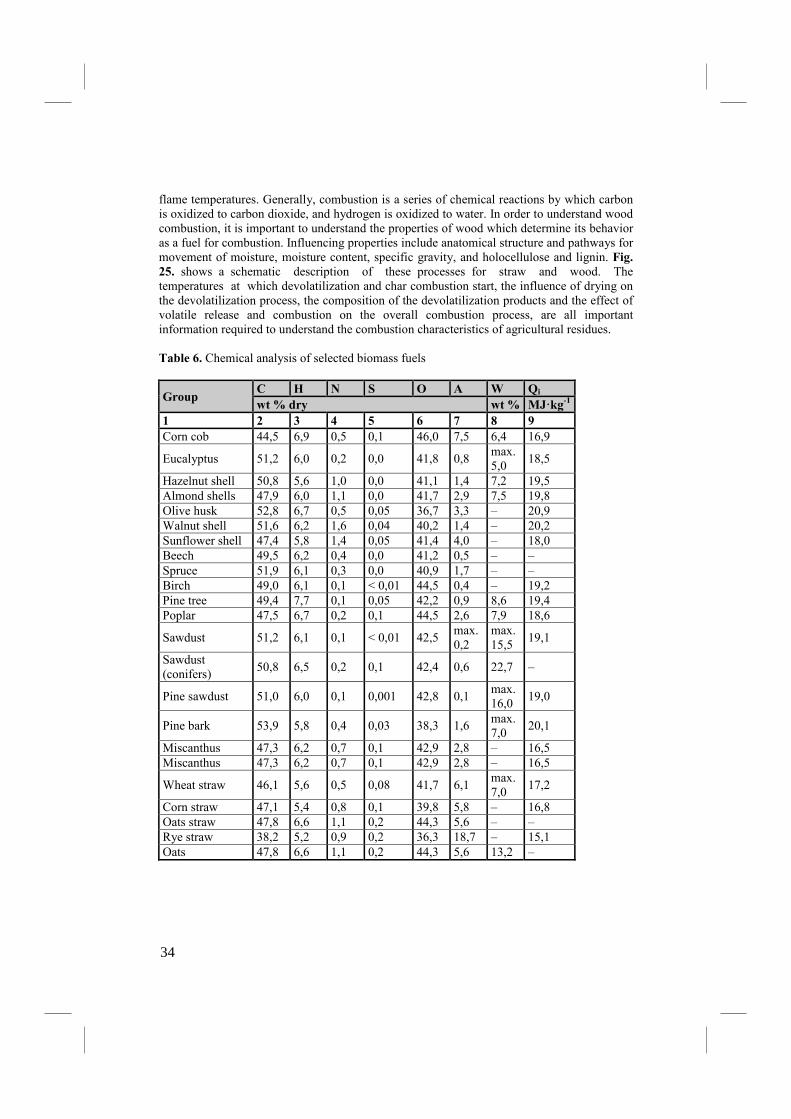
flame temperatures. Generally, combustion is a series of chemical reactions by which carbon is oxidized to carbon dioxide, and hydrogen is oxidized to water. In order to understand wood combustion, it is important to understand the properties of wood which determine its behavior as a fuel for combustion. Influencing properties include anatomical structure and pathways for movement of moisture, moisture content, specific gravity, and holocellulose and lignin. Fig. 25. shows a schematic description of these processes for straw and wood. The temperatures at which devolatilization and char combustion start, the influence of drying on the devolatilization process, the composition of the devolatilization products and the effect of volatile release and combustion on the overall combustion process, are all important information required to understand the combustion characteristics of agricultural residues. Table 6. Chemical analysis of selected biomass fuels
Group C H % S O
A W Qi
wt % dry wt % MJ·kg-1
1 2 3 4 5 6 7 8 9
Corn cob 44,5 6,9 0,5 0,1 46,0 7,5 6,4 16,9
Eucalyptus 51,2 6,0 0,2 0,0 41,8 0,8 max. 5,0
18,5
Hazelnut shell 50,8 5,6 1,0 0,0 41,1 1,4 7,2 19,5 Almond shells 47,9 6,0 1,1 0,0 41,7 2,9 7,5 19,8 Olive husk 52,8 6,7 0,5 0,05 36,7 3,3 – 20,9 Walnut shell 51,6 6,2 1,6 0,04 40,2 1,4 – 20,2 Sunflower shell 47,4 5,8 1,4 0,05 41,4 4,0 – 18,0 Beech 49,5 6,2 0,4 0,0 41,2 0,5 – – Spruce 51,9 6,1 0,3 0,0 40,9 1,7 – – Birch 49,0 6,1 0,1 < 0,01 44,5 0,4 – 19,2 Pine tree 49,4 7,7 0,1 0,05 42,2 0,9 8,6 19,4 Poplar 47,5 6,7 0,2 0,1 44,5 2,6 7,9 18,6
Sawdust 51,2 6,1 0,1 < 0,01 42,5 max. 0,2
max. 15,5
19,1
Sawdust (conifers)
50,8 6,5 0,2 0,1 42,4 0,6 22,7 –
Pine sawdust 51,0 6,0 0,1 0,001 42,8 0,1 max. 16,0
19,0
Pine bark 53,9 5,8 0,4 0,03 38,3 1,6 max. 7,0
20,1
Miscanthus 47,3 6,2 0,7 0,1 42,9 2,8 – 16,5 Miscanthus 47,3 6,2 0,7 0,1 42,9 2,8 – 16,5
Wheat straw 46,1 5,6 0,5 0,08 41,7 6,1 max. 7,0
17,2
Corn straw 47,1 5,4 0,8 0,1 39,8 5,8 – 16,8 Oats straw 47,8 6,6 1,1 0,2 44,3 5,6 – – Rye straw 38,2 5,2 0,9 0,2 36,3 18,7 – 15,1 Oats 47,8 6,6 1,1 0,2 44,3 5,6 13,2 –
34
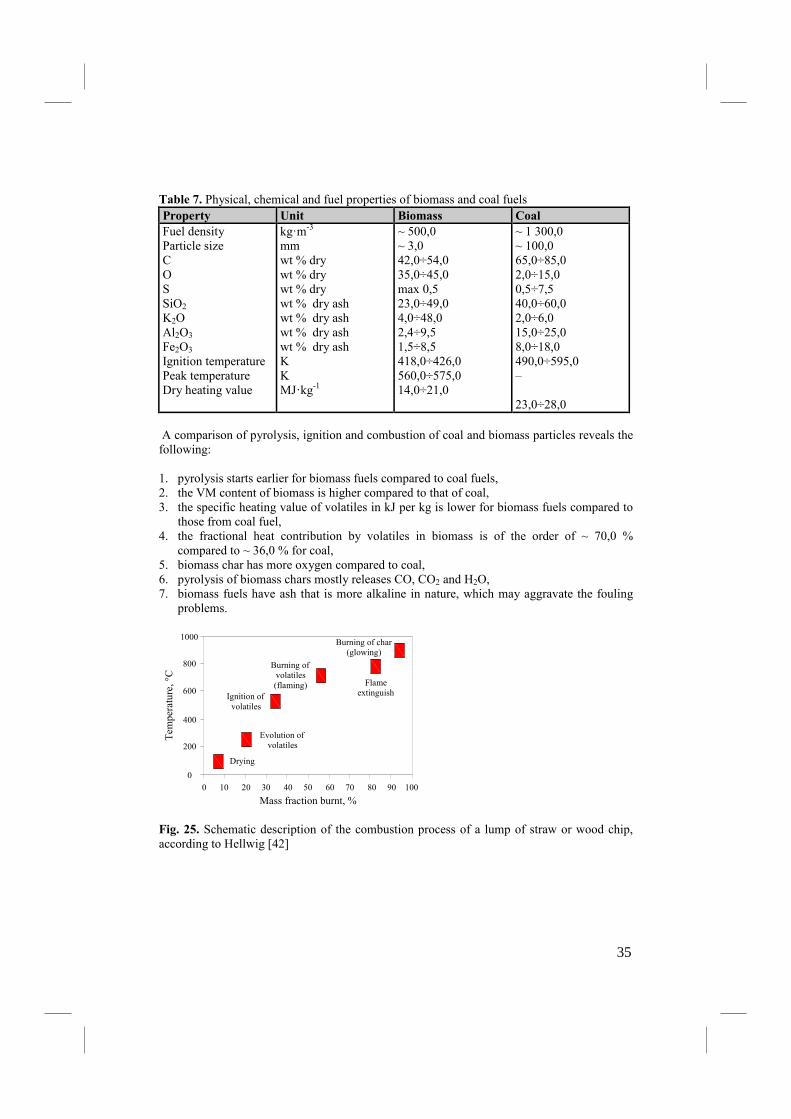
Table 7. Physical, chemical and fuel properties of biomass and coal fuels Property Unit Biomass Coal
Fuel density Particle size C O S SiO2 K2O Al2O3 Fe2O3 Ignition temperature Peak temperature Dry heating value
kg·m-3
mm wt % dry wt % dry wt % dry wt % dry ash wt % dry ash wt % dry ash wt % dry ash K K MJ·kg-1
~ 500,0 ~ 3,0 42,0÷54,0 35,0÷45,0 max 0,5 23,0÷49,0 4,0÷48,0 2,4÷9,5 1,5÷8,5 418,0÷426,0 560,0÷575,0 14,0÷21,0
~ 1 300,0 ~ 100,0 65,0÷85,0 2,0÷15,0 0,5÷7,5 40,0÷60,0 2,0÷6,0 15,0÷25,0 8,0÷18,0 490,0÷595,0 – 23,0÷28,0
A comparison of pyrolysis, ignition and combustion of coal and biomass particles reveals the following: 1. pyrolysis starts earlier for biomass fuels compared to coal fuels, 2. the VM content of biomass is higher compared to that of coal, 3. the specific heating value of volatiles in kJ per kg is lower for biomass fuels compared to those from coal fuel, 4. the fractional heat contribution by volatiles in biomass is of the order of ~ 70,0 % compared to ~ 36,0 % for coal, 5. biomass char has more oxygen compared to coal, 6. pyrolysis of biomass chars mostly releases CO, CO2 and H2O, 7. biomass fuels have ash that is more alkaline in nature, which may aggravate the fouling problems.
Tem
perature, °C
0
200
400
600
800
1000
Drying
Evolution of volatiles
Ignition of volatiles
Burning of volatiles (flaming) Flame
extinguish
Burning of char (glowing)
Mass fraction burnt, %0 10 20 30 40 50 60 70 80 90 100
Fig. 25. Schematic description of the combustion process of a lump of straw or wood chip, according to Hellwig [42]
35
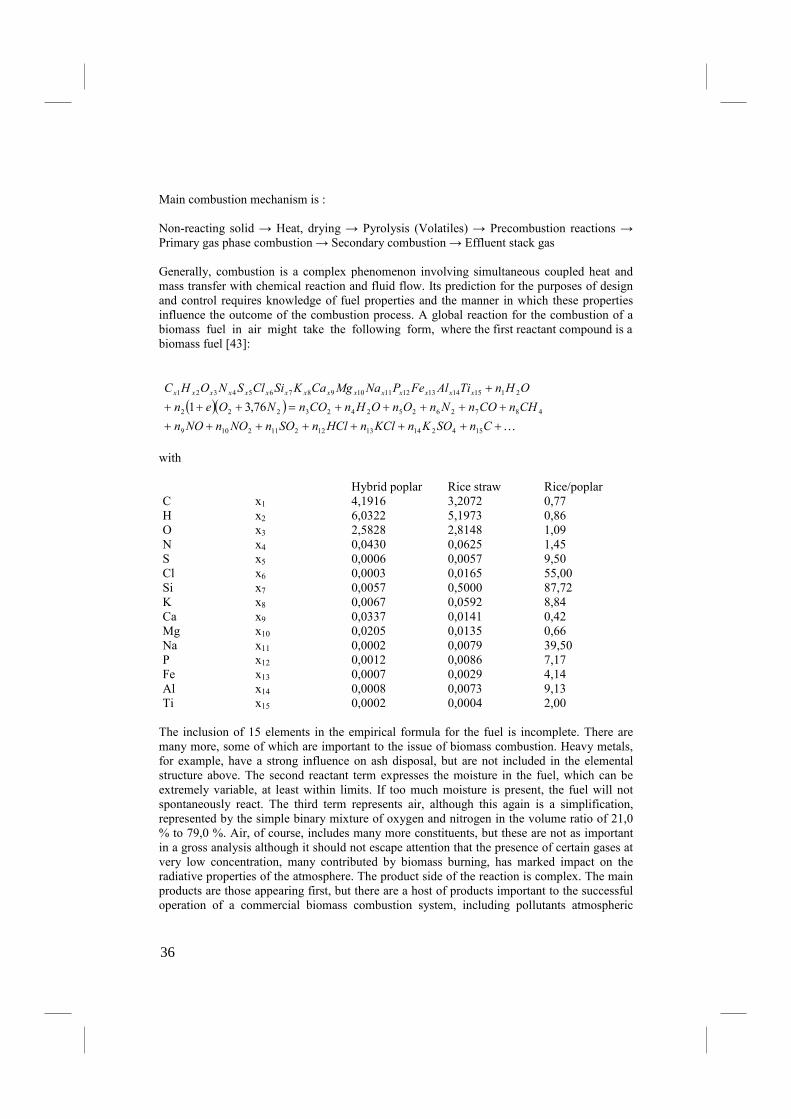
Main combustion mechanism is : Non-reacting solid → Heat, drying → Pyrolysis (Volatiles) → Precombustion reactions → Primary gas phase combustion → Secondary combustion → Effluent stack gas Generally, combustion is a complex phenomenon involving simultaneous coupled heat and mass transfer with chemical reaction and fluid flow. Its prediction for the purposes of design and control requires knowledge of fuel properties and the manner in which these properties influence the outcome of the combustion process. A global reaction for the combustion of a biomass fuel in air might take the following form, where the first reactant compound is a biomass fuel [43]:
( )( )K++++++++
+++++=+++
+
CnSOKnKClnHClnSOn�On�On
CHnCOn�nOnOHnCOn�Oen
OHnTiAlFeP�aMgCaKSiClS�OHC xxxxxxxxxxxxxxx
15421413122112109
48726252423222
21151413121110987654321
76,31
with Hybrid poplar Rice straw Rice/poplar C H O N S Cl Si K Ca Mg Na P Fe Al Ti
x1 x2 x3 x4 x5 x6 x7 x8 x9 x10 x11 x12 x13 x14 x15
4,1916 6,0322 2,5828 0,0430 0,0006 0,0003 0,0057 0,0067 0,0337 0,0205 0,0002 0,0012 0,0007 0,0008 0,0002
3,2072 5,1973 2,8148 0,0625 0,0057 0,0165 0,5000 0,0592 0,0141 0,0135 0,0079 0,0086 0,0029 0,0073 0,0004
0,77 0,86 1,09 1,45 9,50 55,00 87,72 8,84 0,42 0,66 39,50 7,17 4,14 9,13 2,00
The inclusion of 15 elements in the empirical formula for the fuel is incomplete. There are many more, some of which are important to the issue of biomass combustion. Heavy metals, for example, have a strong influence on ash disposal, but are not included in the elemental structure above. The second reactant term expresses the moisture in the fuel, which can be extremely variable, at least within limits. If too much moisture is present, the fuel will not spontaneously react. The third term represents air, although this again is a simplification, represented by the simple binary mixture of oxygen and nitrogen in the volume ratio of 21,0 % to 79,0 %. Air, of course, includes many more constituents, but these are not as important in a gross analysis although it should not escape attention that the presence of certain gases at very low concentration, many contributed by biomass burning, has marked impact on the radiative properties of the atmosphere. The product side of the reaction is complex. The main products are those appearing first, but there are a host of products important to the successful operation of a commercial biomass combustion system, including pollutants atmospheric
36
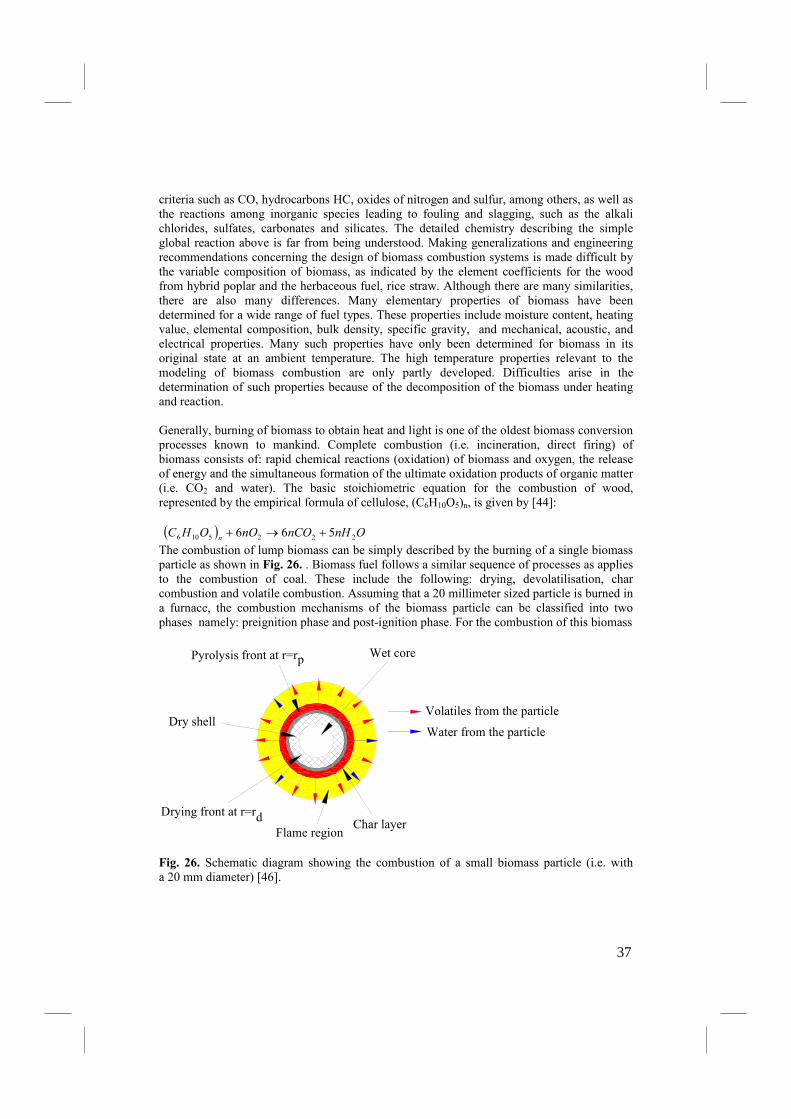
criteria such as CO, hydrocarbons HC, oxides of nitrogen and sulfur, among others, as well as the reactions among inorganic species leading to fouling and slagging, such as the alkali chlorides, sulfates, carbonates and silicates. The detailed chemistry describing the simple global reaction above is far from being understood. Making generalizations and engineering recommendations concerning the design of biomass combustion systems is made difficult by the variable composition of biomass, as indicated by the element coefficients for the wood from hybrid poplar and the herbaceous fuel, rice straw. Although there are many similarities, there are also many differences. Many elementary properties of biomass have been determined for a wide range of fuel types. These properties include moisture content, heating value, elemental composition, bulk density, specific gravity, and mechanical, acoustic, and electrical properties. Many such properties have only been determined for biomass in its original state at an ambient temperature. The high temperature properties relevant to the modeling of biomass combustion are only partly developed. Difficulties arise in the determination of such properties because of the decomposition of the biomass under heating and reaction. Generally, burning of biomass to obtain heat and light is one of the oldest biomass conversion processes known to mankind. Complete combustion (i.e. incineration, direct firing) of biomass consists of: rapid chemical reactions (oxidation) of biomass and oxygen, the release of energy and the simultaneous formation of the ultimate oxidation products of organic matter (i.e. CO2 and water). The basic stoichiometric equation for the combustion of wood, represented by the empirical formula of cellulose, (C6H10O5)n, is given by [44]: ( ) OnHnCOnOOHC
n 2225106 566 +→+ The combustion of lump biomass can be simply described by the burning of a single biomass particle as shown in Fig. 26. . Biomass fuel follows a similar sequence of processes as applies to the combustion of coal. These include the following: drying, devolatilisation, char combustion and volatile combustion. Assuming that a 20 millimeter sized particle is burned in a furnace, the combustion mechanisms of the biomass particle can be classified into two phases namely: preignition phase and post-ignition phase. For the combustion of this biomass
Flame region
Drying front at r=rd
Pyrolysis front at r=r
Dry shell
p
Char layer
Water from the particle
Volatiles from the particle
Wet core
Fig. 26. Schematic diagram showing the combustion of a small biomass particle (i.e. with a 20 mm diameter) [46].
37

particle, the following stages may occur simultaneously or concurrently. The basic steps are described as follows: 1. drying of the biomass particle immediately commences as the particle is introduced into the hot combustion environment. Due to the higher permeability of the vapour phase, a wet-dry interface is formed within the particle, 2. as the dry shell starts heating up, devolatilisation commences with the breaking up of the solids structure, 3. as the volatile release becomes more rapid, ignition of the volatiles are assumed to occur in the gas phase. Following ignition, volatiles burn in a thin flame enveloping the particle surface. It is believed that this phenomenon prevents oxygen reaching the charred surface and the flame energy promotes the drying and devolatilisation of the particle, 4. as all the moisture is vaporised, volatilisation may still continue. Several workers have indicated that there is a possible simultaneous occurrence of devolatilisation and char combustion at this stage of the process, 5. as the volatiles become depleted, the volatile flame collapses and oxygen is permitted to attack the charred surface therefore leading to the ignition and burnout of residual char. Among the complex processes involved during combustion, the devolatilisation of the biomass materials and the subsequent combustion of the char produced during devolatilisation are seen to be the most important process that define parameter for the design of a furnace. The devolatilization of biomass materials involves several complex processes of thermal decomposition and can be generalised as: 1. removal of bound moisture and some volatiles, 2. breakdown of hemicellulose; emission of CO and CO2, 3. exothermic reaction causing the wood temperature to rise from 250 to 360 oC; emission of methane and ethane, 4. external energy is required to continue the process (i.e. breakdown of cellulose and lignin).
3.2.Combustion and Gasification
The combustion of fossil fuels remains the primary energy source for power generation. The main component of natural gas is methane CH4 , also we can use other hydrocarbons. The important fossil fuels are oils and coals. The typical characteristics and elemental compositions of fossil fuels are shown in Table 8 and composition of coal ash in next table.
38

Table 8a. Characteristic of fuel
Proximate analysis Elemental analysis
fuel LHV MJ/kgAshd VM
daf C
daf H
daf %
daf So
daf* O
Hard coal 28 10-24,9 30,5 80,04 5,69 1,56 0,8
Coal lignite 8-15 9-30 30-50 50 4 1 0,6
Crude oil 18,5 0,2 88 8,2 0,1 3 0,5
Table. 8b. Composition of coal ash
Chemical composition %
SiO2 48,56
Al2O3 29,10
Fe2O3 6,48
TiO2 1,98
CaO 1,89
MgO 1,27
%a2O 0,62
K2O 1,23
SO3 0,93
IOL 7,94
Slagging factor=B/A 0,144
39
COMBUSTIO% EQUATIO%S
The combustion of fossil fuels remains the primary energy sources for power generation worldwide, representing 85%~of the global primary energy supply Combustion converts the chemical energy of the fuel to heat through a series of exothermic reactions (i.e., they give off heat).Combustion reactions always involve molecular oxygen O2. If at any time anything burns (in the usual sense), it is a combustion reaction.
The general form of the reaction for the complete combustion of a hydrocarbon is: CxHy + (x+y/4)02 = xCO2 + (y/3)H2O + heat
For example:
CH4 + 202 = CO2 + 2H2O +heat (800kJ/mol CH4 )
Note that the number of moles of the elements on the left-hand side may not equal the number of moles on the right-hand side. However, the number of atoms of an element must remain the same before, after, and during a chemical reaction; this demands that the mass of each element be conserved during combustion. In writing the equation we have demonstrated some knowledge of the products of the reaction. Unless otherwise stated we will assume complete combustion: the products of the combustion of a hydrocarbon fuel will be H2O and CO2. Incomplete combustion results in products that contain H, CO, C, and/or OH. For a simple chemical reaction, such as, (we can immediately write down a balanced chemical equation. For more complex reactions the following systematic method proves useful [50]: 1. Set the number of moles of fuel equal to 1. 2. Balance CO2 with number of C from the fuel. 3. Balance H2O with H from the fuel. 4. Balance O2, from CO2 and H2O. For the combustion of methane, we assumed that the process occurred in a pure oxygen environment. Actually, such a combustion process would normally occur in air. For our purposes, we assume that air consists of 21% O2, and 79% N2 by volume so that for each mole of O2 in a reaction we will have 0,79- mol N2 0,21 - mol O2 thus 0.21/0.79= 3.76, And under assumption that N2 will not undergo any chemical reaction for methane , the combustion reaction is replaced by CH4 + 2(O2 + 3.76N2)= CO2 + 2H2O + 7.52N2
The minimum amount of air that supplies sufficient O2 for the complete combustion of the fuel is called theoretical air or stoichiometric air. When complete combustion is achieved with theoretical air, the products contain no O2, as in the reaction above . In practice, it is found that if complete combustion is to occur, air must be supplied in an amount greater than theoretical air. This is due to the chemical kinetics and molecular activity of the reactants and products. Thus, we often speak in terms of percent theoretical air or percent excess air, where
40
% theoretical air = 100% + % excess air Slightly insufficient air results in CO being formed; some hydrocarbons may result from larger deficiencies. The parameter that relates the amount of air used in a combustion process is the air-fuel ratio (AF),which is the ratio of the mass of air to the mass of fuel. The reciprocal is the fuel-air ratio (FA).
The combustion of hydrocarbon fuels involves H2O in the products of combustion. The calculation of the dew point of the products is often of interest; it is the saturation temperature at the partial pressure of the water vapor. If the temperature drops below the dew point, the water vapor begins to condense. The condensate usually contains corrosive elements, and thus it is often important to ensure that the temperature of the products does not fall below the dew point.
Burning of Coal
Coal is mainly carbon, water, some hydrogen, and oxygen. There are many different kinds of coal. In addition to H and O, coal also contains some small amounts of nitrogen, sulfur, and some other minerals.
Most of the carbon in coal is bound so that there is only one C-C bond for every C atom. Thus, for calculating the energy release of C + O2 CO2 in the case of coal, one assumes only the breaking of one C-C bond
Combustion equation for coal:
C + O2 => CO2 (12 kg C)+(32 kg O) => (34 kg CO2)
Combustion equation for hydrogen:
2 H2 + O2 => 2 H2O (4 kg H)+(32 kg O) => (36 kg H2O)
Combustion equation for sulphur:
S + O2 => SO2 (32 kg S) + (32 kg O) => (64 kg SO2 )
Adiabatic flame temperature
If we consider a combustion process that takes place adiabatically, with no work or changes in kinetic and potential energy, then the temperature of the products is referred to as the adiabatic flame temperature. We find that the maximum adiabatic flame temperature that can be achieved occurs at theoretical air. This fact allows us to control the adiabatic flame temperature by the amount of excess air involved in the process: The greater the amount of excess air the lower the adiabatic flame temperature. The adiabatic flame temperature is calculated assuming complete combustion, no heat transfer from the combustion chamber, and no dissociation of the products into other chemical species. Each of these effects tends to reduce the adiabatic flame temperature. Consequently,
41
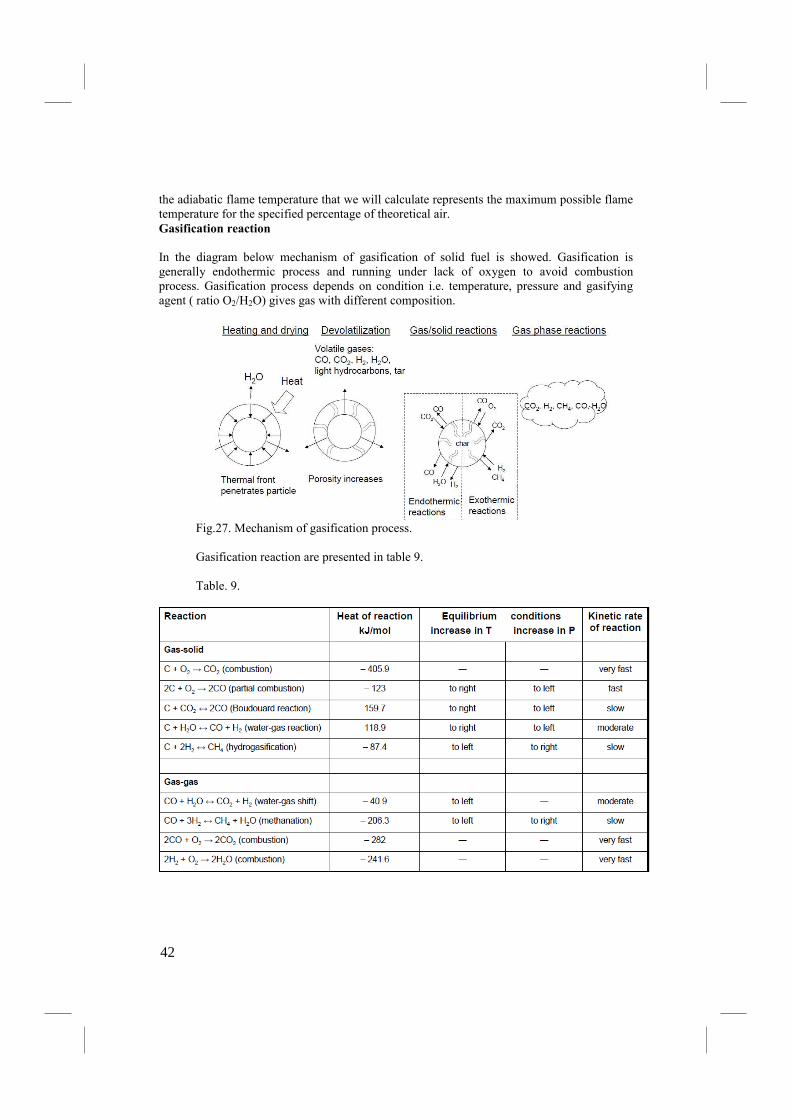
the adiabatic flame temperature that we will calculate represents the maximum possible flame temperature for the specified percentage of theoretical air. Gasification reaction
In the diagram below mechanism of gasification of solid fuel is showed. Gasification is generally endothermic process and running under lack of oxygen to avoid combustion process. Gasification process depends on condition i.e. temperature, pressure and gasifying agent ( ratio O2/H2O) gives gas with different composition.
Fig.27. Mechanism of gasification process. Gasification reaction are presented in table 9. Table. 9.
42
3.3 – Thermodynamics based for power systems
3.3.1 Vapor and combined power cycles In this part, vapor power cycles in which the working fluid is alternatively vaporized and condensed is considered. [51]. We also consider power generation coupled with process heating called cogeneration. The continued quest for higher thermal efficiencies has resulted in some innovative modifications to the basic vapor power cycle. Among these, we discuss the reheat and regenerative cycles as well as power cycles that consist of two separate cycles known as binary cycles and combined cycles where the heat rejected by one fluid is used as the heat input to another fluid operating at a lower temperature. Steam is the most common working fluid used in vapor power cycles because of its many desirable characteristics such as low cost, availability, and high enthalpy of vaporization. Therefore, this chapter is mostly devoted to the discussion of steam power plants. Steam power plants are commonly referred to as coal plants, nuclear plants, or natural gas plants, depending on the type of fuel used to supply heat to the steam. However, the steam goes through the same basic cycle in all of them. Therefore, all can be analyzed in the same manner. 3.3.2 The Carnot vapor cycle The Carnot cycle is the most efficient cycle operating between two specified temperature limits. Thus it is natural to look at the Carnot cycle first as a prospective ideal cycle for vapor power plants. If we could, we would certainly adopt it as the ideal cycle. As explained below, however, the Carnot cycle is not a suitable model for power cycles. Throughout the discussions, we assume steam to be the working fluid since it is the working fluid predominantly used in vapor power cycles. Consider a steady-flow Carnot cycle executed within the saturation dome of a pure substance, as shown in Fig. 28.A. The fluid is heated reversibly and isothermally in a boiler (process 1-2), expanded isentropically in a turbine (process 2-3), condensed reversibly and isothermally in a condenser (process 3-4), and compressed isentropically by a compressor to the initial state (process 4-1). Several impracticalities are associated with this cycle: 1. isothermal heat transfer to or from a two-phase system is not difficult to achieve in practice since maintaining a constant pressure in the device will automatically fix the temperature at the saturation value. Therefore, processes 1-2 and 3-4 can be approached closely in actual boilers and condensers. Limiting the heat transfer processes to two-phase systems, however, severely limits the maximum temperature that can be used in the cycle (it has to remain under the critical-point value, which is 374,0 °C for water). Limiting the maxi mum temperature in the cycle also limits the thermal efficiency. Any attempt to raise the maximum temperature in the cycle will involve heat transfer to the working fluid in a single phase, which is not easy to accomplish isothermally, 2. the isentropic expansion process (process 2-3) can be approximated closely by a well- designed turbine. However, the quality of the steam decreases during this process, as shown on the T-s diagram in Fig. 28.A. Thus, the turbine will have to handle steam with low quality, that is, steam with high moisture content. The impingement of liquid droplets on the turbine blades causes erosion and is a major source of wear. Thus, steam with qualities less than about 90,0 % cannot be tolerated in the operation of power plants. This problem could be eliminated by using a working fluid with a very steep saturated vapor line, 3. the isentropic compression process (process 4-1) involves the compression of a liquid-
43

vapor mixture to a saturated liquid. There are two difficulties associated with this process. First, it is not easy to control the condensation process so precisely as to end up with the desired quality at state 4. Second, it is not practical to design a compressor that will handle two phases.
2
3
1
4
s
T A
2
3
1
4
s
T B
Fig. 28. A & B. T-s diagram of two Carnot vapor cycles Some of these problems could be eliminated by executing the Carnot cycle in a different way, as shown in Fig. 28.B. This cycle, however, presents other problems such as isentropic compression to extremely high pressures and isothermal heat transfer at variable pressures. Thus we conclude that the Carnot cycle cannot be approximated in actual devices and is not a realistic model for vapor power cycles. 3.3.3 Rankine cycle: the ideal cycle for vapor power cycles Many of the impracticalities associated with the Carnot cycle can be eliminated by superheating the steam in the boiler and condensing it completely in the condenser, as shown schematically on a T-s diagram in Fig. 29. The cycle that results is the Rankine cycle, which is the ideal cycle for vapor power plants. The ideal Rankine cycle does not involve any internal irreversibilities and consists of the following four processes:
1-2 isentropic compression in a pump 2-3 constant pressure heat addition in a boiler 3-4 isentropic expansion in a turbine 4-1 constant pressure heat rejection in a condenser
Water enters the pump at state 1 as saturated liquid and is compressed isentropically to the operating pressure of the boiler. The water temperature increases somewhat during this isentropic compression process due to a slight decrease in the specific volume of the water. The vertical distance between states 1 and 2 on the T-s diagram is greatly exaggerated for clarity. (If water were truly incompressible, would there be a temperature change at all during this process?) Water enters the boiler as a compressed liquid at state 2 and leaves as a superheated vapor at state 3. The boiler is basically a large heat exchanger where the heat originating from combustion gases, nuclear reactors, or other sources is transferred to the
44
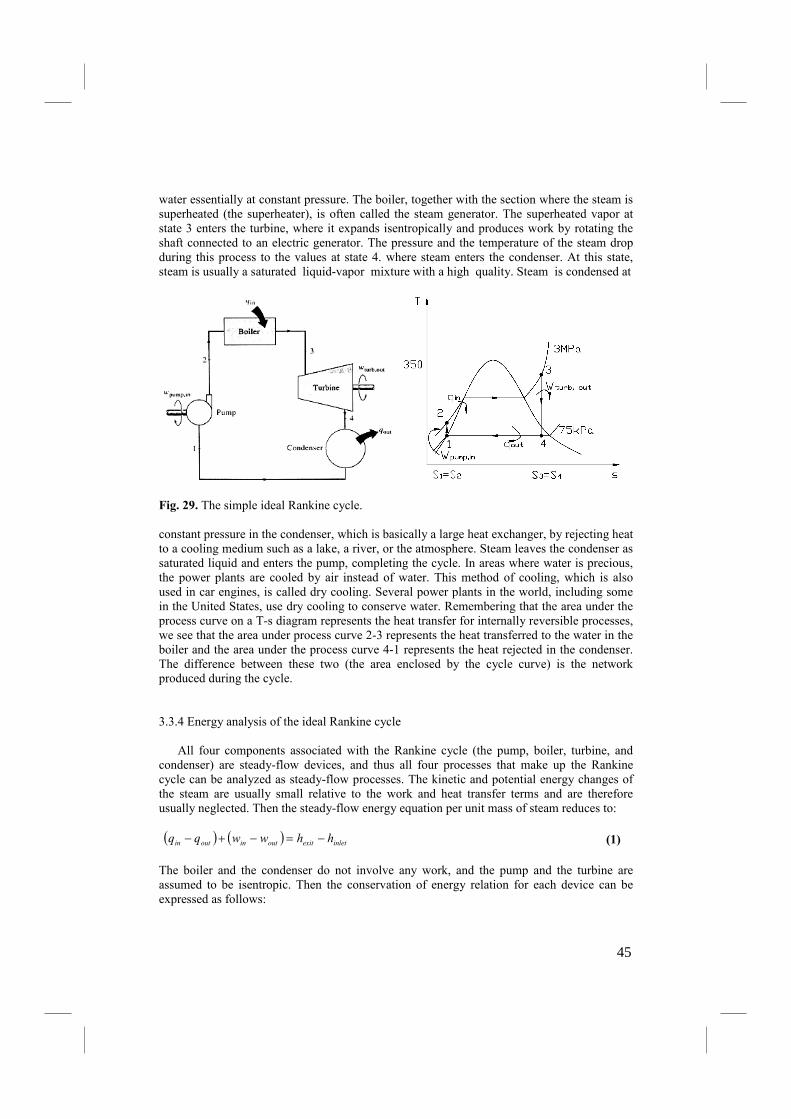
water essentially at constant pressure. The boiler, together with the section where the steam is superheated (the superheater), is often called the steam generator. The superheated vapor at state 3 enters the turbine, where it expands isentropically and produces work by rotating the shaft connected to an electric generator. The pressure and the temperature of the steam drop during this process to the values at state 4. where steam enters the condenser. At this state, steam is usually a saturated liquid-vapor mixture with a high quality. Steam is condensed at
Fig. 29. The simple ideal Rankine cycle. constant pressure in the condenser, which is basically a large heat exchanger, by rejecting heat to a cooling medium such as a lake, a river, or the atmosphere. Steam leaves the condenser as saturated liquid and enters the pump, completing the cycle. In areas where water is precious, the power plants are cooled by air instead of water. This method of cooling, which is also used in car engines, is called dry cooling. Several power plants in the world, including some in the United States, use dry cooling to conserve water. Remembering that the area under the process curve on a T-s diagram represents the heat transfer for internally reversible processes, we see that the area under process curve 2-3 represents the heat transferred to the water in the boiler and the area under the process curve 4-1 represents the heat rejected in the condenser. The difference between these two (the area enclosed by the cycle curve) is the network produced during the cycle.
3.3.4 Energy analysis of the ideal Rankine cycle All four components associated with the Rankine cycle (the pump, boiler, turbine, and condenser) are steady-flow devices, and thus all four processes that make up the Rankine cycle can be analyzed as steady-flow processes. The kinetic and potential energy changes of the steam are usually small relative to the work and heat transfer terms and are therefore usually neglected. Then the steady-flow energy equation per unit mass of steam reduces to: ( ) ( ) inletexitoutinoutin hhwwqq −=−+− (1) The boiler and the condenser do not involve any work, and the pump and the turbine are assumed to be isentropic. Then the conservation of energy relation for each device can be expressed as follows:
45
Pump (q= 0): 12,hhw
inpump−= (2)
or,
( )12,PPw
inpump−=ν (3)
where ,
1@1 Pfhh = and iPf @1 ννν =≅ (4)
Boiler (w= 0): 23 hhqin −= (5) Turbine (q= 0): 43.
hhwoutturb
−= (6) Condenser (w= 0): 14 hhqout −= (7) The thermal efficiency of the Rankine cycle is determined from:
in
out
in
net
thq
q
q
w−== 1η (8)
where
inpumpoutturboutinnet wwqqw,.
−=−= (9)
The conversion efficiency of power plants in the United States is often expressed in terms of heat rate, which is the amount of heat supplied, in Btu's, to generate 1,0 kWh of electricity. The smaller the heat rate, the greater the efficiency. Considering that 1,0 kWh= 3412,0 Btu and disregarding the losses associated with the conversion of shaft power to electric power, the relation between the heat rate and the thermal efficiency can be expressed as
( )( )1
10,3412−
−
⋅
⋅=
kWhBturateHeat
kWhBtuth
η (10)
For example, a heat rate of 11,363 Btu·kWh-1 is equivalent to 30,0 % efficiency. The thermal efficiency can also be interpreted as the ratio of the area enclosed by the cycle on a T-s diagram to the area under the heat-addition process. The use of these relations is illustrated in the following example.
Saturated liquid-vapor mixture ,
During a vaporization process, a substance exists as part liquid and part vapor. That is it is a mixture of saturated liquid (left line) and saturated vapor (right line). To analyze this mixture properly, we need to know the proportions of the liquid and vapor phases in the mixture. This is done by defining a new property called the quality x as the ratio of the mass of vapor to the total mass of the mixture:
46
total
vapor
M
MX = (11)
where
gfvaporliquidtotal MMMMM +=+= (12)
Quality has significance for saturated mixtures only. It is value between 0 and 1.
In saturated mixtures , quality can serve as one of the two independent intensive properties needed to describe a state.
Note that the properties of the saturated liquid are the same whether it exists alone or in a mixture with saturated vapor.
During the vaporization process, only the amount of saturated liquid changes, not its properties. The same can be said about a saturated vapor.
The properties of a saturated mixture will simply by the average properties of the saturated liquid –vapor mixture under consideration.
Consider a tank that contains a saturated liquid-vapor mixture. The volume occupied by saturated liquid is Vf, and the volume occupied by saturated vapor is Vv. The total volume V is the sum of the two:
V= Vf + Vg
V= mv mt vav = mf vf +mg vg
mf = mt - mg mt vav = (mt-mg) vf +mg vg
dividing by mt yields
vav = (1 –x) vf +x vg
since x= mg/mt
this relation can also be expressed as
vav = vf +x vfg (m3/kg)
where vfg = vg - vf.
Solving for quality, we obtain
X= (vav - vf )/ vfg (13)
47
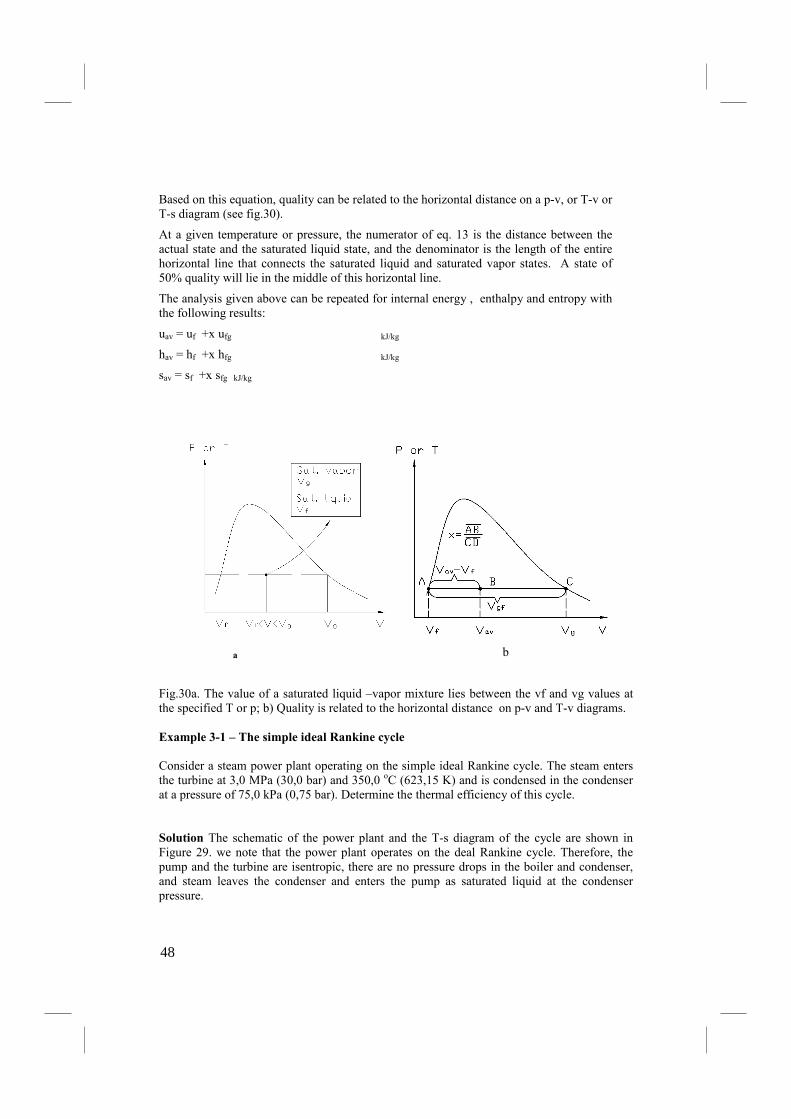
Based on this equation, quality can be related to the horizontal distance on a p-v, or T-v or T-s diagram (see fig.30).
At a given temperature or pressure, the numerator of eq. 13 is the distance between the actual state and the saturated liquid state, and the denominator is the length of the entire horizontal line that connects the saturated liquid and saturated vapor states. A state of 50% quality will lie in the middle of this horizontal line.
The analysis given above can be repeated for internal energy , enthalpy and entropy with the following results:
uav = uf +x ufg kJ/kg
hav = hf +x hfg kJ/kg
sav = sf +x sfg kJ/kg
a b
Fig.30a. The value of a saturated liquid –vapor mixture lies between the vf and vg values at the specified T or p; b) Quality is related to the horizontal distance on p-v and T-v diagrams.
Example 3-1 – The simple ideal Rankine cycle
Consider a steam power plant operating on the simple ideal Rankine cycle. The steam enters the turbine at 3,0 MPa (30,0 bar) and 350,0 oC (623,15 K) and is condensed in the condenser at a pressure of 75,0 kPa (0,75 bar). Determine the thermal efficiency of this cycle.
Solution The schematic of the power plant and the T-s diagram of the cycle are shown in Figure 29. we note that the power plant operates on the deal Rankine cycle. Therefore, the pump and the turbine are isentropic, there are no pressure drops in the boiler and condenser, and steam leaves the condenser and enters the pump as saturated liquid at the condenser pressure.
48

Assumptions 1 Steady operating conditions exist. 2 kinetic and potential energy changes are negligible. Analysis First we determine the enthalpies at various points in the cycle, using data from steam tables .
State 1: =
liquidSat
kPaP
.0,751
13
0,75@1
1
0,75@1
001037,0
39,384−
−
⋅==
⋅==
kgm
kgkJhh
kPaf
kPaf
νν (X.X)
State 2: 21
2 0,3ss
MPaP
==
(X.X)
State 3:
=
=
CT
MPaPo
0,350
0,3
3
3
113
13
7428,6
3,3115−−
−
⋅⋅=⋅=
KkgkJs
kgkJh (X.X)
State 4: ( )
34
4 .0,75ss
mixturesatkPaP
==
(X.X)
8857,02434,6
213,17428,644 =
−=
−=
fg
f
s
ssx ** (X.X)
( ) 1
44 6,24026,22788857,039,384 −⋅=+=⋅+= kgkJhxhh fgf (X.X)
Thus,
( ) 1123 9,272742,3873,3115 −− ⋅=⋅−=−= kgkJkgkJhhqin (X.X)
( ) 1114 2,201839,3846,2402 −− ⋅=⋅−=−= kgkJkgkJhhqout (X.X)
and
%0,26260,09,2727
2,201811
1
1
orkgkJ
kgkJ
q
q
in
outth =
⋅⋅
−=−= −
−
η (X.X)
The thermal efficiency could also be determined from
( ) 1143. 7,7126,24023,3115 −− ⋅=⋅−=−= kgkJkgkJhhw outturb (X.X)
( ) 11.. 7,70903,37,712 −− ⋅=⋅−=−= kgkJkgkJwww inpumpoutturbnet (X.X)
or
( ) 11 7,7092,20189,2727 −− ⋅=⋅−=−= kgkJkgkJqqw outinnet (X.X)
and
49
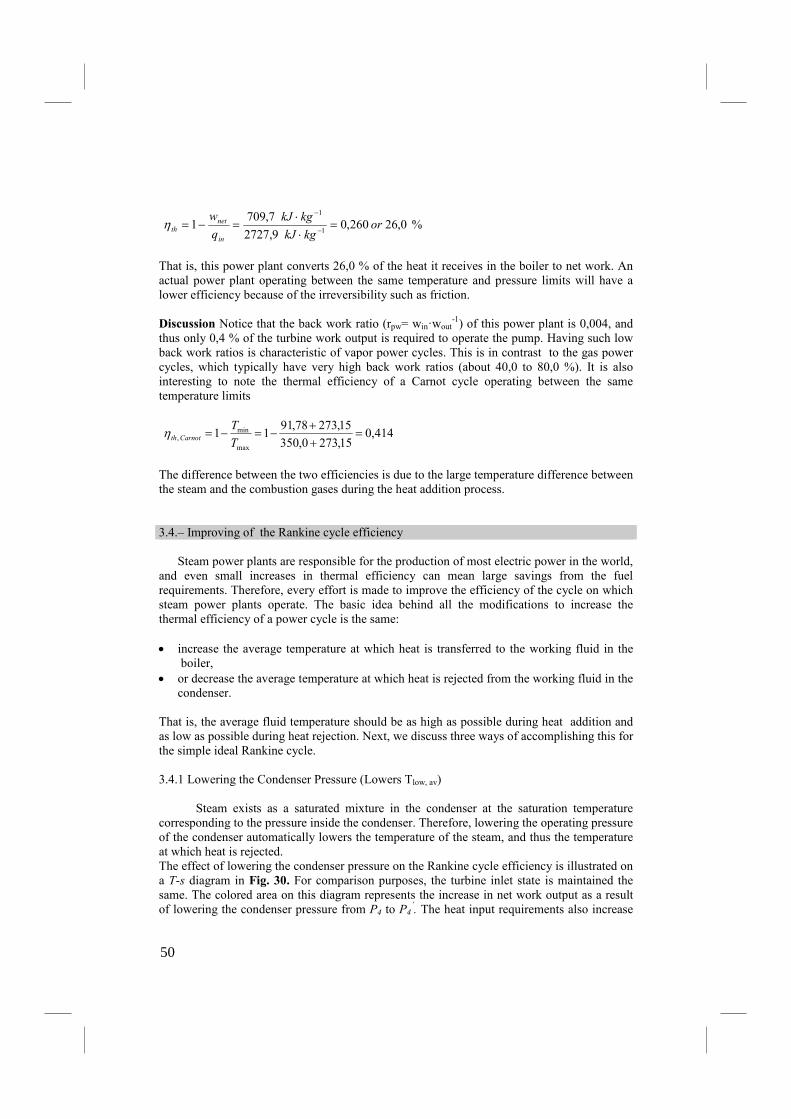
%0,26260,09,2727
7,7091
1
1
orkgkJ
kgkJ
q
w
in
netth =
⋅
⋅=−=
−
−
η (X.X)
That is, this power plant converts 26,0 % of the heat it receives in the boiler to net work. An actual power plant operating between the same temperature and pressure limits will have a lower efficiency because of the irreversibility such as friction. Discussion Notice that the back work ratio (rpw= win·wout
-1) of this power plant is 0,004, and thus only 0,4 % of the turbine work output is required to operate the pump. Having such low back work ratios is characteristic of vapor power cycles. This is in contrast to the gas power cycles, which typically have very high back work ratios (about 40,0 to 80,0 %). It is also interesting to note the thermal efficiency of a Carnot cycle operating between the same temperature limits
414,015,2730,350
15,27378,9111
max
min, =
++
−=−=T
TCarnotth η
The difference between the two efficiencies is due to the large temperature difference between the steam and the combustion gases during the heat addition process. 3.4.– Improving of the Rankine cycle efficiency Steam power plants are responsible for the production of most electric power in the world, and even small increases in thermal efficiency can mean large savings from the fuel requirements. Therefore, every effort is made to improve the efficiency of the cycle on which steam power plants operate. The basic idea behind all the modifications to increase the thermal efficiency of a power cycle is the same: • increase the average temperature at which heat is transferred to the working fluid in the boiler, • or decrease the average temperature at which heat is rejected from the working fluid in the condenser. That is, the average fluid temperature should be as high as possible during heat addition and as low as possible during heat rejection. Next, we discuss three ways of accomplishing this for the simple ideal Rankine cycle. 3.4.1 Lowering the Condenser Pressure (Lowers Tlow, av) Steam exists as a saturated mixture in the condenser at the saturation temperature corresponding to the pressure inside the condenser. Therefore, lowering the operating pressure of the condenser automatically lowers the temperature of the steam, and thus the temperature at which heat is rejected. The effect of lowering the condenser pressure on the Rankine cycle efficiency is illustrated on a T-s diagram in Fig. 30. For comparison purposes, the turbine inlet state is maintained the same. The colored area on this diagram represents the increase in net work output as a result of lowering the condenser pressure from P4 to P4
’. The heat input requirements also increase
50
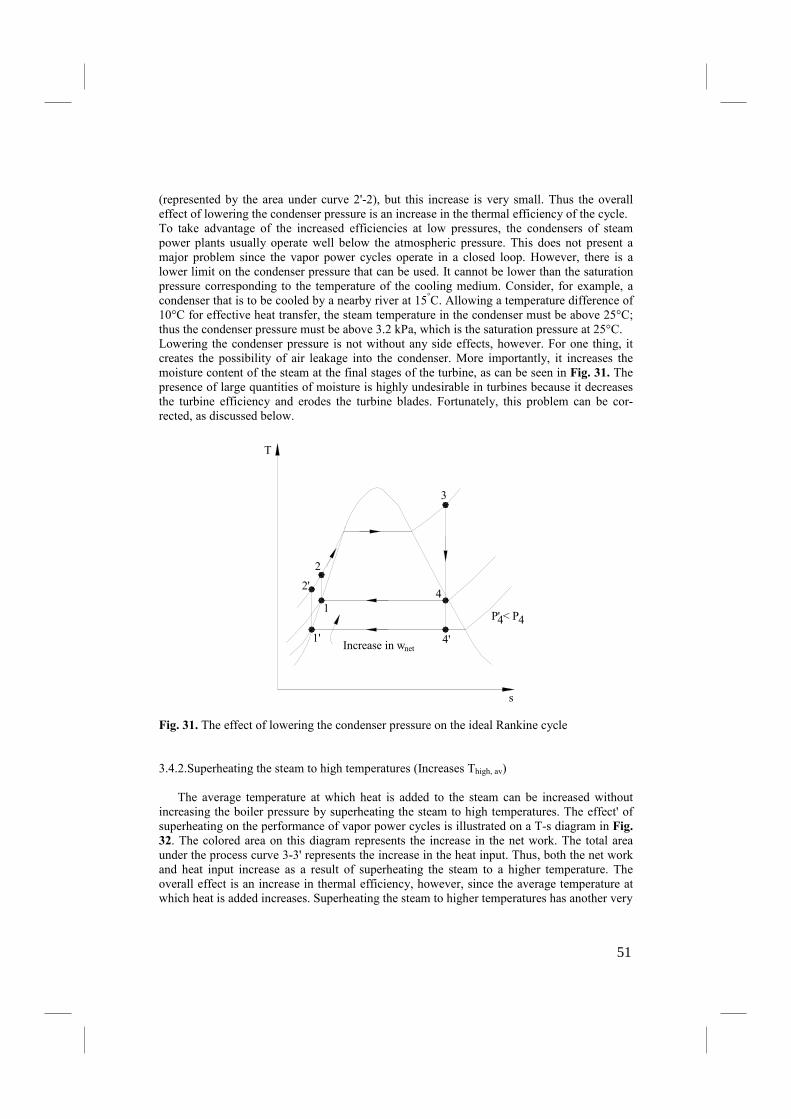
(represented by the area under curve 2'-2), but this increase is very small. Thus the overall effect of lowering the condenser pressure is an increase in the thermal efficiency of the cycle. To take advantage of the increased efficiencies at low pressures, the condensers of steam power plants usually operate well below the atmospheric pressure. This does not present a major problem since the vapor power cycles operate in a closed loop. However, there is a lower limit on the condenser pressure that can be used. It cannot be lower than the saturation pressure corresponding to the temperature of the cooling medium. Consider, for example, a condenser that is to be cooled by a nearby river at 15°C. Allowing a temperature difference of 10°C for effective heat transfer, the steam temperature in the condenser must be above 25°C; thus the condenser pressure must be above 3.2 kPa, which is the saturation pressure at 25°C. Lowering the condenser pressure is not without any side effects, however. For one thing, it creates the possibility of air leakage into the condenser. More importantly, it increases the moisture content of the steam at the final stages of the turbine, as can be seen in Fig. 31. The presence of large quantities of moisture is highly undesirable in turbines because it decreases the turbine efficiency and erodes the turbine blades. Fortunately, this problem can be cor-rected, as discussed below.
Increase in wnet
1
1'
2
2'4
4'
3
T
s
P' < P4 4
Fig. 31. The effect of lowering the condenser pressure on the ideal Rankine cycle 3.4.2.Superheating the steam to high temperatures (Increases Thigh, av) The average temperature at which heat is added to the steam can be increased without increasing the boiler pressure by superheating the steam to high temperatures. The effect' of superheating on the performance of vapor power cycles is illustrated on a T-s diagram in Fig. 32. The colored area on this diagram represents the increase in the net work. The total area under the process curve 3-3' represents the increase in the heat input. Thus, both the net work and heat input increase as a result of superheating the steam to a higher temperature. The overall effect is an increase in thermal efficiency, however, since the average temperature at which heat is added increases. Superheating the steam to higher temperatures has another very
51
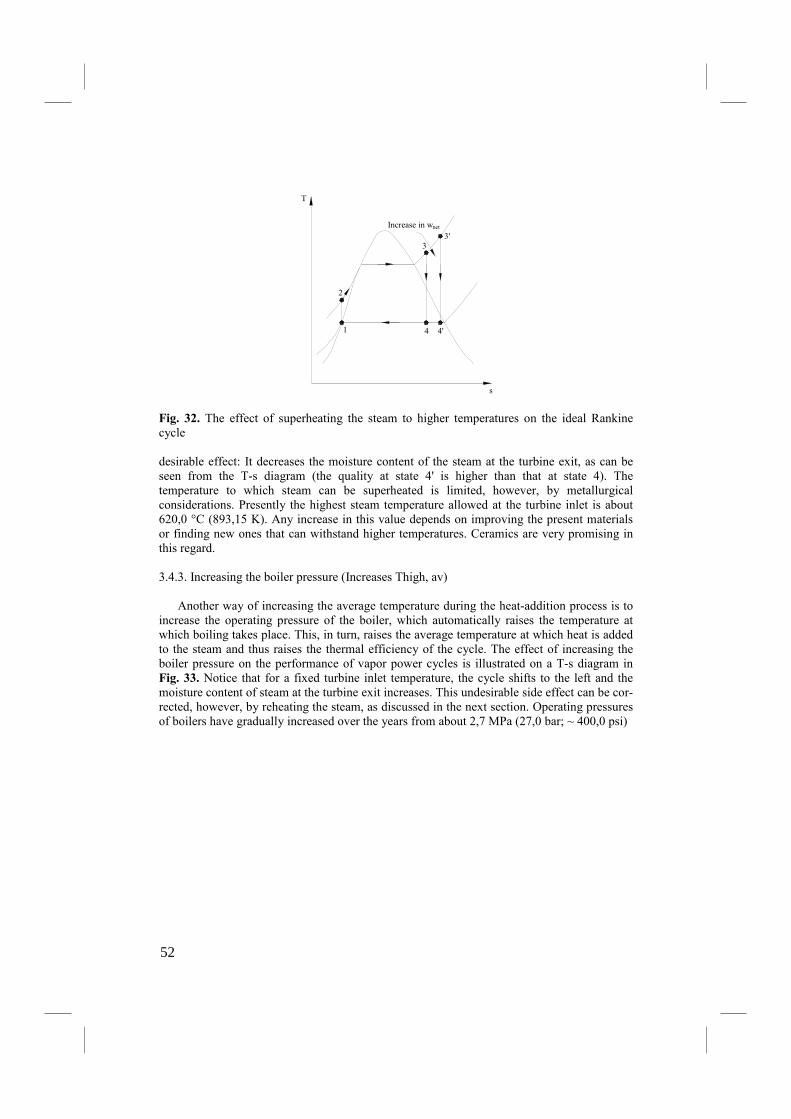
4
Increase in w
2
1
T
3
s
net
3'
4'
Fig. 32. The effect of superheating the steam to higher temperatures on the ideal Rankine cycle desirable effect: It decreases the moisture content of the steam at the turbine exit, as can be seen from the T-s diagram (the quality at state 4' is higher than that at state 4). The temperature to which steam can be superheated is limited, however, by metallurgical considerations. Presently the highest steam temperature allowed at the turbine inlet is about 620,0 °C (893,15 K). Any increase in this value depends on improving the present materials or finding new ones that can withstand higher temperatures. Ceramics are very promising in this regard. 3.4.3. Increasing the boiler pressure (Increases Thigh, av) Another way of increasing the average temperature during the heat-addition process is to increase the operating pressure of the boiler, which automatically raises the temperature at which boiling takes place. This, in turn, raises the average temperature at which heat is added to the steam and thus raises the thermal efficiency of the cycle. The effect of increasing the boiler pressure on the performance of vapor power cycles is illustrated on a T-s diagram in Fig. 33. Notice that for a fixed turbine inlet temperature, the cycle shifts to the left and the moisture content of steam at the turbine exit increases. This undesirable side effect can be cor-rected, however, by reheating the steam, as discussed in the next section. Operating pressures of boilers have gradually increased over the years from about 2,7 MPa (27,0 bar; ~ 400,0 psi)
52
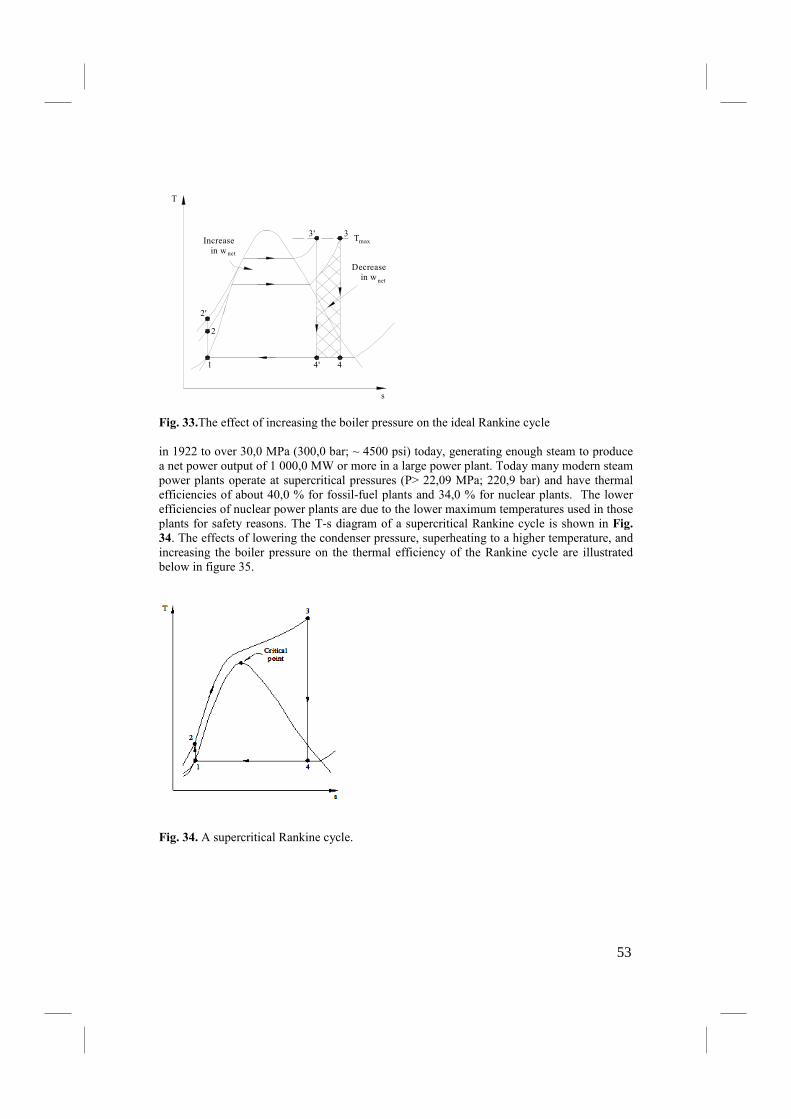
net
Increase in w
1
2
2'
T
44'
s
3' 3 Tmax
Decrease in w net
Fig. 33.The effect of increasing the boiler pressure on the ideal Rankine cycle in 1922 to over 30,0 MPa (300,0 bar; ~ 4500 psi) today, generating enough steam to produce a net power output of 1 000,0 MW or more in a large power plant. Today many modern steam power plants operate at supercritical pressures (P> 22,09 MPa; 220,9 bar) and have thermal efficiencies of about 40,0 % for fossil-fuel plants and 34,0 % for nuclear plants. The lower efficiencies of nuclear power plants are due to the lower maximum temperatures used in those plants for safety reasons. The T-s diagram of a supercritical Rankine cycle is shown in Fig. 34. The effects of lowering the condenser pressure, superheating to a higher temperature, and increasing the boiler pressure on the thermal efficiency of the Rankine cycle are illustrated below in figure 35.
Fig. 34. A supercritical Rankine cycle.
53
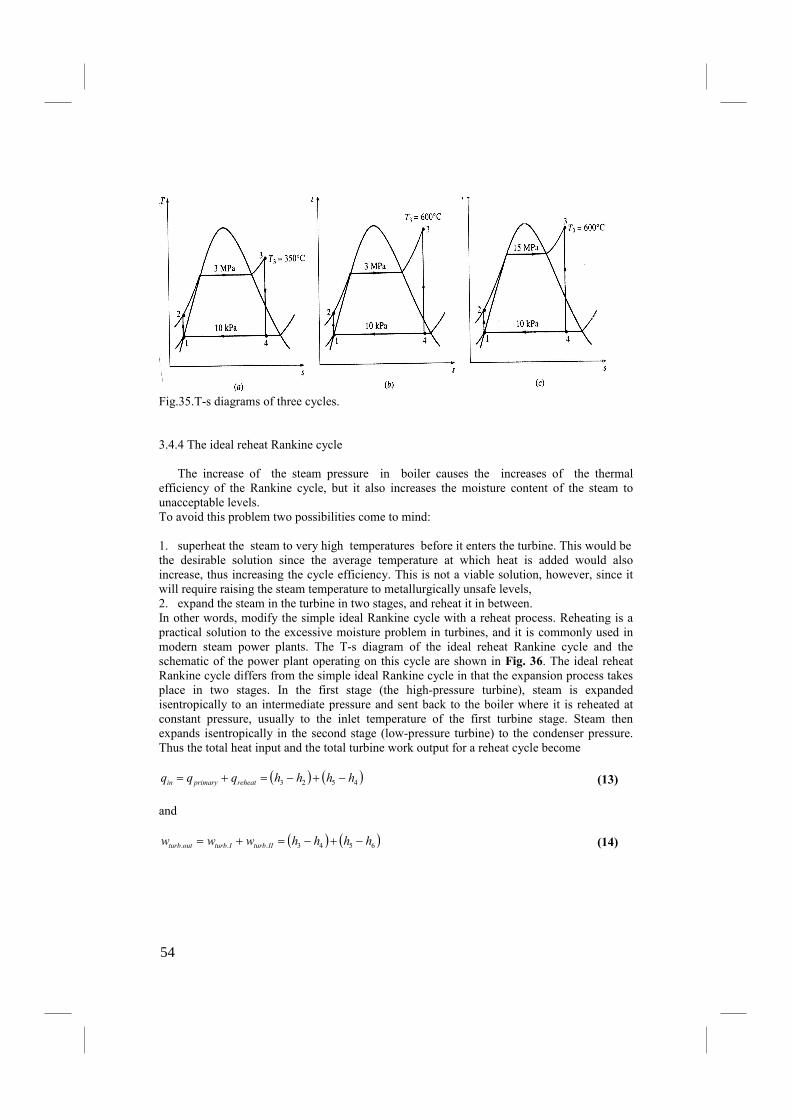
Fig.35.T-s diagrams of three cycles. 3.4.4 The ideal reheat Rankine cycle The increase of the steam pressure in boiler causes the increases of the thermal efficiency of the Rankine cycle, but it also increases the moisture content of the steam to unacceptable levels. To avoid this problem two possibilities come to mind: 1. superheat the steam to very high temperatures before it enters the turbine. This would be the desirable solution since the average temperature at which heat is added would also increase, thus increasing the cycle efficiency. This is not a viable solution, however, since it will require raising the steam temperature to metallurgically unsafe levels, 2. expand the steam in the turbine in two stages, and reheat it in between. In other words, modify the simple ideal Rankine cycle with a reheat process. Reheating is a practical solution to the excessive moisture problem in turbines, and it is commonly used in modern steam power plants. The T-s diagram of the ideal reheat Rankine cycle and the schematic of the power plant operating on this cycle are shown in Fig. 36. The ideal reheat Rankine cycle differs from the simple ideal Rankine cycle in that the expansion process takes place in two stages. In the first stage (the high-pressure turbine), steam is expanded isentropically to an intermediate pressure and sent back to the boiler where it is reheated at constant pressure, usually to the inlet temperature of the first turbine stage. Steam then expands isentropically in the second stage (low-pressure turbine) to the condenser pressure. Thus the total heat input and the total turbine work output for a reheat cycle become
( ) ( )4523 hhhhqqq reheatprimaryin −+−=+= (13)
and
( ) ( )6543... hhhhwww IIturbIturboutturb −+−=+= (14)
54
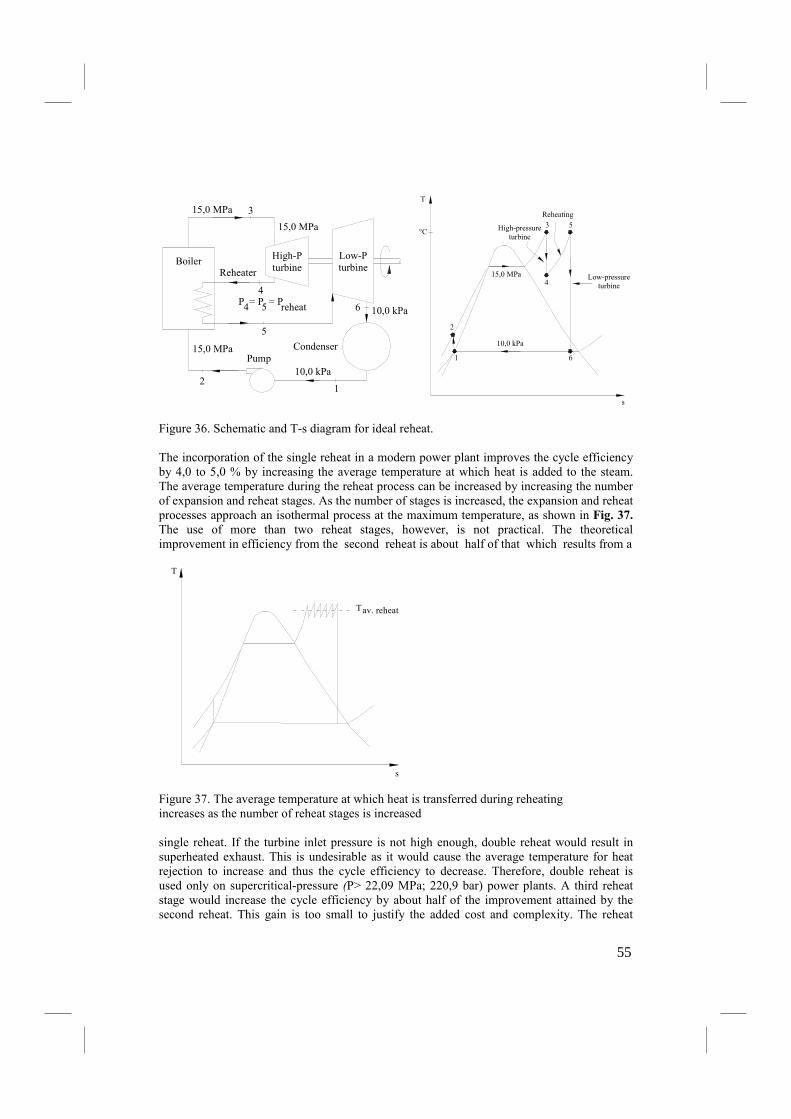
Boiler
3
4
5
21
Reheater
PumpCondenser
High-P turbine
Low-P turbine
P = P = P4 5 reheat
15,0 MPa
15,0 MPa
15,0 MPa
10,0 kPa
10,0 kPa6
T
s
6
Low-pressure turbine
1
2
3
4
5High-pressure turbine
Reheating
600,0 °C
15,0 MPa
10,0 kPa
Figure 36. Schematic and T-s diagram for ideal reheat. The incorporation of the single reheat in a modern power plant improves the cycle efficiency by 4,0 to 5,0 % by increasing the average temperature at which heat is added to the steam. The average temperature during the reheat process can be increased by increasing the number of expansion and reheat stages. As the number of stages is increased, the expansion and reheat processes approach an isothermal process at the maximum temperature, as shown in Fig. 37. The use of more than two reheat stages, however, is not practical. The theoretical improvement in efficiency from the second reheat is about half of that which results from a
av. reheatT
T
s Figure 37. The average temperature at which heat is transferred during reheating increases as the number of reheat stages is increased single reheat. If the turbine inlet pressure is not high enough, double reheat would result in superheated exhaust. This is undesirable as it would cause the average temperature for heat rejection to increase and thus the cycle efficiency to decrease. Therefore, double reheat is used only on supercritical-pressure (P> 22,09 MPa; 220,9 bar) power plants. A third reheat stage would increase the cycle efficiency by about half of the improvement attained by the second reheat. This gain is too small to justify the added cost and complexity. The reheat
55
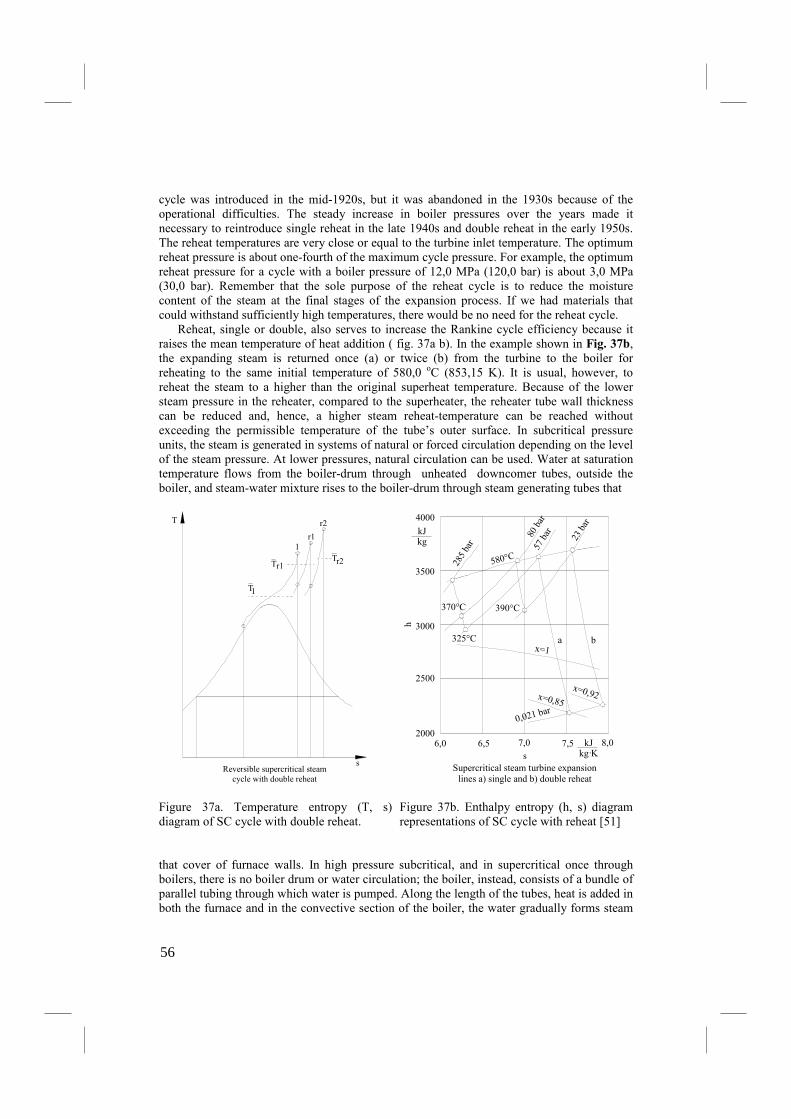
cycle was introduced in the mid-1920s, but it was abandoned in the 1930s because of the operational difficulties. The steady increase in boiler pressures over the years made it necessary to reintroduce single reheat in the late 1940s and double reheat in the early 1950s. The reheat temperatures are very close or equal to the turbine inlet temperature. The optimum reheat pressure is about one-fourth of the maximum cycle pressure. For example, the optimum reheat pressure for a cycle with a boiler pressure of 12,0 MPa (120,0 bar) is about 3,0 MPa (30,0 bar). Remember that the sole purpose of the reheat cycle is to reduce the moisture content of the steam at the final stages of the expansion process. If we had materials that could withstand sufficiently high temperatures, there would be no need for the reheat cycle. Reheat, single or double, also serves to increase the Rankine cycle efficiency because it raises the mean temperature of heat addition ( fig. 37a b). In the example shown in Fig. 37b, the expanding steam is returned once (a) or twice (b) from the turbine to the boiler for reheating to the same initial temperature of 580,0 oC (853,15 K). It is usual, however, to reheat the steam to a higher than the original superheat temperature. Because of the lower steam pressure in the reheater, compared to the superheater, the reheater tube wall thickness can be reduced and, hence, a higher steam reheat-temperature can be reached without exceeding the permissible temperature of the tube’s outer surface. In subcritical pressure units, the steam is generated in systems of natural or forced circulation depending on the level of the steam pressure. At lower pressures, natural circulation can be used. Water at saturation temperature flows from the boiler-drum through unheated downcomer tubes, outside the boiler, and steam-water mixture rises to the boiler-drum through steam generating tubes that
Reversible supercritical steamcycle with double reheat
s
r1
T1
r1T
1
r2T
T r2
Figure 37a. Temperature entropy (T, s) diagram of SC cycle with double reheat.
kJ
kJkg
0,021 bar
390°C
7,57,06,56,02000
2500
3000
3500
4000
Supercritical steam turbine expansion lines a) single and b) double reheat
s
h
a b
285 bar
80 bar
57 bar 23 bar
580°C
325°C
370°C
x=1
x=0,92x=0,85
kg·K8,0
Figure 37b. Enthalpy entropy (h, s) diagram representations of SC cycle with reheat [51]
that cover of furnace walls. In high pressure subcritical, and in supercritical once through boilers, there is no boiler drum or water circulation; the boiler, instead, consists of a bundle of parallel tubing through which water is pumped. Along the length of the tubes, heat is added in both the furnace and in the convective section of the boiler, the water gradually forms steam
56
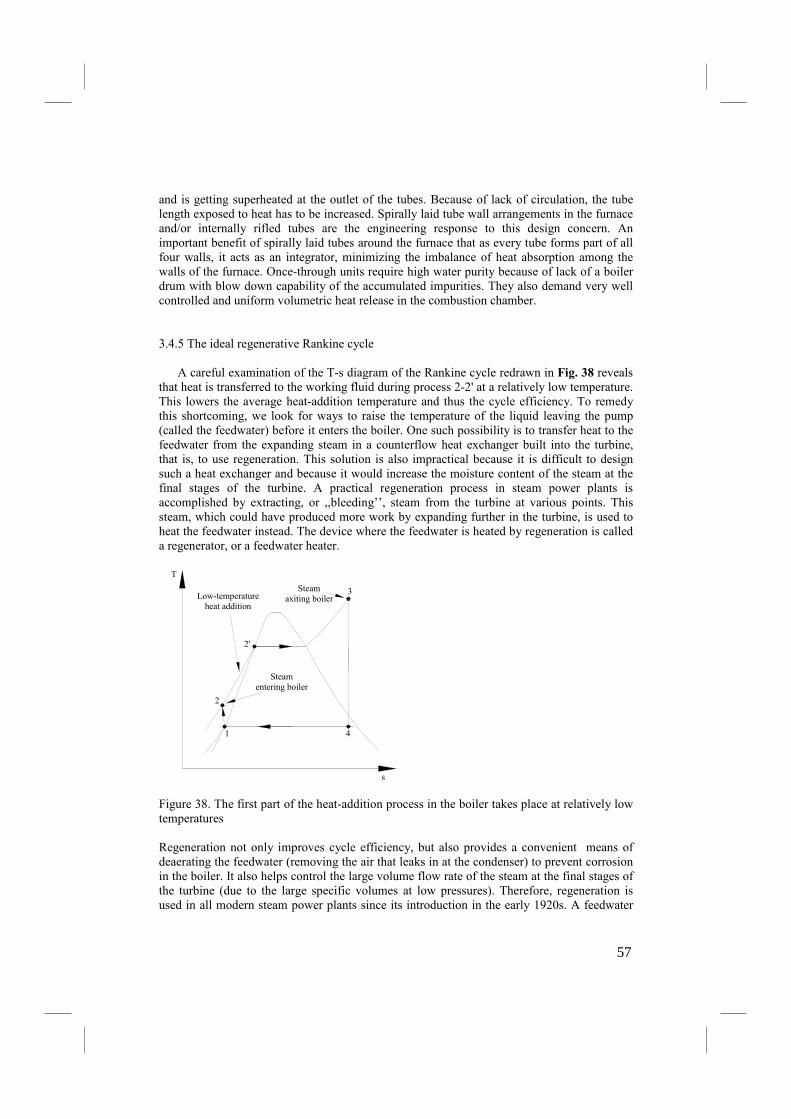
and is getting superheated at the outlet of the tubes. Because of lack of circulation, the tube length exposed to heat has to be increased. Spirally laid tube wall arrangements in the furnace and/or internally rifled tubes are the engineering response to this design concern. An important benefit of spirally laid tubes around the furnace that as every tube forms part of all four walls, it acts as an integrator, minimizing the imbalance of heat absorption among the walls of the furnace. Once-through units require high water purity because of lack of a boiler drum with blow down capability of the accumulated impurities. They also demand very well controlled and uniform volumetric heat release in the combustion chamber. 3.4.5 The ideal regenerative Rankine cycle A careful examination of the T-s diagram of the Rankine cycle redrawn in Fig. 38 reveals that heat is transferred to the working fluid during process 2-2' at a relatively low temperature. This lowers the average heat-addition temperature and thus the cycle efficiency. To remedy this shortcoming, we look for ways to raise the temperature of the liquid leaving the pump (called the feedwater) before it enters the boiler. One such possibility is to transfer heat to the feedwater from the expanding steam in a counterflow heat exchanger built into the turbine, that is, to use regeneration. This solution is also impractical because it is difficult to design such a heat exchanger and because it would increase the moisture content of the steam at the final stages of the turbine. A practical regeneration process in steam power plants is accomplished by extracting, or ,,bleeding’’, steam from the turbine at various points. This steam, which could have produced more work by expanding further in the turbine, is used to heat the feedwater instead. The device where the feedwater is heated by regeneration is called a regenerator, or a feedwater heater.
4
Low-temperature heat addition
Steam entering boiler
Steam axiting boiler
1
2
2'
3
T
s Figure 38. The first part of the heat-addition process in the boiler takes place at relatively low temperatures Regeneration not only improves cycle efficiency, but also provides a convenient means of deaerating the feedwater (removing the air that leaks in at the condenser) to prevent corrosion in the boiler. It also helps control the large volume flow rate of the steam at the final stages of the turbine (due to the large specific volumes at low pressures). Therefore, regeneration is used in all modern steam power plants since its introduction in the early 1920s. A feedwater
57
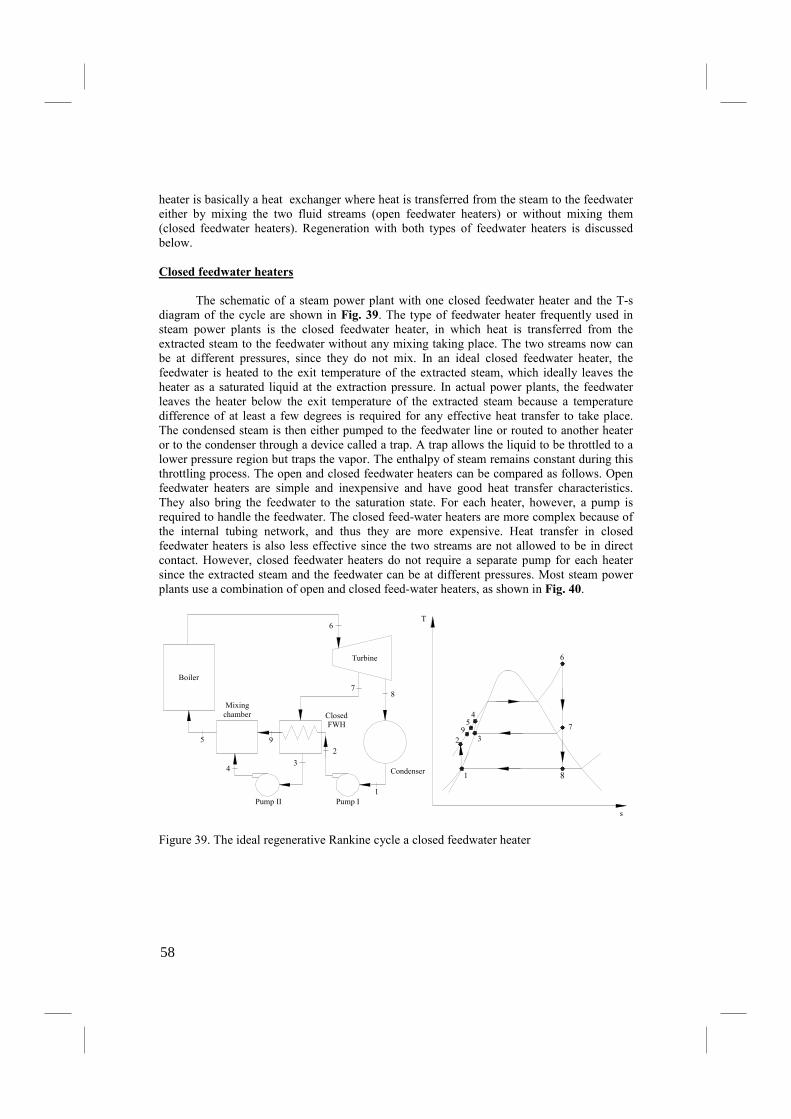
heater is basically a heat exchanger where heat is transferred from the steam to the feedwater either by mixing the two fluid streams (open feedwater heaters) or without mixing them (closed feedwater heaters). Regeneration with both types of feedwater heaters is discussed below.
Closed feedwater heaters The schematic of a steam power plant with one closed feedwater heater and the T-s diagram of the cycle are shown in Fig. 39. The type of feedwater heater frequently used in steam power plants is the closed feedwater heater, in which heat is transferred from the extracted steam to the feedwater without any mixing taking place. The two streams now can be at different pressures, since they do not mix. In an ideal closed feedwater heater, the feedwater is heated to the exit temperature of the extracted steam, which ideally leaves the heater as a saturated liquid at the extraction pressure. In actual power plants, the feedwater leaves the heater below the exit temperature of the extracted steam because a temperature difference of at least a few degrees is required for any effective heat transfer to take place. The condensed steam is then either pumped to the feedwater line or routed to another heater or to the condenser through a device called a trap. A trap allows the liquid to be throttled to a lower pressure region but traps the vapor. The enthalpy of steam remains constant during this throttling process. The open and closed feedwater heaters can be compared as follows. Open feedwater heaters are simple and inexpensive and have good heat transfer characteristics. They also bring the feedwater to the saturation state. For each heater, however, a pump is required to handle the feedwater. The closed feed-water heaters are more complex because of the internal tubing network, and thus they are more expensive. Heat transfer in closed feedwater heaters is also less effective since the two streams are not allowed to be in direct contact. However, closed feedwater heaters do not require a separate pump for each heater since the extracted steam and the feedwater can be at different pressures. Most steam power plants use a combination of open and closed feed-water heaters, as shown in Fig. 40.
T
81
45
92
6
7
3
s
Condenser
Pump II
4
Pump I
3
1
Mixing chamber
5
Boiler
9
Closed FWH
2
78
6
Turbine
Figure 39. The ideal regenerative Rankine cycle a closed feedwater heater
58

Turbine
Condenser
Pump
Pump
Trap Trap Trap
ClosedFWH
ClosedFWH
OpenFWH
ClosedFWH
DeaeratingBoiler
Figure 40. A steam power plant with one open and three closed feedwater heaters
59

CHAPTER 4 Supercritical steam plant (PC/SC)
PC/SC have been in use since the 1930s, mainly in Europe, and since the 1960s sporadically also in the US, but improvements in materials, and increasing demand for higher efficiency are making this system presently the choice of new coal-fired utility plant worldwide. A schematic of advanced PC-fired forced circulation boiler equipped with scrubbers for flue gas desulfurization (FGD) and selective catalytic reactor (SCR) for deep reduction of NOx is shown in Fig. 41. The efficiency of PC/SC power plant can be increased in small steps to 45,0 % (LHV) and beyond, as illustrated by Schilling in Fig. 42. The first two steps in the diagram concern the waste gas heat loss, the largest of a boiler’s heat losses, about 6,0÷8,0 %. More significant increase of power generation efficiency results from applying SC and USC boiler i.e. the steam parameters are higher than critical point ( 22,4 MPa) and steam temperature above 600oC. That effect is visible in diagram in fig.42.
Feed water
Lime emulsion
Ammonia
4
Gypsum
Flue-gas train
Cleaned flue gas
7 6
104
Fly ash Coal
Air
12
11Ash
Boiler house
Flue gas
2
5
3
11
1 Main steam
Power distribution grid
Cooling tower
Circulation water
Condensate
9
10
Fresh water
10
Tower building
8Electric power
1413
Cooling air
Figure 41. Advanced pulverized coal-fired power plant [52] 1– steam generator, 2– DeNOx plant, 3– air preheater, 4– fan, 5– electrostatic precipitator, 6– desulfurization plant, 7– stack, 8– steam turbine, 9– condenser, 10– pump, 11– feed water tank, 13– generator, 14– transformer
60
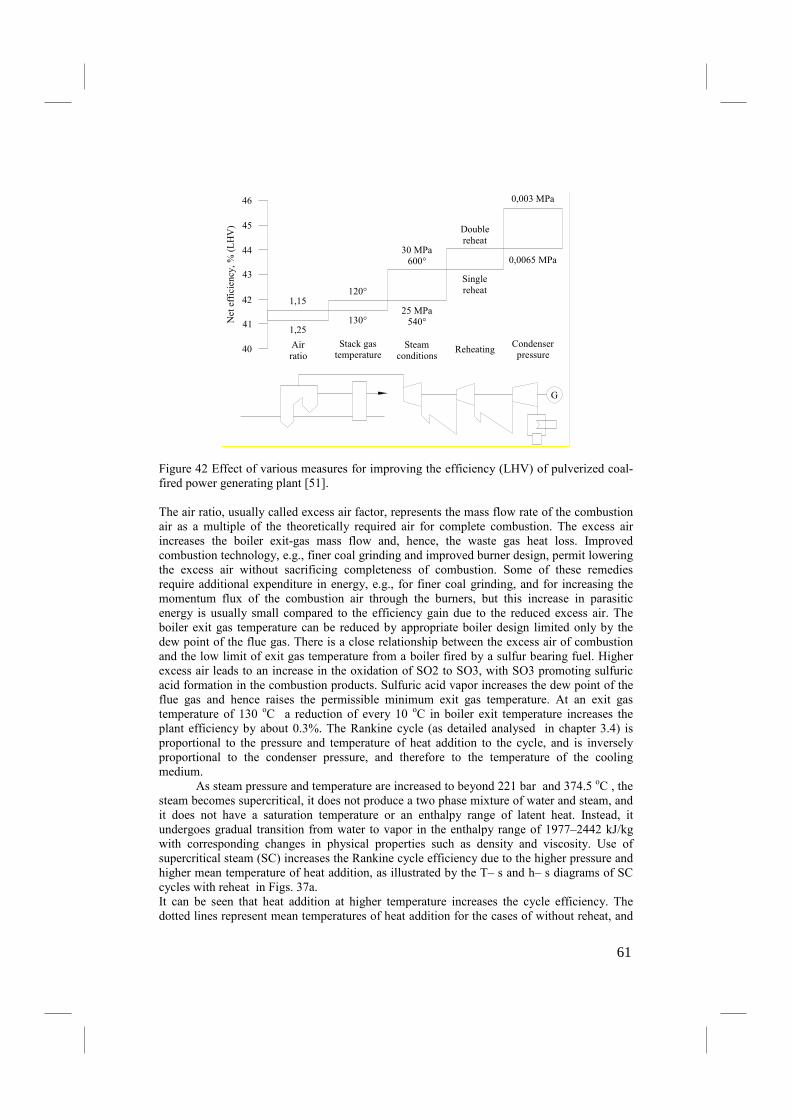
46
45
44
43
42
41
40
1,15
1,25
120°
130°Net efficiency, %
(LHV)
30 MPa600°
25 MPa540°
Double reheat
Single reheat
0,003 MPa
0,0065 MPa
Air ratio
Stack gas temperature
Steam conditions
ReheatingCondenser pressure
G
Figure 42 Effect of various measures for improving the efficiency (LHV) of pulverized coal-fired power generating plant [51]. The air ratio, usually called excess air factor, represents the mass flow rate of the combustion air as a multiple of the theoretically required air for complete combustion. The excess air increases the boiler exit-gas mass flow and, hence, the waste gas heat loss. Improved combustion technology, e.g., finer coal grinding and improved burner design, permit lowering the excess air without sacrificing completeness of combustion. Some of these remedies require additional expenditure in energy, e.g., for finer coal grinding, and for increasing the momentum flux of the combustion air through the burners, but this increase in parasitic energy is usually small compared to the efficiency gain due to the reduced excess air. The boiler exit gas temperature can be reduced by appropriate boiler design limited only by the dew point of the flue gas. There is a close relationship between the excess air of combustion and the low limit of exit gas temperature from a boiler fired by a sulfur bearing fuel. Higher excess air leads to an increase in the oxidation of SO2 to SO3, with SO3 promoting sulfuric acid formation in the combustion products. Sulfuric acid vapor increases the dew point of the flue gas and hence raises the permissible minimum exit gas temperature. At an exit gas temperature of 130 oC a reduction of every 10 oC in boiler exit temperature increases the plant efficiency by about 0.3%. The Rankine cycle (as detailed analysed in chapter 3.4) is proportional to the pressure and temperature of heat addition to the cycle, and is inversely proportional to the condenser pressure, and therefore to the temperature of the cooling medium.
As steam pressure and temperature are increased to beyond 221 bar and 374.5 oC , the steam becomes supercritical, it does not produce a two phase mixture of water and steam, and it does not have a saturation temperature or an enthalpy range of latent heat. Instead, it undergoes gradual transition from water to vapor in the enthalpy range of 1977–2442 kJ/kg with corresponding changes in physical properties such as density and viscosity. Use of supercritical steam (SC) increases the Rankine cycle efficiency due to the higher pressure and higher mean temperature of heat addition, as illustrated by the T– s and h– s diagrams of SC cycles with reheat in Figs. 37a. It can be seen that heat addition at higher temperature increases the cycle efficiency. The dotted lines represent mean temperatures of heat addition for the cases of without reheat, and
61
with single and double reheat, respectively. In order to avoid unacceptably high moisture content of the expanding steam at the low-pressure stages of the steam turbine (a condition favored by high initial steam pressure), the steam, after partial expansion in the turbine, is taken back to the boiler to be reheated. The enthalpy–entropy (h– s) diagram includes lines representing constant moisture concentrations (x) of the wet saturated steam. It can be seen that as a result of reheating the moisture content of the expanding steam is reduced. It is usual, for unit with SC boiler, to reheat the steam to a higher than the original superheat temperature. Because of the lower steam pressure in the reheater, compared to the superheater, the reheater tube wall thickness can be reduced and, hence, a higher steam reheat-temperature can be reached without exceeding the permissible temperature of the tube’s outer surface. In subcritical pressure units, the steam is generated in systems of natural or forced circulation depending on the level of the steam pressure. At lower pressures, natural circulation can be used. Water at saturation temperature flows from the boiler-drum through unheated down tubes, outside the boiler, and steam–water mixture rises to the boiler-drum through steam generating tubes that cover the fire side of furnace walls. In high-pressure subcritical, and in supercritical once through boilers, there is no boiler drum or water circulation; the boiler, instead, consists of a bundle of parallel tubing through which water is pumped. Along the length of the tubes heat is added in both the furnace and in the convective section of the boiler, the water gradually forms steam and is getting superheated at the outlet of the tubes. Because of lack of circulation, the tube length exposed to heat has to be increased. Spirally laid tube wall arrangements in the furnace and /or internally rifled tubes are the engineering response to this design concern . The important benefit of spirally laid tubes around the furnace is that every tube acts as an integrator, minimizing the imbalance of heat absorption among the walls of the furnace. Once-through units require high water purity because of lack of a boiler drum with blow down capability of the accumulated impurities. They also demand very well controlled and uniform volumetric heat release in the combustion chamber because the cooling of boiler tubes by SC occurs at lower heat transfer rates than that by nucleate boiling in subcritical steam. There is renewed interest in SC steam plants today, mainly because of their reduced emissions on account of higher efficiency. SC parameters of 250 bar 540 oC single or double reheat with efficiencies of 41.5% (LHV) represent mature technology. Ultra SC (USC) parameters of 300 bar and 600 oC can be realized today, resulting in efficiencies of 45% (LHV) and higher, for bituminous coal fired power plants. There are several years of experience with these ‘‘600 oC ’’ plants in service, with excellent availability. The improved efficiency represents a reduction of about 15% in the CO2 emission compared to the emission from installed capacity. Further improvement in efficiency achievable by higher USC parameters is dependent on the availability of new, high temperature alloys for boiler membrane wall, superheater and reheater tubes, thick-walled headers and steam turbines. A once-through boiler for supercritical applications is usually applied to systems with a high capacity above 400 MW. In figure 43 the design features with superheater, reheater, economizer, and air heater components is shoved after Babcoc Wilcox .
62
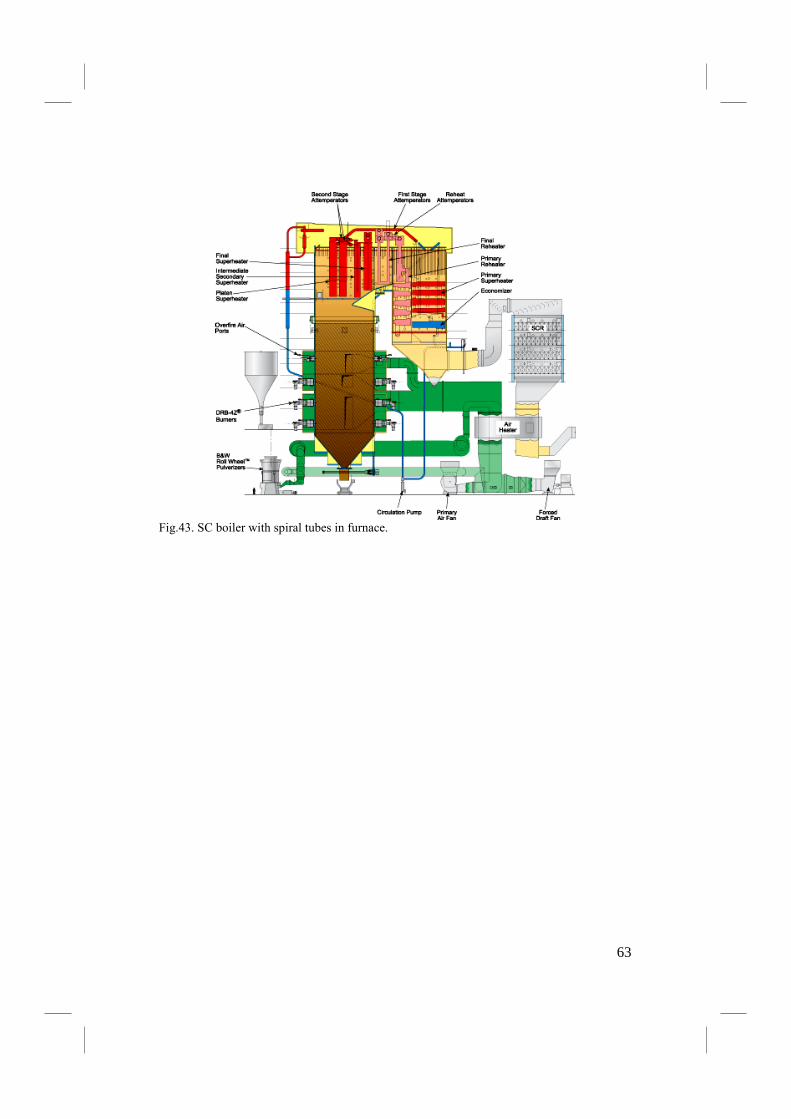
Fig.43. SC boiler with spiral tubes in furnace.
63
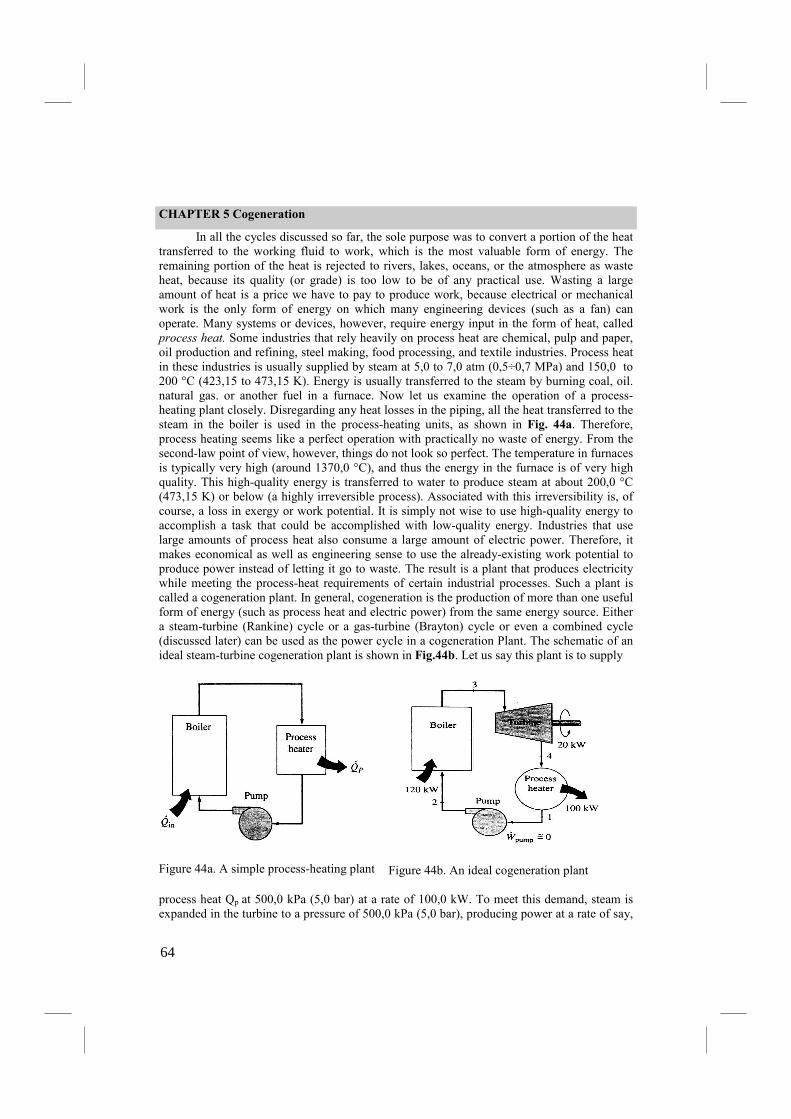
CHAPTER 5 Cogeneration
In all the cycles discussed so far, the sole purpose was to convert a portion of the heat transferred to the working fluid to work, which is the most valuable form of energy. The remaining portion of the heat is rejected to rivers, lakes, oceans, or the atmosphere as waste heat, because its quality (or grade) is too low to be of any practical use. Wasting a large amount of heat is a price we have to pay to produce work, because electrical or mechanical work is the only form of energy on which many engineering devices (such as a fan) can operate. Many systems or devices, however, require energy input in the form of heat, called process heat. Some industries that rely heavily on process heat are chemical, pulp and paper, oil production and refining, steel making, food processing, and textile industries. Process heat in these industries is usually supplied by steam at 5,0 to 7,0 atm (0,5÷0,7 MPa) and 150,0 to 200 °C (423,15 to 473,15 K). Energy is usually transferred to the steam by burning coal, oil. natural gas. or another fuel in a furnace. Now let us examine the operation of a process-heating plant closely. Disregarding any heat losses in the piping, all the heat transferred to the steam in the boiler is used in the process-heating units, as shown in Fig. 44a. Therefore, process heating seems like a perfect operation with practically no waste of energy. From the second-law point of view, however, things do not look so perfect. The temperature in furnaces is typically very high (around 1370,0 °C), and thus the energy in the furnace is of very high quality. This high-quality energy is transferred to water to produce steam at about 200,0 °C (473,15 K) or below (a highly irreversible process). Associated with this irreversibility is, of course, a loss in exergy or work potential. It is simply not wise to use high-quality energy to accomplish a task that could be accomplished with low-quality energy. Industries that use large amounts of process heat also consume a large amount of electric power. Therefore, it makes economical as well as engineering sense to use the already-existing work potential to produce power instead of letting it go to waste. The result is a plant that produces electricity while meeting the process-heat requirements of certain industrial processes. Such a plant is called a cogeneration plant. In general, cogeneration is the production of more than one useful form of energy (such as process heat and electric power) from the same energy source. Either a steam-turbine (Rankine) cycle or a gas-turbine (Brayton) cycle or even a combined cycle (discussed later) can be used as the power cycle in a cogeneration Plant. The schematic of an ideal steam-turbine cogeneration plant is shown in Fig.44b. Let us say this plant is to supply
Figure 44a. A simple process-heating plant
Figure 44b. An ideal cogeneration plant
process heat Qp at 500,0 kPa (5,0 bar) at a rate of 100,0 kW. To meet this demand, steam is expanded in the turbine to a pressure of 500,0 kPa (5,0 bar), producing power at a rate of say,
64
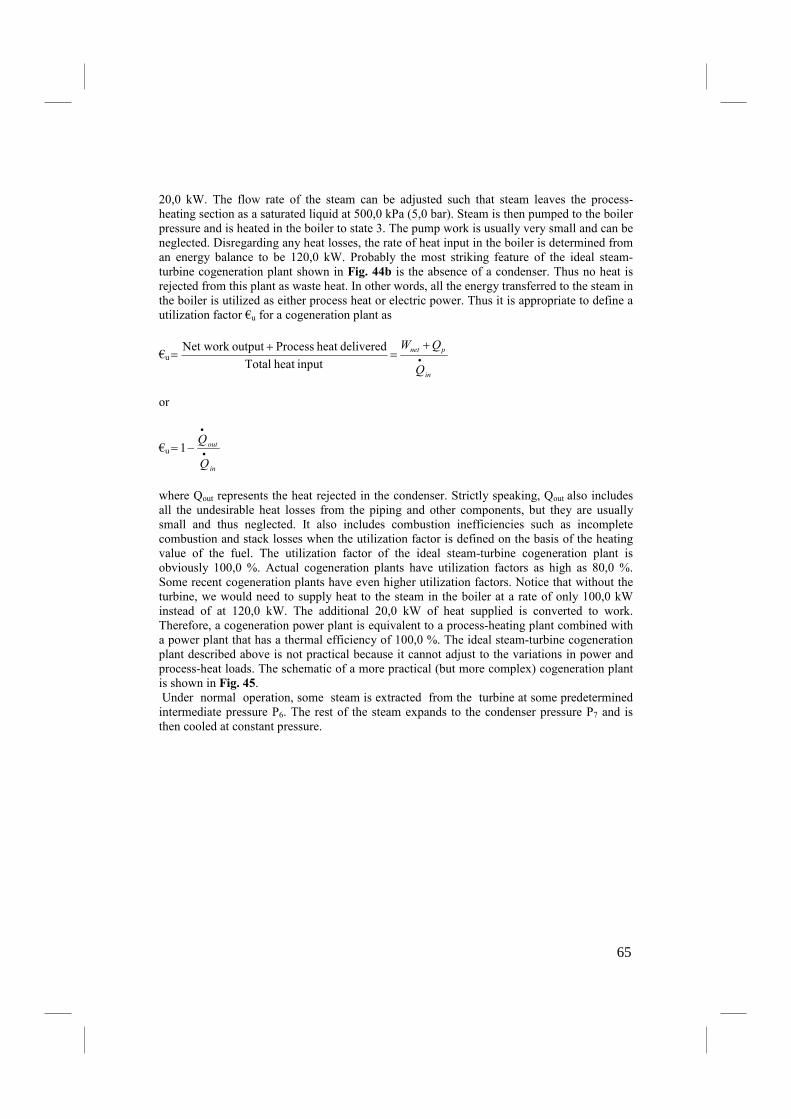
20,0 kW. The flow rate of the steam can be adjusted such that steam leaves the process-heating section as a saturated liquid at 500,0 kPa (5,0 bar). Steam is then pumped to the boiler pressure and is heated in the boiler to state 3. The pump work is usually very small and can be neglected. Disregarding any heat losses, the rate of heat input in the boiler is determined from an energy balance to be 120,0 kW. Probably the most striking feature of the ideal steam-turbine cogeneration plant shown in Fig. 44b is the absence of a condenser. Thus no heat is rejected from this plant as waste heat. In other words, all the energy transferred to the steam in the boiler is utilized as either process heat or electric power. Thus it is appropriate to define a utilization factor €u for a cogeneration plant as
€u
in
pnet
Q
QW•
+=
+=
inputheat Total
deliveredheat ProcessoutputNet work
or
€u
in
out
Q
Q•
•
−= 1
where Qout represents the heat rejected in the condenser. Strictly speaking, Qout also includes all the undesirable heat losses from the piping and other components, but they are usually small and thus neglected. It also includes combustion inefficiencies such as incomplete combustion and stack losses when the utilization factor is defined on the basis of the heating value of the fuel. The utilization factor of the ideal steam-turbine cogeneration plant is obviously 100,0 %. Actual cogeneration plants have utilization factors as high as 80,0 %. Some recent cogeneration plants have even higher utilization factors. Notice that without the turbine, we would need to supply heat to the steam in the boiler at a rate of only 100,0 kW instead of at 120,0 kW. The additional 20,0 kW of heat supplied is converted to work. Therefore, a cogeneration power plant is equivalent to a process-heating plant combined with a power plant that has a thermal efficiency of 100,0 %. The ideal steam-turbine cogeneration plant described above is not practical because it cannot adjust to the variations in power and process-heat loads. The schematic of a more practical (but more complex) cogeneration plant is shown in Fig. 45. Under normal operation, some steam is extracted from the turbine at some predetermined intermediate pressure P6. The rest of the steam expands to the condenser pressure P7 and is then cooled at constant pressure.
65
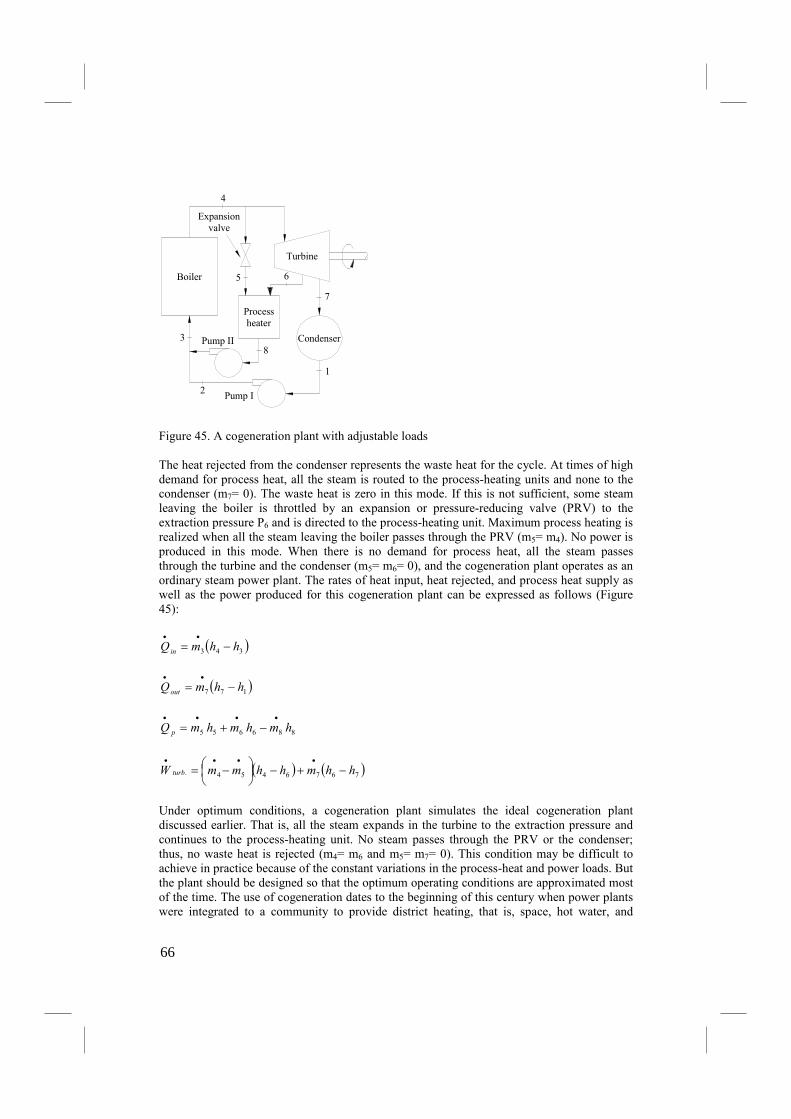
Boiler
Turbine
5 6
7
8
Process heater
Condenser
4
3
2
1
Pump I
Pump II
Expansion valve
Figure 45. A cogeneration plant with adjustable loads The heat rejected from the condenser represents the waste heat for the cycle. At times of high demand for process heat, all the steam is routed to the process-heating units and none to the condenser (m7= 0). The waste heat is zero in this mode. If this is not sufficient, some steam leaving the boiler is throttled by an expansion or pressure-reducing valve (PRV) to the extraction pressure P6 and is directed to the process-heating unit. Maximum process heating is realized when all the steam leaving the boiler passes through the PRV (m5= m4). No power is produced in this mode. When there is no demand for process heat, all the steam passes through the turbine and the condenser (m5= m6= 0), and the cogeneration plant operates as an ordinary steam power plant. The rates of heat input, heat rejected, and process heat supply as well as the power produced for this cogeneration plant can be expressed as follows (Figure 45):
( )343 hhmQin
−=••
( )177 hhmQout
−=••
886655 hmhmhmQ p
••••
−+=
( ) ( )7676454. hhmhhmmW turb −+−
−=
••••
Under optimum conditions, a cogeneration plant simulates the ideal cogeneration plant discussed earlier. That is, all the steam expands in the turbine to the extraction pressure and continues to the process-heating unit. No steam passes through the PRV or the condenser; thus, no waste heat is rejected (m4= m6 and m5= m7= 0). This condition may be difficult to achieve in practice because of the constant variations in the process-heat and power loads. But the plant should be designed so that the optimum operating conditions are approximated most of the time. The use of cogeneration dates to the beginning of this century when power plants were integrated to a community to provide district heating, that is, space, hot water, and
66

process heating for residential and commercial buildings. The district heating systems lost their popularity in the 1940s owing to low fuel prices. However, the rapid rise in fuel prices in the 1970s brought about renewed interest in district heating. Cogeneration plants have proved to be economically very attractive. Consequently, more and more such plants have been installed in recent years. It is projected that 15,0 % of the nation's electricity will be generated from cogeneration plants by the end of the century.
67
CHAPTER 6 Brayton cycle: the ideal cycle for gas-turbine engines
The Brayton cycle is used for gas turbines only where both the compression and expansion processes take place in rotating machinery. Gas turbines usually operate on an open cycle, as shown in Fig. 46. Fresh air at ambient conditions is drawn into the compressor, where its temperature and pressure are raised. The high-pressure air proceeds into the combustion chamber, where the fuel is burned at constant pressure. The resulting high-temperature gases then enter the turbine, where they expand to the atmospheric pressure, thus producing power. The exhaust gases leaving the turbine are thrown out (not recirculated), causing the cycle to be classified as an open cycle. The open gas-turbine cycle described above can be modeled as a closed cycle, as shown in Fig. 47 by utilizing the air-standard assumptions. Here the compression and expansion processes remain the same, but the combustion process is replaced by a constant-pressure heat-addition process from an external source, and the exhaust process is replaced by a constant-pressure heat-rejection process to the ambient air. The ideal cycle that the working fluid undergoes in this closed loop is the Brayton cycle, which is made up of four internally reversible processes:
1-2 isentropic compression (in a compressor) 2-3 constant-pressure heat addition 3-4 isentropic expansion (in a turbine) 4-1 constant-pressure heat rejection
Fuel
1
Compressor Turbine
Freshair
Combustionchamber
23
4Exhaustgases
wnet
Figure 46 An open-cycle gas-turbine engine Figure 47 A closed-cycle gas-turbine
engine The P-v and T-s diagrams of an ideal Brayton cycle are shown in Fig. 48A, B. Notice that all four processes of the Brayton cycle are executed in steady-flow devices; thus, they should
68
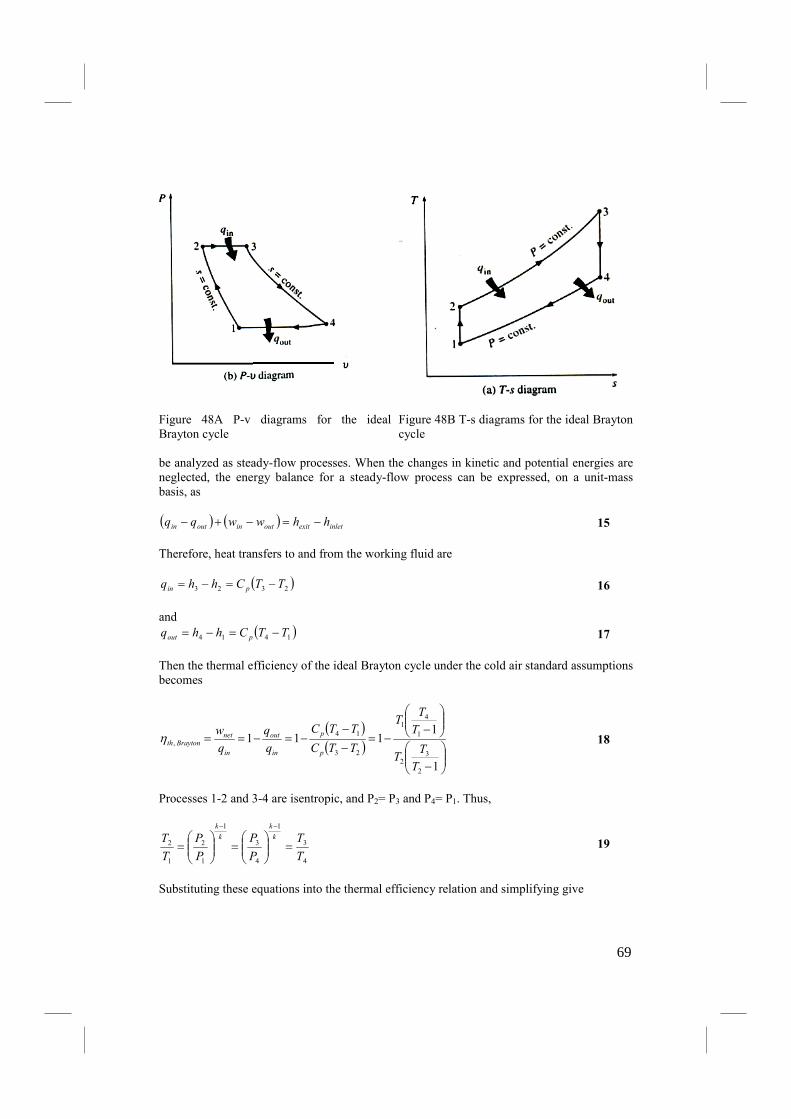
Figure 48A P-v diagrams for the ideal Brayton cycle
Figure 48B T-s diagrams for the ideal Brayton cycle
be analyzed as steady-flow processes. When the changes in kinetic and potential energies are neglected, the energy balance for a steady-flow process can be expressed, on a unit-mass basis, as ( ) ( ) inletexitoutinoutin hhwwqq −=−+− 15
Therefore, heat transfers to and from the working fluid are
( )2323 TTChhq pin −=−= 16
and
( )1414 TTChhq pout −=−= 17
Then the thermal efficiency of the ideal Brayton cycle under the cold air standard assumptions becomes
( )( )
−
−−=
−
−−=−==
1
1111
2
32
1
41
23
14,
T
TT
T
TT
TTC
TTC
q
q
q
w
p
p
in
out
in
netBraytonth η 18
Processes 1-2 and 3-4 are isentropic, and P2= P3 and P4= P1. Thus,
4
3
1
4
3
1
1
2
1
2
T
T
P
P
P
P
T
T k
k
k
k
=
=
=
−−
19
Substituting these equations into the thermal efficiency relation and simplifying give
69

k
k
p
Braytonth
r
1,
11
−−= η
20
where
1
2
P
Prp = (21)
is the pressure ratio and k is the specific heat ratio. Equation 20 shows that under the coId-air-standard assumptions, the thermal efficiency of an ideal Brayton cycle depends on the pressure ratio of the gas turbine and the specific heat ratio of the working fluid. The thermal efficiency increases with both of these parameters, which is also the case for actual gas turbines. A plot of thermal efficiency versus the pressure ratio is given in Fig. 49 for k= 1,4, which is the specific-heat-ratio value of air at room temperature. The highest temperature in the cycle occurs at the end of the combustion process (state 3), and it is limited by the maximum temperature that the turbine blades can withstand. This also limits the pressure ratios that can be used in cycle. For a fixed turbine inlet temperature T3, the net work output per cycle increases with the pressure ratio, reaches a maximum. and then starts to decrease, as shown in Fig. 50. Therefore, there should be a compromise between the pressure ratio (thus the thermal efficiency) and the net work output. With less work output per cycle, a larger mass flow rate (thus a larger system) is needed to maintain the same power output which may not be economical. In most common designs, the pressure ratio of gas turbines ranges from about 11,0 to 16,0. The air in gas turbines performs two important functions: It supplies the necessary oxidant for the combustion of the fuel, and it serves as a coolant to keep the temperature of various components within safe limits. The second function is accomplished by drawing in more air than is needed for the complete combustion of the fuel. In gas turbines, an air-fuel mass ratio of 50 or above is not uncommon. Therefore, in a cycle analysis, treating the combustion gases as air will not cause any appreciable error. Also, the mass flow rate through the turbine will be greater than that through the compressor. the difference being equal to the mass flow rate of the fuel. Thus, assuming a constant mass flow rate throughout the cycle will yield conservative results open-loop gas-turbine engines. The two major application areas of gas-turbine engines are aircraft propulsion and electric power
70
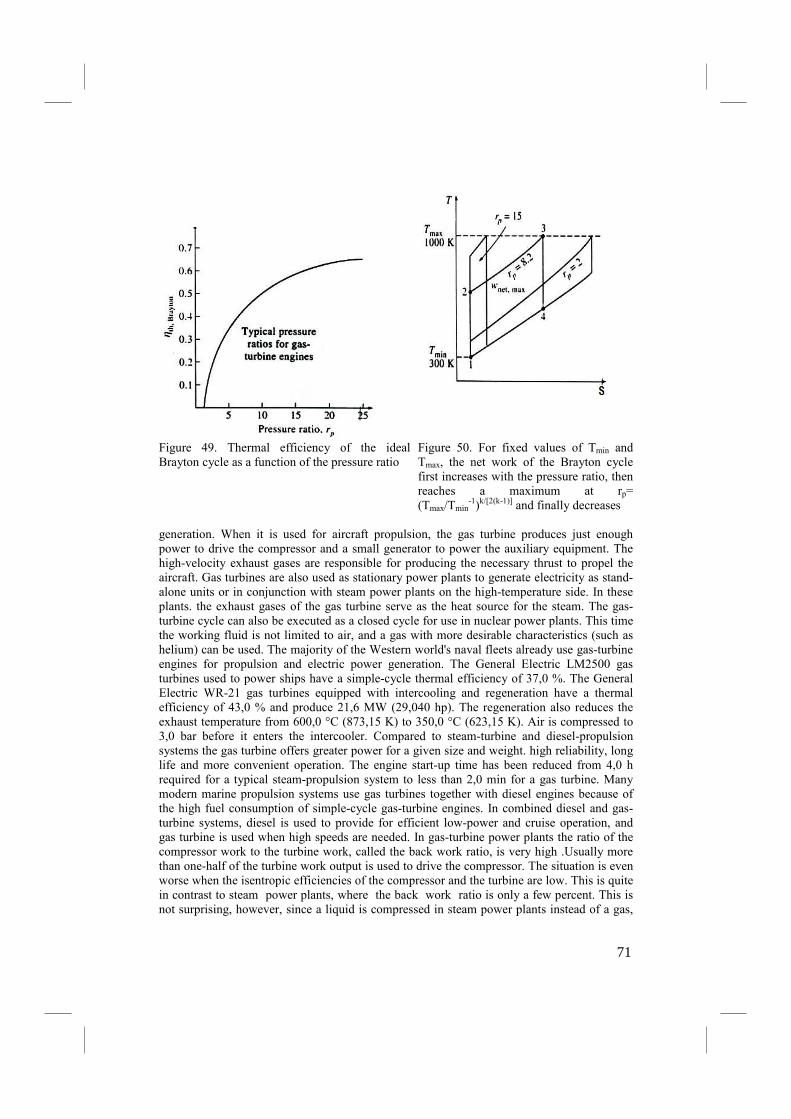
Figure 49. Thermal efficiency of the ideal Brayton cycle as a function of the pressure ratio
Figure 50. For fixed values of Tmin and Tmax, the net work of the Brayton cycle first increases with the pressure ratio, then reaches a maximum at rp= (Tmax/Tmin
-1)k/[2(k-1)] and finally decreases generation. When it is used for aircraft propulsion, the gas turbine produces just enough power to drive the compressor and a small generator to power the auxiliary equipment. The high-velocity exhaust gases are responsible for producing the necessary thrust to propel the aircraft. Gas turbines are also used as stationary power plants to generate electricity as stand-alone units or in conjunction with steam power plants on the high-temperature side. In these plants. the exhaust gases of the gas turbine serve as the heat source for the steam. The gas-turbine cycle can also be executed as a closed cycle for use in nuclear power plants. This time the working fluid is not limited to air, and a gas with more desirable characteristics (such as helium) can be used. The majority of the Western world's naval fleets already use gas-turbine engines for propulsion and electric power generation. The General Electric LM2500 gas turbines used to power ships have a simple-cycle thermal efficiency of 37,0 %. The General Electric WR-21 gas turbines equipped with intercooling and regeneration have a thermal efficiency of 43,0 % and produce 21,6 MW (29,040 hp). The regeneration also reduces the exhaust temperature from 600,0 °C (873,15 K) to 350,0 °C (623,15 K). Air is compressed to 3,0 bar before it enters the intercooler. Compared to steam-turbine and diesel-propulsion systems the gas turbine offers greater power for a given size and weight. high reliability, long life and more convenient operation. The engine start-up time has been reduced from 4,0 h required for a typical steam-propulsion system to less than 2,0 min for a gas turbine. Many modern marine propulsion systems use gas turbines together with diesel engines because of the high fuel consumption of simple-cycle gas-turbine engines. In combined diesel and gas-turbine systems, diesel is used to provide for efficient low-power and cruise operation, and gas turbine is used when high speeds are needed. In gas-turbine power plants the ratio of the compressor work to the turbine work, called the back work ratio, is very high .Usually more than one-half of the turbine work output is used to drive the compressor. The situation is even worse when the isentropic efficiencies of the compressor and the turbine are low. This is quite in contrast to steam power plants, where the back work ratio is only a few percent. This is not surprising, however, since a liquid is compressed in steam power plants instead of a gas,
71
and the reversible steady-flow work is proportional to the specific volume of the working fluid. A power plant with a high back work ratio requires a larger turbine to provide the additional power requirements of the compressor. Therefore, the turbines used in gas-turbine power plants are larger than those used in steam power plants of the same net power output. 6.1 Development of gas turbines The gas turbine has experienced phenomenal progress and growth since its first successful development in the 1930s. The early gas turbines built in the 1940s and even 1950s had simple-cycle efficiencies of about 17,0 % because of the low compressor and turbine efficiencies and low turbine inlet temperatures due to metallurgical limitations of those times. Therefore, gas turbines found only limited use despite their versatility and their ability to burn a variety of fuels. The efforts to improve the cycle efficiency concentrated in three areas: 1. Increasing the turbine inlet (or firing) temperatures This has been the primary approach taken to improve gas-turbine efficiency. The turbine inlet temperatures have increased steadily from about 540,0 °C (813,15 K) in the 1940s to 1425,0 °C (1698,15 K) today. These increases were made possible by the development of new materials and the innovative cooling techniques for the critical components such as coating the turbine blades with ceramic layers and cooling the blades with the discharge air from the compressor. Maintaining high turbine inlet temperatures with air-cooling technique requires the combustion temperature to be higher to compensate for the cooling effect of the cooling air. However. higher combustion temperatures increase the amount of nitrogen oxides (NOx), which are responsible for the formation of ozone at ground level and smog. Using steam as the coolant allowed an increase in the turbine inlet temperatures by 93,3 oC (366,48 K) without an increase in the combustion temperature. Steam is also a much more effective heat transfer medium than air, 2. Increasing the efficiencies of turbomachinery components The performance of early turbines suffered greatly from the inefficiencies of turbines and compressors. However, the advent of computers and advanced techniques for computer-aided design made it possible to design these components aerodynamically with minimal losses. The increased efficiencies of the turbines and compressors resulted in a significant increase in the cycle efficiency, 3. Adding modifications to the basic cycle The simple-cycle efficiencies of early gas turbines were practically doubled by incorporating intercooling, regeneration (or recuperation), and reheating, discussed in the next two sections. These improvements, of course, come at the expense of increased initial and operation costs, and they cannot be justified unless the decrease in fuel costs offsets the increase in other costs. The relatively low fuel prices, the general desire in the industry to minimize installation costs, and the tremendous increase in the simple-cycle efficiency to about 40 percent left little desire for opting for these modifications. The first gas turbine for an electric utility was installed in 1949 in Oklahoma as part of a combined-cycle power plant. It was built by General Electric and produced 3,5 MW of power. Gas turbines installed until mid-1970s suffered from low efficiency and poor reliability. In the past, the base-load electric power generation was dominated by large coal and nuclear power plants. However, there has been an historic shift toward natural gas-fired gas turbines because of their higher efficiencies, lower capital costs, shorter installation times, and better emission characteristics, and the abundance of natural gas supplies, and more and more electric utilities are using gas turbines for base-load power production as well as for peaking. The construction
72
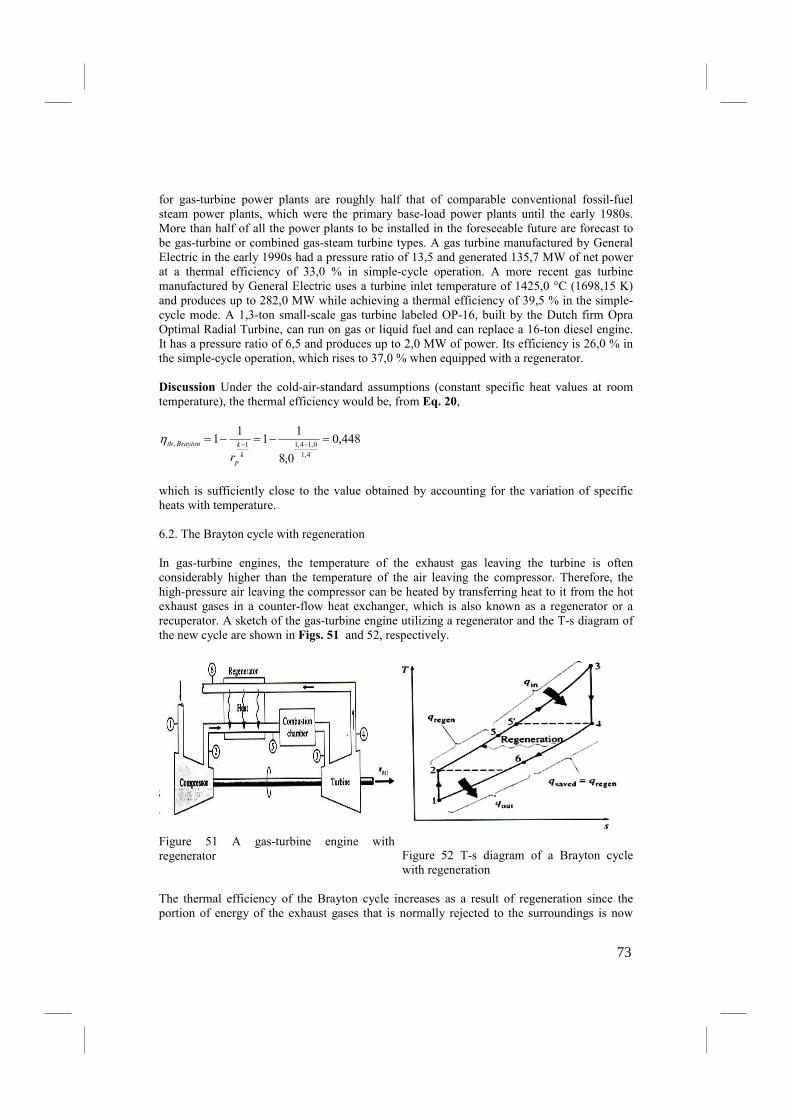
for gas-turbine power plants are roughly half that of comparable conventional fossil-fuel steam power plants, which were the primary base-load power plants until the early 1980s. More than half of all the power plants to be installed in the foreseeable future are forecast to be gas-turbine or combined gas-steam turbine types. A gas turbine manufactured by General Electric in the early 1990s had a pressure ratio of 13,5 and generated 135,7 MW of net power at a thermal efficiency of 33,0 % in simple-cycle operation. A more recent gas turbine manufactured by General Electric uses a turbine inlet temperature of 1425,0 °C (1698,15 K) and produces up to 282,0 MW while achieving a thermal efficiency of 39,5 % in the simple-cycle mode. A 1,3-ton small-scale gas turbine labeled OP-16, built by the Dutch firm Opra Optimal Radial Turbine, can run on gas or liquid fuel and can replace a 16-ton diesel engine. It has a pressure ratio of 6,5 and produces up to 2,0 MW of power. Its efficiency is 26,0 % in the simple-cycle operation, which rises to 37,0 % when equipped with a regenerator. Discussion Under the cold-air-standard assumptions (constant specific heat values at room temperature), the thermal efficiency would be, from Eq. 20,
448,0
0,8
11
11
4,1
0,14,11, =−=−= −−k
k
p
Braytonth
r
η (X.X)
which is sufficiently close to the value obtained by accounting for the variation of specific heats with temperature. 6.2. The Brayton cycle with regeneration In gas-turbine engines, the temperature of the exhaust gas leaving the turbine is often considerably higher than the temperature of the air leaving the compressor. Therefore, the high-pressure air leaving the compressor can be heated by transferring heat to it from the hot exhaust gases in a counter-flow heat exchanger, which is also known as a regenerator or a recuperator. A sketch of the gas-turbine engine utilizing a regenerator and the T-s diagram of the new cycle are shown in Figs. 51 and 52, respectively.
Figure 51 A gas-turbine engine with regenerator
Figure 52 T-s diagram of a Brayton cycle with regeneration
The thermal efficiency of the Brayton cycle increases as a result of regeneration since the portion of energy of the exhaust gases that is normally rejected to the surroundings is now
73
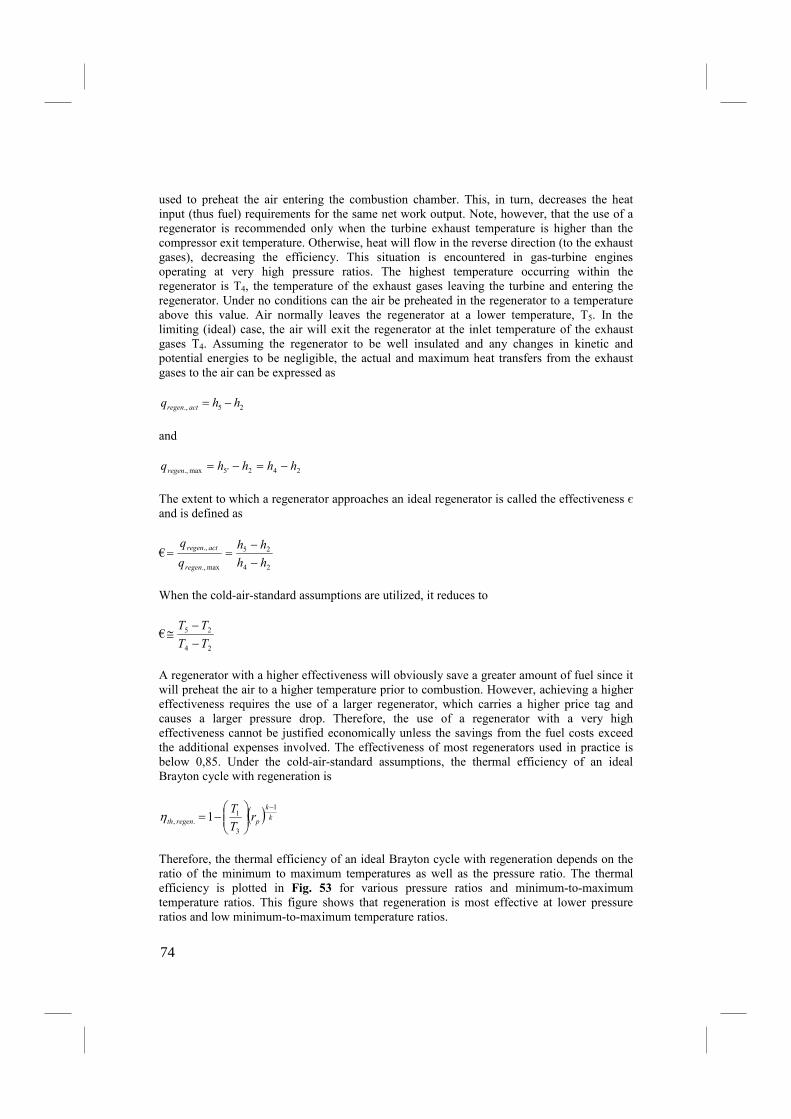
used to preheat the air entering the combustion chamber. This, in turn, decreases the heat input (thus fuel) requirements for the same net work output. Note, however, that the use of a regenerator is recommended only when the turbine exhaust temperature is higher than the compressor exit temperature. Otherwise, heat will flow in the reverse direction (to the exhaust gases), decreasing the efficiency. This situation is encountered in gas-turbine engines operating at very high pressure ratios. The highest temperature occurring within the regenerator is T4, the temperature of the exhaust gases leaving the turbine and entering the regenerator. Under no conditions can the air be preheated in the regenerator to a temperature above this value. Air normally leaves the regenerator at a lower temperature, T5. In the limiting (ideal) case, the air will exit the regenerator at the inlet temperature of the exhaust gases T4. Assuming the regenerator to be well insulated and any changes in kinetic and potential energies to be negligible, the actual and maximum heat transfers from the exhaust gases to the air can be expressed as
25., hhq actregen −=
and
242'5., hhhhqregen −=−=max
The extent to which a regenerator approaches an ideal regenerator is called the effectiveness є and is defined as
€24
25
max.,
.,
hh
hh
q
q
regen
actregen
−
−==
When the cold-air-standard assumptions are utilized, it reduces to
€24
25
TT
TT
−
−≅
A regenerator with a higher effectiveness will obviously save a greater amount of fuel since it will preheat the air to a higher temperature prior to combustion. However, achieving a higher effectiveness requires the use of a larger regenerator, which carries a higher price tag and causes a larger pressure drop. Therefore, the use of a regenerator with a very high effectiveness cannot be justified economically unless the savings from the fuel costs exceed the additional expenses involved. The effectiveness of most regenerators used in practice is below 0,85. Under the cold-air-standard assumptions, the thermal efficiency of an ideal Brayton cycle with regeneration is
( ) k
k
pregenth rT
T 1
3
1., 1
−
−= η
Therefore, the thermal efficiency of an ideal Brayton cycle with regeneration depends on the ratio of the minimum to maximum temperatures as well as the pressure ratio. The thermal efficiency is plotted in Fig. 53 for various pressure ratios and minimum-to-maximum temperature ratios. This figure shows that regeneration is most effective at lower pressure ratios and low minimum-to-maximum temperature ratios.
74
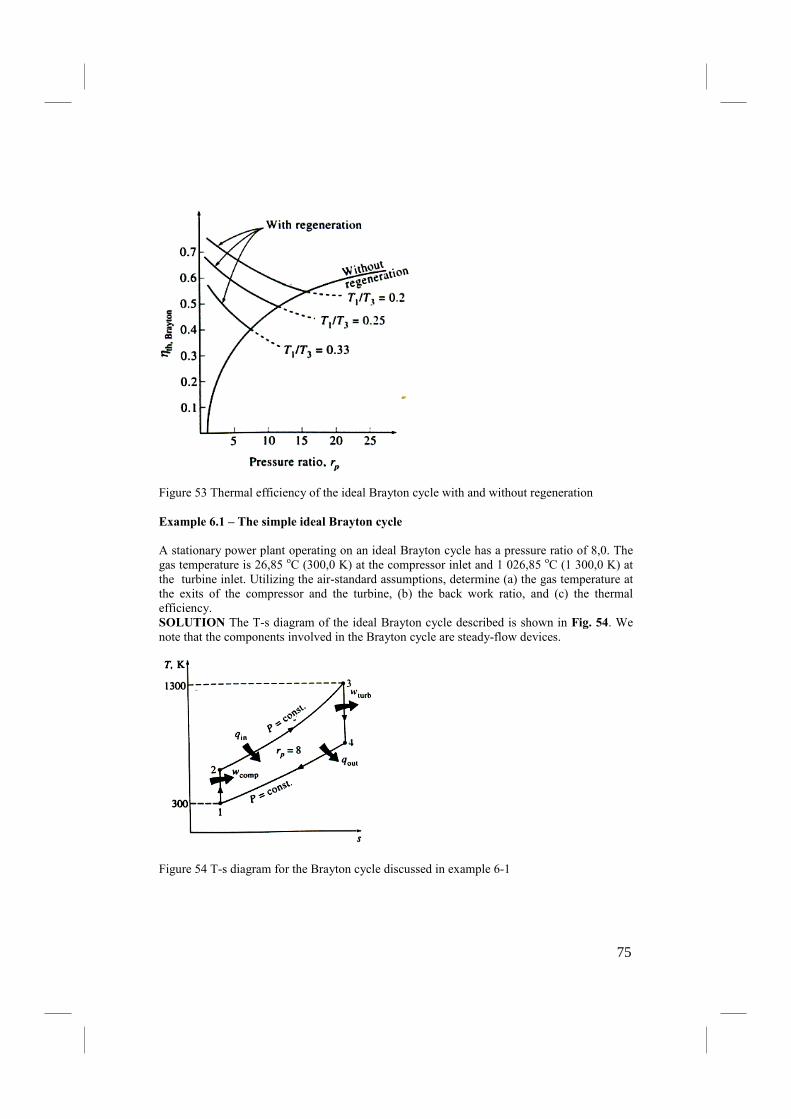
Figure 53 Thermal efficiency of the ideal Brayton cycle with and without regeneration Example 6.1 – The simple ideal Brayton cycle
A stationary power plant operating on an ideal Brayton cycle has a pressure ratio of 8,0. The gas temperature is 26,85 oC (300,0 K) at the compressor inlet and 1 026,85 oC (1 300,0 K) at the turbine inlet. Utilizing the air-standard assumptions, determine (a) the gas temperature at the exits of the compressor and the turbine, (b) the back work ratio, and (c) the thermal efficiency. SOLUTIO% The T-s diagram of the ideal Brayton cycle described is shown in Fig. 54. We note that the components involved in the Brayton cycle are steady-flow devices.
Figure 54 T-s diagram for the Brayton cycle discussed in example 6-1
75

Assumptions 1 Steady operating conditions exist. 2 The air-standard assumptions are applicable. 3 Kinetic and potential energy changes are negligible. 4 The variation of specific heats with temperature is to be considered. Analysis (a) The air temperatures at the compressor and turbine exits are determined from isentropic relations. Process 1-2 (isentropic compression of an ideal gas):
386,119,3000,300
1
111
=⋅=→= −
rP
kgkJhKT
(X.X)
( )( ) ( )1
2
211
22
35,544
0,54009,11386,10,8
−⋅=
=→===
kgkJ
exitcompressoratKTPP
PP rr
h
(X.X)
Process 3-4 (isentropic expansion of an ideal gas):
9,33097,13950,1300
3
133
=⋅=→= −
rP
kgkJhKT
(X.X)
( ) ( )1
4
433
44
11,789
0,77036,419,3308
1
−⋅=
=→=
==
kgkJ
exitatKTPP
PP rr
h
turbine (X.X)
(b) To find the back work ratio, we need to find the work input to the compressor and the work output of the turbine:
143.,
112.,
86,60611,78997,1395
16,24419,30035,544−
−
⋅=−=−=
⋅=−=−=
kgkJhhw
kgkJhhw
turb
incomp
out
(X.X)
Thus,
402,086,606
16,2441
1
.,
., =⋅
⋅==
−
−
kgkJ
kgkJ
w
wrratioworkBack
outturb
incomp
bw (X.X)
That is, 40,2 percent of the turbine work output is used just to drive the compressor. (c) The thermal efficiency of the cycle is the ratio of the net power output to the total heat input:
1
123
70,36216,24486,606
62,85135,54497,1395−
−
⋅=−=−=⋅=−=−=
kgkJwww
kgkJhhq
inoutnet
in (X.X)
Thus,
%6,42426,062,851
70,3621
1
orkgkJ
kgkJ
q
w
in
netth =
⋅
⋅==
−
−
η (X.X)
The thermal efficiency could also be determined from
76

in
out
thq
w−= 1η (X.X)
where
114 92,48819,30011,789 −⋅=−=−= kgkJhhqout (X.X)
Example 6.2 – An actual gas-turbine cycle
Assuming a compressor efficiency of 80,0 % and a turbine efficiency of 85,0 %, determine a) the back work ratio, b) the thermal efficiency, and c) the turbine exit temperature of the gas-turbine cycle discussed in Example 6-1. Solution a) The T-s diagram of the cycle is shown in Fig. 55. The actual compressor work and turbine work are determined by using the definitions of compressor and turbine efficiencies: compressor:
11
., 20,30580,0
16,244 −−
⋅=⋅
== kgkJkgkJw
wC
sincomp η (X.X)
turbine:
( )( ) 11., 83,51586,60685,0 −− ⋅=⋅=⋅= kgkJkgkJww sTturb ηout (X.X)
Thus,
592,083,515
20,3051
1
.,
., =⋅⋅
== −
−
kgkJ
kgkJ
w
wr
outturb
incomp
bw
(X.X)
Figure 55 T-s diagram of the gas-turbine cycle discussed in Example 6-2 That is, the compressor is now consuming 59,2 % of the work produced by the turbine (up from 40,2 %). This increase is due to the irreversibilities that occur within the compressor and the turbine.
77

b) In this case, air will leave the compressor at a higher temperature and enthalpy, which are determined to be:
( )KTandkgkJ
whhhhw
a
incompaaincomp
0,59839,605
20,30519,300
21
.,1212.,
=⋅=+=
+=→−=
−
(X.X)
Thus,
1
123
63,21020,30583,515
58,79039,60597,1395−
−
⋅=−=−=⋅=−=−=kgkJwww
kgkJhhq
inoutnet
ain (X.X)
and
%6,26266,058,790
63,2101
1
orkgkJ
kgkJ
q
w
in
netth =
⋅⋅
== −
−
η (X.X)
That is, the irreversibilities occurring within the turbine and compressor caused the thermal efficiency of the gas turbine cycle to drop from 42,6 to 26,6 %. This example shows how sensitive the performance of a gas-turbine power plant is to the efficiencies of the compressor and the turbine. In fact, gas-turbine efficiencies did not reach competitive values until significant improvements were made in the design of gas turbines and compressors. c) The air temperature at the turbine exit is determined from an energy balance on the turbine:
1
.,3443.,
14,880
83,51597,1395−⋅=
−=−=→−=
kgkJ
whhhhw turbaaoutturb
out
(X.X)
Then, from thermodynamic table T4a= 853,0 K. This value is considerably higher than the air temperature at the compressor exit (T2a= 598,0 K), which suggests the use of regeneration to reduce fuel cost.
78
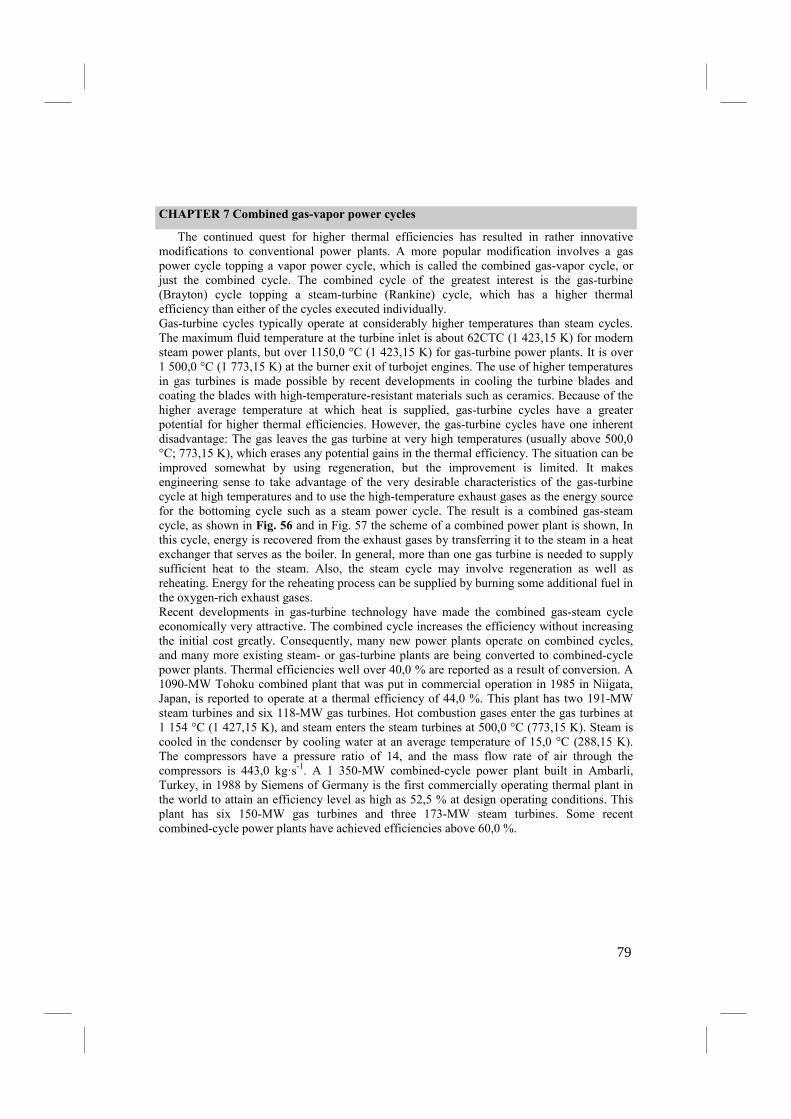
CHAPTER 7 Combined gas-vapor power cycles
The continued quest for higher thermal efficiencies has resulted in rather innovative modifications to conventional power plants. A more popular modification involves a gas power cycle topping a vapor power cycle, which is called the combined gas-vapor cycle, or just the combined cycle. The combined cycle of the greatest interest is the gas-turbine (Brayton) cycle topping a steam-turbine (Rankine) cycle, which has a higher thermal efficiency than either of the cycles executed individually. Gas-turbine cycles typically operate at considerably higher temperatures than steam cycles. The maximum fluid temperature at the turbine inlet is about 62CTC (1 423,15 K) for modern steam power plants, but over 1150,0 °C (1 423,15 K) for gas-turbine power plants. It is over 1 500,0 °C (1 773,15 K) at the burner exit of turbojet engines. The use of higher temperatures in gas turbines is made possible by recent developments in cooling the turbine blades and coating the blades with high-temperature-resistant materials such as ceramics. Because of the higher average temperature at which heat is supplied, gas-turbine cycles have a greater potential for higher thermal efficiencies. However, the gas-turbine cycles have one inherent disadvantage: The gas leaves the gas turbine at very high temperatures (usually above 500,0 °C; 773,15 K), which erases any potential gains in the thermal efficiency. The situation can be improved somewhat by using regeneration, but the improvement is limited. It makes engineering sense to take advantage of the very desirable characteristics of the gas-turbine cycle at high temperatures and to use the high-temperature exhaust gases as the energy source for the bottoming cycle such as a steam power cycle. The result is a combined gas-steam cycle, as shown in Fig. 56 and in Fig. 57 the scheme of a combined power plant is shown, In this cycle, energy is recovered from the exhaust gases by transferring it to the steam in a heat exchanger that serves as the boiler. In general, more than one gas turbine is needed to supply sufficient heat to the steam. Also, the steam cycle may involve regeneration as well as reheating. Energy for the reheating process can be supplied by burning some additional fuel in the oxygen-rich exhaust gases. Recent developments in gas-turbine technology have made the combined gas-steam cycle economically very attractive. The combined cycle increases the efficiency without increasing the initial cost greatly. Consequently, many new power plants operate on combined cycles, and many more existing steam- or gas-turbine plants are being converted to combined-cycle power plants. Thermal efficiencies well over 40,0 % are reported as a result of conversion. A 1090-MW Tohoku combined plant that was put in commercial operation in 1985 in Niigata, Japan, is reported to operate at a thermal efficiency of 44,0 %. This plant has two 191-MW steam turbines and six 118-MW gas turbines. Hot combustion gases enter the gas turbines at 1 154 °C (1 427,15 K), and steam enters the steam turbines at 500,0 °C (773,15 K). Steam is cooled in the condenser by cooling water at an average temperature of 15,0 °C (288,15 K). The compressors have a pressure ratio of 14, and the mass flow rate of air through the compressors is 443,0 kg·s-1. A 1 350-MW combined-cycle power plant built in Ambarli, Turkey, in 1988 by Siemens of Germany is the first commercially operating thermal plant in the world to attain an efficiency level as high as 52,5 % at design operating conditions. This plant has six 150-MW gas turbines and three 173-MW steam turbines. Some recent combined-cycle power plants have achieved efficiencies above 60,0 %.
79
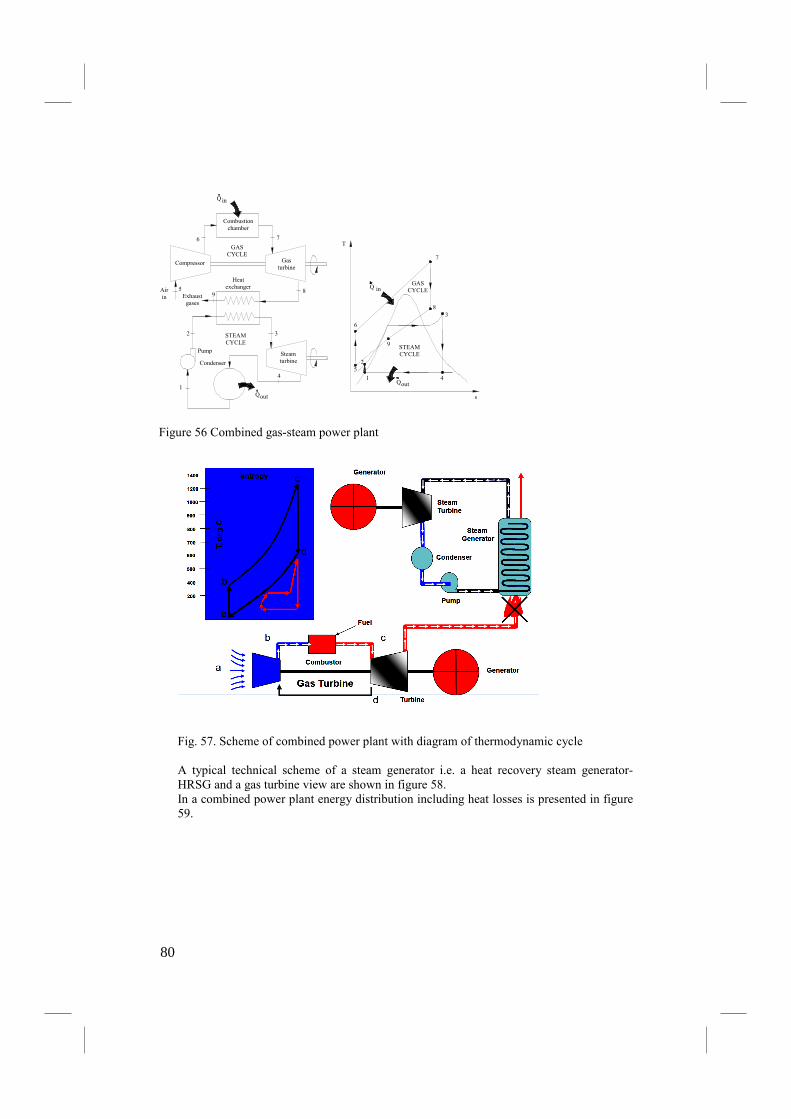
414
1
outQ
outQ
s
Gas turbine
Compressor
Exhaust gases
2
Air in
5
Pump
Condenser
STEAM CYCLE
Steam turbine
3
9
Heat exchanger
8
6GAS
CYCLE
Combustion chamber
7
inQ
STEAM CYCLE
25
6
9
GAS CYCLEinQ
83
T
7
Figure 56 Combined gas-steam power plant
Fig. 57. Scheme of combined power plant with diagram of thermodynamic cycle A typical technical scheme of a steam generator i.e. a heat recovery steam generator- HRSG and a gas turbine view are shown in figure 58. In a combined power plant energy distribution including heat losses is presented in figure 59.
80
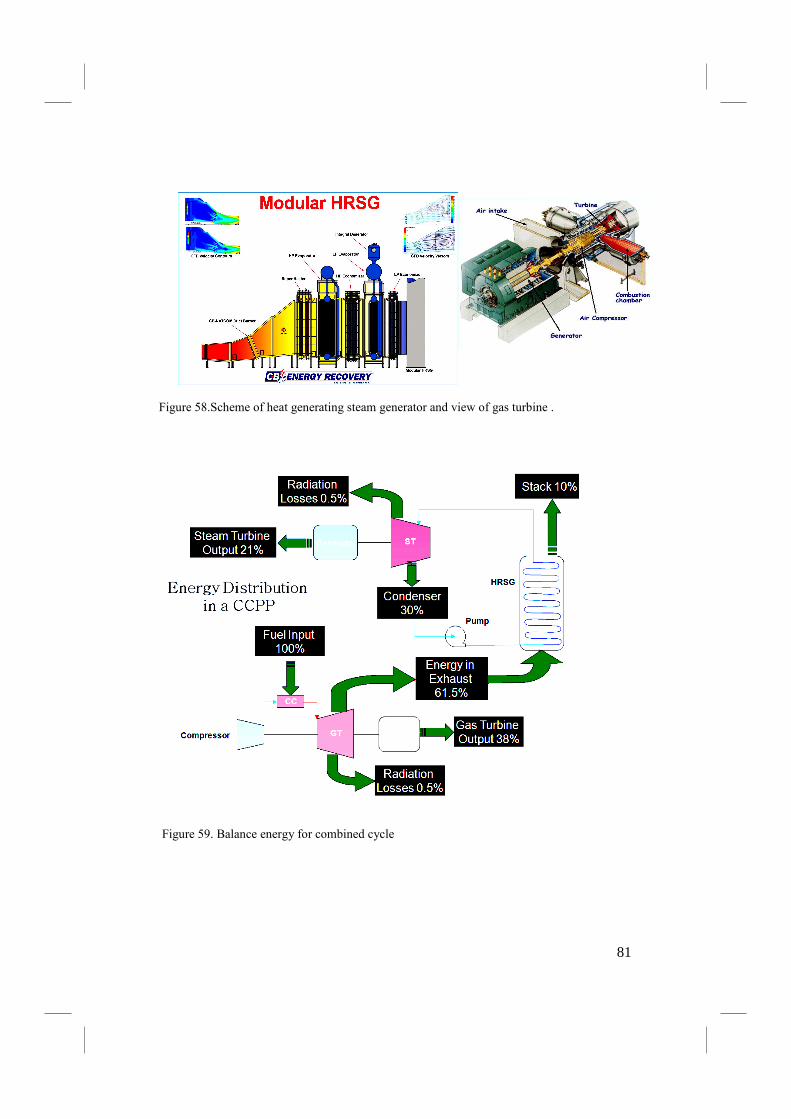
Figure 58.Scheme of heat generating steam generator and view of gas turbine .
Figure 59. Balance energy for combined cycle
81
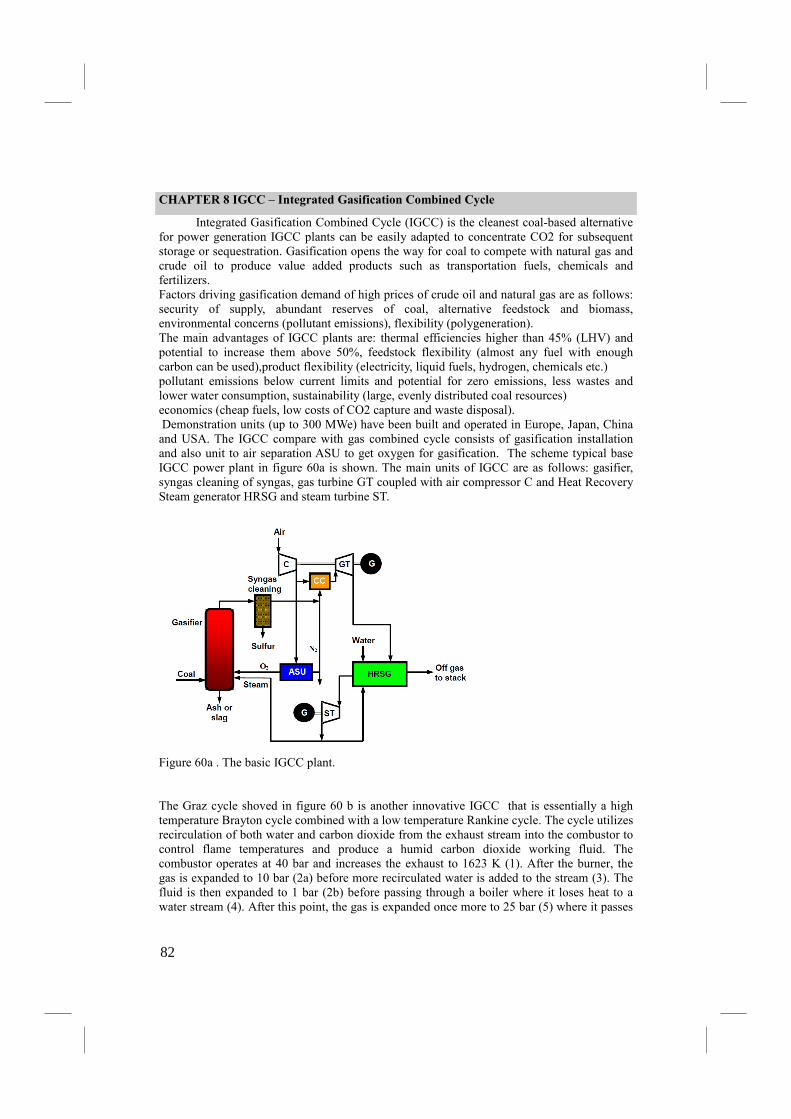
CHAPTER 8 IGCC – Integrated Gasification Combined Cycle
Integrated Gasification Combined Cycle (IGCC) is the cleanest coal-based alternative for power generation IGCC plants can be easily adapted to concentrate CO2 for subsequent storage or sequestration. Gasification opens the way for coal to compete with natural gas and crude oil to produce value added products such as transportation fuels, chemicals and fertilizers. Factors driving gasification demand of high prices of crude oil and natural gas are as follows: security of supply, abundant reserves of coal, alternative feedstock and biomass, environmental concerns (pollutant emissions), flexibility (polygeneration). The main advantages of IGCC plants are: thermal efficiencies higher than 45% (LHV) and potential to increase them above 50%, feedstock flexibility (almost any fuel with enough carbon can be used),product flexibility (electricity, liquid fuels, hydrogen, chemicals etc.) pollutant emissions below current limits and potential for zero emissions, less wastes and lower water consumption, sustainability (large, evenly distributed coal resources) economics (cheap fuels, low costs of CO2 capture and waste disposal). Demonstration units (up to 300 MWe) have been built and operated in Europe, Japan, China and USA. The IGCC compare with gas combined cycle consists of gasification installation and also unit to air separation ASU to get oxygen for gasification. The scheme typical base IGCC power plant in figure 60a is shown. The main units of IGCC are as follows: gasifier, syngas cleaning of syngas, gas turbine GT coupled with air compressor C and Heat Recovery Steam generator HRSG and steam turbine ST.
Figure 60a . The basic IGCC plant. The Graz cycle shoved in figure 60 b is another innovative IGCC that is essentially a high temperature Brayton cycle combined with a low temperature Rankine cycle. The cycle utilizes recirculation of both water and carbon dioxide from the exhaust stream into the combustor to control flame temperatures and produce a humid carbon dioxide working fluid. The combustor operates at 40 bar and increases the exhaust to 1623 K (1). After the burner, the gas is expanded to 10 bar (2a) before more recirculated water is added to the stream (3). The fluid is then expanded to 1 bar (2b) before passing through a boiler where it loses heat to a water stream (4). After this point, the gas is expanded once more to 25 bar (5) where it passes
82
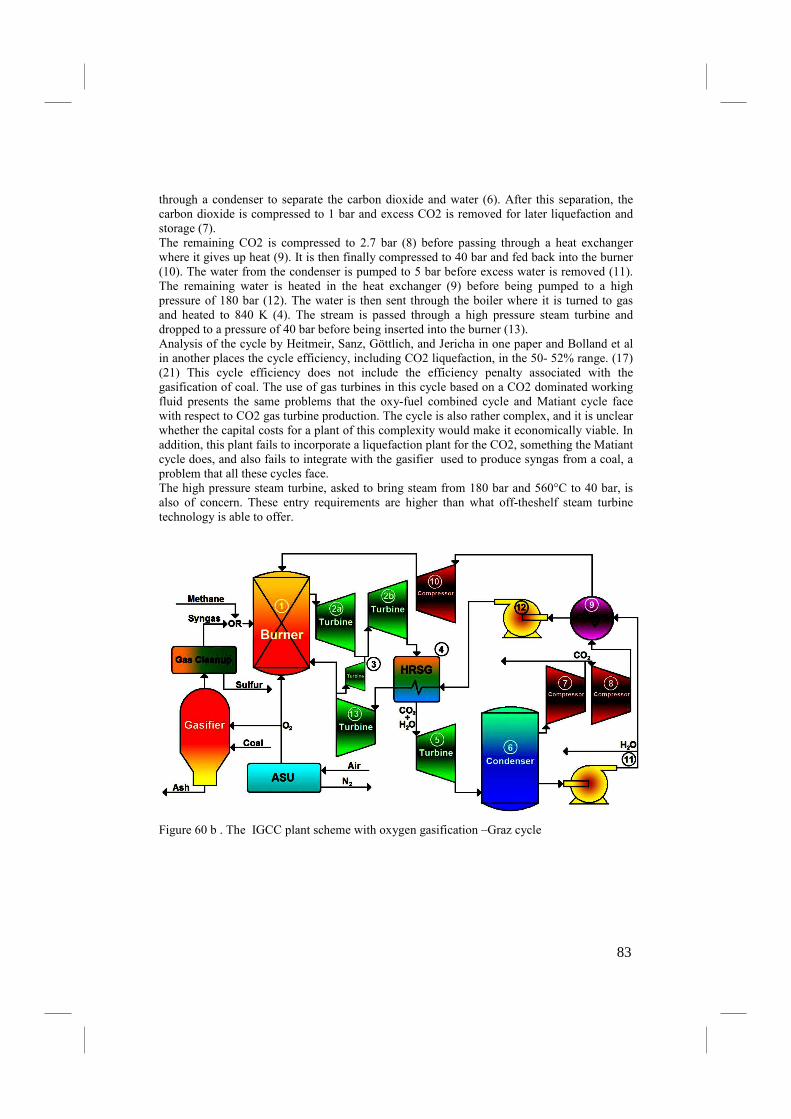
through a condenser to separate the carbon dioxide and water (6). After this separation, the carbon dioxide is compressed to 1 bar and excess CO2 is removed for later liquefaction and storage (7). The remaining CO2 is compressed to 2.7 bar (8) before passing through a heat exchanger where it gives up heat (9). It is then finally compressed to 40 bar and fed back into the burner (10). The water from the condenser is pumped to 5 bar before excess water is removed (11). The remaining water is heated in the heat exchanger (9) before being pumped to a high pressure of 180 bar (12). The water is then sent through the boiler where it is turned to gas and heated to 840 K (4). The stream is passed through a high pressure steam turbine and dropped to a pressure of 40 bar before being inserted into the burner (13). Analysis of the cycle by Heitmeir, Sanz, Göttlich, and Jericha in one paper and Bolland et al in another places the cycle efficiency, including CO2 liquefaction, in the 50- 52% range. (17) (21) This cycle efficiency does not include the efficiency penalty associated with the gasification of coal. The use of gas turbines in this cycle based on a CO2 dominated working fluid presents the same problems that the oxy-fuel combined cycle and Matiant cycle face with respect to CO2 gas turbine production. The cycle is also rather complex, and it is unclear whether the capital costs for a plant of this complexity would make it economically viable. In addition, this plant fails to incorporate a liquefaction plant for the CO2, something the Matiant cycle does, and also fails to integrate with the gasifier used to produce syngas from a coal, a problem that all these cycles face. The high pressure steam turbine, asked to bring steam from 180 bar and 560°C to 40 bar, is also of concern. These entry requirements are higher than what off-theshelf steam turbine technology is able to offer.
Figure 60 b . The IGCC plant scheme with oxygen gasification –Graz cycle
83
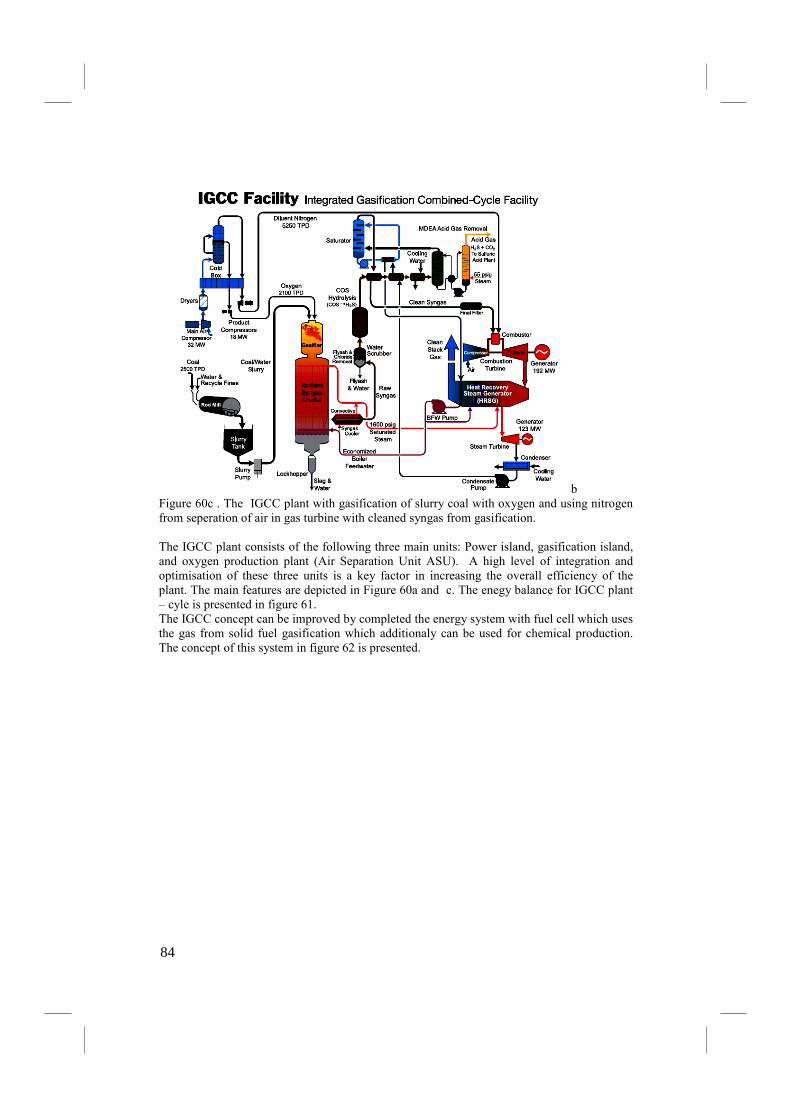
b Figure 60c . The IGCC plant with gasification of slurry coal with oxygen and using nitrogen from seperation of air in gas turbine with cleaned syngas from gasification. The IGCC plant consists of the following three main units: Power island, gasification island, and oxygen production plant (Air Separation Unit ASU). A high level of integration and optimisation of these three units is a key factor in increasing the overall efficiency of the plant. The main features are depicted in Figure 60a and c. The enegy balance for IGCC plant – cyle is presented in figure 61. The IGCC concept can be improved by completed the energy system with fuel cell which uses the gas from solid fuel gasification which additionaly can be used for chemical production. The concept of this system in figure 62 is presented.
84
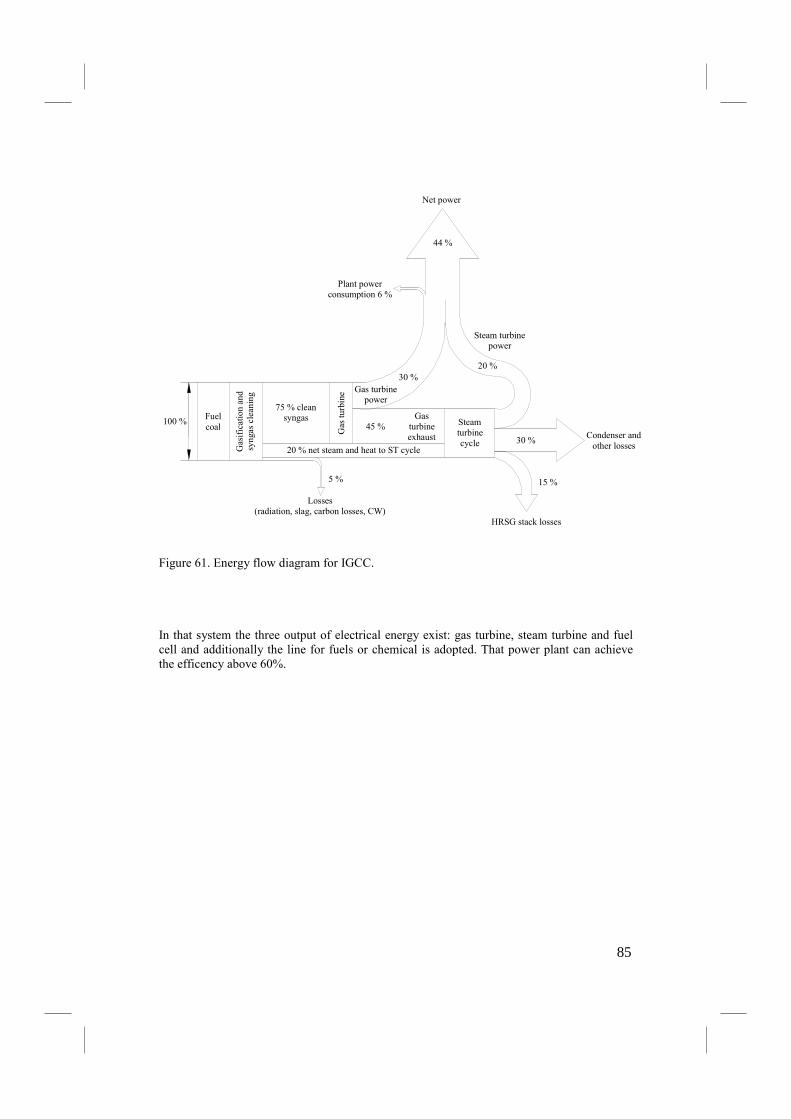
30 %
75 % clean syngasFuel
coal100 %
Gasification and
syngas cleaning
Gas tu
rbine
20 % net steam and heat to ST cycle
45 %Gas
turbine exhaust
Steam turbine cycle
15 %
HRSG stack losses
Condenser andother losses
20 %30 %
Gas turbine power
Steam turbine power
5 %
Losses (radiation, slag, carbon losses, CW)
Net power
Plant power consumption 6 %
44 %
Figure 61. Energy flow diagram for IGCC. In that system the three output of electrical energy exist: gas turbine, steam turbine and fuel cell and additionally the line for fuels or chemical is adopted. That power plant can achieve the efficency above 60%.
85
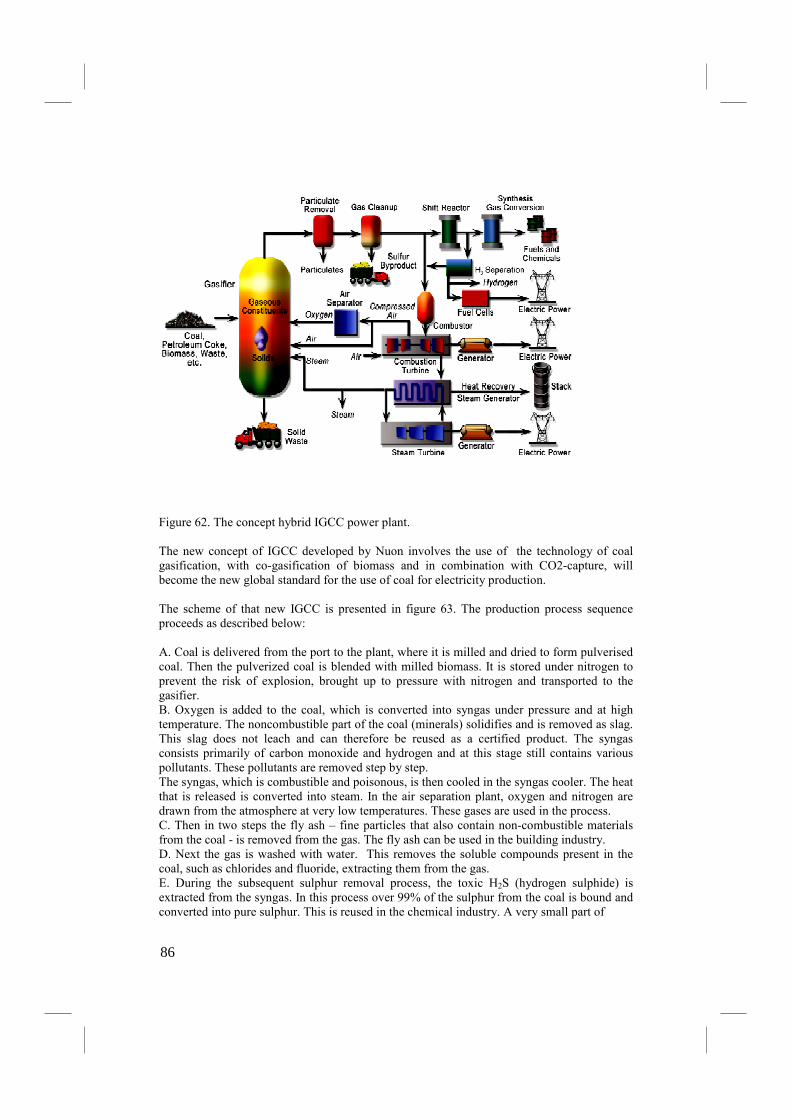
Figure 62. The concept hybrid IGCC power plant. The new concept of IGCC developed by Nuon involves the use of the technology of coal gasification, with co-gasification of biomass and in combination with CO2-capture, will become the new global standard for the use of coal for electricity production. The scheme of that new IGCC is presented in figure 63. The production process sequence proceeds as described below: A. Coal is delivered from the port to the plant, where it is milled and dried to form pulverised coal. Then the pulverized coal is blended with milled biomass. It is stored under nitrogen to prevent the risk of explosion, brought up to pressure with nitrogen and transported to the gasifier. B. Oxygen is added to the coal, which is converted into syngas under pressure and at high temperature. The noncombustible part of the coal (minerals) solidifies and is removed as slag. This slag does not leach and can therefore be reused as a certified product. The syngas consists primarily of carbon monoxide and hydrogen and at this stage still contains various pollutants. These pollutants are removed step by step. The syngas, which is combustible and poisonous, is then cooled in the syngas cooler. The heat that is released is converted into steam. In the air separation plant, oxygen and nitrogen are drawn from the atmosphere at very low temperatures. These gases are used in the process. C. Then in two steps the fly ash – fine particles that also contain non-combustible materials from the coal - is removed from the gas. The fly ash can be used in the building industry. D. Next the gas is washed with water. This removes the soluble compounds present in the coal, such as chlorides and fluoride, extracting them from the gas. E. During the subsequent sulphur removal process, the toxic H2S (hydrogen sulphide) is extracted from the syngas. In this process over 99% of the sulphur from the coal is bound and converted into pure sulphur. This is reused in the chemical industry. A very small part of
86
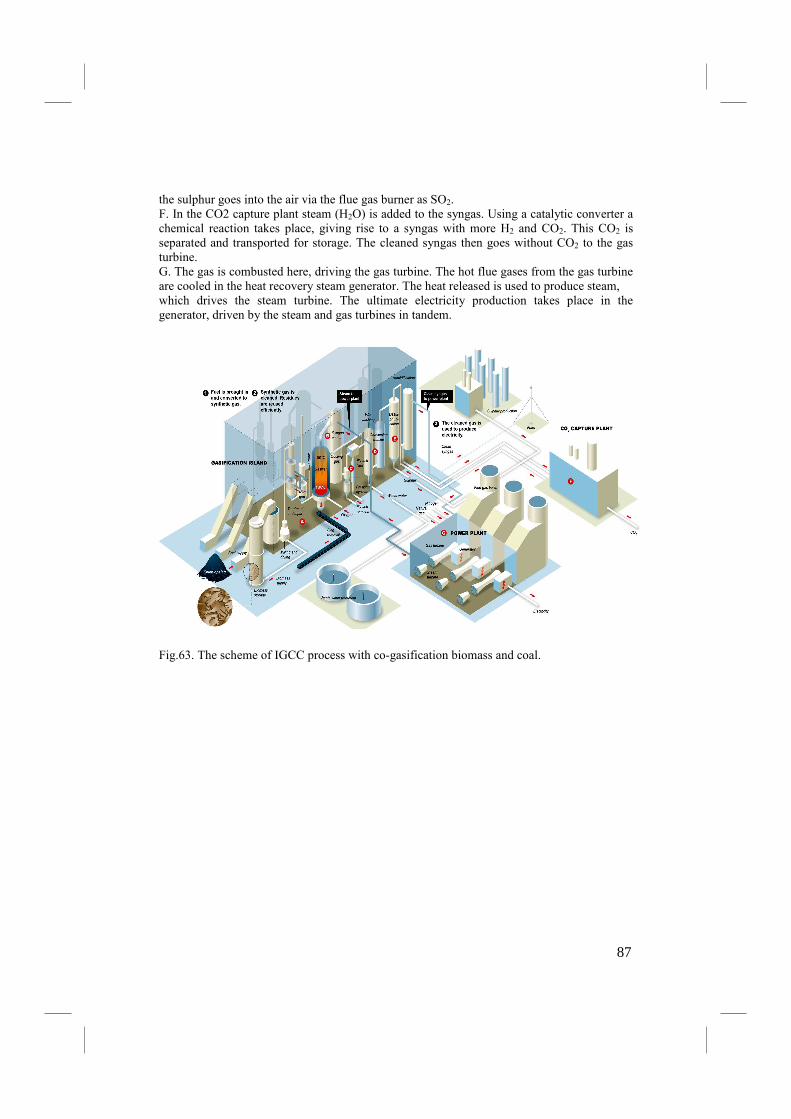
the sulphur goes into the air via the flue gas burner as SO2. F. In the CO2 capture plant steam (H2O) is added to the syngas. Using a catalytic converter a chemical reaction takes place, giving rise to a syngas with more H2 and CO2. This CO2 is separated and transported for storage. The cleaned syngas then goes without CO2 to the gas turbine. G. The gas is combusted here, driving the gas turbine. The hot flue gases from the gas turbine are cooled in the heat recovery steam generator. The heat released is used to produce steam, which drives the steam turbine. The ultimate electricity production takes place in the generator, driven by the steam and gas turbines in tandem.
Fig.63. The scheme of IGCC process with co-gasification biomass and coal.
87
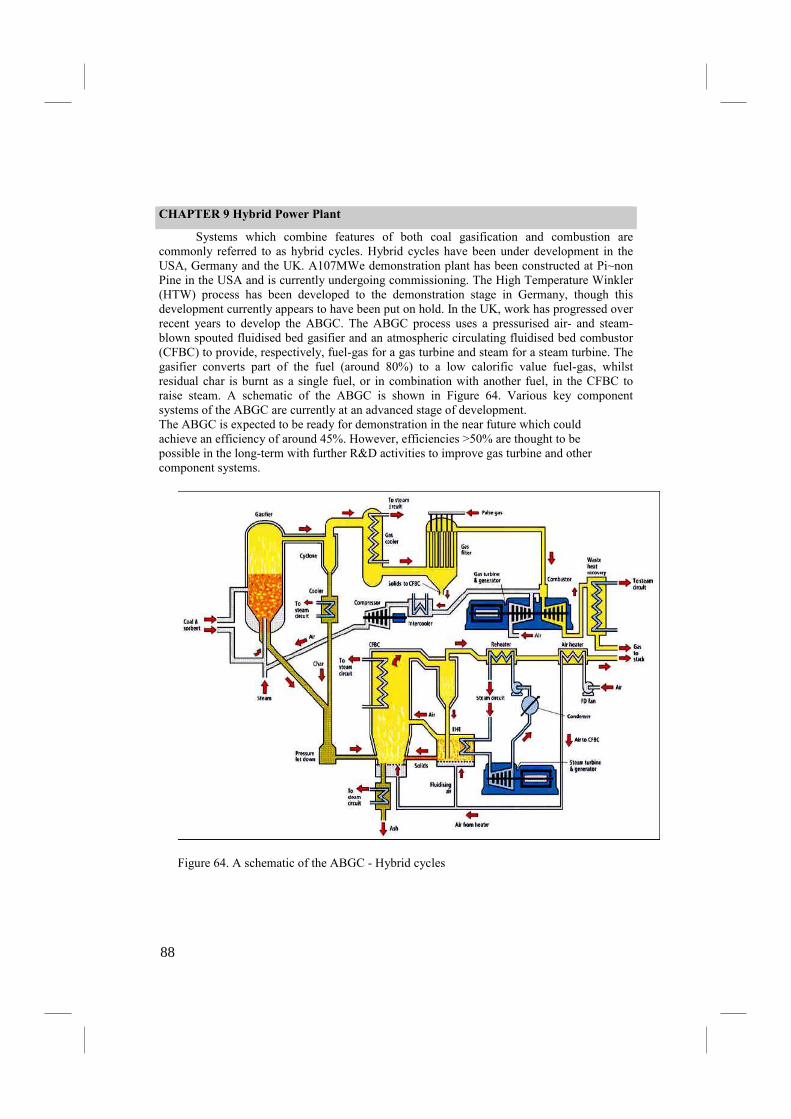
CHAPTER 9 Hybrid Power Plant
Systems which combine features of both coal gasification and combustion are commonly referred to as hybrid cycles. Hybrid cycles have been under development in the USA, Germany and the UK. A107MWe demonstration plant has been constructed at Pi~non Pine in the USA and is currently undergoing commissioning. The High Temperature Winkler (HTW) process has been developed to the demonstration stage in Germany, though this development currently appears to have been put on hold. In the UK, work has progressed over recent years to develop the ABGC. The ABGC process uses a pressurised air- and steam-blown spouted fluidised bed gasifier and an atmospheric circulating fluidised bed combustor (CFBC) to provide, respectively, fuel-gas for a gas turbine and steam for a steam turbine. The gasifier converts part of the fuel (around 80%) to a low calorific value fuel-gas, whilst residual char is burnt as a single fuel, or in combination with another fuel, in the CFBC to raise steam. A schematic of the ABGC is shown in Figure 64. Various key component systems of the ABGC are currently at an advanced stage of development. The ABGC is expected to be ready for demonstration in the near future which could achieve an efficiency of around 45%. However, efficiencies >50% are thought to be possible in the long-term with further R&D activities to improve gas turbine and other component systems.
Figure 64. A schematic of the ABGC - Hybrid cycles
88

CHAPTER 10 Technical solution of advanced power plants - boilers
PC boiler fired with pulverized coal are intensively developed to work at high pressure and temperature of steam. PC combustion in a Rankine steam cycle has been the prevailing mode of coal utilization in power. The typical PC/SC boiler is presented in figure 43 in chapter 4. The increases of steam parameters demands development of new steel for superheaters that is shown in figure 65. The some example of new PC boiler for supercritical parameters with vertical tubes in furnace is shown in figure 66.
Figure 65. Development targets steam temperature and pressure.
89
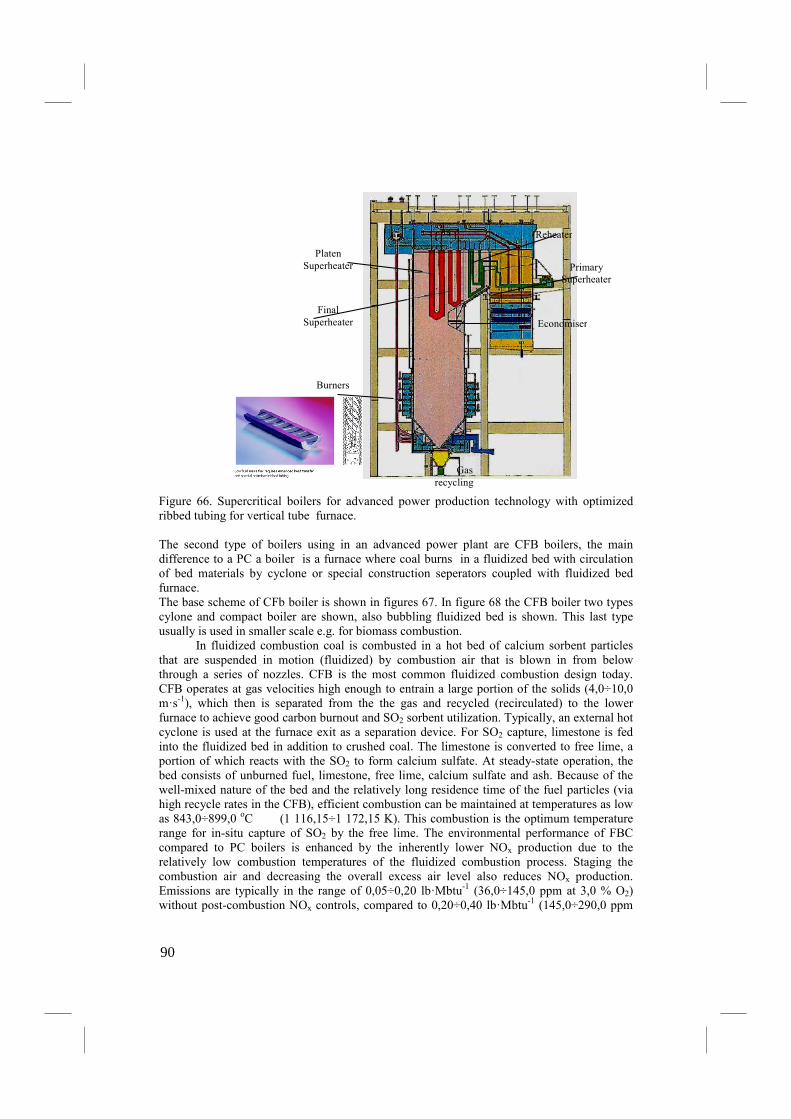
Figure 66. Supercritical boilers for advanced power production technology with optimized ribbed tubing for vertical tube furnace. The second type of boilers using in an advanced power plant are CFB boilers, the main difference to a PC a boiler is a furnace where coal burns in a fluidized bed with circulation of bed materials by cyclone or special construction seperators coupled with fluidized bed furnace. The base scheme of CFb boiler is shown in figures 67. In figure 68 the CFB boiler two types cylone and compact boiler are shown, also bubbling fluidized bed is shown. This last type usually is used in smaller scale e.g. for biomass combustion.
In fluidized combustion coal is combusted in a hot bed of calcium sorbent particles that are suspended in motion (fluidized) by combustion air that is blown in from below through a series of nozzles. CFB is the most common fluidized combustion design today. CFB operates at gas velocities high enough to entrain a large portion of the solids (4,0÷10,0 m·s-1), which then is separated from the the gas and recycled (recirculated) to the lower furnace to achieve good carbon burnout and SO2 sorbent utilization. Typically, an external hot cyclone is used at the furnace exit as a separation device. For SO2 capture, limestone is fed into the fluidized bed in addition to crushed coal. The limestone is converted to free lime, a portion of which reacts with the SO2 to form calcium sulfate. At steady-state operation, the bed consists of unburned fuel, limestone, free lime, calcium sulfate and ash. Because of the well-mixed nature of the bed and the relatively long residence time of the fuel particles (via high recycle rates in the CFB), efficient combustion can be maintained at temperatures as low as 843,0÷899,0 oC (1 116,15÷1 172,15 K). This combustion is the optimum temperature range for in-situ capture of SO2 by the free lime. The environmental performance of FBC compared to PC boilers is enhanced by the inherently lower NOx production due to the relatively low combustion temperatures of the fluidized combustion process. Staging the combustion air and decreasing the overall excess air level also reduces NOx production. Emissions are typically in the range of 0,05÷0,20 lb·Mbtu-1 (36,0÷145,0 ppm at 3,0 % O2) without post-combustion NOx controls, compared to 0,20÷0,40 lb·Mbtu-1 (145,0÷290,0 ppm
Burners
Economiser
Primary Superheater
Reheater
Gas recycling
Final Superheater
Platen Superheater
90
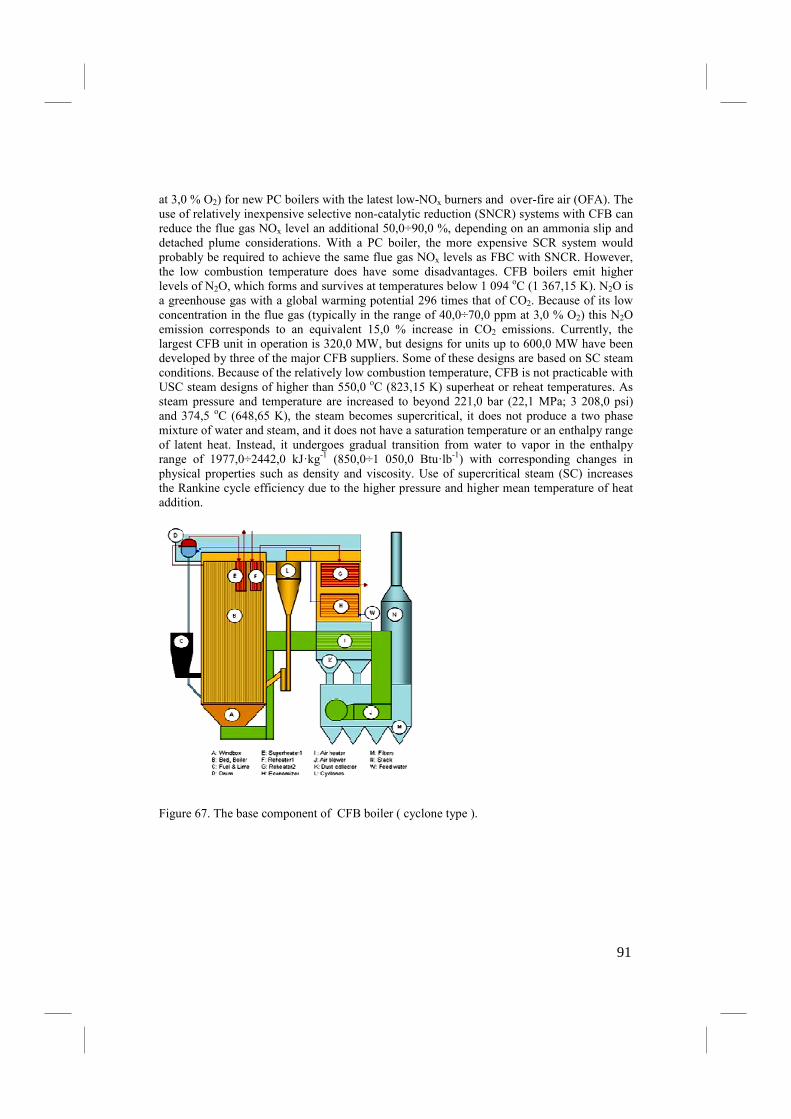
at 3,0 % O2) for new PC boilers with the latest low-NOx burners and over-fire air (OFA). The use of relatively inexpensive selective non-catalytic reduction (SNCR) systems with CFB can reduce the flue gas NOx level an additional 50,0÷90,0 %, depending on an ammonia slip and detached plume considerations. With a PC boiler, the more expensive SCR system would probably be required to achieve the same flue gas NOx levels as FBC with SNCR. However, the low combustion temperature does have some disadvantages. CFB boilers emit higher levels of N2O, which forms and survives at temperatures below 1 094 oC (1 367,15 K). N2O is a greenhouse gas with a global warming potential 296 times that of CO2. Because of its low concentration in the flue gas (typically in the range of 40,0÷70,0 ppm at 3,0 % O2) this N2O emission corresponds to an equivalent 15,0 % increase in CO2 emissions. Currently, the largest CFB unit in operation is 320,0 MW, but designs for units up to 600,0 MW have been developed by three of the major CFB suppliers. Some of these designs are based on SC steam conditions. Because of the relatively low combustion temperature, CFB is not practicable with USC steam designs of higher than 550,0 oC (823,15 K) superheat or reheat temperatures. As steam pressure and temperature are increased to beyond 221,0 bar (22,1 MPa; 3 208,0 psi) and 374,5 oC (648,65 K), the steam becomes supercritical, it does not produce a two phase mixture of water and steam, and it does not have a saturation temperature or an enthalpy range of latent heat. Instead, it undergoes gradual transition from water to vapor in the enthalpy range of 1977,0÷2442,0 kJ·kg-1 (850,0÷1 050,0 Btu·lb-1) with corresponding changes in physical properties such as density and viscosity. Use of supercritical steam (SC) increases the Rankine cycle efficiency due to the higher pressure and higher mean temperature of heat addition.
Figure 67. The base component of CFB boiler ( cyclone type ).
91
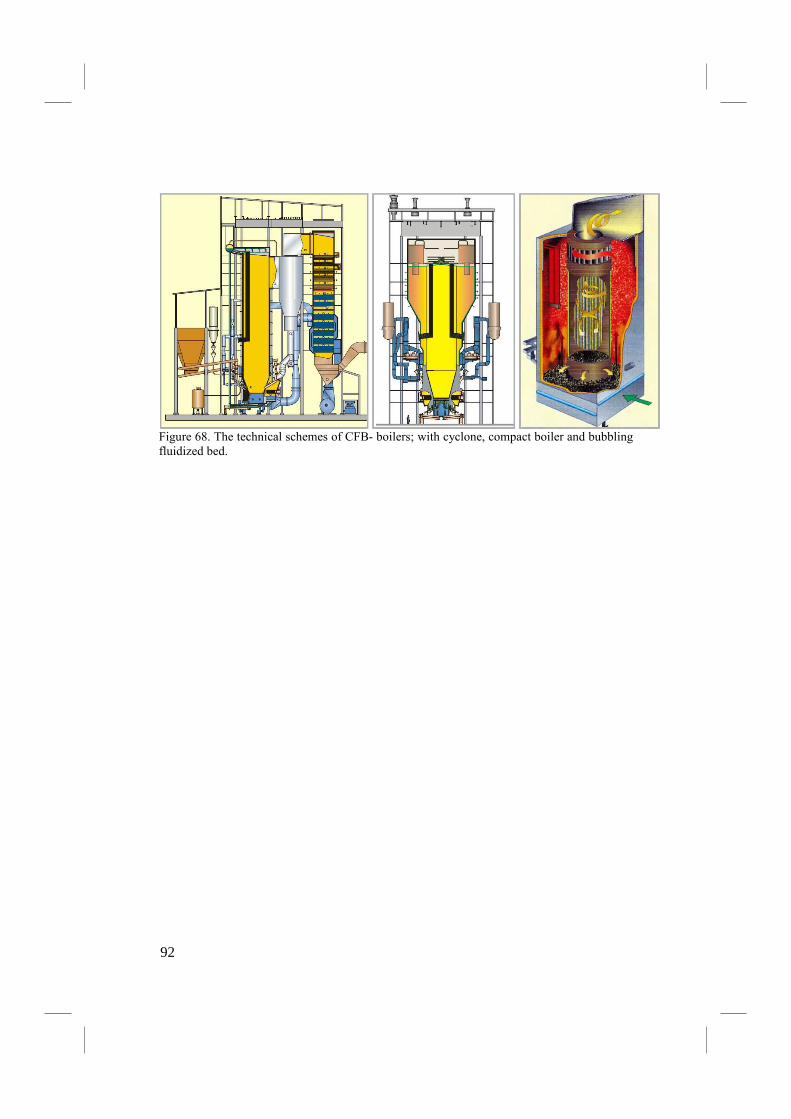
Figure 68. The technical schemes of CFB- boilers; with cyclone, compact boiler and bubbling fluidized bed.
92
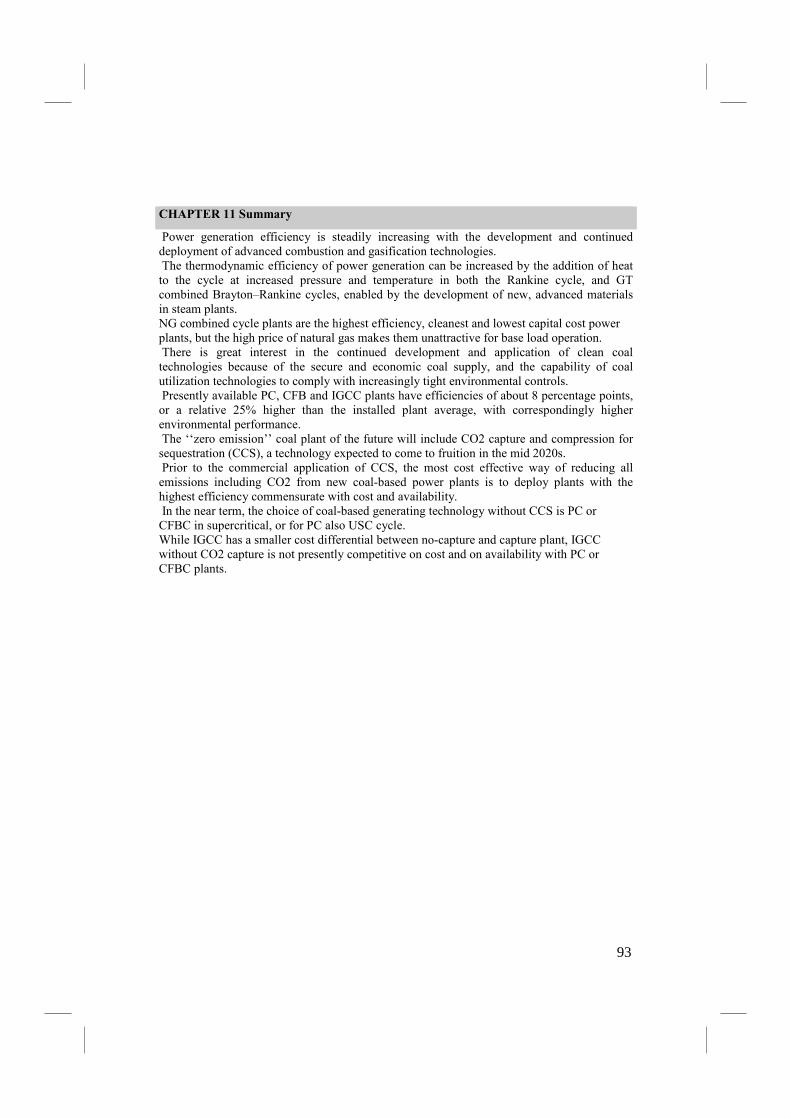
CHAPTER 11 Summary
Power generation efficiency is steadily increasing with the development and continued deployment of advanced combustion and gasification technologies. The thermodynamic efficiency of power generation can be increased by the addition of heat to the cycle at increased pressure and temperature in both the Rankine cycle, and GT combined Brayton–Rankine cycles, enabled by the development of new, advanced materials in steam plants. NG combined cycle plants are the highest efficiency, cleanest and lowest capital cost power plants, but the high price of natural gas makes them unattractive for base load operation. There is great interest in the continued development and application of clean coal technologies because of the secure and economic coal supply, and the capability of coal utilization technologies to comply with increasingly tight environmental controls. Presently available PC, CFB and IGCC plants have efficiencies of about 8 percentage points, or a relative 25% higher than the installed plant average, with correspondingly higher environmental performance. The ‘‘zero emission’’ coal plant of the future will include CO2 capture and compression for sequestration (CCS), a technology expected to come to fruition in the mid 2020s. Prior to the commercial application of CCS, the most cost effective way of reducing all emissions including CO2 from new coal-based power plants is to deploy plants with the highest efficiency commensurate with cost and availability. In the near term, the choice of coal-based generating technology without CCS is PC or CFBC in supercritical, or for PC also USC cycle. While IGCC has a smaller cost differential between no-capture and capture plant, IGCC without CO2 capture is not presently competitive on cost and on availability with PC or CFBC plants.
93
Bibliography
[1] Soliński J., Energy Sector - World and Poland, Development 1971-2000, Prospects to 2030, Polish Member Committee of the World Energy Council, Warsaw, 2004. [2] Fuel production by thermochemical transformation of biomass, CLEFS CEA, 50/51, 2004-2005. [3] IPCC, http://www.ipcc.ch, 2004. [4] Key world energy statistics from the IEA, International Energy Agency, http://www.iea.org/statist/keyworld 2002/key2002/keystats.htm, 2002. [5] Renewables Information 2002, International Energy Agency, http://www.iea.org/stats/files/Ren2002.pdf, 2002. [6] Schelling J., Nakken T., Hagen E. F., Hydrogen from renewable energy - current and future opportunities, 2003. [7] European Bioenergy Networks, Biomass co-firing - an efficient way to reduce greenhouse gas emissions, 2003, http://www.vtt.fi/virtual/afbnet/cofiring180603.pdf, 2004. [8] Hydrogen energy and fuel cells - a vision of our future, HLG on hydrogen and fuel cells, http://www.europa.
eu.int/comm/research/energy/pdf/hlg_interim_report_en.pdf, 2003. [9] Kasatoczkin V., Fine structure of fossil coal, Izv. AN ZSSR Otd. Techn. Nauk, 9, p. 1321, 1951. [10] Raimo H., Boiler technology for biomass CHP Plant, Finland, 2005. [11] Praca zbiorowa pod redakcją Andrzeja Czaplińskiego, Wydawnictwa AGH, Kraków, 1994. [12] Sami M., Annamalai K., Wooldridge M., Co-firing of coal and biomass fuel blends, Progress in Energy and combustion Science, 27, pp. 171-214, 2001. [13] http://www.ar.wroc.pl, 2005. [14] Baxter L., Ash deposition during biomass and coal combustion: a mechanistic approach, Biomass and Bioenergy, 4, 2, pp. 85-102, 1993. [15] Blackham A. U., Smoot L. D., Yousefi P., Fuel, 73, 602, 1994. [16] Ceely F. J., Daman L. E., Chemistry of Coal Utilisation, Wiley & Sons, Canada, Second Supplementary Volume, Chap. 20, 1981. [17] Smith I. W., Coal combustion kinetics and mechanism, pp. 1045-1065, 1982. [18] Malik A. A., Howard C. R., Proceeding of the First Trabzon Internal Energy and Environment Symposium, pp. 693-699, Trabzon, Turkey, 1996. [19] Duranay N. D., Pehlivan D., Combustion of lignite carbon under agitation, Fuel Processing Technology, 86, pp. 913-923, 2005. [20] Tomas D., The brown coal utilization for power generation in Poland, 2000. [21] Bryers R., Factors critically affecting fireside deposits in steam generators, In: Impact of mineral mpurities in solid fuel combustion, Gupta R. Editor, Kluwer Academic, New York, 1999. [22] Eaton A., Smoot L., Hill S., Eatough C., Components, formulations, solutions, evaluation, and application of comprehensive combustion models, Progress in Energy and Combustion Science, pp. 387- 436, 1999. [23] Chomiak J., Combustion a study in theory. Facts and applications, Abacus Press/Gordon and Breach, New York, 1990. [24] Tomeczek J., Spalanie węgla, Wydawnictwo Politechniki Śląskiej, Gliwice, 1992. [25] Smoot L. Editor, Fundamentals of coal combustion for clean and efficient use, Elsevier, Amsterdam, 1993. [26] Kozaczka J., Procesy spalania. Inżynierskie metody obliczeń, Wydawnictwa Akademii Górniczo- Hutniczej, Kraków, 1993. [27] Kowalewicz A., Podstawy procesów spalania, Wydawnictwa Naukowo-Techniczne, Warszawa, 2000. [28] Wilk R., Podstawy niskoemisyjnego spalania, PAN, Katowice, 2001. [29] Wen C., Dutta S., In: Coal conversion technology, Wen C., Lee E. Editors, Addison-Wesley, pp. 57-170, New York, 1979. [30] Lighty J., Veranth J., Sarofim A., Combustion aerosols: Factor governing their size and composition and implication to human health, Journal of the Air and Waste Management Association, 50, pp. 1565- 1618, 2000. [31] Warnatz J., Mass U., Dibble R., Combustion: Physical and chemical fundamentals, modelling and simulation, experiments, pollutant formation, Springer, Berlin, 2001. [32] Thomas K., The release of nitrogen oxides during char combustion, Fuel, 76, p. 457, 1997. [33] Huffman G., Huggins F., Robertson J., Sarofim A., Pugmire R., Molecular structure and microstructure of PM2.5 derived from stationary and mobile fossil fuel sources, 2000. [34] Helble J., Neville M., Sarofim A., Aggregate formation from vaporized ash during pulverised coal combustion, XXI Symposium (Int.) on Combustion, The Combustion Institute, Pittsburgh, PA, pp. 411- 417, 1986.
94
[35] Zevenhoven-Onderwater M., Ash-forming matter in biomass fuels, PhD-Thesis, Faculty of Chemical Engineering, Process Chemistry Group Åbo Academy, Åbo, 2001. [36] Linak W., Miller C., Seams W., Wendt J., Ishinomori T., Endo Y., Miyamae S., On trimodal particle size distributions in fly ash from pulverized coal combustion, Proc. Combust. Inst., 29, p. 441, 2002. [37] Neville M., Quann R., Haynes B., Sarofim A., XXVIII Symposium (Int.) on Combustion, The Combustion Institute, p. 1267, Pittsburgh, 1981. [38] Wang W., Thomas K., The release of nitrogen species from carbons during gasification: models for coal char gasification, Fuel, 71, p. 871-877, 1992. [39] Wang W., Thomas K., The release of nitrogen oxides from char derived from high pressure carbonization of carbazole and haphthol during oxidative gasification, Fuel, 72, p. 293-297, 1993. [40] Van Gerpen J. H., Peterson C. L., Goering C. E., Biodiesel: an alternative fuel for compression ignition engines, Agricultural and Biological Engineers, USA, 2007. [41] Klass D. L., Biomass for renewable energy, fuels, and chemicals, San Diego, Academic Press, 1998. [42] Hellwig G., Basic of the combustion of wood and straw, In: Energy from biomass, Palz W., Coombs J., Hall D. Editors, III E.C. Conference, Elsevier Applied Science, pp. 793-798, London, 1985. [43] Jenkins B. M., Baxter L. L., Miles T. R., Combustion properties of biomass, Fuel Processing Technology, 54, pp. 17-46, 1998. [44] Purvis M. R., Santos S. O., Biomass combustion study pack for WEBCT Contract, Department of Mechanical and Manufacturing Engineering, University of Portsmouth, United Kingdom of Great Britain, 2002. [47] Cheremisinoff N., Overview: biomass as a source of energy, Sunworld, 6(2), pp. 30-33, 1982 [48] Scahill J., Biomass to energy: Present commercial strategies and future options healthy landscapes, Thriving Communities: Bioenergy and Wood Products Conference, National Bioenergy Center, Operated for the U.S. Department of Energy by Midwest Research Institute, 2003 [49] ] Yunus A. Cengel, Michael A. Boles , Thermodynamics, An Engineering Approach. McGraw –Hill Higher Education [50] J.M. Beer, High efficiency electric power generation: The environmental role; Progress in Energy and Combustion Science 33 (2007) 107–134 [51] Schilling H., D., VGB Kraftwerkstech, 73(8), pp. 564-76, 1993. (English ed.)
95