Embed Size (px)
Citation preview

1
Advancements in Predictive Modeling for
Concrete Structures
Matt Miltenberger, P. E.
Applications
• Parking Structures• Marine Structures• Bridges / Pavements• Foundations• Coastal Buildings

2
Need for Predictive Models
Issues to Consider for Modeling
History of Predictive Models
Discussions of Various Predictive Models
Case Studies
Agenda
• Asset management
• Protection system selection
• Preventative maintenance programs
• Due diligence for leases and sales of properties.
• Comparision of restoration options
Need for Predictive Models

3
Where you don’t need predictive models...
Need for Predictive Models
Issues to Consider for Modeling
History of Predictive Models
Discussions of Various Predictive Models
Case Studies
Agenda

4
Service Life Expectations
Concrete Properties
Exposure Conditions
Costs
Predictive
Model
Inputs
Primary Considerations
What isService Life ?
…Time to collapse
…Time to major repair
…Time to ANY repair

5
Complicating Issues for Modeling
Initial Protection
Subsequent Protection
Climate (T & RH)
Reinforcing System
Wet / Dry Conditions
Exposure Zones
Transport Properties
Surface Treatments
Cracking Effects
Multiple DegradationTraffic Patterns
Variation in Concrete Properties
Curing Effects
• Concrete Properties (Transport)
• Exposure Conditions
• Existing Protection Systems
• Past Protection Systems
• Level of Contamination
• Physical Degradation
• Cracking (Micro and Macro)
• Degradation Mechanisms (Corrosion, ASR, DEF, Sulfate Attack, etc.)
Common Modeling Inputs / Considerations

6
Need for Predictive Models
Issues to Consider for Modeling
History of Predictive Models
Discussions of Various Predictive Models
Case Studies
Agenda
• Experience Models
• Tutti Models
• Diffusion-Based Models
• Multiple Transport / Degradation Models
History of Service Life Models
Primarily all models were designed for new construction and not for existing concrete structures.

7
Experience Models (<1980’s)Pros Cons
� Easily understood� Statistical
approach� Fact-based� Identifies trends� “Reality Check”� Basis for generic
comparison
� Inconsistent data � No scientific basis
for evaluating new technology
� Assumes static technology and environment
� Difficult to support claims on specific projects
Pros:
• Time is always beneficial.
Cons:
• Service expectations exceed expertise
• Many technologies are relatively new
• Concrete and reinforcing chemistries have
changed over last 30 years dramatically
• Difficulty in supporting claims of performance
• Case Studies
Experience Model

8
Pros:
• Very Simplistic
• Conceptually and directionally good
• Applicable mostly to singular degradation
Cons:
• Too simplistic
• Doesn’t have the mechanism for quantification
Tutti Model
Time
Det
erio
ratio
n
Chl
orid
e-In
duce
dC
orro
sion
Tutti Model (1980’s)
PropagationPeriod
CorrosionInitiation
AcceleratingDamage
Chloride IngressDet
erio
ratio
n
DamageInitiation
Transport Phase Damage Propagation

9
Tutti Model - 1980’sPros Cons
� Very simplistic� Conceptual / Intuitive� Fact-based� Bi-linear approach� Simple calculation
� Too simplistic� Poor quantification� Educated guess� Assumes static
technology and environment
• Builds on Tutti model
• Standard test method
• Single transport mechanism
• Applicable to saturated environments
• Not applicable for many structures
Diffusion-Based Models

10
Time
Det
erio
ratio
n
Chl
orid
e-In
duce
dC
orro
sion
Modified Tutti Diagram Model
CorrosionInitiation
AcceleratingDamage
Chloride Ingress
Diffusion
ASTM C 1556 Bulk Diffusion Test

11
Depth (mm)
0,0
2,0
4,0
6,0
8,0
10,0
0 5 10 15 20
Chl
orid
eC
onte
nt (
g/kg
)
ExperimentalExperimentalBest fit to dataBest fit to data
ASTM C1586 Bulk Diffusion Test
XX XX

12
XX XXDe = X De = 10X
0
5
10
15
20
25
30
Depth Increment
Chl
orid
e C
onte
nt P
CY Exposed
Protected
Exposure conditions influence test resultEffective diffusion is not a true property!
XX XX
Diffusion is NOT the primary transport mechanism for:• cyclic wet/dry environments• evaporative environments • structures with coatings and sealers

13
Diffusion-Based Models (1990’s)Pros Cons
� Improvement over bi-linear calculation
� Empirical-based� Captures non-
linear behavior� Standard tests
available� Widely accepted
� Testing required� Assumes static
technology and environment
� Invalid model assumptions
� Model easily misused� Single transport
mechanism
Need for Predictive Models
Issues to Consider for Modeling
History of Predictive Models
Discussions of Various Predictive Models
Case Studies
Agenda

14
Life-365 TM
Life-365 Service Life Prediction Model TM
for Reinforced Concrete Exposed to Chlorides
Version 1.1
Life-365 Service Life Prediction Model and Life-365are trademarks of the Silica Fume Association.
Used with permission
Modified Tutti Model
Time
Det
erio
ratio
n
Chl
orid
e-In
duce
dC
orro
sion
CorrosionInitiation
AcceleratingDamage
Chloride Ingress
Life 365
PropagationPeriod Fixed
ChlorideBuild-up &Diffusion

15
Key Build-up Cs(wt. %/yr) (%)
< 0.02 0.2
0.04 to 0.08 0.6
0.08 to 0.12 0.8
> 0.12 1.0
No data available
0.02 to 0.04 0.4
Values are for Parking Structures
Environmental Characterization
Pros:• Applicable for new construction• Graphic user interface – easy to use• Database-driven selection of defaults• User selected concrete mixture and treatments• Allows user to input tested values• Addresses time & temperature-dependant behavior• Addresses sealers and membranes
Cons:• Easily manipulated• Not applicable for existing structures• Not applicable for evaporative transport
Life 365 ModelR

16
• Finite Element Model Architecture
• Coupled Multiple Transport Mechanisms – Diffusion
– Advection
– Electrical Coupling
• Simultaneous Chemical Reactions
• Tracks 9 Ionic Species in/out of Concrete (Including OH/Cl)
• Tracks 9 Solid Phases Forming and Dissolving in Concrete
• Converted to 2-Dimensional (for crack modeling)
• Validated
STADIUM ModelR

17
Consortium (SUMMA)
VTRC QDOT
LOGO
Laboratory Testing – Durability Parameters
20 V
NaCl +NaOHNaCl +NaOH NaOHNaOH
ASTM C642 - Porosity

18
Solid phases after 70 years (Type I)
0
20
40
60
80
100
120
140
160
0 40 80 120 160 200Position (mm)
So
lid p
hase
co
nten
t (g
/kg)
Calcium Hydroxide
AfmCSH
Brucite
Friedel's salt Ettringite
Tim e to Corrosion 60 years (Type I)
0.0
0.5
1.0
1.5
2.0
2.5
3.0
3.5
4.0
0 20 40 60 80 100 120 140 160 180 200
Thickness (mm)
Tot
al C
hlor
ide
[g/k
g]Service Life Prediction
Software
0
100
200
300
400
500
600
0.00 0.05 0.10 0.15 0.20 0.25 0.30 0.35 0.40 0.45 0.50
Distance from the exposed surface (m)
Con
cent
ratio
n (m
mol
/L)
Cl OH
Na
KCa
SO4
STADIUM Output STADIUM Output ExamplesExamples

19
0.45 Type V concrete slab exposed to 2500 ppm of su lfateSolid phases after 80 years
0
20
40
60
80
100
120
140
160
0,00 0,01 0,02 0,03 0,04 0,05 0,06 0,07 0,08 0,09 0,10
Position in the slab (m)
Sol
id p
hase
con
tent
(g/k
g)
Gypsum
C-S-H
Portlandite
Ettringite
Monosulfates
STADIUM Output STADIUM Output ExamplesExamples
Testing of Existing Structures
Exposure ProfilingExposure ProfilingDeterioration AnalysisDeterioration Analysis““SurfaceSurface--CreteCrete”” TransportTransport
Initial Pore Solution ChemistryInitial Pore Solution ChemistryInitial Solid PhasesInitial Solid Phases
Ionic TransportIonic TransportMoisture TransportMoisture TransportPorosityPorosity
Exposed Surface

20
Time
Det
erio
ratio
n
XX
X – Known by evaluations
Predictive Modeling
Time
Det
erio
ratio
n
XX
X – Known by evaluations
STADIUM Predictions
Predictive Modeling

21
Time
Det
erio
ratio
n
XX
X – Known by evaluations
STADIUM Option Analysis
Predictive Modeling
Time
Det
erio
ratio
n
Cor
rosi
on
ASR
Sulfate Attack
DEF
Deterioration Mechanisms

22
Time
Det
erio
ratio
n
Cor
rosi
on
ASR
Com
bine
d
Sulfate Attack
DEF
Deterioration Mechanisms
Pros:
• Validated and industry supported model
• Flexible to capture real world complexities
• Useful for both new and existing concrete
• Useful for both cracked and uncracked concrete
Cons:
• More testing of existing properties and conditions
• More complicated and incremental cost
Multiple Transport / Degradation Model

23
There are no simple answers to complex situations!
Allow good science to lead toward better business solutions.
• World’s Tallest Building
Burj Dubai (Dubai, UAE)

24
Artist’s Sketch
U.S. Navy - Modular Hybrid Pier

25
Where Can These Advance Modeling Tools Be Used ?
• Condition Assessments
• General Maintenance Programs
• Budgeting / Justification / Prioritization
• Construction Variance Resolution
• Due Diligence Tool – (Assign Future Maintenance/Repair Costs )
• Baseline Conditions for Leasors/Leasees
Need for Predictive Models
Issues to Consider for Modeling
History of Predictive Models
Discussions of Various Predictive Models
Case Studies
Agenda

26
Artist’s Sketch
U.S. Navy - Modular Hybrid Pier
Concrete Porosity (ASTM C642)
Tests were conducted on both lightweight and normal weight concrete. (56, 120, 270, and 365 days moist curing).
Table 7 – ASTM C642 Test Results (Absorption)
Manufacturer Type of Concrete
Absorption (after immersion %)
Absorption (after boiling %)
56 d* 120 d* 56 d* 120 d*
Light Weight 9.21 9.34 9.84 9.72 Coreslab Normal 5.14 4.19 5.46 4.47
Light Weight 12.2 12.0 12.8 12.6 Bellingham Normal 6.32 6.10 6.78 6.67
Light Weight 4.68 4.41 4.99 4.60 Clark Pacific
Normal 4.03 4.40 4.16 4.37
* Moist Curing Period
Concrete A
Concrete B
Concrete C

27
Ion Migration Test (ASTM C 1202 Modified)
0
50
100
150
200
250
0 50 100 150 200 250 300
Time (hours)
Cur
rent
(m
A)
Disc A
Disc B
20 V
NaCl +NaOHNaCl +NaOH NaOHNaOH
05
101520
253035
4045
0 100 200 300 400
Duration of curing period (days)
DO
H -E
-12
(m2 /s
)
Producer A
Producer B
Producer C
Ionic diffusion coefficients

28
Pore Solution Testing
Test developed and validated at Purdue University (Dr. Sidney Diamond)
Moisture Transmission Test Moisture Transmission Test (ASTM E 96) (ASTM E 96)
Salt Solution
Water Container
ConcreteSample
To Scale
0
10
20
30
40
0 200 400 600 800
Time (hours)
Moi
stur
e up
take
(g)
58% R.H.58% R.H.
81% R.H.81% R.H.
Concrete samples cured for 56 and 365 days

29
Immersion Tests
Testing seawater exposure from one dimension for va rious periods of time.
Ion Content (ppm)
Chloride 17100 Sodium 8620 Sulfate 2820
Magnesium 1180 Potassium 684 Calcium 404
Seawater Composition
Concrete Samples
Saline Solution Wax Coating
Container Cover
Chloride Ion Determination and Profiling
ASTM C1152 Method. Chloride profiles were obtained by milling thin layers from surface.

30
00
22
44
66
88
1010
1212
00 55 1010 1515 2020 2525
Tot
al c
hlor
ides
(g/
kg)
Tot
al c
hlor
ides
(g/
kg) ExperimentalExperimental
Numerical Numerical simsim..
0
2
4
6
8
10
12
0 5 10 15 20 25
Depth (mm)
Chloride immersion tests
Producer C – Curing 56 days
40 days40 daysof immersion of immersion
120 days120 daysof immersionof immersion
ExperimentalExperimentalNumerical Numerical simsim..
Chloride immersion tests
Producer C – Curing 365 days
0,0
2,0
4,0
6,0
8,0
10,0
0 5 10 15 20Depth (mm)
Chl
orid
eC
once
ntra
tion
(g/k
g)
ExperimentalExperimental
0 5 10 15 20
ExperimentalExperimentalNumerical Numerical simsim.. Numerical Numerical simsim..
40 days40 daysof immersion of immersion
120 days120 daysof immersion of immersion

31
0
20
40
60
80
100
120
140
0 20 40 60 80 100
Years
[Cl- ]/[
OH
- ]
Time Dependent Cl / OH at Depth of 25mm
Corrosion Initiation
• Wharf crane rail beams had variances in concrete cover.
• Resolution process:
– Assess the degree of cover variance.
– Quantify exposure levels.
– Evaluate as-designed service life expectation.
– Evaluate as-built service life expectations.
– Provide repair designs as needed.
Port of San Diego (San Diego, CA)(Construction Variance)
View Along Wharf Cover Measurements

32
Chloride Evolution - Concrete without XYPEX
0.0
0.5
1.0
1.5
2.0
2.5
0 5 10 15 20 25 30 35 40 45
Years
Chl
orid
e C
once
ntra
tion,
g/k
g
¾ in. 1 in. 2 in. 2½ in. Threshold
“As-Built” without Xypex

33
“As-Built” with XypexChloride Evolution - Concrete with XYPEX
0
0.5
1
1.5
2
2.5
0 5 10 15 20 25 30 35 40 45
Years
Chl
orid
e c
once
ntra
tion,
g/k
g
¾ in. 1 in. 2 in. 2½ in. Threshold
“As-Specified” without XypexChloride Evolution - Concrete UV
0.0
0.5
1.0
1.5
2.0
2.5
0 5 10 15 20 25 30 35 40 45
Years
Chl
orid
e C
once
ntra
tion,
g/k
g
¾ in. 1 in. 2 in. 2½ in. Threshold

34

35

36
STADIUM Predictive Results
0
5
10
15
20
0 1 2 3 4 5
Depth Into Concrete (Inches)
Chl
orid
e Io
n C
onte
nt (
PC
Y)
Corrosion ThresholdThreshold
RebarRebarYEAR 0
STADIUM Predictive Results
0
5
10
15
20
0 1 2 3 4 5
Depth Into Concrete (Inches)
Chl
orid
e Io
n C
onte
nt (
PC
Y)
Corrosion ThresholdThreshold
RebarRebarYEAR 2
No Treatment
Single Sealer Application
Periodic Sealer Application
Traffic Bearing Membrane

37
STADIUM Predictive Results
0
5
10
15
20
0 1 2 3 4 5
Depth Into Concrete (Inches)
Chl
orid
e Io
n C
onte
nt (
PC
Y)
Corrosion ThresholdThreshold
RebarRebarYEAR 4
No Treatment
Single Sealer Application
Periodic Sealer Application
Traffic Bearing Membrane
STADIUM Predictive Results
0
5
10
15
20
0 1 2 3 4 5
Depth Into Concrete (Inches)
Chl
orid
e Io
n C
onte
nt (
PC
Y)
Corrosion ThresholdThreshold
RebarRebarYEAR 6
No Treatment
Single Sealer Application
Periodic Sealer Application
Traffic Bearing Membrane

38
STADIUM Predictive Results
0
5
10
15
20
0 1 2 3 4 5
Depth Into Concrete (Inches)
Chl
orid
e Io
n C
onte
nt (
PC
Y)
Corrosion ThresholdThreshold
RebarRebarYEAR 8
No Treatment
Single Sealer Application
Periodic Sealer Application
Traffic Bearing Membrane
STADIUM Predictive Results
0
5
10
15
20
0 1 2 3 4 5
Depth Into Concrete (Inches)
Chl
orid
e Io
n C
onte
nt (
PC
Y)
Corrosion ThresholdThreshold
RebarRebarYEAR 10
No Treatment
Single Sealer Application
Periodic Sealer Application
Traffic Bearing Membrane

39
STADIUM Predictive Results
0
5
10
15
20
0 1 2 3 4 5
Depth Into Concrete (Inches)
Chl
orid
e Io
n C
onte
nt (
PC
Y)
Corrosion ThresholdThreshold
RebarRebarYEAR 12
No Treatment
Single Sealer Application
Periodic Sealer Application
Traffic Bearing Membrane
STADIUM Predictive Results
0
5
10
15
20
0 1 2 3 4 5
Depth Into Concrete (Inches)
Chl
orid
e Io
n C
onte
nt (
PC
Y)
Corrosion ThresholdThreshold
RebarRebarYEAR 14
No Treatment
Single Sealer Application
Periodic Sealer Application
Traffic Bearing Membrane

40
STADIUM Predictive Results
0
5
10
15
20
0 1 2 3 4 5
Depth Into Concrete (Inches)
Chl
orid
e Io
n C
onte
nt (
PC
Y)
Corrosion ThresholdThreshold
RebarRebarYEAR 16
No Treatment
Single Sealer Application
Periodic Sealer Application
Traffic Bearing Membrane
STADIUM Predictive Results
0
5
10
15
20
0 1 2 3 4 5
Depth Into Concrete (Inches)
Chl
orid
e Io
n C
onte
nt (
PC
Y)
Corrosion ThresholdThreshold
RebarRebarYEAR 18
No Treatment
Single Sealer Application
Periodic Sealer Application
Traffic Bearing Membrane

41
STADIUM Predictive Results
0
5
10
15
20
0 1 2 3 4 5
Depth Into Concrete (Inches)
Chl
orid
e Io
n C
onte
nt (
PC
Y)
Corrosion ThresholdCorrosion Threshold
RebarRebarYEAR 20
No Treatment
Single Sealer Application
Periodic Sealer Application
Traffic Bearing Membrane
STADIUM Predictive Results
0
5
10
15
20
0 1 2 3 4 5
Depth Into Concrete (Inches)
Chl
orid
e Io
n C
onte
nt (
PC
Y)
Corrosion ThresholdThreshold
RebarRebarYEAR 22
No Treatment
Single Sealer Application
Periodic Sealer Application
Traffic Bearing Membrane

42
STADIUM Predictive Results
0
5
10
15
20
0 1 2 3 4 5
Depth Into Concrete (Inches)
Chl
orid
e Io
n C
onte
nt (
PC
Y)
Corrosion ThresholdThreshold
RebarRebarYEAR 24
No Treatment
Single Sealer Application
Periodic Sealer Application
Traffic Bearing Membrane
STADIUM Predictive Results
0
5
10
15
20
0 1 2 3 4 5
Depth Into Concrete (Inches)
Chl
orid
e Io
n C
onte
nt (
PC
Y)
Corrosion ThresholdThreshold
RebarRebarYEAR 26
No Treatment
Single Sealer Application
Periodic Sealer Application
Traffic Bearing Membrane

43
STADIUM Predictive Results
0
5
10
15
20
0 1 2 3 4 5
Depth Into Concrete (Inches)
Chl
orid
e Io
n C
onte
nt (
PC
Y)
Corrosion ThresholdThreshold
RebarRebarYEAR 28
No Treatment
Single Sealer Application
Periodic Sealer Application
Traffic Bearing Membrane
STADIUM Predictive Results
0
5
10
15
20
0 1 2 3 4 5
Depth Into Concrete (Inches)
Chl
orid
e Io
n C
onte
nt (
PC
Y)
Corrosion ThresholdThreshold
RebarRebarYEAR 30
No Treatment
Single Sealer Application
Periodic Sealer Application
Traffic Bearing Membrane

44
STADIUM Predictive Results
0
5
10
15
20
0 1 2 3 4 5
Depth Into Concrete (Inches)
Chl
orid
e Io
n C
onte
nt (
PC
Y)
Corrosion ThresholdThreshold
RebarRebarYEAR 32
No Treatment
Single Sealer Application
Periodic Sealer Application
Traffic Bearing Membrane
STADIUM Predictive Results
0
5
10
15
20
0 1 2 3 4 5
Depth Into Concrete (Inches)
Chl
orid
e Io
n C
onte
nt (
PC
Y)
Corrosion ThresholdThreshold
RebarRebarYEAR 34
No Treatment
Single Sealer Application
Periodic Sealer Application
Traffic Bearing Membrane

45
STADIUM Predictive Results
0
5
10
15
20
0 1 2 3 4 5
Depth Into Concrete (Inches)
Chl
orid
e Io
n C
onte
nt (
PC
Y)
Corrosion ThresholdThreshold
RebarRebarYEAR 36
No Treatment
Single Sealer Application
Periodic Sealer Application
Traffic Bearing Membrane
STADIUM Predictive Results
0
5
10
15
20
0 1 2 3 4 5
Depth Into Concrete (Inches)
Chl
orid
e Io
n C
onte
nt (
PC
Y)
Corrosion ThresholdThreshold
RebarRebarYEAR 38
No Treatment
Single Sealer Application
Periodic Sealer Application
Traffic Bearing Membrane
46
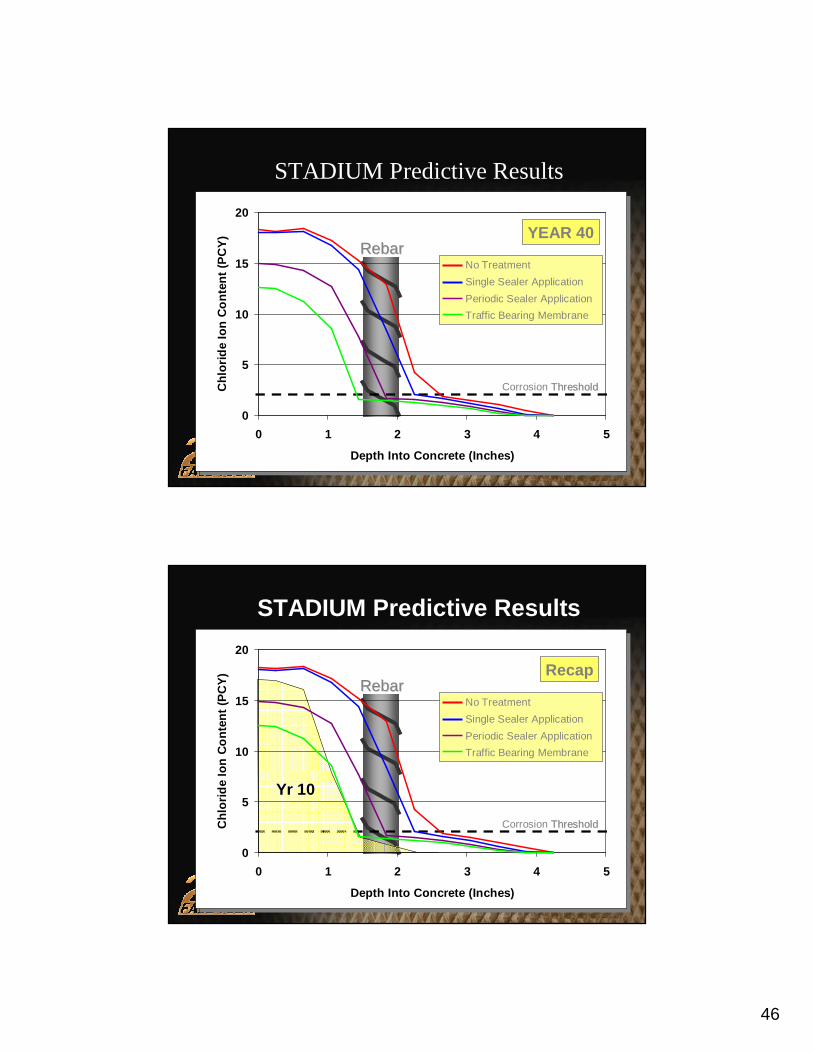
STADIUM Predictive Results
0
5
10
15
20
0 1 2 3 4 5
Depth Into Concrete (Inches)
Chl
orid
e Io
n C
onte
nt (
PC
Y)
Corrosion ThresholdThreshold
RebarRebarYEAR 40
No Treatment
Single Sealer Application
Periodic Sealer Application
Traffic Bearing Membrane
STADIUM Predictive Results
0
5
10
15
20
0 1 2 3 4 5
Depth Into Concrete (Inches)
Chl
orid
e Io
n C
onte
nt (
PC
Y)
Corrosion ThresholdThreshold
RebarRebarRecap
No Treatment
Single Sealer Application
Periodic Sealer Application
Traffic Bearing Membrane
Yr 10

47
(269)384-9980(269)384-9981 Fax
Matthew Miltenberger, P.E. [email protected]
www.tourneyconsulting.com