Embed Size (px)
Citation preview
Advantus Update and Investment OutlookChris Sebald, CFAPresident and Chief Investment OfficerAdvantus Capital Management A Securian Company
www.advantuscapital.comJune 15, 2017
2
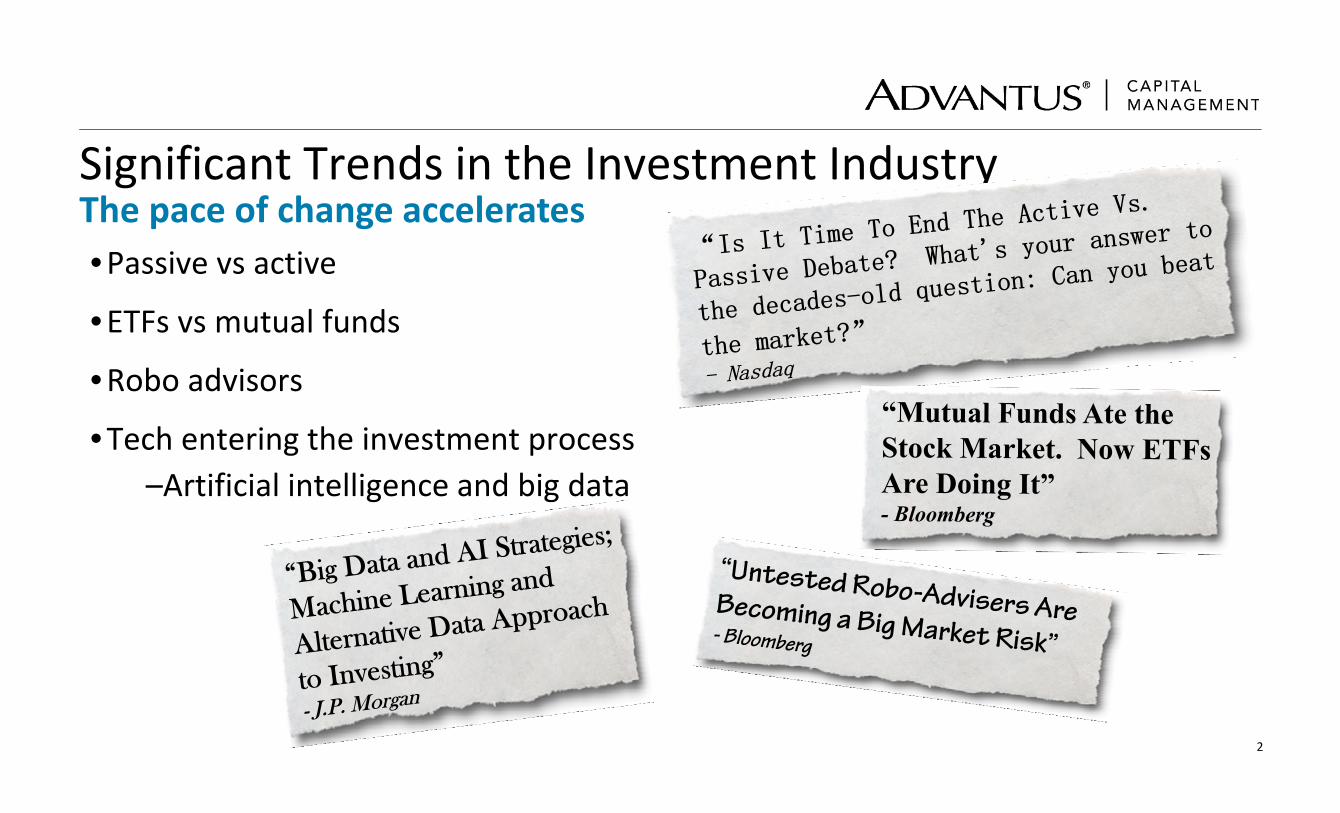
Significant Trends in the Investment IndustryThe pace of change accelerates•Passive vs active
•ETFs vs mutual funds
•Robo advisors
•Tech entering the investment process–Artificial intelligence and big data
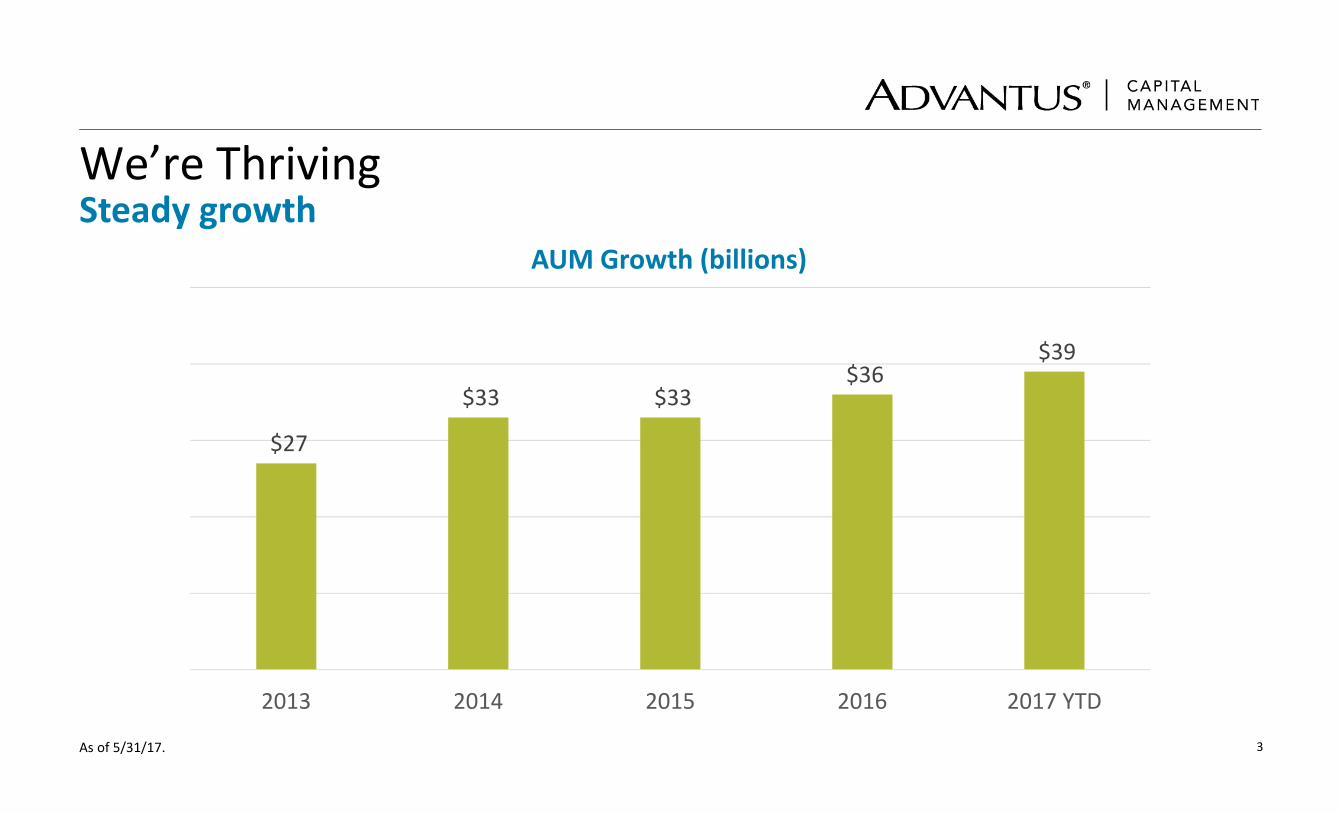
We’re Thriving Steady growth
As of 5/31/17. 3
AUM Growth (billions)
39 40
45
54$27
$33 $33 $36
$39
2013 2014 2015 2016 2017 YTD
4
And ChangingNew strategies and solutions
Source: Advantus Capital Management, iStock.
• Managed Volatility
• Commercial Mortgage Loans
• Pension Risk Transfer
• Strategic Credit Income
• Model Portfolios
5
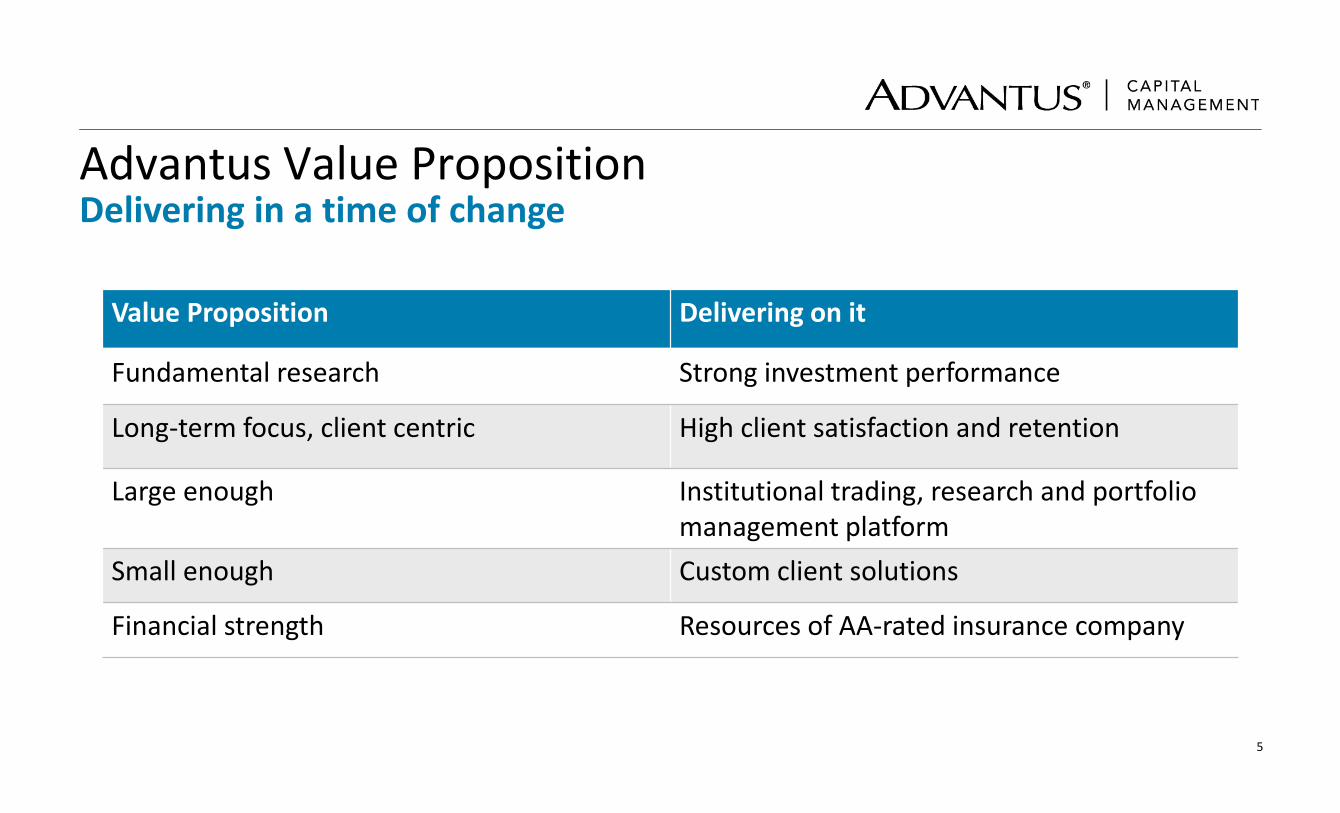
Advantus Value PropositionDelivering in a time of change
Value Proposition Delivering on it
Fundamental research Strong investment performance
Long‐term focus, client centric High client satisfaction and retention
Large enough Institutional trading, research and portfolio management platform
Small enough Custom client solutions
Financial strength Resources of AA‐rated insurance company
6
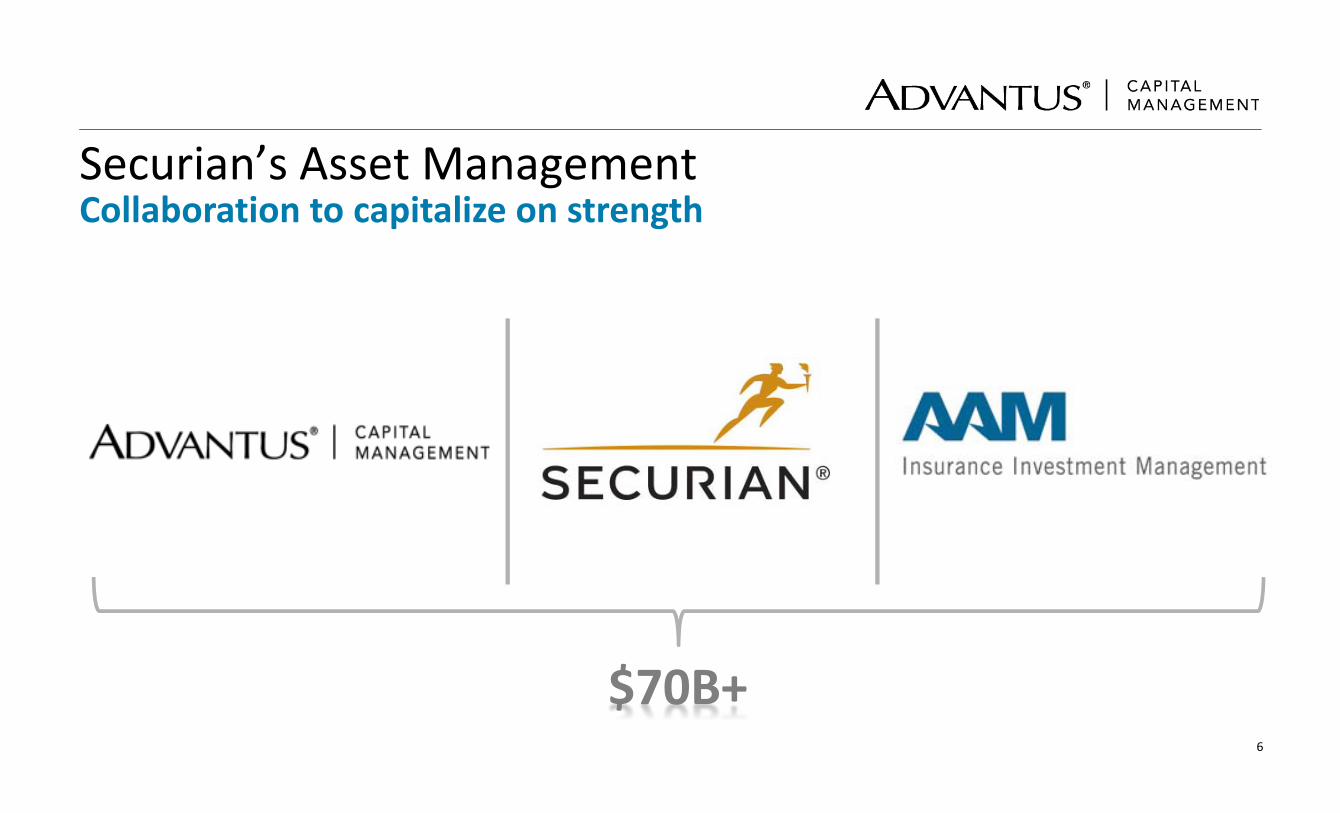
Securian’s Asset ManagementCollaboration to capitalize on strength
$70B+

7
Investment Outlook
8
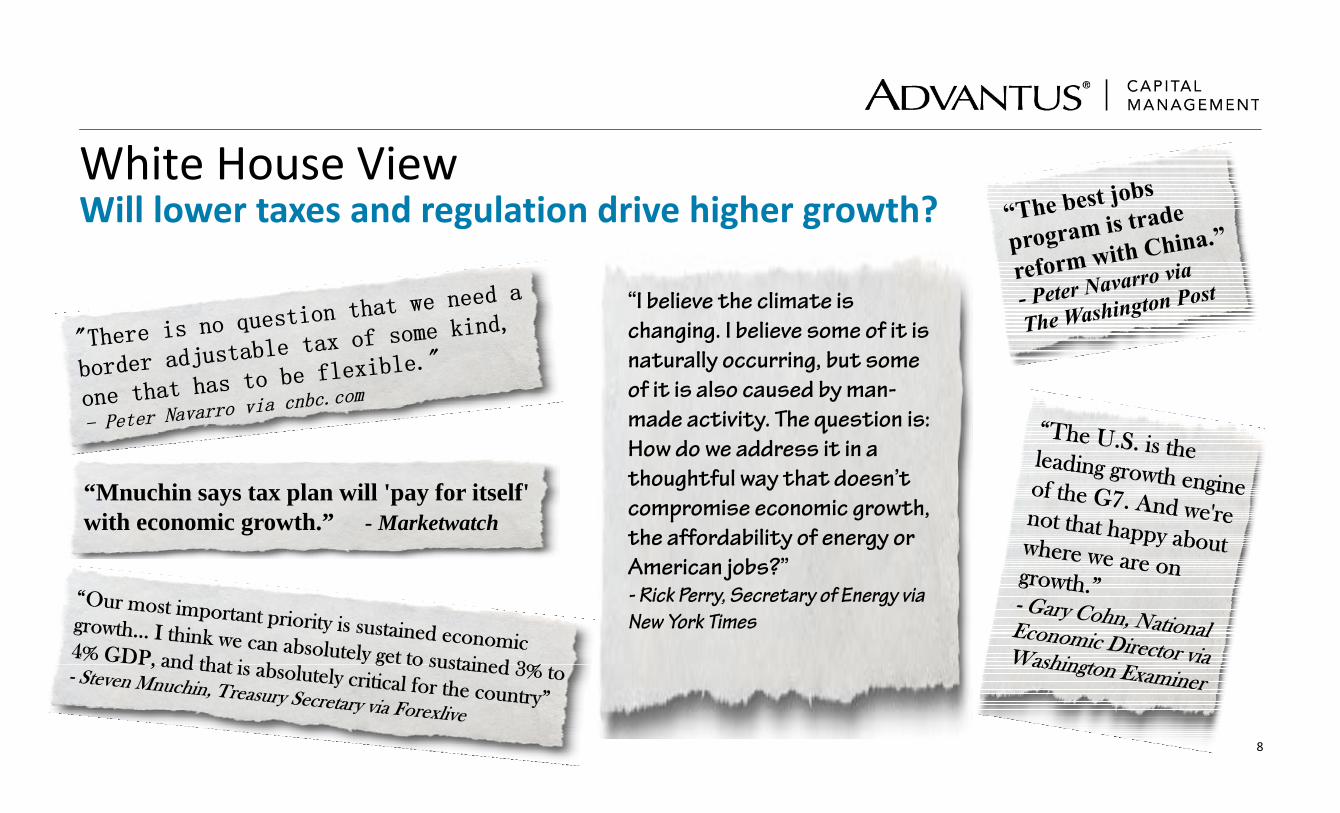
White House ViewWill lower taxes and regulation drive higher growth?
“Mnuchin says tax plan will 'pay for itself' with economic growth.” - Marketwatch
“I believe the climate is
changing. I believe some of it is
naturally occurring, but some
of it is also caused by man-
made activity. The question is:
How do we address it in a
thoughtful way that doesn’t
compromise economic growth,
the affordability of energy or
American jobs?”
- Rick Perry, Secretary of Energy via
New York Times
9
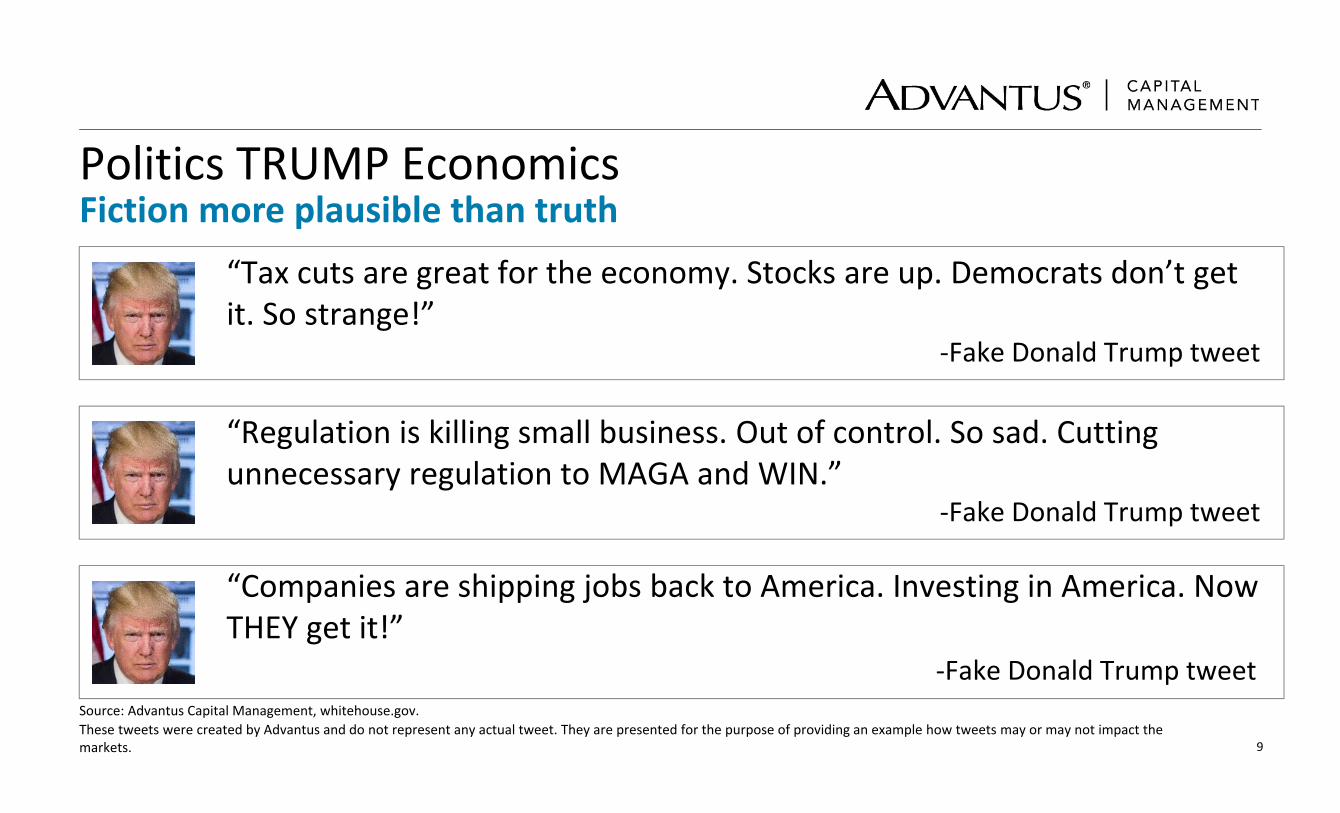
Politics TRUMP EconomicsFiction more plausible than truth
Source: Advantus Capital Management, whitehouse.gov.These tweets were created by Advantus and do not represent any actual tweet. They are presented for the purpose of providing an example how tweets may or may not impact the markets.
“Tax cuts are great for the economy. Stocks are up. Democrats don’t get it. So strange!”
‐Fake Donald Trump tweet
“Regulation is killing small business. Out of control. So sad. Cutting unnecessary regulation to MAGA and WIN.”
‐Fake Donald Trump tweet
“Companies are shipping jobs back to America. Investing in America. Now THEY get it!”
‐Fake Donald Trump tweet
10
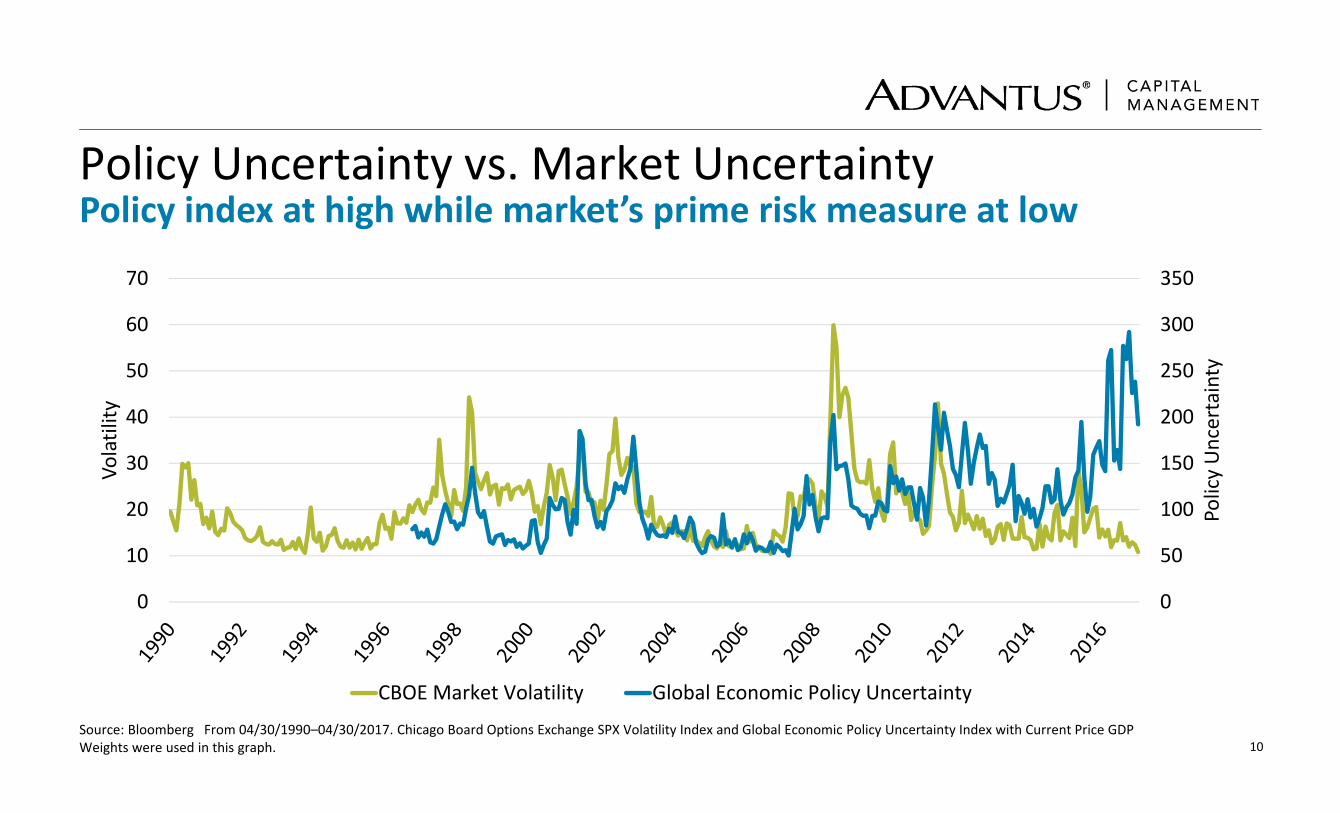
Policy Uncertainty vs. Market UncertaintyPolicy index at high while market’s prime risk measure at low
Source: Bloomberg From 04/30/1990–04/30/2017. Chicago Board Options Exchange SPX Volatility Index and Global Economic Policy Uncertainty Index with Current Price GDP Weights were used in this graph.
0
50
100
150
200
250
300
350
0
10
20
30
40
50
60
70
Policy Uncertainty
Volatility
CBOE Market Volatility Global Economic Policy Uncertainty
11
MacroLongstanding headwinds
Source: Advantus Capital Management, iStock.
• Age demographic shifts
• High developed country debt
• Secular stagnation
• Technology disrupts established industries
12
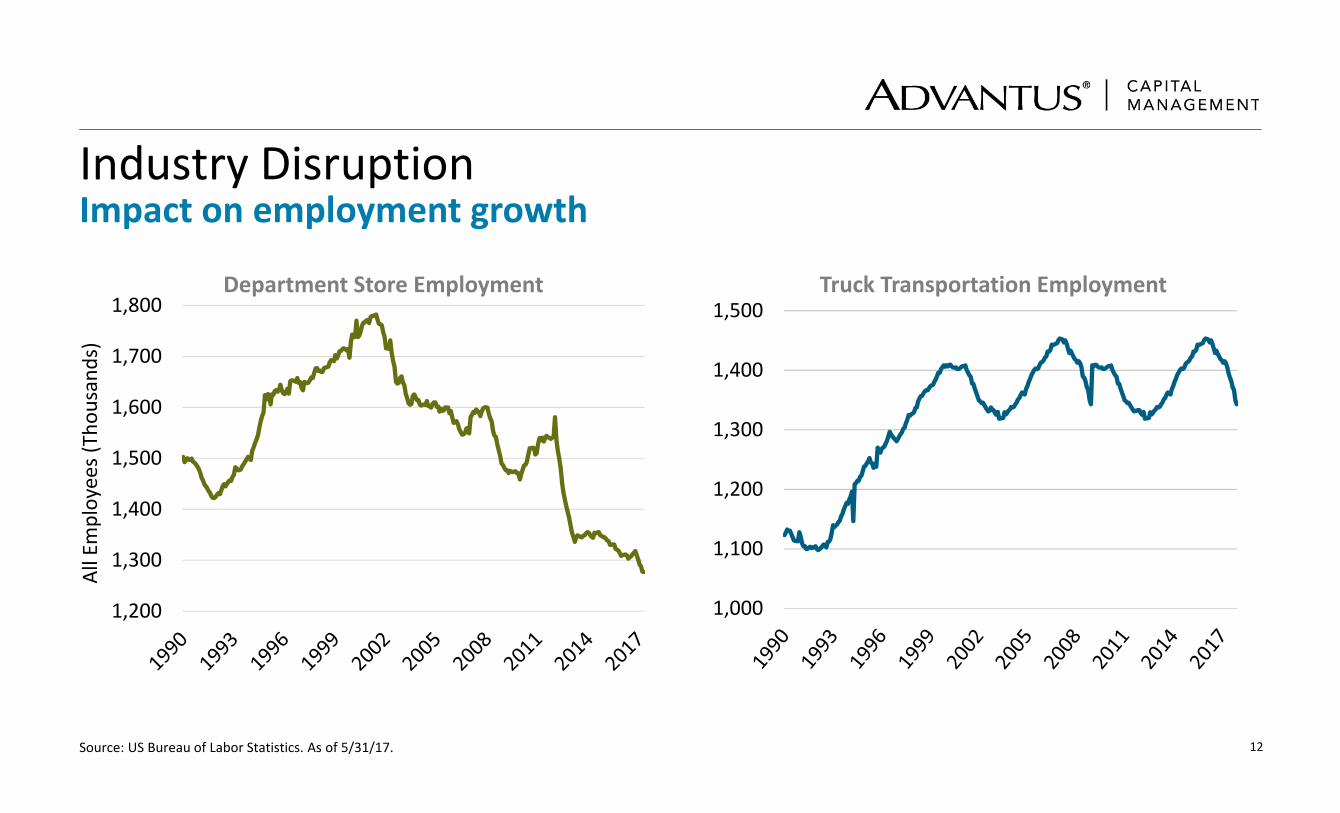
Industry DisruptionImpact on employment growth
Source: US Bureau of Labor Statistics. As of 5/31/17.
1,200
1,300
1,400
1,500
1,600
1,700
1,800Department Store Employment
All Employees (Thou
sand
s)
Truck Transportation Employment
1,000
1,100
1,200
1,300
1,400
1,500
13
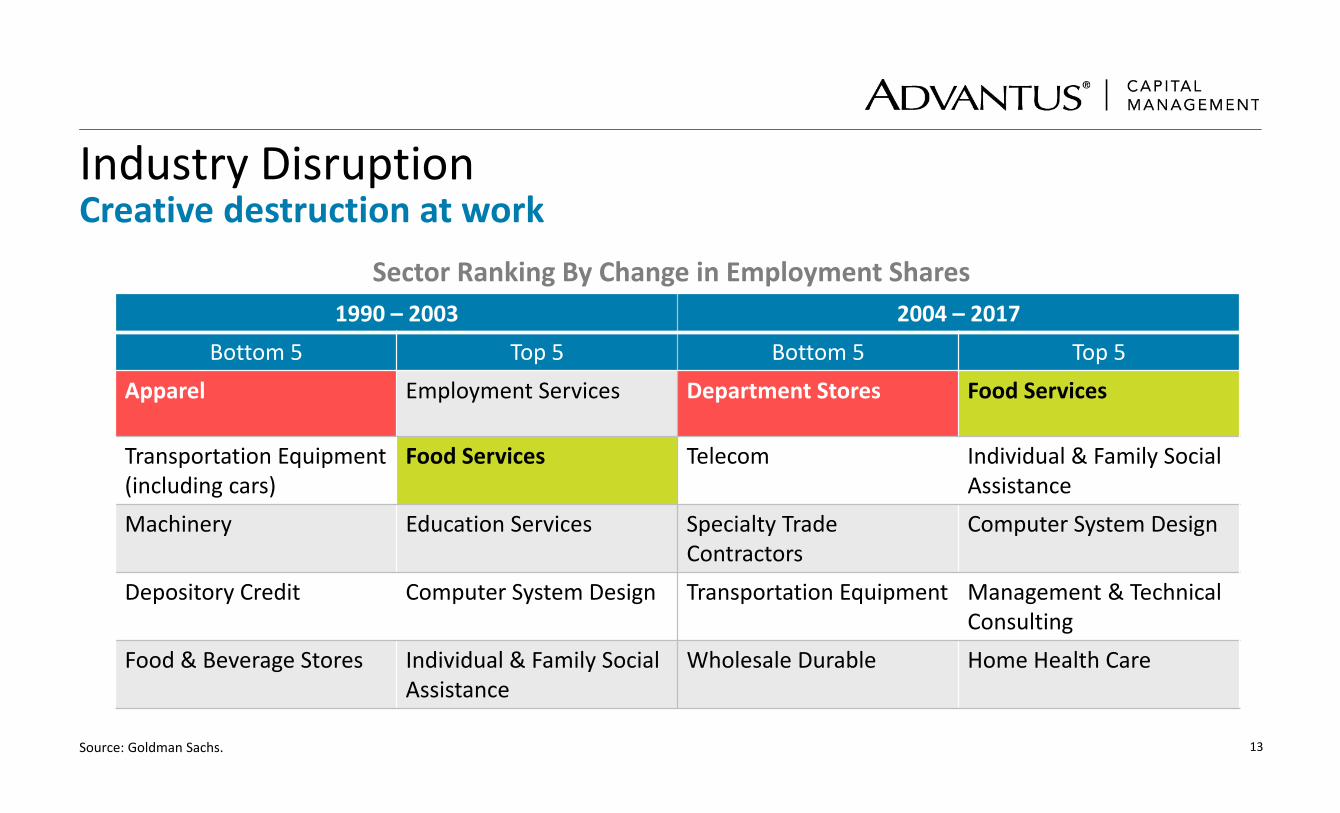
Industry DisruptionCreative destruction at work
Source: Goldman Sachs.
1990 – 2003 2004 – 2017Bottom 5 Top 5 Bottom 5 Top 5
Apparel Employment Services Department Stores Food Services
Transportation Equipment(including cars)
Food Services Telecom Individual & Family Social Assistance
Machinery Education Services Specialty Trade Contractors
Computer System Design
Depository Credit Computer System Design Transportation Equipment Management & TechnicalConsulting
Food & Beverage Stores Individual & Family Social Assistance
Wholesale Durable Home Health Care
Sector Ranking By Change in Employment Shares

14
DisruptionEmployment growth in other sectors
As of 5/31/17. Source: Bureau of Labor Statistics.
All Employees (Thou
sand
s)
6,000
8,000
10,000
12,000
1990 1993 1996 1999 2002 2005 2008 2011 2014 2017
Food Service Employment
15
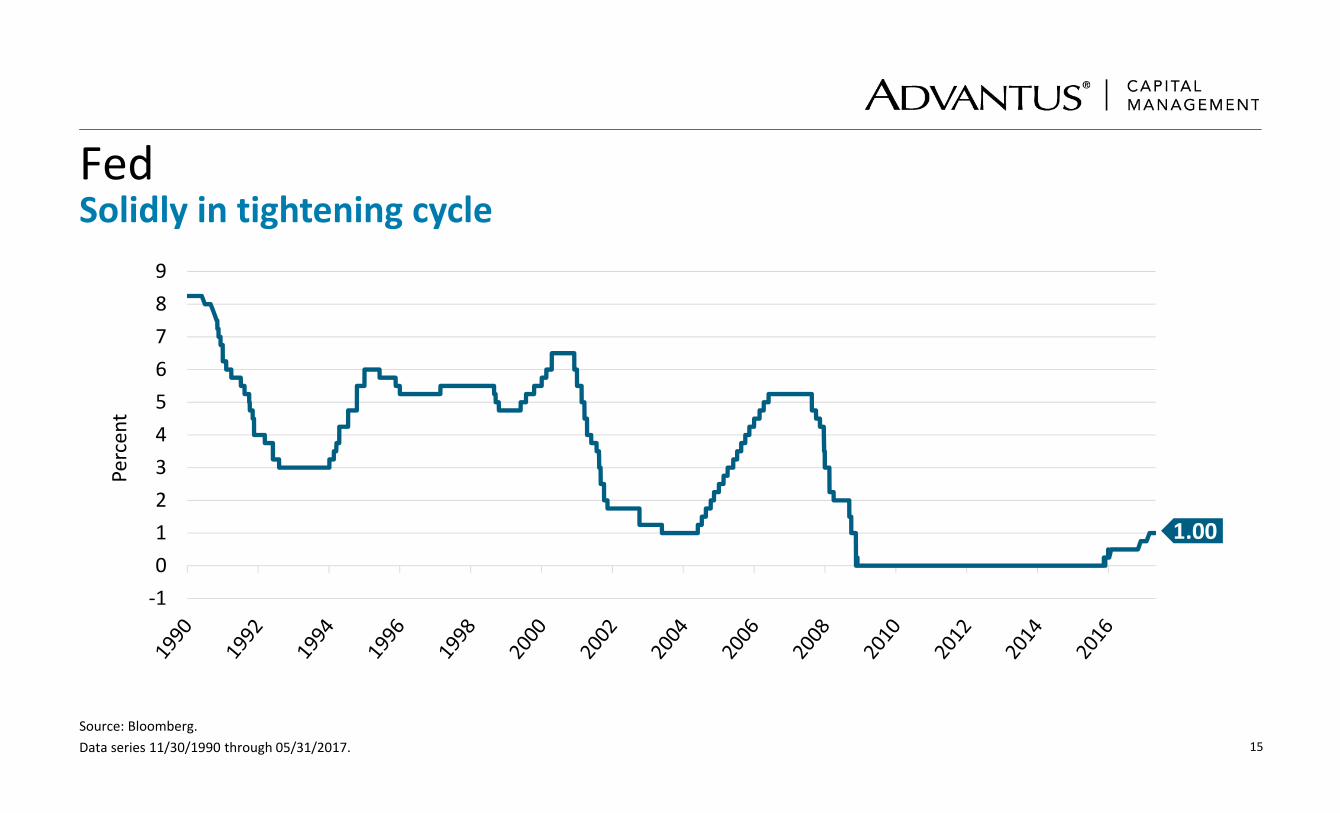
FedSolidly in tightening cycle
Source: Bloomberg. Data series 11/30/1990 through 05/31/2017.
‐10123456789
1.00
Percent
16
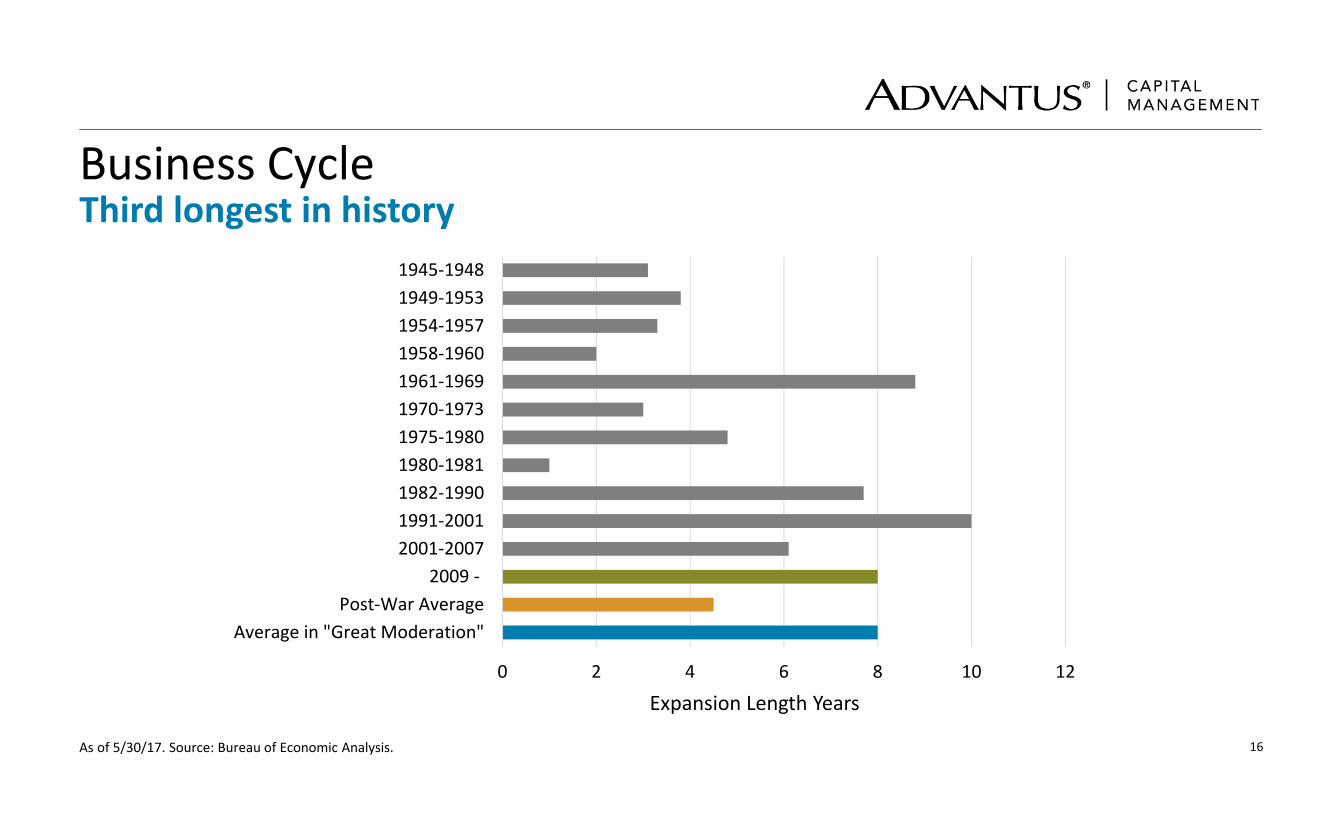
Business CycleThird longest in history
As of 5/30/17. Source: Bureau of Economic Analysis.
Expansion Length Years0 2 4 6 8 10 12
Average in "Great Moderation"Post‐War Average
2009 ‐2001‐20071991‐20011982‐19901980‐19811975‐19801970‐19731961‐19691958‐19601954‐19571949‐19531945‐1948
17
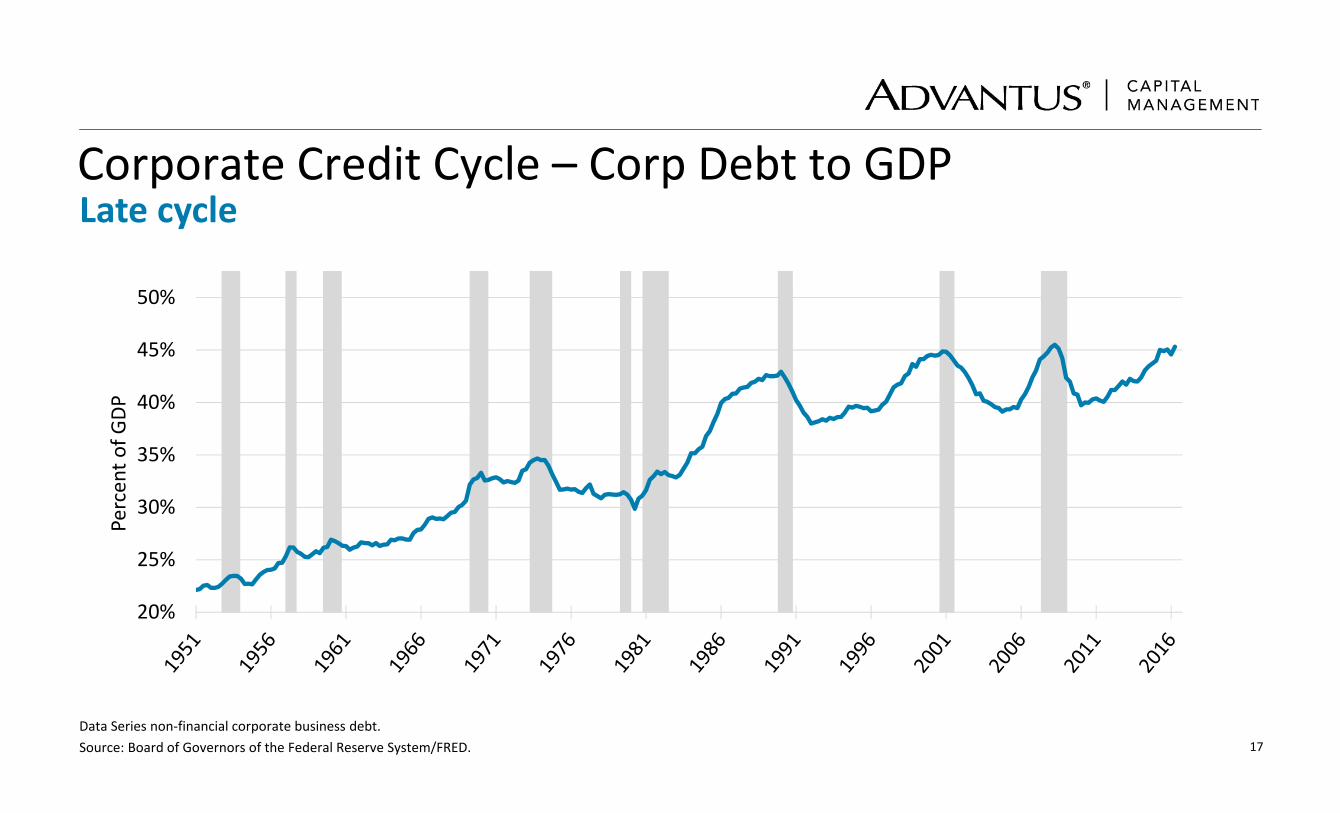
Corporate Credit Cycle – Corp Debt to GDPLate cycle
Data Series non‐financial corporate business debt. Source: Board of Governors of the Federal Reserve System/FRED.
Percent o
f GDP
20%
25%
30%
35%
40%
45%
50%
18
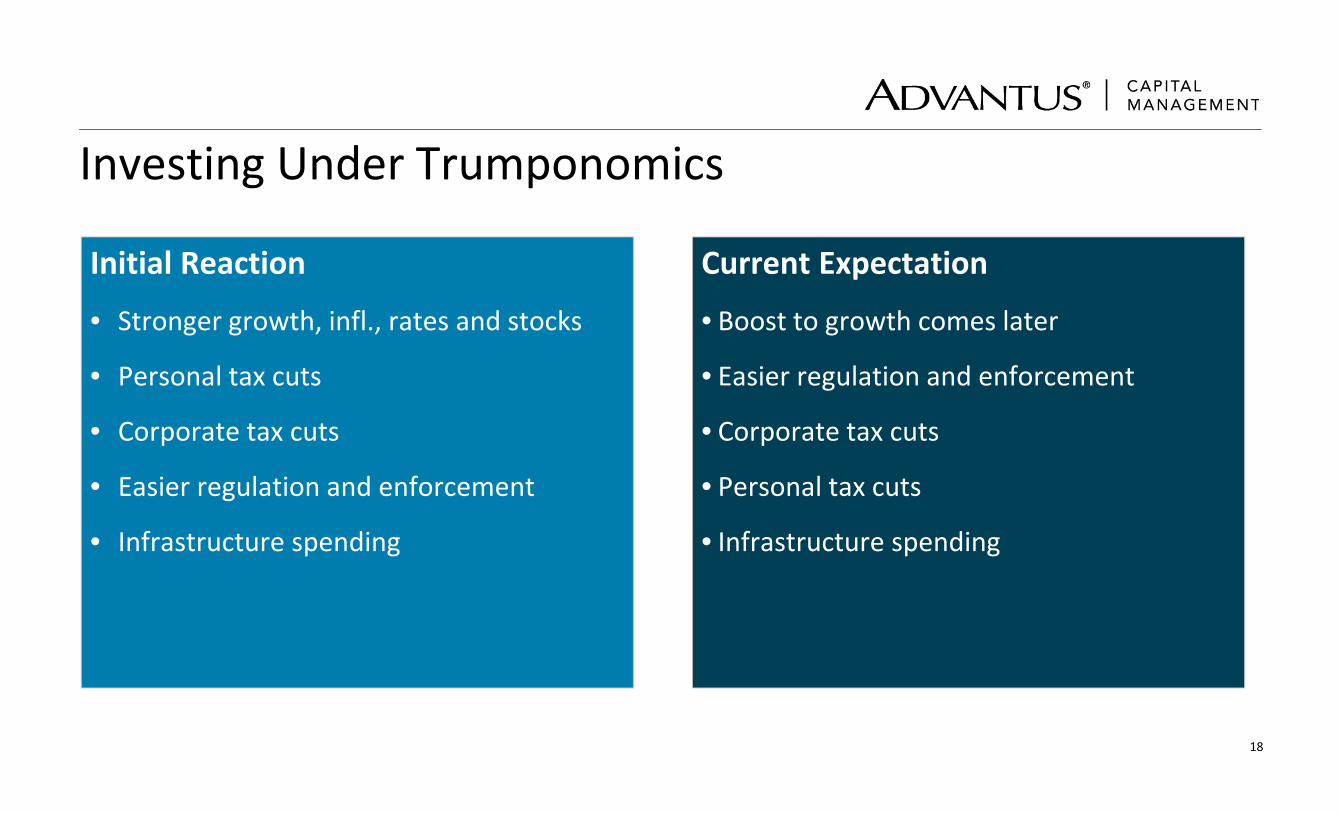
Investing Under Trumponomics
Initial Reaction
• Stronger growth, infl., rates and stocks
• Personal tax cuts
• Corporate tax cuts
• Easier regulation and enforcement
• Infrastructure spending
Current Expectation
• Boost to growth comes later
• Easier regulation and enforcement
• Corporate tax cuts
• Personal tax cuts
• Infrastructure spending
19
Macro RisksRemain significant despite sunnier outlook
• Fed solidly in tightening cycle
• Credit cycle in 8th year
• Developed country debt crisis (Europe or Japan)
• Emerging market debt/currency crisis (China)
20
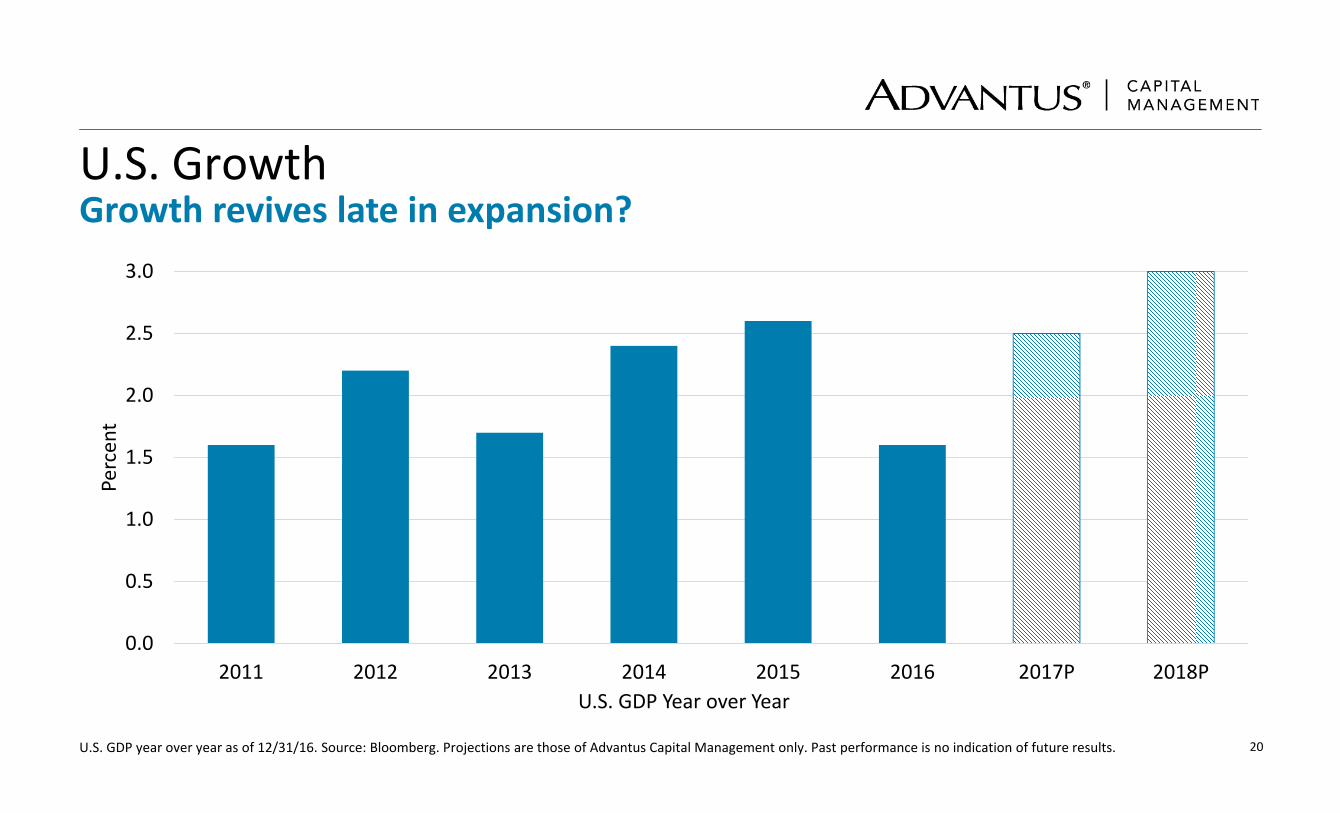
U.S. GrowthGrowth revives late in expansion?
U.S. GDP year over year as of 12/31/16. Source: Bloomberg. Projections are those of Advantus Capital Management only. Past performance is no indication of future results.
0.0
0.5
1.0
1.5
2.0
2.5
3.0
2011 2012 2013 2014 2015 2016 2017P 2018P
Percent
U.S. GDP Year over Year
21
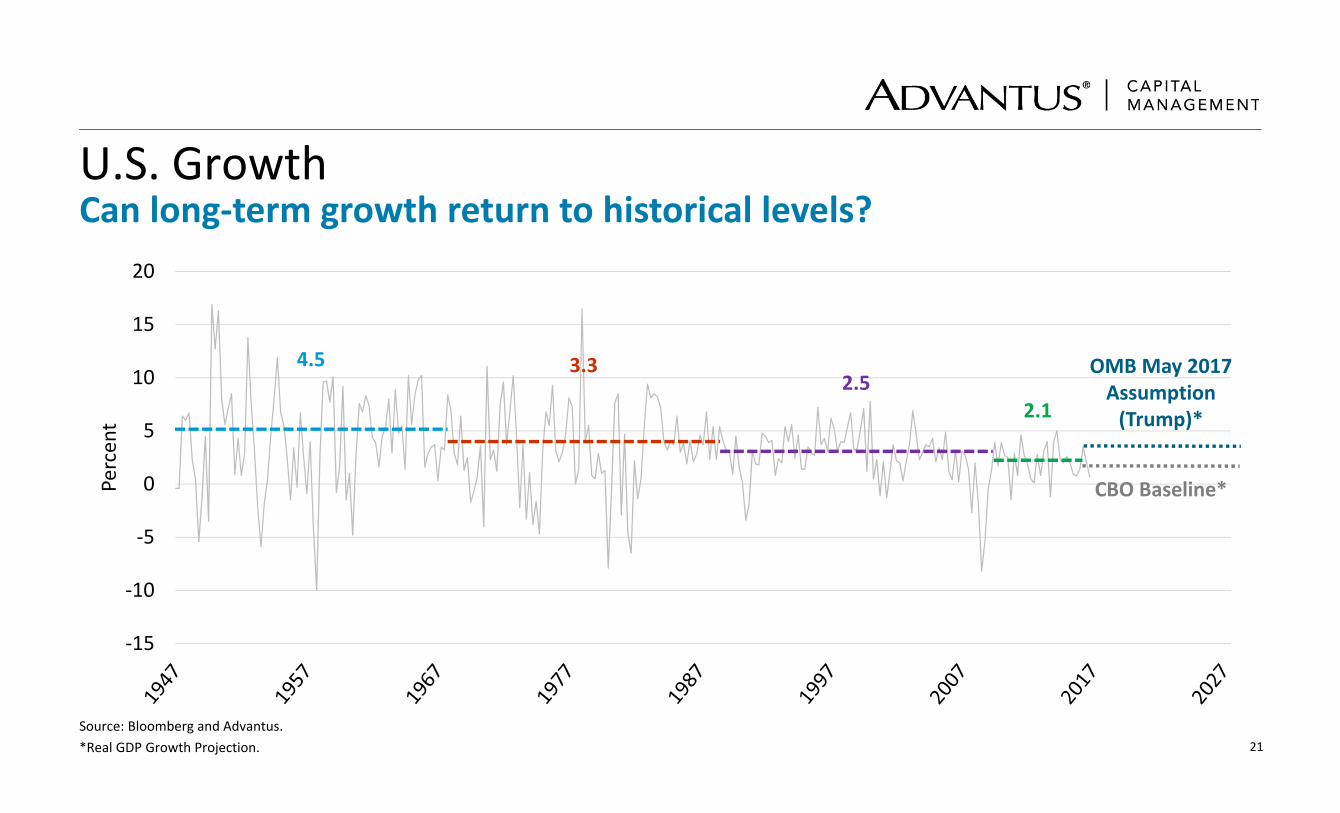
U.S. GrowthCan long‐term growth return to historical levels?
Source: Bloomberg and Advantus. *Real GDP Growth Projection.
‐15
‐10
‐5
0
5
10
15
20
Percent
4.5 3.32.5
2.1
CBO Baseline*
OMB May 2017 Assumption (Trump)*
22
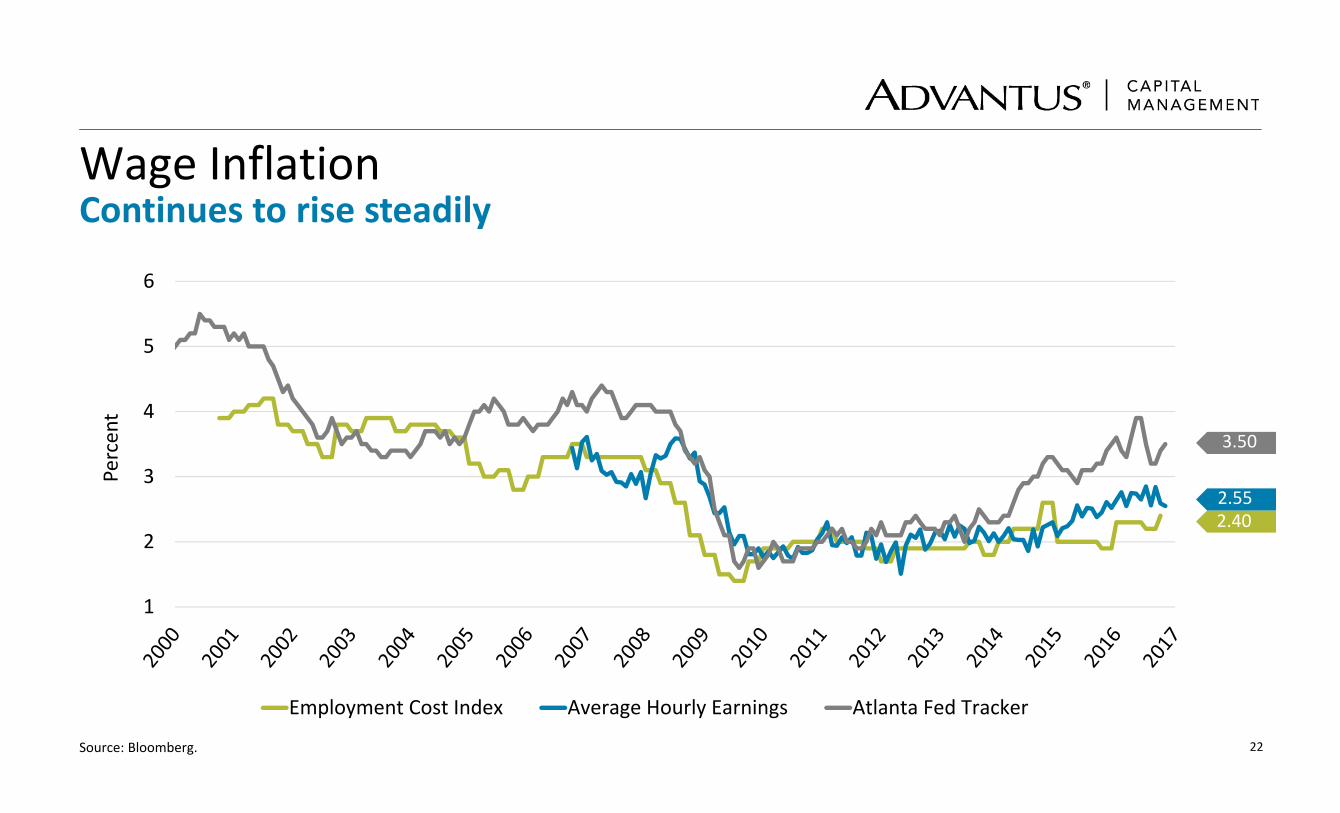
Wage InflationContinues to rise steadily
Source: Bloomberg.
3.50
2.552.40
1
2
3
4
5
6
Percent
Employment Cost Index Average Hourly Earnings Atlanta Fed Tracker
23
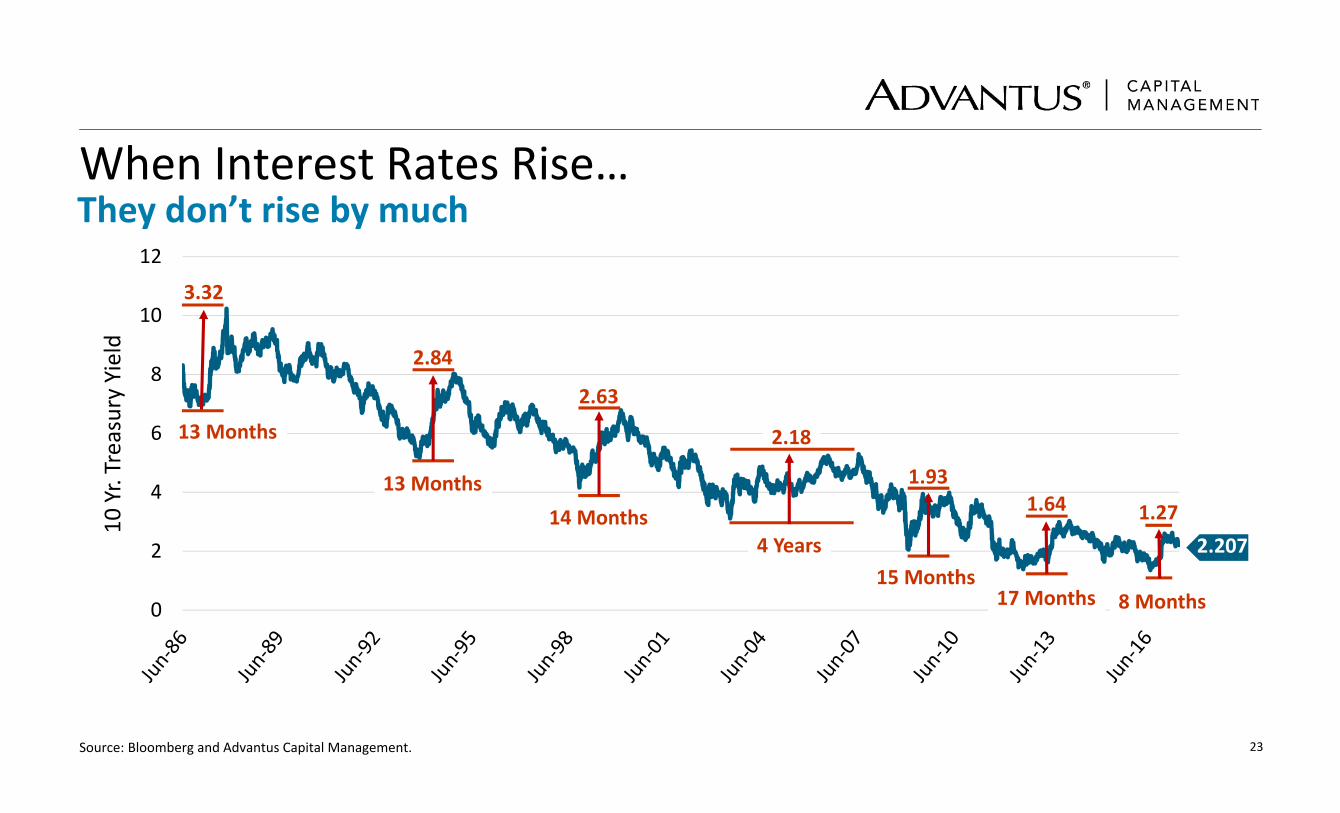
When Interest Rates Rise…They don’t rise by much
Source: Bloomberg and Advantus Capital Management.
0
2
4
6
8
10
12
2.207
10 Yr. Treasury Yield
3.32
2.84
2.63
2.18
1.931.64 1.27
13 Months
13 Months14 Months
4 Years15 Months
17 Months 8 Months
24
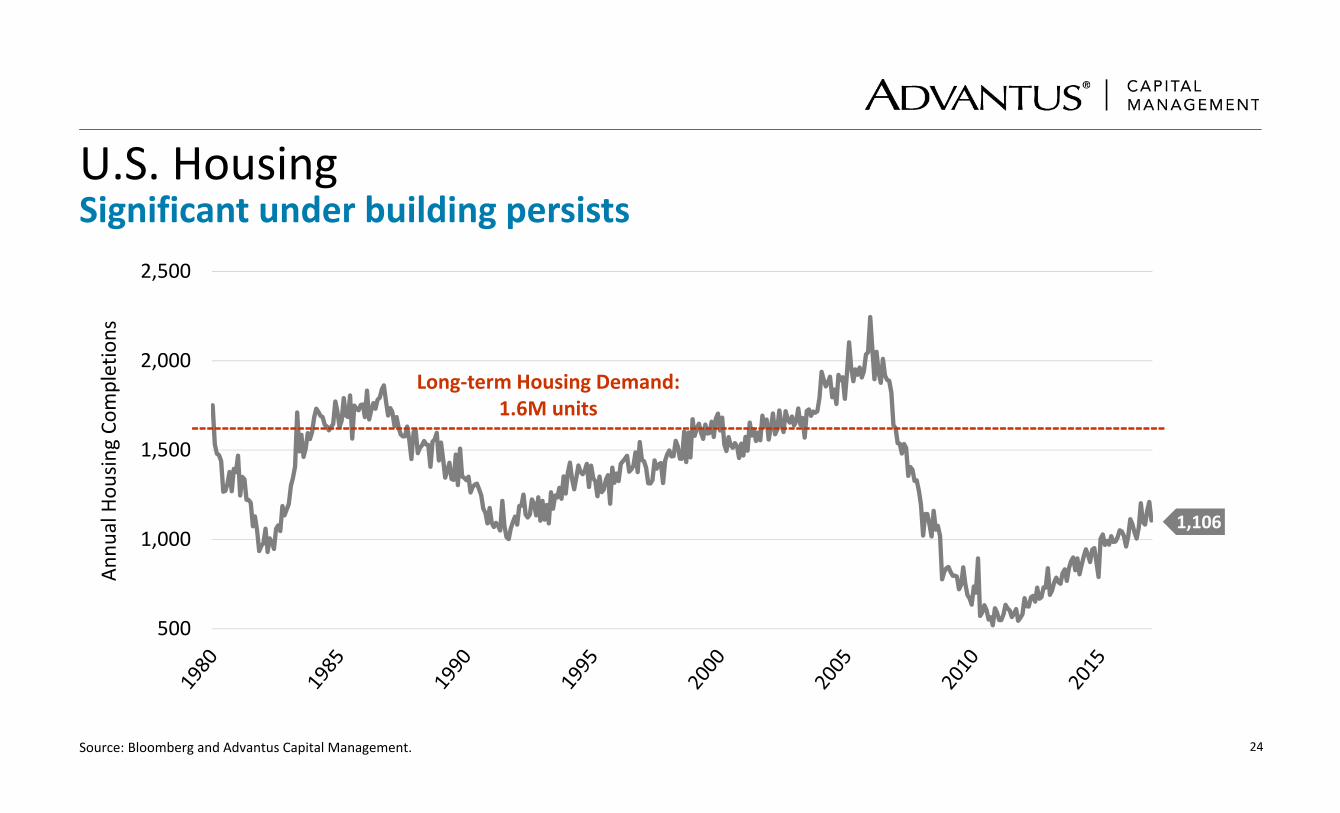
U.S. HousingSignificant under building persists
Source: Bloomberg and Advantus Capital Management.
500
1,000
1,500
2,000
2,500
1,106
Long‐term Housing Demand: 1.6M units
‐‐‐‐‐‐‐‐‐‐‐‐‐‐‐‐‐‐‐‐‐‐‐‐‐‐‐‐‐‐‐‐‐‐‐‐‐‐‐‐‐‐‐‐‐‐‐‐‐‐‐‐‐‐‐‐‐‐‐‐‐‐‐‐‐‐‐‐‐‐‐‐‐‐‐‐‐‐‐‐‐‐‐‐‐‐‐‐‐‐‐‐‐‐‐‐‐‐‐‐‐‐‐‐‐‐‐‐‐‐‐‐‐‐‐‐‐‐‐‐‐‐‐‐‐‐‐‐‐
Annu
al Hou
sing Co
mpletions
25
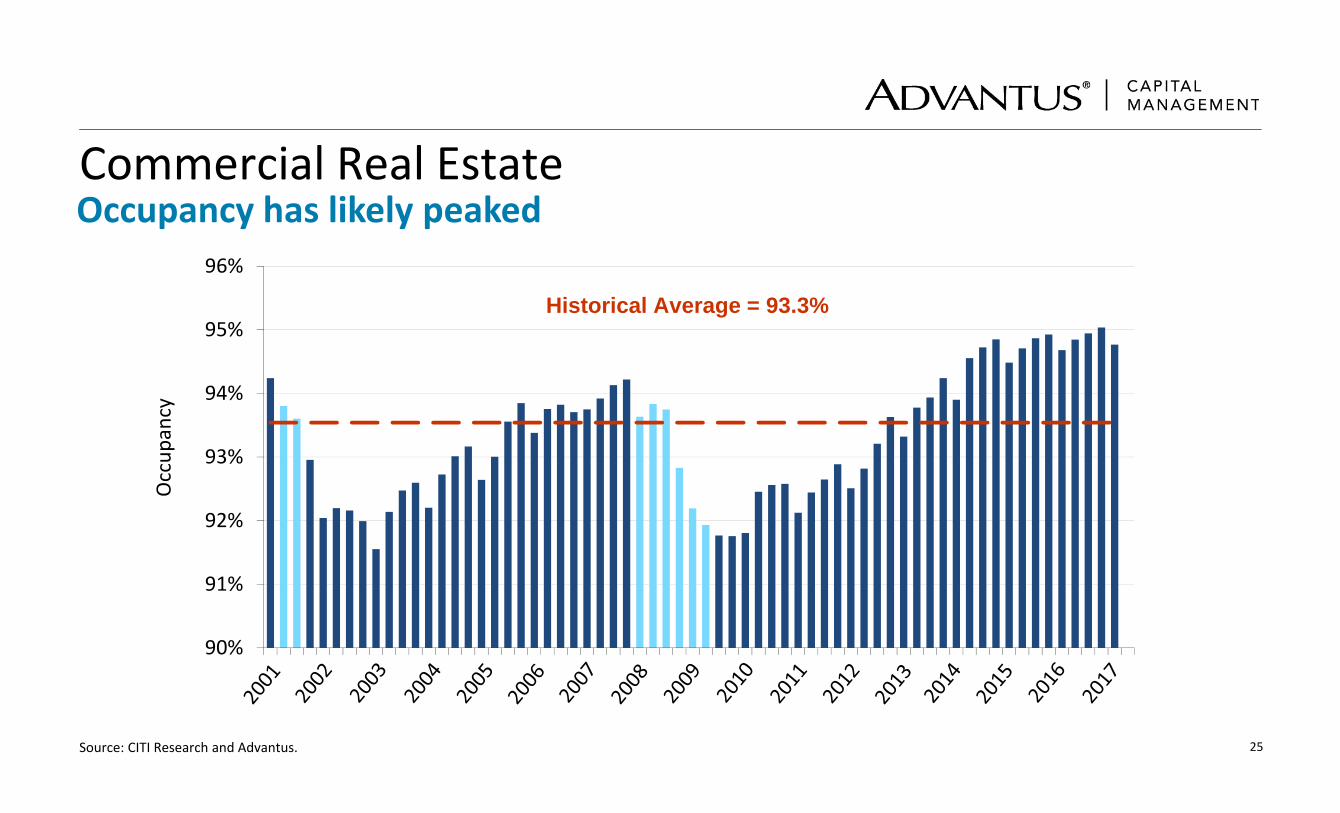
Commercial Real EstateOccupancy has likely peaked
Source: CITI Research and Advantus.
90%
91%
92%
93%
94%
95%
96%
Historical Average = 93.3%
Occup
ancy
26
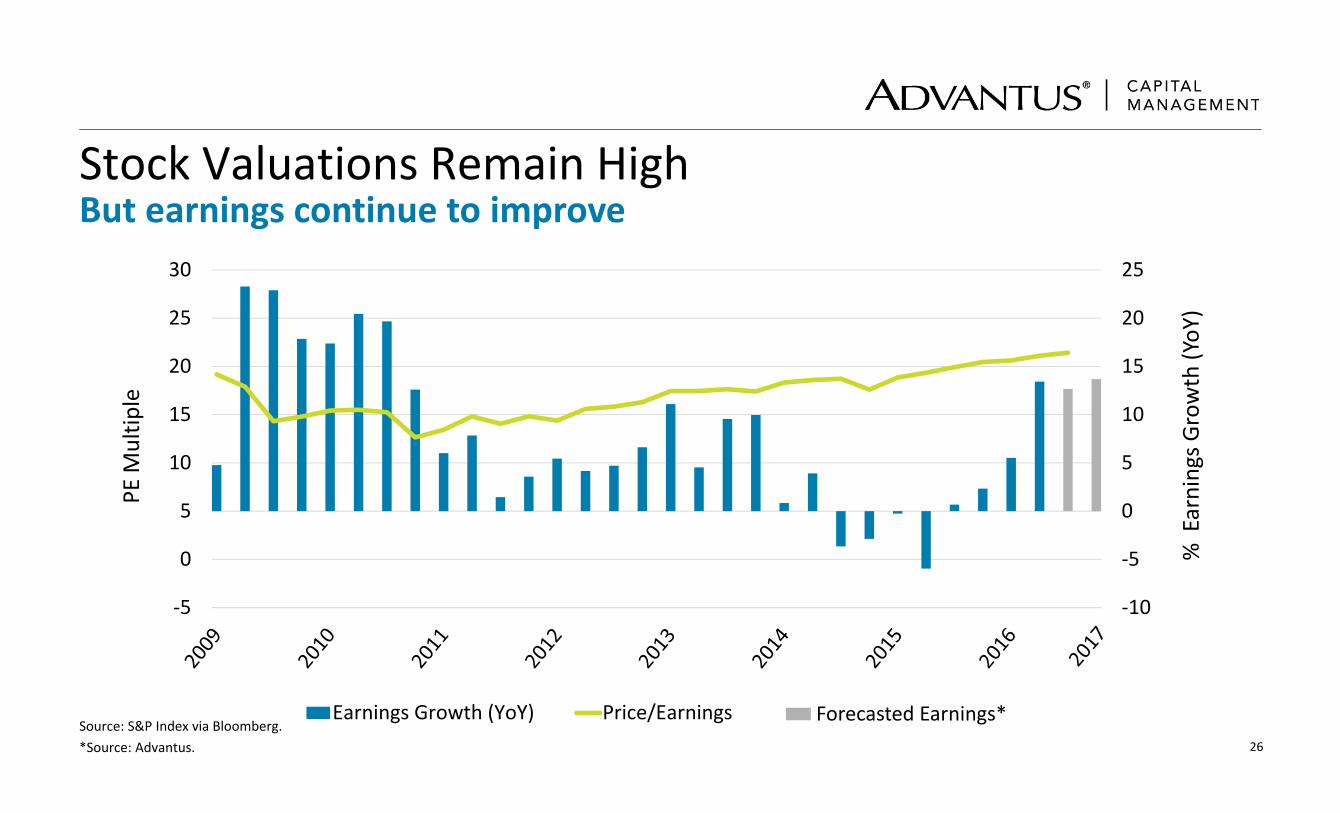
Stock Valuations Remain HighBut earnings continue to improve
Source: S&P Index via Bloomberg.*Source: Advantus.
‐10
‐5
0
5
10
15
20
25
‐5
0
5
10
15
20
25
30
Earnings Growth (YoY) Price/Earnings
% Earnings G
rowth (YoY
)
PE M
ultip
le
Forecasted Earnings*
27
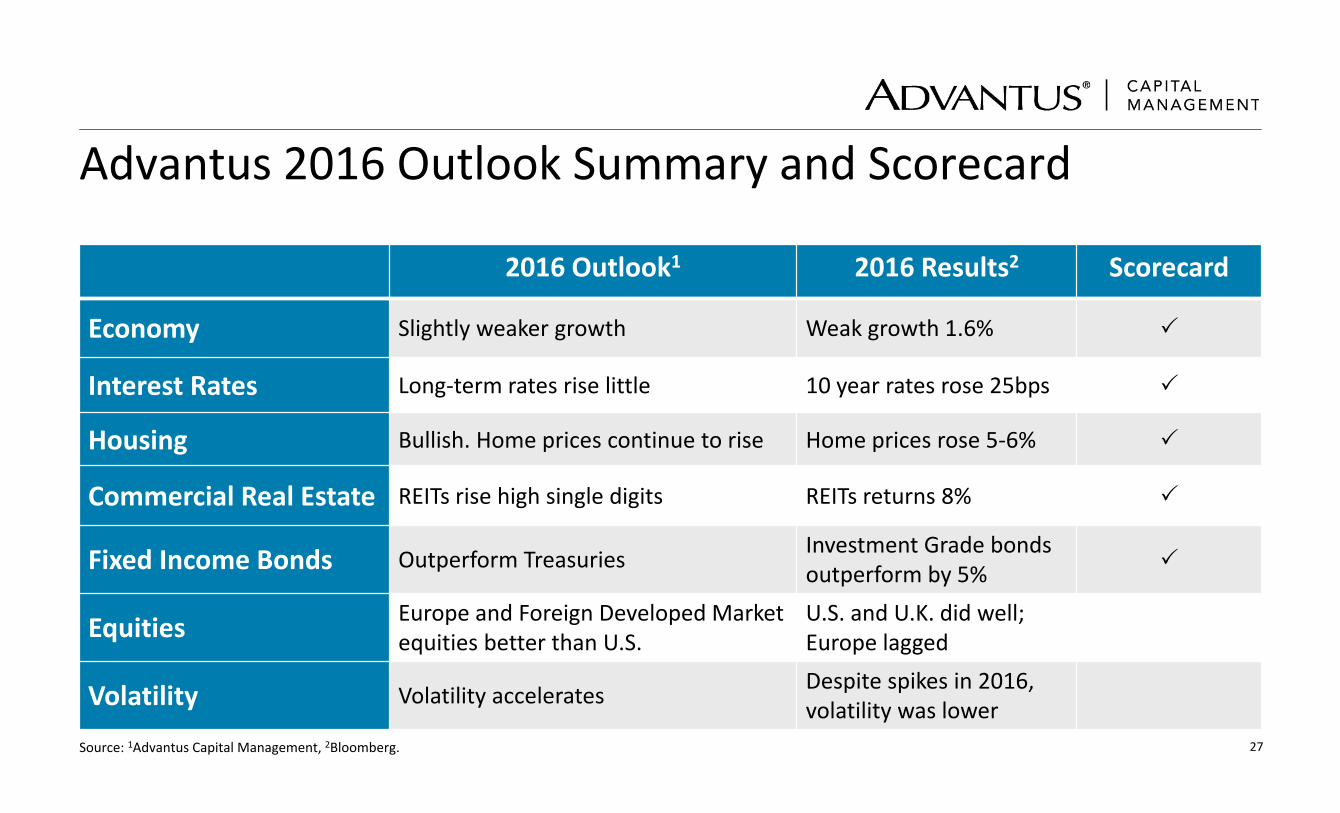
Advantus 2016 Outlook Summary and Scorecard
Source: 1Advantus Capital Management, 2Bloomberg.
2016 Outlook1 2016 Results2 Scorecard
Economy Slightly weaker growth Weak growth 1.6%
Interest Rates Long‐term rates rise little 10 year rates rose 25bps
Housing Bullish. Home prices continue to rise Home prices rose 5‐6%
Commercial Real Estate REITs rise high single digits REITs returns 8%
Fixed Income Bonds Outperform Treasuries Investment Grade bonds outperform by 5%
Equities Europe and Foreign Developed Market equities better than U.S.
U.S. and U.K. did well; Europe lagged
Volatility Volatility accelerates Despite spikes in 2016, volatility was lower
28
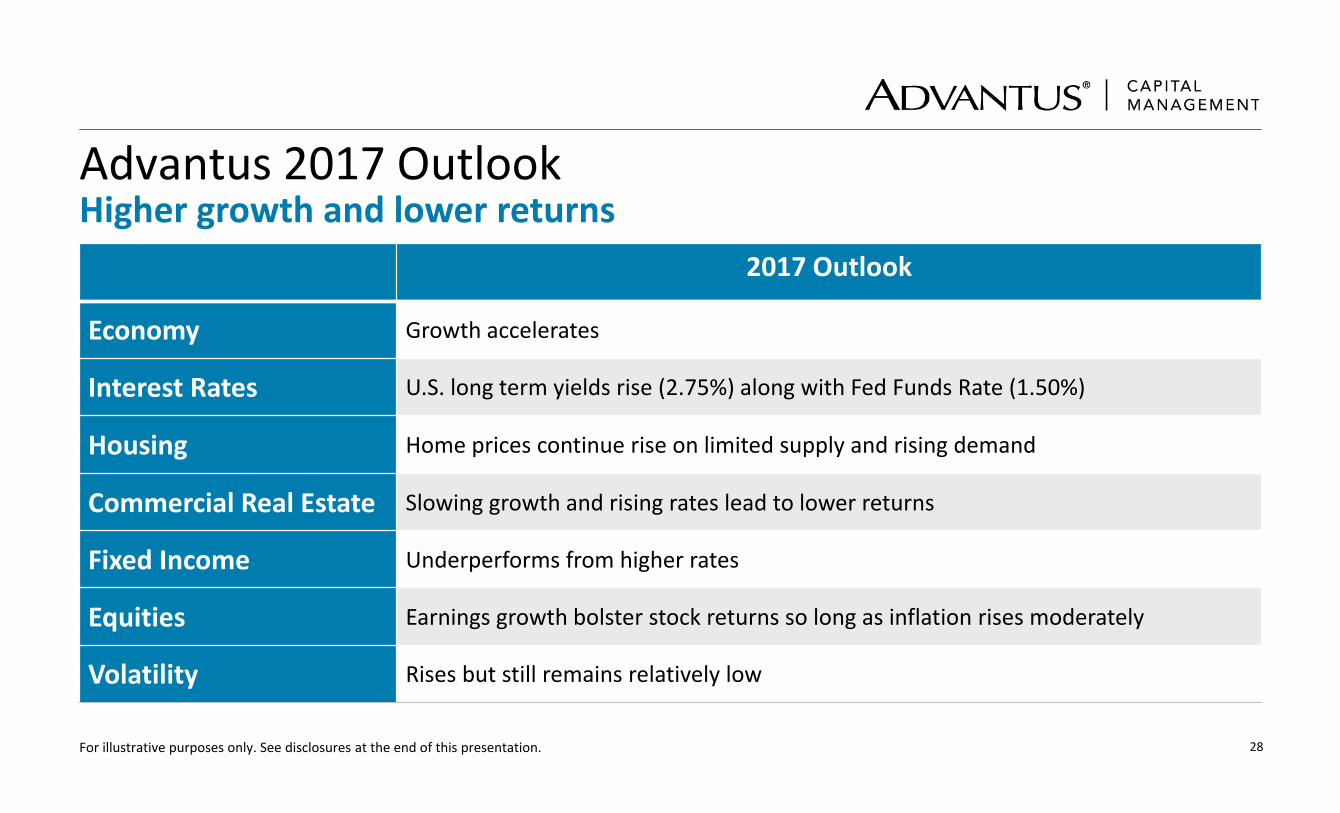
Advantus 2017 OutlookHigher growth and lower returns
2017 Outlook
Economy Growth accelerates
Interest Rates U.S. long term yields rise (2.75%) along with Fed Funds Rate (1.50%)
Housing Home prices continue rise on limited supply and rising demand
Commercial Real Estate Slowing growth and rising rates lead to lower returns
Fixed Income Underperforms from higher rates
Equities Earnings growth bolster stock returns so long as inflation rises moderately
Volatility Rises but still remains relatively low
For illustrative purposes only. See disclosures at the end of this presentation.
DisclosuresThe opinions expressed herein represent the current, good faith views of the author(s) at the time of publication and are provided for limited purposes, are not definitive investment advice, and should not be relied on as such. The information presented in this article has been developed internally and/or obtained from sources believed to be reliable; however, Advantus does not guarantee the accuracy, adequacy or completeness of such information. Predictions, opinions, and other information contained in this article are subject to change continually and without notice of any kind and may no longer be true after the date indicated. Any forward‐looking statements speak only as of the date they are made, and Advantus assumes no duty to and does not undertake to update forward‐looking statements. Forward‐looking statements are subject to numerous assumptions, risks and uncertainties, which change over time. Actual results could differ materially from those anticipated.
Advantus Capital Management, Inc. is a subsidiary of Securian Financial Group, Inc. For Institutional Investment Use Only.
www.advantuscapital.com©2017 Advantus Capital Management, Inc. All rights reserved. DOFU 6‐2017189911