Embed Size (px)
Citation preview
ADVERTIMENT. Lʼaccés als continguts dʼaquesta tesi queda condicionat a lʼacceptació de les condicions dʼúsestablertes per la següent llicència Creative Commons: http://cat.creativecommons.org/?page_id=184
ADVERTENCIA. El acceso a los contenidos de esta tesis queda condicionado a la aceptación de las condiciones de usoestablecidas por la siguiente licencia Creative Commons: http://es.creativecommons.org/blog/licencias/
WARNING. The access to the contents of this doctoral thesis it is limited to the acceptance of the use conditions setby the following Creative Commons license: https://creativecommons.org/licenses/?lang=en
Aircraft departure synchronization toreduce ATC en route interventions
by
Jenaro Nosedal-Sanchez
Thesis advisor
Dr. Miquel Angel Piera Eroles
DISSERTATION
Submitted in Partial Fulfillment of the
Requirements for the Degree of
Doctor in PhilosophyElectrical and Telecommunication Engineering Program
Telecommunications and Systems Engineering Dept.
Universitat Autonoma de Barcelona
Barcelona, Spain
February, 2016

c©2016, Jenaro Nosedal-Sanchez
iii

February 2016
Dr. Miquel Angel Piera Eroles, Associate professor at School of Engineering
at Universitat Autonoma de Barcelona,
CERTIFIES:
That the doctoral thesis entitled ”Aircraft departure synchronization to
reduce ATC en route interventions”, presented in partial fullfilment of the re-
queriments for the obtention of the degree of Doctor in Philosophy, embodies original
work done by Jenaro Nosedal-Sanchez under his supervision.
Dr. Miquel Angel Piera Eroles.
Logistics and Aeronautics Unit
Department of Telecommunications
and Systems Engineering
Universitat Autonoma de Barcelona
iv

Dedication
To my beloved wife Gabriela, to my lovely sons Efren and Luis and to my devoted
parents Dolores and Vıctor.
”I was blessed twice with the greatest treasure: my family,
all what I am is because of them and for them”.
–Jenaro Nosedal Sanchez
v

vi
Acknowledgments
For many reasons, this project was more than a professional or academic under-taking, many other challenges and issues were involved, for that reason foremost I amthankful with my wife and my sons for their willingness and support, because duringthese years several difficulties appeared but all of you showed a big commitment anda great resilience thus this achievement is mostly because of you.
I also want to acknowledge to Dra. Idalia Flores, thank you for introduce me withDr. Piera and encourage me to perform my graduate studies abroad, those eventswere the key stones to make feasible the starting phase of this project.
Of course I need to mention my sincerely and extended acknowledgment to Dr.Miquel A. Piera, thanks for give me the unique opportunity to learn from you andparticipate and be part of this research group, thanks for your effort to build thisrich environment and be an example of hard work, besides I want to stress yourcommitment help in some crucial moments when I was looking the way to succeeddespite some personal issues.
Along these years I had have the honor to collaborate with other researchers,in particular I want to mention to Dr. Adriano Solis, because despite their verybusy agenda, he always found the time to discuss and revise deeply the ideas andmanuscripts, thanks Adriano for your valuable feedback and mentoring during thelast year of my graduate studies. Other valuable experience was my research intern-ship at ENAC, special thanks goes to Dr. Nicolas Durand and Dr. Cyril Allignol,both were very supportive and very kind in facilitating my work there, also otherresearchers from MAIAA laboratory deserve special mention Dr. Nicolas Barnier,Dr. David Gianazza, Dr. Richard Alligier and Dr. Alexandre Gondran, thanks toall for exchange your opinions and moreover for your hospitality.
I should also mention that my graduate studies in the UAB were supported inpart by the National Research and Technology Council of Mexico (CONACYT), alsoduring these research years I had the support from UAB as a PIF.
Special mention deserves the AGAUR from Catalan Government, because fromthis agency I received support to perform my international research internship atENAC.
Naturally, I am grateful to my parents, Dolores and Vıctor for their enthusiasmand all the opportunities they provided me in Mexico, everything I do is because yougave and give me a great impulse. To my brothers Benji and Al, because even in thedistance your are a great backup.
Finally, along this time I had the opportunity of share time with great people inthe UAB, really I have learned and received in several ways a lot from all of you:Margarita Torres, Olatunde Baruwa, Jun Tang, Marko Radanovic, Olessya Bogun,
vii

Yue Lang, Silvia Padron, Xavier Leal, Roman Buil, Monica Gutierrez, Sergio Ruiz,Ernesto Santana, Hugo Marenco, Catya Zuiga and Miguel Mujica, beyond the workinteraction and even more important I have enjoyed your friendship. Thanks formake these years and process more meaningful!!!
Sabadell, Barcelona Jenaro Nosedal-SanchezFebruary, 2016
viii

Aircraft departure synchronization toreduce ATC en route interventions
by
Jenaro Nosedal-Sanchez
ABSTRACT OF DISSERTATION
Submitted in Partial Fulfillment of the
Requirements for the Degree of
Doctor in Philosophy
Electrical and Telecommunication Engineering Program
Telecommunications and Systems Engineering Dept.
Universitat Autonoma de Barcelona
Barcelona, Spain
February, 2016
Aircraft departure synchronization toreduce ATC en route interventions
by
Jenaro Nosedal-Sanchez
Thesis advisor
Dr. Miquel Angel Piera Eroles
Engineering School, Universitat Autonoma de Barcelona, 2016
Abstract
The research work presented in this thesis focuses on the micro and macro analysis
of the untimed en route waypoints of aircraft trajectories obtained after applying a
bi-dimensional (i.e. latitude and longitude positions) D - transform [45] and on
the application of causal modelling and constraint programming (CP) techniques to
simulate and validate a departure-time-bounded adjustment process that preserves
the scheduled slots while relaxing tight 4DT interdependences (for instance, reducing
or solving airspace demand - capacity imbalances).
The research developed instead of a fragmented look at the Air Traffic Man-
agement (ATM) system, in order to generate synergies between airspace users (AUs)
while reducing Air Traffic Control (ATC) interventions, proposes an innovative frame-
work supporting a comprehensive analysis of interdependencies between Air Traffic
Flow and Capacity Management (ATFCM), Departure Management (DMAN) and
the agreed Reference Business Trajectories (RBTs).
x
The overarching goal of this dissertation is to contribute to the literature about
the use of robust combination of RBT’s time stamps preserving the 3D agreements
into a set of collaborative-competitive trajectories under a global scope with mini-
mum ATC interventions.
Furthermore, the proposed approach allows the linkage of land side with air side
operations, and enables the connection between AUs requirements within the traffic
network, thus provides a framework to deploy new Decision Support Tools (DSTs)
towards more collaborative and competitive ATFCM services.
Resumen
La investigacion que se presenta en esta tesis, se enfoca en el analisis a nivel mi-
cro y macro de la posiciones atemporales de trayectorias aereas en la fase de ruta,
obtenidas a partir del uso de una transformacion bidimensional (posiciones de latitud
y longitud) transformacion D [45] y de la aplicacion de modelos causales y tecnicas de
programacion por restricciones para simular y validar un proceso de ajuste acotado
de tiempos de despegue que conserva las ventanas de salida programadas y al mismo
tiempo relaja las interdependencias tensas entre trayectorias 4D (e.g., reduciendo o
resolviendo desequilibrios entre demanda y capacidad en el espacio aereo).
La investigacion desarrollada, con la finalidad de producir sinergias entre los
Usuarios del Espacio Aereo (AUs) y simultaneamente para reducir las intervenciones
de Control de Trafico Aereo (ATC), en vez de revisar el sistema de Gestion de
Trafico Aereo de manera fragmentada, propone un marco innovador que soporta
una analisis exhaustivo de las interdependencias entre Gestion de Flujo de Trafico
Aereo y Gestion de la Capacidad (ATFCM), Gestion de Despegues (DMAN) y las
Trayectorias Comerciales de Referencia (RBTs) acordadas.
xi
El objetivo general de este trabajo es aportar a la literatura con el uso de com-
binaciones robustas de marcas temporales de las RBTs que preservan los perfiles 3D
acordados dentro de un conjunto de trayectorias competitivas y colaborativas bajo
un enfoque global que reducen al mınimo las intervencin de ATC.
Adicionalmente, el enfoque propuesto permite la vinculacion de parte de tierra
con las operaciones del lado aire, y habilita la conexion entre los requerimientos de los
AUs dentro de la red de trafico, por lo que proporciona un marco para implementar
nuevas herramientas de apoyo en las decisiones (DST) para el desarrollo de servicios
ATFCM mas competitivos y colaborativos.
xii

Contents
List of Figures xv
List of Tables xvi
1 Introduction 1
1.1 Background . . . . . . . . . . . . . . . . . . . . . . . . . . . . . . . . 1
1.2 List of publications . . . . . . . . . . . . . . . . . . . . . . . . . . . . 6
1.3 Thesis structure . . . . . . . . . . . . . . . . . . . . . . . . . . . . . . 8
2 State of the art 10
2.1 Motivation and research objectives . . . . . . . . . . . . . . . . . . . 16
3 Paper I 21
4 Paper II 36
5 Research summary, conclusions and further research 55
xiii
Contents
5.1 Research summary . . . . . . . . . . . . . . . . . . . . . . . . . . . . 55
5.2 Conclusions . . . . . . . . . . . . . . . . . . . . . . . . . . . . . . . . 57
5.3 Further research . . . . . . . . . . . . . . . . . . . . . . . . . . . . . . 58
A Paper III 60
B Paper IV 75
References 100
xiv
List of Figures
2.1 Airspace hotspots identification . . . . . . . . . . . . . . . . . . . . . 17
2.2 Airspace potential proximate event identification . . . . . . . . . . . 18
2.3 Potential proximate event clearance analysis and measurement . . . 18
2.4 Airspace hotspots distribution over Europe . . . . . . . . . . . . . . 19
2.5 Clearance time distribution for potential proximate events . . . . . . 20
xv

List of Tables
xvi
Chapter 1
Introduction
1.1 Background
The objective of Air Traffic Management (ATM) is to ensure safe and efficient flights,
from departure to arrival. This mission is carried out by a number of national and
international organizations that provide different services to the airspace users (AUs).
[18]
Air Traffic Flow and Capacity Management (ATFCM), is a service complemen-
tary to Air Traffic Control (ATC), the objective of which is to ensure an optimum
flow of air traffic through defined areas assuring that available capacity of the ATC
system will not be exceeded. [20]
Accordingly with [6], ATFCM procedures try to resolve local demand-capacity
mismatches by adjusting the aggregate traffic flows to match scarce capacity resources
(e.g. runways, sectors and air traffic controllers (ATC’s)).
ATFCM presents 3 levels of decision-making actions [21]:
Strategic: activity taking place during the period from several months until a few
1
Chapter 1. Introduction
days before a flight. During this phase, comparison is made between the expected
air traffic demand and the potential ATC capacity. Objectives are set for each ATC
unit in order to provide the required capacity for them.
Pre-tactical: action taken during the few days before the day of operation of a
flight. Based on the traffic forecasts, the information received from the Flow Man-
agement positions at every ATC centre in Europe and the Central Flow Management
Unit (CFMU) statistical data.
Tactical: the work carried out on the current day of operation of a flight. Flights
taking place on that day may be affected by ATFCM regulations, actions to assure the
ATC demand capacity balance, which includes the re-allocation of individual aircraft
departure times, re-routing to avoid bottlenecks and alternative flight profiles.
At tactical level, these regulations are applied as a method of matching traffic
demand to available capacity by limiting the number of flights planned to enter an
airspace or aerodrome, achieved by the issuing of new departure slots (CTOTs) [24].
When the lack of airspace capacity is predicted in a certain sector, regulations are
applied by holding flights on the ground prior to departure [34].
This management is carried out in Europe by the Eurocontrol Network Manage-
ment Operations Center (NMOC) that enforces ATFCM regulations when required
so by ATC units predicting or anticipating overloads. Meanwhile in the United States
these regulations take the form of Ground Delay Programs (GDPs), this ATFCM
initiative currently in use attempt to address airport arrival capacity reductions. Un-
der this mechanism, departure delays are applied to flights at their origin airports
that are bound for a common destination airport which is predicted to suffer from
reduced capacity or excessive demand. Besides GDPs, other strategies can also be
initiated in order to solve capacity-demand imbalance problems, such as the airspace
flow program (AFP), an equivalent slot allocation initiative implemented when a
2
Chapter 1. Introduction
capacity demand imbalance is predicted in an airspace sector.[16]
The premise for these initiatives, coordinated by the Air Traffic Control Strategic
Command Center (ATCSCC), is that it is better to absorb delays for a flight while
it is grounded at its origin airport rather than incurring air-borne delay near the
affected destination airport which is both unsafe and more costly (in terms of fuel
costs) [5].
The current method of organizing airspace and balancing demand and capacity
relies on partition of airspace into sectors. This fragmentation of airspace configu-
rations into several air traffic control (ATC) boundaries for ATM directly limits the
airside capacity utilization [12].
Nowadays, the demand - capacity airside (i.e., in ATC sectors) balance is deter-
mined by a simple aircraft counter for a time interval. Each sector has a capacity
threshold in the form of the maximum number of aircraft at a given time slot. This
threshold has been used by ATFCM as a controller workload limit indicator for each
sector. However this indicator does not take into account the traffic complexity
[31][38].
The traditional approach to improve predictability by constraining flexibility is no
longer viable in many cases. This regulation approach usually tends to induce latent
capacity problems, because relies on incomplete information (e.g. lack of traffic
complexity indicators and lack of understanding of the interdependences between
trajectories).
The current layered planning approach fragments the ATM system both at func-
tional level and at operational level due to a lack of flexible synchronization (i.e.,
Trajectory Based Operations (TBO) mechanism) that could deal with a trade-off
solution considering the optimization targets of each stakeholder subject to infras-
tructure capacity and safety constraints.
3
Chapter 1. Introduction
This fragmented decision making scope hides disturbances that become source of
emergent dynamics, these dynamics lead the introduction of operational complexity
for integration for a flexible and predictable ATM system under this approach.
Free routing, soft flight level capping constraints, integration of Remotely Piloted
Aircraft (RPAs) are just some examples that claim for a truly integration at ATM
service system level in which present layered ATM planning could exploit the freedom
gaps between the strategic /pre-tactical/ tactical ATFCM [23], to move one step
forward to a competitive ATM system in which present resources are used to attend
AUs demands avoiding resources idleness and saturations that foster regulations,
holdings and poor efficient trajectories.
In addition to those former facts, the predicted growing trends of air traffic re-
inforce evidence of the necessity of new operational and managing policies for more
efficient use of existing airside capacity [27].
Among other new approaches to reduce latent capacity, one of the most important
and challenging paradigms of the Single European Sky ATM Research (SESAR)
[57] and Next Generation Air Transportation System (Next Gen) [60] programs is
the introduction of trajectory-based operations (TBO), which involve the use of
4D trajectories (i.e. consecutive waypoints in three spatial dimensions and their
corresponding time-stamps), also known as business trajectories (BTs) according to
SESARs terminology for civil flights. It is expected that the use of 4D trajectories will
be the seed for new demand and capacity balance tools relying on the synchronization
and predictability of the air transportation system. [40].
While TBO concept enhance the design of new DSTs that could deal with present
demand - capacity balance in ATM, relying on a technological framework for infor-
mation sharing (System Wide Information Management (SWIM), [25]), a word of
caution come into view at practical level: ATM stakeholders realize that technolog-
4
Chapter 1. Introduction
ical flexibility is not synonymous of better performance. It is well accepted that a
major limitation of current ATM system is the loss of effectiveness due to the limited
integration between the layered planning Decision Support Tools (DSTs) [54].
A comprehensive analysis of hard and soft interdependencies between sector ca-
pacities defined at ATFCM level, priority sequence of departure at DMAN (Depar-
ture Manager) level and the agreed flight plan at RBT (Reference Business Tra-
jectory) level provides the framework to exploit an extra degree of freedom to ad-
dress AUs demands with the available capacity. This TBO freedom gap provides
an advanced approach to coordinate trajectory changes and constraints generating
synergies between AUs while reducing ATC interventions.
Hence, allowing small changes in the time stamp component of the agreed 4DT
with a pre-processing of the hotspots predicted at micro level using ATFCM macro
level information obtained from SWIM can cope with large amount of disturbances
and frequent poor adherence trajectory problems, compared to traditional and Air-
port Collaborative Decision Making (A-CDM) methods. This TBO freedom gap
facilitates implementation of changes without affecting the AUs operational costs
and could be straightforward applied to smoothly fit to AUs preferences character-
ized by a high diversity of choices.
The concept of combining trajectories is of course not new, it has been widely
studied; consider for example the agreement approaches from SBTs (Shared Business
Trajectory) to RBTs. Despite these efforts, there is still little concrete evidence of
convergence to stable solutions because AUs cannot share the right information due
to a fierce market competition and diverse business models, the lack of a feedback
loops between ATM strategic and tactical DSTs and the uncertainties that affect the
time component of the trajectories agreed.
The work presented in this research focuses on the micro and macro analysis of
5
Chapter 1. Introduction
the untimed waypoints of the trajectories obtained after applying a bi-dimensional
(i.e. latitude and longitude positions) D - transform [45] and on the application
of causal modelling and constraint programming (CP) techniques to simulate and
validate a departure-time-bounded adjustment process that preserves the scheduled
slots while relaxing tight 4DT interdependences (for instance, reducing or solving
demand - capacity imbalances).
The research developed instead of a fragmented look at the ATM system, in
order to generate synergies between AUs while reducing ATC interventions, proposes
an innovative framework supporting a comprehensive analysis of interdependencies
between ATFM, DMAN and the agreed RBT.
The overarching goal of this dissertation is to contribute to the literature about
the use of robust combination of RBTs time stamps preserving the 3D agreements
into a set of collaborative-competitive trajectories with minimum ATC interventions.
1.2 List of publications
This dissertation thesis is based on a collection of peer - reviewed and published
research papers listed below.
Paper I. Nosedal, J., Piera, M. A., Ruiz, S., and Nosedal, A. (2014). An
efficient algorithm for smoothing airspace congestion by fine-tuning take-off times.
Transportation Research Part C: Emerging Technologies, 44, 171-184.
Paper II. Nosedal, J., Piera M.A., Solis A.O, and Ferrer C. (2015). An optimiza-
tion model to fit airspace demand considering a spatio-temporal analysis of airspace
capacity. Transportation Research Part C: Emerging Technologies, 61, 11-28.
In addition to the above, the following papers have been elaborated and submitted
6
Chapter 1. Introduction
during the period of research (included as appendices).
Paper III. Nosedal, J., Piera M.A. and Lebbink D. (2015). Revisiting the
impact of flights’ arrival variability on departure punctuality: a causal analysis of
earliness landing. Journal of Air Transport Management: An International Journal
of Research, Policy and Practice. Status: Under Review.
Paper IV. Nosedal, J. and Piera M.A., (2015). Causal analysis of aircraft
turnaround time for process reliability evaluation and disruptions identification.
Transportmetrica B: Transport Dynamics. Status: Under Review.
Moreover other conference articles were published during the research; these are
listed below as a reference but are not included as a part of this thesis.
V. A demand shifting algorithm to smooth the peaks at the airport security
screening checkpoint (SSC) facilities, Nosedal-Sanchez J., Piera-Eroles M.A., Mar-
tinez R., Alsina N., I3M: The 12th International Multidisciplinary Modelling and
Simulation Multiconference, 21-23 September, 2015. Bergeggi, Italy.
VI. Asignacion de puertas de embarque considerando restricciones espacio - tem-
porales mediante modelado con redes de Petri coloreadas, Jenaro Nosedal Sanchez
y Miquel Angel Piera Eroles. XXXVI Jornadas De Automatica, September 2015.
Bilbao, Spain.
VII. Passenger Slot Assignment for Airport’s Security Screening, Nosedal-Sanchez
J., Piera-Eroles M.A., Martinez R., Alsina N., I3M: The 11th International Multidis-
ciplinary Modelling and Simulation Multiconference, 10-12 September, 2014. Bor-
deaux, France.
VIII. Use of Colored Petri Nets to Model Aircraft Turnaround at an Airport, Fer-
nandez de Liger, Piera Eroles M.A., Nosedal-Sanchez J., 6th International Con-
ference from Scientific Computing to Computational Engineering (6th IC-SCCE),
7
Chapter 1. Introduction
9-12 July, 2014. Athens, Greece.
IX. A Causal Model to Schedule Efficient Ground Delays in present Air Traffic
Management Systems, Modeling and Simulation for Complex Networks Management.
Jenaro Nosedal, Miquel A.Piera and Sergio Ruiz. Summer Computer Simulation
Conference (SCSC 2013), July 2013. Toronto, Canada.
X. Concurrent and Distributed Systems Analysis Using Colored Petri Nets, Je-
naro Nosedal, Olatunde Baruwa and Miquel A. Piera. XXXIV Jornadas De Au-
tomatica, September 2013.Terrassa, Spain.
XI. Causal Decision Support Tools for Strategic Trajectory De-Confliction to En-
able Seamless Aircraft Conflict Management (STREAM) Clustering And Interaction
Causal Solver Models. Jenaro Nosedal, Sergio Ruiz, Miquel A.Piera and Andrea
Ranieri. 2nd Sesar Innovation Days, November 2012. Braunschweig, Germany.
XII. Modelo Causal Para La Simulacion De La Gestion Del Trafico Aereo (ATM)
A Nivel Pretactico Y Estrategico., Jenaro Nosedal, Sergio Ruiz and Miquel A.
Piera. XXXIII Jornadas De Automatica, September 2012. Vigo, Spain.
1.3 Thesis structure
The remaining sections of this work are organised as follows. Chapter 2 provides the
literature review and introduces the research motivation and objectives. Chapter
3 and 4 include the peer reviewed publications. The first paper exposes an algo-
rithm that facilitates macro and micro analysis along the entire en route path for
4D trajectories, considering the entire European airspace and reducing the combina-
torial explosion problem during the detection of collective micro regions (pair-wise
comparison) by spatial data structure (SDS) analysis. In this paper are also intro-
duced several challenging results by properly tuning the Calculated Take-Off Times
8
Chapter 1. Introduction
(CTOTs) for mitigating the propagation of perturbations between trajectories. The
second paper, included in Chapter 4, by means of discrete event simulation, describes
and formalizes the spatio-temporal interactions between trajectories and presents an
optimization model for airspace capacity- demand management by applying an ef-
ficient departure time bounded adjustment configuration. Chapter 5 includes the
research results summary, conclusion and possible future lines of research.
Finally, two additional under review publications related with the analysis of the
Arrival variability and the Turnaround processes are included as annex A and B
respectively.
9
Chapter 2
State of the art
In Europe, all aircraft must respect so called CFMU-slots, which are 15 minutes
time windows during which they are allowed to take off. If they miss their slot,
they have to apply for another slot, this slot re-scheduling request can imply a long
time waiting (i.e. delay with respect to original departure time), especially during
the peak hours. These new slots are issued by the CFMU for whole Western Europe
based on the predicted capacity of the ATC sectors, in U.S. similar restrictions exists
to avoid air traffic congestion at airports.[26]
From the airport ground management perspective, slot re-allocation usually im-
plies some problems because aircraft must be assigned to a specific position for this
waiting time. If an aircraft reaches the runway threshold too soon, it will have to
hold on until it slot comes, and other aircraft can be stuck in the queue. Conversely,
if the aircraft reaches the runway too late, the slot is missed again.[33]
Currently, if an imbalance is predicted on the day of operations between the traffic
demand and the available airspace capacity, the ATM authority (i.e., the ATFCM)
issues a regulation to reduce the rate of flights entering the ATM sectors at a given
time. When the regulation modifies the flight departure slot [11], the delays are often
10
Chapter 2. State of the art
known as green delays [52].
As alternatives to the ATM regulations, air traffic controllers (ATCOs) frequently
issue maneuvers at a tactical level consisting of holding stacks, headings, flight level
changes or speed variations [22]; unfortunately, such maneuvers are often not con-
sidered desirable measures by AUs due to high operational and fuel consumption
costs (i.e., airborne delays, when incurred, dominate ground delay costs [28]). Green
delays are therefore deemed more acceptable alternatives [9].
The purpose of this ground-holding scheme is to respect the en route capacity
constraints provided by each ATC center (ATCC) as the number of aircraft that can
coexist in the same sector within a given time frame, based on their daily schedule.
The number of aircraft in a sector is the air traffic characteristic that has been most
cited, studied and evaluated in terms of its influence on workload [53]. However, a
limitation of this regulation model is that the definition of the sector’s capacity (i.e.,
the hourly rate of aircraft entering a sector) is poorly related to traffic complexity
[3]. To capture ATC complexity more accurately, it is necessary to consider the flight
characteristics of each individual aircraft and interactions between aircraft pairs [17]
and the surrounding traffic.
Air traffic local complexity can be measured by the control activity required to
accept an additional aircraft entering a sector [41], however from a network perspec-
tive, due to the high degree of connectivity in air traffic networks [42] it is expected
that only if global traffic complexity is considered (i.e., all en route potential con-
flicts) all potential interdependencies can be identified and in consequence, the real
impact of accepting one additional aircraft can be evaluated.
Domino effects [59], together with a lack of complete understanding and a suitable
formalism for modeling these interdependencies, are key elements that often lead to
11

Chapter 2. State of the art
the introduction of negative network effects (i.e., ground holding based solely on
local information) and the impossibility of taking advantage of positive network
effects (i.e., ground holding to improve the network’s robustness).Thus, even small
delays can easily propagate through trajectories [56], leading to regulations that
could be avoided (e.g., the application of unnecessary delays and/or airborne holding
procedures) and the underuse of sectors capacity [12].
Traffic assignment techniques have been developed to reduce congestion in trans-
portation networks by distributing traffic demand across time and space [13]. Be-
cause congestion indicates that several aircraft are requiring the same space at the
same time, congestion could be tackled by shifting flight trajectories in time (slot
re-allocation) or in space (route re-allocation). The following approaches have been
developed to solve this general route-time allocation problem: spacetime network
[66]; variational inequality [47]; optimal control [35]; simulation [10]; integer and
dynamic programming (ground-holding problem) [32] [44]; and more recently, the
collaborative en route resource allocation model (Combined Trajectory Options Pro-
gram) [36] and airspace planning and design based on conflict risk assessment [49]
have been investigated. Slot allocation problems focused on controllers workload
using constraint programming (CP) technology are discussed in [3]. Multi-sector
complexity planning resolution using CP technology is presented in [30]. In [50],
some of the most relevant dynamic traffic assignment (DTA) methods are analyzed,
and path processing modeling approaches are addressed as the core of future DTA
development. In [13], the application of multi-objective stochastic methods (i.e.,
genetic algorithms) on real traffic data, not by using the flow network concept but
by simulating the flight of each aircraft, for one day over the French airspace is
presented.
Based on the TBO paradigm [19], an airspace user’s demand is represented by
the BTs, and the airspace capacity constraints will be given by the spatial and tem-
12
Chapter 2. State of the art
poral interdependencies between these trajectories. To analyse these spatio-temporal
interdependencies between trajectories, the recognition of all of the potential proxi-
mate events per pair of trajectories in a given traffic scenario must first be performed.
Then, by the analysis of the occupancy time windows, it is possible to analyse the
airspace demand - capacity balance or imbalance.
Theoretical and experimental results for a new air traffic system, based on the
moving point paradigm, are reported in [55], where air traffic is completely orga-
nized by a 4D-sequencing (i.e., an allocation of flights to multi-directional lattices is
proposed). In [43], Monte Carlo simulations and reachability analysis are applied to
assess the 4D trajectory concept.
The above mentioned approaches partially solve the bi-allocation problem and
propose solutions for slot allocation only, route allocation only or both for extremely
minor instances of the problem. Furthermore they fail to tackle the congestion prob-
lem from a global scope, because do not consider the air traffic complexity at global
level. Note that the reduced saturation problem of specific sectors could lead the
introduction of regulations that generate reallocation of the congestion downstream
or upstream or raise higher congestion because negative domino effects are produced
in the whole network.
Some other airspace analyses and partitioning (or repartitioning) methods based
on superimposing traffic flows over a fine grid have been used by several researchers.
Dynamic airspace configuration (DAC) is a new operational paradigm that proposes
migrating from the current structured, static airspace to a dynamic airspace [39]. In
DAC research, dynamic airspace sectorization (DAS) represents an initial approach
to restructuring airspace to achieve capacity-demand balance, while managing air
traffic controllers workload and ensuring an orderly flow of traffic [61].
The sectorization problem, considered as NP-hard problem, has been studied
13
Chapter 2. State of the art
most recently as a global optimization problem using integer programming [4]. Other
proposed approaches to the sectorization problem include the use of genetic algo-
rithms [15] and graph partitioning [63]. A survey of the algorithmic aspects of
airspace sectorization tools developed up to 2012 is provided in [29]. In [2], the
Australian airspace is modeled as a hyper-rectangular discrete space (i.e., cells of 10
NM).
All of the formerly cited works focus mainly on the sectorization problem at a
macroscopic level, addressing only one country’s airspace or, in the most general
cases, a single ATC area, and therefore, they do not consider a microscopic repre-
sentation of traffic at the network level, which would be aligned with 4DT concepts
and TBO procedures. In this research, 4DT is considered as a precise description
of an aircraft path in space and time which includes the centerline of the path,
using WPTs to represent specific steps along the path, together with appropriate
buffers to describe the associated position uncertainty. The path contains altitude
descriptions for each WPT and suitable indications about the time(s) at which the
trajectory will be executed, in some of the WPTs in a 4DT path may be associated
with Controlled Time of Arrivals (CTAs). Each CTA is defined by a Target Time
of Arrivals (TTAs) requirement that must be met by the aircraft within a specified
time tolerance. Therefore, CTAs actually represent time windows for the aircraft to
cross specific waypoints and are used when needed to regulate traffic flows entering
congested en route or arrival/departure airspace.
Under TBO approach, airspace users should fly precise 4-dimensional trajectories
(4DTs), involving 3 spatial dimensions plus time, previously agreed upon with the
network manager. A 4DT, otherwise known as BT, represents a contract between
the airline and the network manager such that the aircraft should fly the trajectory,
preserving the time stamps specified in the BT.
Regarding the challenges for the implementation of the TBO approach, while
14
Chapter 2. State of the art
many trials around the world have demonstrated that aircraft equipped with Flight
Management System (FMS) are capable of performing a TBO to very tight toler-
ances, other research results suggest that additional work is needed to mature the
concept [14]. One of the major factors is the wind [62], which leads to longitudinal
uncertainty that affects the execution of RBTs and their respect time stamps. How-
ever the theoretical time separation analysis reported by Klooster and De Smedt
in [37], provide evidence that horizontal spacing of 105 s or, greater would avoid
separation problems even in the presence of longitudinal deviations because of wind.
But other factors can affect adherence significantly, some ATC directives for instance
(based on predictive time horizon and tactical level) affect the adherence of the orig-
inal RBTs but also is a source of downstream adherence problems due to domino
effects constraining, at the same time the airspace capacity.
At land side, the surface traffic automation systems [46][58] enhance the man-
agement of airport surface operations to provide shared situational awareness and
to control taxi times through the use of virtual queues. The collaborative departure
queue management (CDQM) concept manages the length of the runway departure
queues so that aircraft experience minimal physical queuing while ensuring that the
runways are used at their maximum capacity, while also adhering to the departure
slot allocation [51].
The trajectory-based surface operations concept has been proposed to improve
surface movement efficiency while maintaining safety. The proposed systems guide
surface movements and monitor their conformance with assigned trajectories. Whether
the time-based trajectories can be effectively followed so that the expected benefits
can be achieved [67].
From an optimisation point of view, ground movement is one of the key operations
at the airport as it links other airport processes such as departure sequencing, arrival
sequencing and gate/stand allocation and its performance can affect each of these
15

Chapter 2. State of the art
[64] Thus aircraft ground movement is a key element that could enable the RBT
adherence since departure. For that reason ground movement reliability become an
important component of research and development [7][8].
The airport ground movement management involves directing aircraft to their
destinations in a timely manner, with the aim being to meet some target time win-
dows (i.e. CTOTs). Ground movement links the various operations together: arrival
sequencing, departure sequencing and the gate/stand allocation planning. In that
sense, aircraft turnaround is a key factor to enhance the airport ground movement
reliability and in consequence to achieve TBO adherence. Aircraft turnaround com-
plexity arises due to the effects of interdependencies between different actors that
are able to generate an event that could block, freeze, delay, or disable/ enable
other activities programmed in the same or in another sub-process [65][1]. Since air-
craft turnaround is a time critical process with several interdependent sub processes
running sequential and in parallel, it is often a significant contributor to departure
delays with direct impact in air traffic operations. Aircraft departure delays not
only consume the scheduled turnaround time of an aircraft, but can also disrupt the
slot planning (i.e. CTOTs), while aircraft arrival delays affect the gate assignment
scheduling of an airport and might lead to a longer aircraft ground service times
than scheduled [48], becaming a relevant source of disturbances affecting the TBO
adherence.
2.1 Motivation and research objectives
The aim of this research is to empower TBO as a flexible synchronization mechanism
that will support an efficient and competitive use of the ATM services by linking the
land side operation with the air side. The proposed approach relies on an intelligent
cooperative combination of the time stamp component of the RBT agreed by the
16
Chapter 2. State of the art
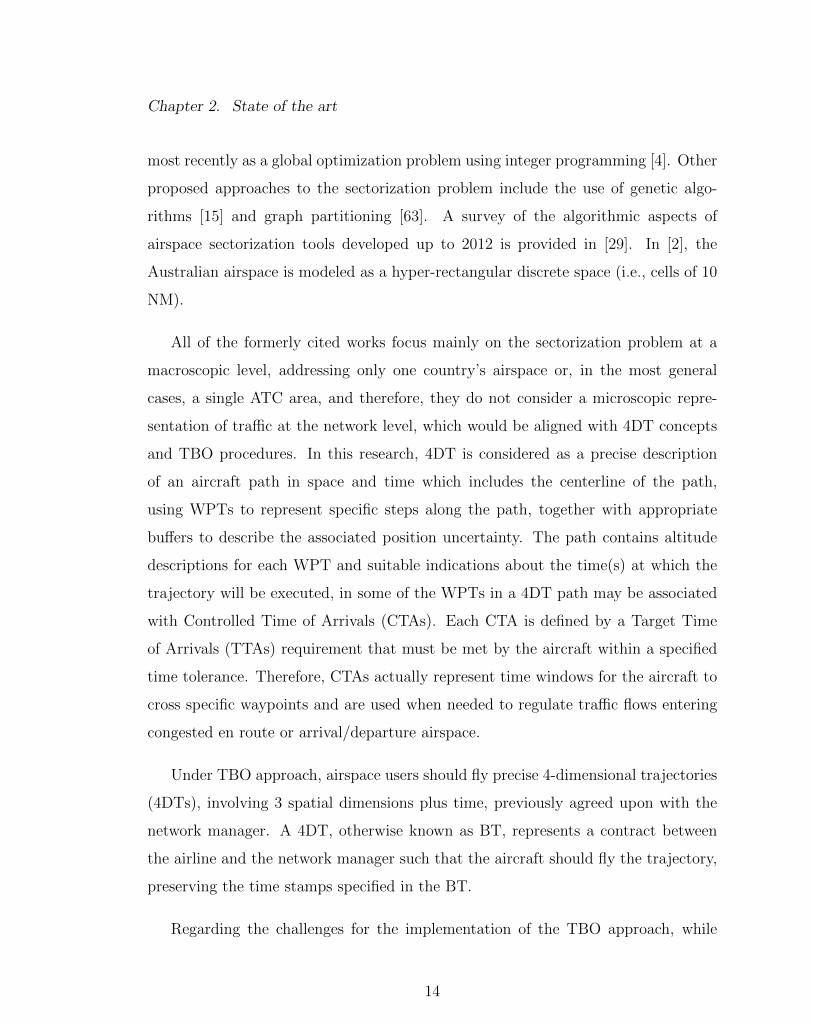
Figure 2.1: Airspace hotspots identification
AUs taking into account the global interdependencies.
To achieve this, the research is focusing on several innovation strands which are
the main objectives pursued:
• Development of models and tools to enable the detection of all the potential
spatial interdependencies between trajectories through efficient methods, at
macro level by means of the traffic analysis under a global scope (i.e. with a
12 NM granularity) to detect airspace hotspots (Fig.2.1).
• Development of models and tools to enable the analysis at micro level (i.e. with
6NM granularity) of all spatio-temporal interdependencies between trajectories
17
Chapter 2. State of the art
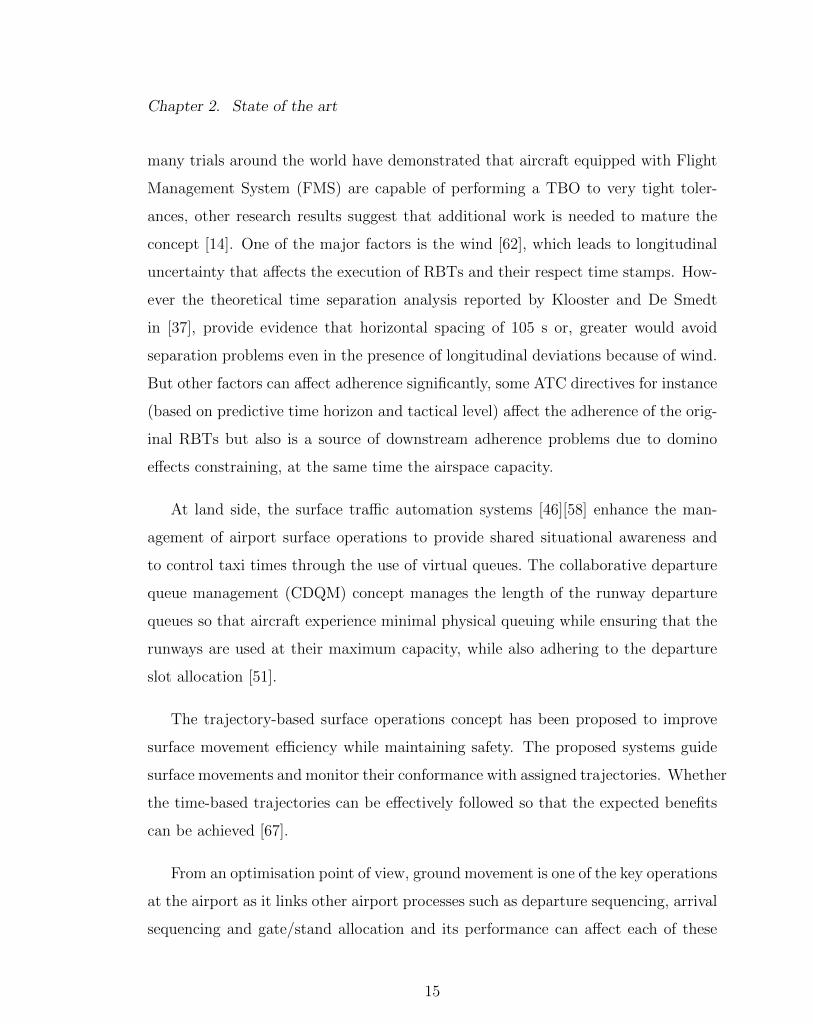
Figure 2.2: Airspace potential proximate event identification
within detected hotspots to determine potential proximate event (Fig.2.2).
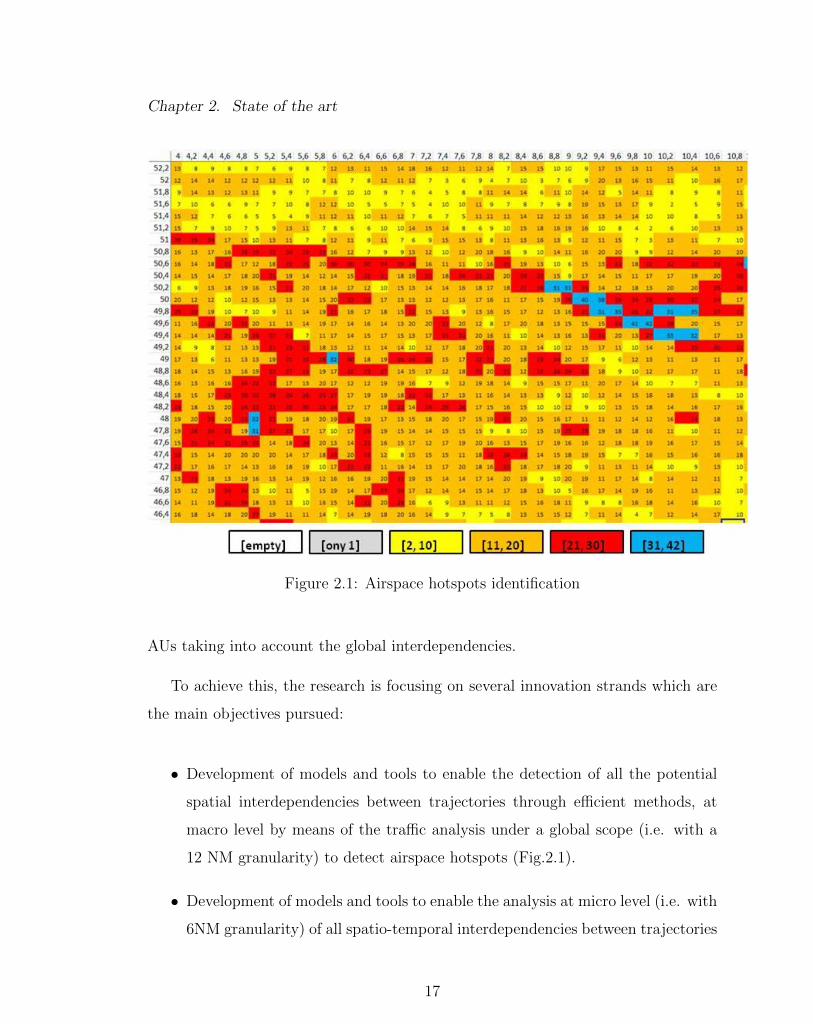
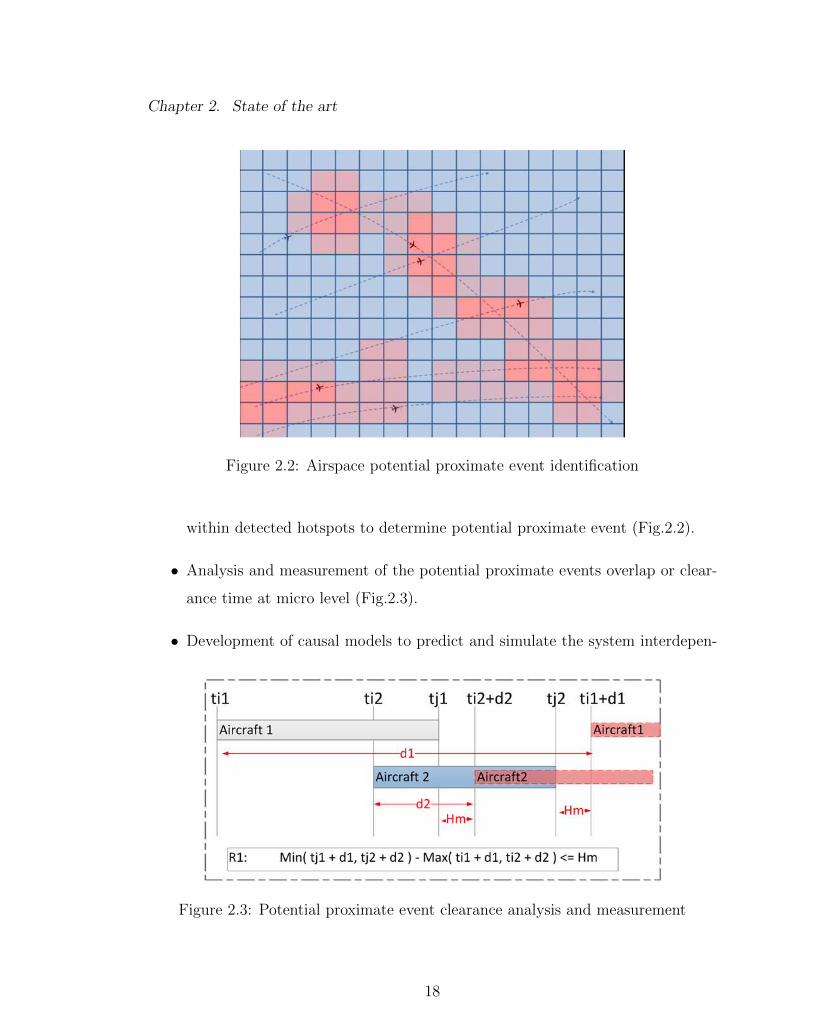
• Analysis and measurement of the potential proximate events overlap or clear-
ance time at micro level (Fig.2.3).
• Development of causal models to predict and simulate the system interdepen-
Figure 2.3: Potential proximate event clearance analysis and measurement
18
Chapter 2. State of the art
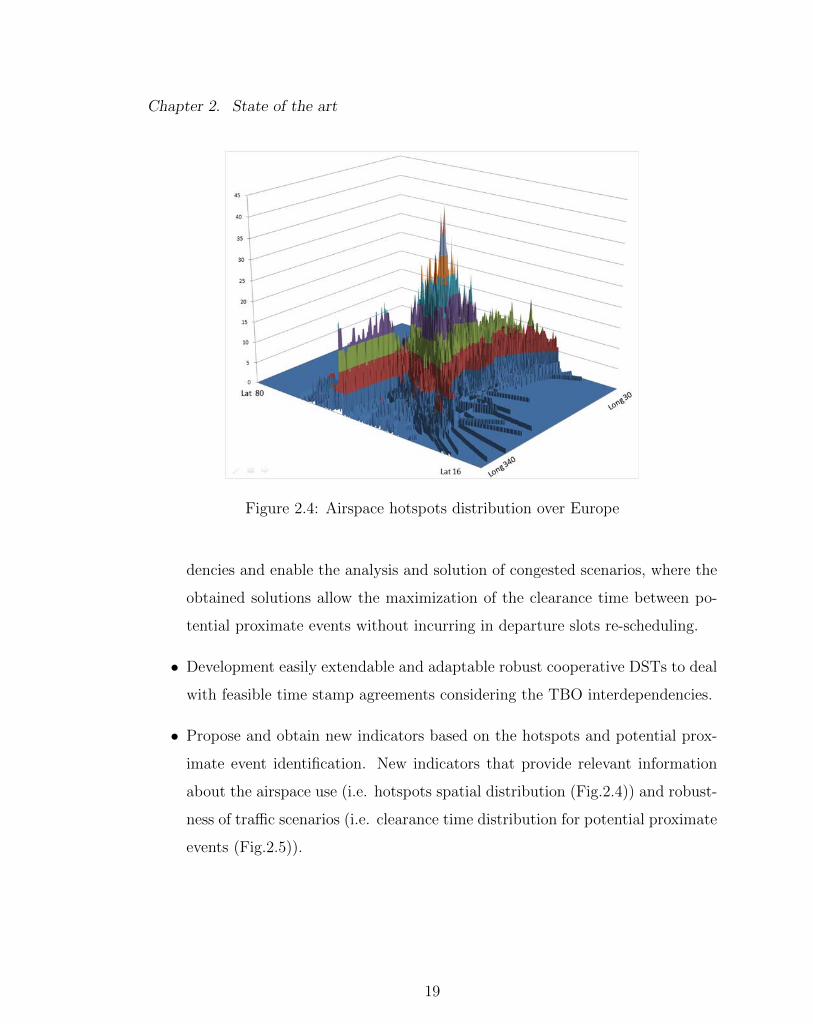
Figure 2.4: Airspace hotspots distribution over Europe
dencies and enable the analysis and solution of congested scenarios, where the
obtained solutions allow the maximization of the clearance time between po-
tential proximate events without incurring in departure slots re-scheduling.
• Development easily extendable and adaptable robust cooperative DSTs to deal
with feasible time stamp agreements considering the TBO interdependencies.
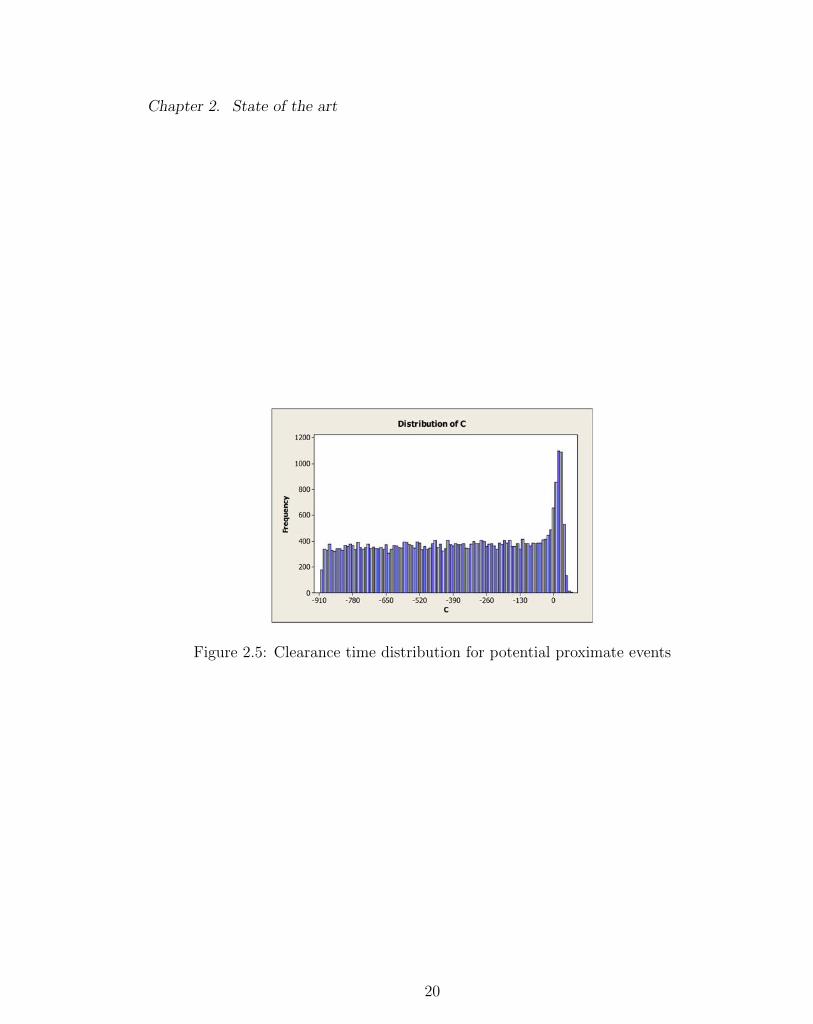
• Propose and obtain new indicators based on the hotspots and potential prox-
imate event identification. New indicators that provide relevant information
about the airspace use (i.e. hotspots spatial distribution (Fig.2.4)) and robust-
ness of traffic scenarios (i.e. clearance time distribution for potential proximate
events (Fig.2.5)).
19
Chapter 2. State of the art
Figure 2.5: Clearance time distribution for potential proximate events
20
Chapter 3
Paper I
In this paper, several challenging results are presented by properly tuning the Cal-
culated Take-Off Times (CTOTs) as a tool for mitigating the propagation of per-
turbations between trajectories that can readily appear in dense sectors. Based on
the identification of collective micro regions, a tool for predicting potential spatio-
temporal concurrence events between trajectories over the European airspace was
developed, together with a CTOT algorithm to sequence the departures that pre-
serve the scheduled slots while relaxing tight trajectory interactions. The algorithm
was tested by considering a realistic scenario (designed and analyzed in the STREAM
project) to evaluate relevant ATM KPIs that provide aggregated information about
the sensitivity of the system to trajectory interactions, taking into account the sys-
tem dynamics at a network level. The proposed approach contributes to enhancing
the ATM capacity of airports to mitigate network perturbations.
21
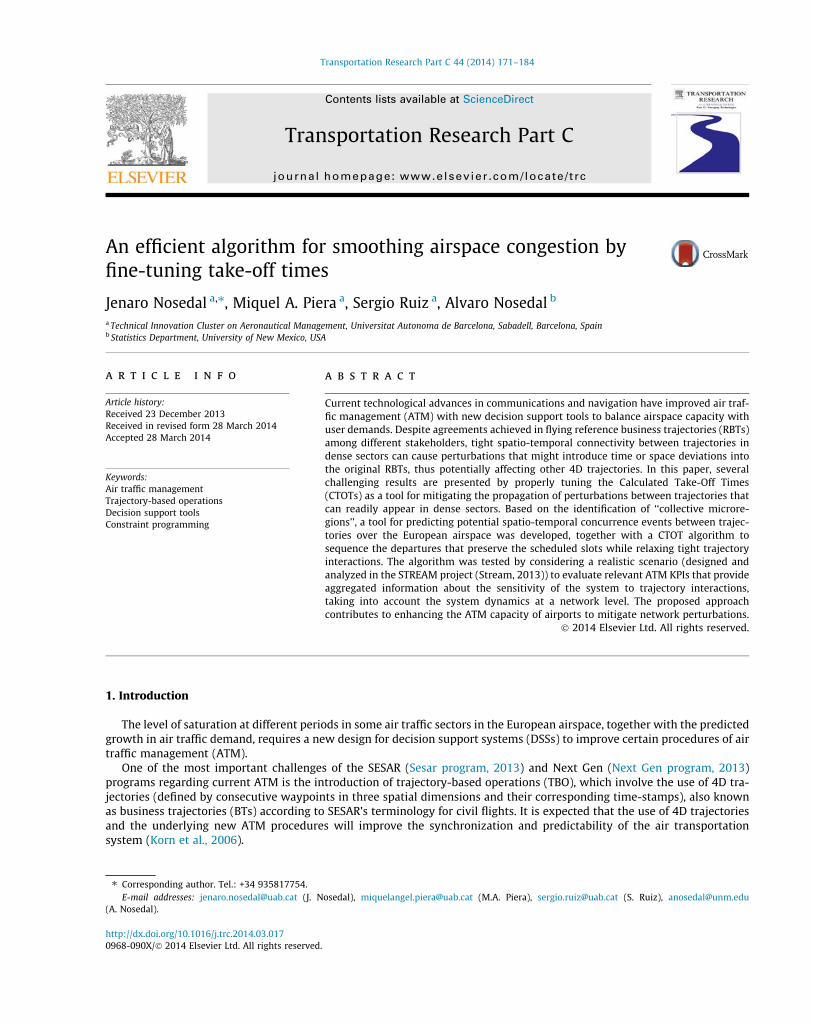
An efficient algorithm for smoothing airspace congestion byfine-tuning take-off times
Jenaro Nosedal a,⇑, Miquel A. Piera a, Sergio Ruiz a, Alvaro Nosedal b
a Technical Innovation Cluster on Aeronautical Management, Universitat Autonoma de Barcelona, Sabadell, Barcelona, Spainb Statistics Department, University of New Mexico, USA
a r t i c l e i n f o
Article history:Received 23 December 2013Received in revised form 28 March 2014Accepted 28 March 2014
Keywords:Air traffic managementTrajectory-based operationsDecision support toolsConstraint programming
a b s t r a c t
Current technological advances in communications and navigation have improved air traf-fic management (ATM) with new decision support tools to balance airspace capacity withuser demands. Despite agreements achieved in flying reference business trajectories (RBTs)among different stakeholders, tight spatio-temporal connectivity between trajectories indense sectors can cause perturbations that might introduce time or space deviations intothe original RBTs, thus potentially affecting other 4D trajectories. In this paper, severalchallenging results are presented by properly tuning the Calculated Take-Off Times(CTOTs) as a tool for mitigating the propagation of perturbations between trajectories thatcan readily appear in dense sectors. Based on the identification of ‘‘collective microre-gions’’, a tool for predicting potential spatio-temporal concurrence events between trajec-tories over the European airspace was developed, together with a CTOT algorithm tosequence the departures that preserve the scheduled slots while relaxing tight trajectoryinteractions. The algorithm was tested by considering a realistic scenario (designed andanalyzed in the STREAM project (Stream, 2013)) to evaluate relevant ATM KPIs that provideaggregated information about the sensitivity of the system to trajectory interactions,taking into account the system dynamics at a network level. The proposed approachcontributes to enhancing the ATM capacity of airports to mitigate network perturbations.
� 2014 Elsevier Ltd. All rights reserved.
1. Introduction
The level of saturation at different periods in some air traffic sectors in the European airspace, together with the predictedgrowth in air traffic demand, requires a new design for decision support systems (DSSs) to improve certain procedures of airtraffic management (ATM).
One of the most important challenges of the SESAR (Sesar program, 2013) and Next Gen (Next Gen program, 2013)programs regarding current ATM is the introduction of trajectory-based operations (TBO), which involve the use of 4D tra-jectories (defined by consecutive waypoints in three spatial dimensions and their corresponding time-stamps), also knownas business trajectories (BTs) according to SESAR’s terminology for civil flights. It is expected that the use of 4D trajectoriesand the underlying new ATM procedures will improve the synchronization and predictability of the air transportationsystem (Korn et al., 2006).
http://dx.doi.org/10.1016/j.trc.2014.03.0170968-090X/� 2014 Elsevier Ltd. All rights reserved.
⇑ Corresponding author. Tel.: +34 935817754.E-mail addresses: [email protected] (J. Nosedal), [email protected] (M.A. Piera), [email protected] (S. Ruiz), [email protected]
(A. Nosedal).
Transportation Research Part C 44 (2014) 171–184
Contents lists available at ScienceDirect
Transportation Research Part C
journal homepage: www.elsevier .com/locate / t rc
Currently, if an imbalance is predicted on the day of operations between the traffic demand and the available airspacecapacity, the ATM authority (i.e., the ATFCM) issues a regulation to maximize the rate of flights entering the ATM sectorsat a given time. When the regulation delays flight departures (Castelli et al., 2011), the delays are often known as green delays(Piera et al., 2014).
As alternatives to the ATM regulations, air traffic controllers (ATCOs) frequently issue maneuvers at a tactical level con-sisting of holding stacks, headings or speed variations (ATFCM Services, 2013); unfortunately, such maneuvers are often notconsidered desirable measures by AUs due to high operational and fuel consumption costs (i.e., airborne delays, whenincurred, dominate ground delay costs (Ferguson et al., 2013). Green delays are therefore deemed more acceptable alterna-tives (Carlier et al., 2007).
The purpose of this ground-holding scheme is to respect the en route capacity constraints provided by each ATC center(ATCC) as the number of aircraft that can coexist in the same sector within a given time frame, based on their daily schedule.The number of aircraft in a sector is the air traffic characteristic that has been most cited, studied and evaluated in terms ofits influence on workload (Prandini et al., 2011). However, a limitation of this regulation model is that the definition of thesector’s capacity (the hourly rate of aircraft entering a sector) is poorly related to traffic complexity (Barnier et al., 2001). Tocapture ATC complexity more accurately, it is necessary to consider the flight characteristics of each individual aircraft andinteractions between aircraft pairs. (Djokic et al., 2010)
Air traffic complexity can be measured by the control activity required to accept an additional aircraft entering a sector(Lee et al., 2007) (i.e., local complexity). From a network perspective, global complexity is related to the interactions betweentrajectories (i.e., all en route potential conflicts).
Due to the high degree of connectivity in air traffic networks (Lu and Shi, 2007), it is expected that only if global trafficcomplexity is considered can all potential interactions be identified.
Domino effects (Ruiz et al., 2014), together with a lack of complete understanding and a suitable formalism for modelingthese interactions, are key elements that often lead to the introduction of negative network effects (i.e., ground holdingbased solely on local complexity information) and the impossibility of taking advantage of positive network effects (i.e.,ground holding to improve the network’s robustness).Thus, even small delays can easily propagate through trajectories(Pyrgiotis et al., 2013), leading to regulations that could be avoided (e.g., the application of unnecessary delays and/or air-borne holding procedures) and the underuse of sectors (European Commission, 2013).
In this paper, by identifying ‘‘collective microregions’’ (square cells of six NM used by two or more flights at the sameFlight Level (FL), independent of occupancy time window) and the analysis of occupancy time windows (i.e., temporal-lon-gitudinal looseness (Ruiz et al., 2012), the volume of potential concurrence events that could require controller interventionis determined. Furthermore, an algorithm that can mitigate the effect of potential spatio-temporal concurrence events (i.e.,congestion) between any two interacting trajectories is proposed. This algorithm preserves all pre-assigned slots by comput-ing and applying ‘‘fine-tuning’’ (i.e., time offsets of [0,15] minutes) on the Calculated Take-Off Times (CTOTs).
The proposed algorithm allows for the analysis of the interactions among en route trajectories (i.e., loss of due safety dis-tance between the geometric description of flight paths) to calculate ‘‘clearance’’ and ‘‘overlapping’’ time windows along thecomplete flight paths, thus predicting potential ‘‘concurrence events’’ (i.e., conflicts) and/or the longitudinal looseness foreach trajectory (assuming TBO). With this approach, the proposed algorithm seeks to help ATM incorporate new strategiesbased on complete interaction-causal analysis to improve decision-making processes.
The paper is organized as follows. Section 2 provides a literature review. Section 3 describes the algorithm. Experimentalresults for a realistic scenario are reported in Section 4, and conclusions and opportunities for further work are discussed inSection 5.
2. Literature review
Traffic assignment techniques have been developed to reduce congestion in transportation networks by distributingtraffic demand across time and space (Delahaye et al., 2005). Because congestion indicates that aircraft are occupying thesame space at the same time, it can be reduced by shifting flight trajectories in time (slot re-allocation) or in space (routere-allocation). The following approaches have been developed to solve this general route-time allocation problem: space–time network (Zenios, 1991); variational inequality (Nagurney, 1998); optimal control (Janson et al., 1993); simulation(Cascetta, 1987); integer and dynamic programming (ground-holding problem) (Glover and et al., 2013; Maugis, 1996);and more recently, the collaborative en route resource allocation model (Combined Trajectory Options Program) (Kimet al., 2013) and airspace planning and design based on conflict risk assessment (Netjasov et al., 2013) have beeninvestigated.
Slot allocation problems focused on controllers’ workload using constraint programming (CP) technology are discussed inBarnier et al. (2001). Multi-sector complexity planning resolution using CP technology is presented in Flener et al. (2007). InPeeta and Ziliaskopoulos (2001), some of the most relevant dynamic traffic assignment (DTA) methods are analyzed, andpath processing modeling approaches are addressed as the core of future DTA development. In Delahaye et al. (2005), theapplication of multi-objective stochastic methods (i.e., genetic algorithms) on real traffic data, not by using the flow networkconcept but by simulating the flight of each aircraft, for one day over the French airspace is presented. In Margellos (2012),Monte Carlo simulations and reachability analysis are applied to assess the 4D trajectory concept. Theoretical and
172 J. Nosedal et al. / Transportation Research Part C 44 (2014) 171–184

experimental results for a new air traffic system, based on the moving point paradigm, are reported in Prot et al. (2014),where air traffic is completely organized by a 4D-sequencing (i.e., an allocation of flights to multi-directional lattices isproposed).
The abovementioned approaches partially solve the bi-allocation problem and propose solutions for slot allocation only,route allocation only or both for extremely minor instances of the problem. They also fail to offer a global scope of air trafficcomplexity because they do not consider the full European ATM network.
Some airspace analyses and partitioning (or repartitioning) methods based on superimposing traffic flows over a fine gridhave been used by several researchers. Dynamic airspace configuration (DAC) is a new operational paradigm that proposesmigrating from the current structured, static airspace to a dynamic airspace (Kopardekar et al., 2007). In DAC research,dynamic airspace sectorization (DAS) represents an initial approach to restructuring airspace to achieve capacity-demandbalance, while managing air traffic controllers’ workload and ensuring an orderly flow of traffic (Tang et al., 2012).
The sectorization problem, considered an NP-hard problem, has been studied most recently as a global optimization prob-lem using integer programming (Basu et al., 2009). Other proposed approaches to the sectorization problem include the useof genetic algorithms (Delahaye et al., 1994) and graph partitioning (Trandac et al., 2005). A survey of the algorithmic aspectsof airspace sectorization tools developed up to 2012 is provided in Flener (2012). In Alam et al. (2008), the Australian air-space is modeled as a hyper-rectangular discrete space (i.e., cells of 10 NM).
All of the cited works focus mainly on the sectorization problem at a macroscopic level, addressing only one country’sairspace or, in the most general cases, a single ATCC area, and therefore, they do not consider a microscopic representationof traffic at the network level, which would be aligned with 4DT concepts and TBO procedures.
The proposed algorithm facilitates a microanalysis along the entire en route path, can consider the entire European air-space and reduces the combinatorial explosion problem during the detection of ‘‘collective microregions’’ (pair-wise com-parison) by spatial data structure (SDS) analysis. The post-processing of a state space stored in the SDS to performsensitivity analysis of temporal/longitudinal looseness is described in Ruiz et al. (2012). The application of a spatial datastructure for the efficient analysis of interactions in large scenarios is described in Ruiz et al. (2013, 2014), and in Ruizet al. (2013), a CD&R platform-based SDS for a simplified 4D nominal model is proposed.
3. Algorithm description
To detect the different ‘‘collective microregions’’ throughout the entire European airspace, each en route trajectory is ini-tially projected onto a discrete grid (100,000 square macrocells of 12 NM) spanning longitudes of �20 to 30 degrees and lat-itudes of 0 to 80 degrees.
In Fig. 1(a), a three-dimensional view of a traffic scenario is shown, whereas in Fig. 1(b), a planar projection of the cor-responding flight’s trajectories is provided. In Fig. 1(b), some regions in which potential concurrence events are identified(red/dark cells) can be observed; these cells are identified after macro-mapping each flight trajectory path.
After the initial mapping, macrocells with an occupancy rate equal or greater than two are partitioned for the identifica-tion of ‘‘collective microregions’’ (square cells of 6 NM in use by at least two aircraft simultaneously; FL independent of occu-pancy time window). Then, for each aircraft pair, the probability of sharing a ‘‘microregion’’, ‘‘clearance time’’ or ‘‘overlaptime’’ is computed, and finally, constraint programming (CP) calculates time adjustments (‘‘fine-tuning’’) on the CTOTs toavoid all potential concurrence events. The algorithm’s flowchart is presented in Fig. 2, and the next subsections will brieflysummarize each process.
Fig. 1. (a) 4D trajectories and (b) macro-mapping and concurrence events in FL k.
J. Nosedal et al. / Transportation Research Part C 44 (2014) 171–184 173
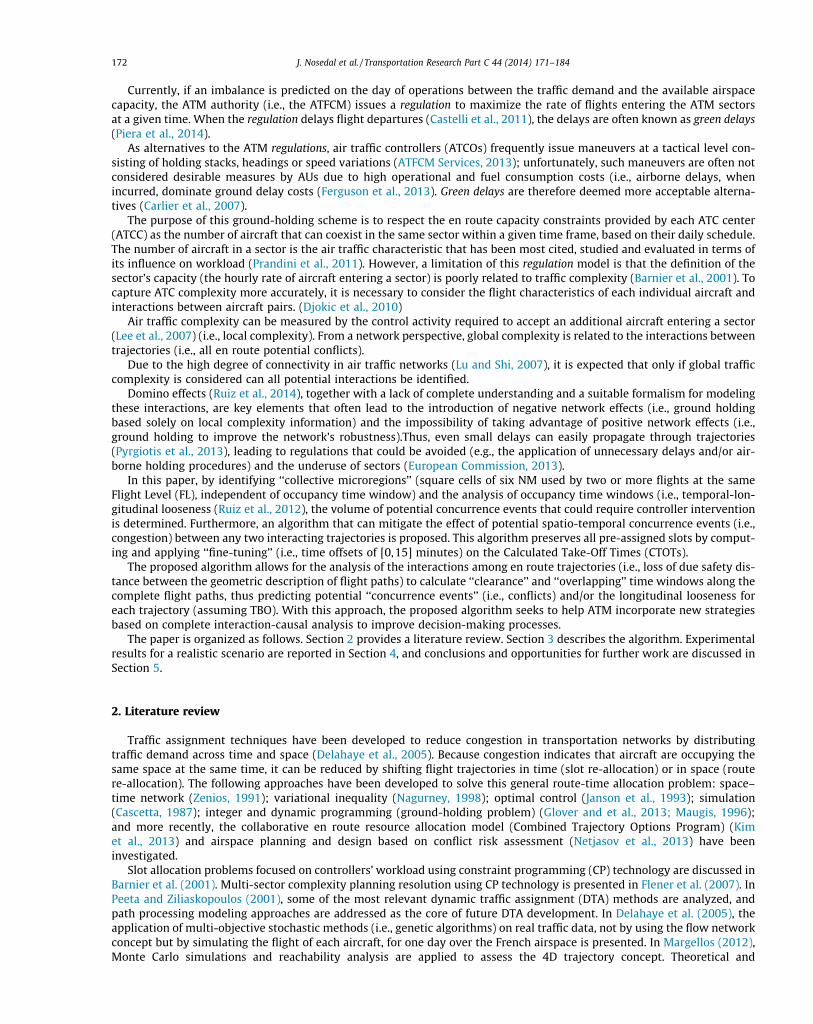
3.1. Macro-mapping process
All en route trajectories are loaded and mapped onto a grid (100,000 square cells of 12 NM) by FL, and all trajectories mustbe discretized (time-equidistant waypoints). Position information, indicated by geographical coordinates, is supplementedwith a time stamp to form the following 4 � 1 vector: [longitude, latitude, flight level, time stamp]. CTOT is known for eachtrajectory.
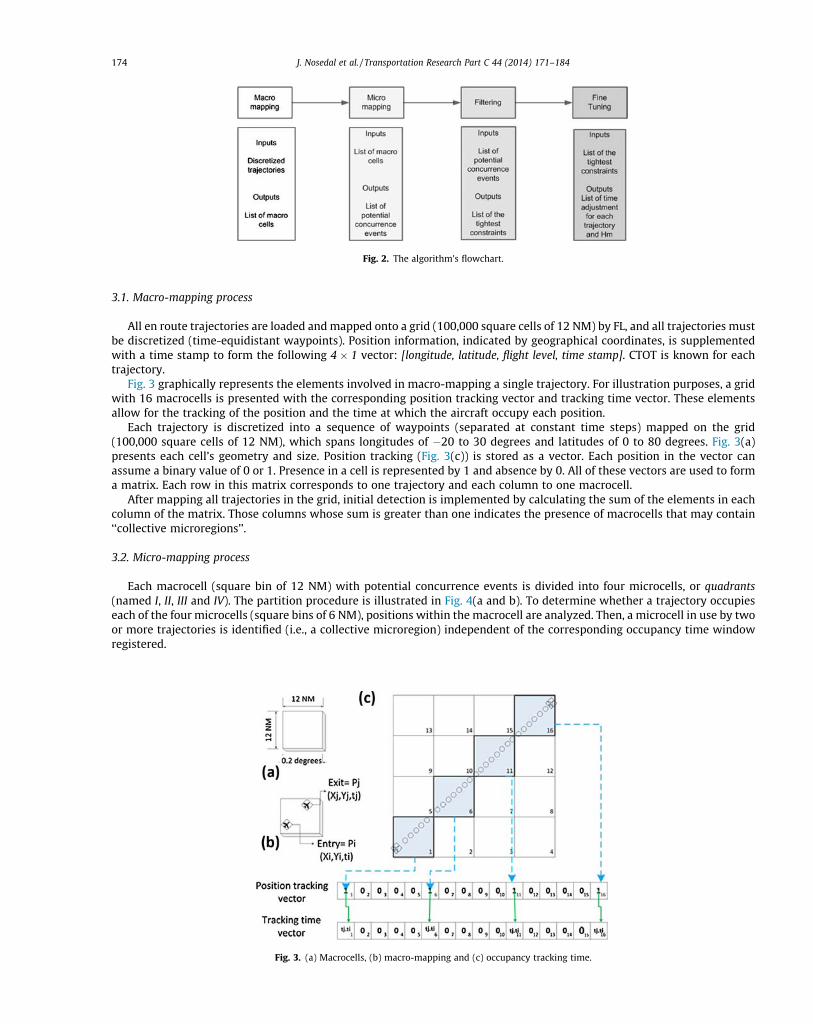
Fig. 3 graphically represents the elements involved in macro-mapping a single trajectory. For illustration purposes, a gridwith 16 macrocells is presented with the corresponding position tracking vector and tracking time vector. These elementsallow for the tracking of the position and the time at which the aircraft occupy each position.
Each trajectory is discretized into a sequence of waypoints (separated at constant time steps) mapped on the grid(100,000 square cells of 12 NM), which spans longitudes of �20 to 30 degrees and latitudes of 0 to 80 degrees. Fig. 3(a)presents each cell’s geometry and size. Position tracking (Fig. 3(c)) is stored as a vector. Each position in the vector canassume a binary value of 0 or 1. Presence in a cell is represented by 1 and absence by 0. All of these vectors are used to forma matrix. Each row in this matrix corresponds to one trajectory and each column to one macrocell.
After mapping all trajectories in the grid, initial detection is implemented by calculating the sum of the elements in eachcolumn of the matrix. Those columns whose sum is greater than one indicates the presence of macrocells that may contain‘‘collective microregions’’.
3.2. Micro-mapping process
Each macrocell (square bin of 12 NM) with potential concurrence events is divided into four microcells, or quadrants(named I, II, III and IV). The partition procedure is illustrated in Fig. 4(a and b). To determine whether a trajectory occupieseach of the four microcells (square bins of 6 NM), positions within the macrocell are analyzed. Then, a microcell in use by twoor more trajectories is identified (i.e., a collective microregion) independent of the corresponding occupancy time windowregistered.
Fig. 3. (a) Macrocells, (b) macro-mapping and (c) occupancy tracking time.
Fig. 2. The algorithm’s flowchart.
174 J. Nosedal et al. / Transportation Research Part C 44 (2014) 171–184

In Fig. 4(b), solid circles represent the trajectory segment contained in quadrant I of macrocell 1. This segment occupiesthe microcell over a time window [ti,tj], where ti represents the time of entry and tj the time of exit. This period is thetemporal domain of occupancy of a microcell for an aircraft (Fig. 4(c)).
For ‘‘collective microregions’’, entry times and exit times are used to determine the temporal looseness, H, i.e., the size ofthe overlap or clearance between aircraft pairs, and later to compute the time adjustments for CTOTs (i.e., fine-tuning) toavoid all potential concurrence events in the detected ‘‘collective microregions’’.
The calculation of H between time windows of aircraft x and y in ‘‘collective microregions’’ is expressed as follows:
H ¼ Minðtjx; tjyÞ �Maxðtix; tiyÞ ð1Þ
where Min is a function that yields the minimum exit time between flights x and y, i.e., tjx and tjy, and Max is a function thatyields the maximum entry time, i.e., tix and tiy.
Fig. 5 shows a diagram of time window usage by three aircraft in a ‘‘collective microregion’’ and lists the three potentialconcurrence events and the calculation of H for each aircraft.
The micro-mapping allows for pair-wise comparisons between aircraft within each microcell. Subsequently, to improvethe reliability of the ‘‘collective microregion’’ identification, for segments located on the boundaries of surrounding cells,macro- and micro-mapping processes are applied on nominal and ‘‘shifted’’ trajectories. The shifted trajectories are obtainedby moving each aircraft’s ‘‘nominal’’ position (by the addition of 0.025, 0.05 and 0.1 degrees to the latitudes and longitudes)before mapping them on the grid.
Fig. 6(a) shows trajectories mapped with a 0.05-degree shift with respect to the ‘‘nominal’’ position, presented previouslyin Fig. 1(b). Fig. 6(b) illustrates the integration of potential concurrence events based on the macrodetection of the ‘‘nominal’’and 0.05-degree-shifted trajectories in the same lattice, where darker microcells represent overlapped ‘‘collective microre-gions’’ and those slightly less dark cells represent additional ‘‘collective microregions’’, as detected by the trajectories’
Fig. 4. (a) Microcells, (b) micro-mapping and (c) occupancy tracking time.
Fig. 5. Time window diagrams and calculation of H.
J. Nosedal et al. / Transportation Research Part C 44 (2014) 171–184 175
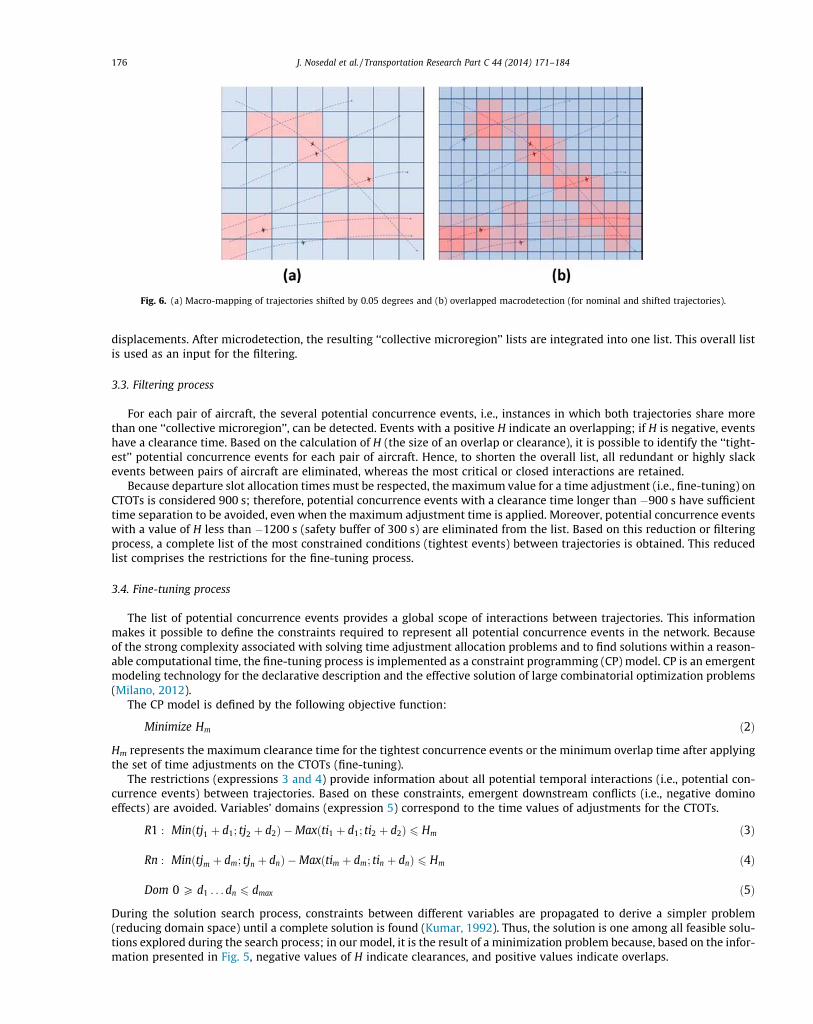
displacements. After microdetection, the resulting ‘‘collective microregion’’ lists are integrated into one list. This overall listis used as an input for the filtering.
3.3. Filtering process
For each pair of aircraft, the several potential concurrence events, i.e., instances in which both trajectories share morethan one ‘‘collective microregion’’, can be detected. Events with a positive H indicate an overlapping; if H is negative, eventshave a clearance time. Based on the calculation of H (the size of an overlap or clearance), it is possible to identify the ‘‘tight-est’’ potential concurrence events for each pair of aircraft. Hence, to shorten the overall list, all redundant or highly slackevents between pairs of aircraft are eliminated, whereas the most critical or closed interactions are retained.
Because departure slot allocation times must be respected, the maximum value for a time adjustment (i.e., fine-tuning) onCTOTs is considered 900 s; therefore, potential concurrence events with a clearance time longer than �900 s have sufficienttime separation to be avoided, even when the maximum adjustment time is applied. Moreover, potential concurrence eventswith a value of H less than �1200 s (safety buffer of 300 s) are eliminated from the list. Based on this reduction or filteringprocess, a complete list of the most constrained conditions (tightest events) between trajectories is obtained. This reducedlist comprises the restrictions for the fine-tuning process.
3.4. Fine-tuning process
The list of potential concurrence events provides a global scope of interactions between trajectories. This informationmakes it possible to define the constraints required to represent all potential concurrence events in the network. Becauseof the strong complexity associated with solving time adjustment allocation problems and to find solutions within a reason-able computational time, the fine-tuning process is implemented as a constraint programming (CP) model. CP is an emergentmodeling technology for the declarative description and the effective solution of large combinatorial optimization problems(Milano, 2012).
The CP model is defined by the following objective function:
Minimize Hm ð2Þ
Hm represents the maximum clearance time for the tightest concurrence events or the minimum overlap time after applyingthe set of time adjustments on the CTOTs (fine-tuning).
The restrictions (expressions 3 and 4) provide information about all potential temporal interactions (i.e., potential con-currence events) between trajectories. Based on these constraints, emergent downstream conflicts (i.e., negative dominoeffects) are avoided. Variables’ domains (expression 5) correspond to the time values of adjustments for the CTOTs.
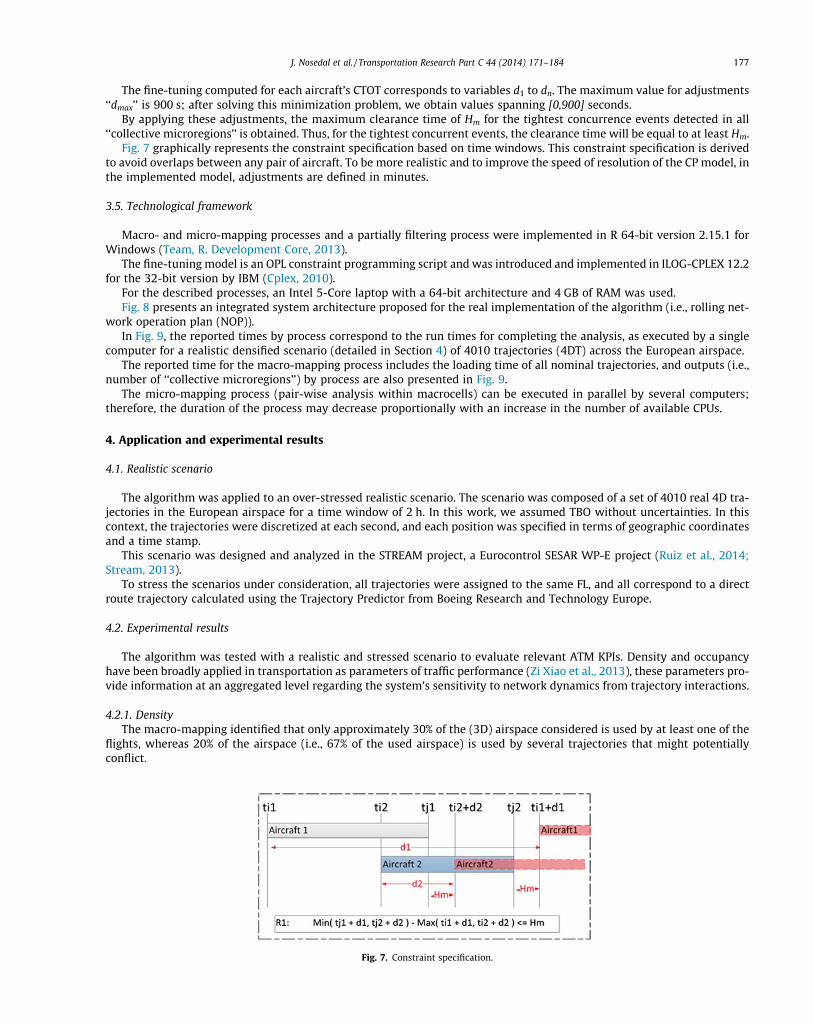
R1 : Minðtj1 þ d1; tj2 þ d2Þ �Maxðti1 þ d1; ti2 þ d2Þ 6 Hm ð3Þ
Rn : Minðtjm þ dm; tjn þ dnÞ �Maxðtim þ dm; tin þ dnÞ 6 Hm ð4Þ
Dom 0 P d1 . . . dn 6 dmax ð5Þ
During the solution search process, constraints between different variables are propagated to derive a simpler problem(reducing domain space) until a complete solution is found (Kumar, 1992). Thus, the solution is one among all feasible solu-tions explored during the search process; in our model, it is the result of a minimization problem because, based on the infor-mation presented in Fig. 5, negative values of H indicate clearances, and positive values indicate overlaps.
Fig. 6. (a) Macro-mapping of trajectories shifted by 0.05 degrees and (b) overlapped macrodetection (for nominal and shifted trajectories).
176 J. Nosedal et al. / Transportation Research Part C 44 (2014) 171–184
The fine-tuning computed for each aircraft’s CTOT corresponds to variables d1 to dn. The maximum value for adjustments‘‘dmax’’ is 900 s; after solving this minimization problem, we obtain values spanning [0,900] seconds.
By applying these adjustments, the maximum clearance time of Hm for the tightest concurrence events detected in all‘‘collective microregions’’ is obtained. Thus, for the tightest concurrent events, the clearance time will be equal to at least Hm.
Fig. 7 graphically represents the constraint specification based on time windows. This constraint specification is derivedto avoid overlaps between any pair of aircraft. To be more realistic and to improve the speed of resolution of the CP model, inthe implemented model, adjustments are defined in minutes.
3.5. Technological framework
Macro- and micro-mapping processes and a partially filtering process were implemented in R 64-bit version 2.15.1 forWindows (Team, R. Development Core, 2013).
The fine-tuning model is an OPL constraint programming script and was introduced and implemented in ILOG-CPLEX 12.2for the 32-bit version by IBM (Cplex, 2010).
For the described processes, an Intel 5-Core laptop with a 64-bit architecture and 4 GB of RAM was used.Fig. 8 presents an integrated system architecture proposed for the real implementation of the algorithm (i.e., rolling net-
work operation plan (NOP)).In Fig. 9, the reported times by process correspond to the run times for completing the analysis, as executed by a single
computer for a realistic densified scenario (detailed in Section 4) of 4010 trajectories (4DT) across the European airspace.The reported time for the macro-mapping process includes the loading time of all nominal trajectories, and outputs (i.e.,
number of ‘‘collective microregions’’) by process are also presented in Fig. 9.The micro-mapping process (pair-wise analysis within macrocells) can be executed in parallel by several computers;
therefore, the duration of the process may decrease proportionally with an increase in the number of available CPUs.
4. Application and experimental results
4.1. Realistic scenario
The algorithm was applied to an over-stressed realistic scenario. The scenario was composed of a set of 4010 real 4D tra-jectories in the European airspace for a time window of 2 h. In this work, we assumed TBO without uncertainties. In thiscontext, the trajectories were discretized at each second, and each position was specified in terms of geographic coordinatesand a time stamp.
This scenario was designed and analyzed in the STREAM project, a Eurocontrol SESAR WP-E project (Ruiz et al., 2014;Stream, 2013).
To stress the scenarios under consideration, all trajectories were assigned to the same FL, and all correspond to a directroute trajectory calculated using the Trajectory Predictor from Boeing Research and Technology Europe.
4.2. Experimental results
The algorithm was tested with a realistic and stressed scenario to evaluate relevant ATM KPIs. Density and occupancyhave been broadly applied in transportation as parameters of traffic performance (Zi Xiao et al., 2013), these parameters pro-vide information at an aggregated level regarding the system’s sensitivity to network dynamics from trajectory interactions.
4.2.1. DensityThe macro-mapping identified that only approximately 30% of the (3D) airspace considered is used by at least one of the
flights, whereas 20% of the airspace (i.e., 67% of the used airspace) is used by several trajectories that might potentiallyconflict.
Fig. 7. Constraint specification.
J. Nosedal et al. / Transportation Research Part C 44 (2014) 171–184 177
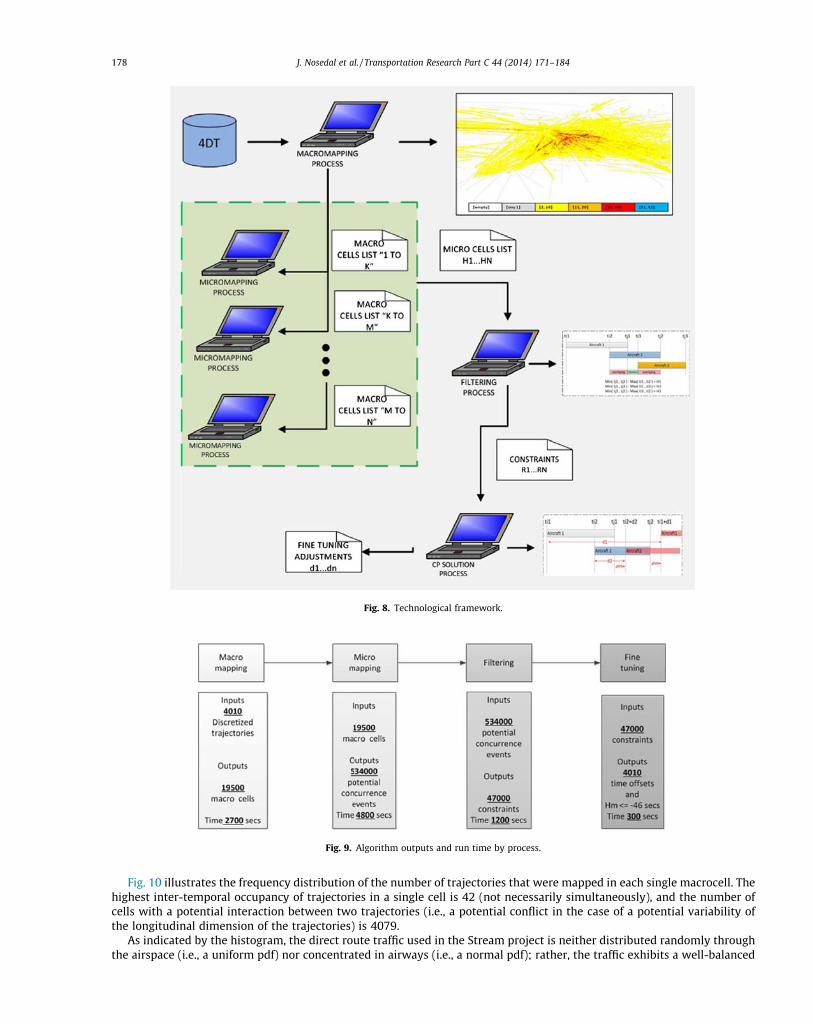
Fig. 10 illustrates the frequency distribution of the number of trajectories that were mapped in each single macrocell. Thehighest inter-temporal occupancy of trajectories in a single cell is 42 (not necessarily simultaneously), and the number ofcells with a potential interaction between two trajectories (i.e., a potential conflict in the case of a potential variability ofthe longitudinal dimension of the trajectories) is 4079.
As indicated by the histogram, the direct route traffic used in the Stream project is neither distributed randomly throughthe airspace (i.e., a uniform pdf) nor concentrated in airways (i.e., a normal pdf); rather, the traffic exhibits a well-balanced
Fig. 8. Technological framework.
Fig. 9. Algorithm outputs and run time by process.
178 J. Nosedal et al. / Transportation Research Part C 44 (2014) 171–184

use of resources given a stochastic demand (i.e., an exponential pdf), as occurs in surface highways tolls or customer callcenters in which random demand is balanced with capacity by considering the cost of queues.
4.2.2. Airspace hot spotsThe spatial distribution of the potential concurrence events for the 4010 trajectories in Europe generated by macrodetec-
tion is illustrated in Fig. 11. The results correspond to the analysis of the European airspace area delimited by [�20,30]degrees longitude and [0,80] degrees latitude. The middle of the figure indicates how some airspace regions, which arenot overcrowded, interact with ‘‘congested regions’’ by crossing trajectories.
A more detailed representation of the macrodetection and hot spot identification for the region spanning [4,10] degrees inlongitude and [46,52] degrees in latitude is presented in Fig. 12, wherein it is possible to locate ‘‘highly congested regions’’.The value in the cell represents the number of trajectories over a time window of 2 h.
The number of times a trajectory crosses other trajectories is relevant for designing an indicator for an RBT’s tightnesswith respect to surrounding traffic.
The implemented micro-mapping functionality provides information about the number of interactions by trajectory (i.e.,potential concurrence events with H longer than �1200 s are excluded).
Fig. 13 illustrates the number of interactions discretized in groups of 60. As shown, 204 trajectories do not interact withsurrounding traffic, thus boosting the network robustness in the nominal scenario (i.e., lack of uncertainty). It can also benoted that approximately 95% of the trajectories have one or more interactions, thus representing possible candidates forspurring positive or negative domino effects (Krozel et al., 2001).
Fig. 10. Frequency distribution of the number of trajectories mapped per macrocell.
Fig. 11. Spatial distribution of the number of trajectories mapped per macrocell.
J. Nosedal et al. / Transportation Research Part C 44 (2014) 171–184 179
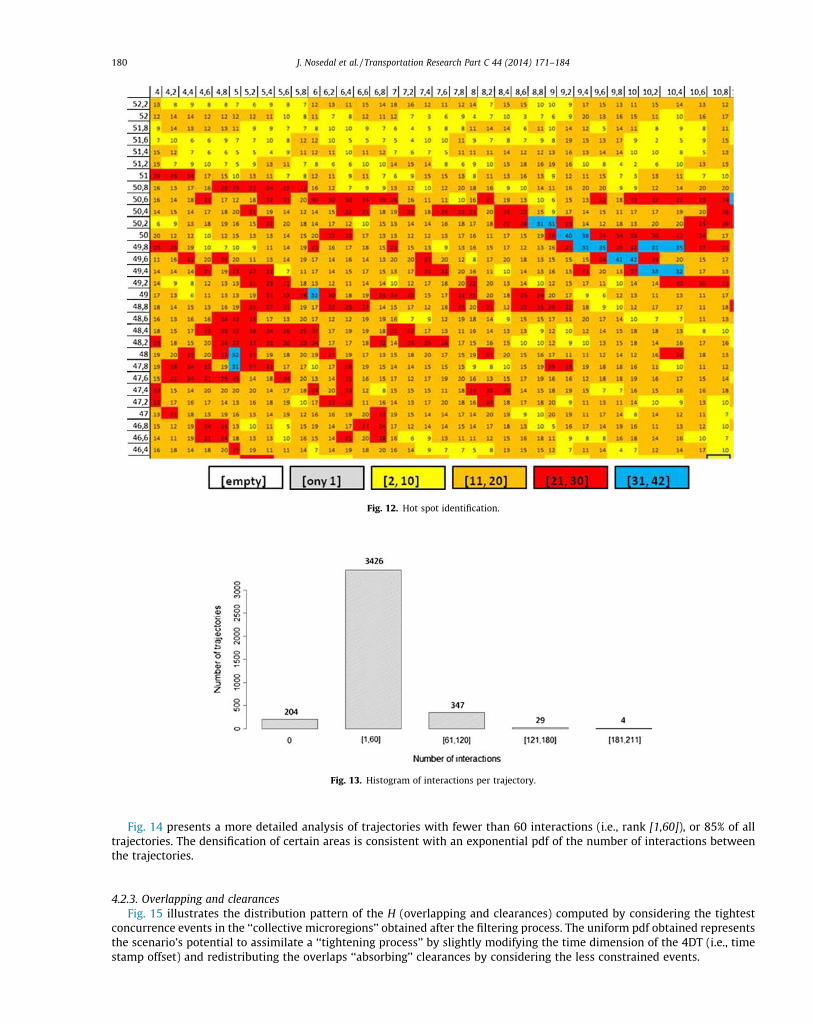
Fig. 14 presents a more detailed analysis of trajectories with fewer than 60 interactions (i.e., rank [1,60]), or 85% of alltrajectories. The densification of certain areas is consistent with an exponential pdf of the number of interactions betweenthe trajectories.
4.2.3. Overlapping and clearancesFig. 15 illustrates the distribution pattern of the H (overlapping and clearances) computed by considering the tightest
concurrence events in the ‘‘collective microregions’’ obtained after the filtering process. The uniform pdf obtained representsthe scenario’s potential to assimilate a ‘‘tightening process’’ by slightly modifying the time dimension of the 4DT (i.e., timestamp offset) and redistributing the overlaps ‘‘absorbing’’ clearances by considering the less constrained events.
Fig. 12. Hot spot identification.
Fig. 13. Histogram of interactions per trajectory.
180 J. Nosedal et al. / Transportation Research Part C 44 (2014) 171–184

4.2.4. Fine-tuningThe constraint programming model implemented generates several feasible solutions in which minor delays on the
CTOTs inside the allocated slot (i.e., less than 15 min) are used to maximize the looseness of the potential concurrence eventsin the ‘‘collective microregions’’ and to improve the robustness of the en route trajectories with respect to the surroundingtraffic in the presence of sources of uncertainty that affect a flight’s longitudinal dimension (i.e., wind prediction errors(Tastambekov et al., 2014). Robust schedules in the ATM system should incorporate uncertainties with alternatives or bufferbottleneck points to prevent significant capacity losses. Furthermore, the schedules should absorb randomly arising uncer-tainties to maximize the efficient use of the available capacity (Heidt and Gluchshenko, 2012).
Fig. 14. Histogram of interactions per trajectory [1,60] cases.
Fig. 15. Distribution pattern of looseness, H (overlapping and clearances).
Fig. 16. Distribution of computed fine-tuning values ‘‘dn’’ based on the CP model solution.
J. Nosedal et al. / Transportation Research Part C 44 (2014) 171–184 181
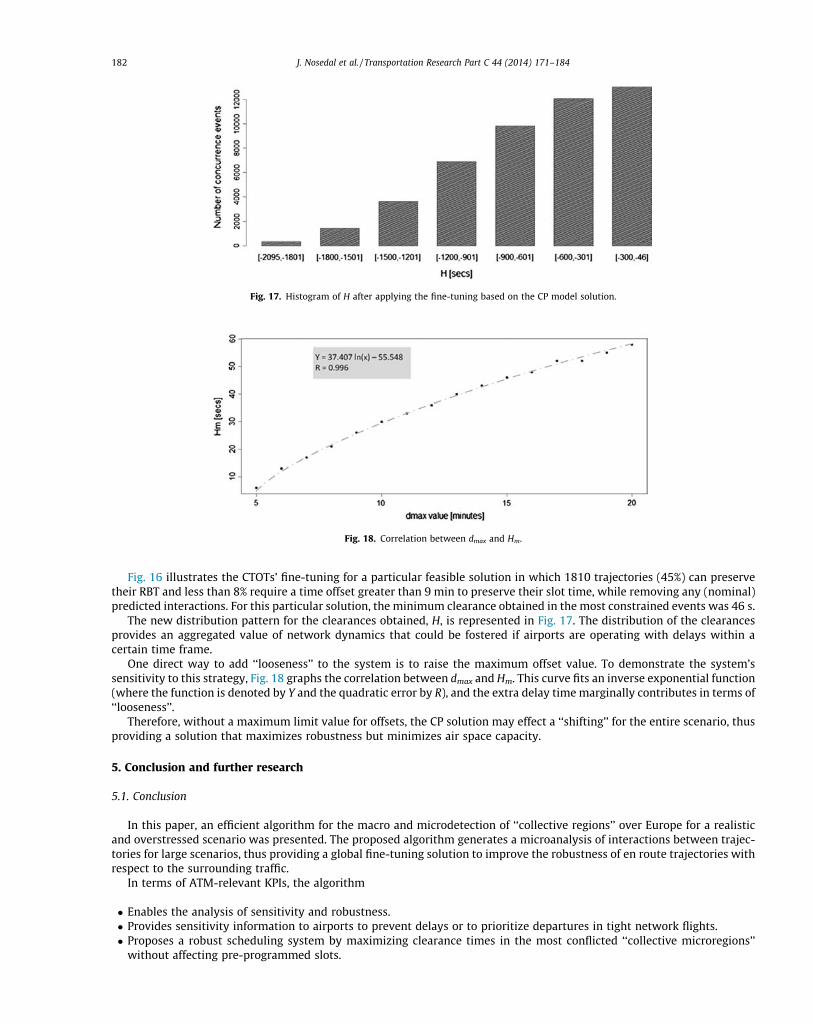
Fig. 16 illustrates the CTOTs’ fine-tuning for a particular feasible solution in which 1810 trajectories (45%) can preservetheir RBT and less than 8% require a time offset greater than 9 min to preserve their slot time, while removing any (nominal)predicted interactions. For this particular solution, the minimum clearance obtained in the most constrained events was 46 s.
The new distribution pattern for the clearances obtained, H, is represented in Fig. 17. The distribution of the clearancesprovides an aggregated value of network dynamics that could be fostered if airports are operating with delays within acertain time frame.
One direct way to add ‘‘looseness’’ to the system is to raise the maximum offset value. To demonstrate the system’ssensitivity to this strategy, Fig. 18 graphs the correlation between dmax and Hm. This curve fits an inverse exponential function(where the function is denoted by Y and the quadratic error by R), and the extra delay time marginally contributes in terms of‘‘looseness’’.
Therefore, without a maximum limit value for offsets, the CP solution may effect a ‘‘shifting’’ for the entire scenario, thusproviding a solution that maximizes robustness but minimizes air space capacity.
5. Conclusion and further research
5.1. Conclusion
In this paper, an efficient algorithm for the macro and microdetection of ‘‘collective regions’’ over Europe for a realisticand overstressed scenario was presented. The proposed algorithm generates a microanalysis of interactions between trajec-tories for large scenarios, thus providing a global fine-tuning solution to improve the robustness of en route trajectories withrespect to the surrounding traffic.
In terms of ATM-relevant KPIs, the algorithm
� Enables the analysis of sensitivity and robustness.� Provides sensitivity information to airports to prevent delays or to prioritize departures in tight network flights.� Proposes a robust scheduling system by maximizing clearance times in the most conflicted ‘‘collective microregions’’
without affecting pre-programmed slots.
Fig. 17. Histogram of H after applying the fine-tuning based on the CP model solution.
Fig. 18. Correlation between dmax and Hm.
182 J. Nosedal et al. / Transportation Research Part C 44 (2014) 171–184

� Avoids potential concurrence events without modifying the trajectories’ path geometry nor flight’s speed.� Computes fine-tuning of the CTOTs, thus preserving airports’ pre-programmed time slots.� Provides fine-tuning for ATM that grants an extra degree of freedom to mitigate over-densified scenarios.
5.2. Further research
Future research will be dedicated to developing and implementing the following:
� Comparisons between direct and structured routes to evaluate both routes in terms of robustness.� Metrics for obtaining optimal solutions in terms of fairness, equity and robustness.� Improved numerical efficiency to reduce computational time, a key factor for delivering fine-tuning results in real time.� Additions to the CP model to allow for constraint relaxation for over-densified scenarios to combine better strategic plan-
ning tools with tactical operations.� Additions to the algorithm to consider uncertainties from airside and landside operations.
Acronyms
4DT trajectory described in terms of three spatial dimensions and time stampsATC air traffic controlATCO air traffic controllerATCC air traffic control centerATM air traffic managementAUs airspace usersBT business trajectoryCD&R conflict detection and resolutionCP constraint programmingCTOT Calculated Take-Off TimeDSS decision support systemsFL Flight LevelKPI key performance indicatorNext Gen next generation air transportation systemNOP network operation planNP nondeterministic polynomial timeOPL optimization programming languagepdf probability distribution functionRBT reference business trajectorySDS spatial data structureSESAR single European sky ATM researchTBO trajectory-based operationsWP-E work package E
Acknowledgments
This work is partly sponsored by the Ministry of Economy and Competitiveness through the project ‘‘Fire GuidedUnmanned Aircrafts and Resources Distribution (FireGUARD), CICYT Spanish program TIN2011-29494-C03-01. J. Nosedalis supported by CONACYT and ICyTDF through the Mexican International Scholarship Program.
References
Alam, Sameer, Abbass, Hussein A., Barlow, Michael, 2008. Atoms: air traffic operations and management simulator. IEEE Trans. Intell. Transport. Syst. 9 (2),209–225.
ATFCM Services, 2013. <http://www.eurocontrol.int/articles/air-traffic-flow-and-capacity-management>, (consulted in 12.13).Barnier Nicolas, Pascal Brisset, Thomas Riviere, 2001. Slot allocation with constraint programming: models and results. In: Proceedings of the fourth USA/
Europe Air Traffic Management R&D, Seminar.Basu, Amitabh, Mitchell, Joseph S.B., Sabhnani, Girish Kumar, 2009. Geometric algorithms for optimal airspace design and air traffic controller workload
balancing. J. Exp. Algorithmics (JEA) 14, 3.Carlier Sandrine, et al., 2007. Environmental impact of air traffic flow management delays. In: Proceedings of the 7th USA/Europe Air Traffic Management
Research and Development Seminar (ATM2007), vol. 8.Cascetta, Ennio, 1987. Static and Dynamic Models of Stochastic Assignment to Transportation Networks. Flow Control of Congested Networks. Springer,
Berlin, Heidelberg, pp. 91–111.Castelli, Lorenzo, Pesenti, Raffaele, Ranieri, Andrea, 2011. The design of a market mechanism to allocate air traffic flow management slots. Transport. Res.
Part C: Emerg. Technol. 19 (5), 931–943.
J. Nosedal et al. / Transportation Research Part C 44 (2014) 171–184 183
Cplex, 2010. IBM ILOG. 12.2 User’s Manual.Delahaye Daniel, et al., 1994. Genetic algorithms for partitioning air space. In: Artificial Intelligence for Applications, Proceedings of the Tenth Conference on
IEEE.Delahaye Daniel, et al., 2005. Airspace congestion smoothing by multi-objective genetic algorithm. In: Proceedings of the 2005 ACM symposium on Applied
computing, ACM.Djokic, Jelena, Lorenz, Bernd, Fricke, Hartmut, 2010. Air traffic control complexity as workload driver. Transport Res. Part C: Emerg. Technol. 18 (6), 930–
936.European Commission Memo 13/666, 2013. European Commission invests €600 million in new research to unblock congestion in Europe’s airspace.Ferguson, J. et al, 2013. Estimating domestic US airline cost of delay based on European model. Transp. Res. Part C 33, 311–323.Flener Pierre, Justin Pearson, 2012. Automatic Airspace Sectorisation: A Survey.Flener, Pierre et al, 2007. Air-traffic complexity resolution in multi-sector planning. J. Air Transport Manage. 13, 323–328.Glover, C. et al, 2013. Stochastic optimization models for ground delay program planning with equity–efficiency tradeoffs. Transp. Res. Part C 33, 196–202.Heidt Andreas, Olga Gluchshenko, 2012. From uncertainty to robustness and system’s resilience in ATM: a case-study. In: Air Transport and Operations:
Proceedings of the Third International Air Transport and Operations Symposium. IOS Press.Bruce, Janson N., Robles, Juan, 1993. Dynamic traffic assignment with arrival time costs. Transport. Traffic Theory.Kim, A. et al, 2013. A framework for the assessment of collaborative en route resource allocation strategies. Transp. Res. Part C 33, 324–339.Kopardekar, P., Bilimoria, K., Sridhar, B., 2007. Initial concepts for dynamic airspace configuration. In: 7th AIAA Aviation Technology, Integration and
Operations Conference (ATIO), Belfast, Northern Ireland.Korn Bernd, et al., 2006. 4D Trajectory management in the extended TMA: coupling AMAN and 4D FMS for optimized approach trajectories. In: Proceedings
of the ICAS 2006 Conference, Hamburg, Germany.Krozel Jimmy, et al., 2001. System performance characteristics of centralized and decentralized air traffic separation strategies. In: Fourth USA/Europe Air
Traffic Management Research and Development Seminar.Kumar, Vipin., 1992. Algorithms for constraint-satisfaction problems: a survey. AI Mag. 13 (1), 32.Lee Keumjin, et al., 2007. Air traffic complexity: an input–output approach. In: Proceedings of the American Control Conference. USA.Lu, Huapu, Shi, Ye, 2007. Complexity of public transport networks. Tsinghua Sci. Technol. 12 (2), 204–213.Margellos Kostas, John Lygeros, 2012. Toward 4-D trajectory management in air traffic control: a study based on Monte Carlo simulation and reachability
analysis, pp. 1–1.Maugis Lionnel, 1996. Mathematical programming for the air traffic flow management problem with en-route capacities. In: Proceedings of the 14th
Triennial World Conference of the International Federation of Operational Research Societies.Milano Michela, 2012. Principles and Practice of Constraint Programming.Nagurney, Anna, 1998. Network Economics: A Variational Inequality Approach, vol. 10. Springer.Netjasov, F. et al, 2013. Framework for airspace planning and design based on conflict risk assessment Part 3: conflict risk assessment model for airspace
operational and current day planning. Transp. Res. Part C 32, 31–47.Next Gen program, 2013. <http://www.faa.gov/nextgen/>, (consulted in 12.13).Peeta, Srinivas, Ziliaskopoulos, Athanasios K., 2001. Foundations of dynamic traffic assignment: the past, the present and the future. Networks Spat. Econ. 1
(3-4), 233–265.Piera, M. et al, 2014. Causal simulation models for facing third millennium air transport sustainability. Simul. Trans. Soc. Model. Simul. Int. 90 (2), 162–170.Prandini, Maria et al, 2011. Toward air traffic complexity assessment in new generation air traffic management systems. IEEE Trans. Intell. Transp. Syst. 12.3,
809–818.Prot, D. et al, 2014. A 4D-sequencing approach for air traffic management. Eur. J. Oper. Res..Pyrgiotis, Nikolas, Malone, Kerry M., Odoni, Amedeo, 2013. Modelling delay propagation within an airport network. Transport. Res. Part C: Emerg. Technol.
27, 60–75.Ruiz Sergio, Piera, M.A., Ranieri, A., Martinez, R., 2012. A computational efficient conflict detection and resolution through spatial data structures. In: Proc.
5th International Conference on Research in Air Transportation, ICRAT 2012, University of California (Berkeley).Ruiz, Sergio et al, 2013. A medium term conflict detection and resolution system for terminal maneuvering area based on spatial data structures and 4D
trajectories. Transport. Res. Part C: Emerg. Technol. 26, 396–417.Ruiz, Sergio et al, 2013. Relational time-space data structure to enable strategic de-confliction with a global scope in the presence of a large number of 4D
trajectories. J. Aerospace Oper. 2, 53–78.Ruiz, Sergio et al, 2014. Strategic de-confliction in the presence of a large number of 4D trajectories using a causal modeling approach. Transp. Res. Part C 39,
129–147.Sesar program, 2013. <http://www.ec.europa.eu/transport/modes/air/sesar/>, (consulted in 12.13).Stream, 2013. Strategic Trajectory de-confliction to Enable seamless Aircraft conflict Management, Eurocontrol WP-E project. <www.hala-sesar.net/
stream>, (consulted in 12.13).Tang, Jiangjun et al, 2012. A multi-objective approach for dynamic airspace sectorization using agent based and geometric models. Transport. Res. Part C:
Emerg. Technol. 21.1, 89–121.Tastambekov, K. et al, 2014. Aircraft trajectory forecasting using local functional regression in Sobolev space. Transp. Res. Part C 39, 1–22.Team, R. Development Core, 2013. R: A language and environment for statistical computing. R Foundation for Statistical Computing, Vienna, Austria, ISBN 3-
900051-07-0. url: <http://www.R-project.org, 2005>.Trandac, Huy, Baptiste, Philippe, Duong, Vu, 2005. Airspace sectorization with constraints. RAIRO-Oper. Res. 39 (02), 105–122.Zenios, S., 1991. Network based models for air traffic control. Eur. J. Oper. Res. 50, 166–178.Zi Xiao, C. et al, 2013. A new concept of occupancy: dynamic time occupancy. Transp. Res. Part C 31, 51–61.
184 J. Nosedal et al. / Transportation Research Part C 44 (2014) 171–184
Chapter 4
Paper II
This paper presents an optimization model for airspace capacity - demand manage-
ment that performs an efficient departure time bounded adjustment configuration for
trajectory based operations. This optimization model is supported by the 4D tra-
jectories paradigm, in which a discrete event model has been developed to formalize
the trajectories spatio-temporal interdependencies. Based on the elements and pa-
rameters declared on the validated coloured Petri net model, a set of constraints is
obtained. By means of constraint programming, feasible solutions for demand - ca-
pacity imbalances are proposed for a case study scenario, while the original departure
slots are preserved in addition to the airspace users preferences. The results obtained
show the advantages in terms of capacity and robustness that can be achieved by
applying an efficient departure time bounded adjustment configuration.
36
An optimization model to fit airspace demand consideringa spatio-temporal analysis of airspace capacity
Jenaro Nosedal a,⇑, Miquel A. Piera a, Adriano O. Solis b, Carles Ferrer c
a Technical Innovation Cluster on Aeronautical Management, Universitat Autonoma de Barcelona, Sabadell, Barcelona, SpainbManagement Science Area, School of Administrative Studies, York University, Toronto, Ontario, CanadacDept. of Microelectronics and Electronic Systems, Universitat Autonoma de Barcelona, Bellaterra, Barcelona, Spain
a r t i c l e i n f o
Article history:Received 17 March 2015Received in revised form 22 September 2015Accepted 12 October 2015Available online 31 October 2015
Keywords:Air traffic managementDiscrete event dynamic systemsColoured Petri netsConstraint programmingAirspace demand–capacity balance
a b s t r a c t
The European and U.S. airspace systems are highly congested at certain peak time intervals.Controllers’ workloads have reached generally accepted limits; therefore, many highlydemanded sectors are subject to traffic regulations and restrictions during many hoursof each day. A lack of a spatio-temporal analysis of the airside capacity management toolsgenerates airside delays at the destination airport in the form of holding or path-stretchingin terminal manoeuvring areas, or even during the cruise by re-routing. These emergentdynamics are demonstrated every day by the urgent need for new and better tools for ana-lyzing and making strategic and tactical decisions that neither induce delays nor negativelyimpact daily operations. This paper presents an optimization model for airspace capacity–demand management that performs an efficient departure time bounded adjustment con-figuration for trajectory based operations. This optimization model is supported by the 4Dtrajectories paradigm, in which a discrete event model has been developed to formalize thetrajectories’ spatio-temporal interdependencies. Based on the elements and parametersdeclared on the validated coloured Petri net model, a set of constraints is obtained. Bymeans of constraint programming, feasible solutions for demand–capacity imbalancesare proposed for a case study scenario, while the original departure slots are preservedin addition to the airspace users’ preferences. The results obtained show the advantagesin terms of capacity and robustness that can be achieved by applying an efficient departuretime bounded adjustment configuration.
� 2015 Elsevier Ltd. All rights reserved.
1. Introduction
Growing air traffic trends necessitate the identification of operational and managing policies for better performance ofexisting airside capacity (Farhadi et al., 2014). The current method of organizing airspace and balancing demand and capac-ity is to partition airspace into sectors. This fragmentation of airspace configurations into several air traffic control (ATC)boundaries for air traffic management (ATM) directly influences the airside capacity utilization, among other impact factors(European Commission Memo, 2013).
Presently, the demand–capacity airside (i.e., ATC sectors) problem is detected by a simple aircraft counter for a time inter-val. Each sector has a capacity threshold in the form of the maximum number of aircraft at a given time slot. This threshold
http://dx.doi.org/10.1016/j.trc.2015.10.0110968-090X/� 2015 Elsevier Ltd. All rights reserved.
⇑ Corresponding author.E-mail addresses: [email protected] (J. Nosedal), [email protected] (M.A. Piera), [email protected] (A.O. Solis), [email protected]
(C. Ferrer).
Transportation Research Part C 61 (2015) 11–28
Contents lists available at ScienceDirect
Transportation Research Part C
journal homepage: www.elsevier .com/locate / t rc
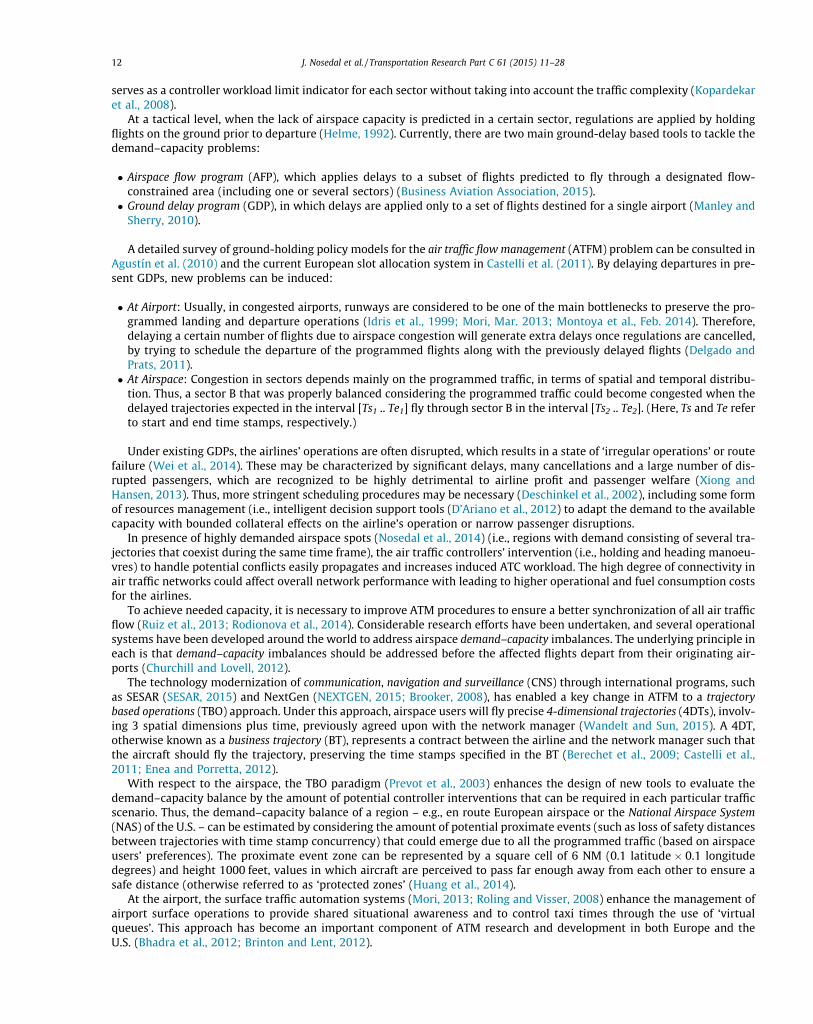
serves as a controller workload limit indicator for each sector without taking into account the traffic complexity (Kopardekaret al., 2008).
At a tactical level, when the lack of airspace capacity is predicted in a certain sector, regulations are applied by holdingflights on the ground prior to departure (Helme, 1992). Currently, there are two main ground-delay based tools to tackle thedemand–capacity problems:
� Airspace flow program (AFP), which applies delays to a subset of flights predicted to fly through a designated flow-constrained area (including one or several sectors) (Business Aviation Association, 2015).� Ground delay program (GDP), in which delays are applied only to a set of flights destined for a single airport (Manley andSherry, 2010).
A detailed survey of ground-holding policy models for the air traffic flow management (ATFM) problem can be consulted inAgustín et al. (2010) and the current European slot allocation system in Castelli et al. (2011). By delaying departures in pre-sent GDPs, new problems can be induced:
� At Airport: Usually, in congested airports, runways are considered to be one of the main bottlenecks to preserve the pro-grammed landing and departure operations (Idris et al., 1999; Mori, Mar. 2013; Montoya et al., Feb. 2014). Therefore,delaying a certain number of flights due to airspace congestion will generate extra delays once regulations are cancelled,by trying to schedule the departure of the programmed flights along with the previously delayed flights (Delgado andPrats, 2011).� At Airspace: Congestion in sectors depends mainly on the programmed traffic, in terms of spatial and temporal distribu-tion. Thus, a sector B that was properly balanced considering the programmed traffic could become congested when thedelayed trajectories expected in the interval [Ts1 .. Te1] fly through sector B in the interval [Ts2 .. Te2]. (Here, Ts and Te referto start and end time stamps, respectively.)
Under existing GDPs, the airlines’ operations are often disrupted, which results in a state of ‘irregular operations’ or routefailure (Wei et al., 2014). These may be characterized by significant delays, many cancellations and a large number of dis-rupted passengers, which are recognized to be highly detrimental to airline profit and passenger welfare (Xiong andHansen, 2013). Thus, more stringent scheduling procedures may be necessary (Deschinkel et al., 2002), including some formof resources management (i.e., intelligent decision support tools (D’Ariano et al., 2012) to adapt the demand to the availablecapacity with bounded collateral effects on the airline’s operation or narrow passenger disruptions.
In presence of highly demanded airspace spots (Nosedal et al., 2014) (i.e., regions with demand consisting of several tra-jectories that coexist during the same time frame), the air traffic controllers’ intervention (i.e., holding and heading manoeu-vres) to handle potential conflicts easily propagates and increases induced ATC workload. The high degree of connectivity inair traffic networks could affect overall network performance with leading to higher operational and fuel consumption costsfor the airlines.
To achieve needed capacity, it is necessary to improve ATM procedures to ensure a better synchronization of all air trafficflow (Ruiz et al., 2013; Rodionova et al., 2014). Considerable research efforts have been undertaken, and several operationalsystems have been developed around the world to address airspace demand–capacity imbalances. The underlying principle ineach is that demand–capacity imbalances should be addressed before the affected flights depart from their originating air-ports (Churchill and Lovell, 2012).
The technology modernization of communication, navigation and surveillance (CNS) through international programs, suchas SESAR (SESAR, 2015) and NextGen (NEXTGEN, 2015; Brooker, 2008), has enabled a key change in ATFM to a trajectorybased operations (TBO) approach. Under this approach, airspace users will fly precise 4-dimensional trajectories (4DTs), involv-ing 3 spatial dimensions plus time, previously agreed upon with the network manager (Wandelt and Sun, 2015). A 4DT,otherwise known as a business trajectory (BT), represents a contract between the airline and the network manager such thatthe aircraft should fly the trajectory, preserving the time stamps specified in the BT (Berechet et al., 2009; Castelli et al.,2011; Enea and Porretta, 2012).
With respect to the airspace, the TBO paradigm (Prevot et al., 2003) enhances the design of new tools to evaluate thedemand–capacity balance by the amount of potential controller interventions that can be required in each particular trafficscenario. Thus, the demand–capacity balance of a region – e.g., en route European airspace or the National Airspace System(NAS) of the U.S. – can be estimated by considering the amount of potential proximate events (such as loss of safety distancesbetween trajectories with time stamp concurrency) that could emerge due to all the programmed traffic (based on airspaceusers’ preferences). The proximate event zone can be represented by a square cell of 6 NM (0.1 latitude � 0.1 longitudedegrees) and height 1000 feet, values in which aircraft are perceived to pass far enough away from each other to ensure asafe distance (otherwise referred to as ‘protected zones’ (Huang et al., 2014).
At the airport, the surface traffic automation systems (Mori, 2013; Roling and Visser, 2008) enhance the management ofairport surface operations to provide shared situational awareness and to control taxi times through the use of ‘virtualqueues’. This approach has become an important component of ATM research and development in both Europe and theU.S. (Bhadra et al., 2012; Brinton and Lent, 2012).
12 J. Nosedal et al. / Transportation Research Part C 61 (2015) 11–28
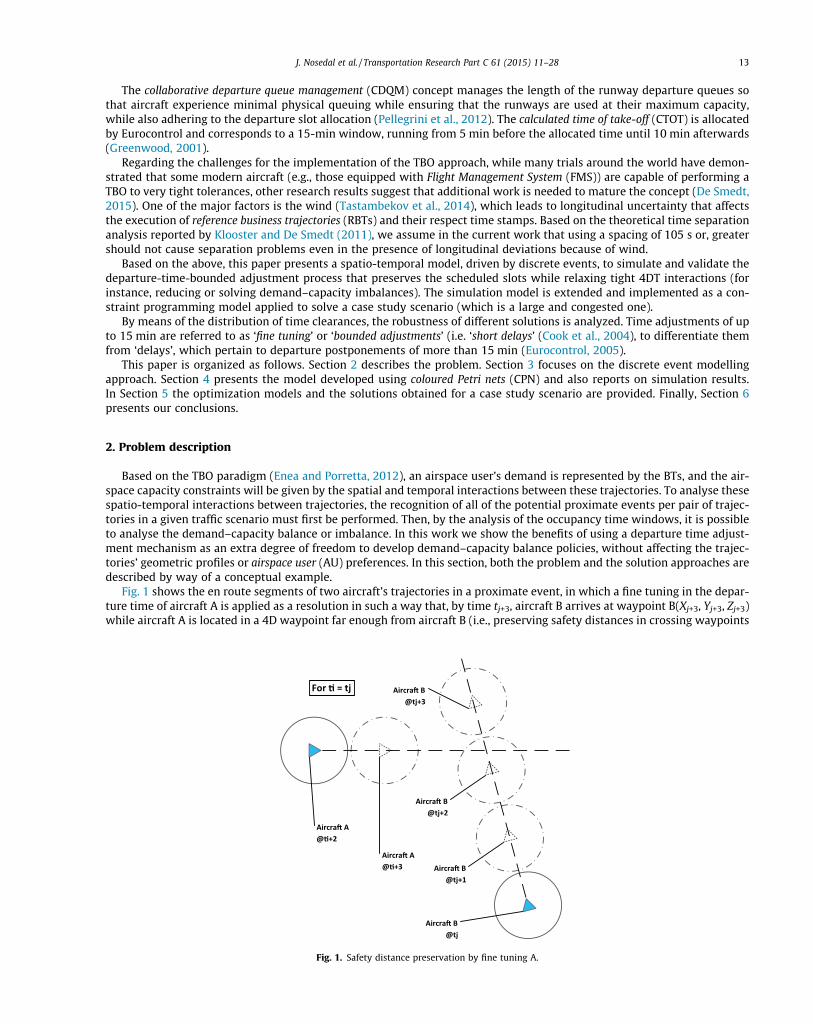
The collaborative departure queue management (CDQM) concept manages the length of the runway departure queues sothat aircraft experience minimal physical queuing while ensuring that the runways are used at their maximum capacity,while also adhering to the departure slot allocation (Pellegrini et al., 2012). The calculated time of take-off (CTOT) is allocatedby Eurocontrol and corresponds to a 15-min window, running from 5 min before the allocated time until 10 min afterwards(Greenwood, 2001).
Regarding the challenges for the implementation of the TBO approach, while many trials around the world have demon-strated that some modern aircraft (e.g., those equipped with Flight Management System (FMS)) are capable of performing aTBO to very tight tolerances, other research results suggest that additional work is needed to mature the concept (De Smedt,2015). One of the major factors is the wind (Tastambekov et al., 2014), which leads to longitudinal uncertainty that affectsthe execution of reference business trajectories (RBTs) and their respect time stamps. Based on the theoretical time separationanalysis reported by Klooster and De Smedt (2011), we assume in the current work that using a spacing of 105 s or, greatershould not cause separation problems even in the presence of longitudinal deviations because of wind.
Based on the above, this paper presents a spatio-temporal model, driven by discrete events, to simulate and validate thedeparture-time-bounded adjustment process that preserves the scheduled slots while relaxing tight 4DT interactions (forinstance, reducing or solving demand–capacity imbalances). The simulation model is extended and implemented as a con-straint programming model applied to solve a case study scenario (which is a large and congested one).
By means of the distribution of time clearances, the robustness of different solutions is analyzed. Time adjustments of upto 15 min are referred to as ‘fine tuning’ or ‘bounded adjustments’ (i.e. ‘short delays’ (Cook et al., 2004), to differentiate themfrom ‘delays’, which pertain to departure postponements of more than 15 min (Eurocontrol, 2005).
This paper is organized as follows. Section 2 describes the problem. Section 3 focuses on the discrete event modellingapproach. Section 4 presents the model developed using coloured Petri nets (CPN) and also reports on simulation results.In Section 5 the optimization models and the solutions obtained for a case study scenario are provided. Finally, Section 6presents our conclusions.
2. Problem description
Based on the TBO paradigm (Enea and Porretta, 2012), an airspace user’s demand is represented by the BTs, and the air-space capacity constraints will be given by the spatial and temporal interactions between these trajectories. To analyse thesespatio-temporal interactions between trajectories, the recognition of all of the potential proximate events per pair of trajec-tories in a given traffic scenario must first be performed. Then, by the analysis of the occupancy time windows, it is possibleto analyse the demand–capacity balance or imbalance. In this work we show the benefits of using a departure time adjust-ment mechanism as an extra degree of freedom to develop demand–capacity balance policies, without affecting the trajec-tories’ geometric profiles or airspace user (AU) preferences. In this section, both the problem and the solution approaches aredescribed by way of a conceptual example.
Fig. 1 shows the en route segments of two aircraft’s trajectories in a proximate event, in which a fine tuning in the depar-ture time of aircraft A is applied as a resolution in such a way that, by time tj+3, aircraft B arrives at waypoint B(Xj+3, Yj+3, Zj+3)while aircraft A is located in a 4D waypoint far enough from aircraft B (i.e., preserving safety distances in crossing waypoints
Aircra� A @�+2
Aircra� A @�+3
Aircra� B @tj
Aircra� B @tj+1
Aircra� B @tj+2
Aircra� B @tj+3
For � = tj
Fig. 1. Safety distance preservation by fine tuning A.
J. Nosedal et al. / Transportation Research Part C 61 (2015) 11–28 13
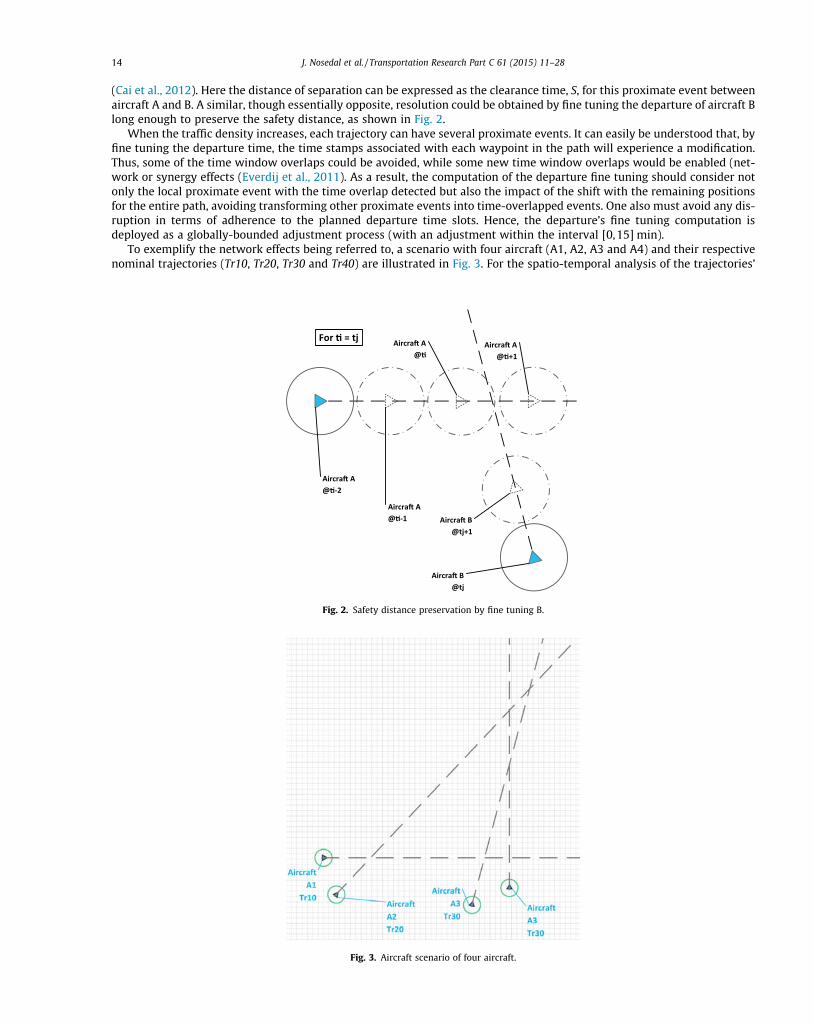
(Cai et al., 2012). Here the distance of separation can be expressed as the clearance time, S, for this proximate event betweenaircraft A and B. A similar, though essentially opposite, resolution could be obtained by fine tuning the departure of aircraft Blong enough to preserve the safety distance, as shown in Fig. 2.
When the traffic density increases, each trajectory can have several proximate events. It can easily be understood that, byfine tuning the departure time, the time stamps associated with each waypoint in the path will experience a modification.Thus, some of the time window overlaps could be avoided, while some new time window overlaps would be enabled (net-work or synergy effects (Everdij et al., 2011). As a result, the computation of the departure fine tuning should consider notonly the local proximate event with the time overlap detected but also the impact of the shift with the remaining positionsfor the entire path, avoiding transforming other proximate events into time-overlapped events. One also must avoid any dis-ruption in terms of adherence to the planned departure time slots. Hence, the departure’s fine tuning computation isdeployed as a globally-bounded adjustment process (with an adjustment within the interval [0,15] min).
To exemplify the network effects being referred to, a scenario with four aircraft (A1, A2, A3 and A4) and their respectivenominal trajectories (Tr10, Tr20, Tr30 and Tr40) are illustrated in Fig. 3. For the spatio-temporal analysis of the trajectories’
Aircra� A @�-2
Aircra� A @�-1
Aircra� B @tj
Aircra� B @tj+1
For � = tj Aircra� A @�
Aircra� A @�+1
Fig. 2. Safety distance preservation by fine tuning B.
Fig. 3. Aircraft scenario of four aircraft.
14 J. Nosedal et al. / Transportation Research Part C 61 (2015) 11–28
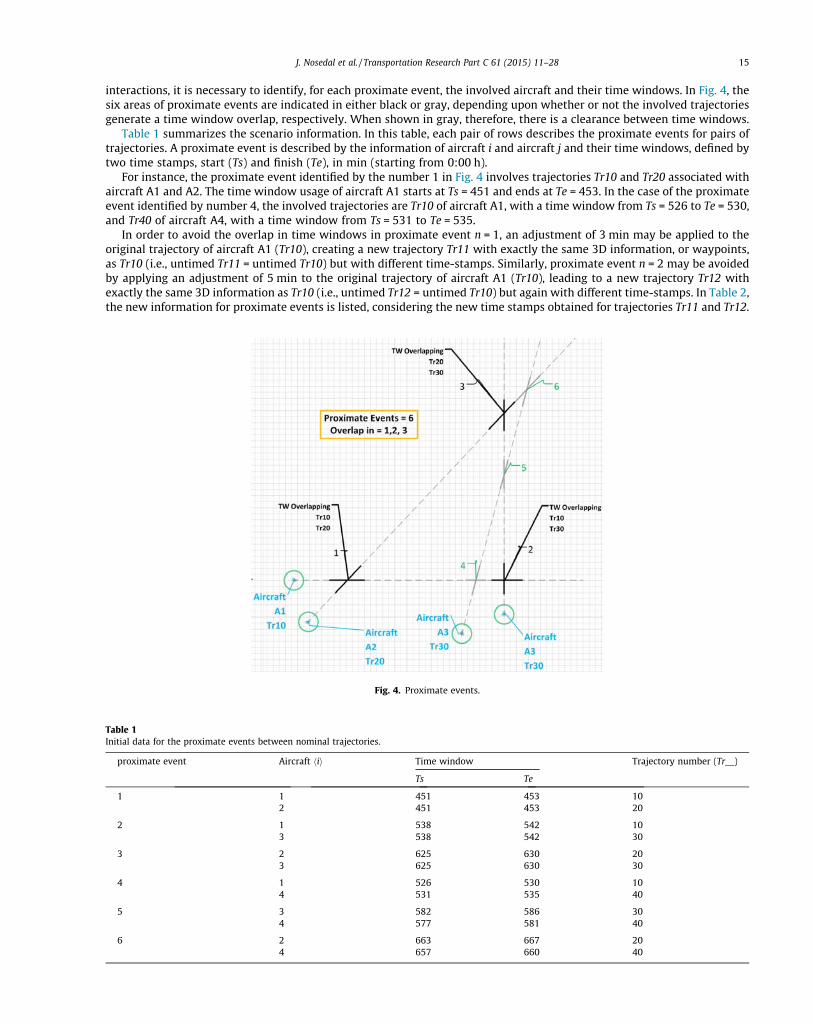
interactions, it is necessary to identify, for each proximate event, the involved aircraft and their time windows. In Fig. 4, thesix areas of proximate events are indicated in either black or gray, depending upon whether or not the involved trajectoriesgenerate a time window overlap, respectively. When shown in gray, therefore, there is a clearance between time windows.
Table 1 summarizes the scenario information. In this table, each pair of rows describes the proximate events for pairs oftrajectories. A proximate event is described by the information of aircraft i and aircraft j and their time windows, defined bytwo time stamps, start (Ts) and finish (Te), in min (starting from 0:00 h).
For instance, the proximate event identified by the number 1 in Fig. 4 involves trajectories Tr10 and Tr20 associated withaircraft A1 and A2. The time window usage of aircraft A1 starts at Ts = 451 and ends at Te = 453. In the case of the proximateevent identified by number 4, the involved trajectories are Tr10 of aircraft A1, with a time window from Ts = 526 to Te = 530,and Tr40 of aircraft A4, with a time window from Ts = 531 to Te = 535.
In order to avoid the overlap in time windows in proximate event n = 1, an adjustment of 3 min may be applied to theoriginal trajectory of aircraft A1 (Tr10), creating a new trajectory Tr11 with exactly the same 3D information, or waypoints,as Tr10 (i.e., untimed Tr11 = untimed Tr10) but with different time-stamps. Similarly, proximate event n = 2 may be avoidedby applying an adjustment of 5 min to the original trajectory of aircraft A1 (Tr10), leading to a new trajectory Tr12 withexactly the same 3D information as Tr10 (i.e., untimed Tr12 = untimed Tr10) but again with different time-stamps. In Table 2,the new information for proximate events is listed, considering the new time stamps obtained for trajectories Tr11 and Tr12.
Fig. 4. Proximate events.
Table 1Initial data for the proximate events between nominal trajectories.
proximate event Aircraft hii Time window Trajectory number (Tr__)
Ts Te
1 1 451 453 102 451 453 20
2 1 538 542 103 538 542 30
3 2 625 630 203 625 630 30
4 1 526 530 104 531 535 40
5 3 582 586 304 577 581 40
6 2 663 667 204 657 660 40
J. Nosedal et al. / Transportation Research Part C 61 (2015) 11–28 15
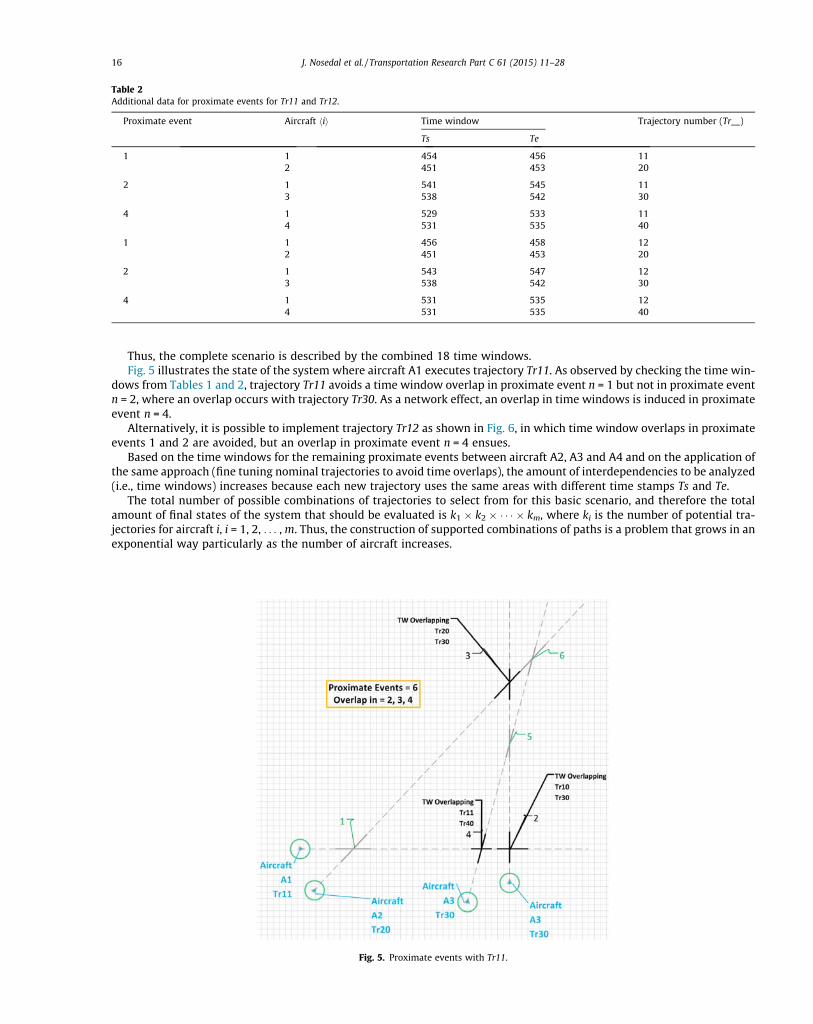
Thus, the complete scenario is described by the combined 18 time windows.Fig. 5 illustrates the state of the system where aircraft A1 executes trajectory Tr11. As observed by checking the time win-
dows from Tables 1 and 2, trajectory Tr11 avoids a time window overlap in proximate event n = 1 but not in proximate eventn = 2, where an overlap occurs with trajectory Tr30. As a network effect, an overlap in time windows is induced in proximateevent n = 4.
Alternatively, it is possible to implement trajectory Tr12 as shown in Fig. 6, in which time window overlaps in proximateevents 1 and 2 are avoided, but an overlap in proximate event n = 4 ensues.
Based on the time windows for the remaining proximate events between aircraft A2, A3 and A4 and on the application ofthe same approach (fine tuning nominal trajectories to avoid time overlaps), the amount of interdependencies to be analyzed(i.e., time windows) increases because each new trajectory uses the same areas with different time stamps Ts and Te.
The total number of possible combinations of trajectories to select from for this basic scenario, and therefore the totalamount of final states of the system that should be evaluated is k1 � k2 � � � � � km, where ki is the number of potential tra-jectories for aircraft i, i = 1, 2, . . . ,m. Thus, the construction of supported combinations of paths is a problem that grows in anexponential way particularly as the number of aircraft increases.
Table 2Additional data for proximate events for Tr11 and Tr12.
Proximate event Aircraft hii Time window Trajectory number (Tr__)
Ts Te
1 1 454 456 112 451 453 20
2 1 541 545 113 538 542 30
4 1 529 533 114 531 535 40
1 1 456 458 122 451 453 20
2 1 543 547 123 538 542 30
4 1 531 535 124 531 535 40
Fig. 5. Proximate events with Tr11.
16 J. Nosedal et al. / Transportation Research Part C 61 (2015) 11–28
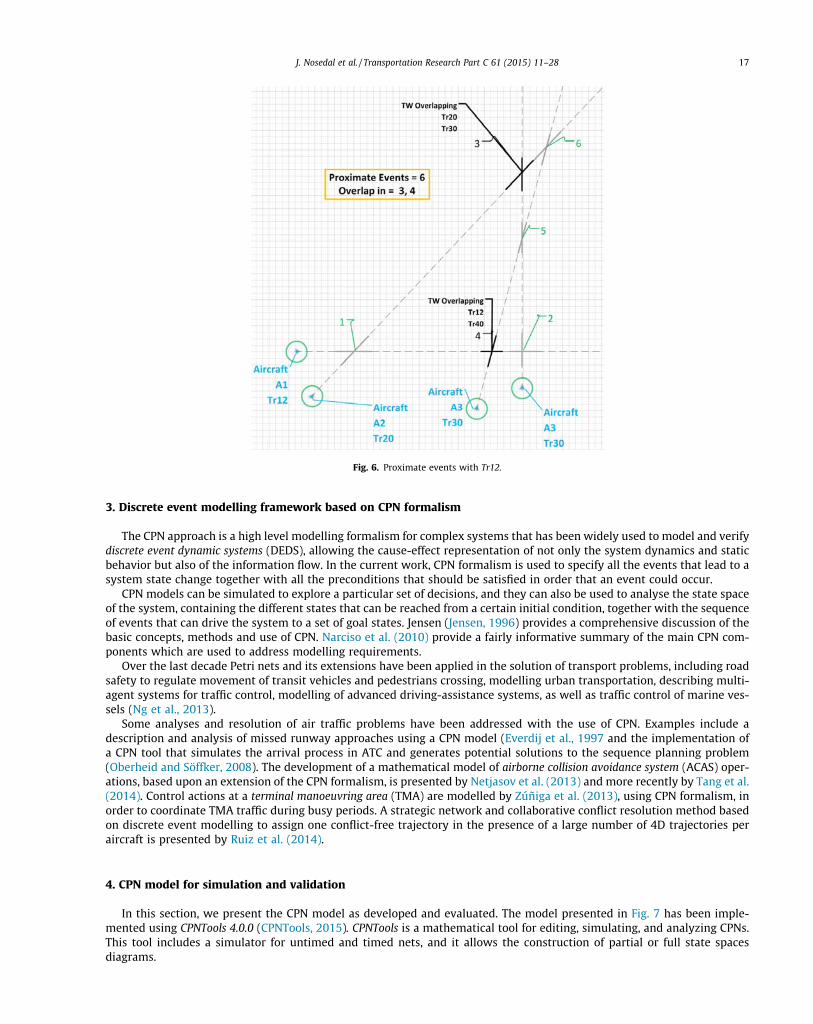
3. Discrete event modelling framework based on CPN formalism
The CPN approach is a high level modelling formalism for complex systems that has been widely used to model and verifydiscrete event dynamic systems (DEDS), allowing the cause-effect representation of not only the system dynamics and staticbehavior but also of the information flow. In the current work, CPN formalism is used to specify all the events that lead to asystem state change together with all the preconditions that should be satisfied in order that an event could occur.
CPN models can be simulated to explore a particular set of decisions, and they can also be used to analyse the state spaceof the system, containing the different states that can be reached from a certain initial condition, together with the sequenceof events that can drive the system to a set of goal states. Jensen (Jensen, 1996) provides a comprehensive discussion of thebasic concepts, methods and use of CPN. Narciso et al. (2010) provide a fairly informative summary of the main CPN com-ponents which are used to address modelling requirements.
Over the last decade Petri nets and its extensions have been applied in the solution of transport problems, including roadsafety to regulate movement of transit vehicles and pedestrians crossing, modelling urban transportation, describing multi-agent systems for traffic control, modelling of advanced driving-assistance systems, as well as traffic control of marine ves-sels (Ng et al., 2013).
Some analyses and resolution of air traffic problems have been addressed with the use of CPN. Examples include adescription and analysis of missed runway approaches using a CPN model (Everdij et al., 1997 and the implementation ofa CPN tool that simulates the arrival process in ATC and generates potential solutions to the sequence planning problem(Oberheid and Söffker, 2008). The development of a mathematical model of airborne collision avoidance system (ACAS) oper-ations, based upon an extension of the CPN formalism, is presented by Netjasov et al. (2013) and more recently by Tang et al.(2014). Control actions at a terminal manoeuvring area (TMA) are modelled by Zúñiga et al. (2013), using CPN formalism, inorder to coordinate TMA traffic during busy periods. A strategic network and collaborative conflict resolution method basedon discrete event modelling to assign one conflict-free trajectory in the presence of a large number of 4D trajectories peraircraft is presented by Ruiz et al. (2014).
4. CPN model for simulation and validation
In this section, we present the CPN model as developed and evaluated. The model presented in Fig. 7 has been imple-mented using CPNTools 4.0.0 (CPNTools, 2015). CPNTools is a mathematical tool for editing, simulating, and analyzing CPNs.This tool includes a simulator for untimed and timed nets, and it allows the construction of partial or full state spacesdiagrams.
Fig. 6. Proximate events with Tr12.
J. Nosedal et al. / Transportation Research Part C 61 (2015) 11–28 17
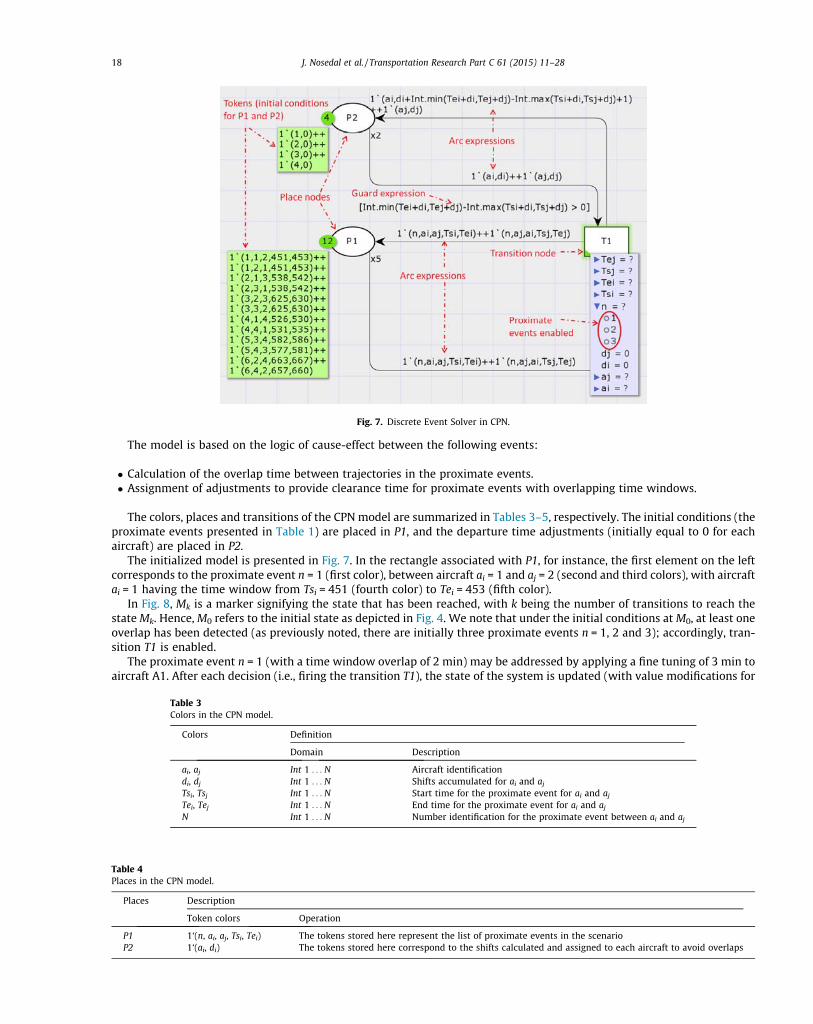
The model is based on the logic of cause-effect between the following events:
� Calculation of the overlap time between trajectories in the proximate events.� Assignment of adjustments to provide clearance time for proximate events with overlapping time windows.
The colors, places and transitions of the CPNmodel are summarized in Tables 3–5, respectively. The initial conditions (theproximate events presented in Table 1) are placed in P1, and the departure time adjustments (initially equal to 0 for eachaircraft) are placed in P2.
The initialized model is presented in Fig. 7. In the rectangle associated with P1, for instance, the first element on the leftcorresponds to the proximate event n = 1 (first color), between aircraft ai = 1 and aj = 2 (second and third colors), with aircraftai = 1 having the time window from Tsi = 451 (fourth color) to Tei = 453 (fifth color).
In Fig. 8, Mk is a marker signifying the state that has been reached, with k being the number of transitions to reach thestateMk. Hence,M0 refers to the initial state as depicted in Fig. 4. We note that under the initial conditions atM0, at least oneoverlap has been detected (as previously noted, there are initially three proximate events n = 1, 2 and 3); accordingly, tran-sition T1 is enabled.
The proximate event n = 1 (with a time window overlap of 2 min) may be addressed by applying a fine tuning of 3 min toaircraft A1. After each decision (i.e., firing the transition T1), the state of the system is updated (with value modifications for
Fig. 7. Discrete Event Solver in CPN.
Table 3Colors in the CPN model.
Colors Definition
Domain Description
ai, aj Int 1 . . . N Aircraft identificationdi, dj Int 1 . . . N Shifts accumulated for ai and ajTsi, Tsj Int 1 . . . N Start time for the proximate event for ai and ajTei, Tej Int 1 . . . N End time for the proximate event for ai and ajN Int 1 . . . N Number identification for the proximate event between ai and aj
Table 4Places in the CPN model.
Places Description
Token colors Operation
P1 1‘(n, ai, aj, Tsi, Tei) The tokens stored here represent the list of proximate events in the scenarioP2 1‘(ai, di) The tokens stored here correspond to the shifts calculated and assigned to each aircraft to avoid overlaps
18 J. Nosedal et al. / Transportation Research Part C 61 (2015) 11–28
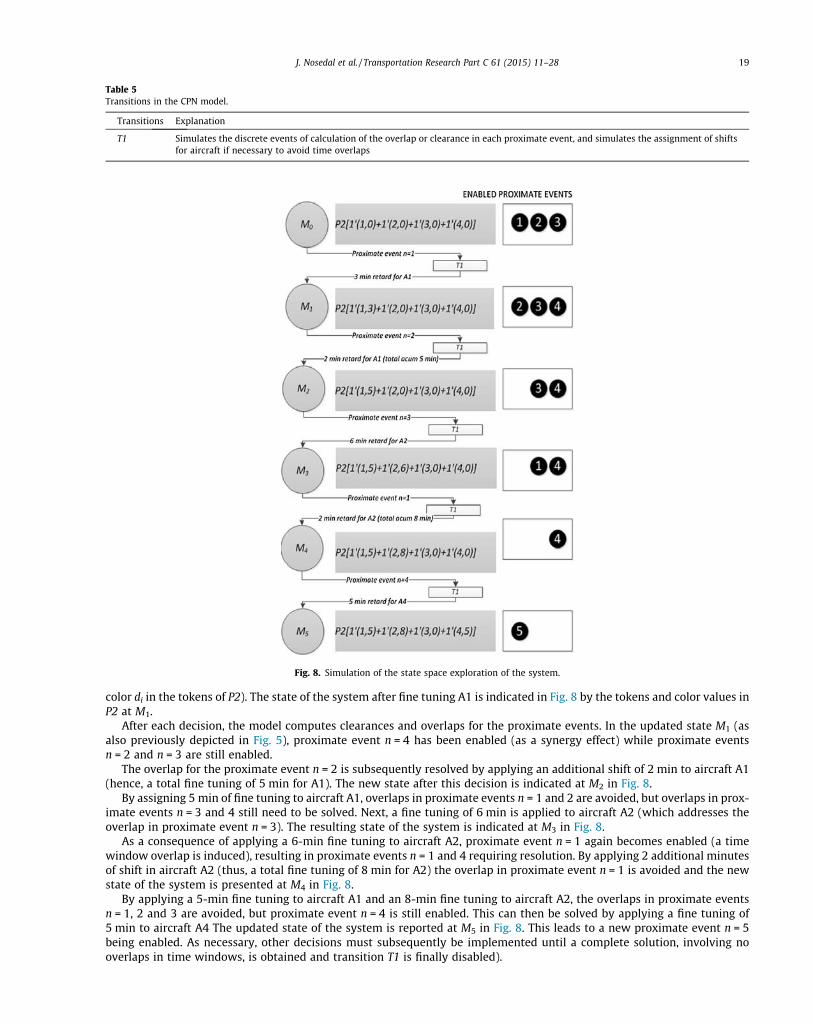
color di in the tokens of P2). The state of the system after fine tuning A1 is indicated in Fig. 8 by the tokens and color values inP2 at M1.
After each decision, the model computes clearances and overlaps for the proximate events. In the updated state M1 (asalso previously depicted in Fig. 5), proximate event n = 4 has been enabled (as a synergy effect) while proximate eventsn = 2 and n = 3 are still enabled.
The overlap for the proximate event n = 2 is subsequently resolved by applying an additional shift of 2 min to aircraft A1(hence, a total fine tuning of 5 min for A1). The new state after this decision is indicated at M2 in Fig. 8.
By assigning 5 min of fine tuning to aircraft A1, overlaps in proximate events n = 1 and 2 are avoided, but overlaps in prox-imate events n = 3 and 4 still need to be solved. Next, a fine tuning of 6 min is applied to aircraft A2 (which addresses theoverlap in proximate event n = 3). The resulting state of the system is indicated at M3 in Fig. 8.
As a consequence of applying a 6-min fine tuning to aircraft A2, proximate event n = 1 again becomes enabled (a timewindow overlap is induced), resulting in proximate events n = 1 and 4 requiring resolution. By applying 2 additional minutesof shift in aircraft A2 (thus, a total fine tuning of 8 min for A2) the overlap in proximate event n = 1 is avoided and the newstate of the system is presented at M4 in Fig. 8.
By applying a 5-min fine tuning to aircraft A1 and an 8-min fine tuning to aircraft A2, the overlaps in proximate eventsn = 1, 2 and 3 are avoided, but proximate event n = 4 is still enabled. This can then be solved by applying a fine tuning of5 min to aircraft A4 The updated state of the system is reported at M5 in Fig. 8. This leads to a new proximate event n = 5being enabled. As necessary, other decisions must subsequently be implemented until a complete solution, involving nooverlaps in time windows, is obtained and transition T1 is finally disabled).
Table 5Transitions in the CPN model.
Transitions Explanation
T1 Simulates the discrete events of calculation of the overlap or clearance in each proximate event, and simulates the assignment of shiftsfor aircraft if necessary to avoid time overlaps
Fig. 8. Simulation of the state space exploration of the system.
J. Nosedal et al. / Transportation Research Part C 61 (2015) 11–28 19

By simulation in CPNTools, it is possible to explore the state space and find different solutions by way of a ‘reachabilitytree’. In Fig. 9, the reachability tree’s final states, denoted by Mx, My and Mz, which constitute the set of feasible solutionsfor the proposed scenario, are presented. For instance, a feasible solution Mx has been obtained by applying a fine tuningof 10 min to aircraft A1 and of 5 min to aircraft A2, as is observed in the state variables described by the tokens and colorsin P1 and P2. In each of these feasible solutions, all time window overlaps in proximate events are avoided.
5. Optimization models for analyzing and solving airspace demand–capacity imbalances
The CPN model that we developed appears to be effective in simulating the network effects, the decision making process,and the search for feasible solutions for the conceptual scenario. This DEDS approach makes it possible to formalize the rep-resentation and the analysis of events occurring within a dynamic system – in this case, the spatial and temporal interactionsand their effects, as well as their logical sequence of occurrence (Ruiz et al., 2014).
Various simulation–optimization methodologies and approaches have been developed to combine the capability of sim-ulation models to be highly descriptive of systems being simulated with the benefits of analytical optimization techniques(Zuñiga et al., 2011; Narciso et al., 2012). Because of the extreme complexity associated with solving time adjustment allo-cation problems and the difficulty in finding solutions to large-scale problems within a reasonable computational time, theDEDS approach is implemented using constraint programming (CP). CP is a technology for solving combinatorial optimizationproblems (Rossi et al., 2006; Milano, 2012). Mathematical programming is based upon a model and run paradigm, relying ona simple vocabulary and standard formats to model problems (Wolsey and Nemhauser, 1999). CP, on the other hand, fea-tures a model and search paradigm, requiring rich modelling languages with combinatorial objects and having ‘‘a distinctiveflavor of programming” (Michel, 2012). A major generic challenge facing CP is scalability (Perron et al., 2004), with problemsto which it is usually applied being NP-hard.
Assessment in modelling constraints is understandably a critical issue for CP. An excess of constraints may lead to failureto reach a solution, while a lack of constraints will increase the scenarios to be computed. The use of redundant constraints,on the other hand, will not contribute in any real way. One of the primary methods for building and quantifying confidencein the constraints is verification and validation (V&V) and the sensitivity analysis of computational simulations. In the sim-ulation community, verification can be seen as the assessment of the accuracy of the solution to a computational modelby comparison with known solutions, while validation may be viewed as the assessment of the accuracy of a computationalsimulation by comparison with experimental data. However, in the CP area, the validation of the constraint model shouldcheck the state space of the problem solution. Since CP is usually embedded in declarative programming, the user neednot write an algorithm to solve the problem but need only model the problem to be solved. Therefore, once the modelhas been generated and validated (in the current case, the CPN model and simulation results), CP can be used even withoutrequiring the constant intervention of an expert to steer the optimization process. This methodology has been successfullyapplied to model and optimize flexible manufacturing systems (Riera et al., 2002). It must be noted that a full understandingof the constraint effects on the search space together with a formal state space analysis are the key aspects in facing the scal-ability issue when applying the model to much larger scenarios.
Let C ¼ ½Int:minðTei þ di; Tej þ djÞ � Int:maxðTsi þ di; Tsj þ djÞ�, where di and dj represent the fine tuning for aircraft ai andaj, respectively; Int.min(�) is a function which outputs the smaller of two exit time stamps; and Int.max(�) is a function whichoutputs the larger of two start time stamps.
C is defined to enable fine tuning for those proximate events with an overlap in time windows. On the one hand, whenC > 0, an overlap clearly occurs; on the other hand, there is no overlap when C 6 0. We accordingly establish a set of con-straints (one for each pair of proximate events) of the form:
C 6 S ð1Þ
where S 6 0, with its magnitude |S| being the required time separation or minimum clearance. In the CPNmodel presented inSection 4, the guard expression for the transition T1 takes the form C > 0, specifically in order to detect the overlaps. In the
Fig. 9. Final states arrived at by exploration of reachability tree.
20 J. Nosedal et al. / Transportation Research Part C 61 (2015) 11–28
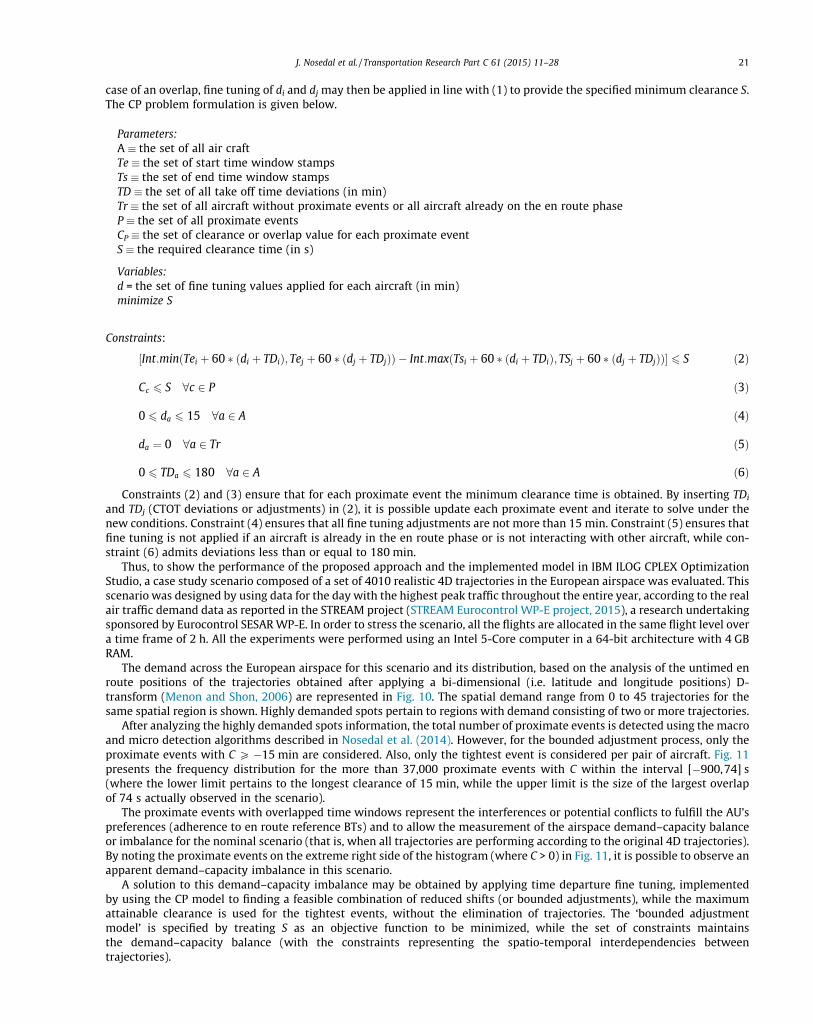
case of an overlap, fine tuning of di and dj may then be applied in line with (1) to provide the specified minimum clearance S.The CP problem formulation is given below.
Parameters:A � the set of all air craftTe � the set of start time window stampsTs � the set of end time window stampsTD � the set of all take off time deviations (in min)Tr � the set of all aircraft without proximate events or all aircraft already on the en route phaseP � the set of all proximate eventsCP � the set of clearance or overlap value for each proximate eventS � the required clearance time (in s)
Variables:d = the set of fine tuning values applied for each aircraft (in min)minimize S
Constraints:
½Int:minðTei þ 60 � ðdi þ TDiÞ; Tej þ 60 � ðdj þ TDjÞÞ � Int:maxðTsi þ 60 � ðdi þ TDiÞ; TSj þ 60 � ðdj þ TDjÞÞ� 6 S ð2Þ
Cc 6 S 8c 2 P ð3Þ
0 6 da 6 15 8a 2 A ð4Þ
da ¼ 0 8a 2 Tr ð5Þ
0 6 TDa 6 180 8a 2 A ð6Þ
Constraints (2) and (3) ensure that for each proximate event the minimum clearance time is obtained. By inserting TDi
and TDj (CTOT deviations or adjustments) in (2), it is possible update each proximate event and iterate to solve under thenew conditions. Constraint (4) ensures that all fine tuning adjustments are not more than 15 min. Constraint (5) ensures thatfine tuning is not applied if an aircraft is already in the en route phase or is not interacting with other aircraft, while con-straint (6) admits deviations less than or equal to 180 min.
Thus, to show the performance of the proposed approach and the implemented model in IBM ILOG CPLEX OptimizationStudio, a case study scenario composed of a set of 4010 realistic 4D trajectories in the European airspace was evaluated. Thisscenario was designed by using data for the day with the highest peak traffic throughout the entire year, according to the realair traffic demand data as reported in the STREAM project (STREAM Eurocontrol WP-E project, 2015), a research undertakingsponsored by Eurocontrol SESARWP-E. In order to stress the scenario, all the flights are allocated in the same flight level overa time frame of 2 h. All the experiments were performed using an Intel 5-Core computer in a 64-bit architecture with 4 GBRAM.
The demand across the European airspace for this scenario and its distribution, based on the analysis of the untimed enroute positions of the trajectories obtained after applying a bi-dimensional (i.e. latitude and longitude positions) D-transform (Menon and Shon, 2006) are represented in Fig. 10. The spatial demand range from 0 to 45 trajectories for thesame spatial region is shown. Highly demanded spots pertain to regions with demand consisting of two or more trajectories.
After analyzing the highly demanded spots information, the total number of proximate events is detected using the macroand micro detection algorithms described in Nosedal et al. (2014). However, for the bounded adjustment process, only theproximate events with C P �15 min are considered. Also, only the tightest event is considered per pair of aircraft. Fig. 11presents the frequency distribution for the more than 37,000 proximate events with C within the interval [�900,74] s(where the lower limit pertains to the longest clearance of 15 min, while the upper limit is the size of the largest overlapof 74 s actually observed in the scenario).
The proximate events with overlapped time windows represent the interferences or potential conflicts to fulfill the AU’spreferences (adherence to en route reference BTs) and to allow the measurement of the airspace demand–capacity balanceor imbalance for the nominal scenario (that is, when all trajectories are performing according to the original 4D trajectories).By noting the proximate events on the extreme right side of the histogram (where C > 0) in Fig. 11, it is possible to observe anapparent demand–capacity imbalance in this scenario.
A solution to this demand–capacity imbalance may be obtained by applying time departure fine tuning, implementedby using the CP model to finding a feasible combination of reduced shifts (or bounded adjustments), while the maximumattainable clearance is used for the tightest events, without the elimination of trajectories. The ‘bounded adjustmentmodel’ is specified by treating S as an objective function to be minimized, while the set of constraints maintainsthe demand–capacity balance (with the constraints representing the spatio-temporal interdependencies betweentrajectories).
J. Nosedal et al. / Transportation Research Part C 61 (2015) 11–28 21

Experiments were conducted with different allowable shift values – i.e., upper limits dmax of the interval [0, dmax] for CTOTtime adjustment. Applying this alternative approach to the case study scenario, the computed required clearance time had aminimummagnitude of 47 s (S = �47) corresponding to dmax = 15 min. In Table 6, the allowable shift values tested in twelveexperiments (starting from 15 min, and being reduced by 1 min at a time) and the corresponding minimum clearance timesare summarized.
In Fig. 12, each of the reference values of S (ranging between 0 and �47 s) from the first twelve experiments is plottedagainst the associated upper limit dmax of shift times. The resulting simple regression line is S = 13.70 � 4.126 � dmax. Thecoefficient of determination R2 and p-value for the slope (as reported in Fig. 12) suggest a highly significant linear relation-ship between the upper limit for allowable CTOT time adjustments (dmax) and the required minimum clearance time (themagnitude of S), with 99.1% of the variation in S explained by the variation in dmax.
In Fig. 13, the frequency distributions of CTOT time adjustments (in min) are presented for twelve different dmax values.Fig. 14 presents the resulting distribution profiles of the variable C (as previously defined) for each corresponding dmax, per-taining to experiments 1–12, respectively (left to right and up to down).
In general, from Figs. 13 and 14, it is possible to observe that the system absorbs the overlapping without ‘‘tightening”effects for the global scenario (wherein a disturbingly high concentration on the extreme right side of the distribution his-togram occurs). The solutions appear to provide a more robust traffic network, increasing the clearances between proximateevents, after the bounded adjustments.
For instance, in the first experiment, as shown in Figs. 13 and 14, CTOT time adjustment values di are computed within theallowable shift interval [0,15] min, and the demand–capacity imbalance is solved by adjusting 57% of the departures (di = 0for 1739, or 43%, of the 4010 trajectories). The attained clearance for the tightest events is 47 s, and the interval for C in thisscenario is [�47,�1680] s.
Fig. 10. Highly demanded spots distribution over Europe.
C
Freq
uen
cy
0-130-260-390-520-650-780-910
1200
1000
800
600
400
200
0
Distribution of C
Fig. 11. Frequency distribution of clearances and overlaps in the 37,252 proximate events.
22 J. Nosedal et al. / Transportation Research Part C 61 (2015) 11–28
In the last experiment (C12), as shown in Figs. 13 and 14, the di values are computed within the interval [0,4] min, and thedemand–capacity imbalance is solved by adjusting just under 41% of the departures (di = 0 for 2369, or roughly 59%, of thetrajectories). The resulting clearances are in the interval [0,�1050] s, with the tightest proximate events having ‘‘0” second ofoverlap between time windows.
From Figs. 11 and 14, the shifting process on the distribution of C is observable, moving toward the left side away from aconcentration of proximate events on the right side. Also observable is an apparent reduction in the volume of tight prox-imate events on the extreme right side after the bounded adjustment; in other words, we observe, global robustness withoutlocal tightening effects for all the experiments.
By using CTOT time adjustments within [0,15] min, the complete set of trajectories is handled with the same airspacedistribution, but without time window overlaps (S = �47 s), while all the AUs’ preferences (slots and agreed upon referenceBTs) are satisfied. Thus, by means of the bounded adjustment model, a global solution with positive effects in terms of air-space demand–capacity balance is provided, but this solution does not achieve the separation minima (i.e. S = �105 s) toabsorb longitudinal deviations due to the wind.
To estimate the amount of aircraft trajectories that prohibit the AUs’ demands from being satisfied without applying anyregulation, the original set of constraints (time window information) is modified by introducing new variables in the con-straint expressions. For each trajectory a, a = 1, 2, . . . , N, a Boolean variable Ka, is introduced to enable or disable detectedproximate events. Ka = 1 means elimination (i.e., flight level change) or blockage of trajectory j, while Ka = 0 indicates thatthe trajectory is still in the scenario (i.e., original flight level). Additionally, an objective function is defined to determinethe minimum amount of delays
Pdi, for i = 1, 2, . . . , N, while a minimum clearance S is specified (representing an additional
constraint). By way of these modifications, the model allows the computation of the maximum number of aircraft to handlewithout applying any other regulation, but at the same time putting in place a set of clearances for the proximate events witha minimum time separation of S. This is done while preserving the AUs’ BT preferences which are possible to fulfill.
Table 6CTOT time adjustment results.
Experiment No. ofaircraft
N (proximateevents)
Adjustment interval(min)
Sum of Ka = 0(aircraft)
Sum of Ka = 1(aircraft)
S (s) Sum of da(min)
Run time(s)
1a 4010 37,252 [0, 15] – – �47 12,609 169.82a 4010 37,252 [0, 14] – – �42 11,770 49.83a 4010 37,252 [0, 13] – – �40 10,902 43.24a 4010 37,252 [0, 12] – – �36 9760 665a 4010 37,252 [0, 11] – – �33 9048 46.86a 4010 37,252 [0, 10] – – �29 8087 37.87a 4010 37,252 [0, 9] – – �25 7309 37.28a 4010 37,252 [0, 8] – – �20 6379 399a 4010 37,252 [0, 7] – – �16 5697 34.210a 4010 37,252 [0, 6] – – �12 5415 52.811a 4010 37,252 [0, 5] – – �6 4110 64.612a 4010 37,252 [0, 4] – – 0 3281 6913 4010 37,252 [0, 15] 2123 1887 �120 0 10.8914 1887 16,339 [0, 15] 879 1008 �120 0 9.5715 1008 15,116 [0, 15] 10 998 �120 0 9.1416 998 14,195 [0, 15] 8 990 �120 0 8.2217a 1008 15,116 [0, 15] – – �65 7583 15.0218a 998 14,195 [0, 15] – – �68 7532 96.86
a Solutions obtained by applying the first model (i.e., only fine tuning).
Fig. 12. Fitted line plot between S and the maximum CTOT time adjustment (dmax) allowed in the solution.
J. Nosedal et al. / Transportation Research Part C 61 (2015) 11–28 23

Frequency
14121086420
1600
800
014121086420
2000
1000
0121086420
2000
1000
0121086420
2000
1000
0
1086420
2000
1000
01086420
2000
1000
086420
2000
1000
086420
2000
1000
0
76543210
2000
1000
06543210
2000
1000
0543210
2000
1000
043210
2000
1000
0
S=-47 @dmax=15 S=-42@dmax=14 S=-40 @dmax=13 S=-36 @dmax=12
S=-33 @dmax=11 S=-29 @dmax=10 S=-25 @dmax=9 S=-20 @dmax=8
S=-16 @dmax=7 S=-12 @dmax=6 S=-8 @dmax=5 S=0 @dmax=4
Fig. 13. Frequency distribution for the CTOT time adjustments for the 12 experiments.
Frequency
-240
-480
-720
-960
-120
0-1
440
-168
0
1600
800
0
-220
-440
-660
-880
-110
0-1
320
-154
0-1
760
1600
800
0
-220
-440
-660
-880
-110
0-1
320
-154
0
1600
800
0
-220
-440
-660
-880
-110
0-1
320
-154
0
1600
800
0
-200
-400
-600
-800
-100
0-1
200
-140
0
1600
800
00
-200
-400
-600
-800
-100
0-1
200
-140
0
1600
800
00
-200
-400
-600
-800
-100
0-1
200
-140
0
1600
800
00
-180
-360
-540
-720
-900
-108
0-1
260
1600
800
0
0-1
80-3
60-5
40-7
20-9
00-1
080
-126
0
1000
500
00
-170
-340
-510
-680
-850
-102
0-1
190
800
400
00
-160
-320
-480
-640
-800
-960
-112
0
800
400
00
-150
-300
-450
-600
-750
-900
-105
0
800
400
0
C1 C2 C3 C4
C5 C6 C7 C8
C9 C10 C11 C12
Fig. 14. Frequency distribution for the C after bounded adjustment for the 12 experiments.
24 J. Nosedal et al. / Transportation Research Part C 61 (2015) 11–28
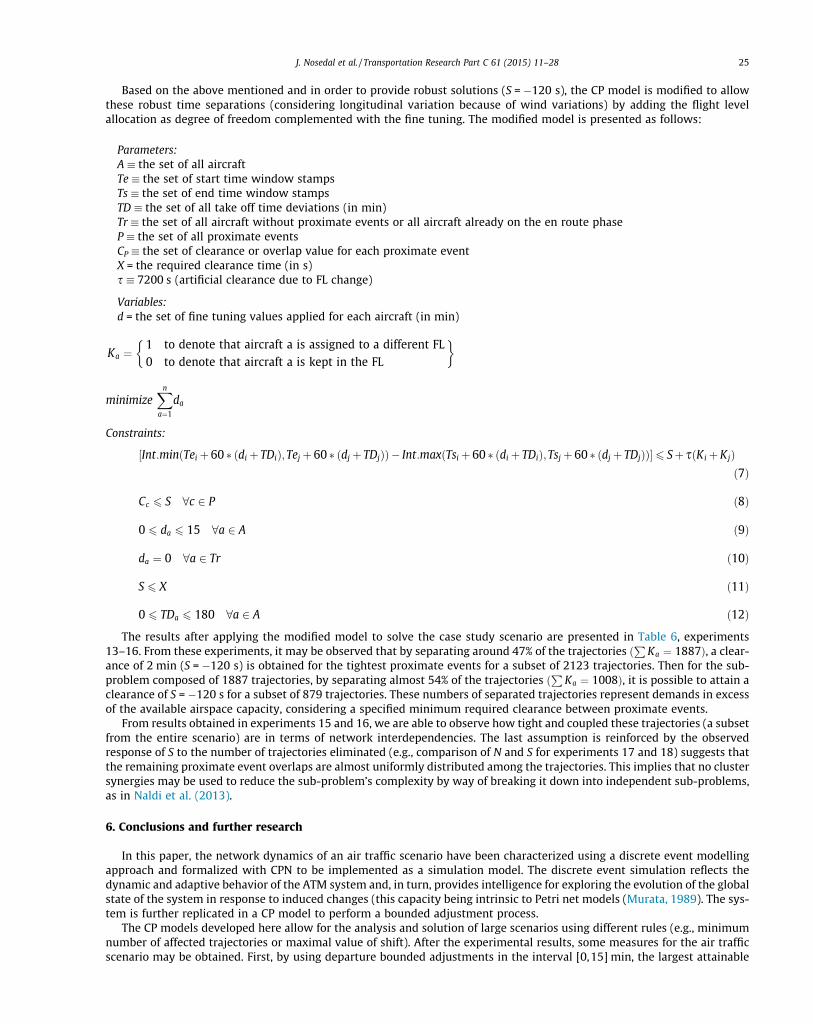
Based on the above mentioned and in order to provide robust solutions (S = �120 s), the CP model is modified to allowthese robust time separations (considering longitudinal variation because of wind variations) by adding the flight levelallocation as degree of freedom complemented with the fine tuning. The modified model is presented as follows:
Parameters:A � the set of all aircraftTe � the set of start time window stampsTs � the set of end time window stampsTD � the set of all take off time deviations (in min)Tr � the set of all aircraft without proximate events or all aircraft already on the en route phaseP � the set of all proximate eventsCP � the set of clearance or overlap value for each proximate eventX = the required clearance time (in s)s � 7200 s (artificial clearance due to FL change)
Variables:d = the set of fine tuning values applied for each aircraft (in min)
Ka ¼1 to denote that aircraft a is assigned to a different FL0 to denote that aircraft a is kept in the FL
� �
minimizeXna¼1
da
Constraints:
½Int:minðTei þ60 � ðdi þ TDiÞ;Tej þ 60 � ðdj þ TDjÞÞ � Int:maxðTsi þ 60 � ðdi þ TDiÞ;Tsj þ 60 � ðdj þ TDjÞÞ�6 Sþ sðKi þKjÞð7Þ
Cc 6 S 8c 2 P ð8Þ
0 6 da 6 15 8a 2 A ð9Þ
da ¼ 0 8a 2 Tr ð10Þ
S 6 X ð11Þ
0 6 TDa 6 180 8a 2 A ð12Þ
The results after applying the modified model to solve the case study scenario are presented in Table 6, experiments13–16. From these experiments, it may be observed that by separating around 47% of the trajectories ð
PKa ¼ 1887Þ, a clear-
ance of 2 min (S = �120 s) is obtained for the tightest proximate events for a subset of 2123 trajectories. Then for the sub-problem composed of 1887 trajectories, by separating almost 54% of the trajectories ð
PKa ¼ 1008Þ, it is possible to attain a
clearance of S = �120 s for a subset of 879 trajectories. These numbers of separated trajectories represent demands in excessof the available airspace capacity, considering a specified minimum required clearance between proximate events.
From results obtained in experiments 15 and 16, we are able to observe how tight and coupled these trajectories (a subsetfrom the entire scenario) are in terms of network interdependencies. The last assumption is reinforced by the observedresponse of S to the number of trajectories eliminated (e.g., comparison of N and S for experiments 17 and 18) suggests thatthe remaining proximate event overlaps are almost uniformly distributed among the trajectories. This implies that no clustersynergies may be used to reduce the sub-problem’s complexity by way of breaking it down into independent sub-problems,as in Naldi et al. (2013).
6. Conclusions and further research
In this paper, the network dynamics of an air traffic scenario have been characterized using a discrete event modellingapproach and formalized with CPN to be implemented as a simulation model. The discrete event simulation reflects thedynamic and adaptive behavior of the ATM system and, in turn, provides intelligence for exploring the evolution of the globalstate of the system in response to induced changes (this capacity being intrinsic to Petri net models (Murata, 1989). The sys-tem is further replicated in a CP model to perform a bounded adjustment process.
The CP models developed here allow for the analysis and solution of large scenarios using different rules (e.g., minimumnumber of affected trajectories or maximal value of shift). After the experimental results, some measures for the air trafficscenario may be obtained. First, by using departure bounded adjustments in the interval [0,15] min, the largest attainable
J. Nosedal et al. / Transportation Research Part C 61 (2015) 11–28 25

minimum clearance is 47 s, while still preserving the slots allocated for departures. For this solution, less than 60% of theflight departure times require adjustment. Alternatively, the minimum allowable clearance (S = 0) is attained by applyingdeparture bounded adjustments in the interval [0,4] min, in this case with adjustments for 41% of the flight departure times.
Based on the analysis of all proximate events and their associated time window stamps, the computed distribution his-togram for the values of C (overlaps and clearances), is proposed as an estimator or reference measure of the airspacedemand–capacity imbalances. Based on this profile distribution for the clearances and overlaps, it is possible to obtain bothqualitative and quantitative descriptions of the potential capability to absorb the overlaps by application of departure timebounded adjustments. The proposed bounded adjustment model provides an extra degree of freedom to tackle congestedscenarios in which some network dynamics may be induced when spatio-temporal analysis is not applied.
Despite all of the technological and management efforts developed in the SESAR and NextGen framework, 4D referenceBTs are subject to different types of perturbations and uncertainties that can provoke some differences between the plannedintended trajectories and the trajectories actually flown. To deliver more robust solutions, the model is extended to applyflight level allocation for those cases where the time separation is not achieved by means of the fine tuning or to providemore robust solutions. By means of applying the flight allocation level as an extra degree of freedom is possible to solve partof the scenario demand imbalance and decouple from the entire scenario smaller and independent sub-problems. Furtherresearch should be conducted to consider and include tactical mechanisms like bounded speed adjustments.
In terms of equity and fairness, by using this departure bounded adjustment in conjunction with robust slot assignmentprocedures (Pellegrini et al., 2012; Narciso and Piera, 2015), AUs do not incur extra costs, because the solutions proposedpreserve the reference BTs, which specify the preferred slots at airport as well as the 4D trajectories. From a network per-spective, the bounded adjustment approach is an effective tool to relax tight interdependencies between trajectories, pre-serving the original trajectories’ geometric profiles (AUs’ preferences).
However, it is well accepted that a major limitation of current ATM systems is the lack of effectiveness due to the limitedintegration between the layered planning decision support tools. For that reason truly effective application of this approach,or any other traffic management initiative, requires the integration with the surface decision support systems. Calculationsreported in Brinton and Lent (2012) indicate that approximately 15 min would be an appropriate queuing buffer for a depar-ture queue management system, which is consistent with the fine tuning model developed. By means of this integration, theproposed approach could contribute to a more efficient ATM by improving capacity management and probably shorteningATC workload supported by synergies between airside and landside (ground surface) management decisions.
Acronyms Meaning
4D or 4DT Trajectory described in terms of 3 spatial dimensions and time stamps 4-dimensional trajectoriesACAS airborne collision avoidance systemAFP airspace flow programATC air traffic controlATFM air traffic flow managementATM air traffic managementAU/AUs airspace user/usersBT business trajectoryCDQM collaborative departure queue managementCNS communication, navigation and surveillanceCP constraint programmingCPN coloured Petri netsCTOT calculated take-off timeDEDS discrete event dynamic systemsFL flight levelFMS Flight Management SystemGDP ground delay programNAS National Airspace SystemNextGen next generation air transportation systemNM nautical milesNP-Hard nondeterministic polynomial timeRBT Reference Business TrajectorySESAR Single European Sky ATM ResearchSTREAM Strategic Trajectory de-confliction to Enable seamless Aircraft conflict ManagementTBO trajectory based operationsTMA terminal manoeuvring areaV&V verification and validationWP-E Work Package E
26 J. Nosedal et al. / Transportation Research Part C 61 (2015) 11–28
Acknowledgement
This work was supported in part by the Ministry of Economy and Competitiveness in the project ‘‘Fire Guided UnmannedAircraft and Resources Distribution (FireGUARD)”, the CICYT Spanish program TIN2011-29494-C03-01, and the support ofCONACYT through the Scholarship program.
References
Agustín, A., Alonso-Ayuso, A., Escudero, L.F., Pizarro, C., 2010. Mathematical optimization models for air traffic flow management: a review. Stud. Inform.Univ. 8 (2), 141–184.
Berechet, I., Debouck, F., Castelli, L., Ranieri, A., Rihacek, C., 2009. A target windows model for managing 4-D trajectory-based operations. In: Proc. DigitalAvionics Systems Conference, October 2009, pp. 3.D.2-1-3.D.2-9.
Bhadra, D., Knorr, D.A., Levy, B., 2012. Benefits of virtual queuing at congested airports using ASDE-X: a case study of JFK airport. Air Traffic Control Quart. 20(3), 225–252.
Brinton, C., Lent, S., 2012. Departure queue management in the presence of traffic management initiatives. In: Proc. Integrated Communications, Navigationand Surveillance Conference, April 2012, pp. H5-1a-H5-13.
Brooker, P., 2008. SESAR and NextGen: investing in new paradigms. J. Nav. 61 (2), 195–208.National Business Aviation Association. ‘‘Airspace flow programs,” 2015. <https://www.nbaa.org/ops/airspace/tfm/tools/afp.php> [accessed in September
2015].Cai, K., Zhang, J., Zhou, C., Cao, X., Tang, K., 2012. Using computational intelligence for large scale air route networks design. Appl. Soft Comput. 12 (9), 2790–
2800.Castelli, L., Pesenti, R., Ranieri, A., 2011. Short-term allocation of Time Windows to flights through a distributed market-based mechanism. J. Aerosp. Oper. 1
(1), 29–40.Castelli, L., Pesenti, R., Ranieri, A., 2011. The design of a market mechanism to allocate air traffic flow management slots. Transport. Res. Part C: Emerg.
Technol. 19 (5), 931–943.Churchill, A.M., Lovell, D.J., 2012. Coordinated aviation network resource allocation under uncertainty. Transport. Res. Part E: Logist. Transport. Rev. 48 (1),
19–33.Cook, A.J., Tanner, G., Anderson, S., 2004. Evaluating the true cost to airlines of one minute of airborne or ground delay: final report. Report to Eurocontrol
Experimental Centre, University of Westminster.CPNTools, 2015. <http://cpntools.org/> [accessed in March 2015].D’Ariano, A., Pistelli, M., Pacciarelli, D., 2012. Aircraft retiming and rerouting in vicinity of airports. IET Intel. Transport Syst. 6 (4), 433–443.De Smedt, David, Bronsvoort, Jesper, McDonald, Greg, 2015. Model for longitudinal uncertainty during controlled time of arrival operations. In: Proc. of 11th
USA/Europe Air Traffic Management Research and Development Seminar.Delgado, L., Prats, X., 2011. Simulation of airborne ATFM delay and delay recovery by cruise speed reduction. In: First SESAR Innovation Days: Book of
Abstracts, Nov.–Dec. 2011, pp. 7.Deschinkel, K., Farges, J.-L., Delahaye, D., 2002. Optimizing and assigning price levels for air traffic management. Transport. Res. Part E: Logist. Transport.
Rev. 38 (3–4), 221–237.Enea, G., Porretta, M., 2012. A comparison of 4D-trajectory operations envisioned for NEXTGEN and SESAR, some preliminary findings. In Proc. of 28th
International Congress of the Aeronautical Sciences (ICAS).Eurocontrol. Report on Punctuality Drivers at Major European Airports, May 2005.European Commission Memo 13/666. European Commission invests €600 million in New Research to Unblock Congestion in Europe’s Airspace, European
Commission Memo 13/666, July 2013.Everdij, M.H.C., Blom, H.A.P., Klompstra, M.B., 1997. Dynamically coloured Petri nets for air traffic management safety purposes. In: Proc. 8th IFAC/IFIP/
IFORS Symposium on Transportation Systems, June 1997, pp. 169–174.Everdij, M.H.C., Scholte, J.J., Blom, H.A.P., Stroeve, S.H., 2011. An investigation of emergent behaviour viewpoints in literature, and their usability in air traffic
management. NLR Air Transport Safety Institute, Report No. NLR-TP-2011-444, July 2011.Farhadi, F., Ghoniem, A., Al-Salem, M., 2014. Runway capacity management – an empirical study with application to Doha International Airport. Transport.
Res. Part E: Logist. Transport. Rev. 68, 53–63.Greenwood, J., 2001. The sequencing of aircraft departures. In: Report of the 40th European Study Group with Industry, England.Helme, M.P., 1992. Reducing air traffic delay in a space-time network. In: Proc. IEEE International Conference on Systems, Man and Cybernetics, October
1992, pp. 236–242.Huang, S., Feron, E., Reed, G., Mao, Z.-H., 2014. Compact configuration of aircraft flows at intersections. IEEE Trans. Intell. Transport. Syst. 15 (2), 771–783.Idris, H.R., Anagnostakis, I., Delcaire, B., Hansman, R.J., Clarke, J.P., Feron, E., Odoni, A.R., 1999. Observations of departure processes at Logan Airport to
support the development of departure planning tools. Air Traffic Control 7 (4), 229–257.Jensen, K., 1996. Coloured petri nets: basic concepts, analysis methods and practical use. Monographs in Theoretical Computer Science, vol. 1. Springer.Klooster, J., De Smedt, D., 2011. Controlled time of arrival spacing analysis. In: Proc. of 9th USA/Europe Air Traffic Management Research and Development
Seminar, Berlin.Kopardekar, P, Rhodes, J., Schwartz, A., Magyarits, S., Willems, B., 2008. Relationship of maximum manageable air traffic control complexity and sector
capacity. In: Proc. 26th International Congress of the Aeronautical Sciences, September 2008, pp. 15–19.Manley, Bengi, Sherry, Lance, 2010. Analysis of performance and equity in ground delay programs. Transport. Res. Part C: Emerg. Technol. 18 (6), 910–920.Menon, P.K., Grabbe, Shon R., 2006. Multi-dimensional D-transform approach to modeling and control of the air traffic environment. In: AIAA Guidance,
Navegation and Control Conference, vol. 3, pp. 1724–1734.Michel, L.D., 2012. Constraint programming and a usability quest. In: Proc. 18th International Conference on Constraint Programming, October 2012, p. 1.Milano, M. (Ed.), 2012. Principles and Practice of Constraint Programming – Proc. 18th International Conference on Constraint Programming. Springer,
Berlin, Heidelberg.Montoya, J., Rathinam, S., Wood, Z., 2014. Multiobjective departure runway scheduling using dynamic programming. IEEE Trans. Intell. Transport. Syst. 15
(1), 399–413.Mori, R., 2013. Aircraft ground-taxiing model for congested airport using cellular automata. IEEE Trans. Intell. Transport. Syst. 14 (1), 180–188.Murata, T., 1989. Petri nets: properties, analysis and applications. Proc. IEEE 77 (4), 541–580.Naldi, M., Salcedo-Sanz, S., Carro-Calvo, L., Laura, L., Portilla-Figueras, A., Italiano, G.F., 2013. A traffic-based evolutionary algorithm for network clustering.
Appl. Soft Comput. 13 (11), 4303–4319.Narciso, M., Piera, M.A., 2015. Robust gate assignment procedures from an airport management perspective. OMEGA – Int. J. Manage. Sci. 50 (January), 82–
95.Narciso, M., Piera, M.A., Guasch, A., 2010. A methodology for solving logistic optimization problems through simulation. Simul.: Trans. Soc. Model. Simul.
Int. 86 (5–6), 369–389.Narciso, M., Piera, M.A., Guasch, A., 2012. A time stamp reduction method for state space exploration using colored Petri nets. Simul.: Trans. Soc. Model.
Simul. Int. 88 (5), 592–616.
J. Nosedal et al. / Transportation Research Part C 61 (2015) 11–28 27

Netjasov, F., Vidosavljevic, A., Tosic, V., Everdij, M.H.C., Blom, H.A.P., 2013. Development, validation and application of stochastically and dynamicallycoloured Petri net model of ACAS operations for safety assessment purposes. Transport. Res. Part C: Emerg. Technol. 33 (complete), 167–195.
NEXTGEN, 2015. <http://www.faa.gov/nextgen/> [accessed in March 2015].Ng, K.M., Reaz, M.B.I., Ali, M.A.M., 2013. A review on the applications of Petri nets in modeling, analysis, and control of urban traffic. IEEE Trans. Intell.
Transport. Syst. 14 (2), 858–870.Nosedal, J., Piera, M.A., Ruiz, S., Nosedal, A., 2014. An efficient algorithm for smoothing airspace congestion by fine-tuning take-off times. Transport. Res. Part
C: Emerg. Technol. 44, 171–184.Oberheid, H., Söffker, D., 2008. Cooperative arrival management in air traffic control – a coloured Petri net model of sequence planning. In: Applications and
Theory of Petri Nets – Proc. 29th International Conference on Petri Nets, June 2008, pp. 348–367.Pellegrini, P., Castelli, L., Pesenti, R., 2012. Metaheuristic algorithms for the simultaneous slot allocation problem. IET Intel. Transport Syst. 6 (4), 453–462.Perron, L., Shaw, P., Furnon, V., 2004. Propagation guided large neighborhood search. In: Proc. 10th International Conference on Constraint Programming, pp.
468–481.Prevot, T., Battiste, V., Palmer, E., Shelden, S., 2003. Air traffic concept utilizing 4D trajectories and airborne separation assistance. In: Proc. AIAA Guidance,
Navigation, and Control Conference, Paper No. AIAA-2003-5770-GNC, August 2003.Riera, D., Piera, M.A., Guasch, A., 2002. PN to CSP methodology: improved bounds. In: Escrig Monferrer, M.T., Toledo Lobo, F. (Eds.), Topics in Artificial
Intelligence. Springer-Verlag, Berlin, Heidelberg, pp. 145–158.Rodionova, O., Sbihi, M., Delahaye, D., Mongeau, M., 2014. North Atlantic aircraft trajectory optimization. IEEE Trans. Intell. Transport. Syst. 15 (5), 2202–
2212.Roling, P.C., Visser, H.G., 2008. Optimal airport surface traffic planning using mixed-integer linear programming. Int. J. Aerosp. Eng. 2008, 11.Rossi, F., van Beek, P., Walsh, T., 2006. Handbook of Constraint Programming. Elsevier.Ruiz, S., Piera, M.A., Del Pozo, I., 2013. A medium term conflict detection and resolution system for terminal maneuvering area based on spatial data
structures and 4D trajectories. Transport. Res. Part C: Emerg. Technol. 26, 396–417.Ruiz, S., Piera, M.A., Nosedal, J., Ranieri, A., 2014. Strategic de-confliction in the presence of a large number of 4D trajectories using a causal modeling
approach. Transport. Res. Part C: Emerg. Technol. 39 (complete), 129–147.SESAR. <http://ec.europa.eu/transport/modes/air/sesar/> [accessed in March 2015].STREAM Eurocontrol WP-E project. <http://hala-sesar.net/projects/stream> [accessed in March 2015].Tang, J., Piera, M.A., Ruiz, S., 2014. A causal model to explore the ACAS induced collisions. Proc. Inst. Mech. Eng. Part G: J. Aerosp. Eng. 228 (10).Tastambekov, K., Puechmorel, S., Delahaye, D., Rabut, C., 2014. Aircraft trajectory forecasting using local functional regression in Sobolev space. Transport.
Res. Part C: Emerg. Technol. 39, 1–22.Wandelt, S., Sun, X., 2015. Efficient compression of 4D-trajectory data in air traffic management. IEEE Trans. Intell. Transport. Syst. 16 (2), 844–853.Wei, P., Spiers, G., Sun, D., 2014. Algebraic connectivity maximization for air transportation networks. IEEE Trans. Intell. Transport. Syst. 15 (2), 685–698.Wolsey, L.A., Nemhauser, G.L., 1999. Integer and Combinatorial Optimization. Wiley-Interscience.Xiong, J., Hansen, M., 2013. Modelling airline flight cancellation decisions. Transport. Res. Part E: Logist. Transport. Rev. 56 (complete), 64–80.Zuñiga, C., Piera, M.A., Narciso, M., 2011. Revisiting the pallet loading problem using a discrete event system approach to minimise logistic costs. Int. J. Prod.
Res. 49 (8), 2243–2264.Zúñiga, C.A., Piera, M.A., Ruiz, S., Del Pozo, I., 2013. A CD&CR causal model based on path shortening/path stretching techniques. Transport. Res. Part C:
Emerg. Technol. 33 (complete), 238–256.
28 J. Nosedal et al. / Transportation Research Part C 61 (2015) 11–28
Chapter 5
Research summary, conclusions
and further research
5.1 Research summary
Based on the analysis of 4D trajectories an efficient algorithm for the macro and micro
detection of collective regions over Europe for a realistic and overstressed scenario was
presented. The proposed algorithm generates a microanalysis of interdependencies
between trajectories for large scenarios, thus providing a global scope and information
to improve the robustness of en route trajectories with respect to the surrounding
traffic.
The CP models developed in this research allow for the analysis and solution of
large scenarios using different rules (e.g., minimum number of affected trajectories
or maximal value of shift).
After the experimental results, some relevant indicators for the air traffic scenario
were obtained. Based on the analysis of all proximate events and their associated time
55
Chapter 5. Research summary, conclusions and further research
window stamps, the computed distribution histogram for the values of overlaps and
clearances, is proposed as an estimator or reference measure of the airspace demand
and capacity imbalances. Based on this profile distribution for the clearances and
overlaps, it is possible to obtain both qualitative and quantitative descriptions of the
potential capability to absorb the overlaps by application of departure time bounded
adjustments.
The proposed bounded adjustment model provides an extra degree of freedom
to tackle congested scenarios in which negative network dynamics may be induced
when spatio-temporal analysis is not considered.
In terms of equity and fairness, by using this departure bounded adjustment
in conjunction with robust slot assignment procedures [51][48], it is expected that
AUs do not incur extra costs, because the solutions proposed preserve the reference
BTs, which specify the preferred slots at airport as well as the 4D trajectories.
From a network perspective, the bounded adjustment approach is an effective tool to
relax tight interdependencies between trajectories, preserving the original trajectories
geometric profiles (AUs’ preferences).
Finally, in this research the initial CP model is extended to apply flight level
allocation for those cases where the time separation is not achieved by means of
the fine tuning, or to generate more robust solution, where the same approach was
applied to provide solutions increasing the minimal clearance time value between
proximate events. By means of applying the flight allocation level as an extra degree
of freedom it is possible to solve part of the scenario demand imbalance and decouple
from the entire scenario smaller and independent sub-problems.
56
Chapter 5. Research summary, conclusions and further research
5.2 Conclusions
Accordingly with the research motivation and objectives initially stated, the main
contributions of this thesis are the development of the models and tools that allows
the detection of all the en route potential spatial interdependencies between trajecto-
ries and the analysis of these interdependencies considering the global traffic network
under ideal conditions (i.e. weather perturbations to the RBT are not considered).
For the analysis of these interdependencies was developed and introduced a causal
model that allows the simulation of cooperative combination of the time stamp com-
ponent of the RBT agreed by the AU’s. Then by extending this approach, the
analysis and solution of congested scenarios is obtained by means of CP models,
where the obtained solutions allow the maximization of the clearance time between
potential proximate events.
For the proposed solutions in the congested scenarios new indicators were in-
troduced (i.e. hotspots quantifications, airspace hotspots distributions, overlap or
clearance time for potential proximate events, amount of interdependencies per tra-
jectory).
Based on the models developed and results obtained this research provides a
framework that could enable:
a. Integration by linking the land side with the air side considering the global
interdependencies.
b. Horizontal connectivity by linking the AUs business models (i.e. RBT) with
the ATFCM under a sustainable competitive services with the creation of an easily
extendable and adaptable robust cooperative DST dealing with feasible time stamp
agreements considering the TBO interdependencies under a network scope.
Besides this research promotes an incremental transformative approach to con-
57

Chapter 5. Research summary, conclusions and further research
solidate loose knowledge exploring the feasibility of a new process that could be
deployed as a TBO service, considering the importance of trajectory adherence and
the different disturbances and uncertainties that affect RBT’s.
5.3 Further research
By linking the land side with the air side to empower TBO as a flexible synchro-
nization mechanism several challenges arise and new research opportunities emerge,
such as:
• Implementation of a state space analysis tool in which any significant time
stamp change of a 4DT can be traced upstream and downstream to compute
its impact to the rest of RBT’s, providing the feasible variables domain values
in which the agreed trajectories will not require an ATC intervention.
• Development of DST using a trajectory predictor to evaluate the speed changes
combinations to improve clearance robustness at identified TBO interdepen-
dencies as a fine tuning algorithm to tackle uncertainty.
• Analysis and computation of the environmental impact of the TBO synchro-
nization approach (i.e. emission and fuel consumption)
• Analysis and identification of clustering trajectories (i.e. critical trajectories
that tighten the network due to their interdependencies).
• Integration with the surface decision support systems for validation and assess-
ment experiments (e.g. shadow mode trials).
58

Appendices
59
Appendix A
Paper III
In this paper, based on field data from two years of operations at a European Airport,
empirical evidence of the influence of arrival variability on departure delay flight for
short scheduled ground times (i.e., up to 60 minutes) is revisited, including three
types of arrival situations, on time, early and late. Based on the results obtained,
in this paper we provide evidence and quantification of the impact of early and late
arrivals on airport operations, with direct effect on gate assignment scheduling and
the turnaround process. Early arrivals are shown to generate higher airport opera-
tional disruptions compared with late arrivals that allow better reaction capacity to
compensate for the disturbances.
60

TITLE: “Revisiting the impact of flights’ arrival variability on departure punctuality: a
causal analysis of earliness landing” (1)
AUTHORS: Jenaro Nosedal-Sáncheza, Miquel A. Piera-Erolesb and Diederik Lebbinkc
a,b Technical Innovation Cluster on Aeronautical Management Universidad Autónoma de Barcelona, Spain. {jenaro.nosedal, miquelangel.piera}@uab.cat
c Ground Handling Operations Aviapartner, Belgium. [email protected]
ADRESS:
EMPRIUS 2, ESCOLA DE ENGINYERIA.
ZIP. CODE: 08202 SABADELL, SPAIN.
CORRESPONDING AUTHOR:
Jenaro Nosedal-Sánchez [email protected]
(1) Acknowledgments
This work is partially funded by the European Commission FP7 project INnovative
TEchnologies and Research for a new Airport Concept towards Turnaround
coordinatION (INTERACTION project). Web page: http://www.interaction-aero.eu. In
addition, J. Nosedal is supported by CONACYT through the Scholarship program.
Abstract
In this paper, based on field data from two years of operations at a European Airport, empirical
evidence of the influence of arrival variability on departure delay flight for short scheduled
ground times (i.e., up to 60 minutes) is revisited, including three types of arrival situations, “on
time”, “early” and “late”. For early and late arrivals, variability is measured together with the
extension of the Scheduled Ground Time (i.e., Actual Ground Time), and the number of
departure delay minutes recorded for the next departure (i.e., average departure delay) are
considered. The paper includes analysis, for a specific ground handler, of the compensation
capacity of the turnaround process when "late" arrival occurs. Based on the results obtained, in
this paper we provide evidence and quantification of the impact of early and late arrivals on
airport operations, with direct effect on gate assignment scheduling and the turnaround
process. Early arrivals are shown to generate higher airport operational disruptions compared
with late arrivals that allow better reaction capacity to compensate for the disturbances.
Keywords: air transportation, punctuality, variability, earliness impact, operational disruptions.
I. Introduction
Airport operational performance depends upon a number of factors as well as hidden
interdependencies between them, all of which affect runway capacity to some degree. In
addition to physical constraints, such as airport layout and infrastructure resources, several
tactical factors have an important impact at that operational level that can increase the airline
dwell time at the airport and introduce disturbances in aircraft departure sequence and the
sustainability of throughput.
Several indicators [1] and procedures [14] have been recently developed to mitigate the
effects of lack of integration of strategic, tactical and operational decision making tasks
[9][25][28][29]. A well accepted indicator for the operational performance of airlines and
airports is “punctuality”. Air transport punctuality is usually calculated as the rate of flights
delayed by more than 15 minutes compared to airline scheduled departure and arrival times.
Thus, two key values are usually measured [13] to evaluate punctuality:
Departure punctuality: the difference between the actual off block time and the scheduled off block time. Arrival punctuality: the difference between the actual on block time and the scheduled on block time.
In an air traffic context characterized by a high amount of tightly scheduled aircraft operating in a highly dynamic environment, it is not uncommon for flights to experience delays [21]. These delays lead to considerable losses for both the airlines in particular and society as a whole, which was estimated to be a staggering $41 billion annually in [30]. Flight delays’ economic impact spreads upstream and downstream on the value chain of the
airline market [6]:
On the demand side, passengers may factor in predicted delay times when choosing
among carriers. Increased delays add to the cost of travel and therefore, act to reduce
passenger demand.
On the supply side, increased delays force carriers to expand anticipated flight (block)
times, decrease aircraft utilization, and increase flight crew costs. These higher costs
lead to increased airfares.
Whereas in ground transportation the concept of reliability has been extensively studied,
literature in air transportation is scarce [19]. Punctuality is a valid indicator from a passenger
viewpoint. However, punctuality alone is not an appropriate indicator to measure and to
improve operational air transport reliability. It is better to focus on the variability of operations
and its consequences. [13]
The operational reliability of an airline network is the outcome of the interaction between
fixed schedules and the unpredictable stochastic dynamics [2] that affects flight at the
operational level. Airline schedules are designed and usually optimised to achieve the
maximum possible profits. A trade-off situation exists, wherein an airline tries to
utilise/optimise its resources (fleet and crew) while considering the flexibility/reliability of
scheduled operations. [36]
Most scientific literature focuses on the impact of "late" arrivals on the airport operation (gate
scheduling [12] and the scheduled ground time, including the turnaround process) and its
multiplicative factor, contributing to the generation of extra departure delays (i.e., analysis of
delay propagation [3]). In a traditional production planning approach [8], the main focus is
tackling tardiness because jobs that are not completed before their due date are the main
cause of revenue reduction, followed by a loss of reputation due to bad service quality factors
and worse the loss of a customer segment. [10]
More recently, the importance of earliness penalties have emerged in several industrial
planning policies such as those scheduling on a just-in-time (JIT) policy, enhancing the idea that
early as well as late delivery must be discouraged [32] due to the economic costs that can be
incurred in peak periods. The awareness of earliness has increased because jobs completed
early in an industrial context results in costly inventories, warehouse costs due to space
utilization and material handling operations and potential profit losses due to environmental
degradation of product quality [35].
In air transportation, early arrivals can put additional pressure on airport, airline, ATC and
handler resources: the local ATC has to cope with an unexpected demand profile both on the
airside during the descending operations and on the landside with a proper scheduling of
runways, taxiways and gates that are usually occupied longer than planned, and additional
resources that are needed to cope with the workload peak pressure (e.g., baggage handling).
Furthermore, early arrivals may have no gate available and may disrupt the ramp operations
by a re-scheduling of handling operations to remote positions [18]. More importantly, a
combination of late arrivals in the preceding period and of early arrivals in the following period
can lead to excess demand during a particular period [13] for all of the landside and airside
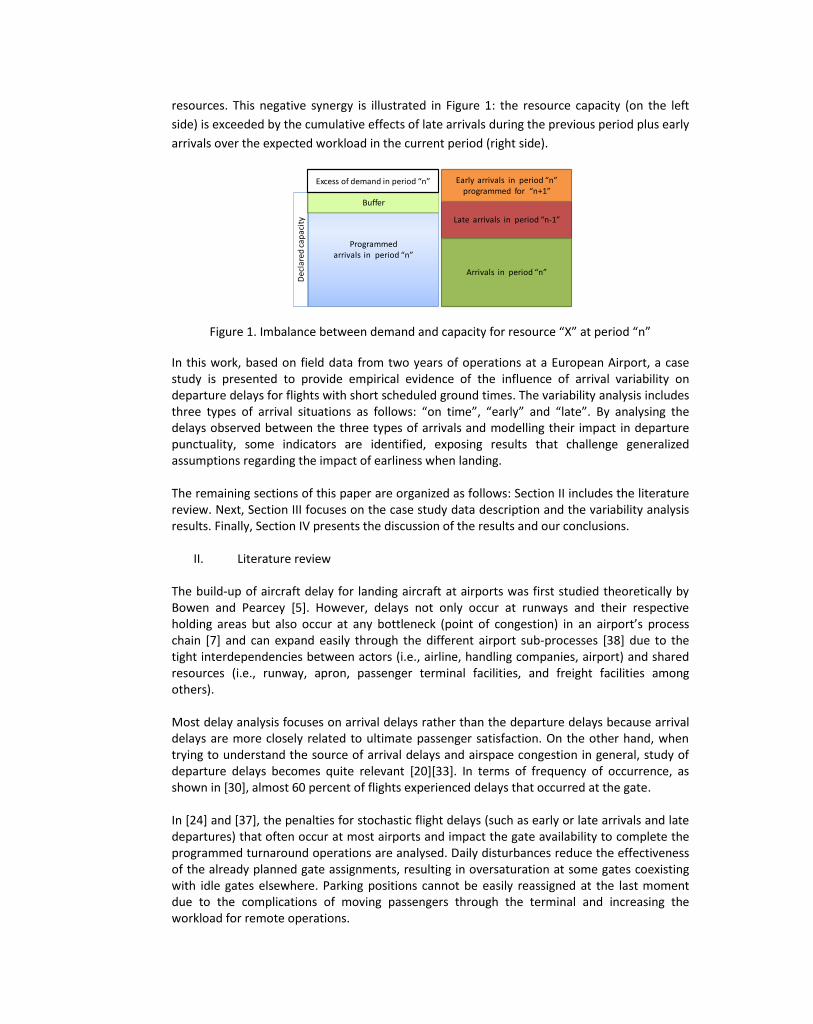
resources. This negative synergy is illustrated in Figure 1: the resource capacity (on the left
side) is exceeded by the cumulative effects of late arrivals during the previous period plus early
arrivals over the expected workload in the current period (right side).
Figure 1. Imbalance between demand and capacity for resource “X” at period “n”
In this work, based on field data from two years of operations at a European Airport, a case study is presented to provide empirical evidence of the influence of arrival variability on departure delays for flights with short scheduled ground times. The variability analysis includes three types of arrival situations as follows: “on time”, “early” and “late”. By analysing the delays observed between the three types of arrivals and modelling their impact in departure punctuality, some indicators are identified, exposing results that challenge generalized assumptions regarding the impact of earliness when landing. The remaining sections of this paper are organized as follows: Section II includes the literature review. Next, Section III focuses on the case study data description and the variability analysis results. Finally, Section IV presents the discussion of the results and our conclusions.
II. Literature review The build-up of aircraft delay for landing aircraft at airports was first studied theoretically by Bowen and Pearcey [5]. However, delays not only occur at runways and their respective holding areas but also occur at any bottleneck (point of congestion) in an airport’s process chain [7] and can expand easily through the different airport sub-processes [38] due to the tight interdependencies between actors (i.e., airline, handling companies, airport) and shared resources (i.e., runway, apron, passenger terminal facilities, and freight facilities among others). Most delay analysis focuses on arrival delays rather than the departure delays because arrival delays are more closely related to ultimate passenger satisfaction. On the other hand, when trying to understand the source of arrival delays and airspace congestion in general, study of departure delays becomes quite relevant [20][33]. In terms of frequency of occurrence, as shown in [30], almost 60 percent of flights experienced delays that occurred at the gate. In [24] and [37], the penalties for stochastic flight delays (such as early or late arrivals and late departures) that often occur at most airports and impact the gate availability to complete the programmed turnaround operations are analysed. Daily disturbances reduce the effectiveness of the already planned gate assignments, resulting in oversaturation at some gates coexisting with idle gates elsewhere. Parking positions cannot be easily reassigned at the last moment due to the complications of moving passengers through the terminal and increasing the workload for remote operations.
Programmedarrivals in period “n”
Imbalance between demand and capacity for resource “X” at period “n”
Dec
lare
dca
pac
ity Late arrivals in period “n-1”
Early arrivals in period “n” programmed for “n+1”
Buffer
Arrivals in period “n”
Excess of demand in period “n”
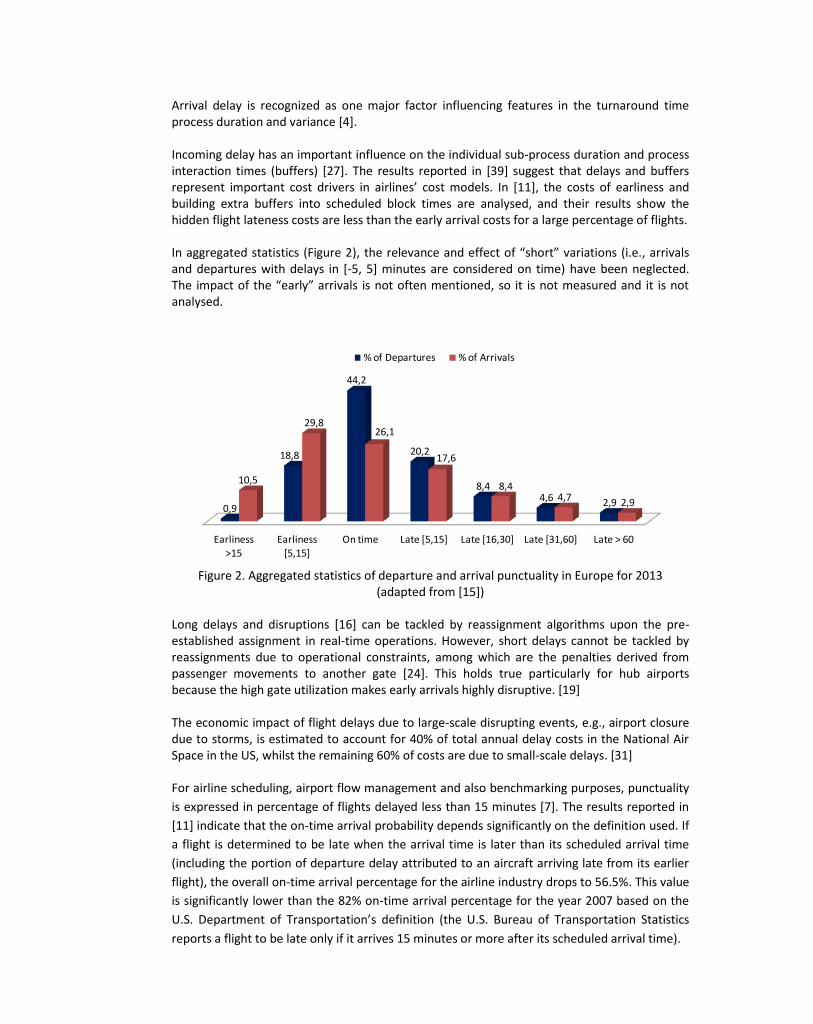
Arrival delay is recognized as one major factor influencing features in the turnaround time process duration and variance [4]. Incoming delay has an important influence on the individual sub-process duration and process interaction times (buffers) [27]. The results reported in [39] suggest that delays and buffers represent important cost drivers in airlines’ cost models. In [11], the costs of earliness and building extra buffers into scheduled block times are analysed, and their results show the hidden flight lateness costs are less than the early arrival costs for a large percentage of flights. In aggregated statistics (Figure 2), the relevance and effect of “short” variations (i.e., arrivals and departures with delays in [-5, 5] minutes are considered on time) have been neglected. The impact of the “early” arrivals is not often mentioned, so it is not measured and it is not analysed.
Figure 2. Aggregated statistics of departure and arrival punctuality in Europe for 2013
(adapted from [15]) Long delays and disruptions [16] can be tackled by reassignment algorithms upon the pre-established assignment in real-time operations. However, short delays cannot be tackled by reassignments due to operational constraints, among which are the penalties derived from passenger movements to another gate [24]. This holds true particularly for hub airports because the high gate utilization makes early arrivals highly disruptive. [19] The economic impact of flight delays due to large-scale disrupting events, e.g., airport closure due to storms, is estimated to account for 40% of total annual delay costs in the National Air Space in the US, whilst the remaining 60% of costs are due to small-scale delays. [31] For airline scheduling, airport flow management and also benchmarking purposes, punctuality
is expressed in percentage of flights delayed less than 15 minutes [7]. The results reported in
[11] indicate that the on-time arrival probability depends significantly on the definition used. If
a flight is determined to be late when the arrival time is later than its scheduled arrival time
(including the portion of departure delay attributed to an aircraft arriving late from its earlier
flight), the overall on-time arrival percentage for the airline industry drops to 56.5%. This value
is significantly lower than the 82% on-time arrival percentage for the year 2007 based on the
U.S. Department of Transportation’s definition (the U.S. Bureau of Transportation Statistics
reports a flight to be late only if it arrives 15 minutes or more after its scheduled arrival time).
Earliness >15
Earliness [5,15]
On time Late [5,15] Late [16,30] Late [31,60] Late > 60
0,9
18,8
44,2
20,2
8,44,6 2,9
10,5
29,826,1
17,6
8,44,7 2,9
% of Departures % of Arrivals
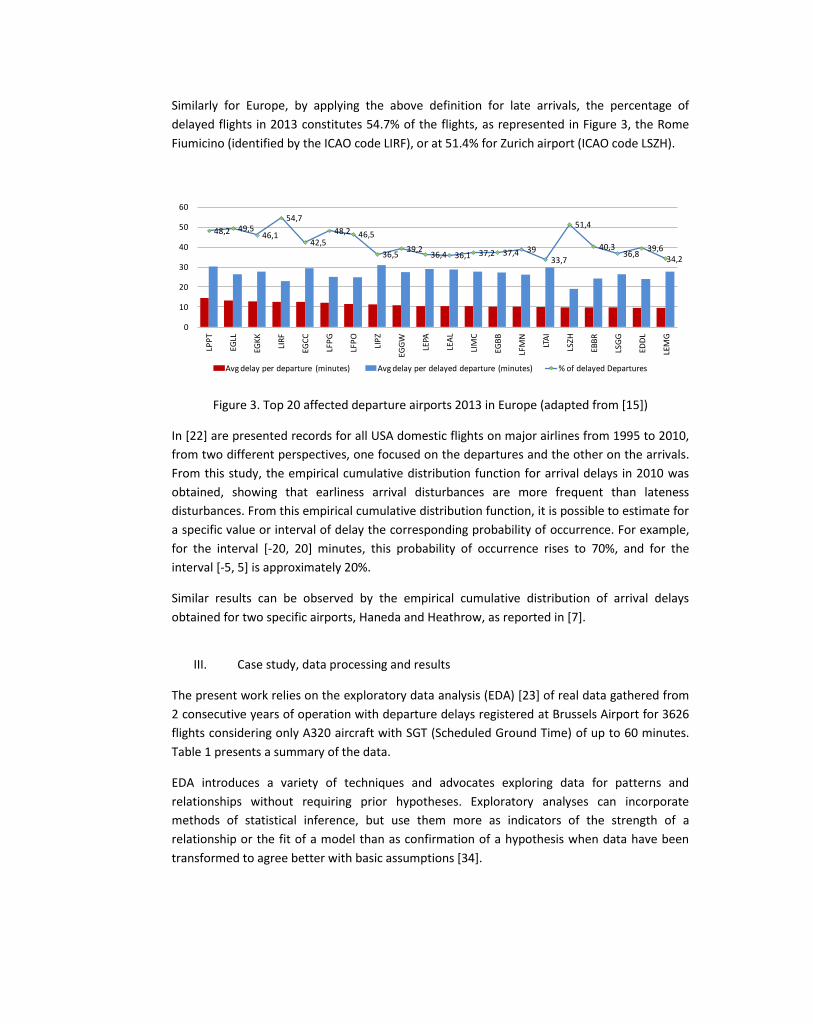
Similarly for Europe, by applying the above definition for late arrivals, the percentage of
delayed flights in 2013 constitutes 54.7% of the flights, as represented in Figure 3, the Rome
Fiumicino (identified by the ICAO code LIRF), or at 51.4% for Zurich airport (ICAO code LSZH).
Figure 3. Top 20 affected departure airports 2013 in Europe (adapted from [15])
In [22] are presented records for all USA domestic flights on major airlines from 1995 to 2010,
from two different perspectives, one focused on the departures and the other on the arrivals.
From this study, the empirical cumulative distribution function for arrival delays in 2010 was
obtained, showing that earliness arrival disturbances are more frequent than lateness
disturbances. From this empirical cumulative distribution function, it is possible to estimate for
a specific value or interval of delay the corresponding probability of occurrence. For example,
for the interval [-20, 20] minutes, this probability of occurrence rises to 70%, and for the
interval [-5, 5] is approximately 20%.
Similar results can be observed by the empirical cumulative distribution of arrival delays
obtained for two specific airports, Haneda and Heathrow, as reported in [7].
III. Case study, data processing and results
The present work relies on the exploratory data analysis (EDA) [23] of real data gathered from
2 consecutive years of operation with departure delays registered at Brussels Airport for 3626
flights considering only A320 aircraft with SGT (Scheduled Ground Time) of up to 60 minutes.
Table 1 presents a summary of the data.
EDA introduces a variety of techniques and advocates exploring data for patterns and
relationships without requiring prior hypotheses. Exploratory analyses can incorporate
methods of statistical inference, but use them more as indicators of the strength of a
relationship or the fit of a model than as confirmation of a hypothesis when data have been
transformed to agree better with basic assumptions [34].
48,2 49,546,1
54,7
42,5
48,2 46,5
36,539,2
36,4 36,1 37,2 37,4 3933,7
51,4
40,336,8
39,634,2
0
10
20
30
40
50
60LP
PT
EGLL
EGK
K
LIR
F
EGC
C
LFP
G
LFP
O
LIP
Z
EGG
W
LEPA
LEA
L
LIM
C
EGB
B
LFM
N
LTA
I
LSZH
EBB
R
LSG
G
EDD
L
LEM
G
Avg delay per departure (minutes) Avg delay per delayed departure (minutes) % of delayed Departures
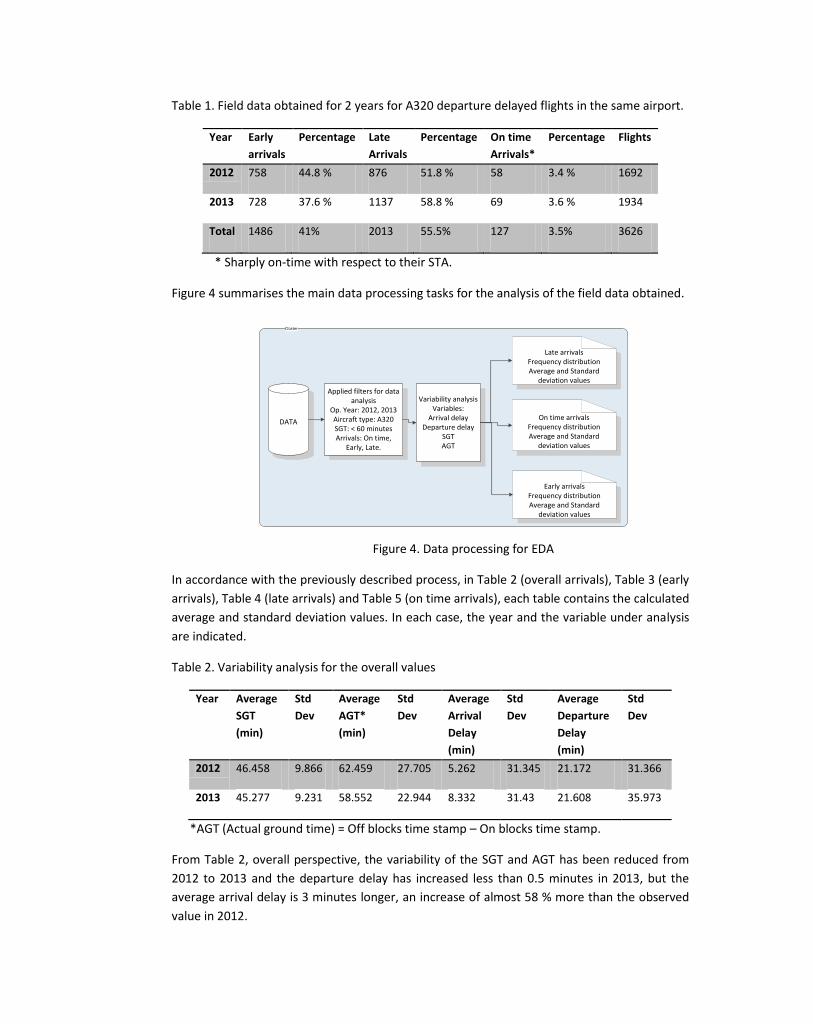
Table 1. Field data obtained for 2 years for A320 departure delayed flights in the same airport.
Year Early
arrivals
Percentage Late
Arrivals
Percentage On time
Arrivals*
Percentage Flights
2012 758 44.8 % 876 51.8 % 58 3.4 % 1692
2013 728 37.6 % 1137 58.8 % 69 3.6 % 1934
Total 1486 41% 2013 55.5% 127 3.5% 3626
* Sharply on-time with respect to their STA.
Figure 4 summarises the main data processing tasks for the analysis of the field data obtained.
Figure 4. Data processing for EDA
In accordance with the previously described process, in Table 2 (overall arrivals), Table 3 (early
arrivals), Table 4 (late arrivals) and Table 5 (on time arrivals), each table contains the calculated
average and standard deviation values. In each case, the year and the variable under analysis
are indicated.
Table 2. Variability analysis for the overall values
Year Average
SGT
(min)
Std
Dev
Average
AGT*
(min)
Std
Dev
Average
Arrival
Delay
(min)
Std
Dev
Average
Departure
Delay
(min)
Std
Dev
2012 46.458 9.866 62.459 27.705 5.262 31.345 21.172 31.366
2013 45.277 9.231 58.552 22.944 8.332 31.43 21.608 35.973
*AGT (Actual ground time) = Off blocks time stamp – On blocks time stamp.
From Table 2, overall perspective, the variability of the SGT and AGT has been reduced from
2012 to 2013 and the departure delay has increased less than 0.5 minutes in 2013, but the
average arrival delay is 3 minutes longer, an increase of almost 58 % more than the observed
value in 2012.
Clúster
DATA
Late arrivalsFrequency distributionAverage and Standard
deviation values
Applied filters for data analysis
Op. Year: 2012, 2013Aircraft type: A320SGT: < 60 minutesArrivals: On time,
Early, Late.
Variability analysisVariables:
Arrival delayDeparture delay
SGTAGT
On time arrivalsFrequency distributionAverage and Standard
deviation values
Early arrivalsFrequency distributionAverage and Standard
deviation values
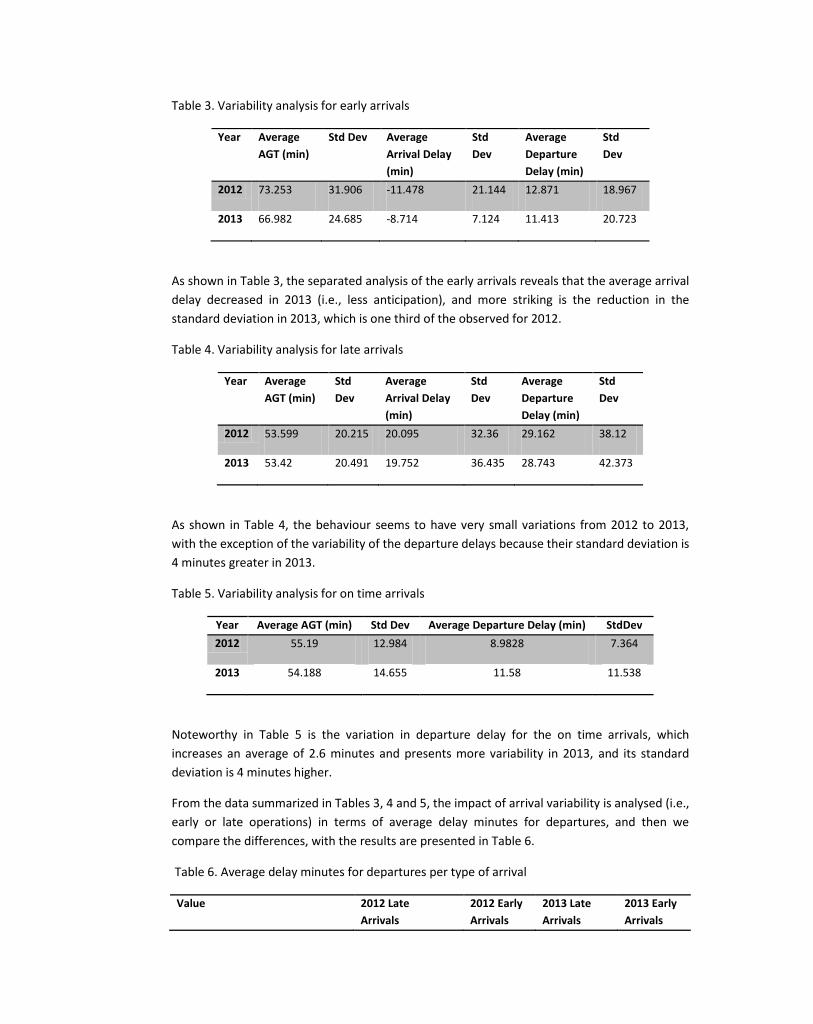
Table 3. Variability analysis for early arrivals
Year Average
AGT (min)
Std Dev Average
Arrival Delay
(min)
Std
Dev
Average
Departure
Delay (min)
Std
Dev
2012 73.253 31.906 -11.478 21.144 12.871 18.967
2013 66.982 24.685 -8.714 7.124 11.413 20.723
As shown in Table 3, the separated analysis of the early arrivals reveals that the average arrival
delay decreased in 2013 (i.e., less anticipation), and more striking is the reduction in the
standard deviation in 2013, which is one third of the observed for 2012.
Table 4. Variability analysis for late arrivals
Year Average
AGT (min)
Std
Dev
Average
Arrival Delay
(min)
Std
Dev
Average
Departure
Delay (min)
Std
Dev
2012 53.599 20.215 20.095 32.36 29.162 38.12
2013 53.42 20.491 19.752 36.435 28.743 42.373
As shown in Table 4, the behaviour seems to have very small variations from 2012 to 2013,
with the exception of the variability of the departure delays because their standard deviation is
4 minutes greater in 2013.
Table 5. Variability analysis for on time arrivals
Year Average AGT (min) Std Dev Average Departure Delay (min) StdDev
2012 55.19 12.984 8.9828 7.364
2013 54.188 14.655 11.58 11.538
Noteworthy in Table 5 is the variation in departure delay for the on time arrivals, which
increases an average of 2.6 minutes and presents more variability in 2013, and its standard
deviation is 4 minutes higher.
From the data summarized in Tables 3, 4 and 5, the impact of arrival variability is analysed (i.e.,
early or late operations) in terms of average delay minutes for departures, and then we
compare the differences, with the results are presented in Table 6.
Table 6. Average delay minutes for departures per type of arrival
Value 2012 Late
Arrivals
2012 Early
Arrivals
2013 Late
Arrivals
2013 Early
Arrivals
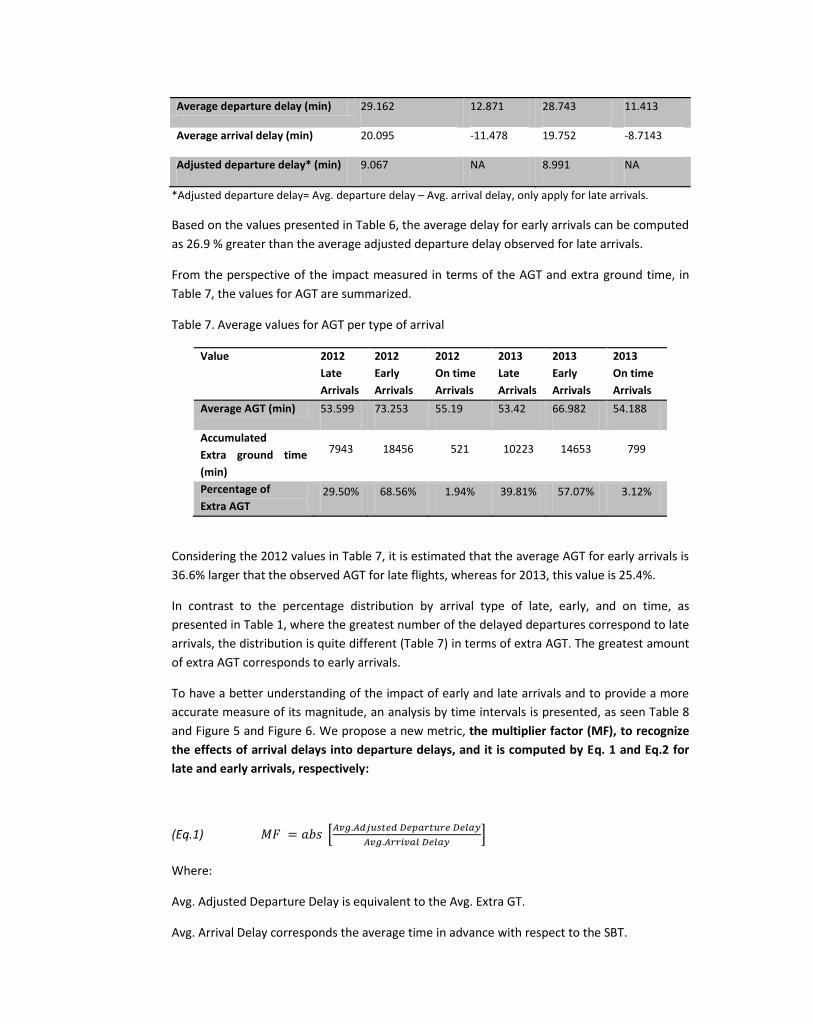
Average departure delay (min) 29.162 12.871 28.743 11.413
Average arrival delay (min) 20.095 -11.478 19.752 -8.7143
Adjusted departure delay* (min) 9.067 NA 8.991 NA
*Adjusted departure delay= Avg. departure delay – Avg. arrival delay, only apply for late arrivals.
Based on the values presented in Table 6, the average delay for early arrivals can be computed
as 26.9 % greater than the average adjusted departure delay observed for late arrivals.
From the perspective of the impact measured in terms of the AGT and extra ground time, in
Table 7, the values for AGT are summarized.
Table 7. Average values for AGT per type of arrival
Value 2012
Late
Arrivals
2012
Early
Arrivals
2012
On time
Arrivals
2013
Late
Arrivals
2013
Early
Arrivals
2013
On time
Arrivals
Average AGT (min) 53.599 73.253 55.19 53.42 66.982 54.188
Accumulated
Extra ground time
(min)
7943 18456 521 10223 14653 799
Percentage of
Extra AGT 29.50% 68.56% 1.94% 39.81% 57.07% 3.12%
Considering the 2012 values in Table 7, it is estimated that the average AGT for early arrivals is
36.6% larger that the observed AGT for late flights, whereas for 2013, this value is 25.4%.
In contrast to the percentage distribution by arrival type of late, early, and on time, as
presented in Table 1, where the greatest number of the delayed departures correspond to late
arrivals, the distribution is quite different (Table 7) in terms of extra AGT. The greatest amount
of extra AGT corresponds to early arrivals.
To have a better understanding of the impact of early and late arrivals and to provide a more
accurate measure of its magnitude, an analysis by time intervals is presented, as seen Table 8
and Figure 5 and Figure 6. We propose a new metric, the multiplier factor (MF), to recognize
the effects of arrival delays into departure delays, and it is computed by Eq. 1 and Eq.2 for
late and early arrivals, respectively:
(Eq.1)
Where:
Avg. Adjusted Departure Delay is equivalent to the Avg. Extra GT.
Avg. Arrival Delay corresponds the average time in advance with respect to the SBT.
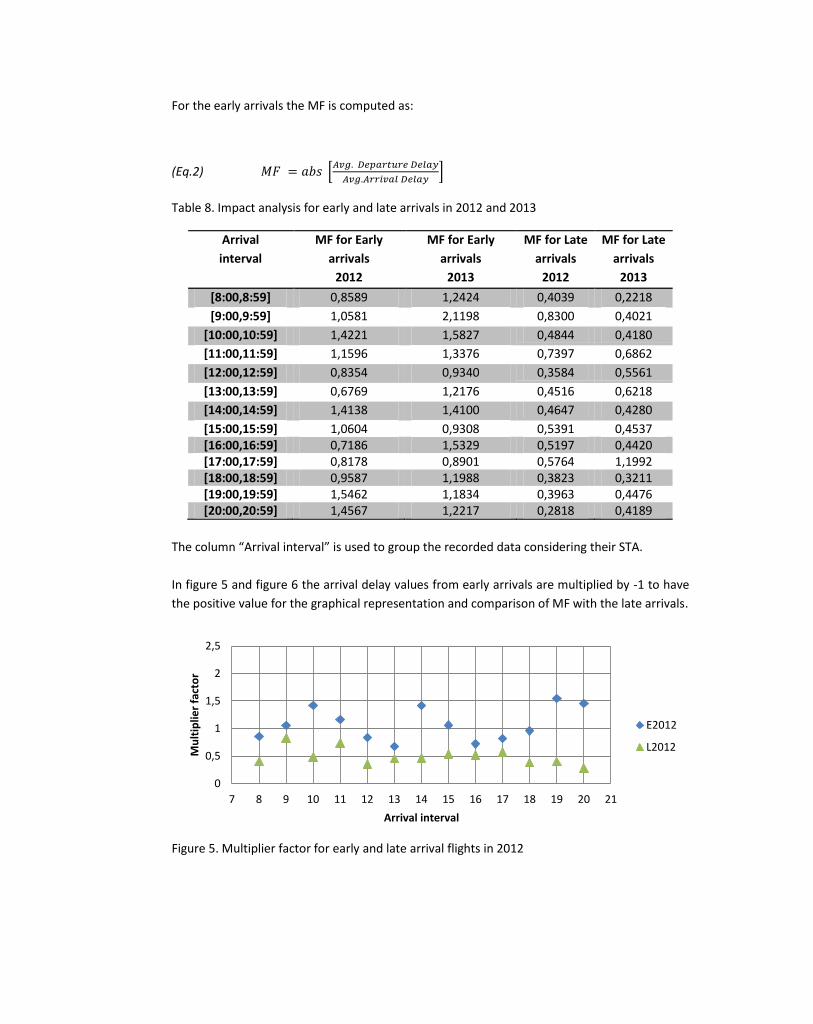
For the early arrivals the MF is computed as:
(Eq.2)
Table 8. Impact analysis for early and late arrivals in 2012 and 2013
Arrival
interval
MF for Early
arrivals
2012
MF for Early
arrivals
2013
MF for Late
arrivals
2012
MF for Late
arrivals
2013
[8:00,8:59] 0,8589 1,2424 0,4039 0,2218
[9:00,9:59] 1,0581 2,1198 0,8300 0,4021
[10:00,10:59] 1,4221 1,5827 0,4844 0,4180
[11:00,11:59] 1,1596 1,3376 0,7397 0,6862
[12:00,12:59] 0,8354 0,9340 0,3584 0,5561
[13:00,13:59] 0,6769 1,2176 0,4516 0,6218
[14:00,14:59] 1,4138 1,4100 0,4647 0,4280
[15:00,15:59] 1,0604 0,9308 0,5391 0,4537 [16:00,16:59] 0,7186 1,5329 0,5197 0,4420 [17:00,17:59] 0,8178 0,8901 0,5764 1,1992 [18:00,18:59] 0,9587 1,1988 0,3823 0,3211 [19:00,19:59] 1,5462 1,1834 0,3963 0,4476 [20:00,20:59] 1,4567 1,2217 0,2818 0,4189
The column “Arrival interval” is used to group the recorded data considering their STA.
In figure 5 and figure 6 the arrival delay values from early arrivals are multiplied by -1 to have
the positive value for the graphical representation and comparison of MF with the late arrivals.
Figure 5. Multiplier factor for early and late arrival flights in 2012
0
0,5
1
1,5
2
2,5
7 8 9 10 11 12 13 14 15 16 17 18 19 20 21
Mu
ltip
lier
fact
or
Arrival interval
E2012
L2012

Figure 6. Multiplier factor observed for early and late arrival flights in 2013
The observed curves (Figures 5 to 6) confirm that the impact of late arrivals is lower in
terms of inducing extra ground time and departure delay in comparison with the early arrivals,
this pattern is observed in both 2012 and 2013. Beside these comparisons reveal different
performance throughout the day.
IV. Discussion and conclusions
By means of the variability analysis for early and late arrivals, the impact in terms of extra time
for the next departure for flights has been measured. Based on the above comparisons, it has
been defined and measured the "multiplier factor", for early and late arrivals, as an indicator
of disturbances in the departure performance. By means of the EDA, some light is shed on
some incorrect assumptions that early flight arrivals do not affect the apron operations as
much as late flight arrivals.
As it can be observed, depending on the arrival interval, for late arrivals MF can take values
lower than 1, the meaning of this is a compensation capacity to absorb part of the disruption
(i.e., arrival delay time) and reduce their impact (i.e. departure delay time). Based on the
analysed data from 2013 (i.e., 1934 flights), from almost 15% of the late arrivals with
departure delay, a total amount of 784 minutes of delay were reclaimed during the
turnaround. A direct financial saving of 23520 dollars can be estimated considering a cost of
approximately 30 dollars per ground minute [26], and additional savings could be obtained if
new robust turnaround procedures are designed to better react in front of earliness arrivals.
As a result of the empirical evidence that early arrivals are more disruptive than late arrivals, a
new challenge is open to adapt present operational airport decision support tools to avoid the
impact of early arrivals by designing a buffer mechanism that can be activated in a flexible,
efficient and reactive context. In fact handling operators are used to monitor the ETA to react
in front of delayed arrivals, usually by shifting or re-scheduling the programmed operations,
however, there is a lack of indicators to predict if a flight will arrive earlier than the ETA. Thus,
new indicators should be elaborated together with new robust procedures to tackle earliness
problems, avoiding an increment of the operational cost (i.e., adding more resources to tackle
the same workload). In [25], an algorithm is presented to sequence the departure aircrafts
(Departure Manager) considering their impact on the ATC workload, and the same causal
0
0,5
1
1,5
2
2,5
7 8 9 10 11 12 13 14 15 16 17 18 19 20 21
Mu
ltip
lier
fact
or
Arrival interval
E2013
L2013
approach could be used to design an algorithm to sequence the arrival aircraft (Arrival
Manager) in the Terminal Manoeuvring Area (TMA) to mitigate the impact of earliness (i.e.
departure disturbances).
References
[1] Airports Council International. Guide to Airport Performance Measures, 2012.
[2] ABDEL-ATY, Mohamed, et al. Detecting periodic patterns of arrival delay. Journal of Air
Transport Management, 2007, vol. 13, no 6, p. 355-361.
[3] AHMADBEYGI, Shervin, et al. Analysis of the potential for delay propagation in passenger
airline networks. Journal of Air Transport Management, 2008, vol. 14, no 5, p. 221-236.
[4] BEELAERTS VAN BLOKLAND, W. W. A., et al. Future airport turnaround ground handling
processes: how to reduce the turnaround time of aircraft at the airport. In Conference
Proceedings of 10th TRAIL Congress, TRAIL in perspective, Delft, October 2008, p. 1-25. TRAIL
Research school, 2008.
[5] BOWEN, E. G.; PEARCEY, T. Delays in air traffic flow. Journ. Royal Aero. Soc, 1948.
[6] BRITTO, Rodrigo; DRESNER, Martin; VOLTES, Augusto. The impact of flight delays on
passenger demand and societal welfare. Transportation Research Part E: Logistics and
Transportation Review, 2012, vol. 48, no 2, p. 460-469.
[7] BUBALO, Branko. Airport Punctuality, Congestion and Delay: The Scope for Benchmarking.
Airlines magazine, 2011, vol. 50, p. 1-9.
[8] BUIL, Roman, PIERA, Miquel A., and LUH, Peter B. Improvement of Lagrangian relaxation
convergence for production scheduling. Automation Science and Engineering, IEEE
Transactions on, 2012, vol. 9, no 1, p. 137-147.
[9] CASTAING, Jeremy, et al. Reducing airport gate blockage in passenger aviation: Models and
analysis. Computers & Operations Research (2014) (in press).
[10] DEMIR, Halil Ibrahim, et al. Process Planning and Due-date Assignment with ATC
Dispatching where Earliness, Tardiness and Due-dates are Punished. Journal of Industrial and
Intelligent Information, 2015, vol. 3, no 3.
[11] DESHPANDE, Vinayak; ARIKAN, Mazhar. The impact of airline flight schedules on flight
delays. Manufacturing & Service Operations Management, 2012, vol. 14, no 3, p. 423-440.
[12] DORNDORF, Ulrich, et al. Flight gate scheduling: State-of-the-art and recent
developments. Omega, 2007, vol. 35, no 3, p. 326-334.
[13] EUROCONTROL. Report on Punctuality Drivers at Major European Airports, May 2005.
[14] EUROCONTROL, Airport CDM Operational Concept Document, Edition Number 3.0,
September 2006, pp. 7, 10-24.
[15] EUROCONTROL, Delays to Air Transport in Europe. CODA Annual Report, 2013.
[16] FITOURI-TRABELSI, Salma, MORA-CAMINO, Félix, NUNES-COSENZA, Carlos A. and
WEIGANG, Li. Integrated Decision Making for Ground Handling Management. Global Journal of
Science Frontier Research:F Mathematics and Decision Sciences, Global Journals inc., 2015, 15
(1), pp.17-31.
[17] FRICKE, Hartmut. SCHULTZ, Michael. Delay impacts onto turnaround performance. In
Proceedings of ATM Seminar. 2009.
[18] HAO, Lu; HANSEN, Mark. How Airlines Set Scheduled Block Times. Tenth USA/Europe Air Traffic Management Research and Development Seminar (ATM2013).

[19] HAO, Lu; HANSEN, Mark. Block time reliability and scheduled block time setting.
Transportation Research Part B: Methodological, 2014, vol. 69, p. 98-111.
[20] ISON, D. C., WEILAND, L., MCANDREW, I., & MORAN, K.. Identification of Air Traffic
Management Principles Influential in the Development of an Airport Arrival Delay Prediction
Model. Journal of Aviation/Aerospace Education & Research, (2015) 24(2).
http://dx.doi.org/10.15394/jaaer.2015.1618
[21] MAHARJAN, Binod; MATIS, Timothy I. An optimization model for gate reassignment in
response to flight delays. Journal of Air Transport Management, 2011, vol. 17, no 4, p. 256-
261.
[22] MARTINEZ, Vincent. Flight Delay Prediction, Master Thesis Systems Group, Department of
Computer Science, ETH Zurich, 2012.
[23] MYATT, Glenn J. Making sense of data: A practical guide to exploratory data analysis and
data mining. John Wiley & Sons, 2007.
[24] NARCISO, Mercedes E.; PIERA, Miquel A. Robust gate assignment procedures from an
airport management perspective. Omega, 2015, vol. 50, p. 82-95.
[25] NOSEDAL, Jenaro, et al. An efficient algorithm for smoothing airspace congestion by fine-
tuning take-off times. Transportation Research Part C: Emerging Technologies, 2014, vol. 44, p.
171-184.
[26] NYQUIST, David C., and MCFADDEN, Kathleen L. A study of the airline boarding problem.
Journal of Air Transport Management 14, no. 4 (2008): 197-204.
[27] ORESCHKO, Bernd, et al. Turnaround Prediction with Stochastic Process Times and Airport
specific Delay Pattern. International Conference on Research in Airport Transportation (ICRAT),
Berkeley. 2012.
[28] PIERA, Miquel A, et al. Causal Simulation Models for Facing Third Millennium Air Transport
Sustainability. Simulation: Transactions of the Society for Modeling and Simulation
International. 2014, vol. 90(2), p. 162–170
[29] RUIZ, Sergio, et al. Strategic de-confliction in the presence of a large number of 4D
trajectories using a causal modeling approach. Transportation Research Part C: Emerging
Technologies, 2014, vol. 39, p. 129-147.
[30] SCHUMER, C. E.; MALONEY, Carolyn B. Your flight has been delayed again: flight delays
cost passengers, airlines, and the US economy billions. The US Senate Joint Economic
Committee, 2008.
[31] SHAVELL, Z. A. The effect of schedule disruptions on the economics of airline operations.
3rd USA/Europe Air Traffic Management R&D Seminar Napoli, 13−16 June 2000.
[32] SOURD, Francis. Earliness–tardiness scheduling with setup considerations. Computers &
operations research, 2005, vol. 32, no 7, p. 1849-1865.
[33] TU, Yufeng; BALL, Michael O.; JANK, Wolfgang S. Estimating flight departure delay
distributions—a statistical approach with long-term trend and short-term pattern. Journal of
the American Statistical Association, 2008, vol. 103, no 481, p. 112-125.
[34] Velleman, Paul F.; Hoaglin, David C. Exploratory data analysis. Cooper, Harris (Ed); Camic,
Paul M. (Ed); Long, Debra L. (Ed); Panter, A. T. (Ed); Rindskopf, David (Ed); Sher, Kenneth J. (Ed),
(2012). APA handbook of research methods in psychology, Vol. 3: Data analysis and research
publication. , (pp. 51-70). Washington, DC, US: American Psychological Association, x, 629 pp.
http://dx.doi.org/10.1037/13621-003
[35] VENTURA, Jose A.; RADHAKRISHNAN, Sanjay. Single machine scheduling with symmetric
earliness and tardiness penalties. European Journal of Operational Research, 2003, vol. 144, no
3, p. 598-612.
[36] WU, Cheng-Lung. Inherent delays and operational reliability of airline schedules. Journal
of Air Transport Management, 2005, vol. 11, no 4, p. 273-282.
[37] YAN, Shangyao; TANG, Ching-Hui. A heuristic approach for airport gate assignments for
stochastic flight delays. European Journal of Operational Research, 2007, vol. 180, no 2, p. 547-
567.
[38] YU, Ming-Miin. Assessment of airport performance using the SBM-NDEA model. Omega,
2010, vol. 38, p. 440-452.
[39] ZOU, Bo; HANSEN, Mark. Impact of operational performance on air carrier cost structure:
evidence from US airlines. Transportation Research Part E: Logistics and Transportation
Review, 2012, vol. 48, no 5, p. 1032-1048.
Appendix B
Paper IV
In this paper, it is presented a causal analysis of the airport turnaround processes,
which is a key factor to enhance the Air Traffic Management reliability. Cause
effect relationship analysis demands for a knowledge representation technique that
considers the stochastic, dynamic and synchronous nature of the turnaround process,
and allows representing both the structure and the different ways in which the sub-
processes can be influenced. In this work an exhaustive timed evaluation of the
different perturbations that can affect the turnaround time due to precedence task
interdependencies is presented. This examination is used to illustrate the complexity
of the turnaround process at operational level (e.g., dynamic critical paths) and to
provide a comprehensive turnaround behavior analysis by taking advantage of causal
methods and simulation models as a useful tool to improve turnaround reliability by
a better understanding of the impact of delays on the full turnaround process.
75
For Peer Review O
nly
Causal analysis of aircraft turnaround time for process
reliability evaluation and disruptions identification
Journal: Transportmetrica B: Transport Dynamics
Manuscript ID TTRB-2015-0066
Manuscript Type: Full Paper
Date Submitted by the Author: 30-Oct-2015
Complete List of Authors: NOSEDAL, JENARO; UNIVERSIDAD AUTONOMA DE BARCELONA, TELECOM
AND SYSTEMS ENGINEERING
PIERA, MIQUEL ANGEL; UNIVERSIDAD AUTONOMA DE BARCELONA
Keywords: turnaround, reliability, causal analysis, airport
URL: http:/mc.manuscriptcentral.com/transportmetrica
Transportmetrica B: Transport Dynamics

For Peer Review O
nly
Causal analysis of aircraft turnaround time for process reliability
evaluation and disruptions identification
Jenaro Nosedal Sáncheza* and Miquel A. Piera Erolesb
a,bTechnical Innovation Cluster on Aeronautical Management, Universidad Autónoma
de Barcelona, Sabadell, Spain
Adress: Emprius 2, Escola de Enginyeria, ZIP. Code: 08202, Sabadell, Spain.
*Correspondence author
Page 1 of 23
URL: http:/mc.manuscriptcentral.com/transportmetrica
Transportmetrica B: Transport Dynamics
123456789101112131415161718192021222324252627282930313233343536373839404142434445464748495051525354555657585960
For Peer Review O
nly
Causal analysis of aircraft turnaround time for process reliability
evaluation and disruptions identification
In this paper, it is presented a causal analysis of the airport turnaround processes,
which is a key factor to enhance the Air Traffic Management reliability. Cause-
effect relationship analysis demands for a knowledge representation technique
that considers the stochastic, dynamic and synchronous nature of the turnaround
process, and allows representing both the structure and the different ways in
which the sub-processes can be influenced. In this work an exhaustive timed
evaluation of the different perturbations that can affect the turnaround time due to
precedence task interdependencies is presented. This examination is used to
illustrate the complexity of the turnaround process at operational level (e.g.,
dynamic critical paths) and to provide a comprehensive turnaround behaviour
analysis by taking advantage of causal methods and simulation models as a useful
tool to improve turnaround reliability by a better understanding of the impact of
delays on the full turnaround process.
Keywords: turnaround; reliability; causal analysis; airport.
1. Introduction
Now a day, aviation provides a worldwide transportation network, to satisfy present industrial demand, supporting the movement of passengers and cargo, playing a vital role in facilitating economic growth (Baker 2015). It is well accepted by the industrial community, that supply chain performance is highly dependent on the rapid and reliable movement of goods, which is well supported by the air transportation system by providing fast and reliable delivery of high-value low-weight products. Airports and en route airspace together with the aircraft are the key components that define the capacity of the overall air transport system. Airports consist of several subsystems (Piera 2009), such as runways (where aircraft land or take-off), taxiways (that aircraft use for reaching and leaving runways), apron stands (where aircraft stop), and terminals (buildings where passengers transfer between ground transportation and airport facilities), each with its own capacity limitations. En route airspace has also a limited capacity, and consist of several sectors each one under the control of an Air Traffic Controller (ATC), which must preserve a safety distance between the aircraft flying in the sector.
The demand of both land side and air side capacity resources is characterized by the flight plan issued by the different Airspace Users (AU’s), which specify the departure and arrival locations, flight duration, alternative airports in case of bad weather, and information about the aircraft, among others. Unfortunately, despite the
Page 2 of 23
URL: http:/mc.manuscriptcentral.com/transportmetrica
Transportmetrica B: Transport Dynamics
123456789101112131415161718192021222324252627282930313233343536373839404142434445464748495051525354555657585960
For Peer Review O
nly
flyable airspace could allocate all the aircrafts, the demand of trajectories are not well distributed through the full airspace, instead, airlines propose flight plans based on several factors (winds, weather conditions, fuel usage, passenger preferences, etc) which results in a spatial concentration of flight in certain sectors during some time windows while some other sectors are practically empty.
At strategic level, in Europe, the Central Flow Management Unit of EUROCONTROL (CFMU) verifies in advance all the flight plans considering the airspace structure, and in case that the amount of flight in a certain sector exceeds the declared capacity, some flight plans are rejected and the airline must propose a less efficient trajectory. At tactical level, ATC’s issue directives (e.g., headings, flight level change, speed change) to aircrafts in order to preserve the safety distance of those aircraft flying in the sector (Zúñiga et.al. 2013). Unfortunately, at operational level, there are several uncertainties (e.g., weather and wind conditions) and perturbations (i.e., poor adherence to the proposed trajectory) which propagate through the full aeronautic processes, which can provoke non-added-value and capacity-wasting operations such as ground delays (Nosedal 2014 and 2015) and holding trajectories (Ruiz 2013) which affect to a constant increasing amount of agreed slots (slot is the permission given to an airline to use the full range of airport infrastructure necessary to operate on a specific date and time for landing or taking-off) degenerating into an unstable air traffic management (ATM) system due to unbalanced demand/capacity problems. In (Piera 2014) it is presented a causal approach to obtain a better understanding of emergent dynamics in the ATM system that arise as a result of tight interdependencies between ATM system actors (i.e., people, procedures, equipment) working together or impacting each other, leading to higher levels of complexity.
To improve ATM reliability, by detecting and designing mitigation mechanisms to avoid the free propagation of perturbation between the airside and landside resources with a direct impact on airport operational capacity (Narciso 2015) that affects the tactical capacity of ATC’s and even propagates to strategic decision making tasks affecting the CFMU level, in Europe and in the USA two important research programs SESAR (Single European Sky ATM Research) and NextGen (Brooker 2008) has been enhanced to design new ATM concepts with the aims of improving fuel efficiency, cost efficiency, safety, and airspace capacity. As a results of the development of new technology and working methods, it is envisaged that future operations will require new trade-offs between safety, efficiency, and capacity enhancing reliability concepts in ATM.
In this paper, it is presented the causal analysis of the airport turnaround processes, which is a key factor in for the ATM system, since delays generated during a turnaround may affect the landside capacity and propagate to the airside capacity by negotiating new slots and in consequence can affect the reliability of the full ATM system.
The causal analysis has been developed as part of the FP7 project Interaction leaded by main European aeronautic stakeholders (http://www.interaction-aero.eu/) and contributes to procedural features to avoid, detect and repair turnaround faults. Thus, the analysis of the turnaround interdependencies, contribute to detect a failure in the
Page 3 of 23
URL: http:/mc.manuscriptcentral.com/transportmetrica
Transportmetrica B: Transport Dynamics
123456789101112131415161718192021222324252627282930313233343536373839404142434445464748495051525354555657585960
For Peer Review O
nly
programmed target of block time (TOBT) which is the main airport source of airside delays, and if possible, provides mitigation mechanisms to correct the problem and isolating the delay at airport level.
Turnaround complexity arises due to the effects of interdependencies between different actors that are able to generate an event that could block, freeze, delay, or disable/ enable other activities programmed in the same or in another sub-process (Wu 2008 and Abd 2014).
Specification requirements in terms of cause-effect relationship between sub-processes (e.g., ground operations) demands for a knowledge representation technique that considers the stochastic, dynamic and synchronous nature of the turnaround process, and allows representing both the structure and the different ways in which the sub-processes can be influenced (e.g., dynamic critical paths). The proper representation, analysis and assessment of all the event-relationships (i.e., disruptions identification and reliability evaluation) that determine the comprehensive turnaround behaviour are essential in dealing with innovative robust improvements.
The remaining sections of this paper are organized as follows, Section 2 includes the turnaround description and the case study data are described. Section 3 illustrates the main turnaround reliability results obtained from the real data analysis (e.g., simultaneous equations, central tendency measures, discrete event simulation and variability comparisons). Finally, Section 4 presents the conclusions.
2. The turnaround process description and case study data
The Turnaround process includes a set of operations performed in the aircraft while it is parked in the airport, between the arrival and the next departure, those operations must be executed in parallel or in a sequential way. Thus, all the operations must be coordinated to optimize the process without incurring changes in the TOBT (the time that an aircraft operator (AO) or ground handler (GH) estimates that an aircraft will be ready, all doors closed, boarding bridge removed, push back vehicle available and ready to start up /push back immediately upon reception of clearance from the tower).
Several actors of different organizations are involved in the turnaround process, each one working for a particular goal and with a lack of information sharing mechanisms, making it a complex operation due to the tight interdependencies between tasks. The main actors involved in the turnaround process are: AOs, GH, air navigation service provider (ANSP) and airport operator. The typical tasks involved in the turnaround may be grouped in four process categories: passenger, baggage, freight and ground services. The ground services comprise the set of operations required from the moment the aircraft arrives at its stand (actual in block time) until the time it leaves it (actual off block time). The turnaround process can be specified by an activity network, in which the process data concerning the tasks to be completed are specified, how long each task takes and the constraints on the order in which the previous tasks must be finalized (precedence, resources availability, space constraints, legal restrictions, etc.).
Page 4 of 23
URL: http:/mc.manuscriptcentral.com/transportmetrica
Transportmetrica B: Transport Dynamics
123456789101112131415161718192021222324252627282930313233343536373839404142434445464748495051525354555657585960
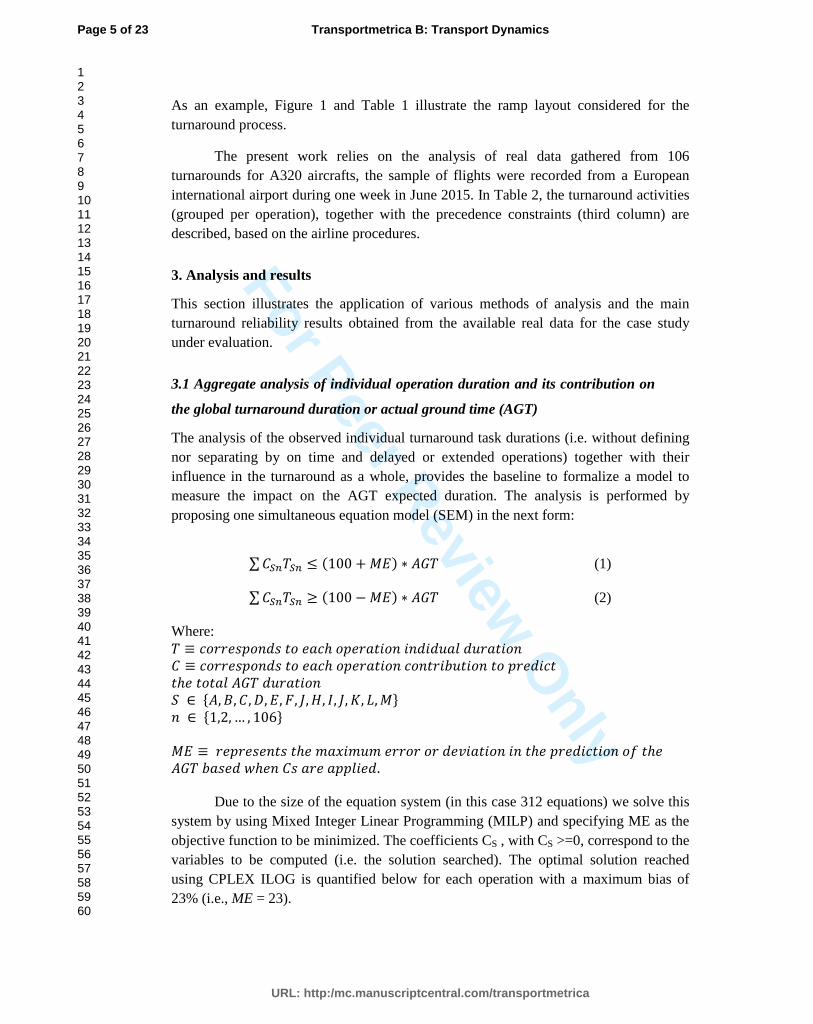
For Peer Review O
nly
As an example, Figure 1 and Table 1 illustrate the ramp layout considered for the turnaround process.
The present work relies on the analysis of real data gathered from 106 turnarounds for A320 aircrafts, the sample of flights were recorded from a European international airport during one week in June 2015. In Table 2, the turnaround activities (grouped per operation), together with the precedence constraints (third column) are described, based on the airline procedures.
3. Analysis and results
This section illustrates the application of various methods of analysis and the main turnaround reliability results obtained from the available real data for the case study under evaluation.
3.1 Aggregate analysis of individual operation duration and its contribution on
the global turnaround duration or actual ground time (AGT)
The analysis of the observed individual turnaround task durations (i.e. without defining nor separating by on time and delayed or extended operations) together with their influence in the turnaround as a whole, provides the baseline to formalize a model to measure the impact on the AGT expected duration. The analysis is performed by proposing one simultaneous equation model (SEM) in the next form:
∑𝐶𝑆𝑛𝑇𝑆𝑛 ≤ (100 + 𝑀𝐸) ∗ 𝐴𝐺𝑇 (1)
∑𝐶𝑆𝑛𝑇𝑆𝑛 ≥ (100 −𝑀𝐸) ∗ 𝐴𝐺𝑇 (2)
Where: 𝑇 ≡ 𝑐𝑜𝑟𝑟𝑒𝑠𝑝𝑜𝑛𝑑𝑠 𝑡𝑜 𝑒𝑎𝑐ℎ 𝑜𝑝𝑒𝑟𝑎𝑡𝑖𝑜𝑛 𝑖𝑛𝑑𝑖𝑑𝑢𝑎𝑙 𝑑𝑢𝑟𝑎𝑡𝑖𝑜𝑛 𝐶 ≡ 𝑐𝑜𝑟𝑟𝑒𝑠𝑝𝑜𝑛𝑑𝑠 𝑡𝑜 𝑒𝑎𝑐ℎ 𝑜𝑝𝑒𝑟𝑎𝑡𝑖𝑜𝑛 𝑐𝑜𝑛𝑡𝑟𝑖𝑏𝑢𝑡𝑖𝑜𝑛 𝑡𝑜 𝑝𝑟𝑒𝑑𝑖𝑐𝑡 𝑡ℎ𝑒 𝑡𝑜𝑡𝑎𝑙 𝐴𝐺𝑇 𝑑𝑢𝑟𝑎𝑡𝑖𝑜𝑛 𝑆 ∈ {𝐴,𝐵,𝐶,𝐷,𝐸,𝐹, 𝐽,𝐻, 𝐼, 𝐽,𝐾, 𝐿,𝑀} 𝑛 ∈ {1,2, … , 106} 𝑀𝐸 ≡ 𝑟𝑒𝑝𝑟𝑒𝑠𝑒𝑛𝑡𝑠 𝑡ℎ𝑒 𝑚𝑎𝑥𝑖𝑚𝑢𝑚 𝑒𝑟𝑟𝑜𝑟 𝑜𝑟 𝑑𝑒𝑣𝑖𝑎𝑡𝑖𝑜𝑛 𝑖𝑛 𝑡ℎ𝑒 𝑝𝑟𝑒𝑑𝑖𝑐𝑡𝑖𝑜𝑛 𝑜𝑓 𝑡ℎ𝑒 𝐴𝐺𝑇 𝑏𝑎𝑠𝑒𝑑 𝑤ℎ𝑒𝑛 𝐶𝑠 𝑎𝑟𝑒 𝑎𝑝𝑝𝑙𝑖𝑒𝑑.
Due to the size of the equation system (in this case 312 equations) we solve this system by using Mixed Integer Linear Programming (MILP) and specifying ME as the objective function to be minimized. The coefficients CS , with CS >=0, correspond to the variables to be computed (i.e. the solution searched). The optimal solution reached using CPLEX ILOG is quantified below for each operation with a maximum bias of 23% (i.e., ME = 23).
Page 5 of 23
URL: http:/mc.manuscriptcentral.com/transportmetrica
Transportmetrica B: Transport Dynamics
123456789101112131415161718192021222324252627282930313233343536373839404142434445464748495051525354555657585960
For Peer Review O
nly
CRefueling = 22; CCleaning = 116; CBoarding = 87; CCatering = 42; CDeboarding = 48; CStart_deboarding = 0; CReady_for_OB = 99; CBulk_unloading = 23; CBulk_loading = 16; CPot_wat_serv = 0; CToilet_serv = 0; CPRM_arrival = 49; CPRM_dep = 18;
Based on the previous results (i.e., considering a maximum bias of 23%) the contribution function to compute the AGT total duration in minutes is expressed as: AGT=(22*TRefueling+116*TCleaning+87*TBoarding+42*TCatering+48*TDeboarding+ 99*TReady_for_OB+23*TBulk_unloading+16*TBulk_loading+49*TPRM_arrival+18*TPRM_dep) / 100
Accordingly to the values for CS it is possible to determine the sensitivity of the AGT duration for time execution variations in each individual operation It should be noted that the impact will depend directly (i.e., it is proportional) to CS and the operation time extension TS.
Thus, the above function provides evidence of correlation between individual operation time extension and the total turnaround duration. However, does not provide evidence of the causality between delays for individual disruptions in the turnaround.
3.2 Standard values definition
Before the analysis of causality for delays in the individual task and turnaround disruptions, establishment of standard or reference values is needed. These standard values will allow further classification of the individual operations and turnaround duration in two main categories: ‘on time’ and ‘delayed’. The causal analysis will rely on well accepted hypothesis:
a. The airline policy accepts 50 minutes as the maximum duration for an “on time” turnaround process (complete turnaround on A320 aircraft).
b. It is assumed a normal distribution or near to normal for the turnaround time duration.
c. It will be assumed also a normal distribution for all the individual operations time durations.
In Figure 2 the distribution for the data sample is illustrated and the percentage of ‘on time’ and ‘delayed’ operations. In Figure 3, the distribution of the recorded data for cleaning operations is presented.
Based on the above, these operation times can be described by means of the
average and the standard deviation parameters. In Table 3, all the values obtained from the distributions analysis, for all the operations included in the turnaround are summarized. In Table 3 (seventh column), it is also indicated the observed percentage of occurrence for delays per each operation together with the maximum delay extension in minutes (eighth column).
Page 6 of 23
URL: http:/mc.manuscriptcentral.com/transportmetrica
Transportmetrica B: Transport Dynamics
123456789101112131415161718192021222324252627282930313233343536373839404142434445464748495051525354555657585960
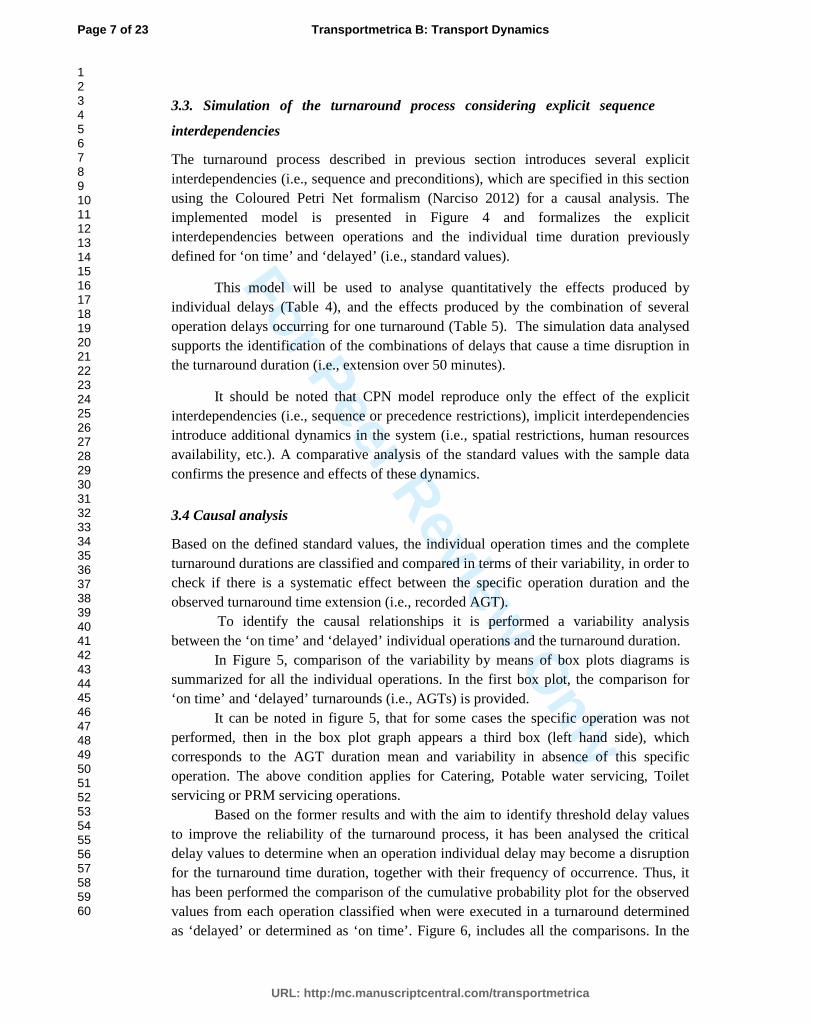
For Peer Review O
nly
3.3. Simulation of the turnaround process considering explicit sequence
interdependencies
The turnaround process described in previous section introduces several explicit interdependencies (i.e., sequence and preconditions), which are specified in this section using the Coloured Petri Net formalism (Narciso 2012) for a causal analysis. The implemented model is presented in Figure 4 and formalizes the explicit interdependencies between operations and the individual time duration previously defined for ‘on time’ and ‘delayed’ (i.e., standard values).
This model will be used to analyse quantitatively the effects produced by individual delays (Table 4), and the effects produced by the combination of several operation delays occurring for one turnaround (Table 5). The simulation data analysed supports the identification of the combinations of delays that cause a time disruption in the turnaround duration (i.e., extension over 50 minutes).
It should be noted that CPN model reproduce only the effect of the explicit interdependencies (i.e., sequence or precedence restrictions), implicit interdependencies introduce additional dynamics in the system (i.e., spatial restrictions, human resources availability, etc.). A comparative analysis of the standard values with the sample data confirms the presence and effects of these dynamics.
3.4 Causal analysis
Based on the defined standard values, the individual operation times and the complete turnaround durations are classified and compared in terms of their variability, in order to check if there is a systematic effect between the specific operation duration and the observed turnaround time extension (i.e., recorded AGT).
To identify the causal relationships it is performed a variability analysis between the ‘on time’ and ‘delayed’ individual operations and the turnaround duration. In Figure 5, comparison of the variability by means of box plots diagrams is summarized for all the individual operations. In the first box plot, the comparison for ‘on time’ and ‘delayed’ turnarounds (i.e., AGTs) is provided.
It can be noted in figure 5, that for some cases the specific operation was not performed, then in the box plot graph appears a third box (left hand side), which corresponds to the AGT duration mean and variability in absence of this specific operation. The above condition applies for Catering, Potable water servicing, Toilet servicing or PRM servicing operations.
Based on the former results and with the aim to identify threshold delay values to improve the reliability of the turnaround process, it has been analysed the critical delay values to determine when an operation individual delay may become a disruption for the turnaround time duration, together with their frequency of occurrence. Thus, it has been performed the comparison of the cumulative probability plot for the observed values from each operation classified when were executed in a turnaround determined as ‘delayed’ or determined as ‘on time’. Figure 6, includes all the comparisons. In the
Page 7 of 23
URL: http:/mc.manuscriptcentral.com/transportmetrica
Transportmetrica B: Transport Dynamics
123456789101112131415161718192021222324252627282930313233343536373839404142434445464748495051525354555657585960
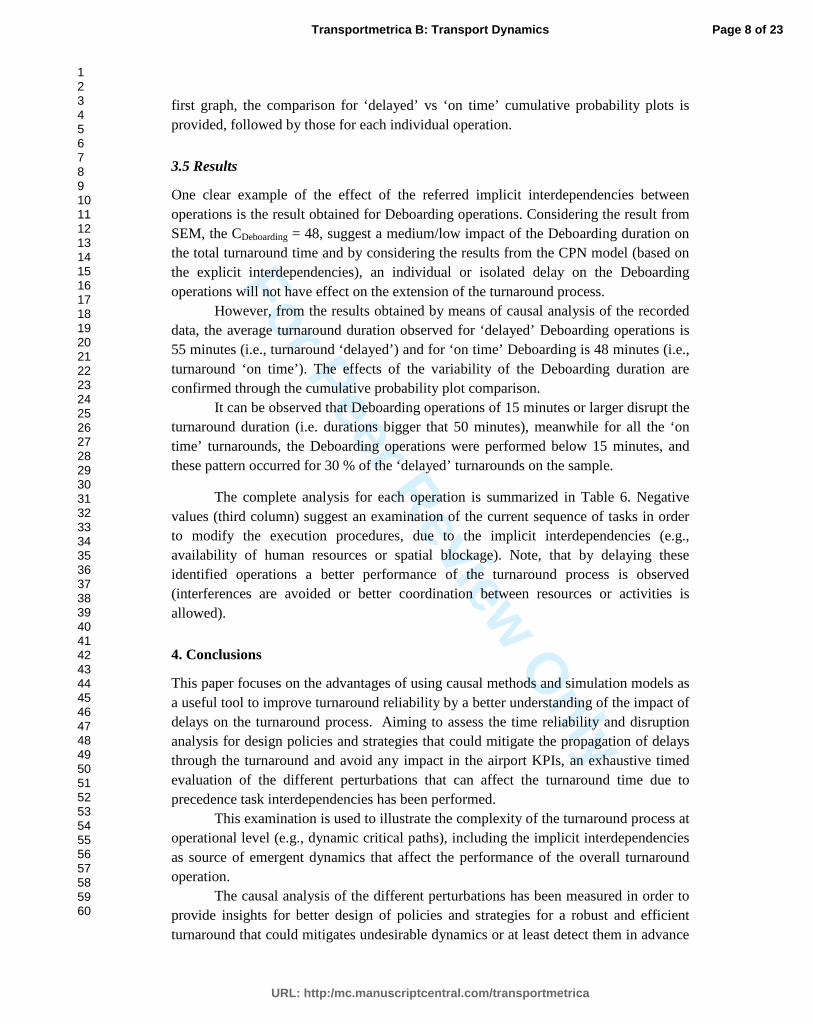
For Peer Review O
nly
first graph, the comparison for ‘delayed’ vs ‘on time’ cumulative probability plots is provided, followed by those for each individual operation.
3.5 Results
One clear example of the effect of the referred implicit interdependencies between operations is the result obtained for Deboarding operations. Considering the result from SEM, the CDeboarding = 48, suggest a medium/low impact of the Deboarding duration on the total turnaround time and by considering the results from the CPN model (based on the explicit interdependencies), an individual or isolated delay on the Deboarding operations will not have effect on the extension of the turnaround process.
However, from the results obtained by means of causal analysis of the recorded data, the average turnaround duration observed for ‘delayed’ Deboarding operations is 55 minutes (i.e., turnaround ‘delayed’) and for ‘on time’ Deboarding is 48 minutes (i.e., turnaround ‘on time’). The effects of the variability of the Deboarding duration are confirmed through the cumulative probability plot comparison.
It can be observed that Deboarding operations of 15 minutes or larger disrupt the turnaround duration (i.e. durations bigger that 50 minutes), meanwhile for all the ‘on time’ turnarounds, the Deboarding operations were performed below 15 minutes, and these pattern occurred for 30 % of the ‘delayed’ turnarounds on the sample.
The complete analysis for each operation is summarized in Table 6. Negative values (third column) suggest an examination of the current sequence of tasks in order to modify the execution procedures, due to the implicit interdependencies (e.g., availability of human resources or spatial blockage). Note, that by delaying these identified operations a better performance of the turnaround process is observed (interferences are avoided or better coordination between resources or activities is allowed).
4. Conclusions
This paper focuses on the advantages of using causal methods and simulation models as a useful tool to improve turnaround reliability by a better understanding of the impact of delays on the turnaround process. Aiming to assess the time reliability and disruption analysis for design policies and strategies that could mitigate the propagation of delays through the turnaround and avoid any impact in the airport KPIs, an exhaustive timed evaluation of the different perturbations that can affect the turnaround time due to precedence task interdependencies has been performed.
This examination is used to illustrate the complexity of the turnaround process at operational level (e.g., dynamic critical paths), including the implicit interdependencies as source of emergent dynamics that affect the performance of the overall turnaround operation.
The causal analysis of the different perturbations has been measured in order to provide insights for better design of policies and strategies for a robust and efficient turnaround that could mitigates undesirable dynamics or at least detect them in advance
Page 8 of 23
URL: http:/mc.manuscriptcentral.com/transportmetrica
Transportmetrica B: Transport Dynamics
123456789101112131415161718192021222324252627282930313233343536373839404142434445464748495051525354555657585960

For Peer Review O
nly
and enhance the robustness of the turnaround and their related processes and actors performance (e.g., airlines, airports, ground handlers, etc.) with direct and indirect impact on ATM system reliability.
Acknowledgements
This work is partially funded by INnovative TEchnologies and Research for a new Airport Concept towards Turnaround coordinatION (INTERACTION project) web page: http://www.interaction-aero.eu/, and the support of CONACYT through the Scholarship program. References [Abd 2014] Abd, Allah Makhloof, M., M. Elsayed Waheed, and Usama A. El-Raouf Badawi. Real-time aircraft turnaround operations manager. Production Planning & Control 25.1 (2014): 2-25. [Baker 2015] Baker, Douglas, Rico Merkert, and Md Kamruzzaman. Regional aviation and economic growth: cointegration and causality analysis in Australia. Journal of Transport Geography 43 (2015): 140-150. [Brooker 2008] Brooker, Peter. SESAR and NextGen: investing in new paradigms. Journal of navigation 61.02 (2008): 195-208. [Narciso 2012] Narciso, Mercedes E., Miquel A. Piera, and Antoni Guasch. A time stamp reduction method for state space exploration using colored Petri nets. Simulation 88.5 (2012): 592-616. [Narciso 2015] Narciso, Mercedes E., and Miquel A. Piera. Robust gate assignment procedures from an airport management perspective. Omega 50 (2015): 82-95. [Nosedal 2014] Nosedal, Jenaro, et al. An efficient algorithm for smoothing airspace congestion by fine-tuning take-off times. Transportation Research Part C: Emerging Technologies 44 (2014): 171-184. [Nosedal 2015] Nosedal, Jenaro, et al. An optimization model to fit airspace demand considering a spatio-temporal analysis of airspace capacity. Transportation Research Part C: Emerging Technologies (2015): In press. [Piera 2009] Piera, Miquel. et. al. Airport logistics operations. Simulation-Based Case Studies in Logistics. Springer London, (2009), 209-228.
Page 9 of 23
URL: http:/mc.manuscriptcentral.com/transportmetrica
Transportmetrica B: Transport Dynamics
123456789101112131415161718192021222324252627282930313233343536373839404142434445464748495051525354555657585960
For Peer Review O
nly
[Piera 2014] Piera, M. et. al. Causal simulation models for facing third millennium air transport sustainability. Simulation: Transactions of the Society for Modeling and Simulation International 2014, Vol.90 (2) 162-170 [Ruiz 2013] Ruiz, Sergio, Miquel A. Piera, and Isabel Del Pozo. "A medium term conflict detection and resolution system for terminal maneuvering area based on spatial data structures and 4D trajectories." Transportation Research Part C: Emerging Technologies 26 (2013): 396-417. [WU 2008] Wu, Cheng-Lung. Monitoring aircraft turnaround operations–framework development, application and implications for airline operations. Transportation Planning and Technology 31.2 (2008): 215-228. [Zúñiga 2013] Zúñiga, C. A., et al. "A CD&CR causal model based on path shortening/path stretching techniques." Transportation Research Part C: Emerging Technologies 33 (2013): 238-256. List of Tables. Table 1. Ramp layout and equipment for ground services. Table 2. Ground services by operations. Table 3. Individual duration standards for “on time” and “delayed” operations. Table 4. Simulations result summary for individual delays Table 5. Simulation of different combinations for individual delayed operations Table 6. Causal analysis results for individual delayed operations List of Figures. Figure 1. Turnaround process, equipment and ramp layout. Figure 2. Distribution for 106 records of AGT in PBB (without out-layers) and percentage of delayed and on time operations in PBB for recorded AGT. Figure 3. Cleaning times distribution for the sample and percentage of delayed and on time cleaning operations. Figure 4. CPN model to simulate the complete turnaround process. Figure 5. Variability analysis delayed vs on time operations (comparison of median values for turnaround duration).
Figure 6. Empirical cumulative distribution plots.
Page 10 of 23
URL: http:/mc.manuscriptcentral.com/transportmetrica
Transportmetrica B: Transport Dynamics
123456789101112131415161718192021222324252627282930313233343536373839404142434445464748495051525354555657585960
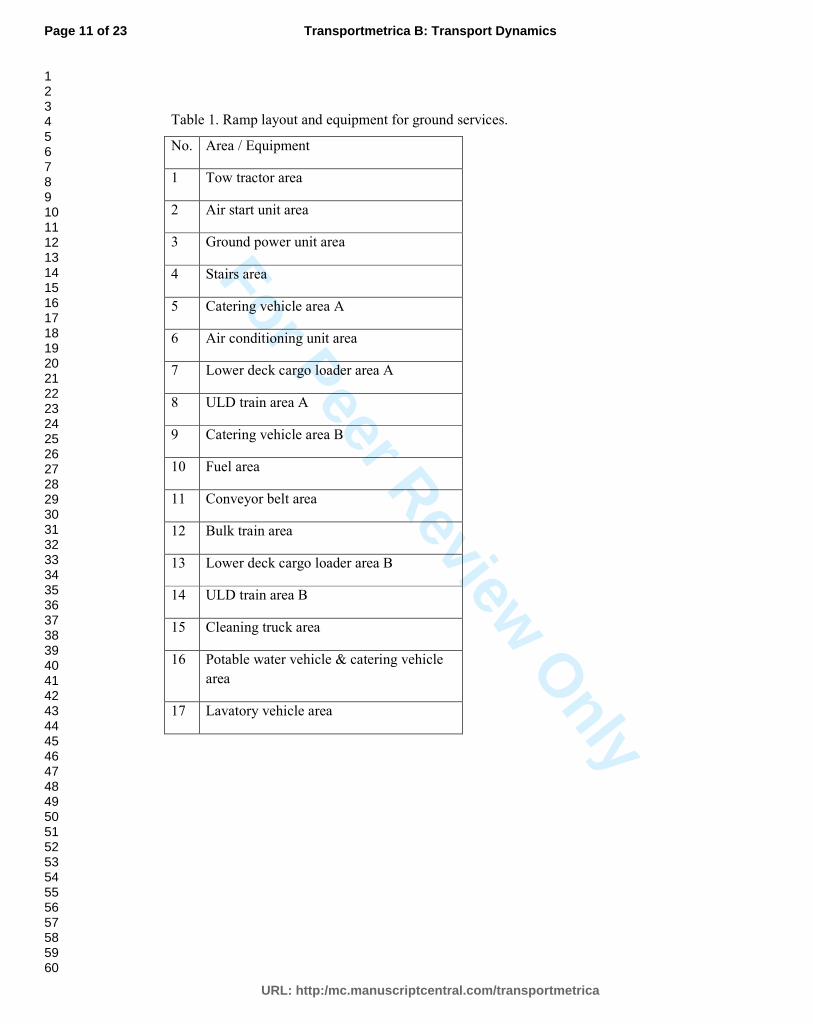
For Peer Review O
nly
Table 1. Ramp layout and equipment for ground services.
No. Area / Equipment
1 Tow tractor area
2 Air start unit area
3 Ground power unit area
4 Stairs area
5 Catering vehicle area A
6 Air conditioning unit area
7 Lower deck cargo loader area A
8 ULD train area A
9 Catering vehicle area B
10 Fuel area
11 Conveyor belt area
12 Bulk train area
13 Lower deck cargo loader area B
14 ULD train area B
15 Cleaning truck area
16 Potable water vehicle & catering vehicle
area
17 Lavatory vehicle area
Page 11 of 23
URL: http:/mc.manuscriptcentral.com/transportmetrica
Transportmetrica B: Transport Dynamics
123456789101112131415161718192021222324252627282930313233343536373839404142434445464748495051525354555657585960
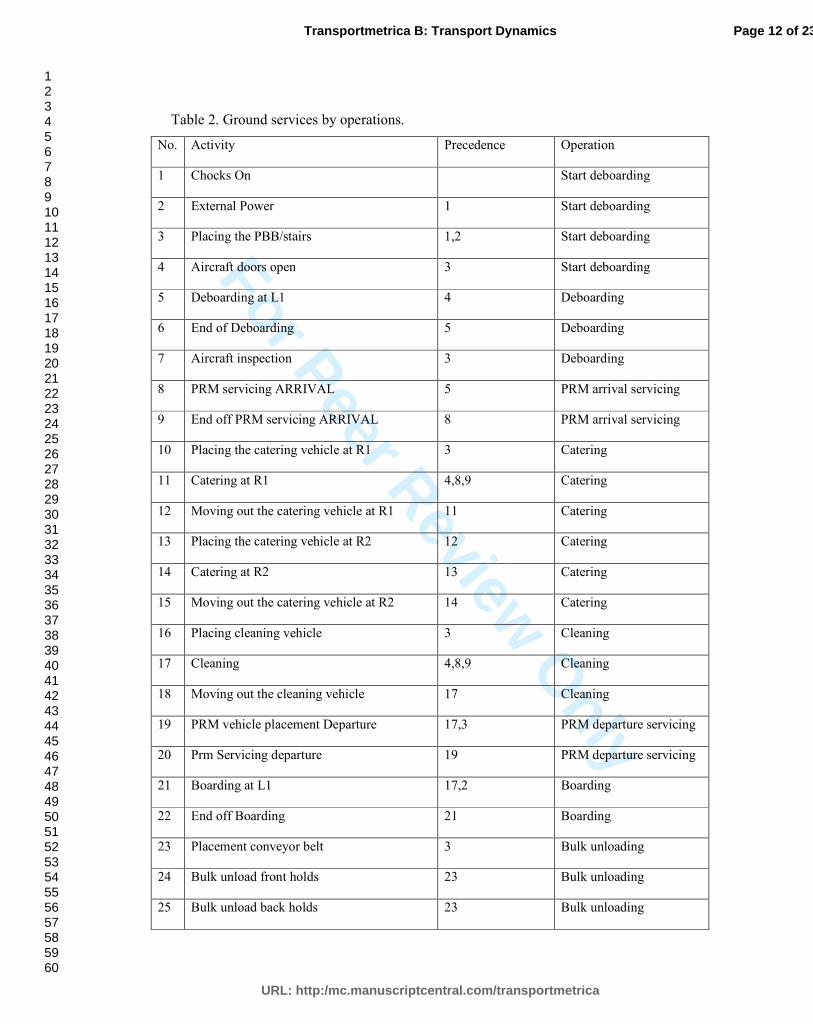
For Peer Review O
nly
Table 2. Ground services by operations.
No. Activity Precedence Operation
1 Chocks On Start deboarding
2 External Power 1 Start deboarding
3 Placing the PBB/stairs 1,2 Start deboarding
4 Aircraft doors open 3 Start deboarding
5 Deboarding at L1 4 Deboarding
6 End of Deboarding 5 Deboarding
7 Aircraft inspection 3 Deboarding
8 PRM servicing ARRIVAL 5 PRM arrival servicing
9 End off PRM servicing ARRIVAL 8 PRM arrival servicing
10 Placing the catering vehicle at R1 3 Catering
11 Catering at R1 4,8,9 Catering
12 Moving out the catering vehicle at R1 11 Catering
13 Placing the catering vehicle at R2 12 Catering
14 Catering at R2 13 Catering
15 Moving out the catering vehicle at R2 14 Catering
16 Placing cleaning vehicle 3 Cleaning
17 Cleaning 4,8,9 Cleaning
18 Moving out the cleaning vehicle 17 Cleaning
19 PRM vehicle placement Departure 17,3 PRM departure servicing
20 Prm Servicing departure 19 PRM departure servicing
21 Boarding at L1 17,2 Boarding
22 End off Boarding 21 Boarding
23 Placement conveyor belt 3 Bulk unloading
24 Bulk unload front holds 23 Bulk unloading
25 Bulk unload back holds 23 Bulk unloading
Page 12 of 23
URL: http:/mc.manuscriptcentral.com/transportmetrica
Transportmetrica B: Transport Dynamics
123456789101112131415161718192021222324252627282930313233343536373839404142434445464748495051525354555657585960
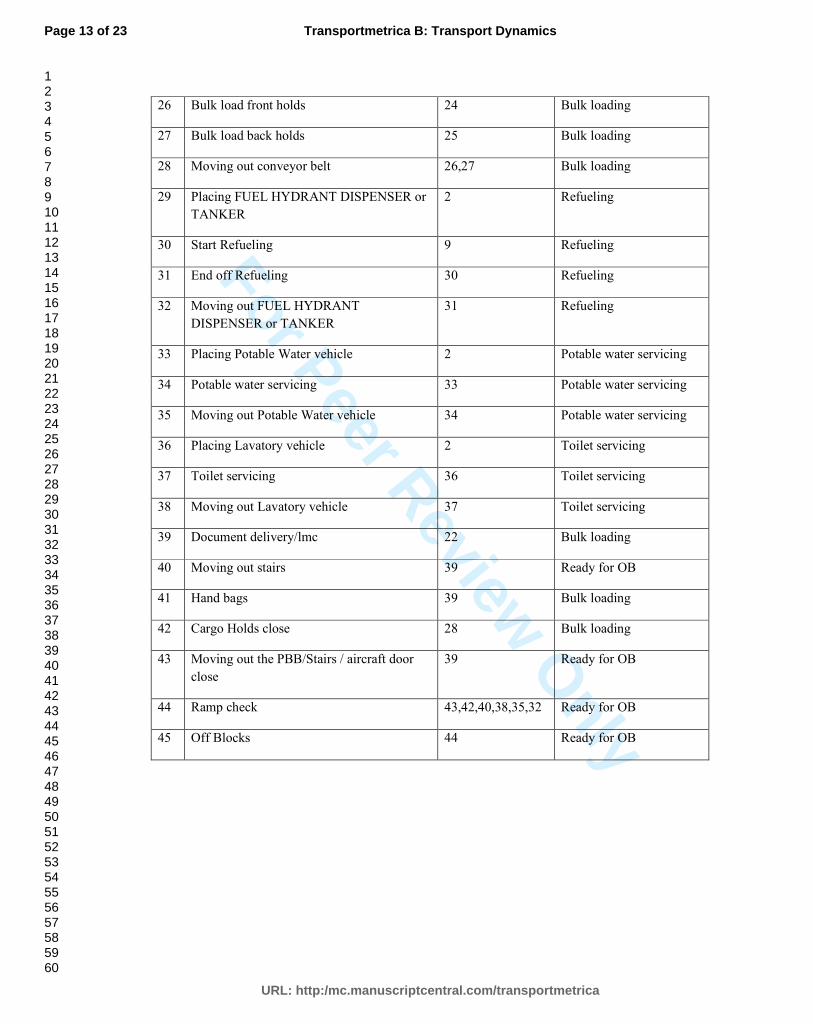
For Peer Review O
nly
26 Bulk load front holds 24 Bulk loading
27 Bulk load back holds 25 Bulk loading
28 Moving out conveyor belt 26,27 Bulk loading
29 Placing FUEL HYDRANT DISPENSER or
TANKER
2 Refueling
30 Start Refueling 9 Refueling
31 End off Refueling 30 Refueling
32 Moving out FUEL HYDRANT
DISPENSER or TANKER
31 Refueling
33 Placing Potable Water vehicle 2 Potable water servicing
34 Potable water servicing 33 Potable water servicing
35 Moving out Potable Water vehicle 34 Potable water servicing
36 Placing Lavatory vehicle 2 Toilet servicing
37 Toilet servicing 36 Toilet servicing
38 Moving out Lavatory vehicle 37 Toilet servicing
39 Document delivery/lmc 22 Bulk loading
40 Moving out stairs 39 Ready for OB
41 Hand bags 39 Bulk loading
42 Cargo Holds close 28 Bulk loading
43 Moving out the PBB/Stairs / aircraft door
close
39 Ready for OB
44 Ramp check 43,42,40,38,35,32 Ready for OB
45 Off Blocks 44 Ready for OB
Page 13 of 23
URL: http:/mc.manuscriptcentral.com/transportmetrica
Transportmetrica B: Transport Dynamics
123456789101112131415161718192021222324252627282930313233343536373839404142434445464748495051525354555657585960
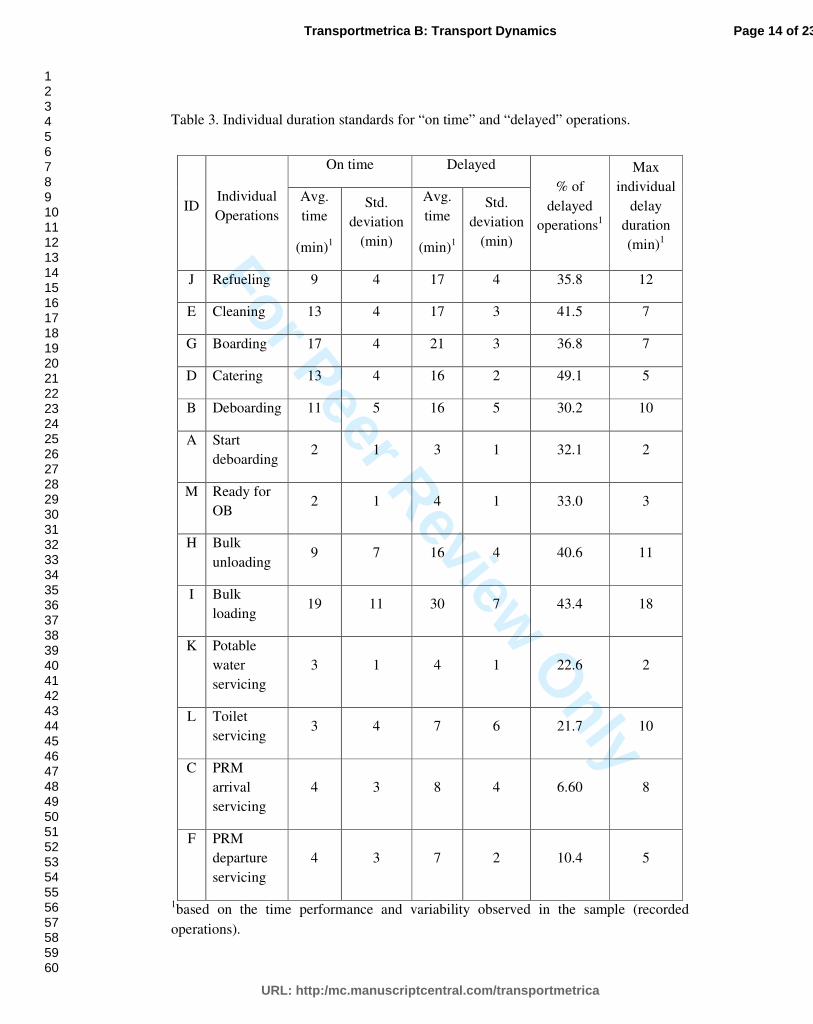
For Peer Review O
nly
Table 3. Individual duration standards for “on time” and “delayed” operations.
ID Individual
Operations
On time Delayed
% of
delayed
operations1
Max
individual
delay
duration
(min)1
Avg.
time
(min)1
Std.
deviation
(min)
Avg.
time
(min)1
Std.
deviation
(min)
J Refueling 9 4 17 4 35.8 12
E Cleaning 13 4 17 3 41.5 7
G Boarding 17 4 21 3 36.8 7
D Catering 13 4 16 2 49.1 5
B Deboarding 11 5 16 5 30.2 10
A Start
deboarding 2 1 3 1 32.1 2
M Ready for
OB 2 1 4 1 33.0 3
H Bulk
unloading 9 7 16 4 40.6 11
I Bulk
loading 19 11 30 7 43.4 18
K Potable
water
servicing
3 1 4 1 22.6 2
L Toilet
servicing 3 4 7 6 21.7 10
C PRM
arrival
servicing
4 3 8 4 6.60 8
F PRM
departure
servicing
4 3 7 2 10.4 5
1based on the time performance and variability observed in the sample (recorded
operations).
Page 14 of 23
URL: http:/mc.manuscriptcentral.com/transportmetrica
Transportmetrica B: Transport Dynamics
123456789101112131415161718192021222324252627282930313233343536373839404142434445464748495051525354555657585960
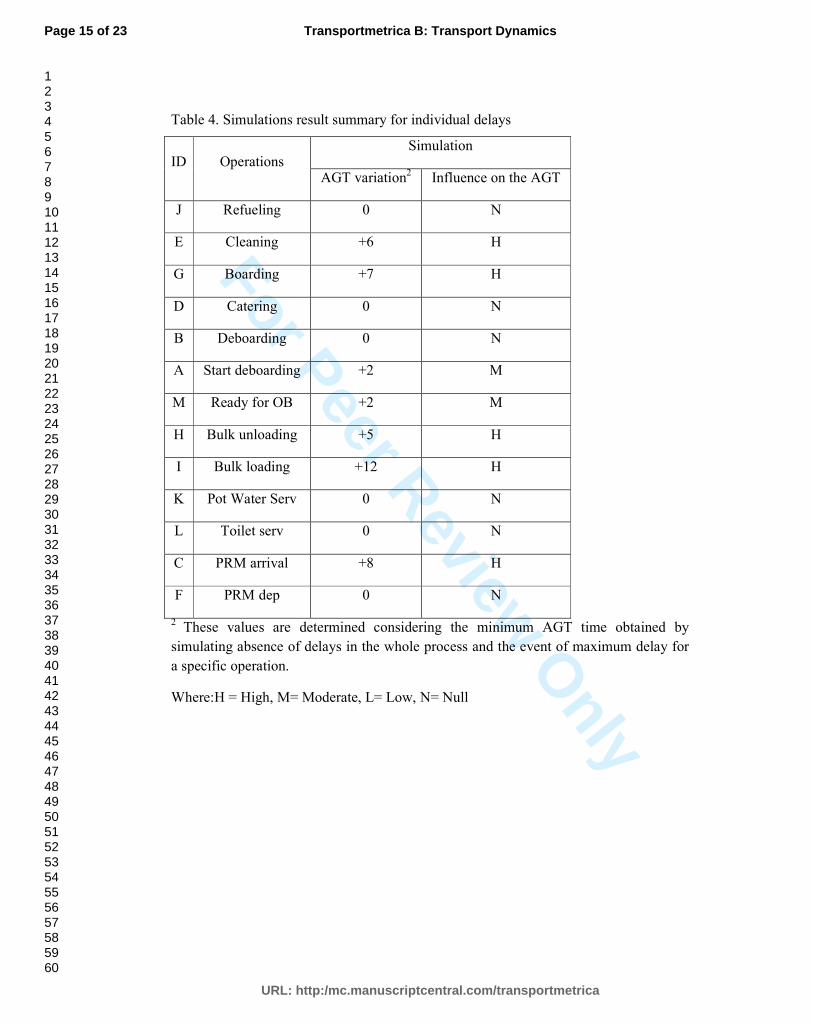
For Peer Review O
nly
Table 4. Simulations result summary for individual delays
ID Operations Simulation
AGT variation2 Influence on the AGT
J Refueling 0 N
E Cleaning +6 H
G Boarding +7 H
D Catering 0 N
B Deboarding 0 N
A Start deboarding +2 M
M Ready for OB +2 M
H Bulk unloading +5 H
I Bulk loading +12 H
K Pot Water Serv 0 N
L Toilet serv 0 N
C PRM arrival +8 H
F PRM dep 0 N
2 These values are determined considering the minimum AGT time obtained by
simulating absence of delays in the whole process and the event of maximum delay for
a specific operation.
Where: H = High, M= Moderate, L= Low, N= Null
Page 15 of 23
URL: http:/mc.manuscriptcentral.com/transportmetrica
Transportmetrica B: Transport Dynamics
123456789101112131415161718192021222324252627282930313233343536373839404142434445464748495051525354555657585960
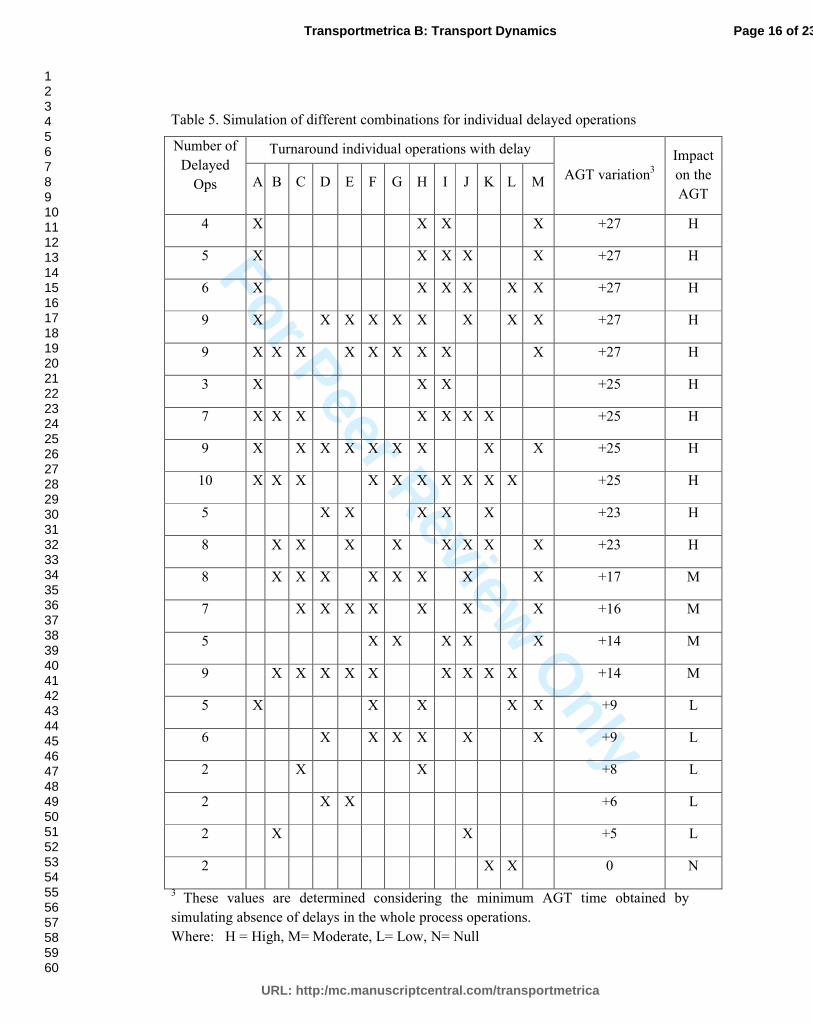
For Peer Review O
nly
Table 5. Simulation of different combinations for individual delayed operations
Number of
Delayed
Ops
Turnaround individual operations with delay
AGT variation3
Impact
on the
AGT A B C D E F G H I J K L M
4 X X X X +27 H
5 X X X X X +27 H
6 X X X X X X +27 H
9 X X X X X X X X X +27 H
9 X X X X X X X X X +27 H
3 X X X +25 H
7 X X X X X X X +25 H
9 X X X X X X X X X +25 H
10 X X X X X X X X X X +25 H
5 X X X X X +23 H
8 X X X X X X X X +23 H
8 X X X X X X X X +17 M
7 X X X X X X X +16 M
5 X X X X X +14 M
9 X X X X X X X X X +14 M
5 X X X X X +9 L
6 X X X X X X +9 L
2 X X +8 L
2 X X +6 L
2 X X +5 L
2 X X 0 N
3 These values are determined considering the minimum AGT time obtained by
simulating absence of delays in the whole process operations.
Where: H = High, M= Moderate, L= Low, N= Null
Page 16 of 23
URL: http:/mc.manuscriptcentral.com/transportmetrica
Transportmetrica B: Transport Dynamics
123456789101112131415161718192021222324252627282930313233343536373839404142434445464748495051525354555657585960
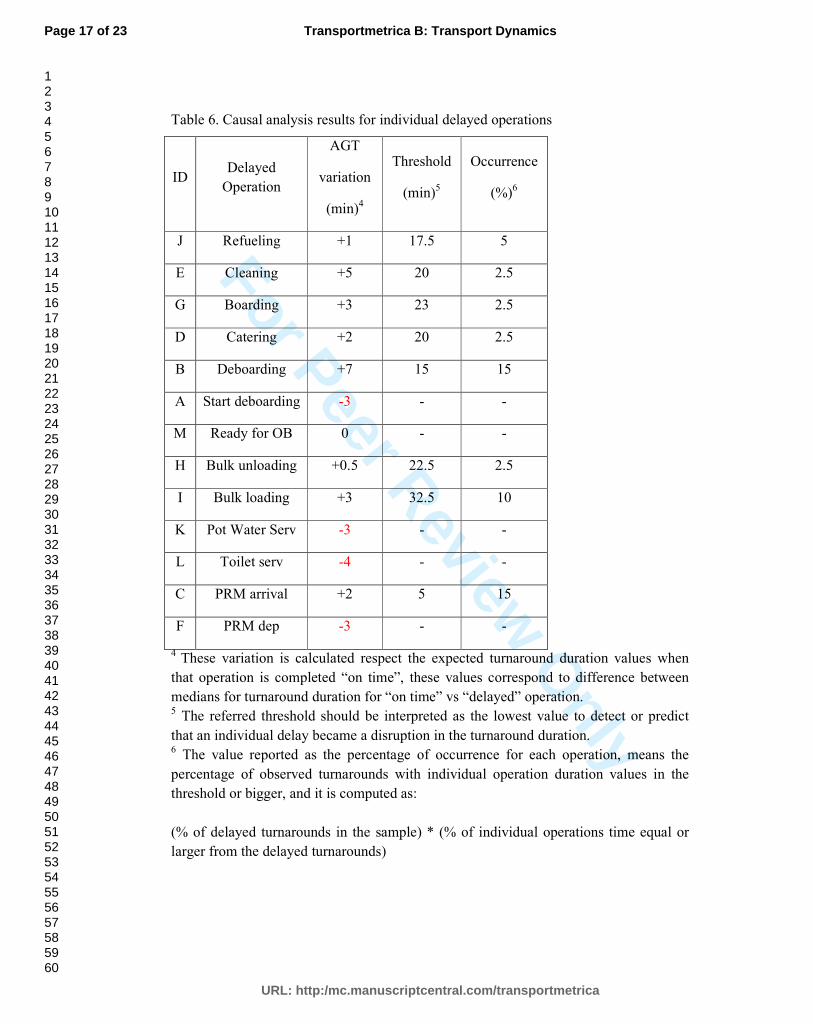
For Peer Review O
nly
Table 6. Causal analysis results for individual delayed operations
ID Delayed
Operation
AGT
variation
(min)4
Threshold
(min)5
Occurrence
(%)6
J Refueling +1 17.5 5
E Cleaning +5 20 2.5
G Boarding +3 23 2.5
D Catering +2 20 2.5
B Deboarding +7 15 15
A Start deboarding -3 - -
M Ready for OB 0 - -
H Bulk unloading +0.5 22.5 2.5
I Bulk loading +3 32.5 10
K Pot Water Serv -3 - -
L Toilet serv -4 - -
C PRM arrival +2 5 15
F PRM dep -3 - -
4 These variation is calculated respect the expected turnaround duration values when
that operation is completed “on time”, these values correspond to difference between
medians for turnaround duration for “on time” vs “delayed” operation. 5 The referred threshold should be interpreted as the lowest value to detect or predict
that an individual delay became a disruption in the turnaround duration. 6 The value reported as the percentage of occurrence for each operation, means the
percentage of observed turnarounds with individual operation duration values in the
threshold or bigger, and it is computed as:
(% of delayed turnarounds in the sample) * (% of individual operations time equal or
larger from the delayed turnarounds)
Page 17 of 23
URL: http:/mc.manuscriptcentral.com/transportmetrica
Transportmetrica B: Transport Dynamics
123456789101112131415161718192021222324252627282930313233343536373839404142434445464748495051525354555657585960
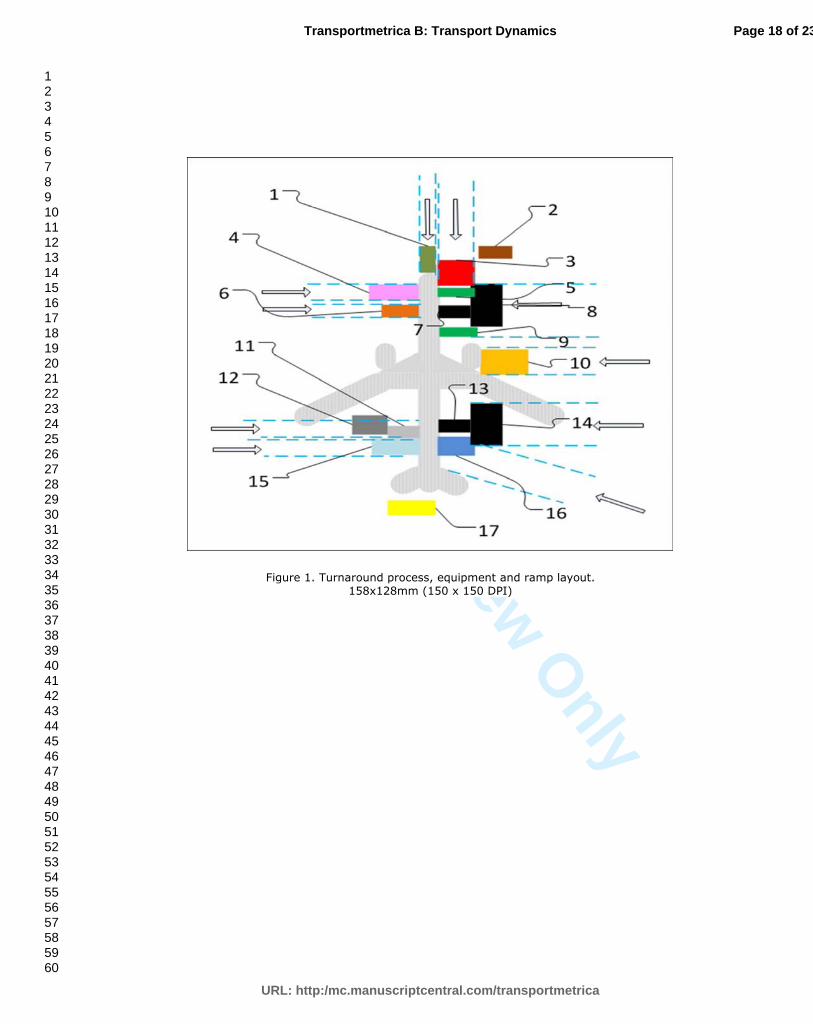
For Peer Review O
nly
Figure 1. Turnaround process, equipment and ramp layout.
158x128mm (150 x 150 DPI)
Page 18 of 23
URL: http:/mc.manuscriptcentral.com/transportmetrica
Transportmetrica B: Transport Dynamics
123456789101112131415161718192021222324252627282930313233343536373839404142434445464748495051525354555657585960
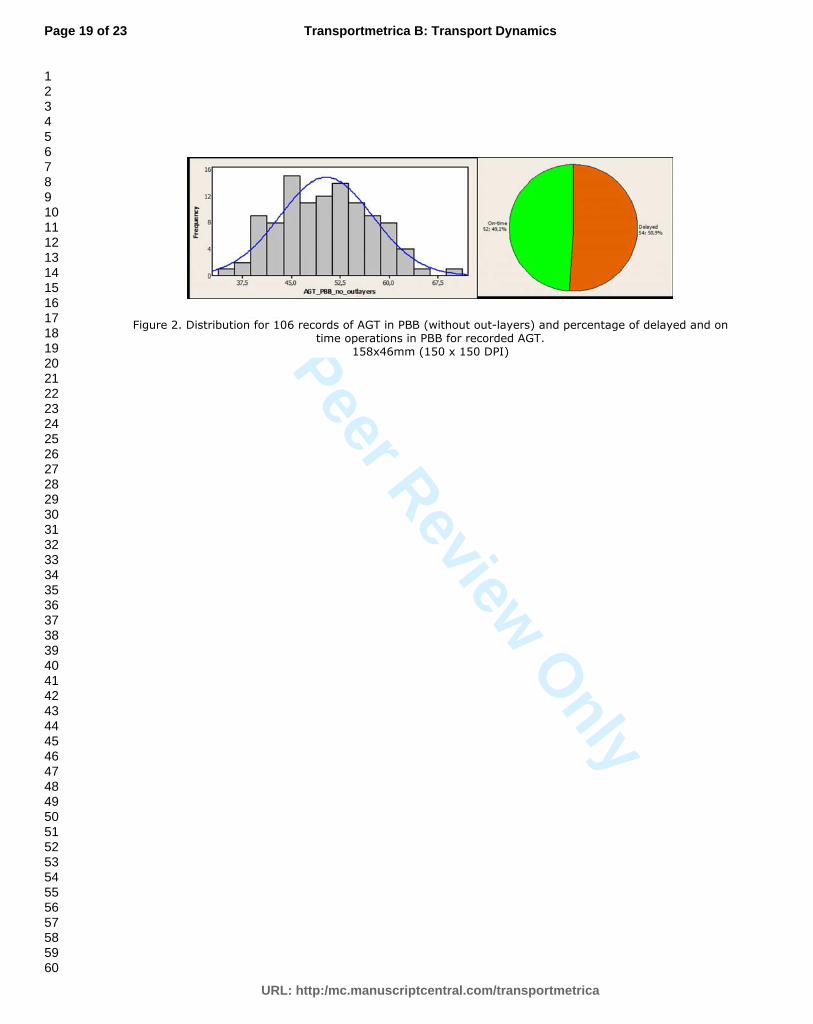
For Peer Review O
nly
Figure 2. Distribution for 106 records of AGT in PBB (without out-layers) and percentage of delayed and on time operations in PBB for recorded AGT.
158x46mm (150 x 150 DPI)
Page 19 of 23
URL: http:/mc.manuscriptcentral.com/transportmetrica
Transportmetrica B: Transport Dynamics
123456789101112131415161718192021222324252627282930313233343536373839404142434445464748495051525354555657585960
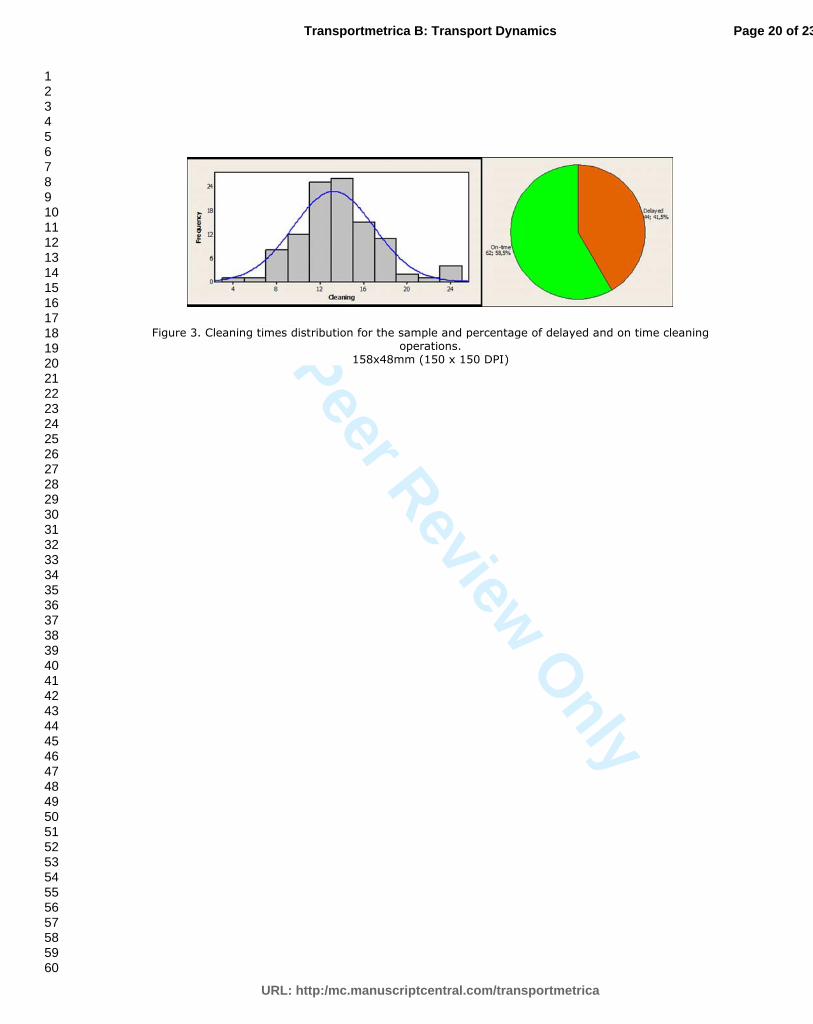
For Peer Review O
nly
Figure 3. Cleaning times distribution for the sample and percentage of delayed and on time cleaning operations.
158x48mm (150 x 150 DPI)
Page 20 of 23
URL: http:/mc.manuscriptcentral.com/transportmetrica
Transportmetrica B: Transport Dynamics
123456789101112131415161718192021222324252627282930313233343536373839404142434445464748495051525354555657585960
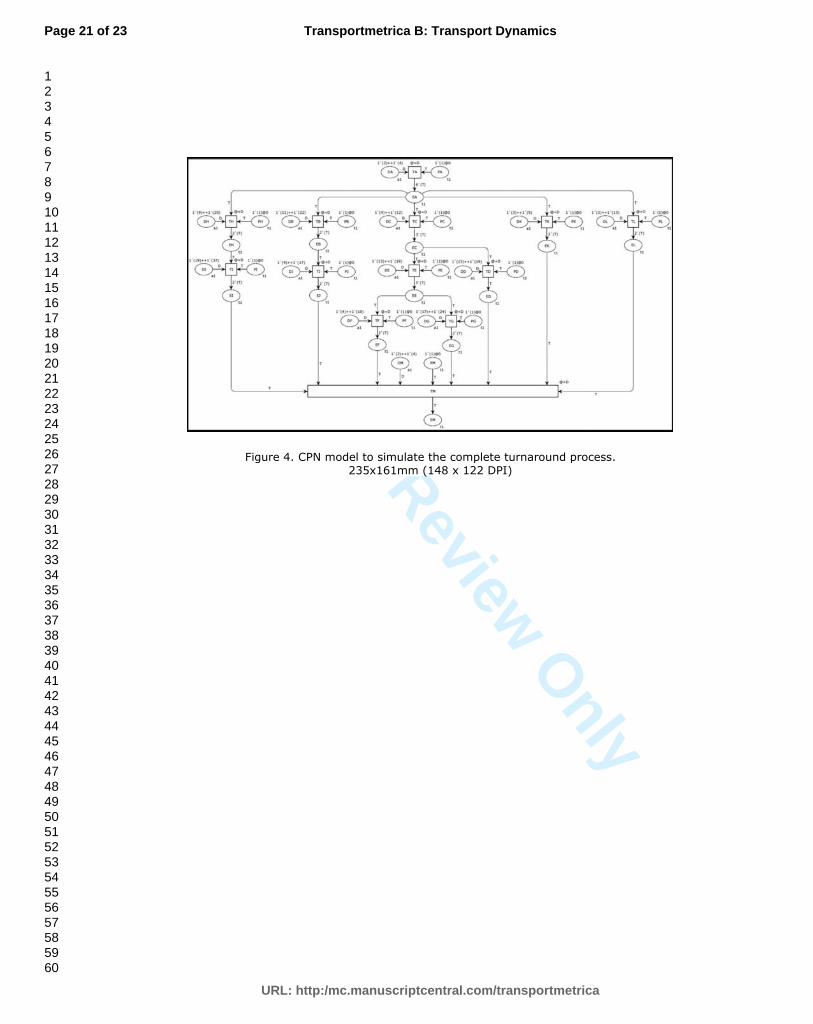
For Peer Review O
nly
Figure 4. CPN model to simulate the complete turnaround process.
235x161mm (148 x 122 DPI)
Page 21 of 23
URL: http:/mc.manuscriptcentral.com/transportmetrica
Transportmetrica B: Transport Dynamics
123456789101112131415161718192021222324252627282930313233343536373839404142434445464748495051525354555657585960
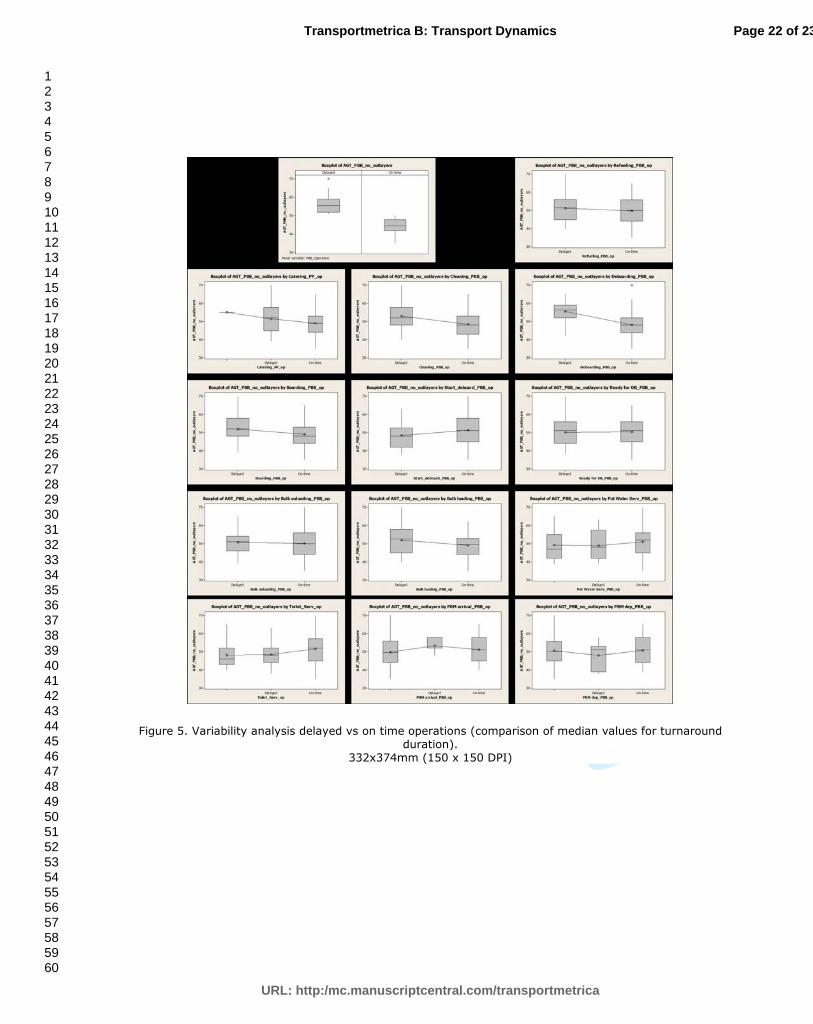
For Peer Review O
nly
Figure 5. Variability analysis delayed vs on time operations (comparison of median values for turnaround duration).
332x374mm (150 x 150 DPI)
Page 22 of 23
URL: http:/mc.manuscriptcentral.com/transportmetrica
Transportmetrica B: Transport Dynamics
123456789101112131415161718192021222324252627282930313233343536373839404142434445464748495051525354555657585960
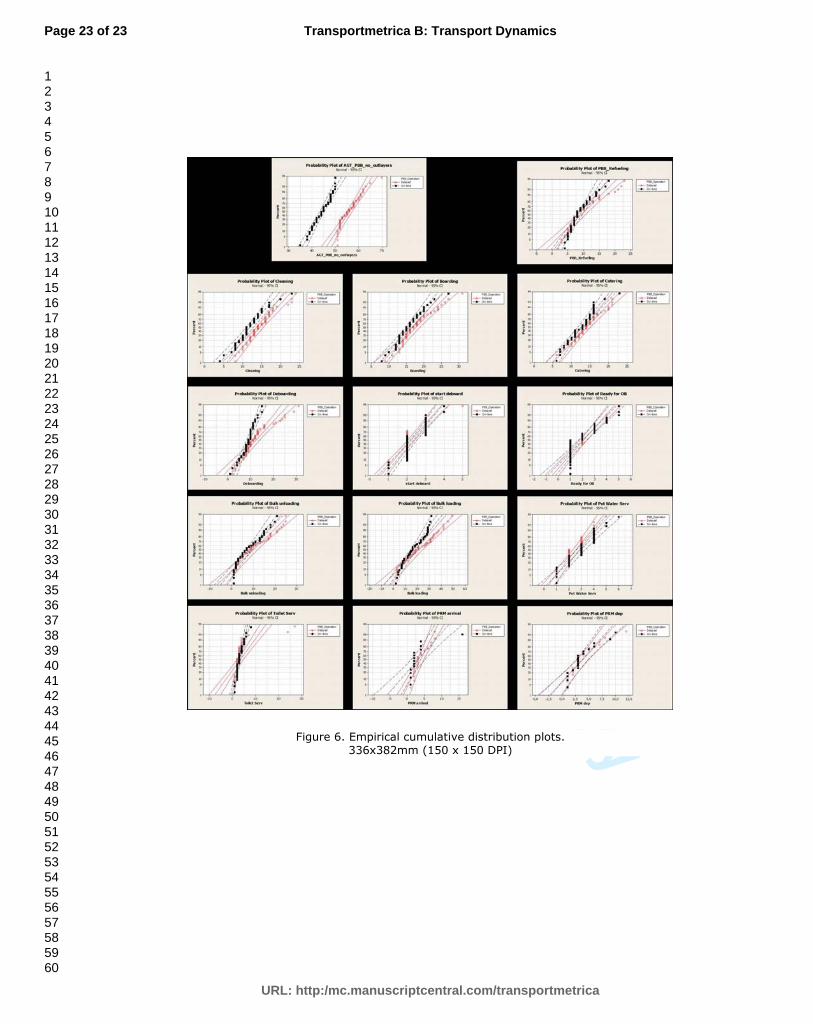
For Peer Review O
nly
Figure 6. Empirical cumulative distribution plots.
336x382mm (150 x 150 DPI)
Page 23 of 23
URL: http:/mc.manuscriptcentral.com/transportmetrica
Transportmetrica B: Transport Dynamics
123456789101112131415161718192021222324252627282930313233343536373839404142434445464748495051525354555657585960
References
[1] M Abd Allah Makhloof, M Elsayed Waheed, and Usama A El-Raouf Badawi,Real-time aircraft turnaround operations manager, Production Planning & Con-trol 25 (2014), no. 1, 2–25.
[2] Sameer Alam, Hussein Abbass, Michael Barlow, et al., Atoms: Air traffic op-erations and management simulator, Intelligent Transportation Systems, IEEETransactions on 9 (2008), no. 2, 209–225.
[3] N. Barnier, B. Pascal, and R. Thomas, Slot allocation with constraint program-ming: models and results, In: Proceedings of the 4th USA/Europe Air TrafficManagement Research and Development Seminar (2001).
[4] Amitabh Basu, Joseph SB Mitchell, and Girish Kumar Sabhnani, Geometricalgorithms for optimal airspace design and air traffic controller workload bal-ancing, Journal of Experimental Algorithmics (JEA) 14 (2009), 3.
[5] D. Bertsimas and S. Gupta, A proposal for network air traffic flow managementincorporating fairness and airline collaboration, Operations Research (2011).
[6] D. Bertsimas and S. Gupta, Fairness and collaboration in network air trafficflow management: An optimization approach, Transportation Science (2015).
[7] Dipasis Bhadra, David A Knorr, and Benjamin Levy, Benefits of virtual queuingat congested airports using asde-x: A case study of jfk airport, Air Traffic ControlQuarterly 20 (2012), no. 3, 225.
[8] Chris Brinton and Steven Lent, Departure queue management in the presenceof traffic management initiatives, Integrated Communications, Navigation andSurveillance Conference (ICNS), 2012, IEEE, 2012, pp. H5–1.
[9] S. Carlier, Environmental impact of air traffic flow management delays, In: Pro-ceedings of the 7th USA/Europe Air Traffic Management Research and Devel-opment Seminar 8 (2007).
100
References
[10] Ennio Cascetta, Static and dynamic models of stochastic assignment to trans-portation networks, Flow control of congested networks, Springer, 1987, pp. 91–111.
[11] L. Castelli, R. Pesenti, and A. Ranieri, The design of a market mechanismto allocate air traffic flow management slots, Transport. Res. Part C: Emerg.Technol. 19 (2011), 931–943.
[12] European Commission, Memo 13/666. european commission invests 600 millionin new research to unblock congestion in europes airspace, 2013.
[13] Delahaye Daniel, Sofiane Oussedik, and Puechmorel Stephane, Airspace con-gestion smoothing by multi-objective genetic algorithm, Proceedings of the 2005ACM symposium on Applied computing, ACM, 2005, pp. 907–912.
[14] David De Smedt, Jesper Bronsvoort, and Greg McDonald, Model for longi-tudinal uncertainty during controlled time of arrival operations, Proc. of 11thUSA/Europe Air Traffic Management Research and Development Seminar,2015.
[15] Daniel Delahaye, Jean-Marc Alliot, Marc Schoenauer, and Jean-Loup Farges,Genetic algorithms for partitioning air space, AI 1994, 10th Conference on Ar-tificiel Intelligence for Applications, IEEE, 1994, pp. pp–291.
[16] Prats X. Delgado, L. and B. Sridhar, Cruise speed reduction for ground delayprograms: A case study for san francisco international airport arrivals, Trans-portation Research Part C: Emerging Technologies 36 (2013), 83–96.
[17] J. Djokic, B. Lorenz, and H. Fricke, Air traffic control complexity as workloaddriver, Transport. Res. Part C: Emerg. Technol. 18 (2010), 930–936.
[18] N. Durand, Alliot J. M. Gianazza, D., and J. B. Gotteland, Metaheuristics forair traffic management, John Wiley and Sons., 2016.
[19] Gabriele Enea and Marco Porretta, A comparison of 4d-trajectory operationsenvisioned for nextgen and sesar, some preliminary findings, 28th Congress ofthe International Council of the Aeronautical Sciences, 2012, pp. 23–28.
[20] Eurocontrol, Air traffic flow management operations: Atfm users manual, edi-tion 8.0, 18.3.2002 ed., Eurocontrol CFMU, 2002.
[21] , http://www.cfmu.eurocontrol.int/cfmu/public/standard_page/
about_meetobjectives.html, 2006, [Online; accessed 31-Dec-2015].
101
References
[22] , http://www.eurocontrol.int/articles/
air-traffic-flow-and-capacity-management, 2013, [Online; accessed31-Dec-2015].
[23] , http://www.eurocontrol.int/sites/default/files/
publication/files/jan2015-network-operational-concept-2019.pdf,2014, [Online; accessed 31-Dec-2015].
[24] , Nm glossary, Eurocontrol Lexicon, 2014.
[25] , http://www.eurocontrol.int/swim, 2016, [Online; accessed 15-Ene-2016].
[26] Torsten Fahle, Rainer Feldmann, Silvia Gotz, Sven Grothklags, and BurkhardMonien, The aircraft sequencing problem, Computer science in perspective,Springer, 2003, pp. 152–166.
[27] F. Farhadi, A. Ghoniem, and M. Al-Salem, Runway capacity management anempirical study with application to doha international airport, Transport. Res.Part E: Logist. Transport 68 (2014), 53–63.
[28] J. Ferguson, Estimating domestic us airline cost of delay based on europeanmodel, Transport. Res. Part C: Emerg. Technol. 33 (2013), 313–323.
[29] Pierre Flener and Justin Pearson, Automatic airspace sectorisation: A survey,arXiv preprint arXiv:1311.0653 (2013).
[30] Pierre Flener, Justin Pearson, Magnus Agren, Carlos Garcia-Avello, Mete Celik-tin, and Søren Dissing, Air-traffic complexity resolution in multi-sector planning,Journal of Air Transport Management 13 (2007), no. 6, 323–328.
[31] D. Gianazza, Airspace configuration using air traffic complexity metrics, 7thUSA/Europe Air Traffic Management Research and Development Seminar(2007).
[32] Charles N Glover and Michael O Ball, Stochastic optimization models for grounddelay program planning with equity–efficiency tradeoffs, Transportation ResearchPart C: Emerging Technologies 33 (2013), 196–202.
[33] Jean-Baptiste Gotteland, Nicolas Durand, and Jean-Marc Alliot, Handling cfmuslots in busy airports, ATM 2003, 5th USA/Europe Air Traffic ManagementResearch and Development Seminar, 2003.
102
References
[34] M.P. Helme, Reducing air traffic delay in a space-time network, Proc. IEEEInternational Conference on Systems, Man and Cybernetics October (1992),236–242.
[35] Bruce N Janson and Juan Robles, Dynamic traffic assignment with arrival timecosts., Transportation and traffic theory (1993).
[36] Amy Kim and Mark Hansen, A framework for the assessment of collaborative enroute resource allocation strategies, Transportation Research Part C: EmergingTechnologies 33 (2013), 324–339.
[37] Joel K Klooster and David de Smedt, Controlled time of arrival spacing analysis,Proceedings of the Ninth USA/Europe Air Traffic Management Research andDevelopment Seminar (ATM2011), Berlin, Germany, 2011.
[38] P. Kopardekar, J. Rhodes, A. Schwartz, S. Magyarits, and B. Willems, Relation-ship of maximum manageable air traffic control complexity and sector capacity,In: Proc. 26th International Congress of the Aeronautical Sciences (2008), 15–19.
[39] Parimal Kopardekar, Karl Bilimoria, and Banavar Sridhar, Initial concepts fordynamic airspace configuration, 7th AIAA aviation technology, integration andoperations conference (ATIO), Belfast, Northern Ireland, 2007, pp. 18–20.
[40] B. Korn, 4d trajectory management in the extended tma: coupling aman and 4dfms for optimized approach trajectories, In: Proceedings of the ICAS Conference(2006).
[41] Keumjin Lee, Eric Feron, and Amy Pritchett, Air traffic complexity: an input-output approach, American Control Conference, 2007. ACC’07, IEEE, 2007,pp. 474–479.
[42] Huapu Lu and Ye Shi, Complexity of public transport networks, Tsinghua Science& Technology 12 (2007), no. 2, 204–213.
[43] Kostas Margellos and John Lygeros, Toward 4-d trajectory management in airtraffic control: a study based on monte carlo simulation and reachability analysis,Control Systems Technology, IEEE Transactions on 21 (2013), no. 5, 1820–1833.
[44] Lionnel Maugis, Mathematical programming for the air traffic flow managementproblem with en-route capacities, in Proceedings of the 14th Triennial WorldConference of the International Federation of Operational Research Societies,1996.
103
References
[45] PK. Menon and S.R. Grabbe, Multi-dimensional d-transform approach to mod-eling and control of the air traffic environment, AIAA Guidance, Navigation,and Control Conference and Exhibit, 2006, p. 6230.
[46] Ryuhei Mori, Aircraft ground-taxiing model for congested airport using cellularautomata, Intelligent Transportation Systems, IEEE Transactions on 14 (2013),no. 1, 180–188.
[47] Anna Nagurney, Network economics: A variational inequality approach, vol. 10,Springer Science & Business Media, 2013.
[48] Mercedes E Narciso and Miquel A Piera, Robust gate assignment proceduresfrom an airport management perspective, Omega 50 (2015), 82–95.
[49] Fedja Netjasov and Obrad Babic, Framework for airspace planning and designbased on conflict risk assessment: Part 3: Conflict risk assessment model forairspace operational and current day planning, Transportation Research Part C:Emerging Technologies 32 (2013), 31–47.
[50] Srinivas Peeta and Athanasios K Ziliaskopoulos, Foundations of dynamic trafficassignment: The past, the present and the future, Networks and Spatial Eco-nomics 1 (2001), no. 3-4, 233–265.
[51] Paola Pellegrini, Lorenzo Castelli, and Raffaele Pesenti, Metaheuristic algo-rithms for the simultaneous slot allocation problem, IET Intelligent TransportSystems 6 (2012), no. 4, 453–462.
[52] M.A. Piera, Causal simulation models for facing third millennium air transportsustainability, Trans. Soc. Model. Simul. Int. 90 (2014), 162–170.
[53] M. Prandini, Toward air traffic complexity assessment in new generation airtraffic management systems, Trans. Intell. Transp. Syst. 12 (2011), 809–818.
[54] T. Prevot, Atm concept integrating trajectory-orientation and airborne separa-tion assistance in the presence of time-based traffic flow management, In: Pro-ceedings of Digital Avionics Systems Conference 1 (2003).
[55] Damien Prot, Christophe Rapine, Sophie Constans, and Remy Fondacci, A4d-sequencing approach for air traffic management, European Journal of Oper-ational Research 237 (2014), no. 2, 411–425.
[56] Nikolas Pyrgiotis, Kerry M Malone, and Amedeo Odoni, Modelling delay prop-agation within an airport network, Transportation Research Part C: EmergingTechnologies 27 (2013), 60–75.
104
References
[57] Single European Sky ATM Research, http://ec.europa.eu/transport/
modes/air/sesar/, 2013, [Online; accessed 31-Dec-2015].
[58] PC Roling and HG Visser, Optimal airport surface traffic planning using mixed-integer linear programming, International Journal of Aerospace Engineering2008 (2008), no. 1, 1.
[59] Sergio Ruiz, Miquel A Piera, Jenaro Nosedal, and Andrea Ranieri, Strategicde-confliction in the presence of a large number of 4d trajectories using a causalmodeling approach, Transportation Research Part C: Emerging Technologies 39(2014), 129–147.
[60] Next Generation Air Transportation System, http://www.faa.gov/nextgen/,2013, [Online; accessed 31-Dec-2015].
[61] Jiangjun Tang, Sameer Alam, Chris Lokan, and Hussein A Abbass, A multi-objective approach for dynamic airspace sectorization using agent based andgeometric models, Transportation research part C: Emerging technologies 21(2012), no. 1, 89–121.
[62] Kairat Tastambekov, Stephane Puechmorel, Daniel Delahaye, and ChistopheRabut, Aircraft trajectory forecasting using local functional regression in sobolevspace, Transportation research part C: emerging technologies 39 (2014), 1–22.
[63] Huy Trandac, Philippe Baptiste, and Vu Duong, Airspace sectorization withconstraints, RAIRO-Operations Research 39 (2005), no. 02, 105–122.
[64] Michal Weiszer, Jun Chen, and Paul Stewart, A real-time active routing ap-proach via a database for airport surface movement, Transportation ResearchPart C: Emerging Technologies 58 (2015), 127–145.
[65] Cheng-Lung Wu, Monitoring aircraft turnaround operations–framework develop-ment, application and implications for airline operations, Transportation Plan-ning and Technology 31 (2008), no. 2, 215–228.
[66] Stavros A Zenios, Network based models for air-traffic control, European Journalof Operational Research 50 (1991), no. 2, 166–178.
[67] Tianci Zhang, Meng Ding, Bangfeng Wang, and Qian Chen, Conflict-free time-based trajectory planning for aircraft taxi automation with refined taxiway mod-eling, Journal of Advanced Transportation (2015).
105
![8 1 4 Park, Hosung) - KAISTan.kaist.ac.kr/~sbmoon/paper/thesis/2010Dec-hosung.pdf · 2018-08-30 · A thesis submitted to the faculty of KAIST in partial ful llment ... 22, 13]. Independent](https://img.pdfslide.tips/doc/110x75/5f3cce50f3e41a6f75563b79/8-1-4-park-hosung-sbmoonpaperthesis2010dec-hosungpdf-2018-08-30-a-thesis.jpg)