Embed Size (px)
Citation preview

ÅF – leading the way in technical consulting.Our work focuses on energy and the environment,
investments in infrastructure and projects for industry.Our base is in Europe, but our business and clients
extend right across the globe.What makes us unique is our co-workers and the tech-
nical consulting industry’s greatest bank of experience.It’s all summed up in our corporate motto:
“ÅF – innovation by experience.”
Tel +46 10 505 00 00www.afconsult.com
ÅFANNUALREPORT2010
ANNUAL REPORT 2010

THISISÅF
OPERATIONS
ANNUA
LREPORT
CORPO
RATE
GOVERNANCE
66 Administration report70 Consolidated income statement71 Statement of consolidated comprehensive income72 Consolidated balance sheet74 Statement of change in equity for Group75 Statement of cash flows for Group76 Parent income statement77 Statement of comprehensive income for Parent78 Parent balance sheet80 Statement of change in equity for Parent81 Statement of cash flows for Parent83 Notes121 Audit report
22 Energy28 Industry34 Infrastructure40 Technology46 ÅF shares50 Sustainability is profitability51 Sustainability report58 Risk management and sensitivity analysis63 Definitions64 Five-year financial summary, SEK65 Five-year financial summary, EUR
1 The year at a glance2 This is ÅF4 A message from the President6 Mission, vision, strategies and objectives9 Olympic Green Advisor11 Market trends and business review14 Human resources
ÅF is continuously developing its consulting businessand its capacity to carry out its assignments in thebest possible way. The ambition is clear: to safe-guard successful, long-term sustainable develop-ment for ÅF’s clients and for ÅF itself.
page 8
Striving for profitability and wanting to make theworld a better place aren’t mutually exclusive.Quite the opposite, in fact. A sustainable companyis a long-term venture, which lays the foundationsfor good profitability over time.
page 50
In 2010 ÅF made a number of acquisitions in Europein line with its strategy of becoming number one ortwo in the markets where the company is active.
page 67
The board works to continuously improve the effec-tiveness of its routines and working methods in orderto be able to devote as much time as possible toimportant strategic discussions.
page 122
122 Corporate governance at ÅF123 Corporate governance report128 Board of directors130 Senior management132 Annual general meeting
133 ÅF offices
The English version of the Annual Report of ÅF AB is a translation of the Swedish original. The Swedish text is the binding version and shall prevail in the event of any discrepancies.Å F A N N U A L R E P O R T 2 0 1 0
1 3 3Å F O F F I C E S
Group Head OfficeÅF ABVisitor’s address: Frösundaleden 2, SolnaPost address: SE-169 99 Stockholm, SwedenTel +46 10 505 00 00
Fax – Senior Management: +46 8 653 56 13Fax – Reception: +46 10 505 00 10For further information about addresses,please see www.afconsult.com
SwedenAlingsåsArbogaBorlängeBoråsEnköpingEskilstunaFalunGällivareGävleGothenburgHalmstadHelsingborgHässleholmJönköpingKalmarKarlskogaKarlskronaKarlstadKirunaKristianstadLinköpingLuleåMalmöMora
NorrköpingNynäshamnOskarshamnPiteåSkaraSkellefteåSkövdeSollefteåStenungsundStockholmSundsvallSöderhamnSödertäljeTavelsjöTrollhättanUddevallaUmeåUppsalaVarbergVästeråsVäxjöÅmålÖrebroÖrnsköldsvikÖstersund
Czech RepublicBrnoMêlnikPardubicePlzenPrag
DenmarkCopenhagenHerlevRandersKalundborg
EstoniaNarvaTallinnViljandiVöru
FinlandTampereVantaa
GermanyHamburg
IndiaNew Delhi
IndonesiaJakarta
ItalyRome
KazakhstanAstana
LithuaniaKaunasVilnius
NigeriaGarki Abuja
NorwayBodöLilleströmOsloSandefjordMoss
RussiaMoscowSt PetersburgYekaterinburg
ScotlandEdinburgh
South AfricaDurban
SpainMadridSan Sebastian
SwitzerlandBaden
ThailandBangkok
TurkeyAnkara
TurkmenistanAschabad
UkraineKremenchuk
VietnamHanoi
A110418-02Produced by Solberg in collaboration with the ÅF Group’s CorporateInformation and Corporate Finance Departments. Printed by Elanders.Photos: Peter Bartholdsson and others. Translation: AB Språkman.
A brief historical summaryOn 23 February 1895 Södra Sveriges Ångpanneförening was created when anumber of steam generator owners in the south of Sweden joined forces withthe aim of preventing accidents and making more efficient use of steam power.
In the 115 years that have elapsed since then, ÅF has played a key role in theindustrial developments that have revolutionised society.
The company has guided its clients through four major technology changes –steam, electricity, nuclear power and computerisation – and remained at the fore-front of technology both in the industrial era and in today’s information society.
AB Ångpanneföreningen was first listed on the Stockholm Stock Exchangein January 1986. On 5 May 2008 AB Ångpanneföreningen changed its name toÅF AB, and today it is one of Europe’s largest technical consulting companies.
ÅF OFFICES

1
Å F A N N U A L R E P O R T 2 0 10
T H I S I S Å F T H E Y E A R A T A G L A N C E
201020072006 2008 2009
5,000
4,000
3,000
2,000
1,000
0
Group operating income,excl. capital gain (in millions of SEK)MSEK
500
400
300
200
100
0
12.5
10
7.5
5
2.5
0
MSEK %
Group operating profit andoperating margin, excl. capital gain
201020072006 2008 2009
0
1
2
3
4
Dividend per share 1)
1) A 2:1 share split was implemented on 2 June 2010. Comparative figures adjusted.2) Proposed dividend.
SEK
2010 2)20072006 2008 2009
Financial summary 2010 2009
Operating income, MSEK 4,795.9 4,692.0Operating income excl. capital gain, MSEK 4,338.0 4,684.2Operating profit, MSEK 805.8 388.3Operating profit excl. capital gain, MSEK 317.0 380.5Operating margin, percent 16.8 8.3Operating margin excl. capital gain, percent 7.3 8.1Capacity utilisation, percent 71.9 71.3Profit after net financial items, MSEK 798.1 377.0Profit margin, percent 16.6 8.0Employees (FTEs) 3,966 4,182Equity per share, SEK 69.47 53.68Equity/assets ratio, percent 59.8 51.0Return on equity, percent 32.5 15.8Return on equity excl. capital gain, percent 12.5 15.4Earnings per share before dilution, SEK 21.02 7.93Dividend per share, SEK 1) 4.00 2) 4.001) A 2:1 share split was implemented on 2 June 2010. Comparative figures adjusted.2) Proposed dividend.
THE YEAR AT A GLANCE
4,338Operating income excludingcapital gain totalled SEK
million (2009: SEK 4,684 million)
717Profit after tax amounted to SEK
million (2009: SEK 275 million)
317Operating profit excludingcapital gain totalled SEK
million (2009: SEK 380 million)
21.02Earnings per share before dilution: SEK
(2009: SEK 7.93)

2 T H I S I S Å F Å F A T A G L A N C E
THIS IS ÅF
Division ÅF offices
Infrastructure
The Infrastructure Division holds a leading position in the field of consultingservices for infrastructure development in Scandinavia.
Industry
The Industry Division is a leader in consulting services in the fields of processtechnology, energy efficiency, environmental engineering, industrial IT, automation,electrical power systems and mechanical engineering.
Energy
The Energy Division offers technical and financial consulting services forthe energy sector and is a world leader in the field of nuclear power.
Technology
The Technology Division offers solutions and consulting services in fieldsthat include telecommunications, defence and development.
Å F A N N U A L R E P O R T 2 0 10

3T H I S I S Å F Å F A T A G L A N C E
Clients Operating income Operating profit Employees (FTEs)Operating profit
per FTE
• Road and rail
• Property sector
MSEK 1,233
29 % 20 % 28 %
MSEK 69.0 1,065
SEK 65,000
• All sectors of industry:in Scandinavia, also energyand nuclear power
MSEK 1,340
31 % 35 % 32 %
MSEK 119.9 1,200
SEK 100,000
3 3
MSEK 1,012 MSEK 83.1 906
SEK 92,000
23 % 25 % 24 %2 2 2• Power industry andenergy companies
• Government bodies
• Financial institutions
• All industries and sectors
MSEK 719
17 % 20 % 16 %
MSEK 69.1 616
SEK 112,000
Å F A N N U A L R E P O R T 2 0 10
Total, all divisions MSEK 4,304 MSEK 341.1 3,787 SEK 90,000
Other/Eliminations*) MSEK 492 MSEK 464.7 179 —
Total including eliminations MSEK 4,796 MSEK 805.8 3,966 SEK 203,000
Divisional contributions to Group totals for 2010 are shown as a percentage.*) Includes the Inspection Division, which was sold in Q1 2010.

4
Å F A N N U A L R E P O R T 2 0 10
T H I S I S Å F T H E P R E S I D E N T ’ S C O M M E N T S
CEO Jonas Wiström explains how ÅF sharpenedits focus in 2010 and what is top of the agendaover the next few years. The key themes areprofitability, growth and sustainability.
So, Jonas Wiström, how would you summarise 2010?“For ÅF, 2010 was a year of strategic realignment. The decision tosell our Inspection Division, ÅF Kontroll, proved a good move for usand the division’s 500 co-workers, but more important still, it under-lined our strategy to become number one or two in our fields ofexpertise in our chosen markets. The inspection market is domi-nated by a handful of big global players, so the opportunities for usto expand our operations in this segment were limited. Moreover,ÅF’s growth, particularly in nuclear power, was making it increas-ingly problematical to combine the dual roles of project implementa-tion and independent inspection under one and the same corporatebanner. The decision also meant we had to sell our share in ÅF-TÜVNord, but the income from these divestments helped to fund anumber of strategic acquisitions during the year in our focus areasof industry, energy and infrastructure. The acquisitions of Energo,Gatubolaget i Göteborg, Platom and VPC Mining in Sweden, Meacontin the Czech Republic and Mercados in Spain added the strengthsof more than 550 highly qualified new co-workers to our core com-petences. This represents a significant reinforcement of our marketposition and leaves us very well placed to grow further and to cap-
ture new market share at the start of what we hope is an upturn inthe economy.”
What has been happening in the various divisions?“As far as market developments in general are concerned, therecovery in 2010 turned out to be slower than we had initially antici-pated. We didn’t witness any real increase in client activity until theautumn. The Energy Division won several important assignments in2010, but was also affected by clients deferring their investmentplans and by structural shifts in the market. The Industry Divisionreported a continuous improvement in the level of profitability, andearnings were good towards the end of the year. Growth was goodin the Infrastructure Division, especially in infrastructure planning,where the division demonstrated its strengths by securing somemajor assignments in connection with the Stockholm Bypass Project.However, profitability in the division was undermined by the costs ofmajor restructuring work in Norway. The Technology Division devel-oped in a highly positive direction, reporting good capacity utilisation,healthy profitability and good growth. Overall, ÅF increased its marketshares over the course of the year.”
ÅF is committed to doubling its consulting workforceand increasing turnover significantly over the next fiveyears. How do you aim to go about achieving that?“We will achieve our vision through what, in the longer term, will bea more or less evenly balanced mix of organic and acquired growth.As our strategy is to be a market leader in our chosen areas of exper-tise, most of the initial growth will be in countries and fields where wehave already made a name for ourselves. It’s clear to me that ourrecent successes have been built on a strong, well-known brand andthe ability to consistently exceed our clients’ expectations.”
A more focused ÅF – ready toserve a stronger market
“Our first-class offers in global growthareas will produce good results.”
A MESSAGE FROM THE PRESIDENT

5
Å F A N N U A L R E P O R T 2 0 10
T H I S I S Å F T H E P R E S I D E N T ’ S C O M M E N T S
How do you make sure that rapid growth doesn’tundermine profitability?“Personally, I can’t see why growth and profitability should not becompatible. On the contrary, the lines of business that have beenmost profitable at ÅF are those that have grown most rapidly.Growth creates an entrepreneurial spirit and fosters a corporateculture whose hallmarks are creativity, a willingness to listen andthe ability to deliver. Our clients benefit from this in the form of in-telligent solutions that, in turn, increase demand for our services.”
“Olympic Green Advisor” is a new concept.What does it actually mean?“As Olympic Green Advisor, ÅF acts as a consultant to the nationalOlympic Committees in Finland, Norway, Sweden and Switzerlandon issues relating to sustainability. In Sweden, for example, we havebegun the process of educating leaders and athletes on sustainabilityissues. We have already carried out a sustainability study for theSwedish Olympic Committee and, in the longer term, we hope to beable to play our part in helping to make the Olympic Games greener.Our aim is to make a difference and to influence general opinion bynudging it in the right direction. The broader but related concept of‘ÅF Green Advisor’ places us in a unique position to market anumber of strong offers across our client base.”
Tell us about ÅF’s work with sustainability.“The world needs new technology, creativity and strong politicalaction to meet the challenges facing humanity. We must embrace thetechnological solutions that lead to a better, more prosperous andmore environmentally sustainable world. And it will be engineerswho lead us along this path.For ÅF, sustainability is the basis for long-term profitability. Eco-
nomic, environmental and social sustainability are the cornerstoneson which we need to build in order to be able to continue to deliverthe best solutions to clients who want their business operations tobe sustainable, successful and profitable.For the first time ÅF is reporting its sustainability performance
over the past year with reference to the guidelines of the GlobalReporting Initiative (GRI). In the autumn ÅF also launched its owntough targets for the company’s internal sustainability work: theseinclude halving climate impact by 2015 (calculated per individual,with 2009 as the baseline year) and aiming to ensure that ÅF alwaysoffers clients an alternative ‘green’ solution to every challenge we
are asked to solve. In 2010 we also launched a web-based sustain-ability training programme for all ÅF employees.”
Where does the focus lie in 2011?“After the slowdown in business that followed the financial crisis, it’snow time for us to start to grow again. We did capture new sharesof the market during the economic downturn, but our sights are nowfirmly set on growth in absolute terms, where the most importantthing is to grow organically. We have first-class offers in globalgrowth areas and these will produce results.”
What is the best thing about ÅF?“The accumulated knowledge and experience of our 4,500 or soco-workers. It’s truly fantastic. And I would argue, too, that our abilityto make systematic use of the knowledge we gain is quite unique.It means our clients always have fast-track access to tried-and-tested methods and techniques.”
And finally…?“The sale of ÅF-Kontroll was an important milestone in our corporateevolutionary process. It has sharpened the focus within ÅF and givenus the financial resources to grow in our core activities. Today wehave an organisation that is fully focused on and geared to meetingour commercial targets. I believe the market will improve in 2011,and the ÅF brand is now stronger than ever. Add that to ÅF’s evergreater appeal as an employer (ÅF was recently voted one ofEurope’s top 50 employers in a major survey of engineering stu-dents), and I’m convinced that the outlook for the future is good.Finally I would like to say thank you to all the co-workers who have
contributed to ÅF’s suc-cess. I look forward tocontinuing to work withyou all in building thecorporate values thatare so important to ourclients, shareholdersand other stakeholders.”
Stockholm, Sweden –March 2011
Jonas WiströmPresident and CEO
6 T H I S I S Å F M I S S I O N , V I S I O N , S T R A T E G I E S A N D O B J E C T I V E S
MISSION, VISION, STRATEGIES AND OBJECTIVES
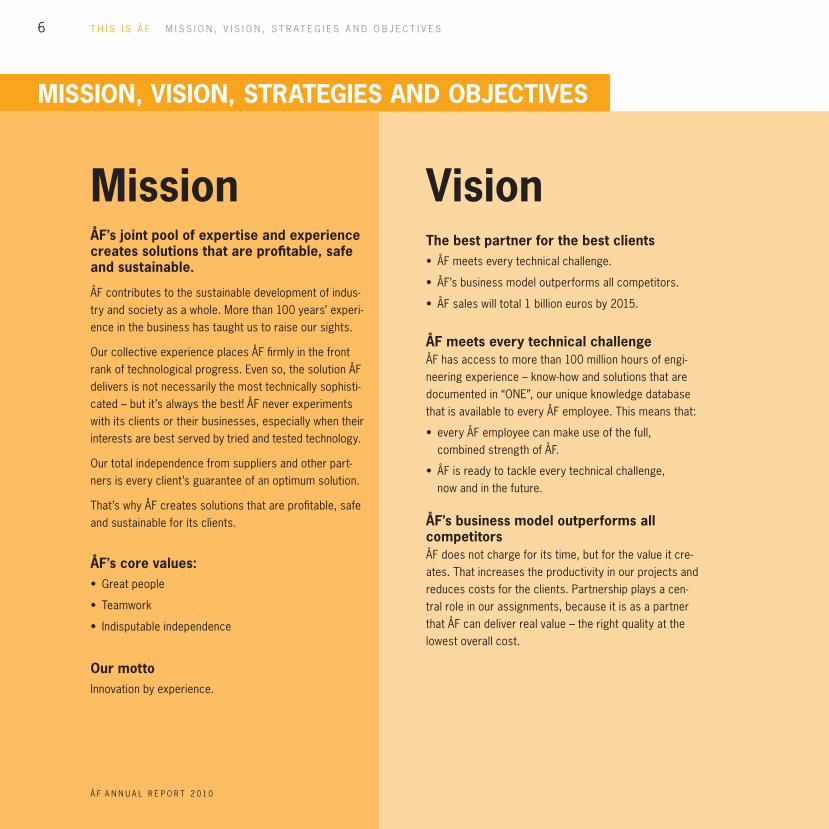
MissionÅF’s joint pool of expertise and experiencecreates solutions that are profitable, safeand sustainable.
ÅF contributes to the sustainable development of indus-try and society as a whole. More than 100 years’ experi-ence in the business has taught us to raise our sights.
Our collective experience places ÅF firmly in the frontrank of technological progress. Even so, the solution ÅFdelivers is not necessarily the most technically sophisti-cated – but it’s always the best! ÅF never experimentswith its clients or their businesses, especially when theirinterests are best served by tried and tested technology.
Our total independence from suppliers and other part-ners is every client’s guarantee of an optimum solution.
That’s why ÅF creates solutions that are profitable, safeand sustainable for its clients.
ÅF’s core values:• Great people
• Teamwork
• Indisputable independence
Our mottoInnovation by experience.
VisionThe best partner for the best clients• ÅF meets every technical challenge.
• ÅF’s business model outperforms all competitors.
• ÅF sales will total 1 billion euros by 2015.
ÅF meets every technical challengeÅF has access to more than 100 million hours of engi-neering experience – know-how and solutions that aredocumented in “ONE”, our unique knowledge databasethat is available to every ÅF employee. This means that:
• every ÅF employee can make use of the full,combined strength of ÅF.
• ÅF is ready to tackle every technical challenge,now and in the future.
ÅF’s business model outperforms allcompetitorsÅF does not charge for its time, but for the value it cre-ates. That increases the productivity in our projects andreduces costs for the clients. Partnership plays a cen-tral role in our assignments, because it is as a partnerthat ÅF can deliver real value – the right quality at thelowest overall cost.
Å F A N N U A L R E P O R T 2 0 10

7
Å F A N N U A L R E P O R T 2 0 10
T H I S I S Å F M I S S I O N , V I S I O N , S T R A T E G I E S A N D O B J E C T I V E S
Our outstanding co-workers are one step ahead interms of technical expertise, business acumen and totalindependence.For our clients and competitors it is clear that here at
ÅF we demand more of ourselves. We have the will to win.
ÅF sales will total 1 billion euros by 2015ÅF will become Europe’s leading technical consultant.For us, that means becoming the most profitable com-pany among our biggest competitors in the business.Our rate of growth will be high. We will grow both
organically and through corporate acquisitions, but wewill also be careful to ensure that the companies weacquire make a positive contribution to our profitabilityand to the ÅF culture.
StrategiesOperations will be decentralised• under one and the same brand• with common processes and systems• with shared values and a common corporate culture in orderto concert efforts and fully exploit the potential of all theexperience that is represented within the ÅF Group.
ONE ÅF is a huge, shared bank of knowledge available to all ÅFco-workers that enables ÅF to improve profitability for its clientsby proposing safe, sustainable solutions to a wide variety ofchallenges.
ONE ÅF is a common workplace where co-workers are encour-aged to pursue their career within ÅF, for example in a differentcountry or with new, technical challenges.
ONE ÅF is a joint sales organisation through which clients areoffered the entire range of ÅF’s services.
ONE ÅF is the firm base for the corporate culture and sharedvalues of ÅF.
Acquisitions strategyÅF’s acquisitions policy is based on the above. Every effort will bemade to develop the business when the right opportunities arise,but expansion will not take place at the expense of profitability.

8
Å F A N N U A L R E P O R T 2 0 10
T H I S I S Å F M I S S I O N , V I S I O N , S T R A T E G I E S A N D O B J E C T I V E S
Business support and shared processesÅF is continuously developing its consulting business and itscapacity to carry out its assignments in the best possible way.The ambition is clear: to safeguard successful, long-term sus-tainable development for ÅF’s clients and for ÅF itself.One example of this is ONE, ÅF’s recently developed IT plat-
form. At the same time as it acts as a driving force for collabo-ration within ÅF and with clients and subcontracted suppliers,ONE also guarantees a modern approach to working with pro-cesses, projects and knowledge retrieval at ÅF, freeing up timefor development and innovation in client assignments.ONE is a web-based tool, mostly in English, that is accessible
to employees throughout the ÅF Group.ONE also serves as ÅF’s business support system, a central
operational control system that makes ÅF’s business operationsconsiderably more cost-effective while assuring quality and con-sistency in the company’s approach.The system includes tools for shared processes, project docu-
mentation and a searchable database of engineering and busi-ness experience that pinpoints any similarities between the manyassignments undertaken by ÅF. When a client commissions ÅF toperform an assignment, the chances are great that ÅF has alreadysuccessfully completed a similar assignment elsewhere.ONE enables ÅF management to control and support opera-
tions and meet the criteria for certification for environmentaland quality management in accordance with ISO 14001:2004and ISO 9001: 2008.
Long-term objectivesFinancial objectivesÅF shall be the most profitable company among its closest com-parable competitors in the industry and achieve an operatingmargin (EBIT) of at least 10 percent over a business cycle.
ÅF shall have net debt over a period of time, but net indebted-ness shall not exceed 40 percent of equity.
Growth objectiveSales of 1 billion euros by 2015.
Human resources objectivesBetter balance in the gender ratio. An initial target is for at least 25percent of the company’s consultants and managers to be women.Staff turnover, based on resignations, to be 7–13 percent.All employees to take part in a personal development inter-
view each year.
Sustainability objectivesIn 2010 ÅF adopted a plan for the company’s sustainability workfor the period up to 2015 and embraced three overarching sus-tainability objectives:
By the year 2015 ÅF aims to:• have halved its direct climate impact (baseline year 2009,calculated per individual).
• include a proposal in every offer or tender that ÅF submits,to enhance the sustainability aspect of the project.
• be perceived as the technical consulting firm that, from asustainability perspective, best solves the technical chal-lenges that its clients are faced with.
In 2010 ÅF began the work of producing a sustainability frame-work for the entire ÅF Group that comprises a sustainabilitypolicy, including revised tools for managing risks. The plan isto launch this sustainability framework in spring 2011.For further details of ÅF’s work with sustainability issues and
the company’s GRI report, please refer to pages 51–56.

9T H I S I S Å F O LY M P I C G R E E N A D V I S O R
OLYMPIC GREEN ADVISOR
ÅF has embarked on an important jointventure with the Olympic Committees inFinland, Norway, Sweden and Switzerland,assuming the role of Olympic partner andGreen Advisor to all four of these nationalorganisations.
ÅF provides consulting and advisory services on green issuesand takes an active role in developing Olympic sporting activi-ties from a sustainability perspective. Sustainability is an issuethat is rapidly growing in importance in the Olympic movement,
particularly when it comes to choosing host cities for futureOlympic events. The focus is on policies, strategies and actionprogrammes, and on the education of staff, coaches and theathletes themselves.ÅF is also a sponsor for the national Olympic Committees in
Finland, Norway, Sweden and Switzerland. A sponsorship agree-ment has been signed for the period 2010–2014 that will coverthree Olympic Games.The Olympic rings and the exclusive title of Green Advisor
have been integrated into ÅF’s external communications. TheOlympic rings and the Olympic Association are the world’sstrongest and most fiercely protected non-commercial brand.
World-class managerial conferenceAmong those gathered for the annual ÅFManagers’ Conference were three of theworld’s top names in ice hockey and athletics– Peter Forsberg, Sanna Kallur and AndreasThorkildsen. All three took the stage to explainthe importance of focus, mental training, andthe drive and desire to be best in the worldat what you do.
Å F A N N U A L R E P O R T 2 0 10

1 0
Å F A N N U A L R E P O R T 2 0 10
Martin Jonsson works inStockholm as a section manager for RockEngineering & Measurement Technologyin the Infrastructure Division. He likes tospend his spare time with friends, andenjoys cooking, running in the Swedishmountains and long walks in the woods.
“I want a stimulating environment with peoplewho set me the kind of challenges that help meto grow as a person. I love solving problems.The best thing about ÅF is the positive atmos-phere – and the challenges! Nothing is impossibleand we set ambitious targets. It’s an approachthat runs through the entire organisation.”

1 1
Å F A N N U A L R E P O R T 2 0 10
T H I S I S Å F M A R K E T T R E N D S A N D B U S I N E S S R E V I E W
ÅF’s services in briefÅF is a leader in technical consulting. Our work focuses onenergy and the environment, infrastructure and projects forindustry.Our base is in Europe, but our business and clients extend
right across the globe. What makes us unique is our co-workersand the technical consulting industry’s greatest bank of collec-tive experience. It’s all summed up in our corporate motto:“ÅF – innovation by experience.”
ÅF is made up of four specialist divisionsThe Energy Division focuses on technical and financial consult-ing for the energy sector, from advice on business models toimplementing investments in power plants and the many relatedenvironmental issues.The Industry Division is Northern Europe’s leading industrial
consultant offering services in process technology, automation,industrial IT, electrical power systems and mechanical engineer-ing. In Scandinavia, the division is also responsible for ÅF’soffers to the energy market.
The Infrastructure Division is a leader in the consulting industryfor infrastructure development in Scandinavia and has clients inindustry, the public sector and the property sector.The Technology Division works mostly with assignments in
Sweden, where it is a leading name in product development anddefence technology. The division also enjoys a strong position inthe market for telecommunications and IT consulting services.
ClientsEach year ÅF performs more than 30,000 assignments for some10,000 clients. Assignments vary in length from just a few hoursto hundreds of thousands.ÅF’s ten largest clients in 2010 together accounted for
approximately 23 percent of total invoiced sales. They wereEricsson, the Swedish Defence Materiel Administration (FMV),Ringhals nuclear power plant, the Swedish National Rail Adminis-tration (Banverket), the Stockholm municipal water utility Stock-holm Vatten, ATEL, Gusinoozersk CHP, the Danish Road Directo-rate (Vejdirektoratet), Stockholm’s regional transport authority(SL), and Siemens.
MARKET TRENDS AND BUSINESS REVIEW
Client base – sales by sector 2010
Public sector Private sector
29 % 71 %
ÅF’s operations arebecoming increasinglyinternational. It hasoffices in more than 20countries, but conductsbusiness activities andattracts clients through-out the world.
Geographical spread of ÅF businessNumber of employees per country, December 2010
Sweden
Finland
Norway
Denmark
Switzerland
Czech Republic
Russia
Rest of world

1 2
Å F A N N U A L R E P O R T 2 0 10
T H I S I S Å F M A R K E T T R E N D S A N D B U S I N E S S R E V I E W
MarketIn 2010 the market for ÅF’s services began to stabilise after thefinancial crisis. However, while demand in the energy and infra-structure sectors remains high, elsewhere the recovery hasbeen relatively slow as companies continue to be cautiousabout major new investments in industrial production capacity.In the energy sector the recovery was worldwide, enabling
companies to restart many projects that they had previouslysuspended.In the Nordic region, demand from process industries and the
energy and nuclear power sectors was generally good during2010, particularly towards the end of the year, and most espe-cially in Sweden. Demand from industry was chiefly driven bythe need for efficiency improvements in manufacturing plants,environmental engineering projects, the development of alterna-tive fuels and conversion to efficient energy management.The market for consulting services to the pulp and paper
industry remained weak in Europe in 2010, although the situa-tion was better in South America, Asia and Africa. ÅF has rela-tively large business interests in Chile, so it was encouraging tonote signs of a recovery in that market after the major earth-quake there at the start of the year.Demand was good throughout 2010 for services to the prop-
erty, construction and industrial plant sectors. The propertysector in particular really took off during the autumn. Publiclyfinanced projects proceeded according to plan, with new busi-ness picking up again after a slight slowdown in the wake of thefinancial crisis.Demand from the defence sector remained steady in 2010,
while the market in telecoms and the automotive industryimproved as the year progressed, particularly from the secondquarter onwards.
Outlook – Nordic countriesIt appears that growth in the Nordic energy market will continueto be driven mainly by investments in nuclear power in Finland,preparations for the expansion of nuclear power facilities inSweden, and renewable energy sources in the other Nordiccountries. Alongside major new investments that have alreadybeen approved, there is a constant need for a large number ofefficiency improvement projects, upgrades, capacity increasesand environmental improvements in existing plants, in both thepower industry and elsewhere.Nordic industry will continue to need to significantly improve
the efficiency of its production facilities and to make energy-sav-ing investments. The outlook in the mining, petrochemical,energy, food and pharmaceutical industries is particularly good.The engineering sector, including the automotive industry, isrecovering after several difficult years, but growth is comingfrom a low level.The energy sector is undergoing a period of major adjustment
to new types of energy, the need for greater efficiency and in-creased competition. These factors are likely to drive demandfor technical consulting services for many years to come.The forest industry is restructuring, with several companies
expanding their operations from solely pulp and paper process-ing to include biofuels and electricity.Nordic industry leads the way when it comes to incorporating
sustainability into business operations. This gives it a competi-tive edge internationally and generates considerable demand fortechnical consulting services.In purely geographical terms, the Öresund region is likely to
undergo considerable growth, thanks in part to the very largeESS project, an inter-disciplinary research facility for materialsstudies. There is also good potential for growth in the north,where the mining sector is a key driver of business.
1 3T H I S I S Å F M A R K E T T R E N D S A N D B U S I N E S S R E V I E W
There are many similarities between Sweden, Norway andDenmark when it comes to the market for services that supportpublic-sector investment in roads and railways. These threecountries have strong government finances and their infrastruc-tures are becoming increasingly integrated with each other atthe same time as investments are being made at a similar rateand to a similar extent. The prospects appear to be very rosyfor all three countries.In the construction and property sectors, demand for energy
efficiency initiatives is expected to remain high across the region.The automotive industry seems to have bottomed out and is
expected to show stable growth, albeit from what are histori-cally very low levels.
Outlook – other marketsDemand in the energy sector in Western and Central Europecontinues to be driven primarily by the expansion of new nuclearpower and biofuel facilities. Older coal-fired power stationsurgently need to improve their efficiency and environmental per-formance. In Eastern Europe and Southeast Asia, the marketslook capable of recovering slightly after the significant downturntriggered by the financial crisis.Asia is a strong engine that affects growth in many other mar-
kets, which suggests that demand for energy and raw materials
should continue to be good. Europe also requires vast amountsof energy, which, for ÅF, translates into continued demand forservices in both power generation and distribution. Strong glo-bal demand for raw materials means that future growth in themining sector is also likely to be considerable.Demand from projects to improve environmental performance
and increase energy efficiency in industry is likely to continue tobe healthy, in line with developments in recent years.Growth in the pulp and paper sector is expected to come
from Asia, South America and Africa. Europe is tending to investmore in recycled paper processing and general efficiency gainsthan in new production plant.
Increased internationalisationIn recent years ÅF has expanded through acquisitions andorganic growth, becoming increasingly international. Parallelwith this development, a great deal of effort has been made tostandardise the structure of our competence developmentwork, internal databases, intranet, and brand identity, and toestablish an understanding within the organisation of our sharedcorporate values and aims. Each part of ÅF enjoys considerableautonomy, and this helps secure strong local roots while thecompany’s global structure contributes strength and stability.
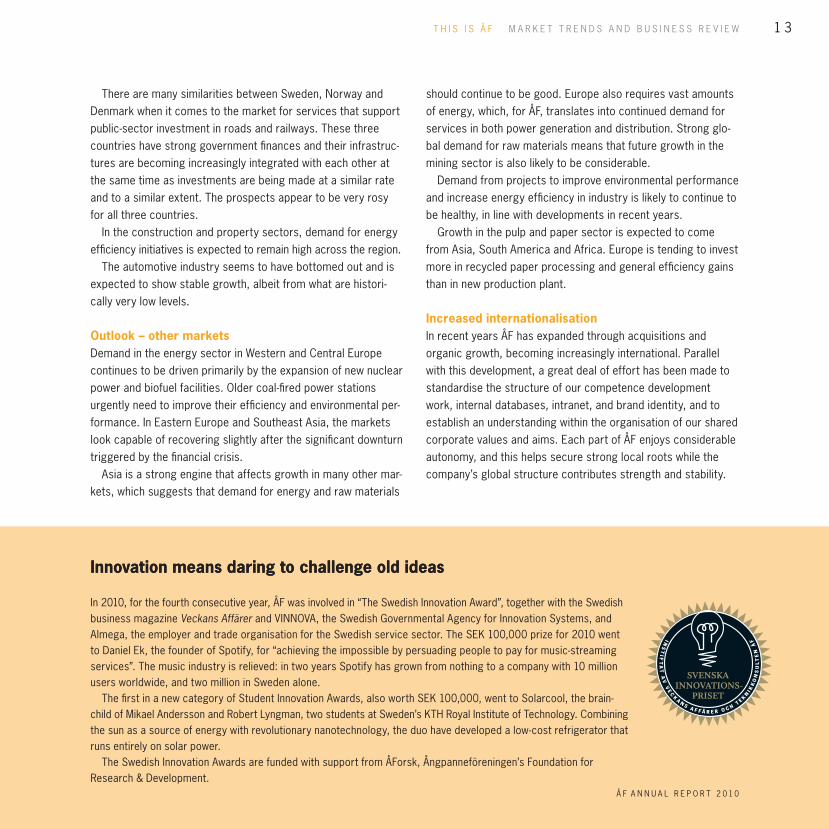
In 2010, for the fourth consecutive year, ÅF was involved in “The Swedish Innovation Award”, together with the Swedishbusiness magazine Veckans Affärer and VINNOVA, the Swedish Governmental Agency for Innovation Systems, andAlmega, the employer and trade organisation for the Swedish service sector. The SEK 100,000 prize for 2010 wentto Daniel Ek, the founder of Spotify, for “achieving the impossible by persuading people to pay for music-streamingservices”. The music industry is relieved: in two years Spotify has grown from nothing to a company with 10 millionusers worldwide, and two million in Sweden alone.The first in a new category of Student Innovation Awards, also worth SEK 100,000, went to Solarcool, the brain-
child of Mikael Andersson and Robert Lyngman, two students at Sweden’s KTH Royal Institute of Technology. Combiningthe sun as a source of energy with revolutionary nanotechnology, the duo have developed a low-cost refrigerator thatruns entirely on solar power.The Swedish Innovation Awards are funded with support from ÅForsk, Ångpanneföreningen’s Foundation for
Research & Development.
Innovation means daring to challenge old ideasInnovation means daring to challenge old ideas
Å F A N N U A L R E P O R T 2 0 10

1 4 T H I S I S Å F H U M A N R E S O U R C E S
HUMAN RESOURCES
ÅF has a strong corporate culture and abrand that is becoming increasingly wellknown. These are essential attributes for anycompany that aims to be an industry leaderin Europe and needs to be able to recruitand retain co-workers of outstanding calibre.ÅF has many years’ experience of solvingtechnical challenges, and both the technicaland commercial aspects of its consultants’work are continuously being developed.Every ÅF co-worker has an important partto play in consistently conveying the rightimage of the company to clients and otherstakeholders.
Corporate culture and core valuesThe company’s culture, values and working methods are describedin the ÅF Blue Book (2.0), which is aimed at all co-workers andserves as a tool for pooling the company’s strengths as “One ÅF”.The ÅF core values – great people, teamwork and indisputable
independence – are the bedrock of the day-to-day work of ÅFco-workers and their attitudes to clients and colleagues. ÅFemployees exceed their clients’ expectations in terms of thesolutions they offer and their combination of technical expertiseand business-mindedness. But ÅF employees are also goodcommunicators, good team players and good listeners. Theyare positive in their outlook, deliver on their promises and showrespect in their dealings with clients.
A workplace where you can feel at homeÅF wants employees to take pride in their work and the company,to feel confidence in their managers and to enjoy working along-side their colleagues. To meet the demands made on a modernemployer, ÅF adopts a highly focused, long-term approach to HRissues at all levels within the company and conducts regular co-worker surveys to assess the prevailing mood within the Group.
An increasingly attractiveemployer throughout Europe
• ÅF is an international workplace with offices in more than20 countries.
• ÅF currently employs a total of some 4,500 co-workers.
• In 2010 ÅF co-workers performed projects in more than70 countries.
Å F A N N U A L R E P O R T 2 0 10

1 5
Universum’s Career Barometer 2010 Ranking
IKEA 1
Google 2
ÅF 3
ABB 4
Volvo Group 5
Ericsson 6
T H I S I S Å F H U M A N R E S O U R C E S
To make clear its position on a number of employment-relatedissues, ÅF has formulated guidelines in key areas such as humanresources, pay, equal opportunities and the working environment.HR activities differ from country to country, but the aim remains
the same: to foster a sense of togetherness and create a pleasantatmosphere at work.ÅF works hard to create a good gender balance, an ambition
that is reflected in the company’s recruitment activities. Thefirst step towards a better gender balance is to raise the propor-tion of female consultants and managers to 25 percent by 2015.Whenever a managerial post becomes vacant, at least onewoman must be short-listed. By the end of 2010, the proportionof female consultants was 19 percent (2009: 17 percent). Theproportion of female senior consultants was 17 (15) percent,while female employees made up 23 (21) percent of the totalworkforce. Three of the eight ÅF directors elected by the AnnualGeneral Meeting are women: this corresponds to a 38 percentrepresentation on the board.
ÅF Recruiter – fast-tracking candidateswith the right profileÅF has a web-based recruitment tool that enables external andinternal candidates to register their interest in a searchable
database used by ÅF managers when recruiting new membersto their team. The system handles the entire chain of adminis-trative recruitment procedures, from job advert to contract ofemployment. Simple interfaces mean that the tool can be usedboth via the ÅF website and by external recruitment agencies.
Many development opportunitiesÅF has set itself the target of having approximately 10,000employees by 2015. But such growth means being able to offeran attractive working environment with good opportunities fordevelopment. Working as an ÅF consultant offers enormousopportunities to develop, for example, in different professionalroles, through different levels of expertise, in a wide range oflocations and through international assignments.ÅF has identified three distinct career paths within the com-
pany – as project manager, specialist/expert and manager –each offering a variety of roles, levels and development stages.Whichever path you choose, there are plenty of opportunities todevelop within your role or to switch between roles, for exam-ple, from project leader to specialist and back again. Careerpaths provide support for setting individual targets and actionplans, often as part of the annual personal development inter-views between managers and their co-workers.
ÅF, Sweden’s favourite technical consultant is more popular than ever in Europe
Å F A N N U A L R E P O R T 2 0 10
In the 2010 Career Barometer survey of professional engineers, ÅF wasranked as Sweden’s third most popular employer overall and the numberone choice among technical consulting companies. In the European sur-vey of students at Europe’s top universities, ÅF came 48th in the overallemployer rankings.The Career Barometer is an annual attitude survey conducted by
Universum Communications. All respondents are “young professionals”no more than 40 years old, with an engineering degree from a universityor college plus two to eight years of working experience in their special-ist area. More than 3,000 engineers took part in the Swedish survey,while the European survey canvassed 6,000 technology students.

1 6
Å F A N N U A L R E P O R T 2 0 10
T H I S I S Å F H U M A N R E S O U R C E S
ÅF AcademyThe ÅF Academy is ÅF’s own training organisation, providingsupport for the ÅF career paths and the development of the con-sultant’s role. This includes comprehensive foundation coursesfor new consultants as well as specialised advanced coursesand training tailored to individual requirements. Lecturers andfacilitators come both from within ÅF and from external serviceproviders. The 2010 programme included courses in salestraining, commercial skills and service, all firmly founded onthe ÅF approach to sound entrepreneurial skills.
CertificationAt the ÅF Academy, ÅF project managers undergo training toobtain certification in accordance with the European accredita-tion standard, IPMA. At the time of writing, ÅF has 232 certifiedproject managers at four different levels of certification: A, B, Cand D. For project managers involved in international projects,the certification process is conducted in English.
Education and training in nuclear powerThe ÅF Nuclear Academy is a competence development initia-tive designed to prepare consultants to meet the increasinglystringent requirements of the nuclear power industry and itsregulatory bodies. Courses lead to certification at four levels,and 16 individuals received certification in 2010. The initiativehas stimulated considerable interest in the industry and givesindividual employees outstanding opportunities for professionaldevelopment. Courses are also open to clients and other industrystakeholders.
Variable salaries and Group bonusThe four ÅF divisions have adopted different systems for variableremuneration packages, either based on the results of the divisionas a whole or on individual performance.To underline the relationship between the efforts made by
each individual co-worker and the profitability of the ÅF Group inthe short term and the long term, a bonus model has been intro-duced. Under the current system, part of all profit generated atGroup level is shared out in the form of a bonus payment that isthe same for all co-workers in the company.
Other benefitsAlongside exciting opportunities for professional development,other benefits open to ÅF employees, such as occupationalpensions, favourable insurance deals, company cars, etc., varyfrom country to country depending on local practice and nationaltax regimes.All ÅF Group employees are entitled to rent one of the cottages
or apartments that are owned, managed or leased by the ÅFStaff Foundation.
Sickness absenceSickness absence among ÅF employees was 2.1 percent in2010 (2009: 2.2 percent).

Å F A N N U A L R E P O R T 2 0 10
Elena Kozhevnikova, BusinessDevelopment manager,ÅF in St Petersburg, Russia:“It’s exciting to be part of the era of knowledge capital. My mainresponsibility is developing the organisation in terms of professionaland social skills, knowledge accumulation and integration betweenour various units. The ÅF Group is a fantastic example of rapid yetbalanced growth. If we want to stay on top, however, it’s crucial thatwe continue to make use of the experience and expertise we have indifferent sectors and geographical areas. We need to make the bestpossible use of our synergies.”
Liisa Mäki, HR manager,
ÅF in Vantaa, Finland:“One key aspect of our work is to support managers so that we cancreate the best possible management culture and safeguard ourgood reputation as an employer. This will enable us to recruit thebest co-workers from among both experienced engineers and youngpeople who are just embarking on a career. We also invest a lot ofeffort in motivational issues, to achieve a whole that is greater thanthe sum of its parts.”
Liselotte Trösch, HR manager,ÅF-Colenco in Baden,
Switzerland:“Our biggest challenges are to recruit highly educated and experi-enced engineers who speak several languages, and to sort out thecomplexities of international social insurance, labour law and taxissues for our employees working abroad.”
Charlotte Witt, ÅF’s Directorfor Human Resources,
Stockholm, Sweden:“Our greatest challenge is to focus on efficient processes andintelligent ways of working. We need to be service-oriented,knowledgeable and able to work closely with the client. Successfulgrowth will require recruiting more co-workers and making sure thatwe have managers who set clear targets and aims together withtheir teams. And this, of course, will bring in even more interestingand stimulating projects.”
Growing our most important asset
1 7T H I S I S Å F H U M A N R E S O U R C E S

Å F A N N U A L R E P O R T 2 0 10
Dieter Müller, PhD, manager of the Hydro-power unit at ÅF-Colenco in Switzerland
What has the leadership programmegiven you?“I’ve gained new insights into interesting subjectsthat support the long-term strategy for our busi-ness. I liked all the great communication and lead-ership ideas, which are useful in my day-to-daywork. But I also appreciated the chance to networkand find out more about ÅF’s business.”
What would be a typical day at work?“My working day generally starts with checking mye-mail. If I’m in the office I’ll have internal meetingswith our project managers on decisions relating tocurrent projects or I’ll discuss various proposals,agreements or recruitment matters with othermembers of the management group. Then thereare meetings with, or phone calls to, clients andpartners. During breaks I schedule in brief conver-sations with my staff about their various chal-lenges. Early mornings or late afternoons aregenerally spent preparing for meetings or readingthrough documents.”
Maria Åkesson, section manager atTelecom East, Technology Division
What has the leadership programmegiven you?“It’s bolstered my business expertise. It’s alsodeveloped my leadership skills and given me lotsof good communication skills. What’s more, I’vebuilt up a fantastic network within ÅF.”
What would be a typical day at work?“My working days tend to start early. That way, Ican make sure I have a quiet period before every-thing really gets going. I generally spend this timeon admin, such as e-mail and other odds and ends.During the day I’ll be involved in a variety of things,ranging from meetings with clients, lunchtimemeetings with consultants who are working in thefield, job interviews and project follow-ups. I gohome in the afternoon with my head held high,really proud of my consulting team and the workwe do for our clients.”
T H I S I S Å F H U M A N R E S O U R C E S
ÅF’s Business Executive Leadership Programme is a joint venture with IFL Executive Educationthat is aimed at selected managers within the ÅF Group. Training is spread over a 12-monthperiod during which participants acquire a deeper understanding of ÅF as a company. Amongthe topics covered are strategic planning, international leadership and communication skills.January 2011 marked the end of the first programme, in which Maria Åkesson and DieterMüller were two of the 18 participants.
Growth needs good leaders
1 8

1 9
2008 2009 2010
0
1,000
2,000
3,000
4,000
Number of employees (all forms of employment)
Men Women
2008 2009 2010
0
6
12
18
24
Staff turnover (resignations) %
30 – 39– 29 40 – 49 50 – 59 60 –Age group
Staff turnover based on resignations.Total 2010: 8.9 percent (2009: 6.3 percent).
Age distributionPercentage
Age group, years 2008 2009 2010
–29 14 14 1430–39 30 29 3040–49 27 27 2750–59 19 19 1960– 10 11 11Average age 43.1 43.4 43.3
Length of employmentPercentage
Years of employment 2008 2009 2010
–2 34 26 223–5 21 27 336–10 19 19 1811–20 16 17 1621– 10 11 11Average length of employment 7.8 7.9 7.9
Education, %2008 2009 2010
Postgrad. licentiate or Ph.D studies 3.2 3.6 3.2University degree 43.8 46.6 53.2Other post-secondary education 13.4 13.7 15.0Secondary 39.6 36.1 28,6
Å F A N N U A L R E P O R T 2 0 10
T H I S I S Å F H U M A N R E S O U R C E S

2 0
Å F A N N U A L R E P O R T 2 0 10
M E D A R B E TA R E Å F 2 010
Armada
• Sweden’s largest careers fair fortechnology students.
• Organised by the student union atthe Royal Institute of Technology inStockholm.
• In November 2010 some 8,000 visitorscame into contact with around 150companies over two days.
• Various peripheral events over a two-weekperiod include the Enova and ArmadaChallenge problem-solving competitions.
T H I S I S Å F H U M A N R E S O U R C E S
10:00 Armada opens. ÅF welcomesstudents with an informal chat, fresh fruit anda great cup of coffee. The day combines lotsof information with opportunities for makingcontacts and networking.
ÅF is working actively on employer branding to presentitself as a good employer for potential employees andstrengthen its image in general. In 2010 ÅF was the mainsponsor together with Ericsson of the Armada CareerDays event at Sweden’s Royal Institute of Technology.Armada is Sweden’s largest careers fair for engineeringstudents. Here’s how we got on!
Calling all students!
11:37 Jenny Voss, an electri-cal engineer who works in technicalsales at ÅF’s Nynäshamn office, meetsSawayos Jaynutapong who is studyingfor a master’s degree in sustainabletechnology. She advises him on wherehis skills could take him.

2 1
Å F A N N U A L R E P O R T 2 0 10
T H I S I S Å F H U M A N R E S O U R C ES
12:18 “If you don’t knowwhere you’re going, then you’ll never getthere.” The excitement is palpable whenan ÅF project management veteran talksabout what it takes to be a successfulproject manager. ÅF’s lunchtime presen-tation is packed with over 200 studentswho are totally tuned into this taste ofreality.
14:22 “I think ÅF has made a majorimpression on the students who’ve comealong to these career days,” says Moa Moss-berg (right), student union project managerfor Armada. Although it is a hectic day, shemanages to exchange a few words with ZahraParsa. Zahra, a civil engineering graduatespecialising in geotechnical engineering, isa business developer at ÅF in Borlänge.
ÅF employer branding activities
• A number of external activities are car-ried out every year at universities, bothIRL (“in real life”) and via social media.
• This work strengthens ÅF’s profile not onlyamong potential employees, but alsoamong future clients and competitors.
• Students come away with good contactsfor degree project placements andcareers enquiries in their specialist field.ÅF attaches considerable importance tomeeting students’ needs and puttingthem in touch with the right personquickly.
• 2010 marked the start of the “Sustain-ability Case Tour”, an opportunity for stu-dents from Chalmers University of Tech-nology in Gothenburg, the Royal Instituteof Technology in Stockholm and the tech-nical universities in Linköping and Lundto test their problem-solving skills ininfrastructure planning and sustainability.
• ÅF took part in the new “Career Days”event in Stockholm’s Globen Arena inorder to meet more practising engineers.
22:07 “Armada 2010,what a fair! Every company wants tobe there. Apply to us, apply to us.Come and share your genius!” At theclosing banquet, Sofia von Celsing,who is responsible for employerbranding at ÅF, thanked the projectgroup – in verse! – for all its hardwork.

2 2 O P E R AT I O N S E N E R G Y D I V I S I O N
ENERGY
Key figures 2010 2009
Operating income (in millions of SEK) 1,012.1 1,192.2
Operating profit (in millions of SEK) 83.1 126.5
Operating margin, % 8.2 10.6
Contribution to Group income % 23 27
Number of employees (FTEs) 906 841
Operating profit per FTE (in thousands of SEK) 92 150
The historical figures above have been adjusted, proforma, to take account ofthe corporate restructurings implemented on 1 January and 1 October 2010.
Contribution toGroup sales
23%
The Energy Division offers technical consult-ing services for the energy sector. It hasoperations in large parts of the world and isa market leader in the Nordic region, Switzer-land and the Baltic countries. In 2010 ENRmagazine (Engineering News Record) rankedÅF as the world’s sixth-largest internationalenergy consultant.
The offer – consulting for the entire investment cycleThe Energy Division offers technical and financial consultingservices for the energy sector, with the emphasis on power gen-eration and district heating. Services include everything fromadvice on energy markets and their regulations to the imple-mentation of investments in power plant new-builds.Already a market leader in Finland, Switzerland and the Baltic
countries, the division is also enjoying rapid growth in Russiaand Central Europe. 2010 brought the acquisition of the Czechconsulting company Meacont, strengthening the division’s mar-ket position in the Czech Republic and Slovakia. At the end ofthe year the division acquired Mercados Energy Markets Interna-
A catalyst for ÅF’sinternational growth
Å F A N N U A L R E P O R T 2 0 10

Å F A N N U A L R E P O R T 2 0 10
Energy Division – facts at a glance
• Consulting services for all types of energy.
• Global operations.
• 1,100 co-workers in the Czech Republic, Estonia, Finland, India, Lithuania,Nigeria, Russia, Spain, Switzerland, Thailand and Vietnam.
• Contribution to total Group sales: 23 percent.
• All assignments are conducted outside Sweden. (Please see Industry Divisionfor energy assignments in Scandinavia.)
Meet Eero AurannePresident, Energy Division
What are you happiest about in 2010?“We made two strategic acquisitions: CzechMeacont Praha in May and Spanish MercadosEMI in December. The former will strengthenour business both internationally and innuclear power, while Mercados will bringa new strategic dimension to the division’srange through its strong presence in theinternational energy markets.”
What’s top of your agenda for 2011?“To consolidate our rapid acquired growthand integrate the new operations so that wecan offer a cohesive international ÅF range.”
What’s the best thing about ÅF?“ÅF has expanded its international operationsconsiderably over the last five years. At thesame time we have consistently deliveredsound financial results and are now theworld’s sixth-largest international consultantin power and energy.”
tional, a Spanish-based consulting company. Energy has also establisheda firm foothold in the growth regions of India and Southeast Asia.The division’s specialist expertise, breadth of experience and ability to
take projects from the drawing board to implementation are some of thekey factors behind its success.The Energy Division offers a broad spectrum of services that includes
aspects of technology, financing, management and energy consulting.While assignments are frequently connected to major investment projects,the division also takes on projects to increase the efficiency and capacityof existing plants and offers strategic advice at managerial level on energymarkets and power deals. It also carries out environmental and safetyinvestigations.Most of Energy’s turnover is derived from services relating to invest-
ments in power plants. Consultants offer support throughout the life cycleof a project: analyses and feasibility studies in the initial stages, pre-engi-neering and engineering once the investment decision has been made,and project management during the implementation phase. This includesservices such as project steering, the basic design of process solutions,procurement negotiations, manufacturing, design and installation inspec-
2 3

2 4
Å F A N N U A L R E P O R T 2 0 10
O P E R AT I O N S E N E R G Y D I V I S I O N
ENERGY
tions, and functionality testing. Once the plant is fully opera-tional the division can also assist with a range of other services,from troubleshooting to maintenance planning.
Clients – large-scale projects and partnershipsEnergy’s clients are private and publicly owned energy compa-nies, energy-intensive industries, public institutions and financialinstitutions. These clients’ investments are usually large-scaleand extend over many years. As such, client relationships arelong-term and often characterised by a sense of partnership.Thanks to the fact that the division has established a presencein many different locations, geographical proximity to clients isgood.• The division currently has several hundred clients.• A large proportion of clients come back with repeat business.• The ten largest clients account for 39 percent of the division’ssales.
• Clients include Alpiq (Switzerland and Central Europe), Fortum(Nordic countries and Russia), Energo Service and Remener-gomontazh (Russia), CEZ (the Czech Republic and EasternEurope) and many national power companies such as EestiEnergia, Latvenergo, Lietuvos Elektrine and ElectrobrasNuclear Brazil.
Market and trends – healthy order books and marketrecoveryThe division began 2010 with major projects on its books, whichensured a satisfactory level of capacity utilisation. However,economic uncertainty meant that the markets in Russia, the Bal-tic countries, Finland and Southeast Asia suffered a downturnafter the orders had been secured, which resulted in reducedinvestments in energy and tougher price competition. Nonethe-less, 2010 brought clear signs of recovery to the investmentmarkets, and many projects that had been put on hold resumed.Despite the global recovery in the power sector, the downturn
in other process industries led to excess capacity and pressureon prices for some engineering services in Finland and the Bal-tic countries. Furthermore, the sharp drop in the value of theeuro relative to the Swiss franc caused problems for the Swissoperation.Despite these short-term difficulties, the world still has a fun-
damental need for more energy, primarily electricity. Consump-tion is increasing in many countries, driving a relentless questfor additional capacity that must be met by both conventionaland renewable forms of energy. Furthermore, existing plantneeds to be made more efficient in order to increase capacityand improve environmental performance. Sustainability issuesrelating to energy consumption have become a natural part ofcompanies’ business opportunities in more and more markets.The division expects the energy sector to remain a growth
area with considerable potential.
2 5
Å F A N N U A L R E P O R T 2 0 10
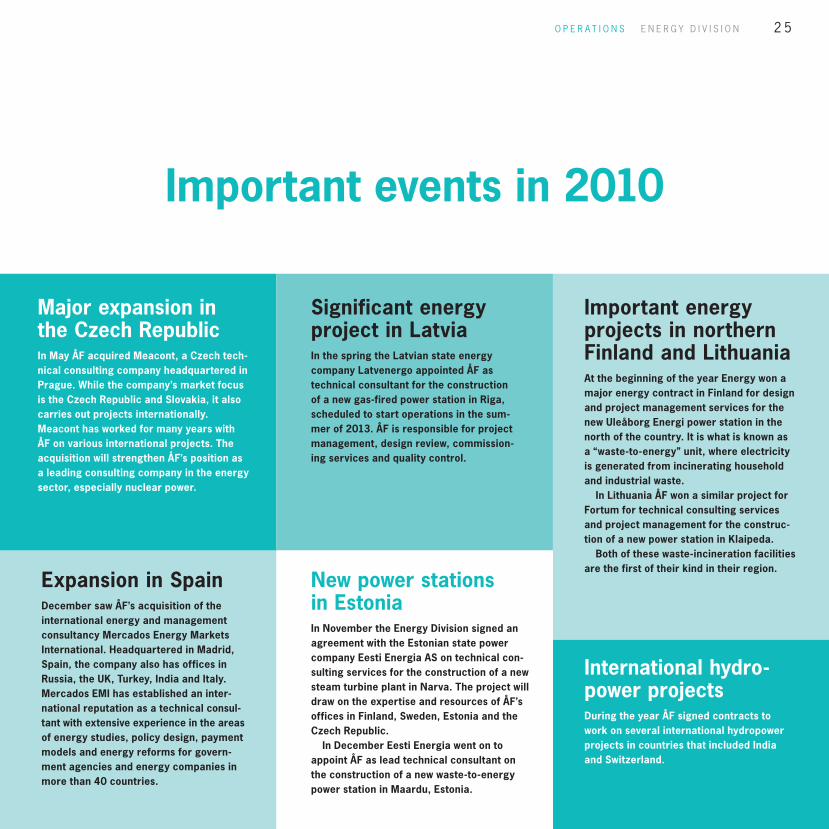
Important events in 2010
Major expansion inthe Czech RepublicIn May ÅF acquired Meacont, a Czech tech-nical consulting company headquartered inPrague. While the company’s market focusis the Czech Republic and Slovakia, it alsocarries out projects internationally.Meacont has worked for many years withÅF on various international projects. Theacquisition will strengthen ÅF’s position asa leading consulting company in the energysector, especially nuclear power.
Significant energyproject in LatviaIn the spring the Latvian state energycompany Latvenergo appointed ÅF astechnical consultant for the constructionof a new gas-fired power station in Riga,scheduled to start operations in the sum-mer of 2013. ÅF is responsible for projectmanagement, design review, commission-ing services and quality control.
Important energyprojects in northernFinland and LithuaniaAt the beginning of the year Energy won amajor energy contract in Finland for designand project management services for thenew Uleåborg Energi power station in thenorth of the country. It is what is known asa “waste-to-energy” unit, where electricityis generated from incinerating householdand industrial waste.
In Lithuania ÅF won a similar project forFortum for technical consulting servicesand project management for the construc-tion of a new power station in Klaipeda.
Both of these waste-incineration facilitiesare the first of their kind in their region.
Expansion in SpainDecember saw ÅF’s acquisition of theinternational energy and managementconsultancy Mercados Energy MarketsInternational. Headquartered in Madrid,Spain, the company also has offices inRussia, the UK, Turkey, India and Italy.Mercados EMI has established an inter-national reputation as a technical consul-tant with extensive experience in the areasof energy studies, policy design, paymentmodels and energy reforms for govern-ment agencies and energy companies inmore than 40 countries.
New power stationsin EstoniaIn November the Energy Division signed anagreement with the Estonian state powercompany Eesti Energia AS on technical con-sulting services for the construction of a newsteam turbine plant in Narva. The project willdraw on the expertise and resources of ÅF’soffices in Finland, Sweden, Estonia and theCzech Republic.
In December Eesti Energia went on toappoint ÅF as lead technical consultant onthe construction of a new waste-to-energypower station in Maardu, Estonia.
International hydro-power projectsDuring the year ÅF signed contracts towork on several international hydropowerprojects in countries that included Indiaand Switzerland.
O P E R AT I O N S E N E R G Y D I V I S I O N

A V S N I T T Å F 2 0102 6
Å F A N N U A L R E P O R T 2 0 10
ENERGY

Å F A N N U A L R E P O R T 2 0 10
Transforming the Alpsinto storage batteries
2 7
The Nant de Drance pumped-storage facilitywas conceived to exploit the enormous hydro-electric potential of the Swiss Alps. The plantis jointly owned by two listed energy utilitiesand a railway operator. ÅF-Colenco’s engi-neers were assigned responsibility for allphases of the project, from design engineer-ing and issues relating to permits to commis-sioning. The new underground facility makesuse of a difference in height of more than 350metres between two reservoirs connected viaa system of subterranean channels, and willhave a capacity of 900 megawatts. Betweenthe reservoirs a huge gallery is being exca-vated to house a power station with six 150-megawatt pump-turbines. When demand forelectricity is low, the turbines will pump thewater from the lower to the upper reservoirin a process similar to that of charging abattery. When demand increases, the waterthat has previously been pumped up can beused to produce electricity. In all, some 14kilometres of tunnels and chambers need tobe excavated in the mountainside to provideaccess and house the logistics.
“We chose an external specialist with the compe-tence to design, plan and assist in all aspects ofthe project development and implementation.ÅF-Colenco was one of the forerunners throughoutthe selection process because of the company’sprevious experience from similar major projects.ÅF-Colenco works across a wide spectrum of engi-neering activities, offering specialist expertise indisciplines such as civil engineering, deep mining,electromechanics, electrical engineering, automa-tion and construction technologies. The companyhas a proven track record of its ability to deliverand to act promptly if delays occur. Everyone knowswhat they have to do and how to do it, and a strongteam spirit has always been one of the distinguish-ing characteristics of the company.”
Eric Wuilloud, CEO Nant de Drance Ltd.,Martigny, Switzerland.
SwitzerlandPhoto: Jean-Luc Lugon

2 8
Å F A N N U A L R E P O R T 2 0 10
O P E R AT I O N S I N D U S T R Y D I V I S I O N
INDUSTRY
31%
Boosting client profitabilitythroughout the business cycle
The Industry Division is the leading technicalconsultant for industries in the Nordic regionand enjoys a unique standing in industrialautomation. This is a field in which consultingservices are in demand throughout the busi-ness cycle, as automation provides excellentopportunities for clients to improve profitabil-ity and reduce their environmental impact.Geographical proximity to clients, a thoroughunderstanding of the sectors in which they
work and experience gained from previousprojects pave the way for long-term clientrelationships.
The offer: from pre-study to commissioning– and more full-service projectsThe Industry Division is the largest independent consultant in itsfield in the Nordic region, with responsibility for energy andnuclear power assignments in Scandinavia, where it cooperatesclosely with the Energy Division. In all other sectors of industrythe division operates worldwide.
Å F A N N U A L R E P O R T 2 0 10
Contribution toGroup sales
Key figures 2010 2009
Operating income (in millions of SEK) 1,340.0 1,386.8
Operating profit (in millions of SEK) 119.9 129.9
Operating margin, % 9.0 9.4
Contribution to Group income % 31 32
Number of employees (FTEs) 1,200 1,222
Operating profit per FTE (in thousands of SEK) 100 106
The historical figures above have been adjusted, proforma, to take account ofthe corporate restructurings implemented on 1 January and 1 October 2010.

Å F A N N U A L R E P O R T 2 0 10
Industry Division – facts at a glance
• Responsible for energy and nuclear power assignments in Scandinavia and otherindustrial contracts worldwide.
• Offers engineering consulting services in all fields and in all sectors of industry.
• 1,300 co-workers in some 50 offices in Sweden, Norway, Denmark, Germany,Spain, Estonia and South Africa.
• Contribution to total Group sales: 31 percent.
• Approximately 20 percent of assignments are conducted outside Sweden.
Meet Per MagnussonPresident, Industry Division
What were you happiest about in 2010?“I’m proud of the fact that – despite toughtimes for industry and growth that had stag-nated in absolute terms – we succeeded inwinning new assignments and developingour existing business. This meant that weincreased our market share from nine per-cent to eleven percent.”
What’s top of your agenda for 2011?“Strong growth! I’m convinced there’s a verygreat need for our services. I’m counting onthe lion’s share of growth in 2011 being organic.We will be placing great emphasis on this inall areas of the division throughout the year.”
What’s the best thing about ÅF?“The people who work here! They’re outstand-ing. There’s a unique mix of experience andpioneering spirit at ÅF that I’ve never encoun-tered anywhere else. When we work together,we’re more than a match for every challenge.That creates the basis for close relations withour clients – a kind of partnership, with vestedinterests in one another’s development andsuccesses.”
The Industry Division provides experienced process engineers withskills in most sectors, multidisciplinary project leaders for major projects,technical specialists and a broad spectrum of engineering expertise, totake care of every link in the chain, from feasibility studies to the finishedplant. The division’s main focus areas are process technology, designand analysis calculations, control technology, industrial IT, automation,electrical power systems, mechanical engineering, piping design andinspections.Services are aimed at companies with industrial production facilities.
Consultants can work as an integral part of the client’s own organisation;alternatively, the division can assume total overall responsibility for thedelivery of a specific function or even an entire project. Most contractsinvolve modernising existing facilities or making them more efficient, butthe division is, of course, also involved in building new industrial plants.The division’s long experience and cutting-edge know-how are provinga valuable combination as various aspects of sustainability becomeincreasingly important for clients in industry.
2 9

3 0
Å F A N N U A L R E P O R T 2 0 10
O P E R AT I O N S I N D U S T R Y D I V I S I O N
INDUSTRY
Typical assignments include technology and financial impactassessments to produce the documentation on which clientsbase decisions on future investments, control technology for pro-duction lines, the integration of production systems and businessmanagement systems, and design engineering projects for bio-fuel furnaces or nuclear power plants.
Clients – a broad cross-section, low sensitivity to theeconomic cycleThe Industry Division offers services to all sectors of industrybut enjoys a particularly strong standing in energy, nuclearpower, mining, food technology, pharmaceuticals, pulp andpaper, and other process industries. Not only does this diverseclient base across a range of industries leave the division rela-tively unscathed by ups and downs in the business cycle, thedivision’s offer also remains attractive whatever the health ofthe economy: industry has a constant need for improvements inproductivity, environmental adaptations and measures to saveenergy and improve safety.The division works in geographical proximity to its clients and
collaborates closely with them. The strategy is for around 80 per-cent of the division’s business to be generated by local clients,while the remaining 20 percent derives from joint projects withother units within the division or with other ÅF divisions. This cre-ates flexibility within the organisation and the ability to accommo-date clients’ expansion ambitions. Consequently, relationshipswith clients are increasingly assuming the character of partner-ships, where the division shoulders a great deal of responsibilityfor the delivery of the projects as a whole.
• The division has approximately 3,400 active clients.• The ten largest clients account for 30 percent of the division’searnings.
• The largest single client accounts for 8 percent of earnings.• Major clients include ABB, Fortum, Korsnäs, LKAB, Novo Nor-disk A/S, Rexcell Tissue, Siemens, SSAB, the municipal waterutility Stockholm Vatten, Sweden’s nuclear power plants atForsmark and Ringhals, and Westinghouse.
Market and trends – efficiency improvements andredeployment of resourcesThe Industry Division is a market leader in the Nordic regionwith a market share of eleven percent.The division’s strengths in automation proved invaluable during
the economic downturn: with the main emphasis of most newassignments on making existing operations more efficient, Indus-try won new shares of a market that, as a whole, had more orless stagnated.After a sluggish start to the year, by September there were at
last clear signs of a recovery in the business cycle. While this wasevident in all sectors, demand remained strongest for efficiencyimprovements in production plants, environmental projects, thedevelopment of alternative fuels and energy-efficiency conver-sions. In geographical terms, operations are strongest in the min-ing industry in the north of Sweden and in the energy and pharma-ceutical industries in the south of Sweden.

3 1
Important events in 2010
Continued investmentin focus area ofnuclear powerDuring the autumn ÅF acquired the tech-nical consulting company Platom AB. Theacquisition will strengthen the IndustryDivision’s offer in the field of nuclearpower with high-quality process andanalysis services.
Major investmentin miningThe summer saw the acquisition of the tech-nical consulting company VPC Mining fromVattenfall. The company provides high-qualityengineering services for the mining industryand will enable ÅF to consolidate its positionas one of pre-eminent technical consultingcompanies in the north of Sweden. The miningsector grew strongly during the year, and ÅFcoordinates and develops projects through itsMining Competence Centre. ÅF is involved in anumber of projects, including a major prospect-ing project in Pajala for Northland Resources.
Important project inenergy/pulp and paperIn April ÅF was appointed lead technicalconsultant for the investment in a newblock heat power plant on the Korsnäsindustrial site in Gävle, Sweden, adjacentto the Korsnäs pulp and paper mill. Theclient is Bomhus Energi AB, which is jointlyowned by forestry group Korsnäs and muni-cipal power company Gävle Energi. This ÅFassignment is a multidisciplinary EPCMproject that covers all areas of technologyrelating to the investment, including projectmanagement and administration. Readmore overleaf.
Strategic investmentin hydropower andelectricity networksThe end of the year brought the acquisitionof Energo, which has operations in Stock-holm, Malmö and Helsingborg. This willstrengthen Industry’s position in hydro-power, dam safety, windpower, electricalnetworks and power supply. The Infrastruc-ture Division and Technology Division alsostand to benefit from Energo’s specialistexpertise.
Stronger position inSwedish energyAt the end of the year ÅF signed a four-yearcontract as an ‘A’ supplier to Vattenfall. Indoing so, ÅF strengthened its position as astrategic partner in nuclear power, hydro-power and windpower. The agreement re-lates to the provision of technical consult-ing services in all disciplines. ÅF intendsto step up its recruitment of personnelwith experience in the energy sector asa consequence of the agreement.
O P E R AT I O N S I N D U S T R Y D I V I S I O N

A V S N I T T Å F 2 0103 2
Å F A N N U A L R E P O R T 2 0 10
INDUSTRY

Å F A N N U A L R E P O R T 2 0 10
3 3
Gävle, SwedenPhoto: Andreas Björklund
Municipality andindustry join forceson district heatingBomhus Energi is a new energy company thatis jointly owned by forestry company KorsnäsAB and municipal power company GävleEnergi. The two teamed up to build a jointpower plant when Korsnäs wanted to makeits energy process more efficient and GävleEnergi needed to guarantee a good price forits district heating. ÅF was assigned to runthe project, which involves overall projectmanagement, project planning, financialfollow-ups, HSE work and quality follow-ups,and process, pipe, low-voltage and instru-ment project engineering.
“Korsnäs has been working with consultants fromÅF for many years on both environmental and pulpand paper projects that have required expertise inprocess engineering and energy. In our opinion,ÅF has highly skilled employees. They are easy towork with and can make a quick start on projectsas they know our industry so well. We’ve alwaysbeen pleased with the work they’ve done for us,which is why we’ve gone back to them time andagain. ÅF won the important job of lead consultantfor the construction of the new power plant prima-rily because of the company’s track record in theindustry and its undisputed ability to deliver.”
Mats Törnkvist,Technical Director, Korsnäs AB

3 4
Å F A N N U A L R E P O R T 2 0 10
O P E R AT I O N S I N F R A S T R U C T U R E D I V I S I O N
29%
INFRASTRUCTURE
Market leader with sustainablesolutions for tomorrow’s world
The Infrastructure Division leads the Scandi-navian market for technical solutions forinfrastructure projects. The division’sstrengths include a strong sales organisa-tion, sound commercial skills and a portfolioof services with a firm focus on sustainabil-ity. The division is continuously enhancing itsmarket potential by developing innovativesolutions that boost client profitability andsupport clients’ target fulfilment aspirations.
The offer – sustainability integral to all servicesThe Infrastructure Division comprises five business areas: Instal-lations, Environment, Rail, Roads and Sound & Vibrations.Installations is the largest of the division’s business areas and
Sweden’s number one technical consultant for qualified servicesrelated to the construction and modernisation of commercial,industrial and public-sector premises. Many of its assignmentsrevolve around improving functionality, reducing operating costsand enhancing environmental performance.Rail offers everything from surveys and investigations to
more technically oriented installations assignments where thefocus is on track-laying, electrical and signalling systems, and
Å F A N N U A L R E P O R T 2 0 10
Contribution toGroup sales
Key figures 2010 2009
Operating income (in millions of SEK) 1,233.1 1,167.6
Operating profit (in millions of SEK) 69.0 101.9
Operating margin, % 5.6 8.7
Contribution to Group income % 29 27
Number of employees (FTEs) 1,065 994
Operating profit per FTE (in thousands of SEK) 65 103
The historical figures above have been adjusted, proforma, to take account ofthe corporate restructurings implemented on 1 January and 1 October 2010.

Å F A N N U A L R E P O R T 2 0 10
Infrastructure Division – facts at a glance
• Clients in the property market, construction and industrial plant, and the publicsector.
• Services include both one-off projects and full-service solutions, from initialconceptualisation to implementation.
• Infrastructure planning and energy efficiency are growth areas that are given toppriority.
• Approximately 1,400 members of staff in some 40 offices in Denmark, Norwayand Sweden. Individual project activities are carried out all over the world, includingRussia and China.
• Contribution to total Group sales: 29 percent.
traffic communications. Land improvement services and geotechnicalconsulting for railway embankments, etc. come under the remit of theRoads business area.Sound & Vibrations possesses unique cutting-edge expertise in acous-
tics and vibrations to meet needs within industry, infrastructure planning,property management and product development.Environment offers services related to environmental impact assess-
ments and licensing procedures to the full spectrum of ÅF clients.Roads’ portfolio of services extends from land improvements, geotech-
nical and rock engineering assignments to investigations and analyses oftraffic solutions and other infrastructure planning projects in which roadsplay an important part.
Clients – long-term projects limit sensitivity to the economiccycleThe Infrastructure Division has a number of very large clients in the prop-erty sector, which have substantial shares of their respective markets.One such client is Skanska, for whom ÅF is involved in a major projectengineering assignment for the new Karolinska University Hospital in Solna.
Meet Mats PåhlssonPresident, Infrastructure Division
What were you happiest about in 2010?“I’m delighted that, thanks to good organicgrowth and strategic acquisitions, ÅF hasestablished such a prominent place for itselfin the field of infrastructure consulting. Wehave also won some major new assignmentsand have a portfolio of many satisfied clientseager to develop their collaboration with us.”
What’s top of your agenda for 2011?“To make sure we remain the number onechoice for clients looking for sustainable solu-tions. By being best in the fields of energy-efficiency, rail traffic and other infrastructuredevelopments, we can take a big share of thestrong growth we expect in these areas.”
What’s the best thing about ÅF?“The broad appeal of the ÅF brand. It helps usattract the best co-workers, make goodacquisitions and keep our clients happy.”
3 5

3 6
Å F A N N U A L R E P O R T 2 0 10
O P E R AT I O N S I N F R A S T R U C T U R E D I V I S I O N
Public-sector assignments tend to be major tax-funded invest-ments over many years. This leads to long-term relationshipswith clients and a more or less continuous inflow of orders.Many major infrastructure projects extend beyond the horizon
of a single business cycle, thus reducing the division’s sensitiv-ity to fluctuations in the economy. However, there is a slowdownin orders during periods of low economic activity and competi-tion intensifies as more foreign players enter the arena andprices come under pressure.Other factors that mitigate the division’s sensitivity to the eco-
nomic cycle are its broad client base and the fact that manyprojects are driven by the need to improve efficiency, whichalways has a direct impact on clients’ profitability regardless ofthe state of the economy.• The division serves approximately 6,000 clients.• Approximately 30 percent of clients are from the public sectorand approximately 70 percent from the private sector.
• Between them, the ten largest clients account for just underone third of the division’s earnings.
• Important clients include the Danish Road Directorate, theSwedish Transport Administration, Skanska, Statbygg (Nor-way), Stockholm’s regional transport authority (SL), and localand regional authorities.
Market and trends – strong market and good prospectsThe market for infrastructure consulting services remainedgood throughout 2010, underpinned by a steady increase in thenumber of major investments in new roads and railways fundedby the public purse. ÅF has reported good growth in this sector.Towards the end of the year, the division also saw clear signs
of an upturn in the property sector, which had been very badlyaffected by the financial crisis. This is a sector where manyprojects are driven by the need to make energy-efficiency gains.As far as the economy is concerned, the outlook remains
good. We assume continuing keen interest in environmentalinvestments and energy-efficiency projects and, thanks to politi-cal decisions that have already earmarked funds for long-terminvestments in the Nordic road and rail network, demand fromthat sector is also expected to be good for many years to come.
INFRASTRUCTURE

3 7
Å F A N N U A L R E P O R T 2 0 10
Important events in 2010
Stronger positionin infrastructureplanningIn the summer of 2010 ÅF acquired theconsulting operations of the City of Gothen-burg’s highways and traffic managementdepartment, Göteborgs Gatuaktiebolag.This municipal consulting company hasapproximately 100 employees engagedininvestigations, project engineering andproject management of existing and newinfrastructure investments in the rapidlyexpanding Gothenburg region.
Major StockholmBypass projectIn collaboration with the engineering con-sultancy Scott Wilson UK, ÅF was awardedtwo of the four contracts from the SwedishTransport Administration to provide tech-nical consulting services for the majorStockholm Bypass project. The projectinvolves project planning and projectengineering work for the interchanges atAkalla and Häggvik and the rock tunnels.
New organisationfor sharper focuson growthOn 1 October the former InfrastructureDivision was split into two new divisions:Infrastructure and Technology.
Market leader inenergy-efficientpropertiesThe end of the year brought the acquisitionof Energo, which has operations in Stock-holm, Malmö and Helsingborg. This willstrengthen ÅF’s position as a leader in thegrowing Swedish market for improving theenergy efficiency of buildings. The divisionwill also gain considerable technical instal-lation know-how. The Industry Division andTechnology Division also stand to benefitfrom Energo’s specialist expertise.
O P E R AT I O N S I N F R A S T R U C T U R E D I V I S I O N

A V S N I T T Å F 2 0103 8
Å F A N N U A L R E P O R T 2 0 10
INFRASTRUCTURE

Å F A N N U A L R E P O R T 2 0 10
3 9
Fredriksberg Castle, Copenhagen
A Nordic castle shouldhave Nordic lightingDenmark’s army officers will all pass throughthe Royal Danish Army Academy during theirtraining. Based at Frederiksberg Castle, theacademy wanted to light up the externalfacades so that this national treasure couldbe appreciated around the clock. ÅF Den-mark was commissioned to devise a lightingproposal that exemplified the Nordic conceptof light. Lighting up a dark Nordic castle re-quires a completely different approach fromilluminating a similar building in SouthernEurope. Natural simplicity works better inthe Nordic countries, without theatrical pro-ductions and clever lighting effects. The newlighting was ready in time for Queen Mar-grethe’s birthday in April 2010. FrederiksbergCastle is now Copenhagen’s only historicalbuilding with lighting that is founded on aholistic approach.
“Providing beautiful and functional external lightingfor old castles isn’t exactly one of the army’s coreskills. We were therefore looking for a consultantthat could handle both the technical and formalaspects of this kind of project. We chose ÅF, andthe experience has been positive in every sense forthe academy. The consultants were open and pro-fessional with a ‘can-do’ approach that played acrucial role for the success of the end result. Therewere, of course, a few misgivings along the way,but I think that everyone is now more than happywith the impression the castle gives in the dark.”
Lieutenant Colonel Jan Stoltenborg,deputy commander at the Royal DanishArmy Academy

4 0
Å F A N N U A L R E P O R T 2 0 10
O P E R AT I O N S T E C H N O L O G Y D I V I S I O N
17%
TECHNOLOGY
Green-tech specialistsand high-tech solutions
The Technology Division is active mainly inSweden, where it is a leading name in prod-uct development and defence technology. Afirm base and a long track record of successprovide stability and give clients peace ofmind. The Technology Division also hasstrong offers within its specialist fields relat-ing to various aspects of sustainability.
Offer – high-tech solutions firmly founded on exten-sive experienceThe Technology Division is active in the fields of telecommunica-tions, defence and product development.In telecoms and IT, the division assists with everything from
coordinating major projects to providing highly specialised ser-vices, supporting clients – telecom operators, network owners,municipal authorities and private sector companies – by offer-ing solutions that are both sustainable and profitable. Typicalassignments include conducting technical IT security analyses,procuring and implementing new communication solutions, andplanning and project engineering broadband networks.
Å F A N N U A L R E P O R T 2 0 10
Contribution toGroup sales
Key figures 2010 2009
Operating income (in millions of SEK) 719.3 636.1
Operating profit (in millions of SEK) 69.1 33.7
Operating margin, % 9.6 5.3
Contribution to Group income % 17 14
Number of employees (FTEs) 616 604
Operating profit per FTE (in thousands of SEK) 112 56
The historical figures above have been adjusted, proforma, to take account ofthe corporate restructurings implemented on 1 January and 1 October 2010.

Å F A N N U A L R E P O R T 2 0 10
Division – facts at a glance Technology
• Clients in the defence sector, telecommunications, the engineering and automotiveindustries, medical technology and life sciences.
• Assignments include everything from one-off projects to full-service undertakings.Demand for sustainable solutions is increasing across the board.
• Approximately 700 co-workers at 12 offices, most in Sweden’s expansive metro-politan regions around Stockholm, Gothenburg and Malmö.
• Contribution to total Group sales: 17 percent.
The Defence business area offers services in civil security and mainte-nance technology to public and private sector clients. Typically, clientshere are looking for an independent consultant to analyse problems, toprovide support in the procurement process and, in many cases, to pro-ceed with the adaptation of systems. Examples of projects undertakeninclude the development of warning systems for the Swedish Civil Contin-gencies Agency (MSB), an investigation of the effect of offshore windfarms on radar stations for the Swedish Defence Materiel Administration(FMV), and the installation of mobile command centres, also for FMV.Product Development offers services related to product development
and hi-tech IT applications that include embedded systems, mechanicalengineering, programming and product care. The division has the skillsneeded to follow either a single component or the intended end-productthroughout the entire process from pre-study to serial production. Itsbroad spectrum of activities extends from pacemakers to 3G base sta-tions and train control systems.Since the manufacturing process frequently accounts for as much as
80 percent of the total environmental impact of a product, making theright choices at the design stage, when a product is still on the drawing
Meet Johan OlssonPresident, Technology Division
What were you happiest about in 2010?“The fact that our own business developedpositively even in the depths of an economicdownturn is a sign of strength that bodes wellfor the future. We’ve succeeded in growing ourbusiness while improving profitability and deliv-ering consistently high quality to our clients.”
What’s top of your agenda for 2011?“To make ÅF even stronger in our chosenareas of expertise. We’ll do that through newrecruitment, stronger sales and strategicacquisitions. Most of the growth will be in Swe-den’s expansive metropolitan regions aroundStockholm, Gothenburg and Malmö.”
What’s the best thing about ÅF?“That we’re number one – but continue to workas hard as if we were number two! ÅF is nevercontent to rest on its laurels. We always have agoal in our sights and never miss a chance toadvance our positions.”
4 1

4 2
Å F A N N U A L R E P O R T 2 0 10
O P E R AT I O N S T E C H N O L O G Y D I V I S I O N
board, is of paramount importance. For this reason, interest inthe ÅF EcoDesign Center has been steadily rising since the initi-ative was launched a few years ago. Here ÅF offers clients aneco-friendly product development service aimed at factoringenvironmental considerations, such as energy efficiency and theright choice of materials and components, into the equation atevery stage, from drawing board to finished product. Experiencesgained in the ÅF EcoDesign Center are systematically integratedinto the division’s other product development activities.
Clients – partnerships lead to larger undertakingsThe Technology Division is a leading name in product develop-ment and defence technology with the bulk of its clientele con-centrated in the light engineering and automotive industries, thedefence sector, medical technology and life sciences. Especiallyin the defence sector, customer relations are, without excep-tion, long-term and typically take the form of close collaborationakin to partnerships. Clients for the division’s product develop-ment services include both the R&D departments of large com-panies and small, innovative companies that outsource largeparts of their development activities.With no let-up in recent trends towards outsourcing bigger
and bigger assignments and even full-service undertakings, it isclear that procurement activities and the clients’ project evalua-tions are increasing in complexity. This, however, bodes well forÅF, which has the breadth and the experience to be able to offerclients the right option, whatever their needs.
Moreover, clients also benefit from ÅF’s strong appeal in thelabour market, which means the Technology Division has accessto the best consultants in the business at all times.• The division has around 350 clients.• The ten largest clients together account for just over 60percent of sales.
• Key clients include Bombardier, Electrolux, Ericsson, theSwedish Defence Materiel Administration (FMV), Kockums,SAAB, Scania, Visma and Volvo.
Market and trends – improved marketand greater demand for green solutionsDemand from the defence sector, which is traditionally largelyunaffected by the state of the economy, remained stablethroughout 2010.Demand from the private sector, which includes the telecom-
munications and automotive industries, picked up during thesecond quarter and continued to improve steadily throughoutthe year. This positive development was chiefly the result ofrecovery in our clients’ own markets as the world emerged fromthe economic downturn, opening up scope for investments ininnovations in both new and existing products and IT systems.Product development and product care activities are, on the
whole, relatively resistant to fluctuations in the business cycle;the needs they meet exist regardless of the general health ofthe economy.One clear and growing trend is that sustainability is now near
the top of every client’s agenda: environmental adaptation hasbecome an engine for growth.
TECHNOLOGY

4 3
Å F A N N U A L R E P O R T 2 0 10
Important events in 2010
Important new projectsThe year’s major orders included newprojects from Bombardier, Electroluxand Kockums.
Growth in thepublic sectorIn August the Swedish Legal, Financial andAdministrative Services Agency selectedÅF for a framework agreement for the pro-vision of IT project consulting services tovarious government agencies. The agree-ment is to run for two years, with the optionof a subsequent two-year extension, andwill pave the way for further inroads intothe public sector. ÅF won the contract pri-marily thanks to its experience of turnkeydeliveries.
Growth potential inthe defence sectorAt the end of the year ÅF signed a frame-work agreement with the Swedish DefenceMateriel Administration, FMV, relating totelecommunications. ÅF secured the fram-ework agreements for seven areas of tech-nology out of a total of nine: radio & antennasystems, satellite communication, telecomexchange systems, radar systems, tele-war-fare systems, identification systems and fre-quency planning. The contract is to run forthree years, with the option of a subsequentone-year extension.
Expansion in ITand telecomsThe end of the year brought the acquisi-tion of Energo, which has operations inStockholm, Malmö and Helsingborg. TheTechnology Division gained a number ofIT and telecoms consultants. The IndustryDivision and Infrastructure Division alsostand to benefit from Energo’s specialistexpertise.
Investments in clientinformation, projectmanagement andbusiness skillsThe year involved a number of trainingcourses for consultants in their role asbusiness professionals and project mana-gers. A new organisational structure waslaunched where various experienced pro-ject managers became key account man-agers for a selection of key clients.
O P E R AT I O N S T E C H N O L O G Y D I V I S I O N

A V S N I T T Å F 2 0104 4
Å F A N N U A L R E P O R T 2 0 10
TECHNOLOGY

Å F A N N U A L R E P O R T 2 0 10
4 5
Offshore wind farm, U.K.
Windpower and radarsurveillance worktogether at seaWind turbines affect the surveillance cap-ability of radar stations. Given that thereare plans for huge offshore wind farms, theSwedish Armed Forces needed to look intothe matter more closely to ensure that theirsurveillance operations could continue towork well. ÅF was assigned to carry out astudy of the technical, financial and legaloptions for setting up a radar station adjacentto an offshore wind farm. This project drew ona number of different skills within the group:radar technology, communication systems,encryption, law and project financing. Theresult was a proposal for a technical solutionwith costings.
“Getting radar surveillance to work alongside wind-power is an exciting challenge that really needsgood solutions. ÅF has the relevant radar expertise,good internal quality assurance and the capacity tounderstand and interpret our directives. ÅF showedan impressive commitment to the project, and onmany occasions the company took its own initia-tives when it came to contacting the authoritiesand companies involved. Our working relationshipwas positive and good humoured, but above allwith plenty of constructive dialogue. I like the wayÅF presents its opinions. It stimulates us to rethinkand come up with new ideas. ÅF carried out thisproject by the book.”
Kjell-Åke Eriksson M.Sc., project manager/project engineer with the Swedish DefenceMateriel Administration, FMV

4 6
Å F A N N U A L R E P O R T 2 0 10
O P E R AT I O N S Å F S H A R E S
ÅF SHARES
ÅF’s class B shares have been quoted on theStockholm Stock Exchange since January1986. Prior to this, ÅF traded as a coopera-tive association from 1895 until 1980, andas a joint-stock company from 1981. ÅF’s Bshares are traded in Stockholm on the Nas-daq OMX exchange’s Mid Cap list under the‘AF B’ ticker symbol. At the end of 2009 thecombined market capitalisation of the com-pany’s shares, including class A shares, wasSEK 4,743 million (2009: SEK 3,329 million).
Share movements and turnoverShareholders at the annual general meeting of the companyon 5 May 2010 voted to implement a 2:1 share split. As a resultof the split in June 2010, the total number of shares in the com-pany rose from 17,029,501 to 34,059,002. Following the splitthe quota value of the ÅF share is SEK 5. ÅF’s class B sharesincreased in value by 42.5 percent during 2010, trading at SEK139.25 at the end of the year: this compares with a value ofSEK 195.50 per share at the beginning of 2010, which corre-sponds to SEK 97.75 when adjusted to take account of the split.During the same period the Stockholm OMXSPI all-share indexrose by 23.1 percent. During the year a total of 15,325,671shares were traded for an aggregate value of SEK 2,197 million(2009: 12,418,178 shares worth SEK 1,770 million). Turnoverper trading day averaged SEK 8.7 million (SEK 7.1 million). Theshare was traded on 100 percent of trading days in both 2010and 2009.
Dividend policy and dividendThe board has adopted a dividend policy according to which thedividend corresponds to approximately 50 percent of the con-solidated profit after tax excluding capital gains. For the compa-ny’s operations during 2010 the board proposes a dividend ofSEK 4.00 per share (2009: SEK 4.00 per share).
Share buy-backsÅF holds a total of 284,000 of the company’s class B sharesrelating to the performance-related share programmes for 2008,2009 and 2010. No further share buy-backs were made in 2010.
Investor relationsÅF’s positive development is reflected in the interest shown inthe ÅF share. The company adopts a long-term approach to itscommunication with the capital market. In September the year’sCapital Market Day focused on the ÅF Vision for 2015 andincluded an in-depth look at the Infrastructure Division. Theevent, hosted by ÅF at its head office in Stockholm, attractedaround 35 investors, analysts and representatives of the media.The President/CEO, CFO and/or Director of Corporate Informa-
tion also took part in a number of “road shows” to Oslo, London,Frankfurt and New York in 2010, that led to approximately 25meetings with investors. In addition a further 40 or so individualinvestor meetings were held at the ÅF head office in Stockholmduring the year.
Analysts who regularly monitor the progress of ÅF:Johan Dahl, Erik Penser BankaktiebolagDaniel Djurberg, NordeaJan Ihrfelt, Swedbank MarketsDavid Jacobsson, Öhman FondkommissionFredrik Lithell, CarnegieStefan Wård, Handelsbanken Capital Markets

Å F A N N U A L R E P O R T 2 0 10
2,500
2,000
1,500
1,000
500
02006 2007 2008 2009 2010
B share (incl. dividend) SIX Return Index
2006 2007 2008 2009 2010
(in millions of SEK)
Annual turnover inÅF class B shares
Total yield − 5 years
20
60
80
100
120140160180
© NASDAQ OMX
40
Comparative figures adjusted for share splits in 2006 and 2010.
1,000
2,000
3,000
4,000
20
40
60
80
100
120
140
160
© NASDAQ OMX
OMX Stockholm_PINumber of shares traded in thousands B share
OMX Small Cap Stockholm Index
2006 2007 2008 2009 2010 2011
SEK
Comparative figures adjusted for share splits in 2006 and 2010.
ÅF share − 5-year trend ÅF has earned its“leader’s jersey”
David Jacobsson is an analystat Öhman Fondkommission. Hespecialises in companies in theengineering and IT sectors and hasbeen monitoring ÅF since 2007.
How do you view ÅF’s performanceover the last few years?“There are three key factors that havegiven ÅF a boost in recent years. Firstly,ÅF management has shown a great deal ofresolve when acquiring and disposing ofoperations. Secondly, sponsorship activi-ties have done a great job in strengtheningthe brand and helping to stimulate interestin engineering. And last, but not least,ÅF has done well to maintain its marginsthrough the economic downturn. That’s asign of inner strength and discipline in thegroup, and means that ÅF fully deservesthe leader’s jersey in the sector.”
ÅF’s new vision includes continuedstrong growth with good profitability.For example, sales of EUR 1 billionfor 2015. How do you rate ÅF’schances of hitting this target?“I think they’re very good. A strong brandand good profitability will help ÅF to groworganically through recruitment and tomake successful acquisitions.”
Who should consider having ÅFshares in their portfolio?“ÅF shares are suitable for long-terminvestors with faith in Europe’s ability todevelop infrastructure through investmentsin energy, transport and the application oftechnology in industry.”
Prize-winning IR workFor the second consecutive year Viktor Svensson, ÅF’sExecutive Vice President (Corporate Information), wasvoted Sweden’s top Investor Relations manager amongmedium-sized listed companies. The annual survey, con-ducted by Regi Research & Strategi and the Swedish dailynewspaper Dagens Industri, is based on interviews with alarge number of Swedish and European financial analysts.
O P E R A T I O N S Å F S H A R E S 4 7

4 8
Å F A N N U A L R E P O R T 2 0 10
Shareholders in Sweden and abroad31 December 2010 Percent of capital
Sweden 64.7
Other Nordic countries 7.7
Rest of Europe 15.8
USA 11.4
Others 0.4
The number of shareholders rose by 609 during 2010 to a total of 6,691.
Shareholder categories31 December 2010 Percent of capital
Foreign owners 35.3
Swedish owners 64.7
of which:
Institutions 88.0
Private individuals (incl. close companies) 12.0
Size of shareholding31 December 2010
Number Number of Percentageof shares shareholders of shares
<500 4,388 2.3
500–5,000 2,000 9.3
>5,000– 303 88.4
Total 6,691 100.0
Historical development of share capitalChange in number of shares Numbers of shares Share total Share capital
Year Quota value Change A shares B shares A shares B shares SEK ‘000
1984 50 ÅF issues convertible debentures to employees 727,460 727,460 36,373
1985 50 Redesignation –42,600 42,600 684,860 42,600 727,460 36,3731986 50 New issue and B share floated on A list 300,000 684,860 342,600 1,027,460 51,3731987 20 Bonus issue and split 684,860 1,370,060 1,369,720 1,712,660 3,082,380 61,6481990 20 Conversion of convertible debentures from 1984 269,420 480,580 1,639,140 2,193,240 3,832,380 76,6481994 20 Redesignation –810,475 810,475 828,665 3,003,715 3,832,380 76,6481996 20 Bonus issue 414,332 1,501,857 1,242,997 4,505,572 5,748,569 114,9711997 20 Redesignation –840,778 840,778 402,219 5,346,350 5,748,569 114,9712004 20 New issue 175,807 402,219 5,522,157 5,924,376 118,4882005 20 New issue 37,766 402,219 5,559,923 5,962,142 119,2432006 10 Split 2:1 402,219 5,559,923 804,438 11,119,846 11,924,284 119,2432006 10 New issue 1,121,527 804,438 12,241,373 13,045,811 130,4582006 10 New issue 3,232,164 804,438 15,473,537 16,277,975 162,7802007 10 New issue 90,951 804,438 15,564,488 16,368,926 163,6892007 10 Conversion of convertible debentures from 2005/2008 566,307 804,438 16,130,795 16,935,233 169,3522008 10 Conversion of convertible debentures from 2005/2008 94,268 804,438 16,225,063 17,029,501 170,2952010 5 Split 2:1 804,438 16,225,063 1,608,876 32,450,126 34,059,0021) 170,295
1) Of which 284,000 are held by the company.
The ten largest owners on 31 December 2010
Owner A shares B sharesHolding,
%Votes,
%
Ångpanneföreningen’s Foundation forResearch & Development 1,602,876 3,832,576 16.0 40.9
Swedbank Robur investment funds 0 2,817,619 8.3 5.8
Skandinaviska Enskilda Banken S.A., NQI 0 1,970,652 5.8 4.1
Nordea Investment Funds 0 1,687,873 5.0 3.5
Åfond Foundation (ÅF Group Trust) 0 1,335,317 3.9 2.8
Afa Försäkring 0 967,748 2.8 2.0
NTC Various Fiduciary Capacit 0 866,930 2.6 1.8
SSB CL Omnibus AC OMO9 (30 PCT) 0 858,626 2.5 1.8
Nordea Bank S.A. Nominee, account 0 709,867 2.1 1.5
Handelsbanken investment funds 0 656,683 1.9 1.4
Total, 10 largest owners 1,602,876 15,703,891 50.8 65.4
Total, other owners 6,000 16,746,235 49.2 34.6
Total 31 Dec 2010 1,608,876 32,450,126 100.0 100.0
Key ratios per share
SEK 2006 2007 2008 2009 20101)
Share price, 31 Dec. 73.00 84.50 59.50 97.75 139.25
Pre-tax profit 5.41 9.63 13.42 10.87 23.34
Profit after tax 3.69 6.58 9.54 7.93 21.02
Profit after tax, after dilution 3.58 6.56 9.54 7.91 20.95
Equity, excluding non-controllinginterests 33.56 39.41 49.73 53.68 69.47
Yield, percent 2.1 3.8 5.5 4.1 2.92)
Dividend 1.50 3.25 3.25 4.00 4.003)
Annual turnover rate, times 95.3 59.7 75.0 76.0 60.1
Market capitalisation (MSEK) 2,376.6 2,862.1 2,026.5 3,329.3 4,742.7
1) A 2:1 share split was implemented on 2 June 2010. Comparative figures adjusted.2) Based on proposed dividend3) Proposed dividend.
O P E R A T I O N S Å F S H A R E S

Å F A N N U A L R E P O R T 2 0 10
Ulrica Johansson is a processconsultant with the Industry Division inStockholm. She spends her free timedancing, singing in a choir, wine tasting,skiing, cycling and motorcycling.
“In my job I am constantly coming into contactwith new people, cultures and challenges. Thatstimulates me and helps me develop. I’m able toorganise my own workload and think for myself,but I can still turn to all the wise old owls I havearound me when I need to. I really appreciate thefact that no two days are the same.”

Å F A N N U A L R E P O R T 2 0 10
O P E R AT I O N S S U S TA I N A B I L I T Y I S P R O F I T A B I L I T Y
ÅF’s chairman Ulf Dinkelspiel and sustainability manager Alice Bah Kuhnke talk aboutsustainability, profitability and targets.
How do you view sustainability in the context of ÅF?Ulf Dinkelspiel: “Our approach to sustainability incorporates threedifferent perspectives – financial, environmental and social. Ourrange of services is designed for other companies which, like us,want to work as a sustainable, long-term operation.”
Alice Bah Kuhnke: “Although the word sustainability is a relativelynew and modern concept, the ideas it encompasses have alwaysplayed an important role at ÅF. These days we are clearer aboutthe way we communicate these ideas and we link our sustainabilitywork more directly to our business targets.”
Is sustainability better for the conscience than it is for thecash-box?Ulf Dinkelspiel: “Striving for profitability and wanting to make theworld a better place aren’t mutually exclusive. Quite the opposite,in fact. A sustainable company is a long-term venture, which laysthe foundations for good profitability over time.”
Alice Bah Kuhnke: “ÅF has clear profitability targets, and our sustain-ability work is an important tool for generating profit both now andin the future. Links with the business side of things are very strong.”
You launched what are perhaps the industry’s toughestinternal sustainability targets in 2010. Can you tell us moreabout this?Alice Bah Kuhnke: “We launched three main targets in March. First,by 2015, we aim to halve our climate impact from 2009 levels.“Secondly, we aim to offer an additional sustainable option in the
tenders that we submit to clients so that they have more solutionsfor their challenges. And thirdly, we want to be perceived as thevery best technical consulting company when it comes to providingsustainable solutions to the technical challenges our clients face.”
Ulf Dinkelspiel: “Our vision is to be the most profitable company inour sector. If, in addition, we are seen as the best in terms of sus-tainability, then we will really have succeeded. To this end, we’veworked hard to make our sustainability targets clear, quantifiableand communicable.”
What can clients expect from their ÅF consultant?Alice Bah Kuhnke: “Clients can expect ÅF to come up with the verybest technical solution. Our consultants already take sustainabilityinto account in their projects. But clients will notice that we aretaking things a step further when they are presented with evenmore green options and alternative investment calculations thatcreate profitability over the long term.”
Ulf Dinkelspiel: “Yes, we’re really serious about this. And we aim topractise what we preach. That will be evident from our documenta-tion and the way we achieve our targets.”
SUSTAINABILITY IS PROFITABILITY
5 0

5 1
Å F A N N U A L R E P O R T 2 0 10
O P E R AT I O N S S U S TA I N A B I L I T Y I S P R O F I T A B I L I T Y
SUSTAINABILITY REPORT
For ÅF, sustainability is a fundamentalconcern. ÅF seeks to improve its clients’operations and make them more efficientby offering solutions that are sustainable –environmentally, economically and socially– over the long term. But that’s not all. As acompany and an important corporate memberof society for 115 years, ÅF also understandsthat sustainability is the key to its own successand continuing development.
ÅF has set itself tough targets for its internal sustainability work.The frequently new and louder calls for sustainability from thecompany’s various stakeholders serve as milestones on the roadtowards these ambitious targets. In the long term, investments insustainability are investments in profitability, which is one reasonwhy work with sustainability plays such a key role at ÅF.In March 2010 ÅF launched “The ÅF Green Advisor Plan”, a
roadmap for the company’s sustainability work. Prior to this,a pre-study had been undertaken based on what was then thecurrent situation, and a reference group of employees from
ÅF Green Advisor ReportSince communication plays a crucial part in successfulsustainability work, 2010 saw the launch of the first twoissues of the “ÅF Green Advisor Report”, a journal thatdescribes some of the assignments undertaken by ÅFand the positive effects that these have on communi-ties around the world.
different positions in different parts of the company had formu-lated three sustainability goals aimed at paving the way towardsa more sustainable ÅF. Within five years from the 2009 baseline,ÅF will have halved its carbon footprint per co-worker, ÅF willalways give clients a “green” alternative in the form of a moresustainable solution to every assignment, and ÅF will be per-ceived as the technical consultant that, from a sustainabilityperspective, best addresses the challenges its clients face.The greatest positive impact that ÅF can have on society isthrough the assignments it performs for its clients.One important aspect of the work preceding “The ÅF Green
Advisor Plan” was to identify the interests of key stakeholders:owners, directors, employees, clients, the local community andglobal society. The indicators presented in this sustainabilityreport follow the materiality principle and have been chosen toreflect the main objectives of ÅF’s sustainability work for theperiod 2010–2015, the results of the pilot study, the dialogueconducted with stakeholders and the fact that the AF Group isan international company with subsidiaries in more than 20countries and a workforce of more than 100 people in seven ofthem (the Czech Republic, Denmark, Finland, Norway, Russia,Sweden and Switzerland). The figures reported by these coun-tries constitute the current basis for what has been identified asrelevant to the report.

Å F A N N U A L R E P O R T 2 0 10
Economic indicators of sustainabilityFor ÅF, the process of becoming a more sustainable company ispredicated on being a profitable company. One of the challengesof economic sustainability is to make sure that the company’sprofitability is the result of striking a long-term balance betweenindividual interests, the environment and healthy corporatefinances.
EC 1: Direct economic value generated and distributedThe table below shows the economic value generated by ÅF ina selected number of areas. The information has been compiledfrom the audited annual accounts for 2010, which include allsignificant financial reporting.
Direct economic value generated, (in millions of SEK) Stakeholder 2010
Revenues Clients 4,796
Operating costs, incl. depreciation/amortisation Suppliers –1,469
Employees’ wages and benefits Employees –2,529
Taxes State –81
Economic value retained Owners 717
Environmental performance indicatorsFor ÅF, the challenge that environmental sustainability posesis to make sure that the company contributes to the long-termconservation of the ecosystem’s production capacity and ofeco-diversity. This includes all of Earth’s biological environments,including the seas and lakes, as well as the forests and openlandscapes.
EN 16 and EN 17: Total direct and indirect greenhouse gasemissions by weight and other relevant indirect greenhousegas emissions by weight. See diagrams below.
EN 18: Initiatives to reduce GHG emissions and reductionsachievedIn 2010 ÅF launched a new vehicle policy for its organisation inSweden, building on a dialogue with representatives for ÅF’sstakeholders (owners, employees and organisations represent-ing the interests of the local and global community). The newpolicy formulated a clear ambition to achieve a significant reduc-tion in emissions of greenhouse gases by 2015; this was to be
0
1,000
2,000
4,000
5,000
Other relevant emissions – tonnes of CO2 equivalentsper country*
Denmark Finland Norway Russia Switzerland Sweden Czech Rep.
3,000
*Indirect energy use from ÅF travel/transport and consumption of materials.
0
1,000
2,000
4,000
5,000
Indirect emissions – tonnes of CO2 equivalentsper country*
Denmark Finland Norway Russia Switzerland Sweden Czech Rep.
3,000
*Indirect emissions from ÅF’s energy consumption. As ÅF neither owns nor controls any sources of greenhouse gas emissions, no direct GHG emissions are reported.
5 2 O P E R AT I O N S S U S TA I N A B I L I T Y I S P R O F I T A B I L I T Y

Å F A N N U A L R E P O R T 2 0 10
5 3O P E R AT I O N S S U S TA I N A B I L I T Y I S P R O F I T A B I L I T Y
achieved by progressively reducing emissions limits per gramfor vehicles leased through the company by ÅF employees whoneed use of a car to carry out their assigned duties.The table below shows the reduction in carbon dioxide per
gram that ÅF has achieved through the new policy’s limits. Theaverage emissions values of all vehicles purchased by ÅF in 2010have been compared with the values for vehicles purchased in2009.
EN 28: Non-compliance with environmental laws and regulationsNo fines or penalties have been reported during 2010 for non-compliance with environmental legislation and regulations.
Social performance indicatorsFor ÅF, the challenge that social sustainability poses is to makesure that the company contributes to every human being’s rightto a decent life and to the process of creating societies in whichfundamental human needs and rights are respected.
0
155
160
165
175
CO2 emissions per new vehicle, g/km
2009 2010
170
150
145
LA 1: Total workforceThe total number of employees in ÅF during 2010 was 4,475.The distribution of employees in the seven countries that formthe basis of this report is shown in the table below:
LA 2: Employee turnoverEmployee turnover (resignations and redundancies/lay-offs) inthe seven countries where ÅF has the largest numbers ofemployees was 10.5 percent in 2010. A total of 413 people (83women and 330 men) left the company. Employee turnover forthe different geographical regions is shown in the table below.
0
1,000
2,000
4,000
5,000
Total number of employees, 31 Dec 2010
Denmark Finland Norway Russia Switzer- Sweden Czech Other ÅF, totalland Rep. countries
3,000
0
4
6
10
14
Employee turnover by region, %
Denmark Finland Norway Russia Switzer- Sweden Czechland Rep.
8
12
2
Total, 7 countries with largest
ÅF workforce

5 4
Å F A N N U A L R E P O R T 2 0 10
O P E R AT I O N S S U S TA I N A B I L I T Y I S P R O F I T A B I L I T Y
LA 7: Work-related injuries and sick daysAbsence due to sickness is very low at ÅF. For 2010, it was2.1 percent. The number of work-related injuries and days lostthrough injury are shown in the tables below.
LA 10: Average hours of training per employee by employeecategoryCompetence development is crucial for the continued success ofÅF. Training for new employees, various types of managerial train-
ing courses and training in new legislation, regulations and direc-tives are conducted continuously. During the reporting period,each employee received an average of 37 hours’ training.
LA 13: Composition of board and senior managementÅF is a technical consulting company and therefore most of itsemployees are engineers.ÅF’s senior management team comprises 2 women and
8 men (20 percent female representation). The ÅF Board ofDirectors comprises 3 women and 5 men (38 percent femalerepresentation).
0
25
50
75
100
Days lost through injury
Denmark Finland Norway Russia Switzer- Sweden Czechland Rep.
Total, 7 countries with largest
ÅF workforce
0
10
20
40
50
Number of hours of training per employee
30
Denmark Finland Norway Russia Switzer- Sweden Czechland Rep.
Total, 7 countries with largest
ÅF workforce
0
4
16
Number of work-related injuries
Denmark Finland Norway Russia Switzer- Sweden Czechland Rep.
8
12
Total, 7 countries with largest
ÅF workforce

About the Sustainability Report
C C+ B B+ A A+
Obl
igat
ory
Volu
ntar
y
Rep
orte
xter
nally
assu
red
Rep
orte
xter
nally
assu
red
Rep
orte
xter
nally
assu
red
Self-assess-ment
Third-party decla-ration
Inspected by GRI
Application level
This is the first year that ÅF has chosen to report on its sustain-ability performance as an integral part of the Group’s annualreport with reference to the guidelines formulated by theGlobal Reporting Initiative (GRI). The report follows the criteriafor GRI application level C. ÅF’s ambition is to develop the Group’ssustainability work and to expand the scope of its reportingover the next few years. For further information about GRI and
a full explanation of the guidelines and indicators, please seewww.globalreporting.org.
ContactThe contact person for the ÅF Sustainability Report is AliceBah Kuhnke, Director of Sustainability and CSR at ÅF AB. [email protected] or tel. +46 10 505 00 00.
Å F A N N U A L R E P O R T 2 0 10
5 5O P E R AT I O N S S U S TA I N A B I L I T Y I S P R O F I T A B I L I T Y
Reporting with reference to GRI guidelines must, depending on the level chosen, be done in accordance with the criteria laid downfor application level C, B or A.

GRI index status page
1.0 Strategy and Analysis1.1 Statement form the CEO, strategy, vision and key issues ● 4
2.0 Organisational Profile2.1 Name of the organisation ● 66
2.2 Primary brands, products/services ● 2,11
2.3 Operational structure of the organisation ● 66
2.4 Location of organisation’s headquarters ● 66
2.5 Countries in which the organisation operates ● 133
2.6 Ownership structure and legal form ● 66
2.7 Markets served ● 11
2.8 Size of the company ● 70
2.9 Significant changes during the reporting period ● 93
2.10 Awards received during the reporting period — —
3.0 Report Parameters3.1 Reporting period ● 83
3.2 Date of most recent previous report ✱
3.3 Reporting cycle ● 55
3.4 Contact person for issues relating to theSustainability Report
● 55
3.5 Definition of content of report ● 51
3.6 Boundary of the report ● 51
3.7 Specific limitations on the scope or boundaryof the report
● 51
3.8 Principles for reporting that can affect comparabilitybetween organisations and/or reporting periods
● 51
3.10Explanation of the effect of any re-statements ofinformation provided in earlier reports, and thereasons for such re-statement
✱
3.11 Significant changes from previous reporting periodsrelating to the scope, boundary or measurement methodsapplied in the report
✱
3.12 GRI content index ● 56
✱ This is the company’s first report using GRI guidelines.
status page
4.0 Governance, Commitments and Engagement4.1 Governance structure for the company ● 123
4.2 Indication of whether the Chair of the highestgovernance body is also an executive officer,and if so, an explanation for this arrangement
● —
4.3 Structure of the board of governance and statementof its independence from executive management
● 124
4.4 Mechanisms for communication between board andmanagement
● 124
4.14 List of stakeholder groups engaged by the company ● 51
4.15 Basis for identification of stakeholders with whomto engage
● 51
Economic SustainabilityEC1 Direct economic value generated and distributed ● 52
Environmental SustainabilityEN16 Total direct and indirect greenhouse gas emissions ● 52
EN17 Other relevant indirect greenhouse gas emissions ● 52
EN18 Initiatives to reduce greenhouse gas emissions ● 52
EN28 Fines and other sanctions for non-compliance withenvironmental laws and regulations
● 53
Social SustainabilityLA1 Total workforce ● 53
LA2 Employee turnover ● 53
LA7 Work-related injuries and days lost to sickness ● 54
LA10 Hours of training per employee ● 54
LA13 Composition of board and executive management ● 54
Below is a list of all the disclosures that are mandatory for levelC reports and of the relevant performance indicators that ÅFhas chosen to report. The listing also specifies whether the
report is full ● or partial ◗ with reference to the GRI guidelinesfor each individual indicator, and shows where to find this infor-mation in the annual report
5 6 O P E R AT I O N S S U S TA I N A B I L I T Y I S P R O F I T A B I L I T Y
Å F A N N U A L R E P O R T 2 0 10

5 7
Å F A N N U A L R E P O R T 2 0 10
Jorma Vihavainen is a projectmanager with the Energy Division in Vantaa,Finland. He devotes much of his spare timeto his two school-age children and theirinterests. Judo is also an important part ofhis life. He is now a judo coach and referee.
“Getting the right work/life balance is importantto me. The ÅF Group gives me the opportunity toget involved in lots of interesting and challengingprojects. Clients appreciate and respect ouradvice and recommendations, and that is aconstant source of motivation. I really admirethe energy and willpower our team shows whenit comes to creating professional and innovativesolutions.”

5 8
Å F A N N U A L R E P O R T 2 0 10
O P E R AT I O N S R I S K M A N A G E M E N T A N D S E N S I T I V I T Y A N A LY S I S
Risk is inherent in all commercial activity.Risks that are managed well can open upbusiness opportunities and increase thevalue of a company, while those that aremanaged badly can lead to losses thatundermine the stability of a business. Inrecent years ÅF has worked on making riskmanagement an integral part both of theGroup’s strategic planning processes andits operational activities.
Risk management at ÅF seeks not only to minimise risks butalso to make sure that the company makes the best possibleuse of the opportunities that present themselves. In 2010 ÅFstarted to work with Enterprise Risk Management (ERM). Thisintegrates risk management into day-to-day activities by linkingit to the strategic and operational objectives that the companyhas set up.Work with risks can be divided into requirements and expecta-
tions, identifying and assessing risks, managing and monitoringthem and reporting back to executive management, committeesand the board of directors.What follows is a description of the risks with which ÅF has to
deal.
Operational risksBusiness-cycle dependenceThe Nordic region is ÅF’s largest market, where clients operatein a number of industries, including the energy sector, the publicsector, industry, property and construction. This means that ÅF
is dependent on reasonably stable trends in these areas toachieve its targets. The general economic situation and propen-sity to invest are also highly significant, but ÅF’s diversificationover a number of markets and in areas that experience differentbusiness cycles reduces any risk. To reduce dependence on theNordic market and take advantage of opportunities for growth,ÅF is expanding outside the Nordic region. ÅF’s strategy is togrow in the segments in which the Group is already a Nordicmarket leader. Increasing the geographical spread will help tooffset the effect of local business cycles.
Capacity utilisation and hourly ratesA consulting firm’s capacity utilisation rate is a key factor behindits ability to generate a profit. Every percentage point differencein the invoiced-time ratio equates to a rise or fall of around SEK47 million in ÅF’s annual earnings. The hourly rate itself is also,of course, another essential component for the profitability of aconsulting company. Increasing the hourly rate by SEK 10 would,if all other factors remained unchanged, improve profits for ÅFby some SEK 48 million a year. Various approaches are adoptedto reduce sensitivity, including employing sub-consultants,increasing the variable component in salaries, broadeningexpertise and markets, and packaging services to increasecompetitiveness and reduce client sensitivity to pricing. ÅF isalso increasingly taking over the management of large-scaleprojects for its clients and liaising directly with subcontractorswith regard to the detailed project planning services that arenecessary during the various phases of the project.
Fixed-price contractsFixed-price contracts for carefully specified consulting servicescan be beneficial to both parties. Often consultants are able tomake use of past experience to serve their clients more efficiently
RISK MANAGEMENT AND SENSITIVITY ANALYSIS

5 9
Å F A N N U A L R E P O R T 2 0 10
O P E R AT I O N S R I S K M A N A G E M E N T A N D S E N S I T I V I T Y A N A LY S I S
and are well placed to make an accurate assessment of thetime and resources required. A fixed-price contract may, how-ever, involve an increased risk for client and consultant alike, ifthe time required to complete the assignment is not correctlyestimated. In the event that the fixed price is exceeded, ÅF suf-fers a write-down in its fee. Training and tuition in factors such asproject management and the formulation of appropriate termsand conditions are the key to reducing the risks associated withthis kind of agreement. Continuous monitoring and evaluation ofthe amount of work remaining in fixed-price contracts alsoreduce this risk. Major fixed-price assignments may be led onlyby assignment managers who have received the requisite training.
Acquisition risksOver the past decade or so the technical consulting sector hasundergone a process of consolidation and this process contin-ues unabated. Failure to follow this industry trend could result inthe gradual erosion of competitive strength. While ÅF remainscommitted to taking an active part in this process, it also recog-nises that growth and the takeover of other consulting compa-nies is not risk-free.To minimise the risks, ÅF has adopted a systematic approach
to acquisitions with strict criteria for obligatory documentationand thorough reviews. The ÅF board conducts an annual evalua-tion of any companies that have been taken over, and an Acquisi-tions Unit has been set up to ensure a proactive and systematicapproach to corporate acquisitions and expansion into new geo-graphical markets.
EmployeesTo achieve the targets that have been set, it is crucial thatemployees in a consulting company are motivated and possessthe relevant skills and knowledge. There is always a risk that
highly competent employees may join competitors or clients,or set up their own businesses. The risk is exacerbated if thesepeople are able to use their inside knowledge of the company tocherry-pick the best of their skilled colleagues. A situation likethis could make it difficult for ÅF to deliver the services it is con-tracted to supply and lead to extra costs for the company. Inorder to attract and retain co-workers of the right calibre, ÅFinvests (for example via the ÅF Academy) in continuous profes-sional development, skills development and management train-ing. It is highly unusual for large numbers of employees in keypositions to leave the ÅF Group, and annual co-worker surveysshow that employees are largely happy in their work. ÅF is ableto offer the opportunity to work on large and highly sophisticatedinternational projects, which is attractive to potential employees.Competition for qualified members of staff at all levels is increas-ing, and with it the pressure on ÅF to present itself as an attrac-tive employer. For this reason ÅF invests large sums each year inrecruitment and induction activities.
CompetitorsCompetition in the technical consulting industry comes from anumber of major international companies and various small localcompetitors in each individual market. Competition is fierce, bothfor projects and for the best personnel, and consulting compa-nies in countries with significantly lower cost structures are alsoattracting certain clients. However, thanks to ÅF’s breadth anddepth of skills, its competitive appeal is steadily increasing.
Business support systemÅF has its own business support system, ONE, for managing,following up, controlling and documenting both fixed-price andopen-account assignments. ONE has been certified in accord-ance with ISO 9001: 2008 (quality) and ISO 14001:2004 (envi-

6 0
Å F A N N U A L R E P O R T 2 0 10
O P E R AT I O N S R I S K M A N A G E M E N T A N D S E N S I T I V I T Y A N A LY S I S
ronment). ONE safeguards cost-control for both fixed-priceassignments and those invoiced by the hour.
Environmental risksUnder the provisions of current environmental legislation theÅF Group does not require any environmental permits nor doesit have any obligations to report on its activities. The business’senvironmental risks are restricted to the possible consequencesof contravening existing environmental legislation. However,sophisticated follow-up procedures have been built into ÅF’sbusiness support system to ensure that all units within the Groupcomply with environmental law. ÅF is not involved in any environ-mental disputes or incidents.
Legal risksÅF’s business activities do involve a risk of dispute. Disputesmay arise if ÅF disagrees with a client about the conditions thatapply to a certain assignment. Disputes can also arise in con-junction with takeovers. Drawing up contracts for all assign-ments with terms appropriate to the project in hand reduces therisk. When taking over another company’s business operations,ÅF has a tried-and-tested body of rules and regulations that isused to guide the process. For more complex transactions,legal advice is always sought.
InsuranceIn order to reduce risk in its business activities, ÅF has a highlevel of insurance protection that covers ÅF for the liabilityinvolved in any given project. ÅF is covered for loss of contribu-tion and for additional costs in the event that its premises aredamaged or its equipment is stolen.
IT risksThe majority of ÅF’s IT support has been outsourced to highlyreputable suppliers. Although agreement has been reached withthese service providers on response and action times, therecan be no cast-iron guarantees that unplanned interruptions willnot lead to loss of income at one or more of the Group’s offices.
Financial risksFinance policyThrough its operations the ÅF Group is exposed to various typesof financial risk in the form of fluctuations in the company’s earn-ings and cash flow as a consequence of changes in exchangerates, interest levels and credit risks. Responsibility for the Group’sfinancial transactions and risks is handled centrally by the parentcompany’s accounting and reporting department in accordancewith policies laid down by the Board of Directors. The overallgoal is to provide cost-effective financing and to minimise thenegative effects of market fluctuations on the Group’s earnings.Seen as a whole, the financial risks within the Group are rela-tively low.
Currency riskCurrency risk comprises the risk that fluctuations in exchangerates will have a negative impact on the consolidated incomestatement, balance sheet and cash flow. Currency risk can besplit into transaction exposure and translation exposure. Trans-action exposure is the net of operating and financial inflows andoutflows in foreign currencies. Currency risks related to changesin expected and contracted payment flows are relatively limitedfor ÅF, as the majority of sales and expenses are invoiced inlocal currencies. In accordance with current policy, payment

6 1
Å F A N N U A L R E P O R T 2 0 10
flows in foreign currencies are hedged only when it is possibleto determine the amount and time of the transaction with agreat degree of certainty. In the event of an incoming paymentin foreign currency that involves a net exposure in excess of100,000 euros the risk is hedged through derivatives. The riskis also hedged through derivatives in the event of an outgoingpayment in foreign currency that involves a net exposure inexcess of 50,000 euros. Translation exposure comprises foreignsubsidiaries’ net assets and profits/losses in foreign currency.In line with established policy ÅF does not hedge translationexposure.
Interest rate riskInterest rate risk comprises the risk that changes in interestrates will affect the Group’s net interest income/expense and/orcash flow. The Group’s financing expense is affected by changesin market interest rates. For the purpose of reducing the effectof changes in interest rates on the Group’s performance, ÅF’spolicy is that the average fixed-rate period on loans taken outmust be between three and twelve months. During 2010 thefixed-rate period for the company’s borrowing averaged onemonth. With current borrowing requirements, the effect on theGroup’s profit/loss of a change of 1 percent in interest rateswould be in the region of SEK 3 million. ÅF’s policy is for cashand cash equivalents to be deposited in bank accounts withlocal banks.
Credit risksFinancial credit riskÅF’s financial transactions give rise to credit risks in relation tofinancial counterparties. The risk of a counterparty being unableto fulfil its obligations is reduced through the careful selection ofcreditworthy counterparties and the capping of involvementwith each counterparty.
Bad debt riskThis form of credit risk relates to the outstanding accountsreceivable at any given time: in other words, the credit extendedto ÅF’s clients. This risk is limited through ÅF’s highly effectivecredit policy, which specifies how the company’s credit manage-ment procedures are to be implemented to avoid any uncon-trolled assumption of risks and prevent any unnecessary baddebt losses. This includes, for example, rules on advance pay-ments and advice on how to avoid clients who are likely to havepayment problems. Historically, the Group has reported onlyvery limited credit losses. ÅF’s ten largest clients, who accountfor a total of 23 percent of the Group’s sales, are all large listedcompanies or publicly owned institutions. There are, therefore,no exceptional credit risks in relation to any one major client.
O P E R A T I O N S R I S K M A N A G E M E N T A N D S E N S I T I V I T Y A N A LY S I S
Sensitivity analysisFactor
Change(all other factors
unchanged)Effect on earnings
SEK/share (after tax)
Capacity utilisation ±1 % ±1.04
Hourly rate ±1 % ±0.75
Payroll costs ±1 % ±0.58
Overheads ±1 % ±0.19
Number of co-workers (FTEs) ±1 % ±0.06

6 2
My Andersson is Eco Managerwith the Technology Division in Stockholm.Outside work, she enjoys travelling andspending time with friends, but more oftenthan not you will find her in the stable orout riding.
“I love challenges! I want to have fun at workand feel that it is fulfilling and has a purpose.The best thing about ÅF is that I get to try outdifferent things. I work with companies thatdevelop completely different types of productand help them to reduce their environmentalimpact. It’s great to be a part of somethingbigger.”

6 3
Å F A N N U A L R E P O R T 2 0 10
O P E R AT I O N S D E F I N I T I O N S
Operating marginOperating profit/loss in relation to operating income.
Profit marginProfit/loss after net financial items, in relation to operatingincome.
Equity ratioEquity including non-controlling interests in relation to thebalance sheet total.
Current ratioCurrent assets in relation to current liabilities and currentprovisions.
Return on equityProfit/loss after tax in relation to average shareholders’ equityincluding non-controlling interests.
Return on total capitalProfit/loss after net financial items and restoration of interestexpense, in relation to the average balance sheet total.
Return on capital employedProfit/loss after net financial items and restoration of interestexpense in relation to the average balance sheet total, minusnon-interest-bearing liabilities and net deferred tax.
Interest coverProfit/loss after net financial items and restoration of interestexpenses, in relation to interest expense.
Earnings per shareEarnings attributable to the parent’s shareholders relativeto the average number of shares.
Dividend yieldDividend per share in relation to the year-end share price.
Equity per shareEquity attributable to the parent’s shareholders relativeto the total number of shares.
Cash flow per shareCash flow from operating activities in relation to the averagenumber of shares.
Invoiced-time ratioThe time invoiced to clients as a percentage of the total timeall employees are present at work.
Full-time equivalents (FTEs)Number of employees during the year converted to the equiva-lent number of year-long, full-time positions. The actual numberof employees is higher, owing to part-time employment and thefact that some employees work only part of the year.
DEFINITIONS

6 4
Å F A N N U A L R E P O R T 2 0 10
O P E R AT I O N S F I V E - Y E A R F I N A N C I A L S U M M A R Y , S E K
Values in millions of SEK unless otherwise stated 2010 2009 2008 2007 2006
Operating income and profitOperating income 4,796 4,692 4,570 3,862 3,134Operating profit 806 388 479 332 168Operating profit excluding capital gain 317 374 478 331 148Profit after net financial items 798 377 461 322 158Profit for the year 717 275 328 220 108
Capital structureNon-current assets 2,016 1,733 1,728 1,320 997Current assets 1,934 1,850 1,882 1,476 1,303Equity including non-controlling interests 2,361 1,827 1,699 1,339 1,091Non-current provisions 177 120 190 90 97Non-current liabilities, excluding provisions 8 41 183 186 118Current provisions 14 31 8 10 1Current liabilities, excluding provisions 1,392 1,564 1,530 1,171 993Balance sheet total 3,950 3,583 3,610 2,796 2,300Equity (average) 2,205 1,740 1,482 1,200 820Total capital (average) 3,678 3,518 3,090 2,487 1,860Capital employed (average) 2,508 2,192 1,921 1,579 1,161
Key figuresOperating margin, percent 16.8 8.3 10.5 8.6 5.4Operating margin excluding capital gain, percent 7.3 8.1 10.5 8.6 4.8Profit margin, percent 16.6 8.0 10.1 8.3 5.0Equity ratio, percent 59.8 51.0 47.1 47.9 47.5Current ratio, times 1.4 1.2 1.2 1.2 1.3Return on equity, percent 32.5 15.8 22.1 18.3 13.1Return on total capital, percent 22.0 11.1 15.6 13.8 9.7Return on capital employed, percent 32.2 17.8 25.2 21.8 15.6Interest cover, times 31.1 30.0 21.5 19.9 9.3
ÅF share 1)
Earnings per share, SEK 21.02 7.93 9.54 6.58 3.69Earnings per share after dilution, SEK 20.95 7.91 9.54 6.56 3.58Yield, percent 2.9 4.1 5.5 3.8 2.1Equity per share, SEK 69.47 53.68 49.73 39.41 33.56Equity per share after dilution, SEK 69.25 53.53 49.65 39.40 33.86Cash flow from operating activities per share, SEK 6.0 9.02 9.46 9.47 4.16Cash flow from operating activities per share after dilution, SEK 5.9 9.00 9.44 9.42 4.02Buying rate 31 December, SEK 139.25 97.75 59.50 84.50 73.00Market capitalisation 4,743 3,329 2,027 2,862 2,377Ordinary dividend per share, SEK 4.002) 4.00 3.25 3.25 1.50
OtherInvoiced-time ratio, percent 71.9 71.3 74.1 75.1 72.9Investment in equipment, excluding leasing 3) 40 40 96 54 52Investment in property 3) 5 3 38 102 —Investment in intangible assets 3) 434 68 196 253 738FTEs excluding associates 3,966 4,182 3,948 3,623 3,167
1) A 2:1 share split was carried out on 2 June 2010. The comparative figures have been adjusted.2) Proposed dividend.3) Including acquired businesses.
FIVE-YEAR FINANCIAL SUMMARY, SEK

6 5
Å F A N N U A L R E P O R T 2 0 10
O P E R AT I O N S F I V E - Y E A R F I N A N C I A L S U M M A R Y , E U R
Values in millions of EUR unless otherwise stated 2010 2009 2008 2007 2006
Exchange rate at the end of the reporting period 9.00 10.35 10.94 9.47 9.05
Average exchange rate 9.54 10.62 9.61 9.25 9.25
Operating income and profitOperating income 503 442 476 418 339Operating profit 84 37 50 36 18Operating profit excluding capital gain 33 35 50 36 16Profit after net financial items 84 35 48 35 17Profit for the year 75 26 34 24 12
Capital structureNon-current assets 224 167 158 139 110Current assets 215 179 172 156 144Equity including non-controlling interests 262 176 155 141 120Non-current provisions 20 12 17 9 11Non-current liabilities, excluding provisions 1 4 17 20 13Current provisions 2 3 1 1 0Current liabilities, excluding provisions 155 151 140 124 110Balance sheet total 439 346 330 295 254Equity (average) 231 164 154 130 89Total capital (average) 385 331 322 269 201Capital employed (average) 263 206 200 171 125
Key figuresOperating margin, percent 16.8 8.3 10.5 8.6 5.4Operating margin excluding capital gain, percent 7.3 8.1 10.5 8.6 4.8Profit margin, percent 16.6 8.0 10.1 8.3 5.0Equity ratio, percent 59.8 51.0 47.1 47.9 47.5Current ratio, times 1.4 1.2 1.2 1.2 1.3Return on equity, percent 32.5 15.8 22.1 18.3 13.1Return on total capital, percent 22.0 11.1 15.6 13.8 9.7Return on capital employed, percent 32.2 17.8 25.2 21.8 15.6Interest cover, times 31.1 30.0 21.5 19.9 9.3
ÅF share 1)
Earnings per share, EUR 2.20 0.75 1.00 0.71 0.40Earnings per share after dilution, EUR 2.20 0.75 1.00 0.71 0.39Yield, percent 2.9 4.1 5.5 3.8 2.1Equity per share, EUR 7.72 5.19 4.55 4.16 3.71Equity per share after dilution, EUR 7.69 5.15 4.54 4.16 3.74Cash flow from operating activities per share, EUR 0.62 0.85 0.99 1.03 0.45Cash flow from operating activities per share after dilution, EUR 0.62 0.85 0.98 1.02 0.44Buying rate 31 December, EUR 15.47 9.44 5.44 8.92 8.07Market capitalisation 527 322 185 302 263Ordinary dividend per share, EUR 0.442) 0.39 0.30 0.35 0.17
OtherInvoiced-time ratio, percent 71.9 71.3 74.1 75.1 72.9Investment in equipment, excluding leasing 3) 4 4 10 6 6Investment in property 3) 1 0 4 11 —Investment in intangible assets 3) 45 6 20 27 80FTEs excluding associates 3,966 4,182 3,948 3,623 3,167
1) A 2:1 share split was carried out on 2 June 2010. The comparative figures have been adjusted.2) Proposed dividend.3) Including acquired businesses.
FIVE-YEAR FINANCIAL SUMMARY, EUR

6 6
Å F A N N U A L R E P O R T 2 0 10
A N N U A L R E P O R T A D M I N I S T R A T I O N R E P O R T
ÅF AB (publ)Corporate identity number 556120-6474
The Board of Directors and the President of ÅF AB (publ) herewith submit their annualreport for the year 2010. ÅF AB, which has its registered office in Stockholm, is the par-ent company of the ÅF Group.
Group and Parent companyÅF is a leading company in the technical consulting industry, with expertise founded onmore than a century of experience. ÅF offers highly qualified services and solutions infields of expertise that include industrial processes, infrastructure projects and thedevelopment of products and IT systems. The Group’s operational base is in the Nordicregion, but its business and clients are found all over the world.
ÅF bases its consulting business on the development of systems and products, andon investments, maintenance measures and ongoing modification work relating toindustrial plant, processes, machinery and buildings, as well as infrastructure projects.The majority of projects originate in Swedish and international industrial companies,service companies, government authorities and the real estate sector.
Sales and earningsNet sales for the year fell by 7 percent. Organic growth was negative at –2 percent. Thestructural effect was also negative, –4 percent, chiefly as a consequence of the sale ofthe subsidiary, ÅF-Kontroll. The strengthening Swedish krona resulted in a negativetranslation difference of 1 percent. Operating profit fell by 18 percent, first and fore-most as a consequence of the sale of ÅF-Kontroll and of losses incurred by ÅF’s Nor-wegian business operations.• Net sales totalled SEK 4,334 million (2009: SEK 4,678 million).• Operating profit excluding capital gains was SEK 317 million (SEK 380 million).• The operating margin excluding capital gains was 7.3 percent (8.1 percent).• The capacity utilisation rate was 71.9 percent (71.3 percent).• Profit after tax was SEK 717 million (SEK 275 million).• Earnings per share before dilution were SEK 21.02 (SEK 7.93).
Organisational changesOn 1 January 2010 the Swedish process and environmental operations were transferredfrom the Energy Division to the Industry Division. Parallel with this structural change,operations in Finland, Estonia and the Czech Republic were transferred from the Indus-try Division to the Energy Division.
On 1 October 2010 the Infrastructure Division was split into two separate divisions,namely Infrastructure and Technology. The purpose was to clearly identify two areas oflong-term commercial opportunity and to increase the focus on profitability and growthin the years ahead. At the same time, ÅF’s Engineering Division changed its name to theIndustry Division. As a consequence, from 1 October 2010, ÅF comprises four divisions:Energy, Industry, Infrastructure and Technology.
Divisional PerformanceEnergyOperating income Q1–Q4: SEK 1,012 million (2009: SEK 1,192 million)Operating margin Q1–Q4: 8.2 % (10.6 %)The Energy Division is a leading consultant in the energy sector with ongoing assign-ments in some 40 countries worldwide.
The market for energy consulting services remained good throughout 2010, with theexception of the nuclear power sector where there were postponements to a number ofprojects. Invoiced sales for the Energy Division dipped, partly as a result of shrinking
sales in Russia due to reductions in material deliveries to clients, and the negative effectof changes in exchange rates. This, together with increased pressure on prices in Finland,dragged down profits.
Orders exceeded expectations as the year drew to a close, boosted by a number ofmajor contracts linked to new hydropower plants in Switzerland, India and Germany. Themarket for hydropower is expanding across a broad front. New orders were also signedon the back of strong demand for project competence and expertise relating to CHPplants in Europe that are fuelled by biomass and waste.
The highest levels of profitability were reported by our operations in the CzechRepublic, where we now have more than 100 consultants.
IndustryOperating income Q1–Q4: SEK 1,340 million (2009: SEK 1,387 million)Operating margin Q1–Q4: 9.0 % (9.4 %)The Industry Division is the leading industrial consultant in Northern Europe.
The market for the services of the Industry Division showed a continued improvementas the year progressed, and the division benefited from the strength of the Swedish eco-nomy and increased production volumes in industry. Demand continued to be strongestfrom the mining, steel and energy sectors, but brisker demand from the food process-ing and pharmaceutical industries brought further good news for the division’s opera-tions in Denmark and the south of Sweden.
ÅF signed a four-year strategic contract as an ‘A’ supplier to Vattenfall that will runfrom 2011 to the end of 2014. The agreement relates to the provision of technical con-sulting services in everything from project management, analysis and investigations totechnical calculations, mechanical construction and design in all areas of technology.As a result of the agreement, business with Vattenfall is expected to expand signifi-cantly. The Industry Division is planning to step up its recruitment of personnel.
Towards the end of the year the Industry Division was reinforced with an additional75 or so consultants following the acquisition of Energo, a specialist in windpower, damsafety, hydropower, electrical networks and power supply. This line of business makesthe Industry Division one of Sweden’s leading suppliers of all-round consulting servicesin hydropower and electrical networks.
InfrastructureOperating income Q1–Q4: SEK 1,233 million (2009: SEK 1,168 million)Operating margin Q1–Q4: 5.6 % (8.7 %)The Infrastructure Division holds a leading position in consulting services for infrastruc-ture development in Scandinavia.
The market for infrastructure consulting services remained good, underpinned by thesteady increase in the number of publicly funded projects for major investments in newroads and railways.
Profitability for the year as a whole was, however, unsatisfactory. Earnings werepulled down by further delays to ÅF’s extensive consulting assignments linked to theStockholm Bypass Project pending the result of an appeal, and by continued losses inthe division’s Norwegian operations. A new management team has been appointed inNorway and, towards the end of the year, far-reaching cost-cutting programmes wereimplemented and sales and marketing activities were ramped up. The aim is for ÅFNorway to return to profitability with effect from the first quarter of 2011.
The strongest performance came from the division’s property consulting operations,the Installations business area, and its Swedish operations, which now comprise a work-force of almost 700 consultants following the acquisition of Energo. The operating mar-gin for Installations approached 15 percent, with growth fuelled by strong demand forconsulting services to make properties more energy efficient.
ADMINISTRATION REPORT

6 7
Å F A N N U A L R E P O R T 2 0 10
A N N U A L R E P O R T A D M I N I S T R A T I O N R E P O R T
TechnologyOperating income Q1–Q4: SEK 719 million (2009: SEK 636 million)Operating margin Q1–Q4: 9.6 % (5.3 %)The Technology Division holds a leading position in Sweden in the fields of Communicationand Software Development for technical applications.
The Technology Division was created on 1 October 2010 from part of what was previ-ously the Infrastructure Division. It comprises approximately 700 employees whotogether constitute ÅF’s core competence in the fields of telecommunications,advanced product development, defence technology and IT. The division’s consultantswork primarily with software, electronics, mechanical engineering, project managementand systems integration. Major clients are found in the telecom and defence industries.
The market for the Technology Division was good during the year, particularly in thefourth quarter and the division’s capacity utilisation rate rose. There were signs of in-creased needs for investment and consulting services among a large number of clients,particularly in the metropolitan regions of Stockholm, Gothenburg and Copenhagen–Malmö. Several new framework agreements were signed, for example with Kammar-kollegiet (Sweden’s Legal, Financial and Administrative Services Agency with respon-sibility for more than 20 authorities), Electrolux, FMV (the Swedish Defence MaterielAdministration), GE Healthcare, Scania and Visma.
Over the year as a whole organic growth for the division rose to more than 10 percent.
Acquisitions, disposals and alliancesThe past twelve months have seen some major structural changes in the Group in linewith our strategy to become number one or two in the markets where we are active.
In December 2010 ÅF acquired the international energy and management consul-tancy Mercados Energy Markets International. The vendor was the company’s seniormanagement. Headquartered in Madrid, Spain, the company has a total of more than 60employees. In 2010 Mercados sales totalled EUR 9 million and the operating margin wasapproximately 7 percent. ÅF paid EUR 4.1 million for 100 percent of the shares in thecompany. Agreement has been reached on an additional consideration to be based onearnings over the next three years. ÅF estimates that this additional consideration willamount to EUR 3.5 million.
In November ÅF acquired the technical consulting company Energo AB from Bure ABand Bure’s corporate management. Energo is a well-established consulting companywith extensive expertise and experience in the fields of energy and electrical power sys-tems, technical installations in buildings, information technology and telecommunica-tions. The company has almost 300 employees, most of them based in Stockholm,Malmö and Helsingborg. Energo’s sales for 2010 totalled just over SEK 300 million andthe company had an operating margin of 8.5 percent. Based on an enterprise value ofSEK 300 million, ÅF paid SEK 260 million for the shares.
In October ÅF acquired the technical consulting company Platom AB with 10 employ-ees in Oskarshamn and Västerås in Sweden. Platom is a consulting company that offersqualified process and analysis services to the nuclear power industry.
In September ÅF sold its 50 percent stake in ÅF-TÜV Nord, which provides servicesrelating to third-party inspections for the nuclear power industry. The purchaser was theother joint owner, the German technical inspection company, TÜV Nord. The purchasesum agreed was SEK 33 million, which resulted in a capital gain for ÅF equivalent toSEK 31 million.
In September ÅF acquired the consulting operations of the City of Gothenburg’s high-ways and traffic management department, Göteborgs Gatuaktiebolag, with approximately100 employees engaged in consulting activities relating to investigations, analyses andthe project engineering and project management of existing and new infrastructure invest-ments in the Gothenburg region. The purchase price was SEK 26 million.
In July ÅF acquired the technical consulting company VPC Mining i Skellefteå with10 employees, from the Swedish state-owned energy company, Vattenfall. VPC Miningis a well-established consulting company, offering high-level engineering services to themining industry.
In May ÅF acquired the Czech technical consulting company Meacont. The company,which is headquartered in Prague, has 90 employees and clients who are active in theenergy sector, including the nuclear power industry. The purchase sum was SEK 50 mil-lion, plus an additional consideration of an estimated SEK 28 million, based on futureearnings. Meacont sold services for approximately SEK 80 million in 2009 and reportedan operating margin of 8 percent for the year.
In March ÅF signed an agreement to transfer 100 percent of the shares in the ÅFInspection Division, ÅF-Kontroll and its subsidiaries, to DEKRA AG in Germany. Basedon an enterprise value of SEK 610 million, DEKRA paid SEK 550 million for the shares inÅF-Kontroll. The transaction led to a capital gain of SEK 458 million in the ÅF accounts.The Inspection Division was deconsolidated from ÅF with effect from 25 March 2010.
GoodwillWhen consulting businesses are acquired, the payment does not relate only to the carryingamount of tangible assets in the company, but also includes a premium to reflect, for exam-ple, the benefit of acquiring relations with new clients and with expert, well-qualified andexperienced consultants. This premium in the form of human capital, which is not recordedas an asset in the acquired company, is recognised primarily as goodwill in the ÅF Group.
On the acquisition of Energo, the goodwill item was SEK 238 million. Other acquisi-tions gave rise to goodwill of SEK 159 million, while the sale of ÅF-Kontroll reduced thetotal amount of goodwill in the ÅF Group by SEK 68 million. In total, ÅF’s goodwill increasedduring the year by SEK 288 million to SEK 1,626 million, with changes in exchange ratescorresponding to SEK –32 million. For further information about goodwill and other intan-gible assets, please see Note 13.
Research and developmentThe divisions carry out research and development work in conjunction with universitiesand trade organisations, but also internationally with EU funding. In-house method devel-opment also forms part of this R&D work. For the Group as a whole, R&D costs duringthe year totalled SEK 21 million (2009: SEK 41 million). This item consists mostly ofcosts for time spent on R&D projects by ÅF’s own salaried employees and has fallen fol-lowing the sale of ÅF-Kontroll.
Cash flow and financial statusCash flow for January–December 2010 was SEK –10 million (2009: SEK 66 million). Cashflow for the year was affected by costs for acquisitions and additional considerationstotalling SEK –514 million (SEK –40 million), by income amounting to SEK 625 million(SEK 20 million) from the sale of subsidiaries, and by dividends to shareholders of SEK–139 million (SEK –112 million). Over the course of the year amortisation of loans tocredit institutions has totalled SEK 150 million net (SEK –33 million).
The Group’s liquid assets totalled SEK 328 million (SEK 345 million).The Group’s net cash balance at the end of 2010 totalled SEK 35 million
(SEK –44 million).Equity per share was SEK 69.47 and the equity/assets ratio was 59.8 percent.
At the beginning of 2010 equity per share was SEK 53.68 and the equity/assets ratiowas 51.0 percent.
InvestmentNot taking into account acquisitions, gross investment in tangible and intangible assetsfor 2010 totalled SEK 34 million (2009: SEK 58 million).
Parent companyParent company sales for the year totalled SEK 330 million (2009: SEK 294 million) andrelate chiefly to services and rent for premises within the Group. Profit after net financialitems was SEK 760 million (SEK –4 million). The parent made a profit of SEK 501 millionon the sales of ÅF-Kontroll and ÅF-TÜV Nord. Other income from participations in Groupcompanies totalled SEK 281 million (SEK 4 million). Cash and cash equivalents on 31December 2010 totalled SEK 54 million (SEK 4 million), and gross investment in machin-ery and equipment for the year amounted to SEK 7 million (SEK 10 million).

6 8
Å F A N N U A L R E P O R T 2 0 10
A N N U A L R E P O R T A D M I N I S T R A T I O N R E P O R T
Environmental workTogether with its stakeholders and society in general, ÅF has an important duty to worktowards more sustainable development. In many instances, ÅF is tasked with introduc-ing new and better technology, implementing rationalisation measures and reducingemissions. With more than a century’s experience as an established name in technicalconsulting, ÅF adopts a long-term perspective to business and has its sights firmly seton making a positive contribution to long-term sustainable development.
ÅF frequently participates in environmental collaboration between different playersin trade and industry, the public sector and the world of research. Its role as a consult-ant is to act as a bridge by facilitating understanding and the exchange of knowledgeamong those involved.
ÅF also acts as an expert resource for ISO in the development of international guide-lines for Corporate Social Responsibility, ISO 26000. For ÅF’s Sustainability Report,please see pages 51–56 of the annual report.
EmployeesThe number of FTEs was 3,966 (2009: 4,182).
During the course of 2010 more than 1,000 co-workers left or joined ÅF as a resultof the process of selling and acquiring companies that reflects the strategy of creatingan organisation with a greater focus on technical consulting and with strong businessdivisions, each with the potential to be a market leader in its field. The total number ofemployees at the end of the reporting period was 4,475 (4,428): 3,148 in Sweden and1,327 outside Sweden.
ÅF adopts an active, long-term perspective to HR work in order to attract and retainskilled employees. This approach involves marketing ÅF as an employer externally, butalso providing clear information about the various career paths and opportunities fordevelopment available at ÅF, and offering all employees the kind of work that developsthem as individuals.
ÅF improved its market standing in 2010, particularly in the fields of energy and infra-structure, and maintained its strong appeal as an employer. In Universum’s annualCareer Barometer survey of some 3,500 practising engineers, ÅF secured an overallthird place among Swedish companies in the “ideal employer” rankings. ÅF works hardwith employer branding activities to market itself as a good employer among potentialco-workers and to bolster the company’s image in general. During the year a number ofoutreach activities were conducted at universities and technical colleges. ÅF also worksto achieve a good gender balance within the company. Whenever a managerial postbecomes vacant, at least one woman must be selected as a possible candidate. Theproportion of female consultants was 19 percent at the end of 2010 (2009: 17 percent).
The “Five of Five Thousand” project has identified and defined three main careerpaths within ÅF: specialist/expert, project manager and manager. Parallel with this, theinternal training organisation, ÅF Academy, has been established to support the devel-opment of co-workers in their specific professional role within the company and to assistmanagers in this development work. All the courses that are offered by this internaltraining organisation include modules on entrepreneurial skills. For further details aboutÅF’s work with human resources, please see pages 14–21 in the Group’s annual report.
Risk management and sensitivity analysisThe capacity utilisation rate is a crucial factor behind a consulting company’s ability togenerate a profit. Every percentage point change in this figure affects ÅF’s results byplus/minus approximately SEK 47 million. The hourly rate, of course, is also a key com-ponent in the results of a consulting company. An increase in the hourly rate of SEK 10would, if all other factors remained unchanged, improve profits for ÅF by around SEK 48million. Methods of increasing flexibility and reducing sensitivity include the use of sub-consultants, fixed-term employment contracts and increases in the variable salary com-ponent, along with measures to broaden expertise and markets and to productise ser-vices, which involves packaging a number of services to improve competitiveness andreduce price sensitivity.
While most ÅF assignments are carried out on an open-account basis, fixed pricecontracts are also agreed in a many cases. This does, of course, represent a financialrisk in the form of write-downs if the costs involved in a project are miscalculated. Care-ful estimates of costs and follow-ups of fixed-price assignments are carried out to mini-mise the risk of impairment.
If the set targets are to be reached, it is absolutely crucial for a consulting companythat staff are motivated and possess the relevant skills and expertise. There is always arisk that skilled employees may leave ÅF to set up their own company or be headhuntedby the competition. In order to attract and retain staff, ÅF invests in continual training,skills development and leadership development. ÅF’s ambition is to make everyemployee perceive some form of added value in working for ÅF.
ÅF’s business activities involve a risk of dispute. Drawing up contracts for all assign-ments and specifying in detail the terms of the agreement reduces the risk.
ÅF’s ambition is to augment growth by acquiring other consulting companies. Theincreased risk that this entails is minimised by adopting a systematic approach to acqui-sitions and insisting on the relevant documentation and reviews. An annual evaluation ofrecent acquisitions is carried out by the ÅF Board over a period of at least three yearsafter the acquisition has been made.
Through its operations, ÅF is exposed to various financial risks, such as currencyrisk, interest rate risk, financial credit risk and client credit risk. Responsibility for theGroup’s financial transactions and risks is held centrally by the parent company’saccounting and reporting department in accordance with the policies adopted by theboard. The overriding goal is to provide cost-effective financing and to minimise the neg-ative impact of market fluctuations on the Group’s earnings. To minimise the currencyrisk in contracted payment flows in foreign currencies, large contracts are hedged usingderivatives. For a more detailed description of risk management and sensitivity analysis,please see Note 25 and pages 58–61.
SharesÅF’s B shares have been quoted on Nasdaq OMX Stockholm (Mid Cap) since January1986. Prior to that, ÅF traded as a cooperative association (Ångpanneföreningen) from1895 until 1980 and as a joint-stock company from 1981.
ÅF shares traded at SEK 139.25 at the end of 2010, an appreciation of 42.5 percentin value over the year. The Stockholm OMXSPI all-share index rose by 23.1 percent dur-ing the same period.
ÅF’s market capitalisation as at 31 December 2010 was SEK 4,743 million (31 Dec2009: SEK 3,329 million).
During the year there was a turnover of 15,325,671 (12,418,178) shares, valued at atotal of SEK 2,197 million (SEK 1,770 million). The average turnover per trading day wasSEK 8.7 million (SEK 7.1 million). Shares were traded on 100 percent (100 percent) oftrading days.
The total number of ÅF shares on 31 December 2010 amounted to 34,059,002, ofwhich 1,608,876 were class A shares and 32,450,126 were class B shares. On 31December 2010 ÅF AB held 284,000 of its own class B shares. A 2:1 share split wasimplemented on 2 June 2010.
The ten largest shareholders in ÅF are listed on page 48 of the Group’s annual report.The largest single shareholder is Ångpanneföreningen’s Foundation for Research &Development, which holds 1,602,876 class A shares and 3,832,576 class B shares: thisequates to 16.0 percent of the total number of shares and 40.9 percent of the votingrights in the company.
On 5 May 2010 the Annual General Meeting of shareholders authorised the Board ofDirectors to buy back shares so that the company’s own holding amounts to a maximumof 10 percent of the shares in the company. The board was also authorised to issue newshares that correspond to an increase of a maximum of SEK 15,000,000 in the compa-ny’s share capital.
The board has not made use of these powers during 2010.There are no limitations, neither in law nor in the company’s articles of association,
relating to the transfer of shares.

6 9
Å F A N N U A L R E P O R T 2 0 10
Performance-related Share Programme 2010At the Annual General Meeting held on 5 May 2010 shareholders in ÅF AB resolved toimplement a new three-year performance-related share savings programme for up to119 key individuals in the company, including the President/CEO.
Participants in the programme were given the opportunity to reserve a sum corre-sponding to a maximum of 5 percent of their gross salary for the purchase of ÅF shareson Nasdaq OMX Stockholm over a 12-month period from the date of implementation ofthe programme. On expiry of the application period, 98 ÅF employees in key positionshad expressed an interest in purchasing approximately 36,000 shares for the entire2010 programme.
In the event that the preset performance targets are met in full, some 189,000 shareswill be transferred to these employees throughmatching and free of consideration between2010 and 2013. This can lead to dilution of a maximum 0.6 percent of earnings per share.
Board of DirectorsFollowing the recommendation of the Nomination Committee eight directors (withoutdeputies) were elected by the Annual General Meeting to serve in 2010: Ulf Dinkelspiel,Patrik Enblad, Eva-Lotta Kraft, Jon Risfelt, Helena Skåntorp, Anders Snell and Lena Tre-schow Torell were re-elected, and Björn O Nilsson was elected to serve a first term as adirector of the company.
Ulf Dinkelspiel was re-elected as Chairman of the Board.Patrik Tillack and Fredrik Sundin were appointed as employee representatives on the
board.At its inaugural meeting following the AGM, the board elected Lena Treschow Torell
as its Deputy Chair.Please turn to pages 128–129 in this annual report for a more detailed presentation
of board members and directors.
Work of the Board of DirectorsDuring the 2010 financial year, the board held nineteen (19) meetings, one of which wasthe board’s inaugural meeting. The work of the board focuses chiefly on strategicissues, business plans, financial statements, major investments and takeovers andother decisions which, according to the written rules of procedure, are to be dealt withby the board. A presentation of developments with regard to the company’s businessoperations and financial position is a standing item on the agenda. In conjunction witheach ordinary meeting of the board, one business area within the company is also scruti-nised in greater detail. At the board meeting in September a strategy seminar wasarranged which included a thorough review of each division.
Other ÅF employees have participated in board meetings to present reports. ViktorSvensson, ÅF’s Executive Vice President, Corporate Information, has served as secre-tary to the board.
An evaluation of the board’s work during the year has been carried out.ÅF’s Corporate Governance Report is presented separately on pages 123–127 in this
annual report.
Senior managementIn 2010 the ÅF Group’s senior management team comprised Jonas Wiström (Presidentand CEO), Jonas Ågrup (CFO), Viktor Svensson (Executive Vice President, CorporateInformation), Charlotte Witt (Director, Human Resources), Jacob Landén (General Coun-sel) and the Divisional Presidents, Eero Auranne, Per Magnusson, Mats Påhlsson andJohan Olsson. Marie Edman is the secretary to the senior management group.
Please turn to pages 130–131 for a presentation of the senior executives in thecompany.
Guidelines for the remuneration of the senior executives of the CompanyThe 2010 Annual General Meeting resolved that the principles below relating to remu-neration and other conditions of employment for senior executives of the company willapply for contracts of employment signed or amended after the AGM. By “senior execu-tives of the company” is meant the President/CEO and other members of the seniormanagement group.
ÅF Group policy is that remuneration should be on competitive market terms, as thiswill facilitate recruitment and enable the Group to retain senior executives with the requi-site skills and experience. ÅF applies the “grandfather principle”, according to whichremuneration terms must always be approved by each manager’s immediate superior.
The remuneration package for senior executives consists of basic salary, a variablesalary element, pension, use of a company car, other remuneration and long-term incen-tive programmes.
Remuneration is based on factors such as duties, expertise, experience, positionand performance. The apportionment between basic salary and variable remunerationis also related to the executive’s position and duties. The annual variable element for theCEO is a maximum of 65 percent of the fixed annual salary, and for other executives nor-mally a maximum of 60 percent of the fixed annual salary. The fixed annual salary is thecurrent monthly salary multiplied by 12.2. The variable remuneration paid is the amountafter the deduction of social security expenses. The variable element is based on out-comes in relation to targets. The targets and salary for the CEO are determined by theBoard of Directors. Targets and salary for other senior executives are set by the CEO inconsultation with the Remuneration Committee.
Senior executives have defined-contribution pension plans with market contribu-tions. All pension benefits are vested, and are not, therefore, dependent on futureemployment. The retirement age for the CEO is 60, and for other senior executives,65 (with the exception of contracts signed before 2002).
For information regarding previously approved remuneration which has not becomedue for payment, please refer to Note 8 in this annual report.
The Board of Directors proposes that the 2011 Annual General Meeting resolves thatthe principles for remuneration and other conditions of employment for senior manage-ment for 2011 shall be in line with the principles that have been applied during 2010.
DividendThe Board proposes a dividend for 2010 of SEK 4.00 per share (2009: SEK 4.00 per share).
Prospects for 2011The outlook for 2011 appears to be favourable. ÅF has a clear corporate structure and astrong brand and, for the first time since the onset of the financial crisis, the trend forcapacity utilisation is positive. The inflow of orders exceeded expectations in the fourthquarter, and it is our opinion that the market for ÅF’s services will become progressivelystronger as the year unfolds. Most of the signs suggest that 2011 will be a better yearfor ÅF than 2010.
Proposed appropriation of profitsNon-restricted profits of SEK 1,996,291,789 are at the disposal of the Annual GeneralMeeting. The Board of Directors and CEO propose that these profits be appropriated asfollows:
To the shareholders:
a dividend of SEK 4.00 per share 135,100,008
To be carried forward 1,861,191,781
Total, SEK 1,996,291,789
The board’s explanation of the proposed appropriation of profits will be posted on thecompany’s website, www.afconsult.com. It can also be ordered from the company.
A N N U A L R E P O R T A D M I N I S T R A T I O N R E P O R T

7 0
Å F A N N U A L R E P O R T 2 0 10
A N N U A L R E P O R T C O N S O L I D A T E D I N C O M E S TAT E M E N T
1 January – 31 December (in millions of SEK) Note 2010 2009
Operating incomeNet sales 2 4,334.1 4,677.9
Other operating income 5 461.8 14.1
4,795.9 4,692.0
Operating expenses 6
Other external costs 7, 26 –1,430.5 –1,564.2
Personnel costs 8 –2,528.7 –2,671.9
Depreciation/amortisation and impairment of tangible and intangible assets 13, 14 –50.8 –61.6
Other operating expenses 9 –13.1 –7.6
Profit attributable to participation in associates 15 33.1 1.6
Operating profit 2 805.8 388.3
Result from financial investmentsFinancial income 13.5 12.2
Financial expenses –21.3 –23.5
Net financial items 10 –7.7 –11.3
Profit after financial items 798.1 377.0
Tax 22 –80.9 –101.6
Profit for the year 717.2 275.3
Attributable to:
Shareholders in the parent 709.9 268.7
Non-controlling interest 7.3 6.6
717.2 275.3
Earnings per share with regard to profit attributableto shareholders in the parent 12
before dilution (SEK) 21.02 7.93
after dilution (SEK) 20.95 7.91
CONSOLIDATED INCOME STATEMENT

7 1
Å F A N N U A L R E P O R T 2 0 10
A N N U A L R E P O R T S TA T E M E N T O F C O N S O L I D A T E D C O M P R E H E N S I V E I N C O M E
1 January – 31 December (in millions of SEK) Note 2010 2009
Change in translation reserve for the year –43.6 –56.7
Change in value of cash flow hedging 2.1 –0.4
Pensions (actuarial gains and losses) –4.4 44.1
Tax 0.5 –8.7
Other comprehensive income –45.4 –21.7
Profit for the year 717.2 275.3
Total comprehensive income for the period 671.8 253.7
Attributable to:
Shareholders in the parent 665.9 247.4
Non-controlling interest 5.9 6.3
671.8 253.7
STATEMENT OF CONSOLIDATED COMPREHENSIVE INCOME

7 2
Å F A N N U A L R E P O R T 2 0 10
A N N U A L R E P O R T C O N S O L I D A T E D B A L A N C E S H E E T
As at 31 December (in millions of SEK) Note 2010 2009
Assets 3, 4
Intangible assets 13 1,677.0 1,369.8
Tangible assets 14 292.7 332.9
Participations in associates 15 5.9 12.4
Financial investments 16 0.7 1.2
Non-current receivables 18.5 5.7
Deferred tax asset 22 21.7 10.9
Total non-current assets 2,016.4 1,732.9
Accounts receivable 24 1,078.3 881.8
Revenue generated but not invoiced 370.8 457.1
Current tax assets 22 19.0 15.1
Other receivables 64.7 92.0
Prepaid expenses 17 73.4 59.0
Cash and cash equivalents 327.9 344.7
Total current assets 1,934.0 1,849.6
Total assets 3,950.4 3,582.5
CONSOLIDATED BALANCE SHEET

7 3
Å F A N N U A L R E P O R T 2 0 10
As at 31 December (in millions of SEK) Note 2010 2009
Equity and liabilitiesEquity 18
Share capital 170.3 170.3
Other contributed capital 469.8 467.7
Reserves 81.9 122.4
Retained earnings including profit for the year 1,624.4 1,052.6
Equity attributable to shareholders in parent 2,346.3 1,813.0
Non-controlling interest 14.4 13.6
Total equity 2,360.7 1,826.6
Liabilities 3, 4
Liabilities to credit institutions 19, 25 6.5 39.7
Provisions for pensions 20 62.8 62.4
Other provisions 21 68.0 27.3
Deferred tax liabilities 22 45.9 30.0
Other liabilities 1.3 1.6
Total non-current liabilities 184.5 161.0
Liabilities to credit institutions 19, 25 224.1 289.4
Work invoiced but not yet carried out 252.9 256.6
Accounts payable – trade 293.5 264.9
Current tax liability 22 4.0 31.8
Other liabilities 237.8 310.9
Accrued expenses and prepaid income 23 379.4 410.6
Provisions 21 13.6 30.7
Total current liabilities 1,405.2 1,595.0Total liabilities 1,589.7 1,756.0
Total equity and liabilities 3,950.4 3,582.5
For information about the Group’s pledged assets and contingent liabilities, please refer to Note 27.
CONSOLIDATED BALANCE SHEET (CONTINUED)
A N N U A L R E P O R T C O N S O L I D A T E D B A L A N C E S H E E T

7 4
Å F A N N U A L R E P O R T 2 0 10
A N N U A L R E P O R T S TA T E M E N T O F C H A N G E I N E Q U I T Y F O R G R O U P
Equity attributable to shareholders in the parent
In millions of SEKSharecapital
Othercontributed
capital Reserves
Profits broughtforward incl.profit for the
year Total
Non-controlling
interest Total equity
Equity brought forward 1 Jan 2009 170.3 482.0 179.1 858.6 1,690.1 8.5 1,698.6
Other comprehensive income — — –56.7 35.3 –21.4 –0.3 –21.7
Profit for the year 268.7 268.7 6.6 275.3
Total comprehensive income for the period — — –56.7 304.1 247.4 6.3 253.7
Dividends –110.2 –110.2 –1.3 –111.5
Share buy-backs –16.1 –16.1 –16.1
Share savings programme 1.8 1.8 1.8
Equity carried forward 31 Dec 2009 170.3 467.7 122.4 1,052.6 1,813.0 13.6 1,826.6
Equity brought forward 1 Jan 2010 170.3 467.7 122.4 1,052.6 1,813.0 13.6 1,826.6
Other comprehensive income — — –40.6 –3.5 –44.0 –1.3 –45.4
Profit for the year 709.9 709.9 7.3 717.2
Total comprehensive income for the period — — –40.6 706.4 665.9 5.9 671.8
Dividends –135.1 –135.1 –4.2 –139.3
Acquisition of non-controlling interest 0.5 0.5 –0.9 –0.4
Share savings programmes 2.0 2.0 2.0
Equity carried forward 31 Dec 2010 170.3 469.8 81.9 1,624.4 2,346.3 14.4 2,360.7
For supplementary information, please see Note 18.
STATEMENT OF CHANGE IN EQUITY FOR GROUP

7 5
Å F A N N U A L R E P O R T 2 0 10
1 January – 31 December (in millions of SEK) Note 2010 2009
Operating activities 31
Profit after financial items 798.1 377.0
Adjustment for items not included in cash flow and other –456.3 49.0
Income tax paid –117.1 –150.2
Cash flow from operating activities before changes in working capital 224.7 275.8
Cash flow from changes in working capitalChange in operating receivables –71.2 51.8
Change in operating liabilities 47.8 –21.7
Cash flow from operating activities 201.3 305.8
Investing activitiesAcquisition of tangible assets –27.9 –42.6
Acquisition of intangible assets –6.4 –15.7
Acquisition of business operations 4 –391.1 –2.2
Additional considerations paid –122.4 –37.8
Disposal of business operations 3 624.5 19.9
Acquisition of financial assets –0.5 –0.8
Disposal of financial assets 1.2 —
Cash flow from investing activities 77.4 –79.1
Financing activitiesProceeds from borrowing 0.3 6.8
Amortisation of loans –150.0 –40.2
Dividend paid to parent shareholders and non-controlling shareholders –139.3 –111.5
Share buy-backs — –16.1
Cash flow from financing activities –289.0 –161.0
Cash flow for the year –10.3 65.8Cash and cash equivalents brought forward 344.7 290.3
Exchange difference in cash/cash equivalents –6.5 –11.5
Cash and cash equivalents carried forward 327.9 344.7
A N N U A L R E P O R T S TA T E M E N T O F C A S H F L O W S F O R G R O U P
STATEMENT OF CASH FLOWS FOR GROUP

7 6
Å F A N N U A L R E P O R T 2 0 10
A N N U A L R E P O R T P A R E N T I N C O M E S TAT E M E N T
1 January – 31 December (in millions of SEK) Note 2010 2009
Operating incomeNet sales 225.1 207.4
Other operating income 5 104.5 86.8
329.6 294.1
Operating expensesOther external costs 7, 26 –159.1 –127.0
Personnel costs 8 –66.2 –71.7
Depreciation and impairment of tangible and intangible assets 13, 14 –10.5 –9.3
Other operating expenses 9 –110.5 –91.9
Operating loss –16.7 –5.7
Result from financial investmentsResult from shares in Group companies and associates 10 782.2 3.7
Interest income and similar profit/loss items 10 2.0 8.1
Interest expense and similar profit/loss items 10 –7.2 –10.4
777.0 1.4
Profit/loss after financial items 760.3 –4.3
Appropriations 11 –2.7 –13.2
Pre-tax profit/loss 757.6 –17.6
Tax 22 6.3 5.5
Profit/loss for the year 763.9 –12.1
PARENT INCOME STATEMENT

7 7
Å F A N N U A L R E P O R T 2 0 10
1 January – 31 December (in millions of SEK) Note 2010 2009
Change in value of cash flow hedges — –0.6
Tax — 0.2
Other comprehensive income — –0.4
Profit/loss for the year 763.9 –12.1
Total profit/loss for the period 763.9 –12.5
A N N U A L R E P O R T S TA T E M E N T O F C O M P R E H E N S I V E I N C O M E F O R P A R E N T
STATEMENT OF COMPREHENSIVE INCOME FOR PARENT

7 8
Å F A N N U A L R E P O R T 2 0 10
A N N U A L R E P O R T P A R E N T B A L A N C E S H E E T
As at 31 December (in millions of SEK) Note 2010 2009
AssetsNon-current assetsIntangible assets 13 4.7 3.3
Tangible assets 14 55.4 57.5
Participations in Group companies 29 2,356.8 2,109.5
Participations in associates 15 7.3 8.0
Receivables from Group companies 28 4.5 2.1
Non-current receivables 15.2 1.3
Total non-current assets 2,443.9 2,181.7
Current assetsAccounts receivable 3.3 1.9
Receivables from Group companies 28 271.8 192.7
Receivables from associates 28 0.1 0.1
Revenue generated but not invoiced 2.7 3.5
Current tax assets 22 12.1 13.6
Other receivables 15.8 9.4
Prepaid expenses 17 41.1 31.5
Total current receivables 346.9 252.5
Cash and bank balances 53.7 3.9
Total current assets 400.6 256.4
Total assets 2,844.5 2,438.1
PARENT BALANCE SHEET

7 9
Å F A N N U A L R E P O R T 2 0 10
As at 31 December (in millions of SEK) Note 2010 2009
Equity and liabilitiesEquity 18
Restricted equityShare capital (1,608,876 class A shares and 32,450,126 class Bshares: total 34,059,002 shares with a quota value of SEK 5) 170.3 170.3
Statutory reserve 46.9 46.9
Non-restricted equityShare premium reserve 441.0 441.0
Profit brought forward 791.4 746.9
Profit/loss for the year 763.9 –12.1
Total equity 2,213.5 1,393.1
Untaxed reserves 30 28.4 25.8
ProvisionsProvisions for pensions and similar obligations 20 26.2 27.1
Other provisions 21 69.8 24.4
Total provisions 96.0 51.5
Non-current liabilitiesLiabilities to Group companies 28 0.2 0.2
Total non-current liabilities 0.2 0.2
Current liabilitiesLiabilities to credit institutions 19, 25 100.0 211.6
Accounts payable – trade 69.0 53.8
Liabilities to Group companies 28 311.2 555.6
Other liabilities 2.2 122.5
Accrued expenses and prepaid income 23 24.0 24.1
Total current liabilities 506.4 967.6
Total equity and liabilities 2,844.5 2,438.1
Pledged assets and contingent liabilities for the parentPledged assets 27 None None
Contingent liabilities 27 114.9 237.6
PARENT BALANCE SHEET (CONTINUED)
A N N U A L R E P O R T P A R E N T B A L A N C E S H E E T
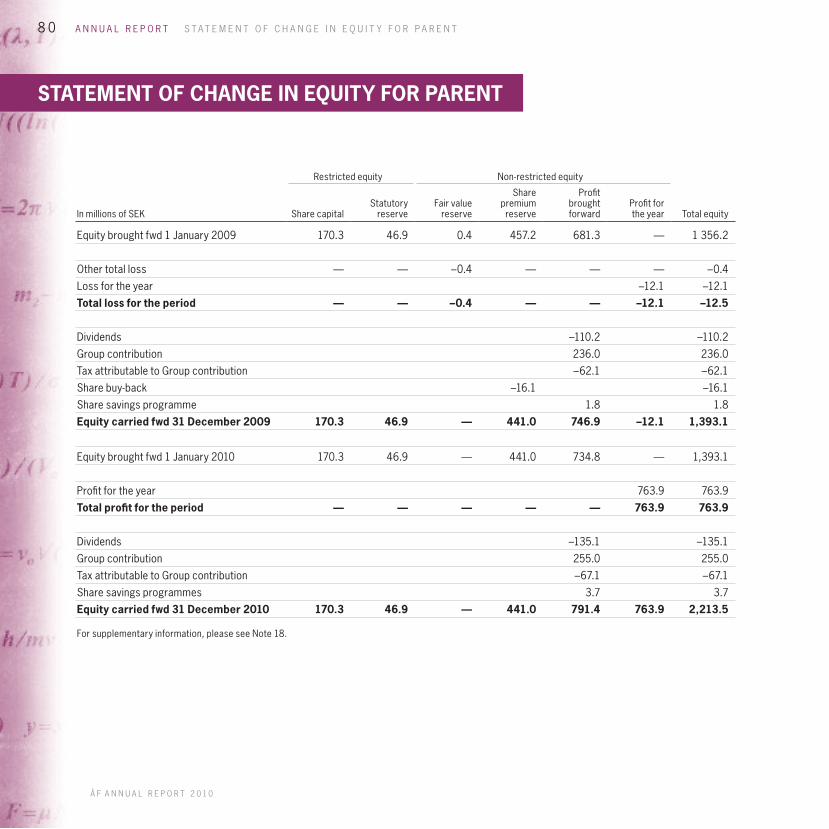
8 0
Å F A N N U A L R E P O R T 2 0 10
A N N U A L R E P O R T S TA T E M E N T O F C H A N G E I N E Q U I T Y F O R P A R E N T
Restricted equity Non-restricted equity
In millions of SEK Share capitalStatutoryreserve
Fair valuereserve
Sharepremiumreserve
Profitbroughtforward
Profit forthe year Total equity
Equity brought fwd 1 January 2009 170.3 46.9 0.4 457.2 681.3 — 1 356.2
Other total loss — — –0.4 — — — –0.4
Loss for the year –12.1 –12.1
Total loss for the period — — –0.4 — — –12.1 –12.5
Dividends –110.2 –110.2
Group contribution 236.0 236.0
Tax attributable to Group contribution –62.1 –62.1
Share buy-back –16.1 –16.1
Share savings programme 1.8 1.8
Equity carried fwd 31 December 2009 170.3 46.9 — 441.0 746.9 –12.1 1,393.1
Equity brought fwd 1 January 2010 170.3 46.9 — 441.0 734.8 — 1,393.1
Profit for the year 763.9 763.9
Total profit for the period — — — — — 763.9 763.9
Dividends –135.1 –135.1
Group contribution 255.0 255.0
Tax attributable to Group contribution –67.1 –67.1
Share savings programmes 3.7 3.7
Equity carried fwd 31 December 2010 170.3 46.9 — 441.0 791.4 763.9 2,213.5
For supplementary information, please see Note 18.
STATEMENT OF CHANGE IN EQUITY FOR PARENT

8 1
Å F A N N U A L R E P O R T 2 0 10
1 January – 31 December (in millions of SEK) Note 2010 2009
Operating activities 31
Profit/loss after financial items 760.3 –4.3
Adjustment for items not included in the cash flow and other –360.2 –6.7
Income tax paid –59.3 –120.5
Cash flow from operating activities before changes in working capital 340.8 –131.5
Cash flow from changes in working capitalChange in operating receivables 44.1 818.1
Change in operating liabilities –46.1 367.9
Cash flow from operating activities 338.8 1 054.4
Investing activitiesAcquisition of tangible assets –6.7 –9.9
Acquisition of intangible assets –3.1 –3.7
Acquisition of financial assets –607.8 –885.3
Disposal of financial assets 575.3 —
Cash flow from investing activities –42.3 –898.9
Financing activitiesAmortisation of loans –111.6 –29.2
Dividends paid –135.1 –110.2
Share buy-backs — –16.1
Cash flow from financing activities –246.7 –155.5
Cash flow for the year 49.8 0.0Cash and cash equivalents brought forward 3.9 3.9
Cash and cash equivalents carried forward 53.7 3.9
A N N U A L R E P O R T S TA T E M E N T O F C A S H F L O W S F O R P A R E N T
STATEMENT OF CASH FLOWS FOR PARENT

8 2
Å F A N N U A L R E P O R T 2 0 10
A N N U A L R E P O R T
Page
Note 1 Accounting principles 83
Note 2 Segment reporting 92
Note 3 Sale of business operations 93
Note 4 Business combinations 93
Note 5 Other operating income 94
Note 6 Research and development 94
Note 7 Fees and remuneration of auditors 94
Note 8 Employees and personnel costs 94
Note 9 Other operating expenses 97
Note 10 Net financial income/expense 97
Note 11 Appropriations 98
Note 12 Earnings per share 98
Note 13 Intangible assets 99
Note 14 Tangible assets 101
Note 15 Participations in associates 102
Note 16 Financial investments 103
Note 17 Prepaid expenses 103
Note 18 Equity 104
Note 19 Liabilities to credit institutions 105
Note 20 Retirement benefit obligations 106
Note 21 Provisions 108
Note 22 Taxes 109
Note 23 Accrued expenses and prepaid income 111
Note 24 Financial assets and liabilities 112
Note 25 Financial risks and financial policy 114
Note 26 Operating leases 115
Note 27 Pledged assets, contingent liabilitiesand contingent assets 115
Note 28 Transactions with related parties 115
Note 29 Group subsidiaries 116
Note 30 Untaxed reserves 118
Note 31 Statement of cash flows 119
Note 32 Events after the end of the reporting period 119
Note 33 Critical estimates and assumptions 119
Note 34 Information about the parent 119
TABLE OF NOTES
8 3
Å F A N N U A L R E P O R T 2 0 10
A N N U A L R E P O R T N O T E S
Financial values in the tables of accounts are in millions of SEK unless other-wise stated.
1 Accounting principles
1.1 Compliance with standards and legislationThe consolidated financial statements have been prepared in accordance withInternational Financial Reporting Standards (IFRS) issued by the InternationalAccounting Standards Board (IASB) and interpretations published by the Inter-national Financial Reporting Interpretations Committee (IFRIC) approved by theEuropean Commission for application in the EU. In addition, the Swedish Finan-cial Reporting Board’s recommendation RFR 1 (Supplementary AccountingRules for Groups) has been applied.
The parent applies the same accounting policies as the Group except asstated below in the section “Parent accounting policies”. The differencesbetween the accounting policies of the parent and the Group are due to limi-tations in the parent’s scope to apply IFRS imposed by the Swedish AnnualAccounts Act and the Pension Obligations Vesting Act (Tryggandelagen), andin some cases to tax reasons.
1.2 Basis of preparation of the parent and consolidated financialstatementsThe parent’s functional currency is the Swedish Krona (SEK), which is also thereporting currency for the parent and the Group. This means that the financialstatements are presented in SEK.
Assets and liabilities are reported at historical cost, with the exception ofvarious financial assets and liabilities which are carried at fair value. The finan-cial assets and liabilities which are carried at fair value are derivative instru-ments and financial assets classified as available for sale. Non-current assetsheld for sale are carried at the lower of previous carrying amount and fairvalue less costs to sell.
The preparation of financial statements in accordance with IFRS requiresmanagement to make judgements and estimates, and to make assumptionswhich affect the application of the accounting policies and the carryingamounts of assets, liabilities, income and expenses. These estimates andassumptions are based on historical experience and a number of other factorsdeemed reasonable under the circumstances. The results of these estimates
and assumptions are then used to judge the carrying amounts of assets andliabilities where these are not clear from other sources. The actual outcomemay differ from these estimates and judgements.
Estimates and assumptions are reviewed regularly. Changes in estimatesare recognised in the period in which the change is made if the change affectsonly that period, or in both the period in which the change is made and futureperiods if the change affects both the current and future periods.
Judgements made by management in applying IFRS which have a significanteffect on the financial statements, and estimates made which could result inmaterial adjustments in subsequent years’ financial statements are describedin more detail in Note 33.
The following accounting policies for the Group have been applied consist-ently to all periods presented in the Group’s financial statements unless other-wise stated below. The Group’s accounting policies have been applied consist-ently in the reporting and consolidation of the parent, subsidiaries and theinclusion of associates in the consolidated accounts.
The annual report and consolidated financial statements were approved forrelease by the Board of Directors on 11 March 2011. The consolidated incomestatement and balance sheet and the parent income statement and balancesheet will be put forward for adoption at the Annual General Meeting on 2 May2011.
1.3 Amended accounting policies and disclosure requirements1.3.1 Amended and new accounting policies for the yearIFRS 3R Business combinations and IAS 27R Consolidated and separatefinancial statementsIFRS 3R introduces a number of changes in the treatment of business combi-nations which affect the size of recognised goodwill, the profit/loss in theperiod in which the acquisition was completed and future profit/loss.
IAS 27R requires that changes in ownership structure in a subsidiary, inwhich the majority shareholder does not lose control, are recognised as equitytransactions. This means that such transactions no longer give rise to goodwillor generate gains or losses. In addition, IAS 27R alters the treatment of losseswhich arise in a partially-owned subsidiary and the accounting where control-ling influence over a subsidiary is lost.
During 2010, the changes to IFRS 3 have affected the consolidatedaccounting of transaction costs and additional considerations.
NOTES WITH ACCOUNTING PRINCIPLES AND COMMENTS
8 4
Å F A N N U A L R E P O R T 2 0 10
A N N U A L R E P O R T N O T E S
1.3.2 Future changes in accounting policiesNo new accounting policies will come into force in 2011 that will affect the con-solidated financial statements for 2011.
1.4 Segment reportingSegment reporting is based on operating segments which consist of theGroup’s four divisions. This corresponds to the structure for the senior man-agement team’s monitoring and management of operations.
1.5 Classification, etc.In the financial statements for both the parent and the ÅF Group, non-currentassets and non-current liabilities consist essentially of amounts expected tobe recovered or settled more than 12 months after the end of the reportingperiod. Current assets and liabilities consist essentially of amounts expectedto be recovered or settled within 12 months of the end of the reporting period.
1.6 Basis of consolidation1.6.1 SubsidiariesSubsidiaries are companies over which ÅF AB has a controlling influence. Acontrolling influence means, directly or indirectly, the power to govern a com-pany’s financial and operating policies with a view to deriving economic bene-fits. Potential voting rights which are currently exercisable or convertible aretaken into account when assessing whether a controlling influence is held.
Subsidiaries are accounted for using the acquisition method. This meansthat the acquisition of a subsidiary is treated as a transaction where the Groupindirectly acquires the subsidiary’s assets and assumes its liabilities and con-tingent liabilities. The consolidated cost is determined by means of an analysisundertaken in connection with the acquisition of a business. The analysisdetermines the acquisition value of participations or businesses, the fair valueof acquired identifiable assets and assumed liabilities, contingent liabilitiesand equity instruments issued as consideration for the net assets acquired.
The difference between the cost of the shares in the subsidiary and the fairvalue of the assets acquired on the one hand, and liabilities and contingent lia-bilities assumed on the other, is treated as goodwill.
Subsidiaries’ financial statements are consolidated from the date of acquisi-tion until such time as the controlling influence is relinquished.
1.6.2 AssociatesAssociates are companies over whose operational and financial managementthe Group exercises a significant but not controlling influence, generallythrough a holding of 20–50 percent of the votes. Investments in associatesare accounted for in the consolidated financial statements using the equitymethod from the time significant influence is obtained. This means that thecarrying amount of the shares in the associate recognised in the consolidatedfinancial statements consists of the Group’s share of the associate’s equityplus goodwill and any other remaining fair value adjustments. The Group’sshare of the associate’s profit/loss after tax and non-controlling interests,adjusted for any amortisation, impairment or reversal of fair value adjust-ments, is recognised in the consolidated income statement under “Share ofassociates’ profit/loss”. Any dividends received from the associate reduce thecarrying amount of the investment.
Any difference at the time of acquisition between the cost of the investmentand the investor’s interest in the net fair value of the associate’s identifiableassets, liabilities and contingent liabilities is recognised in accordance withIFRS 3 “Business combinations”.
If the Group’s interest in the recognised losses of an associate exceeds thecarrying amount of the shares in the consolidated balance sheet, the carryingamount of the shares is reduced to zero. Losses are also allocated againstunsecured non-current financial balances which effectively form part of theinvestor’s net investment in the associate. Further losses are not recognisedunless the Group has issued guarantees to cover losses arising at the associ-ate. The equity method is applied until such time as significant influence isrelinquished.
1.6.3 Transactions eliminated on consolidationIntra-group receivables, liabilities, income and expenses, and unrealised gainsand losses arising on transactions between Group companies, are eliminatedin their entirety when preparing the consolidated financial statements.
Unrealised gains arising on transactions with associates and joint venturesare eliminated in proportion to the Group’s interests in the company. Unreal-ised losses are eliminated in the same way as unrealised gains, but only to theextent that there is no indication of impairment.
Note 1 cont’d

8 5
Å F A N N U A L R E P O R T 2 0 10
1.7 Foreign currency1.7.1 Transactions in foreign currencyTransactions in foreign currency are translated into the functional currency atthe exchange rate ruling on the transaction date. Monetary assets and liabilitiesin foreign currency are translated into the functional currency at the exchangerate ruling at the end of the reporting period. Exchange differences arising ontranslation are recognised in profit or loss. Non-monetary assets and liabilitiescarried at historical cost are translated at the exchange rate ruling on thetransaction date. Non-monetary assets and liabilities carried at fair value aretranslated into the functional currency at the exchange rate ruling when theirfair value was determined, and changes in exchange rates are then recognisedin the same way as other changes in the value of the asset or liability.
The functional currency is the currency of the primary economic environ-ments in which the companies in the ÅF Group operate. The parent’s functionalcurrency and reporting currency is the Swedish Krona (SEK). The ÅF Group’sreporting currency is SEK.
1.7.2 Financial statements of foreign operationsThe assets and liabilities of foreign operations, including goodwill and otherfair value adjustments, are translated into SEK at the exchange rate ruling atthe end of the reporting period. The income and expenses of foreign opera-tions are translated into SEK at an average exchange rate which approximatesthe exchange rates on the various transaction dates.
Translation differences arising on the translation of net investments in foreignoperations are recognised in other comprehensive income. When a foreign oper-ation is sold, the accumulated translation differences attributable to the oper-ation are realised net of any currency hedging in the consolidated balance sheet.
1.8 RevenueRevenue from services rendered is recognised in accordance with IAS 18. Thepercentage of completion method is applied to all assignments whose outcomecan be measured reliably. The majority of assignments are performed on anopen-account basis, according to which income is entered into the accountswhen the work is performed, and clients are normally invoiced one month afterthe work is carried out. Where assignments are carried out on a fixed-pricebasis, revenue is recognised in profit or loss on the basis of the stage of com-pletion at the end of the reporting period. The stage of completion of an assign-ment is determined by comparing the expenditure at the end of the reportingperiod with estimated total expenditure. If it is probable that the total assign-ment expenditure will exceed the total assignment revenue, the anticipatedloss is immediately recognised as an expense in its entirety. Revenue is notrecognised if it is probable that the economic benefits will not flow to theGroup. In the event of significant uncertainty about payment or associatedexpenses, no revenue is recognised.
1.9 Operating expenses and financial income and expenses1.9.1 Operating lease agreementsPayments under operating leases are recognised in profit or loss on a straight-line basis over the lease term. Benefits received in connection with signing alease are reported as part of the total lease cost in the income statement.Contingent rents are recognised in the periods in which they arise.
1.9.2 Finance lease agreementsMinimum lease payments are apportioned between a finance charge and areduction of the outstanding liability. The finance charge is spread over thelease term so that the amount charged in each reporting period correspondsto a fixed rate of interest on the liability recognised in that period. Contingentrents are recognised in the periods in which they arise.
1.9.3 Financial income and expensesFinancial income and expenses consist of interest receivable on bank balancesand receivables, interest payable on loans, dividend income and exchange dif-ferences on loans.
Interest receivable on receivables and interest payable on liabilities arecalculated using the effective interest rate method. The effective interest rateis the rate of interest that makes the present value of all future inflows and out-flows over the life of the receivable or liability equal to its carrying amount. Theinterest component of finance lease payments is recognised in profit or loss byapplying the effective interest rate method. Interest receivable includes accruedtransaction costs and any discounts, premiums or other differences betweenthe original value of the receivable and the amount received at maturity.
Dividend income is recognised when the right to receive payment has beenascertained.
1.10 Financial instrumentsFinancial instruments recognised on the asset side of the balance sheetinclude cash and cash equivalents, trade receivables, shares and other equityinstruments, and derivatives. Included in equity and liabilities are trade pay-ables, issued debt and equity instruments, borrowings and derivatives.
A financial asset or financial liability is recognised in the balance sheet whenthe company becomes a party to the contractual terms of the instrument.Trade receivables are recognised in the balance sheet when an invoice hasbeen sent. Liabilities are recognised once the counterparty has performedand there is a contractual obligation to pay, even if an invoice has not yet beenreceived. Trade payables are recognised when an invoice has been received.
Note 1 cont’d
A N N U A L R E P O R T N O T E S

8 6
Å F A N N U A L R E P O R T 2 0 10
A N N U A L R E P O R T N O T E S
A financial asset is derecognised from the balance sheet when the rights inthe contract are transferred or expire or the company loses control over them.The same applies to parts of a financial asset. A financial liability is derecog-nised when the obligation in the contract is discharged or in some other wayextinguished. The same applies to parts of a financial liability.
Acquisitions and disposals of financial assets are recognised on the tradedate, which is the day when the company makes a binding commitment to buyor sell the asset.
The fair value of quoted financial assets is the asset’s quoted bid price atthe end of the reporting period. For further information, see Note 24.
1.10.1 Classification and valuationFinancial instruments that are not derivatives are recognised initially at anacquisition value equivalent to the fair value of the instrument with the additionof transaction costs for all financial instruments except those in the financialassets category, which are recognised at fair value excluding transactioncosts. A financial instrument is classified on initial recognition on the basis ofthe purpose for which the instrument was acquired. The classification deter-mines how the financial instrument is to be valued after initial recognition, asdescribed below.
Derivative instruments are recognised initially at fair value, indicating thattransaction costs are charged to profit or loss for the period. Subsequent tothe initial recognition, derivative instruments are recognised in the mannerdescribed below. If a derivative instrument is used for hedging, to the extentthat this is effective, changes in value of the derivative instrument are recog-nised on the same line in the income statement as the hedged item. Even ifhedge accounting is not applied, increases or decreases in the value of thederivative are recognised as income or expense in the operating profit/loss orin net financial income/expense depending on the intention behind the use ofthe derivative and whether the use relates to an operating item or a financialitem. With hedge accounting, the ineffective part of the hedge is recognised inthe same way as changes in the value of a derivative which is not used forhedge accounting.
1.10.2 Loans and receivablesLoans and receivables are non-derivative financial assets with fixed or deter-minable payments and that are not quoted in an active market. These assetsare valued at amortised cost. Amortised cost is determined on the basis of theeffective interest rate calculated on the date of acquisition. Assets with a shortterm are not discounted.
Accounts receivable are recognised at the amount which it is estimated willbe received, i.e. after the deduction of bad debts and as the result of individualevaluation. Impairments of accounts receivable are recognised in operatingexpense.
Other receivables are classified as non-current receivables if the holdingperiod exceeds one year and if it is shorter than other receivables.
Cash and cash equivalents consist of cash, immediately accessible depositswith banks and similar institutions, and short-term liquid investments with amaturity of less than three months from the date of purchase, which are subjectto only an insignificant risk of changes in value.
1.10.3 Available-for-sale financial assetsThe category of assets described as “available-for-sale financial assets” in-cludes financial assets that are not classified in any other category or financialassets that the company initially chose to designate in this category. Holdingsof shares and participations that are not recognised as subsidiaries, associ-ates or joint ventures are recognised here. Assets in this category are valuedat fair value, with changes in value recognised in other comprehensive income,except for those due to impairment, interest on debt instruments and dividendincome, as well as exchange differences on monetary items, which are recog-nised in profit or loss. On derecognition of the asset, accumulated gains/lossespreviously recognised in other comprehensive income are recognised in profitor loss.
Financial investments constitute, depending on the intention with which theyare held, either non-current assets if the holding period is longer than one yearor current assets if the holding period is less than one year.
1.10.4 Other financial liabilitiesLoans and other financial liabilities, e.g. accounts payable, are included in thiscategory. The liabilities are valued at amortised acquisition value. Accountspayable have a short expected term and are valued without discounting attheir nominal amount.
Non-current liabilities have an expected term longer than one year, whilecurrent liabilities have a term shorter than one year.
Convertible debentures can be converted into shares by the counterpartyexercising an option to convert the instrument into shares. Convertible deben-tures are recognised as a compound financial instrument comprising a liabilitycomponent and an equity component. The fair value of the liability is calcu-lated by discounting future cash flows using the current market interest ratefor an equivalent liability without a conversion right. The value of the equityinstrument is calculated as the difference between the issue proceeds whenthe convertible debenture was issued and the fair value of the financial liabilityat the time of issue. Any deferred tax attributable to the liability on the date ofissue is deducted from the recognised value of the equity instrument. Thetransaction costs relating to the issue of a compound financial instrument areapportioned between the liability component and the equity component in thesame proportions as the issue proceeds. The interest cost is recognised inprofit or loss and calculated using the effective interest rate method.
Note 1 cont’d

8 7
Å F A N N U A L R E P O R T 2 0 10
1.11 Derivative instruments and hedgingÅF makes only limited use of derivatives to hedge future flows in foreign cur-rencies. Derivatives used for hedging future cash flows are recognised in thebalance sheet at fair value. The changes in value are recognised in other com-prehensive income until such time as the hedged flow affects profit or loss,upon which the accumulated changes in value of the hedging instrument arerecycled into profit or loss simultaneously with the profit or loss effects of thehedged transaction. Flows from both contracted and forecast transactionscan be hedged.
To meet the requirements for hedge accounting under IAS 39, there mustbe an unequivocal link to the hedged item. In addition, the hedging of the itemmust be effective, hedging documentation must have been prepared and it mustbe possible for effectiveness to be measured. Gains and losses on hedgingare recognised in profit or loss on the same date as gains and losses on thehedged items are recognised.
1.12 Tangible assets1.12.1 Owned assetsTangible assets are recognised as assets in the balance sheet if it is probablethat future economic benefits will flow to the company, and that the cost of theitem can be measured reliably. Tangible assets are recognised in the consoli-dated financial statements at cost less accumulated depreciation and anyimpairment losses. Cost is defined as the purchase price plus any additionalexpenses directly attributable to bringing the asset to the location and condi-tion necessary for it to be capable of operating in the intended manner. Exam-ples of directly attributable additional expenses included in cost are the costsof delivery and handling, installation, title deeds, consulting services and legalservices. The accounting policies for impairment are set out below.
Tangible assets which consist of parts with different useful lives are treatedas separate components of tangible assets.
The carrying amount of an asset is derecognised from the balance sheet onretirement or disposal or when no future economic benefits are expected toflow from the use or retirement/disposal of the asset. The gain or loss arisingon the disposal or retirement of an asset is the difference between the disposalproceeds and the carrying amount less direct costs to sell. The gain or loss isrecognised under other operating income/expenses.
Future expenditureFuture expenditure is added to the acquisition value only if it is probable thatfuture economic benefits that are attributable to the asset will flow to the com-pany, and the acquisition value can be measured reliably. All other futureexpenditure is recognised as an expense in the period in which it arises. Indetermining when an additional expenditure is to be added to the acquisitionvalue, the decisive factor is whether the expenditure relates to the replace-ment of identified components, or parts of such components, in which casethe expenditure is capitalised. In instances where a new component has beencreated, the expenditure is also added to the acquisition value. Any undepreci-ated carrying amount on replaced components or parts of components isretired and recognised as an expense when the replacement is carried out.Repairs are recognised as an expense as they are carried out.
Depreciation principlesLinear depreciation is applied over the estimated useful life of the asset. Landis not depreciated. The ÅF Group applies component depreciation, which meansthat the estimated useful life of the components forms the basis for depreciation.
1.12.2 Leased assetsLeased assets are accounted for in accordance with IAS 17. Leases are classi-fied as either finance leases or operating leases in the consolidated financialstatements. A lease is classified as a finance lease if it transfers substantiallyall the risks and rewards incidental to ownership to the lessee. Otherwise it isclassified as an operating lease.
Assets held under finance leases are recognised as assets in the consoli-dated balance sheet. The liability to make future lease payments is recognisedunder non-current and current liabilities. The leased assets are depreciated ona straight-line basis, while the lease payments are recognised as a financecharge and a reduction in the liability.
With operating leases, the lease payments are recognised as expense overthe lease term on a straight-line basis.
1.12.3 DepreciationDepreciation is charged on a straight-line basis over the estimated useful lifeof an asset. Estimated useful lives are:
IT equipment 3 years
Vehicles 5 years
Office equipment 5 years
Office furnishings 10 years
Buildings (business premises) 40–100 years
Business premises consist of a number of components with different usefullives. The primary division is between buildings and land. No depreciation isapplied to the land component, which is regarded as having an unlimited usefullife. The buildings, however, consist of many components with varying usefullives. The useful lives of these components have been assessed as varyingbetween 40 and 100 years.
The following main groups of components have been identified, which formthe basis for depreciation of buildings:
Structure and foundations 100 years
Outer surface finish; facades, roofs, etc. 67 years
Floors, doors and electrical installations 67 years
Installations; heating, water, sanitation,ventilation, lifts, etc. 40 years
The residual value and useful life of an asset are reviewed annually.
Note 1 cont’d
A N N U A L R E P O R T N O T E S

8 8
Å F A N N U A L R E P O R T 2 0 10
A N N U A L R E P O R T N O T E S
1.13 Intangible assets1.13.1 GoodwillGoodwill is the difference between the cost of a business combination (i.e. cor-porate acquisition, takeover, etc.) and the fair value of the assets acquired andliabilities and contingent liabilities assumed.
When it comes to goodwill arising on business combinations before 1 Janu-ary 2004, the Group has not applied IFRS retroactively; instead, the carryingamount on that date will continue to be the historical cost of acquisition in theconsolidated financial statements, net of impairment losses.
Goodwill is apportioned between cash-generating units and groups of cash-generating units, and is instead tested annually for impairment (see §1.14below). Thus goodwill is carried at cost less accumulated impairment losses.Goodwill arising on the acquisition of associates is included in the carryingamount of the investment in the associate.
Where the cost of a business combination is less than the net fair value ofthe assets acquired and liabilities and contingent liabilities assumed, the dif-ference is recognised immediately in the income statement.
1.13.2 Research and developmentExpenditure on research aimed at obtaining new scientific or technical knowl-edge is recognised as an expense as it is incurred.
Expenditure on development where research results or other knowledge isapplied to achieve new or improved products or processes is recognised as anasset in the balance sheet if the product or process is technically and commer-cially feasible and the company has sufficient resources to complete its devel-opment and then use or sell the intangible asset. The carrying amount includesthe cost of materials, direct payroll costs and indirect costs which can reason-ably and consistently be attributed to the asset. Other development expendi-ture is recognised in profit or loss as expense as it is incurred. Developmentexpenditure recognised in the balance sheet is carried at cost less accumu-lated amortisation and impairment losses.
1.13.3 Other intangible assetsOther intangible assets acquired by the Group are recognised at cost lessaccumulated amortisation (see below) and impairment losses (see §1.14below).
Costs incurred in respect of internally-generated goodwill and internally-generated trademarks are recognised in profit or loss as they are incurred.
1.13.4 Subsequent expenditureSubsequent expenditure on capitalised intangible assets is recognised as anasset in the balance sheet only if it increases the future economic benefitsfrom the specific asset to which it relates. All other expenditure is recognisedas an expense as it is incurred.
1.13.5 AmortisationAmortisation is recognised in profit or loss on a straight-line basis over theestimated useful life of the asset, unless its useful life is indefinite. Goodwilland intangible assets with an indefinite life are tested for impairment annuallyor as soon as there are indications that the asset in question has diminished invalue. Amortisable intangible assets are amortised from the date they becomeavailable for use. The estimated useful lives are as follows:
Capitalised development expenditure 1–3 yearsAcquired intangible assets 1–10 years
1.14 ImpairmentThe carrying amounts of the Group’s assets – with the exception of assetsheld for sale recognised in accordance with IFRS 5 and deferred tax assets –are tested at the end of each reporting period to assess whether there is anyindication of impairment. If there is any such indication, the asset’s recoverableamount is determined. The carrying amounts of the exceptions stated aboveare tested in accordance with the relevant standard.
1.14.1 Impairment tests for tangible and intangible assets and participationsin subsidiaries and associatesThe recoverable amount is the higher of fair value less costs to sell and valuein use. When calculating value in use, future cash flows are discounted at a dis-count rate which reflects the risk-free rate of interest and the risk associatedwith the specific asset. For an asset which does not generate cash flows thatare essentially independent of other assets, the value in use is calculated forthe cash-generating unit to which the asset belongs. The impairment loss isthe amount by which the asset’s carrying amount exceeds its recoverableamount. Impairment losses in respect of cash-generating units are allocated inthe first instance to goodwill and then to the other assets included in the uniton a pro rata basis.
In the case of goodwill, other intangible assets with an indefinite life andintangible assets not yet ready for use, the recoverable amount is calculatedannually.
1.14.2 Impairment tests for financial assetsAt the end of each reporting period, the company assesses whether there isobjective evidence that a financial asset or group of assets requires impair-ment. Objective evidence consists both of observable circumstances thathave arisen and which have a negative effect on the ability to recover theacquisition cost, and of significant and long-lasting reductions in the fair valueof an investment in an available-for-sale financial asset.
On the impairment of an equity instrument designated as an available-for-sale financial asset, accumulated losses already recognised in equity arereversed through profit or loss.
Note 1 cont’d

8 9
Å F A N N U A L R E P O R T 2 0 10
The recoverable amount of assets in the loans and receivables categorywhich are recognised at amortised cost is measured as the present value ofthe future cash flow discounted at the effective interest rate current on thedate on which the asset was first recognised. Assets with a short term are notdiscounted. Impairment is charged to profit or loss.
1.14.3 Reversal of an impairment lossAn impairment loss is reversed if there are indications that the impairmentrequirement no longer exists and there has been a change in the assumptionswhich formed the basis for the measurement of the recoverable amount.Impairment of goodwill is never reversed. A reversal is made only to the extentthat the carrying amount due to reversal should not be more than the depreci-ated historical cost would have been if the impairment had not been recognised.
Impairment of loans and receivables that has been recognised at amortisedcost is reversed if a subsequent increase in the recoverable amount can beattributed objectively to an event occurring after the impairment had beenmade.
Impairment losses on equity instruments designated as available-for-salefinancial assets that have already been recognised in profit or loss may notsubsequently be reversed via profit or loss. The impaired value is the valuefrom which subsequent revaluations are made, and these are recognised inother comprehensive income. Impairment losses on interest-bearing instru-ments designated as available-for-sale financial assets are reversed in profitor loss if the fair value increases and the increase can be attributed objectivelyto an event occurring after the impairment had been made.
1.15 DividendsDividends are recognised as a liability once they have been approved by thegeneral meeting.
1.16 Employee benefits1.16.1 Defined-contribution retirement benefit plansObligations to contribute to defined-contribution plans are recognised as anexpense in the income statement as they arise.
1.16.2 Defined-benefit retirement benefit plansThe ÅF Group’s obligations under defined-benefit plans are calculated sepa-rately for each plan by estimating the future benefits earned by employeesthrough their employment in both the current and prior periods. These benefitsare discounted to present value. The discount rate is the market yield at the endof the reporting period on a first-class corporate bond with a maturity corre-sponding to that of the Group’s retirement benefit obligations. Where there isno active market for such corporate bonds, the market yield on governmentbonds with a corresponding maturity is used instead. The calculations are per-formed by a qualified actuary using the projected unit credit method.
Actuarial assumptions represent the company’s best assessment of the dif-ferent variables which determine the costs involved in providing the benefits.Since actuarial assumptions are used, the actual outcome may differ from theestimated outcome, and the actuarial assumptions may change from oneperiod to another. These differences constitute actuarial gains and losses.They may be caused, for example, by a change in expected lifespans, changesin salaries, changes in the discount rate and differences between actual andestimated returns on plan assets. Actuarial gains and losses are recognised inother comprehensive income for the period in which they arise. The Group’snet liability, as shown in the balance sheet, for each defined-benefit plan is thepresent value of the obligations minus the fair value of the plan assets. If thevalue of the plan assets exceeds the amount of the obligations, a surplusarises, which is recorded as an asset under other non-current receivables.
When the benefits in a plan are improved, the proportion of the increasedbenefits attributable to the employees’ service in previous periods is recog-nised as an expense in profit or loss, allocated on a straight-line basis over theaverage period until the benefits are fully vested. If the benefits are fully vested,the expense is recognised immediately in profit or loss.
When there is a difference between how retirement benefit costs are deter-mined in the Group and in its constituent companies, a provision or receivableis recognised in respect of special employer’s contribution to reflect this dif-ference. The provision or receivable is not discounted to present value.
1.16.3 Share-related remunerationUnder the share savings programme adopted by the AGM, employees areeligible to receive performance-related matching shares for shares which theyhave themselves purchased under the programme. The total number of match-ing shares issued for each share purchased is dependent on the employeeremaining with the Group for three years after the investment date, the sharesconcerned not being sold and the achievement of other parameters stipulatedin advance. For these share programmes, salary expenses for matching sharesare recognised during the vesting period (3 years) based on the fair value ofthe shares on the date on which the employee purchased shares under the pro-gramme. When the shares are matched, social security contributions will bepaid in certain countries on the value of the benefit to the employee. During thevesting period, provisions are made for these estimated social security contri-butions. The buy-back of shares to meet obligations under outstanding shareprogrammes is recognised in equity.
1.16.4 Termination benefitsA provision is made for termination benefits only when the company is demon-strably committed to terminating employment before the normal date, orwhen the benefits are the result of an offer made in order to encourage volun-tary redundancy. In the event that the company is obliged to lay off membersof staff, a detailed plan is drawn up specifying as a minimum the location, func-tion and approximate number of employees involved, the benefits for each jobclassification or function, and the time at which the plan will be implemented.
Note 1 cont’d
A N N U A L R E P O R T N O T E S
9 0
Å F A N N U A L R E P O R T 2 0 10
A N N U A L R E P O R T N O T E S
1.17 ProvisionsA provision is recognised in the balance sheet when the Group has a presentlegal or constructive obligation as a result of a past event, and when it is prob-able that an outflow of economic resources will be required to meet this obliga-tion, and a reliable estimate of the amount of the obligation can be made.Where the effect of the point in time when payment takes place is significant,provisions are calculated by discounting expected future cash flows at a rateof interest before tax that reflects current market assessments of the timevalue of money and, where appropriate, the risks associated with the liability.
Provisions for restructuring are recognised once the Group has adopted adetailed and formal restructuring plan, and the work of restructuring haseither begun or been publicly announced. No provisions are made for futureoperating expenses.
1.18 TaxIncome taxes comprise current tax and deferred tax. Income taxes are recog-nised in profit or loss except where the underlying transaction is recognised inother comprehensive income, in which case the associated tax effect is alsorecognised in other comprehensive income.
Current tax is the tax payable or recoverable in respect of the current year,based on the tax rates enacted or substantively enacted as at the end of thereporting period, including adjustments of current tax in respect of prior periods.
Deferred tax is calculated using the liability method on the basis of tempo-rary differences between the carrying amount and tax base of assets and lia-bilities. The following temporary differences are disregarded: temporary dif-ferences arising on the initial recognition of goodwill; the initial recognition ofassets and liabilities which do not constitute business combinations and affectneither recognised nor taxable income at the time of the transaction; and tem-porary differences attributable to investments in subsidiaries and associates,in cases where the parent, investor or joint owner can exert some influenceover the point in time when the temporary differences will be reversed andwhen it is not anticipated that this reversal will take place in the foreseeablefuture. The valuation of deferred tax is based on how the carrying amounts ofassets and liabilities are expected to be realised or adjusted. Deferred tax iscalculated using the tax rates and tax rules enacted or substantively enactedas at the end of the reporting period.
Deferred tax assets in respect of deductible temporary differences andunused tax losses are recognised only to the extent that it is probable that theycan be utilised. The value of deferred tax assets is reduced when it is no longerdeemed probable that they can be utilised.
Any additional income tax arising on the payment of dividends is recognisedat the same time as the dividend is recognised as a liability.
1.19 Non-current assets held for saleA non-current asset is classified as held for sale if its carrying amount will berecovered primarily through sale and not through use.
When first classified as held for sale, non-current assets are recognised atthe lower of carrying amount and fair value less costs to sell.
1.20 Contingent liabilitiesA contingent liability is reported when there is a potential obligation relating topast events whose existence will be confirmed only by one or more uncertainfuture events, or when there is an obligation which is not recognised as a liabilityor provision because it is not probable that an outflow of resources will berequired, or the amount cannot be measured reliably.
1.21 Earnings per shareThe calculation of earnings per share is based on the consolidated profit orloss attributable to the parent’s shareholders and on the weighted averagenumber of shares outstanding during the year. In calculating earnings pershare after dilution, the profit or loss and the weighted average number ofshares are adjusted to take account of the effects of potential diluting ordinaryshares, which derive during the reporting period from matching shares in thesavings programme.
1.22 Parent accounting policiesThe parent has prepared its annual report in accordance with the SwedishAnnual Accounts Act (1995:1554) and the Swedish Financial Reporting Board’srecommendation RFR 2 (Accounting for Legal Entities). RFR 2 requires that theparent’s annual report applies all IFRS standards and interpretations approvedby the EU as far as is possible within the constraints of the Annual AccountsAct and the Pension Obligations Vesting Act (Tryggandelagen), and while takinginto account the relationship between reporting and taxation. The recommen-dation specifies which exceptions and supplements are to be made with respectto IFRS. The differences between the accounting policies of the Group andparent are presented below.
The accounting principles outlined below have been applied consistentlyto all periods presented in the parent’s financial statements.
Note 1 cont’d
9 1
Å F A N N U A L R E P O R T 2 0 10
Note 1 cont’d
Differences between accounting policies for the Group and the parent1.22.1 Subsidiaries and associatesShares in subsidiaries and associates are recognised in the parent using theacquisition method. Dividends received are recognised as income.
1.22.2 Tangible non-current assetsLeased assetsThe parent reports all leases on the basis of the rules for operating leases.
1.22.3 Intangible assetsResearch and developmentThe parent recognises all development expenditure as an expense in theincome statement.
1.22.4 Non-current assets held for saleThe parent applies IFRS 5 with the exceptions set out in RFR 2, 8–9. Underthe provisions of IFRS 5, assets held for sale are recognised separately in thebalance sheet, and discontinued operations are recognised separately in theincome statement. This does not, however, correspond to the layout in theSwedish Annual Accounts Act. The information referred to, along with otherinformation which must be disclosed under IFRS 5, is, therefore, presented inthe form of notes. In addition, the rules in IFRS 5 which prescribe that non-cur-rent assets held for sale are not to be depreciated are not applied. Deprecia-tion is calculated in accordance with the Swedish Annual Accounts Act.
1.22.5 Financial guaranteesThe parent’s financial guarantee contracts consist primarily of guarantees forthe benefit of subsidiaries and associates. Financial guarantees mean that thecompany has an obligation to recompense the holder of a debt instrument forlosses incurred due to the failure of a specified debtor to make full payment onthe due date in accordance with the terms of the contract. For the recognitionof financial guarantee contracts, the parent applies RFR 2, 72, which involves arelief compared with the provisions of IAS 39 in respect of financial guaranteecontracts issued for the benefit of subsidiaries and associates. The parent rec-ognises financial guarantee contracts as a provision in the balance sheet whenthe company has an obligation for which payment will probably be required tosettle the obligation.
1.22.6 Employee benefitsDefined-benefit retirement benefit plansThe parent applies a different basis for the calculation of defined-benefit plansto that set out in IAS 19. The parent complies instead with the provisions of thePension Obligations Vesting Act (Tryggandelagen) and the regulations of Finans-inspektionen, the Swedish financial supervisory authority, as this is a require-ment for tax deductibility. The most important differences relative to the pro-visions of IAS 19 are the way in which the discount rate is determined, thecalculation of defined-benefit obligations on the basis of current salary levelswithout making assumptions about future wage growth, and the recognition ofall actuarial gains and losses in the income statement as they arise.
1.22.7 TaxesThe parent reports untaxed reserves inclusive of deferred tax liabilities. In theconsolidated financial statements, untaxed reserves are apportioned betweena deferred tax liability and equity.
1.22.8 Group contributions and shareholder contributions for legal entitiesThe company reports Group contributions and shareholder contributions inaccordance with the statement issued by the Swedish Financial ReportingBoard. Shareholder contributions are recognised by the recipient in equity andcapitalised under shares and participations by the contributor net of impair-ment losses.
Group contributions are reported on a substance over form basis. Thismeans that Group contributions paid in order to minimise the Group’s overalltax liability are recognised in retained earnings net of their current tax effect.Group contributions comparable with dividends are treated as dividends. Thismeans that Group contributions received and their current tax effect are rec-ognised in profit or loss. Group contributions paid and their current tax effectare recognised in retained earnings. Group contributions comparable withshareholder contributions are recognised by the recipient in retained earningstaking account of the current tax effect. The contributor reports the Groupcontribution and its current tax effect as investment in participations in Groupcompanies, to the extent that impairment is not required.
A N N U A L R E P O R T N O T E S

9 2
Å F A N N U A L R E P O R T 2 0 10
A N N U A L R E P O R T N O T E S
Sweden Outside Sweden Total
By geographical area 2010 2009 2010 2009 2010 2009
Sales to external clients 2,928 3,069 1,406 1,609 4,334 4,678
Assets 2,170 2,440 1,780 1,143 3,950 3,583
Operating segmentsThe Group’s operating structure and internal reporting to senior managementand the board is based on accounting by divisions. The aim is to classify thedivisions on the basis of their clients and their own expertise. Intra-group salesbetween segments are based on an internal market price, calculated on anarms-length basis, i.e. as between parties who are mutually independent,well-informed and with an interest in completing the transactions.
All of the Group’s operating assets and liabilities have been placed directlyin divisions or allocated by division. The accounting policies governing operatingsegments are the same as those applied in the Group in general. There are noindividual clients whose sales amount to 10 percent or more of the Group’stotal sales.
2 Segment reporting
Energy Industry Infrastructure Technology Inspection Others & elim. Group
2010 2009 2010 2009 2010 2009 2010 2009 2010 2009 2010 2009 2010 2009
Income
Sales to external clients 1,000 1,179 1,297 1,346 1,210 1,128 715 617 89 402 24 7 4,334 4,678
Other operating income 2 2 1 2 0 9 0 0 0 0 458 — 462 14
Sales between segments 11 11 41 39 23 31 4 19 0 5 –80 –105 — —
Total income 1,012 1,192 1,340 1,387 1,233 1,168 719 636 89 407 402 –98 4,796 4,692
Operating expenses –913 –1,051 –1,215 –1,251 –1,155 –1,056 –648 –600 –86 –368 78 83 –3,939 –4,242
Depreciation and impairment of intangibleassets –4 –4 –1 –2 –1 –1 –1 –1 0 –2 –2 0 –10 –10
Depreciation and impairment of tangibleassets –12 –11 –4 –4 –8 –9 –2 –2 –2 –9 –14 –18 –41 –52
Operating profit/loss 83 127 120 130 69 102 69 34 0 29 465 –32 806 388
Operating margin, % 8.2 10.6 9.0 9.4 5.6 8.7 9.6 5.3 0.0 7.0 16.8 8.3
Assets and liabilities
Intangible assets 664 566 579 506 330 139 99 72 — 84 5 3 1,677 1,370
Tangible assets 177 173 12 12 27 17 10 9 — 32 67 91 293 333
Other assets 713 1,153 575 400 566 497 371 279 — 113 –244 –562 1,981 1,880
Total assets 1,553 1,892 1,166 918 923 653 481 360 — 228 –173 –468 3,950 3,583
Equity 96 537 71 509 175 322 191 112 — 90 1,827 257 2,361 1,827
Total liabilities 1,457 1,355 1,096 409 747 331 289 248 — 139 –2,000 –726 1,590 1,756
The historical figures above are adjusted, proforma, to reflect the organisational changes implemented on 1 January and 1 October 2010.

9 3
Å F A N N U A L R E P O R T 2 0 10
3 Sale of business operations
Net assets of companies disposed of on date of disposal2010 2009
Intangible assets 15.9 —
Tangible assets 30.3 1.0
Financial assets 4.1 —
Accounts receivable and other receivables 85.5 11.1
Cash and cash equivalents 10.8 1.9
Accounts payable and other liabilities –60.7 –6.6
Net identifiable assets and liabilities 85.9 7.4
Consolidated goodwill 68.1 9.7
Adjustment for capital gain or loss 488.9 7.3
Adjustment for realised translation differences –0.4 –0.9
Selling price 642.5 23.4Deduct:
Cash balance (disposed) 10.8 1.9
Selling expenses 7.2 1.6
Net cash inflow 624.5 19.9
Disposals in 2010 refer to ÅF-Kontroll AB and ÅF-TÜV Nord AB.Disposals in 2009 refer to ÅF-Brekke & Strand Akustikk AS and ITP-InfraTrans Project Ltd.
4 Business combinations
Acquisitions 2010In 2010, ÅF acquired FastTech, Meacont s.r.o, VVS Energi i Borås AB, VPC Min-ing i Skellefteå, Gatubolaget Konsult i Göteborg, Platom AB, Energo AB andMercados EMI S.A. The total number of employees in the companies/businessoperations acquired was 555. For further details about the business opera-tions of the companies acquired, please see page 67.
The acquisitions of FastTech, VPC Mining i Skellefteå and Gatubolaget Kon-sult i Göteborg took the form of acquisitions of business operations. In theother companies, all shares were acquired.
Effects of acquisitionsThe table below shows the effect of the acquisitions on the consolidatedassets and liabilities. The acquisition analyses are provisional since the assetsof the acquired companies have not yet been finally analysed.
The consideration on reported acquisitions was greater than the carryingamount of the assets in the acquired companies, as a result of which the acqui-sition analysis gave rise to intangible assets. On the acquisition of a consultingfirm, the primary acquisition is, in fact, human capital in the expertise of thestaff, for which reason the majority of the assets of the acquired company areattributable to goodwill. The other intangible assets identified in the acquisi-tion consist mainly of orders on hand and customer relationships.
Net assets of Energo as per acquisition dateIdentifiableassets andliabilities
Fairadjustment
value
Fair valuerecognised
in Group
Intangible assets 1.0 27.0 28.0
Tangible assets 9.3 — 9.3
Accounts receivable and other receivables 79.4 — 79.4
Cash and cash equivalents 3.9 — 3.9
Non-current provisions –4.5 –7.1 –11.6
Interest-bearing liabilities –44.2 — –44.2
Accounts payable and other liabilities –43.0 — –43.0
Net identifiable assets and liabilities 1.9 19.9 21.8Consolidated goodwill 237.8
Consideration paid, cash 259.6
Deduct:
Cash (acquired) 3.9
Net cash outflow 255.7
Net assets of other acquired companies as per acquisition dateIdentifiableassets andliabilities
Fairadjustment
value
Fair valuerecognised
in Group
Intangible assets 2.1 8.9 11.0
Tangible assets 7.9 — 7.9
Accounts receivable and other receivables 58.7 — 58.7
Cash and cash equivalents 10.7 — 10.7
Non-current provisions –0.1 –1.6 –1.7
Interest-bearing liabilities –19.9 — –19.9
Accounts payable and other liabilities –32.4 — –32.4
Net identifiable assets and liabilities 27.0 7.3 34.3Consolidated goodwill 158.8
Acquisition cost including estimatedconsideration 193.1
Deduct:
Cash (acquired) 10.7
Estimated additional consideration 62.2
Additional:
Part of additional considerationallocated as blocked funds 15.2
Net cash outflow 135.4
A N N U A L R E P O R T N O T E S

9 4
Å F A N N U A L R E P O R T 2 0 10
A N N U A L R E P O R T N O T E S
8 Employees and personnel costsTotal remuneration is included in profit or loss under the heading “Personnelcosts”.
Average number of employees by gender2010 2009
Women Men Women Men
ParentSweden 50 20 50 22
SubsidiariesSweden 459 2,268 457 2,488
Finland 33 181 41 190
Norway 28 101 28 112
Denmark 13 89 13 74
Switzerland 49 158 44 155
Czech Republic 10 89 10 79
Russia 163 121 145 115
Estonia 6 28 7 29
Lithuania 9 23 12 32
India 4 36 3 35
Others 5 24 11 30
Group total 829 3,137 821 3,361
Total average number of employees 3,966 4,182Total for associates 38 54
Total average number ofemployees including associates 4,004 4,236
5 Other operating income
Group 2010 2009
Gain on disposal of business operations 457.9 7.8
Other 3.9 6.3
461.8 14.1
Other operating income of SEK 104.5 million in the parent relates to the invoic-ing of rental charges to subsidiaries.
6 Research and development
The ÅF Group’s costs for research and development totalled SEK 20.7 million(2009: SEK 41.5 million). The amount comprises mostly costs for time spenton research and development projects by ÅF’s own salaried employees.
Note 4 cont’d
Total of net assets of acquired companies as per acquisition dateIdentifiableassets andliabilities
Fairadjustment
value
Fair valuerecognised
in Group
Intangible assets 3.1 35.9 39.0
Tangible assets 17.2 17.2
Accounts receivable and other receivables 138.1 138.1
Cash and cash equivalents 14.6 14.6
Non-current provisions –4.6 –8.7 –13.3
Interest-bearing liabilities –64.1 –64.1
Accounts payable and other liabilities –75.4 –75.4
Net identifiable assets and liabilities 28.9 27.2 56.1Consolidated goodwill 396.6
Acquisition cost including estimatedconsideration 452.7
Deduct:
Cash (acquired) 14.6
Estimated additional consideration 1) 62.2
Additional:
Part of additional considerationallocated as blocked funds 15.2
Net cash outflow 391.11) The agreed additional consideration in the acquired companies relates to the perform-ance of the respective companies over the next two to three years. The total additionalconsideration for the acquired companies will not exceed SEK 83 million.
If the above acquisitions had been completed on 1 January 2010, consolidatedincome would have been SEK 5,243 million and operating profit SEK 831 millionas at 31 December 2010.
Acquisitions 2009Through business acquisitions during 2009, ÅF acquired industrial consultingoperations in Gothenburg from Industrikonsult i Göteborg AB, as well as engi-neering operations in Malmö from Etteplan Industry AB. The total acquisitioncost was SEK 2.2 million.
7 Fees and remuneration of auditorsGroup Parent
2010 2009 2010 2009
AccountantsErnst & YoungAudit assignments 3.1 3.6 0.7 0.7
Tax advice 0.1 0.3 0.1 0.2
Other assignments 0.8 1.4 0.6 0.1
4.1 5.3 1.4 0.9Other accounting companiesAudit assignments 0.3 0.6 — —
Tax advice 0.1 0.4 0.1 0.1
Other assignments 0.3 0.3 — —
0.7 1.3 0.1 0.1
“Audit assignments” refer to the auditing of the annual report, the accountingrecords and the administration by the Board of Directors and the ManagingDirector, other duties which it is incumbent upon the company’s auditors tocarry out, as well as advice and other assistance stemming from observationsmade during such audits or the execution of such other duties.

9 5
Å F A N N U A L R E P O R T 2 0 10
Gender distribution – directors and senior managementWomen, %
Group 2010 2009
Directors 38 38
Senior management 20 20
Salaries, other remuneration and payroll overheads
2010 2009
Salariesand remun-
erationsSocialcosts
Salariesand remun-
erationsSocialcosts
ParentBoard of Directors and seniorexecutives 22.0 12.7 23.8 12.0
(of which annual variableremuneration) 3.8 — 5.6 —
(of which pension expenses) 1) — 5.7 — 4.6
Other employees 1,779.2 644.0 1,872.6 693.4
(of which annual variableremuneration) 53.7 — 49.5 —
(of which, pension expenses) 1) — 228.2 — 238.0
1,801.2 656.7 1,896.4 705.41) Including statutory charges.
Other personnel costs total SEK 70.8 million (2009: SEK 70.2 million).
2010 2009
Salariesand remun-
erationsSocialcosts
Salariesand remun-
erationsSocialcosts
ParentBoard of Directors andPresident/CEO 7,2 4,0 7,6 3,5
(of which annual variableremuneration) 1,3 — 2,5 —
(of which pension expenses) 1) — 1,7 — 1,1
Other employees 32,8 16,9 35,5 19,0
(of which annual variableremuneration) 2,2 — 3,4 —
(of which, pension expenses) 1) — 7,6 — 8,8
40,0 20,9 43,1 22,51) Including statutory charges.
Note 8 cont’d
In addition, it was resolved to pay fees for committee work of SEK 35,000to each committee member who is not employed in the Group, and that a feeof SEK 75,000 be paid to the Chair of the Audit Committee and a fee of SEK50,000 to be paid to the Chair of the Remuneration Committee. The total remu-neration payable to the board is thus SEK 1,890,000, of which SEK 1,625,000is for the ordinary work of the board and SEK 265,000 for committee work.
Remuneration to the Board in 2010Remuneration to the board is payable quarterly. This means that the remuner-ation to the board was at the rate determined by the AGM in 2009 for the firsttwo quarters and at the rate determined by the AGM in 2010 for the remainingtwo quarters of the year.
During 2010 a total of SEK 1,802,500 (2009: SEK 1,715,000) was recog-nised as an expense for remuneration to the board in the parent accounts.In addition, the employee representatives on the board received a total ofSEK 40,000 (SEK 40,000).
No agreements have been signed concerning future pensions or severancepay for the Chairman or other members of the board.
Information relating to remuneration to members of the board in 2010
Remuneration in SEKDirector Board Committee Total
Ulf Dinkelspiel 400,000 85,000 485,000
Patrik Enblad 175,000 — 175,000
Eva-Lotta Kraft 175,000 35,000 210,000
Björn O. Nilsson 87,500 — 87,500
Jon Risfelt 175,000 35,000 210,000
Helena Skåntorp 175,000 75,000 250,000
Anders Snell 175,000 — 175,000
Lena Treschow Torell 175,000 35,000 210,000
Total 1,537,500 265,000 1,802,500
Information relating to remuneration to members of the board in 2009Remuneration in SEKDirector Board Committee Total
Ulf Dinkelspiel 400,000 85,000 485,000
Patrik Enblad 175,000 — 175,000
Eva-Lotta Kraft 175,000 35,000 210,000
Jon Risfelt 175,000 17,500 192,500
Helena Skåntorp 175,000 75,000 250,000
Anders Snell 87 500 — 87 500
Lena Treschow Torell 175,000 35,000 210,000
Magnus Grill 87,500 17,500 105,000
Total 1,450,000 265,000 1,715,000
President/CEOAnnual variable remuneration is based on the Group’s results, as well as a numberof preset targets, and may amount to a maximum of 65 percent of fixed basicsalary. The fixed basic salary of the President/CEO for 2010 was SEK 3.9 million(2009: SEK 3.3 million). The President/CEO also has the use of a company car.
Remuneration to senior executivesSee page 69 for guidelines for remuneration of senior executives.
Remuneration to the Board approved by the 2010 AGMThe AGM on 5 May 2010 approved remuneration totalling SEK 1,625,000 forthe work of the board in 2010. The Chairman received SEK 400,000 and mem-bers of the board not employed in the Group received SEK 175,000 each.
A N N U A L R E P O R T N O T E S

9 6
Å F A N N U A L R E P O R T 2 0 10
A N N U A L R E P O R T N O T E S
Note 8 cont’d
For members of the senior management team, the period of notice from thecompany’s side is normally 12months. Full salary continues to be payable duringtheperiod of notice. From the individual’s side, a period of sixmonths’ notice applies.
One of the members of the ÅF Group’s senior management team has retire-ment benefit conditions in line with the ITP occupational pension plan. Othershave defined-contribution retirement benefits, towards which an amount equi-valent to 27.5 to 30 percent of basic salary is allocated annually.
Determination of remunerationThe level of remuneration paid to the President/CEO for financial year 2010was set by the Board of Directors following a proposal drafted by the board’sRemuneration Committee. Remuneration paid to other senior executives wasset by the President/CEO in consultation with the Remuneration Committee.
Annual variable remunerationWithin ÅF’s divisions, there are different systems of variable remuneration forco-workers. Remuneration may either be based on the division’s performanceor linked directly to individual performance.
To demonstrate clearly the crucial importance of the efforts of co-workersto the Group’s results in both the long and the short term, a Group bonus hasbeen introduced. The model is based on part of profit that is generated atGroup level being shared out in the form of bonus payments that are the samefor co-workers in all parts of the Group.
Non-current variable remunerationPerformance-related share savings programmeGeneral conditionsPerformance-related share savings programmes were introduced for keymembers of staff in 2008, 2009 and 2010.
The aim of the three programmes is to encourage continued loyalty andexcellent performance, and also to make the ÅF Group even more attractive asan employer.
To participate in the programmes, employees must invest their own money.Employees who participate in the performance-related share savings pro-grammes for 2008, 2009 and 2010 may save an amount equivalent to a maxi-mum of 5 percent of their fixed salaries. Senior managers, including the seniormanagement team, have been selected and allocated four, five or six shares(matching shares) for every share they buy under the programme. To qualifyfor performance matching, the individual concerned must also have beenemployed during the entire three-year period from the beginning of the respec-tive programme.
A condition for performance matching is that ÅF’s average annual percent-age increase in earnings per share meets certain targets. (See the table foreach share savings programme.) The base value for the calculation of theincrease in earnings per share is the total of earnings per share for the fourquarters immediately preceding the implementation of a new share savingsprogrammes.
Before the number of performance shares for matching is finally deter-mined, the Board of Directors will consider whether performance matching isreasonable with regard to the company’s financial performance and position,and the situation on the stock market and in general. Should the board con-clude that full matching is not appropriate, it may reduce the number of per-formance shares to a number it deems appropriate.
The performance targets may not be revised after the end of the three-yearperiod. If the minimum performance has not been achieved, no performancematching shares will be issued.
The expense is arrived at by periodising a straight-line estimated expenseover three years.
Specific conditions2008 and 2009The terms for performance matching are also based on the company’s operat-ing margin before extraordinary items in relation to a basket of comparablecompanies.
2010In addition to performance matching, employees will be allocated a number ofclass B shares free of charge, equivalent to the number saved.
The period of notice for the President/CEO of the parent is two years fromthe company’s side. From the President/CEO’s side, a period of six months’notice applies. The retirement age for the President/CEO is 60. The Presi-dent/CEO’s retirement benefit plan is defined-contribution, and an annual pro-vision equivalent to 35 percent of the year’s basic salary is made for this. Fullsalary continues to be payable during the period of notice. An obligation towork during the period of notice may apply for a maximum of one year.
ÅF Group senior management, excluding the President/CEOThe ÅF Group senior management team consists of nine (2009: nine) individualsexcluding the President/CEO.
Annual variable remuneration may amount to a maximum of 60 percent offixed basic salary. Members of the ÅF Group senior management team havethe use of company cars.
Cost of remuneration of the President/CEO and other senior management
2010 2009
President/CEOOther seniormanagement Total President/CEO
Other seniormanagement Total
Salaries 3.9 12.0 15.9 3.3 11.8 15.1Provisions for annual variable remuneration earnedduring the current year 1.3 2.5 3.8 2.5 3.1 5.6
Provisions for non-current variable remuneration 0.1 0.4 0.5 0.1 1.3 1.4
Pension expenses 1) 1.7 4.0 5.7 1.1 3.5 4.6
Other social security expenses 1.7 4.7 6.4 1.8 5.0 6.9
Total 8.7 23.5 32.3 8.8 24.6 33.51) Including statutory charges.

9 7
Å F A N N U A L R E P O R T 2 0 10
9 Other operating expenses
Group 2010 2009
Exchange losses 13.1 7.6
13.1 7.6
Other operating expenses of SEK 110.5 million in the parent relate to rentalcharges.
10 Net financial income/expense
Group 2010 2009
Interest income 1) 11.0 4.8
Profit on sale of investments in securities, etc. — 0.0
Exchange gains 2.5 7.4
Financial income 13.5 12.2
Interest expense 1) –10.3 –13.8
Net loss on the disposal of financial assetsheld for sale — –0.1
Exchange losses –11.0 –9.7
Financial expense –21.3 –23.5
Net financial expense –7.7 –11.3
Parent 2010 2009
Interest income, Group companies 0.1 7.7
Interest income 1.5 0.1
Gain on disposals of Group companies and associates 500.8 —
Exchange gains 0.4 0.4
Dividends from Group companies and associates 413.0 3.7
Financial income 915.8 11.9
Interest expense, Group companies –0.6 –2.5
Interest expense 1) –5.6 –6.6
Impairment of shares in Group companies –131.6 —
Exchange losses –1.0 –1.4
Financial expense –138.8 –10.4
Net financial income 777.0 1.4
1) Includes interest on pension provisions.
Note 8 cont’d
Absence from work due to sickness Parent
Figures in percent 2010 2009
Total sick leave as a percentage of ordinaryworking time 2.9 2.3
Portion of total sick leave comprising absencesof 60 consecutive days or more 1.2 0.7
Sick leave as a percentage of total ordinaryworking time for each of the following groups:By gender:
Men 0.9 0.6
Women 3.7 3.1
By age:
29 years old or below 1.0 0.7
30–49 years 1.2 3.0
50 years or above 6.0 2.0
A N N U A L R E P O R T N O T E S
Share savings programme (PSP)
2008 2009 2010 Total
Base value earnings per share,SEK 1) 8.41 8.70 7.08
Target for annual averageincrease in earnings per share, % 5–30 5–15 5–15
Number of participants in theallocation 100 110 98
Allocation of matching shares,number 2) 0–4 0–4 0–4
0–5 0–5 0–5
0–6 0–6 0–6
Allocation of number of freeshares per share saved — — 1
Maximum number of matchingshares 204,000 138,000 189,000 531,000Maximum dilution of earnings pershare, % 0.6 0.4 0.6 1.6Provision for the year, MSEK –2.1 0.8 4.5 3.2Accumulated provision, MSEK 0 2.4 4.5 6.9Minimum cost, MSEK 0 0 5.4 5.4Maximum cost, MSEK 21.4 19.7 28.3 69.4Savings period July 2008–
June 2009July 2009–June 2010
July 2010–June 2011
1) Total for four quarters up to 30 June of the plan year.2) Senior managers may have the right to performance matching of up to four shares, theGroup management team up to five shares and the President/CEO up to six shares foreach share purchased.

9 8
Å F A N N U A L R E P O R T 2 0 10
A N N U A L R E P O R T N O T E S
12 Earnings per share
Before dilution After dilution
SEK 2010 2009 2010 2009
Earnings per share 21.02 7.93 20.95 7.91
The calculation of the numerators and denominators used in the above calcula-tions of earnings per share is explained below.
A 2:1 share split was implemented on 2 June 2010. The comparative figureshave been adjusted.
Earnings per share before dilutionThe calculation of earnings per share for 2010 is based on the profit for the yearattributable to the parent’s ordinary shareholders amounting to SEK 709.9 mil-lion (2009: SEK 268.7 million) and on a weighted average number of outstandingshares that amounted to 33,775,002 during 2010 (2009: 33,898,072).
Weighted average number of outstanding ordinary shares,before dilution
2010 2009
Total number of ordinary shares 1 January 33,775,002 33,985,002
Effect of share buy-backs in 2009 — –86,930
Weighted average number of ordinaryshares during the year, before dilution 33,775,002 33,898,072
Earnings per share after dilutionIn calculating earnings per share after dilution, the weighted number of out-standing ordinary shares is adjusted for the dilution effect of all outstandingpotential ordinary shares. When calculating earnings per share after dilution,outstanding ordinary shares have been adjusted for a potential dilution effectfor shares in the outstanding share savings programme.
Profit attributable to the parent’s ordinary shareholders, after dilution2010 2009
Profit attributable to the parent’sordinary shareholders 709.9 268.7
Profit attributable to the parent’sordinary shareholders, after dilution 709.9 268.7
Weighted average number of outstanding ordinary shares,after dilution
2010 2009
Weighted average number of ordinaryshares during the year, before dilution 33,775,002 33,898,072
Effect of outstanding share savingsprogramme 106,701 94,286
Weighted average number of ordinaryshares during the year, after dilution 33,881,703 33,992,358
11 Appropriations
Parent 2010 2009
Difference between recognised depreciation/amortisation and depreciation/amortisationaccording to plan –2.7 –13.2
–2.7 –13.2
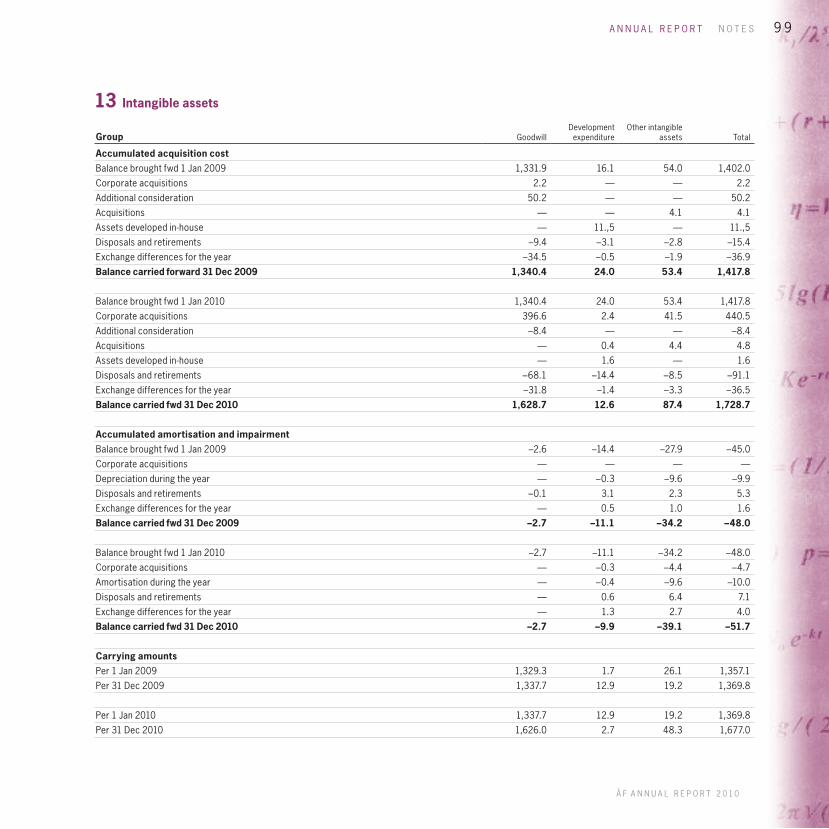
9 9
Å F A N N U A L R E P O R T 2 0 10
13 Intangible assets
Group GoodwillDevelopmentexpenditure
Other intangibleassets Total
Accumulated acquisition costBalance brought fwd 1 Jan 2009 1,331.9 16.1 54.0 1,402.0
Corporate acquisitions 2.2 — — 2.2
Additional consideration 50.2 — — 50.2
Acquisitions — — 4.1 4.1
Assets developed in-house — 11.,5 — 11.,5
Disposals and retirements –9.4 –3.1 –2.8 –15.4
Exchange differences for the year –34.5 –0.5 –1.9 –36.9
Balance carried forward 31 Dec 2009 1,340.4 24.0 53.4 1,417.8
Balance brought fwd 1 Jan 2010 1,340.4 24.0 53.4 1,417.8
Corporate acquisitions 396.6 2.4 41.5 440.5
Additional consideration –8.4 — — –8.4
Acquisitions — 0.4 4.4 4.8
Assets developed in-house — 1.6 — 1.6
Disposals and retirements –68.1 –14.4 –8.5 –91.1
Exchange differences for the year –31.8 –1.4 –3.3 –36.5
Balance carried fwd 31 Dec 2010 1,628.7 12.6 87.4 1,728.7
Accumulated amortisation and impairmentBalance brought fwd 1 Jan 2009 –2.6 –14.4 –27.9 –45.0
Corporate acquisitions — — — —
Depreciation during the year — –0.3 –9.6 –9.9
Disposals and retirements –0.1 3.1 2.3 5.3
Exchange differences for the year — 0.5 1.0 1.6
Balance carried fwd 31 Dec 2009 –2.7 –11.1 –34.2 –48.0
Balance brought fwd 1 Jan 2010 –2.7 –11.1 –34.2 –48.0
Corporate acquisitions — –0.3 –4.4 –4.7
Amortisation during the year — –0.4 –9.6 –10.0
Disposals and retirements — 0.6 6.4 7.1
Exchange differences for the year — 1.3 2.7 4.0
Balance carried fwd 31 Dec 2010 –2.7 –9.9 –39.1 –51.7
Carrying amountsPer 1 Jan 2009 1,329.3 1.7 26.1 1,357.1
Per 31 Dec 2009 1,337.7 12.9 19.2 1,369.8
Per 1 Jan 2010 1,337.7 12.9 19.2 1,369.8
Per 31 Dec 2010 1,626.0 2.7 48.3 1,677.0
A N N U A L R E P O R T N O T E S

1 0 0
Å F A N N U A L R E P O R T 2 0 10
A N N U A L R E P O R T N O T E S
Note 13 cont’d
Parent Intangible assets
Accumulated acquisition costBalance brought fwd 1 Jan 2009 —
Acquisitions 3.7
Balance carried fwd 31 Dec 2009 3.7
Balance brought fwd 1 Jan 2010 3.7
Acquisitions 3.1
Balance carried fwd 31 Dec 2010 6.8
Accumulated amortisation and impairmentBalance brought fwd 1 Jan 2009 —
Amortisation during the year –0.4
Balance carried fwd 31 Dec 2009 –0.4
Balance brought fwd 1 Jan 2010 –0.4
Amortisation during the year –1.7
Balance carried fwd 31 Dec 2010 –2.1
Carrying amountsPer 1 Jan 2009 —
Per 31 Dec 2009 3.3
Per 1 Jan 2010 3.3
Per 31 Dec 2010 4.7
The carrying amount of goodwill is allocated as follows:
Division 2010Proforma
2009
Energy 649.8 556.6
Industry 571.0 504.0
Infrastructure 320.5 137.0
Technology 84.7 71.1
Inspection (ÅF-Kontroll) — 69.0
Total 1,626.0 1,337.7
GroupThe Group’s intangible assets arise primarily from business combinations.These acquired intangible assets consist largely of goodwill, since the mainvalue of consulting companies lies in their human capital, the expertise of theirco-workers. Other intangible assets identified in connection with the acquisi-tions include the outstanding orders, customer lists and reference projects.The useful life of these other intangible assets is 1 to 10 years.
Goodwill and other intangible assets have been allocated to the lowestidentifiable cash-generating unit which corresponds to company-specificinvestments in the appropriate division. Impairment tests on goodwill andother intangible assets are carried out annually, during Q4 or when there areindications that an impairment need has arisen, by discounting the anticipatedfuture cash flow by a weighted average cost of capital per cash-generatingunit. The present value of the cash flows, the value in use, is compared with thecarrying amount including goodwill and other intangible assets.
In calculating the value in use of the cash-generating units, a number ofassumptions on future circumstances and estimates of parameters have beenmade. Changes in these assumptions and estimates would affect the carryingamount of goodwill.
The forecasts of future cash flows used are based on the forecast made bysenior management for the next year, supplemented by an individual assess-ment of a further four years. From that point onwards the calculation is basedon an annual growth rate of 2 percent.
The weighted average cost of capital is based on assumptions about aver-age interest rates on 10-year government bonds, as well as company-specificrisk factors and beta values. The Group’s average cost of capital, the discountrate, for 2010 has been calculated at 13 percent (2009: 11 percent) before taxand 10 percent (8 percent) after tax. The forecast cash flows have been dis-counted to present value. The test concluded that no impairment need hasarisen since the value in use exceeds the carrying amount including goodwilland other intangible assets. It is the opinion of the company management thatno reasonably likely changes in important assumptions for cash-generatingunits would lead to an impairment need.
The discount rate varies between cash-generating units as shown in thefollowing table.
CountryDiscount ratebefore tax, %
Discount rateafter tax, %
Long-termannual
growth, %
Baltic countries 14.0 10.5 2
Denmark 13.0 9.8 2
Finland 13.0 9.8 2
Norway 13.0 9.8 2
Russia 16.0 12.0 2
Switzerland 13.0 9.8 2
Sweden 12.7 9.5 2
Czech Republic 14.0 10.5 2
Germany 13.0 9.8 2
At the end of 2010, goodwill amounted to SEK 1,626.0 million (2009: SEK1,337.7 million).

1 0 1
Å F A N N U A L R E P O R T 2 0 10
14 Tangible assets
Group
Equipment,tools, fixtures
and fittingsLand andbuildings Total
Acquisition costsBalance brought fwd 1 Jan 2009 339.8 177.2 517.0
Corporate acquisitions — — —
Acquisitions 64.3 2.7 67.0
Disposals and retirements –49.2 — –49.2
Exchange differences –2.4 –9.4 –11.9
Balance carried fwd31 Dec 2009 352.4 170.5 523.0
Balance brought fwd 1 Jan 2010 352.4 170.5 523.0
Corporate acquisitions 32.1 6.6 38.7
Acquisitions 34.7 0.1 34.8
Disposals and retirements –212.4 –6.3 –218.6
Exchange differences –8.0 6.4 –1.6
Balance carried fwd31 Dec 2010 198.8 177.4 376.2
Depreciation and impairmentBalance brought fwd 1 Jan 2009 –172.0 –6.4 –178.4
Corporate acquisitions — — —
Depreciation during the year –47.4 –4.3 –51.7
Disposals and retirements 38.2 — 38.2
Exchange differences 1.5 0.4 1.9
Balance carried fwd31 Dec 2009 –179.7 –10.3 –190.0
Balance brought fwd 1 Jan 2010 –179.7 –10.3 –190.0
Corporate acquisitions –19.8 –1.6 –21.4
Depreciation during the year –36.5 –4.2 –40.8
Disposals and retirements 161.3 1.3 162.6
Exchange differences 6.6 –0.5 6.1
Balance carried fwd31 Dec 2010 –68.1 –15.4 –83.5
Carrying amountsPer 1 Jan 2009 167.8 170.8 338.6
Per 31 Dec 2009 172.8 160.2 332.9
Per 1 Jan 2010 172.8 160.2 332.9
Per 31 Dec 2010 130.7 162.0 292.7
GroupFinance leasesEquipment held under finance leasing agreements is included in the Group atthe carrying amount of SEK 11.0 million (2009: SEK 33.2 million). The differ-ence between the years is attributable chiefly to the sale of ÅF-Kontroll.
Current and non-current liabilities in the consolidated balance sheet includefuture payments in respect of leasing obligations entered as liabilities. Seealso Note 19 “Liabilities to credit institutions”.
ParentEquipment, tools,
fixtures and fittings
Acquisition costsBalance brought fwd 1 Jan 2009 88,2
Acquisitions 9,9
Disposals and retirements —
Balance carried fwd 31 Dec 2009 98,1
Balance brought fwd 1 Jan 2010 98,1
Acquisitions 6,8
Disposals and retirements —
Balance carried fwd 31 Dec 2010 104,9
DepreciationBalance brought fwd 1 Jan 2009 –31,7
Depreciation during the year –8,9
Disposals and retirements —
Balance carried fwd 31 Dec 2009 –40,6
Balance brought fwd 1 Jan 2010 –40,6
Depreciation during the year –8,9
Disposals and retirements
Balance carried fwd 31 Dec 2010 –49,5
Carrying amountsPer 1 Jan 2009 56,5
Per 31 Dec 2009 57,5
Per 1 Jan 2010 57,5
Per 31 Dec 2010 55,4
A N N U A L R E P O R T N O T E S

1 0 2
Å F A N N U A L R E P O R T 2 0 10
A N N U A L R E P O R T N O T E S
The total earnings, profit, assets and liabilities of associates are specified in the tables below
Associates 2010 Country Earnings Profit Assets Liabilities Equity Ownership %
ÅF-Incepal S.A Spain 25.4 0.1 27.5 15.5 12.0 47
Associates 2009 Country Earnings Profit Assets Liabilities Equity Ownership %
ÅF-TÜV Nord AB Sweden 42.3 3.9 15.0 7.6 7.4 50
ÅF-Incepal S.A Spain 29.5 0.2 36.8 21.8 15.1 47
NDT Training Center AB Sweden 15.5 0.8 7.9 3.6 4.2 33
87.4 4.9 59.7 33.0 26.7
15 Participations in associates
Group Parent
2010 2009 2010 2009
Carrying amount at start of year 12.4 13.4 8.0 0.6
Acquisition of associates — — — 7.3
Sale of associates –3.4 –0.4 –0.6 —
Participations in the results of associates after tax 1) 2.1 1.6 — —
Dividend received –4.2 –1.9 — —
Translation difference –1.1 –0.3 — —
Carrying amount at end of year 5.9 12.4 7.3 8.01) The gain as a result of the sale of ÅF-TÜV Nord totalled SEK 31.0 million. The overall result with regard to associates was SEK 33.1 million (2009: SEK 1.6 million).

1 0 3
Å F A N N U A L R E P O R T 2 0 10
16 Financial investments
Group 2010 2009
Financial assets that are non-current assetsUnlisted shares and participations 0.7 0.8
Tenant-owner property holdings — 0.4
0.7 1.2
Specification of changes in carrying amounts for the year
Group 2010 2009
Carrying amount brought forward 1.2 1.3
Disposals/impairments –0.4 –0.1
Translation difference –0.1 0.0
Carrying amount carried forward 0.7 1.2
17 Prepaid expenses
Group Parent
2010 2009 2010 2009
Rent 33.4 25.9 26.4 22.0
Support and maintenancecontracts 2.5 4.3 0.6 0.7
Other 37.5 28.8 14.1 8.8
73.4 59.0 41.1 31.5
A N N U A L R E P O R T N O T E S

1 0 4
Å F A N N U A L R E P O R T 2 0 10
A N N U A L R E P O R T N O T E S
GroupThe total number of shares as at 31 December 2010 comprised 1,608,876class A shares (10 votes per share) and 32,450,126 class B shares (1 vote pershare). Holders of ordinary shares are entitled to dividends which are deter-mined in due course. All shares have the same right to the company’s remain-ing net assets. As a result of the share buy-back authorised by the Annual Gen-eral Meeting, ÅF AB held 284,000 of the company’s own class B shares on 31
December 2010. These shares do not participate in dividends. The dividendspaid out during 2010 and 2009 totalled SEK 135.1 million (SEK 4.00 per share)and SEK 110.2 million (SEK 3.25 per share) respectively. At the Annual Generalmeeting on 2 May 2011, a dividend in respect of financial year 2010 of SEK4.00 per share will be proposed, equivalent to a total pay-out of SEK 135.1 mil-lion. The proposed dividend has not been recognised in these financial reports.
The quota value of the share for 2010 is SEK 5 (2009: SEK 5). A 2:1 share splitwas implemented in June 2010. The comparative figures have been adjusted.
ReservesGroup
Translationreserve
Hedgingreserve
Totalreserves
Balance brought forward as at 1 Jan 2009 178.9 0.3 179.1Exchange differences for the year –56.4 –56.4
Cash flow hedges –0.4 –0.4
Tax 0.1 0.1
Balance carried forward as at 31 Dec 2009 122.4 — 122.4
Balance brought forward as at 1 Jan 2010 122.4 — 122.4Exchange differences for the year –42.2 –42.2
Cash flow hedges 2.1 2.1
Tax –0.4 –0.4
Balance carried forward as at 31 Dec 2010 80.2 1.7 81.9
Other contributed capitalThis refers to equity which has been contributed by the shareholders. It includespremium reserve transferred to statutory reserve as at 31 December 2005.Transfers to the premium reserve on and after 1 January 2006 are also recog-nised as contributed capital.
Translation reserveThe translation reserve includes all exchange differences arising on the transla-tion of financial reports from foreign operations with a functional currency otherthan the Group’s presentation currency. The presentation currency for both theparent and the Group is the Swedish Krona (SEK).
Hedging reserveThe hedging reserve includes the effective portion of the accumulated netchanges of fair value of a cash-flow hedging instrument attributable to hedgingtransactions which have not yet taken place.
PensionsPensions include actuarial gains and losses and the employer’s contribution onthese, which are recognised in other comprehensive income.
Profits brought forward including net profit for the yearProfits brought forward including net profit for the year include profits earnedby the parent and its subsidiaries and associates. Previous transfers to thestatutory reserve, excluding premium reserve transferred, are included in thisequity item.
ParentRestricted reservesRestricted reserves must not be reduced through dividends.
Statutory reserveThe purpose of the statutory reserve is to block a portion of net profits, whichare not to be used to cover losses brought forward. With effect from 2006, itis no longer obligatory to make transfers to the statutory reserve.
Non-restricted equityFair value reserveThe fair value reserve includes the effective proportion of the accumulated netchanges in fair value of a cash-flow hedging instrument attributable to hedgingtransactions which have not yet been entered into.
Premium reserveWhen shares are issued at a premium, i.e. when shareholders pay more thanthe quota value of the shares, an amount equivalent to the amount received inexcess of the quota value of the shares is transferred to the premium reserve.Premium reserves attributable to transactions before 1 January 2006 havebeen transferred to the statutory reserve. Premium reserves which arise afterthat date are recognised as non-restricted equity.
Profits brought forwardThese constitute non-restricted equity from previous years after any transferto reserves and after the payment of any dividends. Along with net profit forthe year and any reserve for fair value, these constitute total non-restrictedequity, i.e. the amount available for dividends to shareholders.
18 Equity

1 0 5
Å F A N N U A L R E P O R T 2 0 10
19 Liabilities to credit institutions
The note includes information on the company’s contractual terms in respectof interest-bearing liabilities.
Conditions and amortisation periods
Group Interest rate, %
Nom. amountin originalcurrency
Carryingamount Due, year Fair value
Long-term bank loans
Spain, EUR, variable interest 3.4 0.1 0.6 2013 0.6
0.6 0.6Short-term bank loans
Norway, NOK, variable interest 4.5 0.5 0.5 2011 0.5
Switzerland, CHF, fixed interest 3.3 2.0 14.5 2011 14.4
Switzerland, CHF, variable interest 0.9 4.0 28.9 2011 28.9
Switzerland, CHF, variable interest 0.6 3.0 21.7 2011 21.7
Spain, EUR, variable interest 2.9 1.1 10.3 2011 10.3
Sweden, SEK, variable interest 3.1 41.8 41.8 2011 41.8
Sweden, SEK, variable interest 1.9 50.0 50.0 2011 50.0
Sweden, SEK, variable interest 1.9 50.0 50.0 2011 50.0
Czech Republic, CZK, fixed interest 13.2 0.6 0.1 2011 0.1
Czech Republic, CZK, fixed interest 15.1 0.4 0.1 2011 0.1
218.0 217.9
For bank loans taken out by the parent, in all SEK 100 million, the following specific obligations apply:• Net debt/equity ratio may not exceed 4.5 times.• The interest coverage ratio may not fall below 2.5 times.• The equity/assets ratio may not fall below 25 percent.
Finance leasing liabilitiesFinance leasing liabilities fall due for payment as shown in the table below: 2010 2009
GroupMinimum
leasing fees InterestPrincipalamount
Minimumleasing fees Interest
Principalamount
Within 1 year 6.3 0.2 6.1 9.7 0.4 9.3
1–5 years 6.0 0.1 5.9 26.1 0.3 25.8
12.3 0.3 12.0 35.8 0.6 35.1
For more information on the company’s interest rate risk and exchange raterisk, please refer to Note 25.
GroupNon-current liabilities 2010 2009
Bank loans 0.6 13.9
Finance leasing liabilities 5.9 25.8
6.5 39.7Current liabilitiesShort-term bank loans 218.0 280.1
Current portion of finance leasing liabilities 6.1 9.3
224.1 289.4
ParentNon-current liabilities 2010 2009
Bank loans 1) 100.0 211.6
100.0 211.61) Current liabilities have a maturity of between 3 and 12 months from the end of thereporting period. ÅF AB has credit facilities totalling SEK 950 million.
A N N U A L R E P O R T N O T E S

1 0 6
Å F A N N U A L R E P O R T 2 0 10
A N N U A L R E P O R T N O T E S
20 Retirement benefit obligations
GroupDefined-benefit plans 2010 2009
Present value of funded obligations 713.9 678.2
Fair value of plan assets –713.1 –681.2
0.8 –3.0Present value of unfunded obligations 62.0 62.4
Net recognised in respect ofdefined-benefit plans 62.8 59.4
Recognised as assets — 3.0
Recognised as liabilities 62.8 62.4
Net 62.8 59.4
Defined-benefit plans exist in Sweden, Switzerland and Finland.
Changes in the fair value of plan assetsduring the year 2010 2009
At start of year 681.2 333.4
Assets acquired — 227.6
Expected return 23.7 13.1
Payments made 36.5 97.4
Payments disbursed –67.1 –20.3
Actuarial gains (+) and losses (–)recognised in other comprehensive income 12.2 48.4
Exchange differences 26.6 –18.5
At close of year 713.1 681.2
Changes in present value of obligationsduring the year 2010 2009
At start of year 740.6 437.2
Liabilities assumed — 227.6
Payments made 22.9 84.3
Payments disbursed –70.3 –23.2
Actuarial gains (–) and losses (+)recognised in other comprehensive income 16.5 4.2
Cost recognised in profit or loss 38.9 30.7
Exchange differences 27.3 –20.4
At close of year 775.9 740.6
Actuarial gains (–) and losses (+) recognisedin other comprehensive income 2010 2009
Recognised in other comprehensive incomeas at 1 January 4.7 50.6
Recognised during the year 4.3 –44.2
Exchange differences 0.0 –1.7
Recognised in other comprehensiveincome as at 31 December 9.0 4.7
Expenses in equity 2010 2009
Outcome-based adjustments to pension liability 0.7 0.2
Outcome-based adjustments to plan assets –12.2 –48.4
Effects of changes in actuarial assumptions 15.8 4.0
Actuarial gains (–) and losses (+) for the year, net 4.3 –44.2
Special employer’s contribution in respect ofactuarial gains and losses 0.1 0.1
Total cost (+)/income (–) for defined-benefitpayments recognised in equity 4.4 –44.1
Cost recognised in profit or loss 2010 2009
Current service cost 15.5 15.3
Expected yield –23.7 –13.1
Interest expense for the obligation 23.4 15.4
Total net cost in the income statement 15.2 17.6
The current service cost is included in the income statement under the headingPersonnel costs. Anticipated returns and interest expense on the obligation isrecognised under Net financial items. The cost of defined-benefit plans for 2011is expected to be on a par with the cost recognised in 2010.

Å F A N N U A L R E P O R T 2 0 10
1 0 7
Note 20 cont’d
Assumptions for defined-benefit obligationsThe most significant actuarial assumptions as at the end of the reportingperiod.
Sweden 2010 2009
Discount rate as at 31 December, % 3.9 4.0
Future increase in retirement benefits, % 2.0 2.0
Annual increase in paid-up policies, % 2.0 2.0
Anticipated remaining period of service, in years — —
Switzerland 2010 2009
Discount rate as at 31 December, % 2.80 3.25
Expected return on plan assets, % 4.84 3.66
Future increase in retirement benefits, % 0.0 0.0
Future increases in salaries, % 1.0 1.0
Expected remaining period of service, years 8.6 8.7
For some of the Group’s employees, the obligations in respect of retirementpension and family pension for salaried staff in Sweden are secured throughinsurance with Alecta. According to a statement from the Swedish FinancialReporting Board (UFR 3) this is a defined-benefit multi-employer plan. For finan-cial year 2010, the company has not had access to the information required torecognise this plan as a defined-benefit plan. The ITP supplementary pensionsplan for salaried employees’ retirement benefits that is secured through insur-ance with Alecta is, therefore, recognised as a defined-contribution plan.
Contributions during the year for retirement benefit insurance with Alectaamounted to SEK 103.3 million (2009: SEK 103.3 million). Alecta’s surplusmay be allocated to the insurance policy holder and/or the insured. At theclose of 2010 Alecta’s surplus in the form of the collective funding ratio was146 percent (2009: 141 percent). The collective funding ratio is the marketvalue of Alecta’s assets as a percentage of the insurance obligations calcu-lated in accordance with Alecta’s actuarial calculation assumptions, which arenot in conformity with IAS 19.
ParentDefined-benefit plans 2010 2009
Present value of unfunded obligations 1) 26.2 27.1
Net recognised in respect of defined-benefitplans 26.2 27.1
Of which covered by a credit insurance throughFPG/PRI 26.2 27.1
1) In accordance with Swedish principles for calculating pensions obligations.
Change in obligations during the year 2010 2009
Net present value of pension obligationsat start of year 27.1 27.2
Cost excluding interest expense charged to profit –0.2 0.7
Interest expense 1.3 1.1
Pensions paid –2.0 –1.8
Net present value of pension obligationsat end of year 26.2 27.1
Expense recognised in profit or loss 2010 2009
Revaluation of bonus supplement — 0.8
Other –0.2 –0.2
Interest expense on obligations 1.3 1.1
Total net expense in the income statement 1.1 1.7
The discount rate for the parent’s pension obligations in 2010 is 3.8 percent(2009: 3.8 percent).
Defined-contribution plansThe Group has defined-contribution plans in Sweden and abroad. Contributionsto these plans are made continuously in accordance with the regulations foreach plan.
Group Parent
2010 2009 2010 2009
Cost of defined-contribution plans 218.3 227.3 9.5 9.3
Of the Group’s total expense for defined-contribution plans, SEK 103.3 million(2009: SEK 103.3 million) refers to the ITP plan financed through Alecta.See above.
A N N U A L R E P O R T N O T E S

1 0 8
Å F A N N U A L R E P O R T 2 0 10
A N N U A L R E P O R T N O T E S
21 Provisions
GroupProvisions which are non-current liabilities 2010 2009
Provision for additional consideration 65.3 25.3
Other 2.7 2.0
Total 68.0 27.3
Provisions which are current liabilitiesRestructuring costs 1.4 0.2
Provision for additional consideration 11.9 9.7
Other 0.3 20.9
Total 13.6 30.7
Total provisions 81.6 58.1
RestructuringCarrying amount at start of period 0.2 4.0
Transfers during reporting period 1.4 —
Amount used during period –0.2 –3.8
Carrying amount at end of period 1.4 0.2
Additional considerationCarrying amount at start of period 35.0 45.1
Transfers during reporting period 64.1 6.0
Released during the period –2.1 —
Amount used during period –9.5 –16.1
Amount reversed in the income statement –2.3 —
Disposals during the period –8.0 —
Carrying amount at the end of the period 77.2 35.0
Removal costsCarrying amount at start of period — 0.5
Amount used during period — –0.5
Carrying amount at end of period — —
Other provisionsCarrying amount at start of period 22.9 25.0
Transfers during reporting period 1.4 6.0
Amount used during period –19.4 –0.7
Amount reversed in the income statement –1.8 –7.4
Disposals during the period –0.1 —
Carrying amount at end of period 3.0 22.9
Group’s total provisions 2010 2009
Total carrying amount at start of period 58.1 74.6
Transfers during reporting period 66.9 12.0
Released during the period –2.1 —
Amount used during period –29.1 –21.1
Amount reversed in the income statement –4.1 –7.4
Disposals during the period –8.1 —
Total carrying amount at the end of the period 81.6 58.1
ParentProvisions 2010 2009
Provisions for additional consideration 69.4 22.5
Other 0.4 1.9
Total 69.8 24.4
Change in provisions
Carrying amount at start of period 24.4 17.1
Internally acquired additional consideration — 16.5
Transfers during reporting period 61.1 6.7
Released during the period –4.4 —
Amount used during period –10.9 –0.5
Amount reversed in the income statement –0.4 –15.4
Carrying amount at end of period 69.8 24.4
During the period 2007 to 2010 provisions were made for incentive programmes.(See also Note 8.)
It is anticipated that non-current provisions will be settled within the nextthree years.

1 0 9
Å F A N N U A L R E P O R T 2 0 10
22 Taxes
Recognised in the income statementGroupCurrent tax 2010 2009
Tax expense for the period –91.2 –93.2
Adjustment of tax attributable to previous years 3.2 –2.8
Deferred taxDeferred tax expense 7.0 –5.6
Total recognised tax expense in the Group –80.9 –101.6
ParentCurrent tax 2010 2009
Tax expense for the period –60.7 –51.8
Adjustment of tax attributable to previous years –0.1 —
Tax in respect of Group contributions paid/received 67.1 62.1
Deferred taxDeferred tax in respect of temporary differences — –4.8
Total recognised tax receipt/expense in theparent 6.3 5.5
Reconciliation of effective taxGroup 2010 (%) 2010 2009 (%) 2009
Profit before tax 798.1 377.0
Tax in accordance with currenttax rate for parent –26.30 –209.9 –26.30 –99.1
Effect of other tax rates forforeign subsidiaries 0.45 3.6 1.73 6.5
Non-deductible expenses –0.72 –5.7 –1.30 –4.9
Non-taxable income on sale ofbusiness operations 16.11 128.6 0.54 2.0
Non-taxable income, other 0.06 0.5 0.10 0.4
Effects of loss carry-forwardwithout corresponding capital-isation of deferred tax –0.06 –0.5 –0.53 –2.0
Tax attributable to previousyears 0.41 3.2 –0.74 –2.8
Other –0.09 –0.8 –0.46 –1.8
Recognised effective tax –10.14 –80.9 –26.96 –101.6
Reconciliation of effective taxParent 2010 (%) 2010 2009 (%) 2009
Profit/loss before tax 757.6 –17.6
Tax in accordance with currenttax rate for the parent –26.30 –199.2 –26.30 4.6
Non-deductible expenses –4.61 –34.9 1.76 –0.3
Non-taxable income on sale ofGroup companies and associates 17.39 131.7 — —
Non-taxable income, other 14.36 108.8 -6.74 1.2
Tax attributable to previousyears –0.01 –0.1 — —
Recognised effective tax 0.83 6.3 –31.28 5.5
Recognised in the balance sheetCurrent tax assets, net for the Group, amounted to SEK 15.0 million (net liabilityof SEK 16.7 million for 2009). The current tax asset for the Parent was SEK 12.1million (SEK 13.6 million).
A N N U A L R E P O R T N O T E S

1 1 0
Å F A N N U A L R E P O R T 2 0 10
A N N U A L R E P O R T N O T E S
Unrecognised deferred tax assetsDeductible temporary differences and loss carry-forwards for tax purposesfor which deferred tax assets have not been recognised in the income state-ment and balance sheets:
Group 2010 2009
Loss for tax purposes 25.4 21.5
25.4 21.5
Deferred tax assets have not been recognised in respect of these losses fortax purposes, since it has not yet been deemed likely that the Group will beable to utilise them against future taxable profits. The losses are attributableto parts of the Group’s Norwegian, German and Russian operations.
Deferred tax assets and tax liabilities
Recognised deferred tax assets and tax liabilitiesDeferred tax assets and tax liabilities relate to the following:
Deferred tax assets Deferred tax liability Net
Group 2010 2009 2010 2009 2010 2009
Non-current assets 0.2 0.4 –22.3 –16.5 –22.0 –16.1
Current receivables and liabilities 4.6 3.0 –4.7 –0.2 –0.1 2.9
Provisions 6.4 6.2 –4.6 –7.2 1.9 –0.9
Untaxed reserves — — –15.5 –10.7 –15.5 –10.7
Loss carry-forwards 11.6 5.7 — — 11.6 5.7
Tax assets/tax liabilities 22.8 15.4 –47.0 –34.4 –24.2 –19.0
Set-off –1.1 –4.5 1.1 4.5 — —
Tax assets/tax liabilities, net 21.7 10.9 –45.9 –30.0 –24.2 –19.0
Note 22 cont’d

1 1 1
Å F A N N U A L R E P O R T 2 0 10
23 Accrued expenses and prepaid income
Group Parent
2010 2009 2010 2009
Personnel-related liabilities 326.4 344.4 13.8 16.1
Accrued expenses,sub-consultants 24.1 19.8 0.2 —
Other 28.9 46.4 10.0 8.0
379.4 410.6 24.0 24.1
Change in deferred tax on temporary differences and loss carry-forwards
GroupBalance
1 January 2010Recognised in theincome statement
Recognised in othercomprehensive income
Acquisition/disposal ofbusiness operations
Balance31 December 2010
Non-current assets –16.1 2.5 –0.2 –8.3 –22.0
Current receivables and liabilities 2.9 –2.2 –0.7 — –0.1
Provisions –0.9 1.5 0.6 0.7 1.9
Untaxed reserves –10.7 –1.3 0.1 –3.6 –15.5
Utilisation of loss carry-forwards 5.7 6.6 –1.2 0.5 11.6
–19.0 7.0 –1.4 –10.8 –24.2
Note 22 cont’d
A N N U A L R E P O R T N O T E S

1 1 2
Å F A N N U A L R E P O R T 2 0 10
A N N U A L R E P O R T N O T E S
24 Financial assets and liabilities
Fair value and carrying amount are reported in the balance sheet below:
Group 2010 Group 2009
Derivativesused inhedge
accounting
Financialassets valuedat fair valuevia incomestatement
Accountsreceivableand loan
receivablesFinancialliabilities
Totalcarryingamount Fair value
Derivativesused inhedge
accounting
Financialassets valuedat fair valuevia incomestatement
Accountsreceivableand loan
receivablesFinancialliabilities
Totalcarryingamount Fair value
Financial investments 0.7 0.7 0.7 1.2 1.2 1.2
Non-current receivables 18.5 18.5 18.5 2.7 2.7 2.7
Accounts receivable 1,078.3 1,078.3 1,078.3 881.8 881.8 881.8
Income generated but not invoiced 370.8 370.8 370.8 457.1 457.1 457.1
Currency derivatives (level 2) 2.2 2.2 2.2 — —
Cash and cash equivalents 327.9 327.9 327.9 344.7 344.7 344.7
Total 2.2 0.7 1,795.4 — 1,798.4 1,798.4 — 1.2 1,686.2 — 1,687.3 1,687.3Non-current liability to creditinstitution 6.5 6.5 6.5 39.7 39.7 39.3
Other non-current liabilities 1.3 1.3 1.3 1.6 1.6 1.6
Current liability to credit institution 224.1 224.1 224.0 289.4 289.4 289.2
Accounts payable – trade 293.5 293.5 293.5 264.9 264.9 264.9
Accrued liabilities – subcontractors 24.1 24.1 24.1 19.8 19.8 19.8
Total — — — 549.5 549.5 549.4 — — — 615.5 615.5 614.9
Parent 2010 Parent 2009
Derivativesused inhedge
accounting
Financialassets valuedat fair valuevia incomestatement
Accountsreceivableand loan
receivablesFinancialliabilities
Totalcarryingamount Fair value
Derivativesused inhedge
accounting
Financialassets valuedat fair valuevia incomestatement
Accountsreceivableand loan
receivablesFinancialliabilities
Totalcarryingamount Fair value
Accounts receivable 48.5 48.5 48.5 34.3 34.3 34.3
Cash and bank 53.7 53.7 53.7 3.9 3.9 3.9
Total — — 102.2 — 102.2 102.2 — — 38.2 — 38.2 38.2Current liability to credit institution 100.0 100.0 100.0 211.6 211.6 211.6
Accounts payable – trade 72.3 72.3 72.3 56.4 56.4 56.4
Total — — — 172.3 172.3 172.3 — — — 267.9 267.9 267.9

1 1 3
Å F A N N U A L R E P O R T 2 0 10
Ageing analysis of receivables overdue but not impairedGroup Parent
2010 2009 2010 2009
< 30 days 66.4 68.3 — —
30–90 days 16.5 54.6 — 0.1
91–180 days 14.6 31.0 0.1 0.1
> 180 days 46.2 52.1 0.2 —
Total 143.6 205.9 0.3 0.2
The Group has well established routines for keeping tied-up capital and credit risks within appropriate limits.
Change in doubtful receivablesGroup Parent
Provision for doubtful receivables 2010 2009 2010 2009
Provision at start of year 15.6 20.0 — —
Provision for probable losses 6.9 8.5 — —
Realised losses –4.7 –10.3 — —
Recovered losses –3.8 –3.0 — —
Disposals of business operations –0.8 — — —
Exchange rate differences –0.6 0.4 — —
Provision at end of year 12.7 15.6 — —
Derivative instrumentsForward contracts are valued at recoverable amount in accordance with level2, i.e. fair value determined using directly observable market inputs, eitherdirect (such as price) or indirect (derived from price), and which are notincluded in level 1 (fair value determined on the basis of quoted prices forsimilar instruments on active markets).
Non-current liabilitiesNon-current liabilities are valued by adding to the loan the discounted interestrate difference between the agreed loan interest rate and the market rate upto maturity for equivalent loans.
Calculation of fair valueFair value agrees in all essentials with recognised value, except in the case ofcertain fixed-interest non-current liabilities to credit institutions. (See Note 19).
The following provides a summary of the main methods and assumptionsused to determine the fair value of the Group’s financial instruments.
SecuritiesFair value is based on the quoted market price at the end of the reportingperiod less transaction costs.
Note 24 cont’d
A N N U A L R E P O R T N O T E S

1 1 4
Å F A N N U A L R E P O R T 2 0 10
A N N U A L R E P O R T N O T E S
25 Financial risks and financial policy
The Group’s overall risk management policy is intended to reduce financialrisks to a level which is reasonable for ÅF AB. The aim is to ensure cost-effec-tive financing while minimising the negative effects of market fluctuations onthe Group’s earnings. Derivative instruments are used to hedge some riskexposure.
The Group’s risk management is handled centrally by the parent’s account-ing and reporting department on the basis of policies adopted by the Board ofDirectors. The accounting and reporting department identifies, evaluates andhedges financial risks in close collaboration with the Group’s operating units.
The Group is exposed to many different kinds of financial risk through itsoperations, including exchange rate risk, interest rate risk, credit risk andfinancing risk.
Exchange rate riskExchange rate risk covers future business transactions, recognised assetsand liabilities in foreign currency, and net investments in foreign operations.Exchange rate risk is relatively limited in the ÅF Group.
Loans are raised, and investments made, in the functional currency.
Translation exposureTranslation exposure consists of the net assets and profit/loss of foreign sub-sidiaries in foreign currency. In line with Group policy, ÅF does not hedge trans-lation exposure.
Transaction exposureExchange rate risks are relatively limited as most payments are made in thefunctional currency. Where this is not the case, any large sums are hedgedusing derivatives. The Group classifies the forward contracts used for hedgingforecast transactions as cash flow hedges. The fair value of such forwardcontracts amounted to SEK 2.2 million (2009: SEK 0) and is reported in thebalance sheet under the heading Other receivables.
2010 2009
ReceivablesCarryingamount
Fairvalue
Carryingamount
Fairvalue
Foreign exchange contract EUR 2.2 2.2 — —
Total 2.2 2.2 — —
Interest rate riskIn accordance with ÅF policy, the Group’s cash and cash equivalents aredeposited in bank accounts at local banks. There are no other material inter-est-bearing assets, and so income and cash flows from operating activitiesare essentially independent of changes in market interest rates.
Liabilities to credit institutions consist largely of bank loans at floating inter-est rates, but since indebtedness is not very great, the exposure to changes inmarket interest rates is not significant. Information about the terms of theloans, annual rates and maturity structure is provided in Note 19.
Credit riskCredit risk is a result of the company having at all times a substantial numberof outstanding trade receivables, as well as fees earned but not invoiced, inother words the credit granted to clients. This risk is limited through theGroup’s well-established principles for ensuring that sales are made to clientswith an appropriate payment history, and through advance payments. ÅF’s tenlargest clients, who together account for 23 percent of the Group’s invoicedsales, are all large listed companies with good credit ratings or governmentinstitutions. There is, therefore, not deemed to be any significant credit riskwith regard to any single major client. Counterparties for derivative contractsand cash transactions are limited to financial institutions with a high credit rat-ing. Historically ÅF has suffered only very limited credit losses.
Financing riskFinancing risk is the risk of not being able to obtain financing at all, or only at agreatly inflated price. For ÅF, prudent management of financing risk meanshaving adequate cash and cash equivalents and committed credit lines. ÅF ABhas credit facilities totalling SEK 950 million.
Sensitivity analysisInterest rate93 percent of the Group’s total borrowings at the close of the reporting periodcomprise loans at floating interest rates. A change of +/– 1 percent in theannual average interest rate on these loans affects interest expense by +/–SEK 2.0 million.
Foreign currency26 percent of the Group’s earnings arise from foreign units, with 8 percent deriv-ing from units which have the euro (EUR) as their functional currency and 5 per-cent with the Swiss Franc (CHF) as the local currency. A change of +/– SEK 0.25in the average exchange rate for the euro in 2010 would have affected pre-taxearnings by +/– SEK 0.6 million, and a change of +/– SEK 0.25 in the averageexchange rate for CHF in 2009 would have affected pre-tax earnings by +/– SEK0.5 million.

1 1 5
Å F A N N U A L R E P O R T 2 0 10
26 Operating leases
Leasing agreements where the company is the lesseeOperating leases cover rental agreements for properties, leasing agreementsfor vehicles under which employees assume all the financial risks and benefitsassociated with the vehicles, and the lease of certain items of office equip-ment. Vehicles are generally leased for three years.
The outstanding leasing stock is worth approximately SEK 44 million (2009:SEK 36 million).
Non-revocable leasing paymentsGroup Parent
2010 2009 2010 2009
Within one year 207.2 129.3 132.2 92.1
1–5 years 560.0 403.1 414.7 298.9
More than 5 years 421.4 438.6 406.2 430.4
Total 1,188.5 970.9 953.1 821.4
Leasing payments during the yearGroup Parent
2010 2009 2010 2009
Premises 143.1 120.8 105.0 87.0
Other 21.5 20.4 0.2 0.3
Total 164.6 141.2 105.2 87.4
27 Pledged assets, contingent liabilities andcontingent assets
Group Parent
2010 2009 2010 2009
Pledged assetsIn the form of pledged assetsfor the Group’s own liabilitiesand provisionsProperty mortgages 71.1 69.3 — —
Floating charges 55.6 42.1 — —
Blocked bank accounts — 0.2 — —
Pledged assets, other 259.6 0.2 — —
Total pledged assets 386.3 111.7 — —
Contingent liabilitiesGuarantees, FPG/PRI 1.1 1.1 0.5 0.5
Sureties given for the benefitof subsidiaries — — 70.1 145.9
Sureties given 117.6 353.0 44.3 91.2
Total contingent liabilities 118.6 354.0 114.9 237.6
28 Transactions with related parties
The parent has a related party relationship with its subsidiaries, see Note 29.
Summary of related party transactionsGroupThe term “related parties” in the Group refers to Ångpanneföreningen’s Foun-dation for Research & Development and associates. Transactions with theseparties have taken place on market terms.
Related party relationships
Year
Sale ofservicesto relatedparties
Purchaseof servicesfrom related
parties
Liabilitiesto relatedparties:31 Dec.
Receivablesfrom related
parties:31 Dec
Associates 2010 4.1 0.5 — —
Associates 2009 12.7 3.7 — —
Ångpanneföreningen’sFoundation for R&D 2010 0.5 — — —
Ångpanneföreningen’sFoundation for R&D 2009 0.5 — — —
During 2010, in addition to the above, the Group received grants from Ångpanne-föreningen’s Foundation for Research & Development amounting to SEK 3.7million (2009: SEK 3.9 million). These grants were for projects administeredby the Group.
For details of remuneration to senior executives, please see Note 8.
A N N U A L R E P O R T N O T E S
Note 27 cont’d
Pledged assets, other, refers primarily to shares in subsidiaries which have beenpledged for one of the companies acquired by ÅF. The pledge was restored atthe beginning of 2011, when the loan covered by the pledge was paid off.
Sureties refer primarily to performance guarantees for tenders and thecompletion of projects.
Contingent assetsThe Group does not anticipate that any contingent assets will arise.
ParentRelated party relationships
Year
Sale ofservicesto relatedparties
Purchaseof servicesfrom related
parties
Liabilitiesto relatedparties:31 Dec.
Receivablesfrom related
parties:31 Dec
Subsidiaries 2010 298.4 16.1 311.4 276.3
Subsidiaries 2009 287.2 8.6 555.8 194.8
Associates 2010 1.3 — — 0.1
Associates 2009 1.1 — — 0.1
Ångpanneföreningen’sFoundation for R&D 2010 0.1 — — —
Ångpanneföreningen’sFoundation for R&D 2009 0.2 — — —

1 1 6
Å F A N N U A L R E P O R T 2 0 10
A N N U A L R E P O R T N O T E S
29 Group subsidiaries
Companies owned directly by the parent 2010 2009
Corporate ID Reg’d officeNumber of
sharesInterest,percent 1)
Carryingamount
Interest,percent 1)
Carryingamount
AB Ångpanneföreningen 556158-1249 Stockholm 2,000 100 0.2 100 0.2
Energo AB 556551-7355 Stockholm 1,000 100 259.7 — —
AF-Meacont s.r.o. 453 06 605 Prague 2 100 78.2 — —
Mercados Energy Markets International Investments SL B-854 82 883 Madrid 12,763 100 69.4 — —
ÅF-Consult AB 556101-7384 Stockholm 50,000 100 39.8 100 171.4
ÅF-Industry AB 556224-8012 Stockholm 2,000 100 544.2 100 516.2
ÅF-Funktionspartner AB 556099-8071 Malmö 4,000 100 0.6 100 0.6
ÅF-Infrastructure AB 556185-2103 Stockholm 1,000 100 318.5 100 303.5
ÅF-Kontroll AB 556033-5977 Stockholm — — — 100 73.9
ÅF-Technology AB 556092-4044 Stockholm 60,000 100 71.5 100 71.5
ÅF-Teknik & Miljö AB 556534-7423 Stockholm 3,076 100 10.5 100 10.5
ÅF-Brasil Consultoria Em Processos Industrias Ltda 08.164.752/0001-08 Curitiba — — — 1 0.0
ÅF A/S 21 007 994 Copenhagen 99,300 100 37.6 100 37.6
ÅF-Hansen & Henneberg A/S 13 59 08 85 Copenhagen 533,300 80 32.2 80 32.2
ÅF-Automatikka OÜ 11 297 301 Tallinn 1 100 8.9 100 8.9
ÅF-Consult Oy FI18001896 Vantaa 1,000,000 100 264.6 100 264.6
ÅF-Engineering Oy FI07255030 Tampere 30 100 26.5 100 26.5
ÅF Norge AS 955 021 037 Oslo 20,000 100 37.7 100 28.5
ÅF Norge Holding AS 995 567 768 Oslo 2,000 100 2.4 — —
ÅF-Engineering AS 936 097 367 Oslo 136,615 100 36.1 100 30.4
AF-Colenco AG CH-400.3.924.101-4 Baden 6,000 100 418.7 100 431.5
ÅF-Engineering s.r.o. 263 66 550 Plzen 20,000 100 10.6 100 10.6
ÅF-Qualitest s.r.o. 474 72 448 Prague — — — 10 0.0
ZAO AF Lonas 1 089 847 318 923 St. Petersburg 100 100 88.9 100 91.0
2,356.8 2,109.51) Participating interest refers to both the voting share and the proportion of the total number of shares.
Specification of the change in carrying amounts during the year Parent
2010 2009
Carrying amount brought forward 2,109.5 1,018.5
Acquisitions 411.1 964.4
Sales –73.9 0.0
Revaluations — 411.4
Impairment 1) –131.6 –411.4
Correction of additional consideration –16.2 —
Shareholders’ contributions 57.9 126.7
Value carried forward 2,356.8 2,109.51) Impairment relates to shares in ÅF-Consult AB. The shares have been valued at net worth after the company transferred itsbusiness operation to other companies within the Group and paid a dividend of SEK 325 million to ÅF AB.

1 1 7
Å F A N N U A L R E P O R T 2 0 10
Note 29 cont’d
Comprehensive list of Group subsidiaries 2010 2009
Corporate ID Reg’d officeNumber of
sharesInterest,percent 1)
Carryingamount
Interest,percent 1)
Carryingamount
AB Ångpanneföreningen 556158-1249 Sweden 2,000 100 0.2 100 0.2
Energo AB 556551-7355 Sweden 1,000 100 259.7 — —
Energo Installation Mitt AB 556277-0684 Sweden — 100 — — —
Energo Installation Syd AB 556215-2024 Sweden — 100 — — —
Energo Konsult AB 556536-7918 Sweden — 100 — — —
AF-Meacont s.r.o. 453 06 605 Czech Rep. 2 100 78.2 — —
AF-REGULA a.s. 264 20 961 Czech Rep. — 100 — — —
TODO spol. s.r.o. 470 51 604 Czech Rep. — 100 — — —
Mercados Energy Markets International Investments SL B-854 82 883 Spain 12,763 100 69.4 — —
Mercados Energy Markets International S.A. A-82316902 Spain — 100 — — —
Mercados Energy Markets International Europe S.r.l. 066222200967 Italy — 100 — — —
Mercados EPU Danismanlik Ltd 6160390509 Turkey — 100 — — —
Mercados Energy Markets India, Private Limited AAFCM5128DST001 India — 100 — — —
ÅF-Teknik & Miljö AB 556534-7423 Sweden 3,076 100 10.5 100 10.5
ÅF Brasil Consultoria Em Processos Industrias Ltda 08.164.752/0001-08 Brazil — — — 1 0.0
ÅF-Qualitest s.r.o. 474 72 448 Czech Rep. — — — 10 0.0
ÅF-Consult AB 556101-7384 Sweden 50,000 100 39.8 100 171.4
ÅF Brasil Consultoria Em Processos Industrias Ltda 08.164.752/0001-08 Brazil — — — 99 —
ÅF-Process GmbH 218 403 818 Germany — 100 — 90 —
ÅF-Process b.v. 9157996 Netherlands — — — 100 —
ZAO AF Lonas 1 089 847 318 923 Russia 100 100 88.9 100 91.0
ZAO Lonas Technologia 1 037 808 021 228 Russia — 75 — 75 —
LLC Lonas Technologia Ukraine 15 851 020 000 006 500 Ukraine — 100 — 100 —
TOO AF Lonas Technologia Kazakhstan 620200351121 Kazakhstan — 100 — — —
XO AF Lonas Technologia Turkmenistan 102621002900 Turkmenistan — 100 — — —
AF-Colenco AG CH-400.3.924.101-4 Switzerland 6,000 100 418.7 100 431.5
International Power Design Ltd. CH-400.3.025.445-4 Switzerland — 100 — 100 —
Colenco Engineering S.r.l. 17669779 Romania — 51 — 51 —
AF-Colenco Italia S.r.l. MI-1808529 Italy — 100 — 100 —
AF-Colenco Thailand Ltd 3011879733 Thailand — 100 — 100 —
AF-Consult India Pvt Ltd U74140DL2009FTC197507 India — 100 — — —
ÅF-Consult Oy FI18001896 Finland 1,000,000 100 264.6 100 264.6
LLC AF-Enprima 1037800096641 Russia — 100 — 100 —
AF-Estivo AS 10 449 422 Estonia — 100 — 100 —
UAB AF-Enprima 300 544 325 Lithuania — 100 — 100 —
UAB AF-TSP 135 744 077 Lithuania — 100 — 100 —
Elron Oy FI21206454 Finland — 50 — 50 —
Elron Eastern Europe Oy FI21856262 Finland — 75 — 75 —
Enprima Engineering Oy FI04779402 Finland — 100 — 100 —
Enprima Engineering GmbH 24/388/00843 Germany — — — 100 —
Fortum Engineering S.r.l. R10224145 Romania — — — 100 —
1) Participating interest refers to both the voting share and the proportion of the total number of shares.
A N N U A L R E P O R T N O T E S

1 1 8
Å F A N N U A L R E P O R T 2 0 10
A N N U A L R E P O R T N O T E S
Note 29 cont’d
30 Untaxed reserves
ParentAccumulated depreciation in excess of plan 2010 2009
Opening balance 1 January 25.8 12.5
Depreciation during the year, equipment & fittings 2.7 13.2
Closing balance 31 December 28.4 25.8
Comprehensive list of Group subsidiaries 2010 2009
Corporate ID Reg’d officeNumber of
sharesInterest,percent 1)
Carryingamount
Interest,percent 1)
Carryingamount
ÅF-Industry AB 556224-8012 Sweden 2,000 100 544.2 100 516.2
Platom AB 556575-2101 Sweden — 100 — — —
OrbiTec AB 556470-7015 Sweden — 100 — 100 —
ÅF A/S 21 007 994 Denmark 99,300 100 37.6 100 37.6
ÅF-Automaatika OÜ 11 297 301 Estonia 1 100 8.9 100 8.9
ÅF-Engineering AS 936 097 367 Norway 136,615 100 36.1 100 30.4
ÅF-Engineering Oy FI07255030 Finland 30 100 26.5 100 26.5
ÅF-Engineering s.r.o. 263 66 550 Czech Rep. 20,000 100 10.6 100 10.6
ÅF-Funktionspartner AB 556099-8071 Sweden 4,000 100 0.6 100 0.6
ÅF-Infrastructure AB 556185-2103 Sweden 1,000 100 318.5 100 303.5
Nordblads VVS-Konstruktioner AB 556460-5797 Sweden — — — 100 —
ÅF-Berg Bygg Konsult Röshoff AB 556471-5976 Sweden — — — 100 —
VVS Energi i Borås AB 556449-1842 Sweden — 100 — — —
Ingakvib AB 556067-5067 Sweden — 100 — 100 —
ÅF Norge AS 955 021 037 Norway 20,000 100 37.7 100 28.5
ÅF Norge Holding AS 995 567 768 Norway 2,000 100 2.4 — —
ÅF-Hansen & Henneberg A/S 13 59 08 85 Denmark 533,300 80 32.2 80 32.2
ÅF-Technology AB 556092-4044 Sweden 60,000 100 71.5 100 71.5
ÅF-Kontroll AB 556033-5977 Sweden — — — 100 73.9
ÅF-Kontroll AS 994 141 457 Norway — — — 100 —
ÅF-Qualitest s.r.o. 474 72 448 Czech Rep. — — — 90 —
UAB AF-Inspection 301 845 573 Lithuania — — — 100 —
2,356.8 2,109.51) Participating interest refers to both the voting share and the proportion of the total number of shares.

1 1 9
Å F A N N U A L R E P O R T 2 0 10
33 Critical estimates and assumptions
Key sources of estimation uncertaintyThe Group makes estimates and assumptions about the future. By definition,the resulting accounting estimates will rarely correspond to the actual out-come. Estimates and judgements are reviewed regularly and are based on his-torical experience and other factors, including the expected outcomes offuture events that are considered reasonable under the circumstances.
Estimates and assumptions which, if they prove to be incorrect, can resultin material adjustments to the carrying amounts of assets and liabilities duringthe coming financial year are presented below.
34 Information about the parent
ÅF AB is registered in Sweden as a joint-stock company. The parent’s shares arelisted on the Nasdaq OMX stock exchange in Stockholm. The postal address tothe company’s head office is ÅF AB, SE-169 99 Stockholm, Sweden.
The Group consolidated accounts for the financial year 2010 comprise theaccounts for the parent and its subsidiaries, which together form “the Group”.The Group also includes participations in associates.
31 Statement of cash flows
Interest paid and dividends receivedGroup Parent
2010 2009 2010 2009
Dividends received — — 415.0 1.7
Interest received 5.5 4.1 1.6 7.8
Interest paid –10.1 –14.7 –6.2 –11.0
–4.5 –10.7 410.5 –1.5
Adjustment for items not included in cash flowGroup Parent
2010 2009 2010 2009
Depreciation/amortisation 50.8 61.6 10.5 9.3
Impairment/retirements 1.4 1.9 131.6 —
Loss on disposal of businessoperations –488.9 –7.3 –500.8 —
Other –19.6 –7.3 –1.6 –15.9
–456.3 49.0 –360.2 –6.7
Acquisition of financial assets in the Parent, SEK –608 million (2009: SEK–885 million), refers to the consideration and additional consideration paidfor shares in Group companies and associates, as well as shareholders’ con-tribution. Disposal of financial assets in the Parent, SEK 575 million (0), refersto the sale of ÅF-Kontroll AB and ÅF-TÜV Nord AB.
32 Events after the end of the reporting period
No significant events have occurred since the end of the reporting period.
Impairment of goodwillWhen calculating the recoverable amount of cash-generating units, a numberof assumptions about future circumstances and estimates of parameters havebeen made. Changes to these assumptions and estimates could have an effecton the carrying amount of goodwill (see Note 13).
Forecasts used in respect of future cash flows are based on the forecastmade by senior management for the next year supplemented by an individualassessment of a further four years. From that point onwards the calculation isbased on an annual growth rate of 2 percent. The forecast cash flows havebeen discounted to present value at an average discount rate of 13 percent(2009: 11 percent) before tax.
The impairment test for the year did not give rise to any impairment.A lower assumed rate of growth would result in a lower recoverable amount.
The reverse applies if the calculation of the recoverable amount is based on ahigher assumed growth rate. Were future cash flows to be discounted at ahigher rate of interest, the recoverable amount would be lower; conversely,the recoverable amount would be higher with a lower discount rate.
Retirement benefit obligationsThe Group’s net obligations under defined-benefit plans are calculated sepa-rately for each plan by estimating the future benefits earned by employeesthrough their employment in prior periods. These benefits are discounted topresent value. The calculation of the size of the Group’s total retirement benefitobligations is based on a number of assumptions (see Note 20). The discountrate is the market yield at the end of the reporting period on government bondswith a maturity corresponding to that of the Group’s estimated average retire-ment benefit obligations. The discount rate used is 3.9 percent in Sweden and2.8 percent in Switzerland. The calculations have been performed by a qualifiedactuary using the projected unit credit method. Were a lower discount rate to beused, the obligations would increase and have a negative effect on the Group’sequity. The reverse applies if a higher discount rate is used.
Determination of final cost forecast and stage of completion of contractsThe percentage of completion method is applied to all assignments whose out-come can be measured reliably. The majority of assignments are performed onan open-account basis, and clients are normally invoiced the month after thework is carried out. Where assignments are carried out on a fixed-price basis,revenue is recognised in profit or loss on the basis of the stage of completion atthe end of the reporting period. The stage of completion is determined by havingan assignment manager make an assessment of the amount of work that hasbeen completed in relation to the amount of work still remaining. In the event ofsignificant uncertainty about its value, no revenue is recognised.
Note 33 cont’d
A N N U A L R E P O R T N O T E S

1 2 0
Å F A N N U A L R E P O R T 2 0 10
A N N U A L R E P O R T
The undersigned declare that the consolidated accounts and annual report have been drawn up in accordancewith IFRS, as approved by the EU, and with generally accepted accounting practice, to give a faithful representation of the position
and performance of the Group and the company, and that the Group administration report and the administration reportgive a faithful review of the progress of the Group’s and the company’s operations, position and performance, as well asdescribing the material risks and uncertainty factors to which the companies that are members of the Group are exposed.
Stockholm, Sweden – 11 March 2011
Ulf Dinkelspiel Jonas Wiström Patrik EnbladChairman of the Board President/CEO Director
Eva-Lotta Kraft Björn O. Nilsson Jon RisfeltDirector Director Director
Helena Skåntorp Anders Snell Lena Treschow TorellDirector Director Deputy Chair
Fredrik Sundin Patrik TillackEmployee representative Employee representative
Our Audit Report was presented on 11 March 2011
Ernst & Young AB
Lars TräffAuthorised Public Accountant

1 2 1
Å F A N N U A L R E P O R T 2 0 10
A N N U A L R E P O R T
Stockholm, Sweden – 11 March 2011
Ernst & Young AB
Lars TräffAuthorised Public Accountant
To the annual meeting of the shareholders of ÅF ABCorporate identity number: 556120-6474
We have audited the annual accounts, the consolidated accounts, theaccounting records and the administration of the board of directorsand the managing director of ÅF AB for the financial year 2010. Theannual accounts and the consolidated accounts of the company areincluded in the printed version of this document on pages 66–120.The board of directors and the managing director are responsible forthese accounts and the administration of the company as well as forthe application of the Swedish Annual Accounts Act when preparingthe annual accounts and the application of international financialreporting standards IFRSs as adopted by the EU and the SwedishAnnual Accounts Act when preparing the consolidated accounts.Our responsibility is to express an opinion on the annual accounts,the consolidated accounts and the administration based on our audit.We conducted our audit in accordance with generally accepted
auditing standards in Sweden. Those standards require that we planand perform the audit to obtain reasonable assurance that the annualaccounts and the consolidated accounts are free of material mis-statement. An audit includes examining, on a test basis, evidencesupporting the amounts and disclosures in the accounts. An auditalso includes assessing the accounting principles used and theirapplication by the board of directors and the managing director andsignificant estimates made by the board of directors and the manag-ing director when preparing the annual accounts and consolidatedaccounts as well as evaluating the overall presentation of informationin the annual accounts and the consolidated accounts. As a basis for
our opinion concerning discharge from liability, we examined signifi-cant decisions, actions taken and circumstances of the company inorder to be able to determine the liability, if any, to the company ofany board member or the managing director. We also examinedwhether any board member or the managing director has, in any otherway, acted in contravention of the Swedish Companies Act, the Swed-ish Annual Accounts Act or the Articles of Association. We believe thatour audit provides a reasonable basis for our opinion set out below.The annual accounts have been prepared in accordance with the
Swedish Annual Accounts Act and give a true and fair view of thecompany’s financial position and results of operations in accordancewith generally accepted accounting principles in Sweden. The con-solidated accounts have been prepared in accordance with the inter-national financial reporting standards IFRSs as adopted by the EU andthe Swedish Annual Accounts Act and give a true and fair view of thegroup’s financial position and results of operations. The statutoryadministration report is consistent with the other parts of the annualaccounts and the consolidated accounts.We recommend to the annual meeting of shareholders that the
income statements and balance sheets of the parent company andthe income statement and balance sheets for the group be adopted,that the profit of the parent company be dealt with in accordance withthe proposal in the administration report and that the members ofthe board of directors and the managing director be discharged fromliability for the financial year.
AUDIT REPORT

Å F A N N U A L R E P O R T 2 0 10
C O R P O R AT E G O V E R N A N C E C O R P O R AT E G O V E R N A N C E AT Å F
Ulf Dinkelspiel, Chairman of the Board of ÅF,shares his views on corporate governanceand on some of the important issues facingthe board in the near future.
Can you outline how corporate governance works at ÅF?“The bigger a company is, the more important corporate governancebecomes. It’s about creating the right kind of interaction between theboard, executive management, middle managers and staff in gen-eral. The tasks of the board are to formulate a corporate strategy, tocheck that the company is meeting its targets and to make sure thatthe organisation as a whole works well as a team, with well-defineddecision processes, a clear division of responsibility and effectivecontrol mechanisms. And all this has to be done without gettingbogged down in the details.“The work of the board is governed by the rules for listed companies
in Sweden, but also by ÅF’s own internal regulatory framework andthe guidelines for growth and profitability that have been drawn upfor the current five-year period.“In practice, the board works hard to continuously improve the
effectiveness of its routines and working methods in order to be ableto devote as much time as possible to important strategic discus-sions. The decision to delegate certain tasks to the Audit and Remu-neration Committees is part of this process.“The relationship between the board and the president is funda-
mental to the success of these efforts, so I always attach greatimportance to giving priority to issues that the president is currentlydealing with. A board of directors should function both as a control-ling body and as a sounding board for ideas that come from withinthe organisation.”
What are the main issues facing the board in 2011?“We need to support management and the organisation as a whole,so that ÅF can capitalise on the upswing in the economy that begantowards the end of 2010 and that we hope will continue. We also needto make sure that the organisation is flexible enough to react to anyunexpected turn of events.
“Growth is another key issue. We have ambitious expansion plansand over time ÅF must grow organically as much as it does by takingover other companies. That means that issues relating to acquisi-tions will continue to have a prominent place in the work of the boardin 2011.“Another issue that is the focus of great interest from the board is
sustainability in its widest possible sense. ÅF has set itself tough tar-gets for sustainable performance that affect not only the company’sown actions, but even more so the services and consulting advicethat we offer our clients. These are issues that are directly linked toÅF’s long-term profitability and value creation for shareholders andclients alike.”
Ulf DinkelspielChairman of the Board of Directors
CORPORATE GOVERNANCE AT ÅF
1 2 2

1 2 3
CORPORATE GOVERNANCE REPORT
Corporate governanceÅF AB is a Swedish public company with its registered office in Stock-holm. The company’s class B shares are listed on the Nasdaq OMXStockholm exchange. ÅF is governed in accordance with the com-pany’s articles of association, the Swedish Companies Act, the SwedishAnnual Accounts Act, the listing rules for the Nasdaq OMX Stockholm,the Swedish Code of Corporate Governance, and other relevant docu-ments. ÅF did not depart from the Swedish Code of Corporate Govern-ance in 2010. This corporate governance report has been reviewed bythe company’s auditor.Governance, management and control are divided between the share-
holders at the AGM, the Board of Directors and the President/CEO.The articles of association adopted by the AGM are the most impor-
tant instrument for the company’s internal governance, followed by theboard’s formal work plan and the board’s instructions for the President/CEO. ÅF has regularly introduced and developed other processes andcontrol systems to ensure effective and profitable growth.
ÅF’s major shareholdersÅngpanneföreningen’s Foundation for Research & Development holdsshares that correspond to a total of 40.9 percent of the total number ofvotes for all shares in the company. For further information on share-holders and the ÅF share, please see pages 46–48 and the ÅF website.
ÅF’s Annual General Meeting for 2010The AGM for 2010 was held at the ÅF Group’s head office in Solna, Swe-den, on 5 May. It was attended by 138 shareholders, representing 48.2percent of the share capital and 63.6 percent of the total number of votes.
ResolutionsThe AGM resolved, among other things:• to pay a dividend for 2009 of SEK 4.00 per share (adjusted for theshare split that took place during the year) in accordance with theproposal of the Board of Directors;
• to pay fees totalling SEK 1,625,000 to the board, with the Chairmanto receive SEK 400,000 and members of the board not employed bythe Group to receive SEK 175,000 each. Moreover, it was resolvedthat fees shall be paid for work in the Audit Committee, with theChair of the committee receiving SEK 75,000 and other members ofthe committee who are not employed by the Group receiving SEK35,000 each, and also that fees shall be paid for work in the Remu-neration Committee, with the Chair of the committee receiving SEK50,000 and other members of the committee receiving SEK 35,000each. Auditors’ fees are payable against invoices;
• to elect a board of eight directors: Ulf Dinkelspiel, Patrik Enblad,Eva-Lotta Kraft, Jon Risfelt, Helena Skåntorp, Anders Snell and LenaTreschow Torell were re-elected, while Björn O. Nilsson was electedas a new member. Ulf Dinkelspiel was appointed Chairman;
President/CEOGroup functions and processes
Internal Control
IndustryDivision
EnergyDivision
Board of Directors
Shareholdersthrough General Meeting
IntAudit Committee
Remuneration Committee
InfrastructureDivision
TechnologyDivision
Senior Management
NominationCommittee
Auditors
The principal external regulatory framework that shapes the governance of ÅF:• The Swedish Companies Act• Accounting legislation, IFRS, the Swedish Bookkeeping Act and the Swedish AnnualAccounts Act
• Nasdaq OMX Stockholm Rules & Regulations• Swedish Code of Corporate Governance
Examples of internal documents that shape the governance of ÅF:• Articles of Association• Instructions, rules of procedure• Policies and guidelines• Process descriptions for each business area
ShareholdersThe shareholders’ right to decide in matters relating to the company is exercised at theGeneral Meeting of shareholders, which is the highest decision-making body in ÅF. TheGeneral Meeting ratifies the company’s articles of association, votes on the appointmentof the directors of the company and the Chairman of the Board, and elects auditors.
C O R P O R AT E G O V E R N A N C E C O R P O R AT E G O V E R N A N C E R E P O R T

1 2 4
Å F A N N U A L R E P O R T 2 0 10
C O R P O R AT E G O V E R N A N C E C O R P O R AT E G O V E R N A N C E R E P O R T
• to adopt the Performance-related Share Programme for 2010 inaccordance with the proposal of the Board of Directors;
• to implement a share split in accordance with the proposal madeby the Board so that one share be replaced by two shares;
• to authorise the Board to buy back shares so that the company’sown holding amounts to a maximum of 10 percent of the shares inthe company;
• to authorise the Board to decide on the issue of new shares thatcorrespond to an increase of a maximum of SEK 15,000,000 in thecompany’s share capital.
The minutes of the AGM are available in both Swedish and English onthe ÅF website.
Nomination CommitteeIn accordance with a resolution passed at the AGM on 5 May 2010, theNomination Committee shall, up until the time of the 2011 AGM, consistof the Chairman of the Board together with representatives for at leastthree and at most five of the shareholders with the largest number ofvotes in the company. The names of the members of the committeeshall be announced no later than six months before the 2011 AGM.The Nomination Committee appointed on 25 October 2010 com-
prised Staffan Westlin (Chair), representing Ångpanneföreningen’sFoundation for Research & Development, Ulf Dinkelspiel, Chairman ofthe Board of ÅF, Åsa Nisell appointed by Swedbank Robur, and PeterRudman appointed by Nordea Fonder. In January the Nomination Com-mittee was extended to include a further member, Conny Karlsson,who was appointed by CapMan Public Market Fund.
The duties of the Nomination CommitteeThe Nomination Committee submits proposals, prior to the AGM, onthe number of board members, the composition and remuneration ofthe board, and any fees payable for committee work. The committeeshall also submit proposals on who is to chair the Board of Directorsand the AGM and on auditors and their fees. In accordance with itsremit, the committee shall also carry out those duties assigned to itunder the Swedish Code of Corporate Governance.
The work of the Nomination CommitteeIn the period up to and including February 2011 the committee hasheld six minuted meetings and maintained contact between meetings.To assess how well the present Board of Directors meets the demandsthat will be placed on the board in consequence of the company’s posi-tion and future focus, the committee has discussed the size and com-position of the board in relation to, for example, experience in theindustry and specialist expertise. As a basis for the committee’s work,the Chairman of the Board has informed the committee about the workof the board during the year and of the work undertaken by the AuditCommittee and the Remuneration Committee. The Nomination Com-
mittee has also familiarised itself with the results of the evaluation of theboard and its work, and interviewed individual members of the board.No remuneration has been paid for work on the committee.All shareholders are entitled to approach the committee with sug-
gestions for board members. The committee’s proposals, the reporton the committee’s work prior to the 2011 AGM, and supplementaryinformation on the proposed members of the board will be published inconnection with the notice convening the 2011 AGM, and will be pre-sented at the meeting.
Board of DirectorsThe Board of Directors of ÅF shall consist of a minimum of six and amaximum of ten members, with a maximum of five deputies appointedby the AGM. The 2010 AGM appointed eight directors with no deputies.The President/CEO of ÅF is not a member of the board. The company’semployees are, however, represented on the board.Björn O. Nilsson was elected as a new director of the company in
2010. Tor Ericsson did not seek re-election. Ulf Dinkelspiel, PatrikEnblad, Eva-Lotta Kraft, Jon Risfelt, Helena Skåntorp, Anders Snell andLena Treschow Torell were re-elected. Ulf Dinkelspiel was elected bythe AGM to serve as Chairman of the Board up until the next AGM. Theboard elected Lena Treschow Torell as its Deputy Chair. The President/CEO of ÅF, Jonas Wiström, is not a member, but participates in boardmeetings to present reports. The Group’s CFO, Jonas Ågrup, also par-ticipates to present reports. Viktor Svensson, Executive Vice President,Corporate Information, serves as secretary to the board. For moreinformation on the Board of Directors, please refer to pages 128–129.
Independence of members of the boardThe composition of the board of ÅF meets the requirements for inde-pendent directors laid down by the rules of the Nasdaq OMX Stockholmand the Swedish Code of Corporate Governance. Directors Björn O.Nilsson and Anders Snell hold positions of dependence with regardto the largest shareholder, Ångpanneföreningen’s Foundation forResearch & Development.
Work of the Board of DirectorsEach year the board produces a written formal work plan which setsout the responsibilities of the board, and which governs the allocationof duties among board members, the rules for decision-making, datesand times of board meetings, notification, agenda and minutes for boardmeetings, and the board’s work with accounting and auditing matters.The ÅF board holds an inaugural meeting immediately after the AGM,
after which it is required to meet at least four times per calendar year.Every ordinary board meeting follows the agenda set out in the board’sformal work plan, which includes a report from the President/CEO,financial reports and various strategic matters.The board has opted to appoint a Remuneration Committee and an
Audit Committee.

1 2 5
Å F A N N U A L R E P O R T 2 0 10
Work during the yearBecause of a high level of activity in the company relating to acquisi-tions in 2010, the work of the board has been unusually intensive withmore board meetings than what is normal during the year. In additionto the inaugural meeting, the board held 18 meetings in 2010, of whichone was a per capsulam meeting and six were telephone meetings forwhich the relevant documentation was sent out in advance. Four of themeetings were held in connection with the publication of the com-pany’s interim reports. In connection with the board meeting in Sep-tember, a visit was made to ÅF’s subsidiary in Oslo.The work of the board revolves mostly around strategic issues, busi-
ness plans, budgeting, accounts and acquisitions, in addition to otherdecisions which, under the company’s rules for decision-making, aredealt with by the board. Reports on the progress of the company’s oper-ational activities and finances are a standing item on the agenda. A strat-egy seminar was held at the meeting in September, and included athorough review of each division. At every ordinary board meeting,there is a more in-depth presentation of one of ÅF’s lines of businessor divisions.On one occasion each year the board discusses issues related to
succession planning for senior executives within the company.
Attendance at board/committee meetings in 2010
Function Board
Remuner-ation-Cttee
AuditCttee
Number of meetings 19 2 4Ulf Dinkelspiel C 19 2 4
Patrik Enblad M 19
Tor Ericson** M 8
Eva-Lotta Kraft M 19 3
Björn O. Nilsson* M 12
Jon Risfelt M 19 2
Helena Skåntorp M 18 4
Anders Snell M 18
Lena Treschow Torell M 16 2
Employee representatives:Fredrik Sundin M 17
Patrik Tillack M 19
Patrik Kerttu *** D 1
Anders Toll *** D 2
* Elected to the Board on 5 May 2010** Resigned from the Board on 5 May 2010
*** Employee representatives’ deputies normally attendonly the inaugural meeting of the board
C = Chair M = Board member D = Deputy
Evaluation of the Board of Directors and President/CEOOnce a year, the Chairman of the Board initiates an evaluation of thework of the board by issuing each director with a detailed question-naire, which is answered anonymously. The questionnaire covers areassuch as the climate of cooperation, the breadth of expertise availableand the manner in which the work of the board has been carried out.The object of the evaluation is to obtain an understanding of the direc-tors’ opinions on how the work of the board has been carried out, andwhat measures may be taken to improve the efficiency of this work.The results of the questionnaire are discussed by the board and com-municated to the Nomination Committee.The Board of Directors evaluates the work of the President/CEO on
an ongoing basis, by monitoring the progress of the business againstthe targets that have been set. A formal evaluation is carried out oncea year, and the results are discussed with the President/CEO.
Remuneration CommitteeThe Remuneration Committee is tasked with considering and makingrecommendations on salaries, other terms of employment and incen-tive programmes for the President/CEO and other senior executives inthe company. The committee also deals with matters relating to overallconditions of employment and remuneration packages for all of thecompany’s employees. The committee reports to the board. Prior tothe 2011 AGM the committee has met on two occasions. The commit-tee consists of Ulf Dinkelspiel (Chair), Jon Risfelt and Lena TreschowTorell. The President/CEO attends as a co-opted member, as does theCFO and ÅF’s Director for Human Resources. Remuneration has beenpaid for work on the committee.
Audit CommitteeThe Audit Committee is a vital communications link between the boardand the company’s auditors, supporting the work of the board by safe-guarding the quality of financial reports and following up the results ofthe reviews and audits carried out by the external auditors. The com-pany’s internal audit staff support the committee in its work. Since the2010 AGM the committee has consisted of Helena Skåntorp (Chair),Ulf Dinkelspiel and Eva-Lotta Kraft. All members are independent ofthe owners and the company’s management. The committee held fourminuted meetings in 2010. The company’s auditor has attended allmeetings of the committee. The President/CEO attends as a co-optedmember, as does the CFO and the manager responsible for the ÅFGroup’s financial reporting. The company’s internal auditor has attendedtwo meetings during the year. Remuneration has been paid for work onthe committee.
C O R P O R AT E G O V E R N A N C E C O R P O R AT E G O V E R N A N C E R E P O R T

1 2 6
Å F A N N U A L R E P O R T 2 0 10
AuditorsThe Nomination Committee is tasked with proposing auditors to theAGM. The auditors work for and on behalf of the shareholders to auditthe company’s accounting records, the annual accounts and the admin-istration of the Board of Directors and the President/CEO. The 2007AGM appointed the accounting firm Ernst & Young AB, represented byLars Träff as auditor in charge, as the company’s auditors to serve tothe end of the AGM in 2011.Ernst & Young carries out the audit of ÅF AB and major units within
the ÅF Group. The auditors carry out a “hard close” after the nine-monthreport for the period January–September, and a full audit of the annualaccounts. At the same time, an audit of internal routines and controlsystems is carried out together with an examination of the Group’s cor-porate governance report and of the compliance with the guidelinesapproved by the AGM relating to remuneration to senior executives.
CEO and senior managementThe Board of Directors has delegated operational responsibility for theadministration of the company and the Group to the company’s CEO.The CEO leads operations within the framework laid down by the board.The board has adopted instructions for the division of responsibility be-tween the board and the CEO, which are updated and approved each year.The CEO has appointed a senior management group with day-to-day
responsibility for various aspects of the Group’s operation. During 2010ÅF’s senior management group consisted of the CEO, the divisionalPresidents, the CFO, the Director for Human Resources, the GeneralCounsel, the Executive Vice President for Corporate Information, andthe PA to the President, who serves as secretary to the senior manage-ment group. For further information about the members of the seniormanagement group, please see pages 130–131.ÅF’s senior management group normally meets once a month, to
discuss matters such as the Group’s financial performance, acquisi-tions, group-wide development projects, succession planning andcompetence development, together with various other strategicissues. Eleven minuted meetings were held during 2010.Once a month the CEO and the CFO discuss each division’s income
statement, balance sheet and key figures with the relevant divisionalmanagement team and conduct a status review of any major projects.
The board’s description of internal controlsThe board’s responsibility for internal controls is regulated in the Swe-dish Companies Act and the Swedish Code of Corporate Governance,which set out requirements for annual external disclosures on howinternal controls over financial reporting are organised.Board members must keep themselves informed about the state of
affairs in the company and evaluate the internal control system on aregular basis.
Internal controls at ÅF are designed to ensure that the company’soperations are efficient and fit for purpose, that financial reporting isreliable, and that applicable laws and regulations are complied with.ÅF divides its internal controls over financial reporting into the fol-
lowing components: Control environment, Risk assessment, Controlactivities, Information and communication, and Follow-up.
Control environmentThe control environment constitutes the basis for internal controlsover financial reporting. One important aspect of the control environ-ment is that decision paths, authority and responsibility are clearlydefined and communicated between different levels of the organisa-tion, and that there are guidance documents in the form of policies,guidelines and manuals. The term “control environment” describes theorganisation, decision paths, authority and responsibility for financialreporting.A description of ÅF’s internal control system is included in the com-
pany’s process-orientated business management system (ONE) usedfor managing and supporting day-to-day business operations. Thissets out the organisational structure, together with the authority andresponsibility vested in the various roles in the business. The processorientation of the ONE management system guides users to the rele-vant routines and appropriate tools for the particular task in question,thus providing a sound basis for compliance with requirements andexpectations. The management system is available to all employeesvia the ÅF intranet.
Risk assessmentÅF’s risk assessment in respect of financial reporting aims to identifyand evaluate the key risks affecting financial reporting in the AF Group’scompanies, business areas, divisions and processes. Risk assessmentresults in control targets that help to ensure that the fundamentalrequirements of external financial reporting are met, and provide abasis for managing risk through a variety of control structures. Therisks are considered, assessed and reported by ÅF centrally togetherwith the divisions. Risks are also considered in specific constellations;for example, risks associated with fixed-price projects and acquisitions.
Control activitiesIn order to ensure that the business is run efficiently and that thescheduled financial reports consistently provide a true and fair view ofthe situation, each process has a number of built-in control activities.These involve all levels of the organisation, from the board and man-agement to other employees. Control activities aim to prevent, detectand rectify any errors and non-conformance. Risks are accepted,reduced or eliminated. At ÅF these control activities comprise twoelements: an organisation with clearly defined roles that facilitate an
C O R P O R AT E G O V E R N A N C E C O R P O R AT E G O V E R N A N C E R E P O R T

1 2 7
Å F A N N U A L R E P O R T 2 0 10
effective and, from an internal control perspective, appropriate divi-sion of responsibility; and specific activities that aim to identify orprevent the risk of reporting errors. For all ÅF units, including thoseoutside Sweden, result analysis and other control activities take placecontinuously through the finance functions of the various divisions andÅF AB’s Group Accounting and Reporting department. All accountingand reporting activities for ÅF’s Swedish operations are centralisedunder ÅF Business Services (ÅBS) in Solna, where the processes havebeen standardised and are continuously being made more robust.Control activities at ÅBS include profit analyses and other controlsin respect of revenue and receivables, payments, non-current assets,work in progress, wages and salaries, VAT/tax, book-keeping, con-solidation and reporting as well as the maintenance of databases.
Information & communicationInformation about and communication relating to policies, processdescriptions, routines and tools applicable to financial reports are con-tained in the management system that is available to the relevant per-sonnel via the ÅF intranet. Updates are carried out in the event of anychanges in internal or external requirements or expectations with regardto financial reports. The ÅF Group uses a process where divisionalmanagement confirms compliance with group policies each year.Communication with internal and external parties is governed by a
communication and IR policy, which sets out guidelines for the formthis should take. The policy aims to ensure that all disclosure obliga-tions are met properly and in full. Internal communication aims toensure that every employee understands ÅF’s values and businessactivities. Information is actively communicated on an ongoing basisthrough the group’s intranet in order to keep employees informed.
Follow-upCompliance and the efficacy of internal controls are followed up onan ongoing basis by both the board and management to guarantee thequality of the processes. The company’s financial situation and strat-egy in respect of its financial position are considered at every boardmeeting. The board also receives detailed monthly reports on thecompany’s financial position and the development of the business.The Audit Committee fulfils an important function by guaranteeingcontrol activities for key risk areas in the financial reporting process.The Audit Committee, management and the internal audit functionregularly follow up any reported non-conformances.ÅF’s system for financial management and control paves the way for
effective financial follow-ups throughout ÅF. Monthly reports are sub-mitted for each profit centre, and the reports on the financial perform-ance of assignments reflect the highest standards of reliability anddetail. Any errors that are identified and any measures that are takenare reported to the next level up in the line organisation. ÅF’s internal
audit function carries out independent audits to monitor whether theinternal control and management systems live up to ÅF’s internal ambi-tions and external requirements and expectations. Priority areas forÅF’s internal audits are the ÅF brand, ÅF’s values and ethics, processesand systems, as well as the assignments that ÅF has undertaken toperform. Reports are submitted to the President/CEO and the board’sAudit Committee.
Sustainable business developmentÅF is working strategically over the long term towards becoming a moresustainable business. A Sustainability Strategy forms an integral partof the corporate governance environment and is followed up by boththe board of directors and by senior management. A plan for ÅF’ssustainability activities forms the basis for the company’s work in thisarea. The Sustainability Plan and the objectives that this plan lays downare conceived to be profitable and otherwise beneficial from an environ-mental, social and economic perspective. For further details about thework that ÅF is engaged in with regard to sustainability, please seepages 51–56.
Stockholm, Sweden – 11 March 2011Board of Directors of ÅF AB
Auditor’s report on the Corporate Governance ReportTo the Annual General Meeting of ÅF AB, corporate identity number556120-6474
It is the Board of Directors that is responsible for the Corporate Gov-ernance Report for the year 2010 and for ensuring that it has beenprepared in accordance with the Swedish Annual Accounts Act.As a basis for our opinion that the Corporate Governance Report
has been prepared and is consistent with the annual accounts andthe consolidated accounts, we have read the report and assessedits statutory content based on our knowledge of the company.A Corporate Governance Statement has been prepared and its
statutory content is consistent with the annual accounts and theconsolidated accounts.
Stockholm, Sweden – 11 March 2011Ernst & Young AB
Lars TräffAuthorised Public Accountant
C O R P O R AT E G O V E R N A N C E C O R P O R AT E G O V E R N A N C E R E P O R T

Å F A N N U A L R E P O R T 2 0 10
BOARD OF DIRECTORSEva-Lotta KraftDirector of ÅF since 2002Born 1951Current position Various directorships and otherpositionsOther directorships Director of Biotage AB,Boule Diagnostics AB, Nibe Industrier AB, SamhallAB and Siemens ABProfessional experience Strategy & MarketingManager at the Swedish Defence Research Agency(FOI); Divisional Manager and Vice President ofSiemens-Elema AB; Regional Manager for AlfaLaval ABEducation M.Sc. Chemical Engineering, RoyalSwedish Institute of Technology (KTH); MBAInternational Entrepreneurship, Uppsala UniversityCommittee work Member of ÅF Audit CommitteeShares in ÅF 6,000
Björn O. NilssonDirector of ÅF since 2010Born 1956Current positionProfessor, President and Member of the RoyalSwedish Academy of Engineering Sciences, IVA;Associate Professor at Royal Swedish Institute ofTechnology (KTH)Other directorships Deputy Chair of Åforsk;Director of Bioinvent ABProfessional experienceR&D Manager Amersham Pharmacia Biotech; VicePresident Karo Bio; Director for Business andTechnical Development at Biacore InternationalAB; Business Development Manager at BiovitrumEducation Doctor of TechnologyShares in ÅF 0
Jon RisfeltDirector of ÅF since 2007Born 1961Current positionVarious directorships and consultant/advisorOther directorships Chairman of the Board ofOrtivus AB, C3 Technologies AB and Mawell OY;Director of Bilia AB, KaroBio AB, TeliaSonera AB,Braganza AS, Vanna AB, Ticket Travel Group AB,Ticket Leisure Travel AB and Ticket BusinessTravel ABProfessional experience Former leading mana-gerial positions with Ericsson, SAS, AmericanExpress Card & Travel Divisions, Nyman & Schultz(President), Europolitan and Vodafone Sweden(President), and Gambro Renal (President)Education M.Sc. Chemical Engineering, RoyalSwedish Institute of Technology (KTH)Shares in ÅF 3,250
Ulf DinkelspielChairman of the Board since 2007Director of ÅF since 2004Born 1939Current position Ambassador, E. Öhman J:or ABOther directorships Chairman of the Boardof Landshypotek AB, Sveriges AllmännaHypoteksbank, Springtime AB, the Sweden inEurope Foundation, the Association for SwedesWorldwide and ICC Sverige; Director of NordnetAB, Premiefinans AB and Bockholmen Hav ochRestaurang AB; Member of the Royal SwedishAcademy of Engineering Sciences, IVAProfessional experience Swedish Ministryfor Foreign Affairs; Minister for Europe;Minister for Trade; President Swedish TradeCouncilEducation Graduate business administrator,Stockholm School of EconomicsCommittee work Chair of ÅF RemunerationCommittee; Member of ÅF Audit CommitteeShares in ÅF 60,000
Patrik EnbladDirector of ÅF since 2007Born 1966Current position CEO of Newsec ABOther directorships Director of OrcSoftware, Neonet Securities and the RoyalSwedish Yacht Club (KSSS)Professional experience President HQ Bank;active in finance since 1986Education Economics studies (not completed)at Stockholm UniversityShares in ÅF 6,000
1 2 8
Å F A N N U A L R E P O R T 2 0 10
C O R P O R AT E G O V E R N A N C E B O A R D O F D I R E C T O R S

Å F A N N U A L R E P O R T 2 0 10
Helena SkåntorpDirector of ÅF since 2002Born 1960Other directorships Director ofMekonomen AB, Lernia AB and 2E Group ABProfessional experience President/CEO ofSBC; President/CEO of Jarowskij TelevisionAB; CFO of Arla AB; Authorised PublicAccountantEducation Economics programme,Stockholm UniversityCommittee work Chair of ÅF AuditCommitteeShares in ÅF 0
Anders SnellDirector of ÅF since 2009Born 1950Current position Active within Billerud ABOther directorships Chairman of the Boardof Åforsk; Director of Wibax AB and theSwedish Forest Industries Federation.Professional experience Plant manager ofBillerud Gruvön and Billerud Skärblacka;Technical Director with Billerud AB andAssiDomän ABEducation M.Sc. Chemistry, Royal SwedishInstitute of Technology (KTH)Shares in ÅF 0
Lena Treschow TorellDirector of ÅF since 2006Born 1946Current position Professor at ChalmersUniversity of Technology; Chair of thePresiding Committee of the Royal SwedishAcademy of Engineering Sciences, IVAOther directorships Chair of the Foundationfor Strategic Environmental Research(MISTRA); Chair of Euro-CASE, an umbrellaorganisation for Europe’s national academiesof science and technology; Director of SAABAB, Micronic Laser Systems AB, Investor AB,SKF AB, Dagens Industri AB and ChalmersUniversity of Technology Foundation; Memberof the Swedish government’s GlobalisationCouncil and the European Commission’sresearch advisory board, ERABCommittee work Member ÅF RemunerationCommitteeEducation Ph.D in Physics, University ofGothenburg; Research Fellowship in Physics,Chalmers University of TechnologyShares in ÅF 4,000
Fredrik SundinEmployee representative since 2009Born 1972Current position Employed in ÅF’sInfrastructure DivisionProfessional experience Signal processingconsultant, wireless ticketing systems andproject managementEducation M.Sc. Engineering Physics,Uppsala UniversityShares in ÅF 1,200
Patrik TillackEmployee representative since 2008Born 1967Current position Employed in ÅF’s IndustryDivisionProfessional experience Electrical engi-neer, electrical design engineer and con-tract/project manager in industry and publicadministrationEducation Upper secondary school engi-neering studies (Electrical Engineering/Telecommunications)Shares in ÅF 32
1 2 9
Å F A N N U A L R E P O R T 2 0 10
C O R P O R AT E G O V E R N A N C E B O A R D O F D I R E C T O R S

1 3 0
Å F A N N U A L R E P O R T 2 0 10
1 3 0
Jacob LandénGeneral Counsel since 2008Member of senior management team since 2009Employed by ÅF since 2008 Born 1965Professional experience Legal professionEducation LL.B., Uppsala UniversityShares in ÅF 989
Johan OlssonPresident, Technology Division since 2005Member of senior management team since2005Employed by ÅF since 2005 Born 1956Directorships Director of the SwedishFederation of Consulting Engineers andArchitects (STD)Professional experience President of HiQSkåne AB; R&D Manager for Ericsson CanadaEducation M.Sc., Royal Swedish Institute ofTechnology (KTH)Shares in ÅF 12,511
Jonas WiströmPresident and CEO since 2002Employed by ÅF since 2002Born 1960Directorships etc. Director of Procure It RightAB; Member of the Royal Swedish Academy ofEngineering Sciences (IVA)Professional experience Philips, Saab-ScaniaCombitech AB; President Sun MicrosystemsSweden; Managing Director (Northern Europe)Silicon Graphics; President/CEO Prevas ABEducation M.Sc., Royal Swedish Institute ofTechnology (KTH)Shares in ÅF 24,287
Mats PåhlssonPresident, Infrastructure Division since 2010Member of senior management team since 2010Employed by ÅF since 2009 Born 1954Professional experience Manager at Skanska;Managing Director of SWECO VBB Viak and SWECOVBB; Business Area Manager for ÅF InfrastructurePlanningEducation M.Sc. Civil Engineering, Luleå University ofTechnologyShares in ÅF 1,049
SENIORMANAGEMENT
Eero AurannePresident, Energy Division since 2006Member of senior management team since 2006Employed by ÅF since 2006 Born 1959Professional experience President FortumService; Vice President Fortum Power and Heat OyEducation M.Sc., Helsinki University of TechnologyShares in ÅF 3,629
C O R P O R AT E G O V E R N A N C E

1 3 1
Å F A N N U A L R E P O R T 2 0 10
1 3 1
Jonas ÅgrupCFO since 2007Member of senior management team since 2007Employed by ÅF since 2007Born 1960Professional experience Vice President FinanceAtlas Copco Tools & Assembly Systems; CFO CardoIndustrial Doors; Vice President WM-data SwedenEducation Graduate business administrator,Stockholm UniversityShares in ÅF 4,349
Charlotte WittDirector, Human Resources since 2001Member of senior management team since 2009Employed by ÅF since 2001 Born 1964Professional experience Chief Negotiator for Almega(the employer and trade organisation for the Swedishservice sector); Ombudsman for Jusek (the Swedish tradeunion for graduates in the legal profession, businessadministration and economics)Education B.A. in Economics, Örebro UniversityShares in ÅF 1,397
Marie EdmanPA to the President since 2010Member of senior management team since 2010Employed by ÅF since 2010 Born 1953Professional experience PA to the President at Proffice,Electrolux Cleaning Appliances and SkandexEducation Managerial Secretary studies at FridhemsplanUpper Secondary School/Stockholm University; PR &Business Communication, IHM Business SchoolShares in ÅF 600
Viktor SvenssonExecutive Vice President, Corporate Informationsince 2003Member of senior management team since 2003Employed by ÅF since 2003 Born 1975Professional experience Stock market reporterwith FinanstidningenEducation Graduate business administrator,Karlskrona/Ronneby University CollegeShares in ÅF 7,307
Per MagnussonPresident, Industry Division since 2006Member of senior management team since 2006Employed by ÅF since 2006 Born 1954Professional experience Plant engineer at ASEA AB;Consultant Rejlers Ingenjörer AB; Consulting ManagerJ&W AB, Sigma AB; Managing Director of Benima ABEducation Electrical Power Engineering, PolhemTechnical Upper Secondary School, and advanced sup-plementary courses in economics, marketing and busi-ness development, KTH Executive SchoolShares in ÅF 2,575

1 3 2
Å F A N N U A L R E P O R T 2 0 10
Entitlement to attendShareholders who wish to participate in the Annual General Meetingmust:• have their names entered in the shareholders’ register maintainedby Euroclear Sweden AB by Tuesday 26 April 2011 at the latest, and
• confirm their intention to participate to the company’s head officeby 16.00 (4.00 pm) on Wednesday 27 April 2011 at the latest.
Shareholders who have elected to use a nominee for their sharehold-ing must temporarily re-register their shares in their own name if theywish to exercise the right to participate in the Annual General Meet-ing. Shareholders who wish to do this must inform their nominee oftheir intention in good time before 26 April.
RegistrationNotice of an intention to participate in the Annual General Meetingmay be made to:ÅF ABLegalSE-169 99 Stockholm,Sweden
or via the ÅF Group website: www.afconsult.com/agm2011
Please specify your name, personal or corporate identity number,address, phone number and your registered shareholding. The notifi-cation of attendance must be accompanied by documentary proof of
entitlement to attend the meeting (power of attorney, registrationcertificate, etc.).The official call to attend the AGM is published on the ÅF Group
website: www.afconsult.com
DividendThe Board of Directors proposes a dividend to shareholders of SEK4.00 per share. It is proposed that Thursday 5 May 2011 be made therecord day for the right to receive this dividend. It is anticipated thatpayment will be made via Euroclear Sweden on Tuesday 10 May.
Financial reporting schedule for 2011Interim report (3 months): 2 MayInterim report (6 months): 14 JulyInterim report (9 months): 17 October
ÅF’s annual Capital Market Day will be held in September.
The annual report is published in a Swedish and an English versionand sent to all shareholders who request a printed copy. Orders canbe placed via the website www.afconsult.com or over the phone.Downloadable PDF versions of the annual report and other financialreports are available on the Group’s website.
Shareholders in ÅF AB (publ) are invited to the Annual General Meeting that will commence at17.00 (5.00 pm) on Monday 2 May 2011 at the company’s head office (address: Frösundaleden 2,Solna, Sweden).
ANNUAL GENERAL MEETING
C O R P O R AT E G O V E R N A N C E A N N U A L G E N E R A L M E E T I N G

THISISÅF
OPERATIONS
ANNUA
LREPORT
CORPO
RATE
GOVERNANCE
66 Administration report70 Consolidated income statement71 Statement of consolidated comprehensive income72 Consolidated balance sheet74 Statement of change in equity for Group75 Statement of cash flows for Group76 Parent income statement77 Statement of comprehensive income for Parent78 Parent balance sheet80 Statement of change in equity for Parent81 Statement of cash flows for Parent83 Notes121 Audit report
22 Energy28 Industry34 Infrastructure40 Technology46 ÅF shares50 Sustainability is profitability51 Sustainability report58 Risk management and sensitivity analysis63 Definitions64 Five-year financial summary, SEK65 Five-year financial summary, EUR
1 The year at a glance2 This is ÅF4 A message from the President6 Mission, vision, strategies and objectives9 Olympic Green Advisor11 Market trends and business review14 Human resources
ÅF is continuously developing its consulting businessand its capacity to carry out its assignments in thebest possible way. The ambition is clear: to safe-guard successful, long-term sustainable develop-ment for ÅF’s clients and for ÅF itself.
page 8
Striving for profitability and wanting to make theworld a better place aren’t mutually exclusive.Quite the opposite, in fact. A sustainable companyis a long-term venture, which lays the foundationsfor good profitability over time.
page 50
In 2010 ÅF made a number of acquisitions in Europein line with its strategy of becoming number one ortwo in the markets where the company is active.
page 67
The board works to continuously improve the effec-tiveness of its routines and working methods in orderto be able to devote as much time as possible toimportant strategic discussions.
page 122
122 Corporate governance at ÅF123 Corporate governance report128 Board of directors130 Senior management132 Annual general meeting
133 ÅF offices
The English version of the Annual Report of ÅF AB is a translation of the Swedish original. The Swedish text is the binding version and shall prevail in the event of any discrepancies.Å F A N N U A L R E P O R T 2 0 1 0
1 3 3Å F O F F I C E S
Group Head OfficeÅF ABVisitor’s address: Frösundaleden 2, SolnaPost address: SE-169 99 Stockholm, SwedenTel +46 10 505 00 00
Fax – Senior Management: +46 8 653 56 13Fax – Reception: +46 10 505 00 10For further information about addresses,please see www.afconsult.com
SwedenAlingsåsArbogaBorlängeBoråsEnköpingEskilstunaFalunGällivareGävleGothenburgHalmstadHelsingborgHässleholmJönköpingKalmarKarlskogaKarlskronaKarlstadKirunaKristianstadLinköpingLuleåMalmöMora
NorrköpingNynäshamnOskarshamnPiteåSkaraSkellefteåSkövdeSollefteåStenungsundStockholmSundsvallSöderhamnSödertäljeTavelsjöTrollhättanUddevallaUmeåUppsalaVarbergVästeråsVäxjöÅmålÖrebroÖrnsköldsvikÖstersund
Czech RepublicBrnoMêlnikPardubicePlzenPrag
DenmarkCopenhagenHerlevRandersKalundborg
EstoniaNarvaTallinnViljandiVöru
FinlandTampereVantaa
GermanyHamburg
IndiaNew Delhi
IndonesiaJakarta
ItalyRome
KazakhstanAstana
LithuaniaKaunasVilnius
NigeriaGarki Abuja
NorwayBodöLilleströmOsloSandefjordMoss
RussiaMoscowSt PetersburgYekaterinburg
ScotlandEdinburgh
South AfricaDurban
SpainMadridSan Sebastian
SwitzerlandBaden
ThailandBangkok
TurkeyAnkara
TurkmenistanAschabad
UkraineKremenchuk
VietnamHanoi
A110418-02Produced by Solberg in collaboration with the ÅF Group’s CorporateInformation and Corporate Finance Departments. Printed by Elanders.Photos: Peter Bartholdsson and others. Translation: AB Språkman.
A brief historical summaryOn 23 February 1895 Södra Sveriges Ångpanneförening was created when anumber of steam generator owners in the south of Sweden joined forces withthe aim of preventing accidents and making more efficient use of steam power.
In the 115 years that have elapsed since then, ÅF has played a key role in theindustrial developments that have revolutionised society.
The company has guided its clients through four major technology changes –steam, electricity, nuclear power and computerisation – and remained at the fore-front of technology both in the industrial era and in today’s information society.
AB Ångpanneföreningen was first listed on the Stockholm Stock Exchangein January 1986. On 5 May 2008 AB Ångpanneföreningen changed its name toÅF AB, and today it is one of Europe’s largest technical consulting companies.
ÅF OFFICES

ÅF – leading the way in technical consulting.Our work focuses on energy and the environment,
investments in infrastructure and projects for industry.Our base is in Europe, but our business and clients
extend right across the globe.What makes us unique is our co-workers and the tech-
nical consulting industry’s greatest bank of experience.It’s all summed up in our corporate motto:
“ÅF – innovation by experience.”
Tel +46 10 505 00 00www.afconsult.com
ÅFANNUALREPORT2010
ANNUAL REPORT 2010

![ThinkSystem ST50 - lenovojp.com · ThinkSystem ST50 (7Y49[1年保証],7Y48[3年保証]) System Guide 2019年10月08日版 このカタログに記載されているオプション・サポート状況および価格は2019年10月08日現在のもので、事前の予告なしに](https://img.pdfslide.tips/doc/110x75/5e16ab724366e94f2b559efa/thinksystem-st50-thinksystem-st50-7y491e7y483e-system-guide.jpg)
![dhb'/åf/f dhb'/sf nflu g]kfnsf] klxnf] klqsf · dhb'/åf/f dhb'/sf nflu g]kfnsf] klxnf] klqsf; ... cGgsf bfgfx¿ lk:b}5g\ ... +u7g / ;dsfnLg ljZj, ;f];n Snh;DaGwL ljjfb, o'/f]k]nL](https://img.pdfslide.tips/doc/110x75/5b1dde257f8b9a234e8b662e/dhbaff-dhbsf-nflu-gkfnsf-klxnf-klqsf-dhbaff-dhbsf-nflu-gkfnsf.jpg)
![C â *ßÖú - Hindawiûÿ ã p ã +ßõ*,ß àÕ ÑP _ P Pj U P d Ñäf| ã j P d_ÿ äf| ã åf g\ Uj á U rJ Ñ Pj ßÿ Ñ fZ ß j åf g] ã U P ÿ ù@ ã ÿ ÑüPm ã T ëPSR ûP](https://img.pdfslide.tips/doc/110x75/5e51b266bb614c5f912c8be5/c-hindawi-p-p-p-pj-u-p-d-f-j.jpg)
![P]g ;+Vof · 2018. 8. 2. · 1 :ju{åf/L gu/kflnsf :ju{åf/L gu/kflnsfsf] cfly{s P]g –@)&% gu/ सभाबाट:jLs[t ldlt M=@)&%.#.!! k|dfl0fs/0f ldlt M :ju{åf/L gu/kflnsf k|b]z](https://img.pdfslide.tips/doc/110x75/610397bd82cc785760514476/pg-vof-2018-8-2-1-jufl-gukflnsf-jufl-gukflnsfsf-cflys-pg.jpg)