Embed Size (px)
Citation preview
Air Pollution Abatement Implications of Advanced Cellulosic Biorefineries
2006 Air Innovations ConferenceSeptember 6-8, 2006
Denver, Colorado
Ed Lehrburger, Kiran L. Kadam, Carl Lehrburger
PureVision Technology, Inc.511 N. McKinley Ave., Fort Lupton, CO 80621 (USA)
www.PureVisionTechnology.com
PureVision Technology, Inc. Presentation Outline
• The PureVision biorefining process• Sugar platform − Quantitative analysis of
ethanol production• Pulp and paper platform − Qualitative
assessment• Conclusions & recommendations for future
work
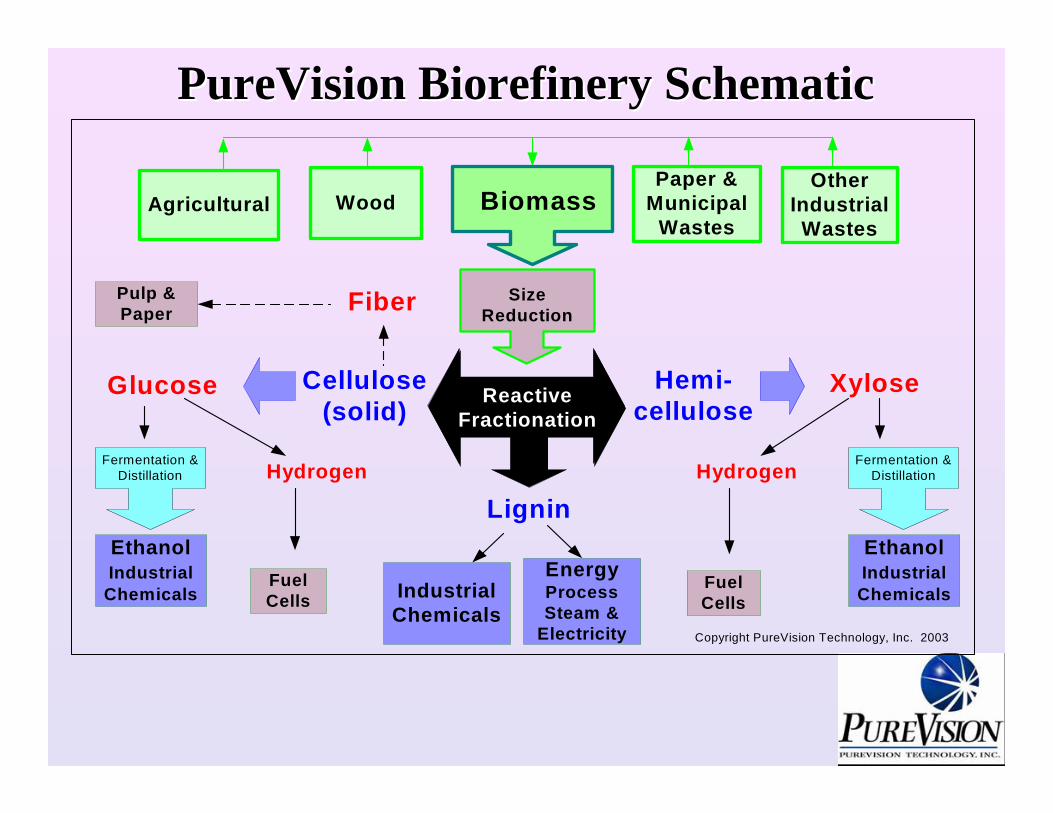
SizeReduction
Hemi-cellulose
Lignin
Fiber
Xylose
Agricultural WoodPaper &
MunicipalWastes
OtherIndustrialWastes
Copyright PureVision Technology, Inc. 2003
Fermentation &Distillation
EthanolIndustrial
Chemicals
Fermentation &Distillation
BiomassFractionation
Glucose Cellulose(solid)
Biomass
FuelCells
Hydrogen
Pulp &Paper
ReactiveFractionation
Hydrogen
FuelCells
EthanolIndustrialChemicalsIndustrial
Chemicals
EnergyProcessSteam &
Electricity
PureVision Biorefinery SchematicPureVision Biorefinery Schematic
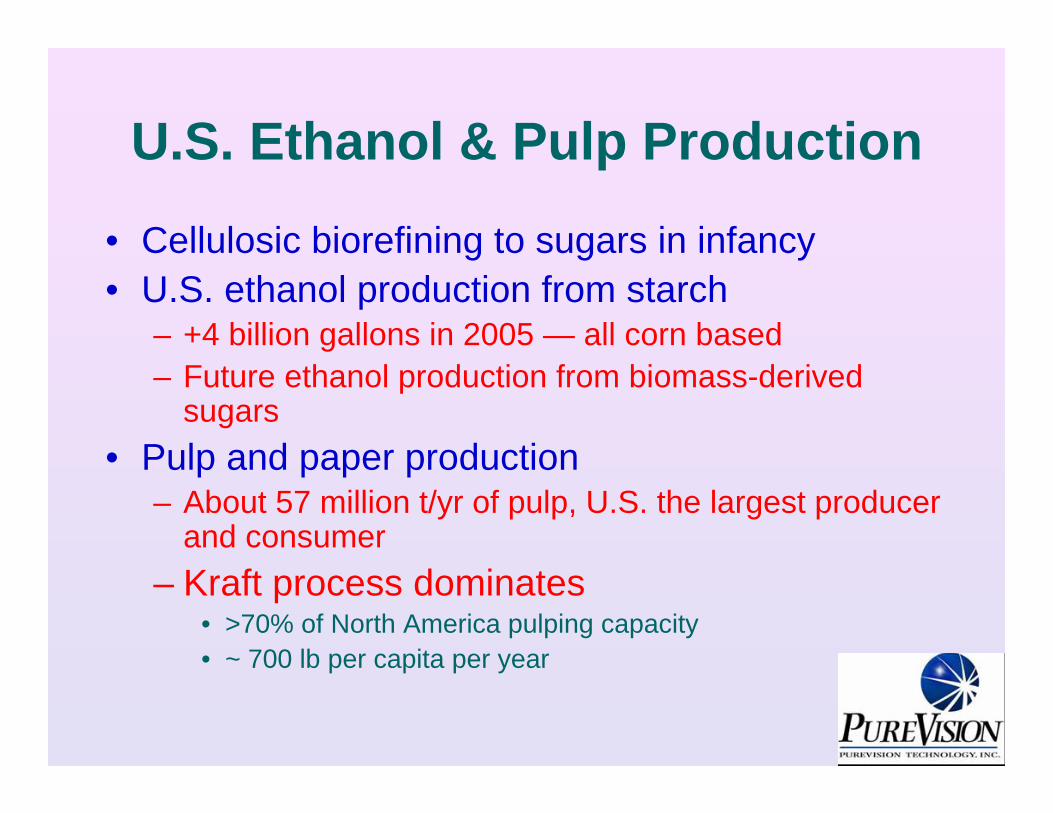
U.S. Ethanol & Pulp Production
• Cellulosic biorefining to sugars in infancy• U.S. ethanol production from starch
– +4 billion gallons in 2005 — all corn based– Future ethanol production from biomass-derived
sugars• Pulp and paper production
– About 57 million t/yr of pulp, U.S. the largest producer and consumer
– Kraft process dominates• >70% of North America pulping capacity• ~ 700 lb per capita per year
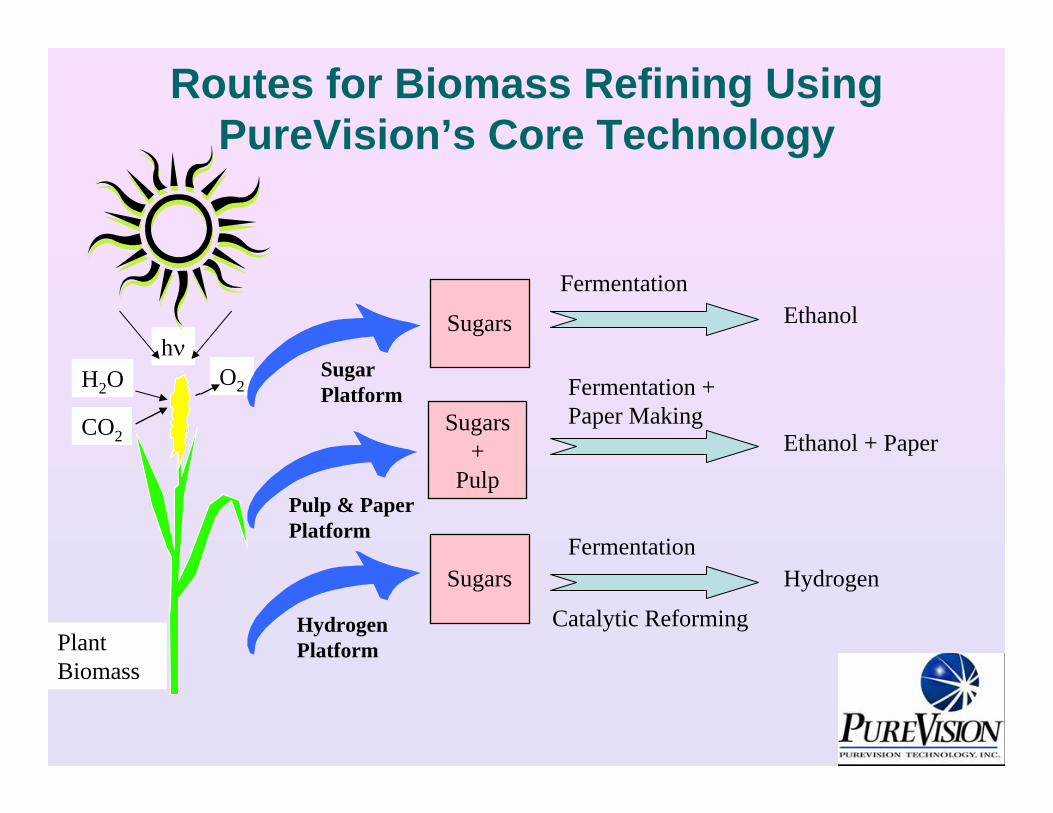
hν
Sugars +
Pulp
Sugars
PlantBiomass
H2O
CO2
O2
Pulp & PaperPlatform
HydrogenPlatform
SugarPlatform
FermentationEthanol
Fermentation +Paper Making
Ethanol + Paper
HydrogenSugarsFermentation
Routes for Biomass Refining Using PureVision’s Core Technology
Catalytic Reforming
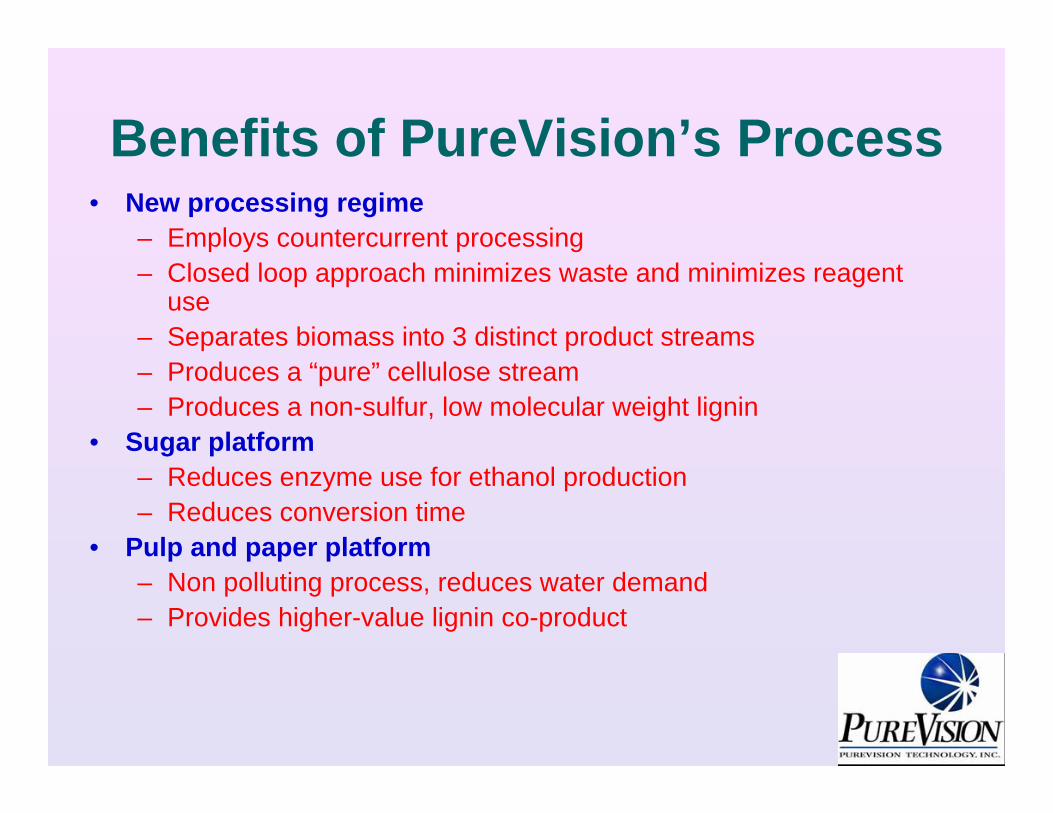
Benefits of PureVision’s Process• New processing regime
– Employs countercurrent processing– Closed loop approach minimizes waste and minimizes reagent
use– Separates biomass into 3 distinct product streams– Produces a “pure” cellulose stream– Produces a non-sulfur, low molecular weight lignin
• Sugar platform– Reduces enzyme use for ethanol production– Reduces conversion time
• Pulp and paper platform– Non polluting process, reduces water demand– Provides higher-value lignin co-product
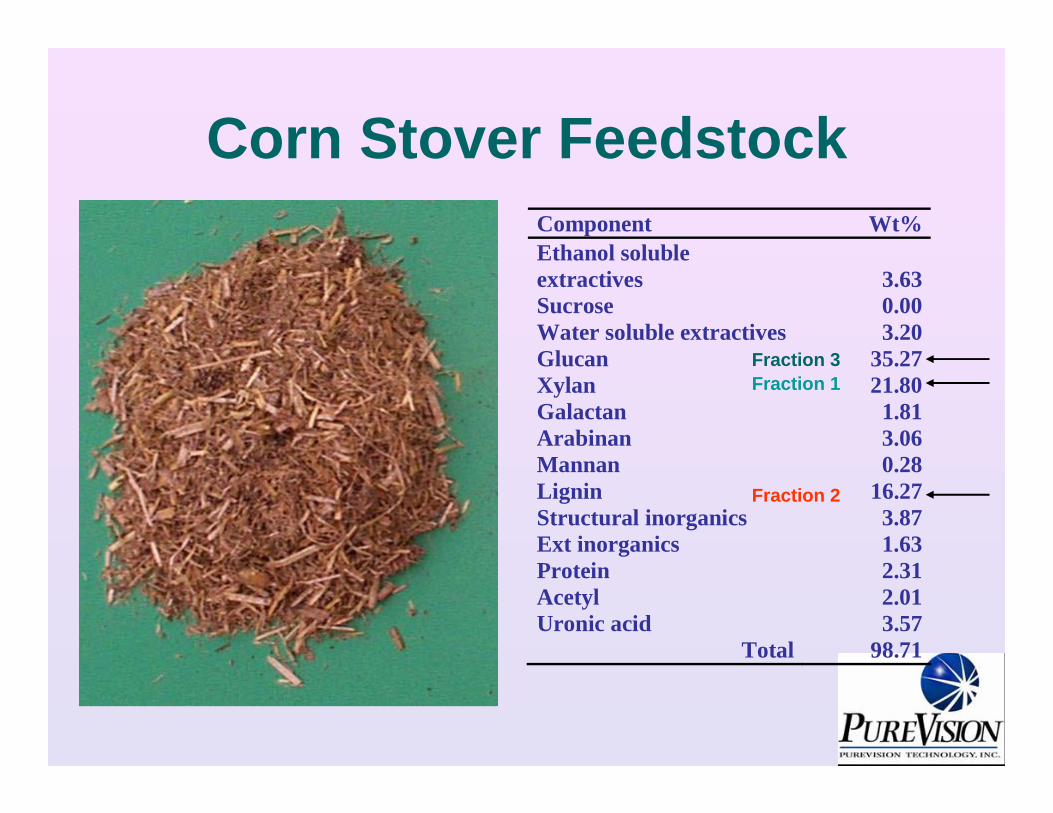
Corn Stover FeedstockComponent Wt%Ethanol soluble extractives 3.63Sucrose 0.00Water soluble extractives 3.20Glucan 35.27Xylan 21.80Galactan 1.81Arabinan 3.06Mannan 0.28Lignin 16.27Structural inorganics 3.87Ext inorganics 1.63Protein 2.31Acetyl 2.01Uronic acid 3.57
Total 98.71
Fraction 3Fraction 1
Fraction 2
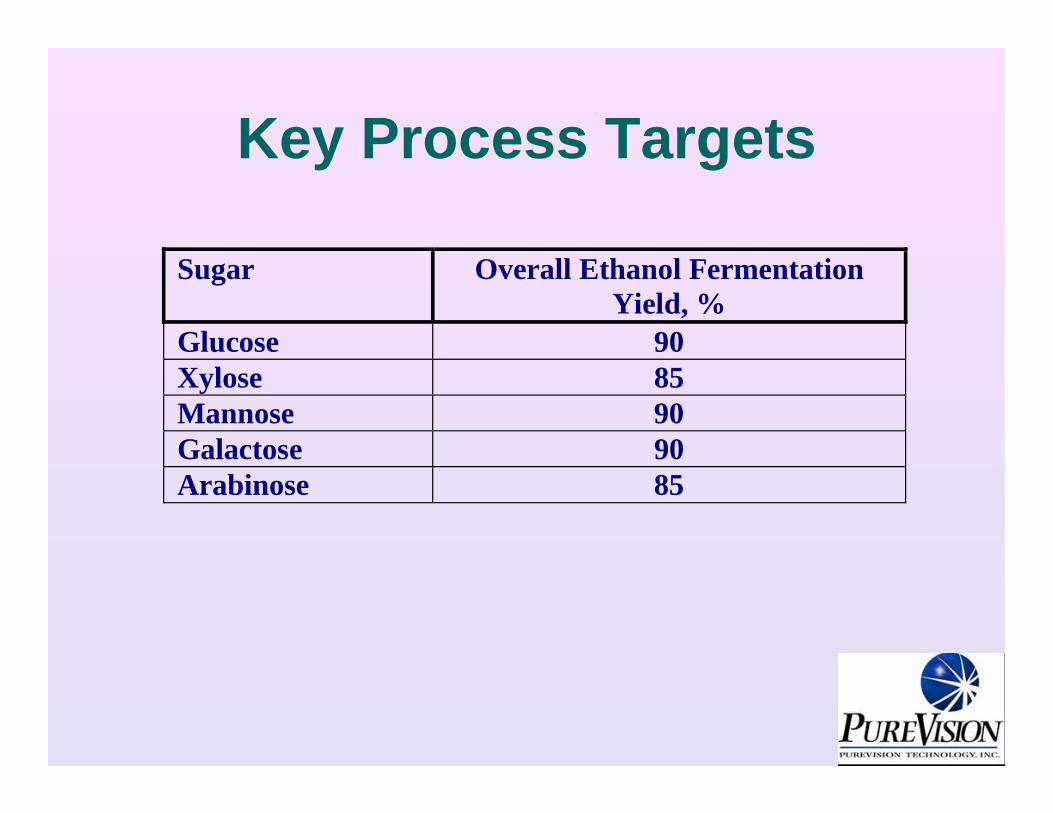
Key Process Targets
Sugar Overall Ethanol Fermentation Yield, %
Glucose 90 Xylose 85 Mannose 90 Galactose 90 Arabinose 85
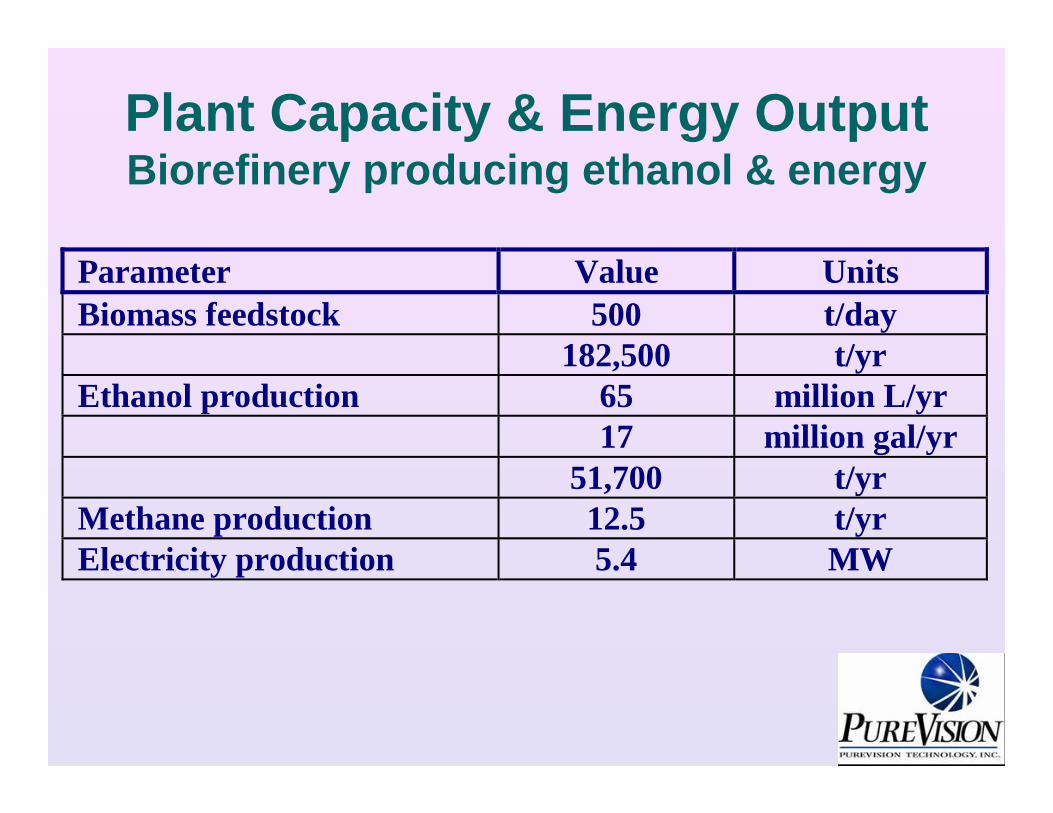
Plant Capacity & Energy OutputBiorefinery producing ethanol & energy
Parameter Value Units Biomass feedstock 500 t/day 182,500 t/yr Ethanol production 65 million L/yr 17 million gal/yr 51,700 t/yr Methane production 12.5 t/yr Electricity production 5.4 MW
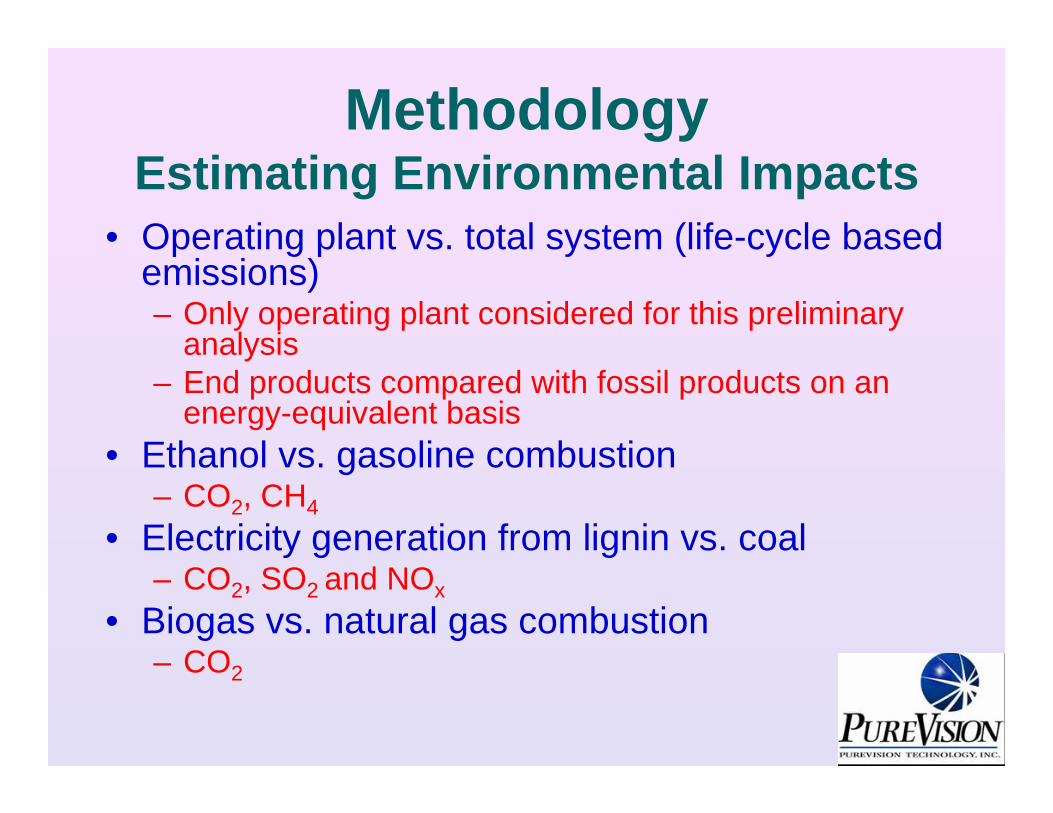
MethodologyEstimating Environmental Impacts
• Operating plant vs. total system (life-cycle based emissions)– Only operating plant considered for this preliminary
analysis– End products compared with fossil products on an
energy-equivalent basis• Ethanol vs. gasoline combustion
– CO2, CH4
• Electricity generation from lignin vs. coal– CO2, SO2 and NOx
• Biogas vs. natural gas combustion– CO2
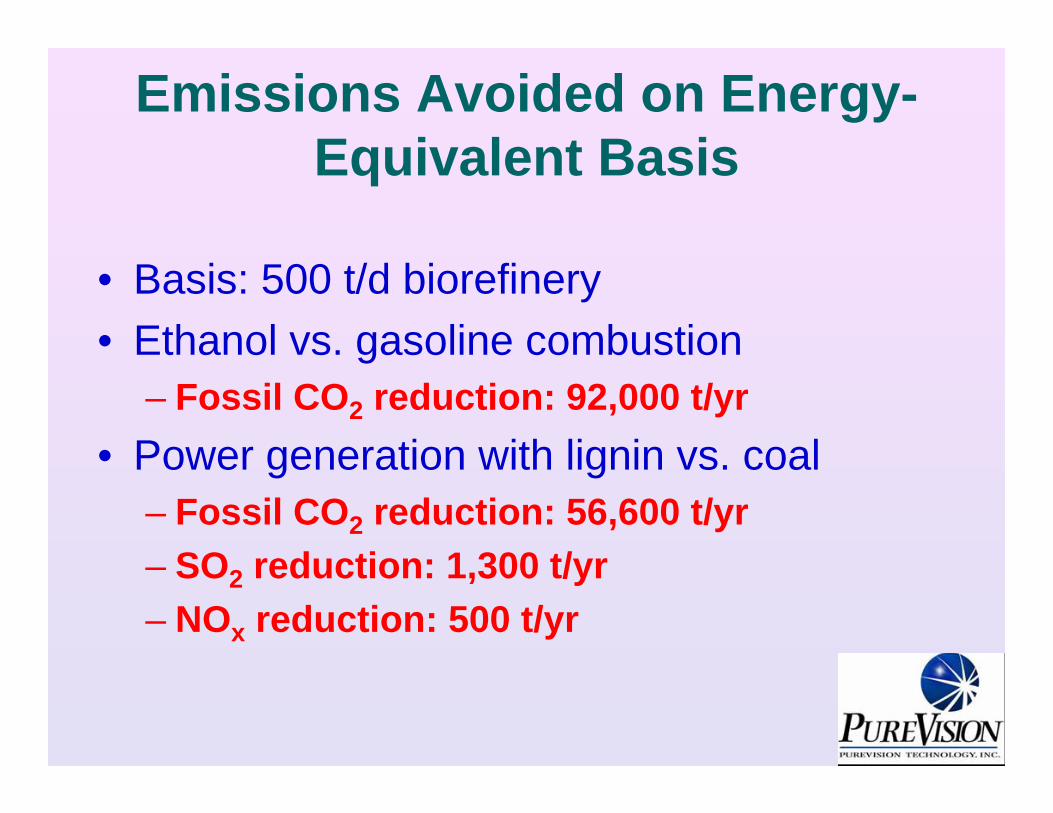
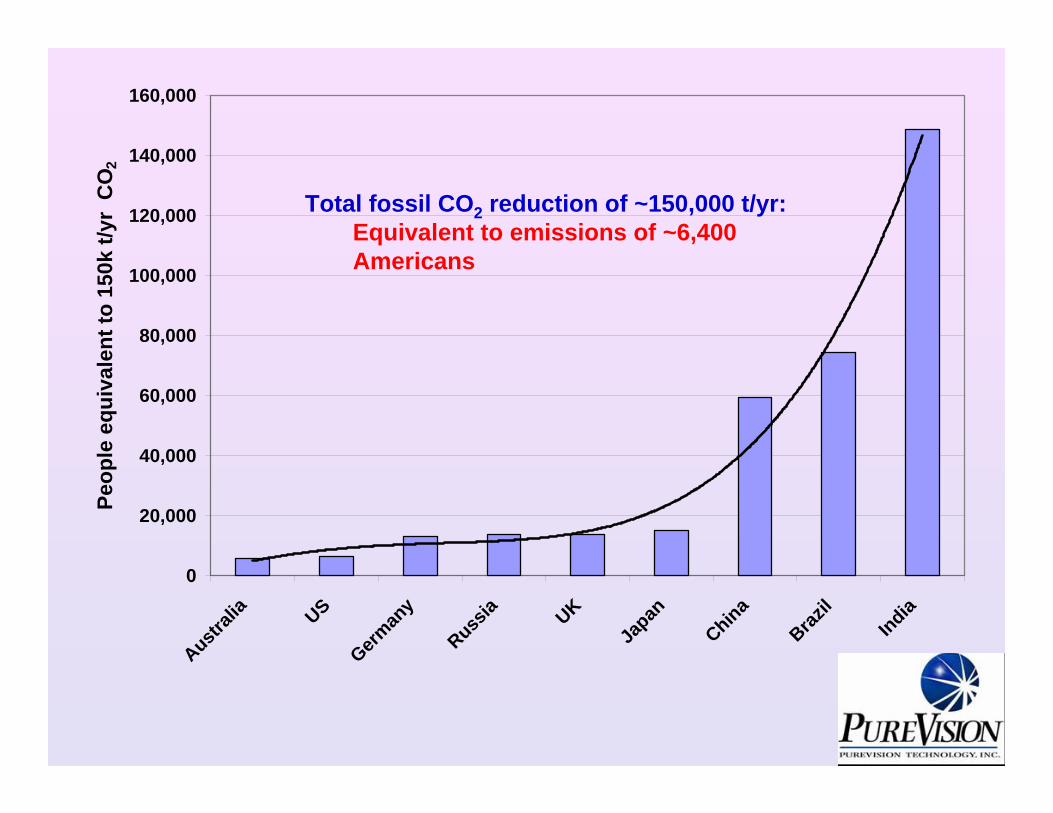
Emissions Avoided on Energy-Equivalent Basis
• Basis: 500 t/d biorefinery• Ethanol vs. gasoline combustion
– Fossil CO2 reduction: 92,000 t/yr• Power generation with lignin vs. coal
– Fossil CO2 reduction: 56,600 t/yr– SO2 reduction: 1,300 t/yr– NOx reduction: 500 t/yr
0
5
10
15
20
25
30
Australia US Germany Russia UK Japan China Brazil India
Per c
apita
CO
2 em
issi
ons,
t/yr
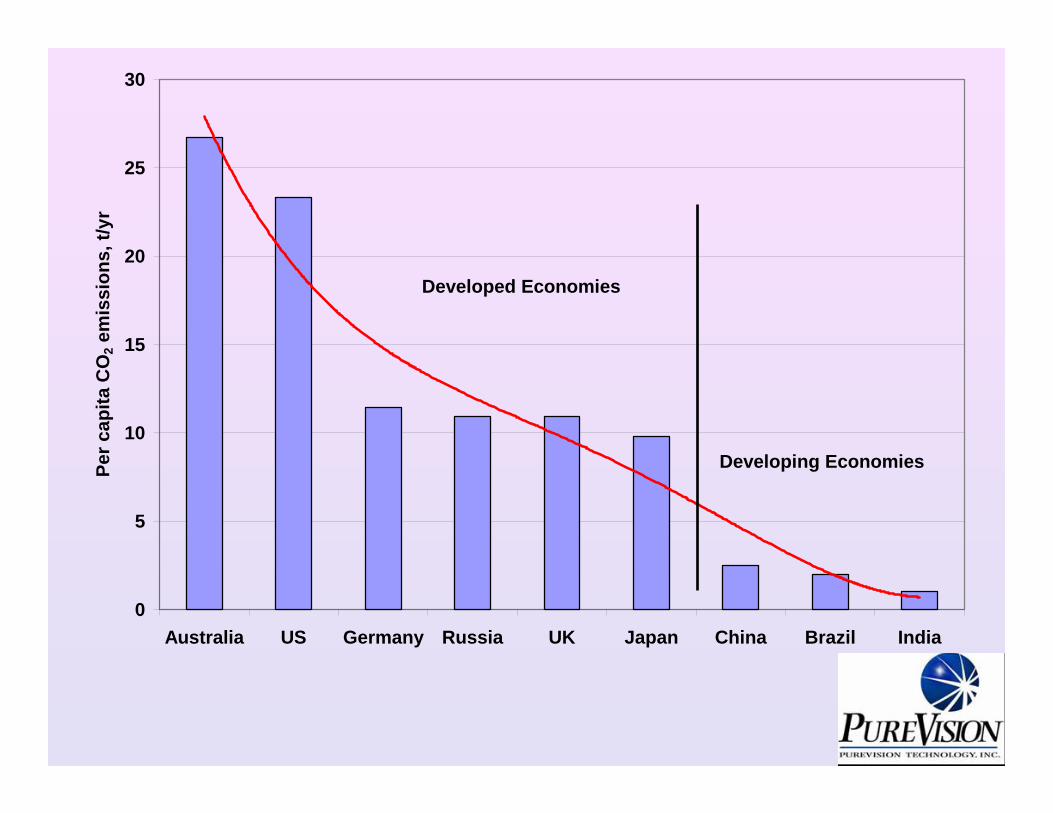
Developed Economies
Developing Economies
0
20,000
40,000
60,000
80,000
100,000
120,000
140,000
160,000
Australi
a US
German
y
Russia UK
Japan
China
Brazil
IndiaPe
ople
equ
ival
ent t
o 15
0k t/
yr C
O2
Total fossil CO2 reduction of ~150,000 t/yr:Equivalent to emissions of ~6,400 Americans
Externalities• Markets do not take into account
– Depletion of scarce natural resources– Denigration of the environment
• Such market failure = “externality”– Specific economic values remain “external” to
the market’s price-setting mechanism• True price of product or service should
capture cost of externalities• GHG emissions not regulated in the U.S.
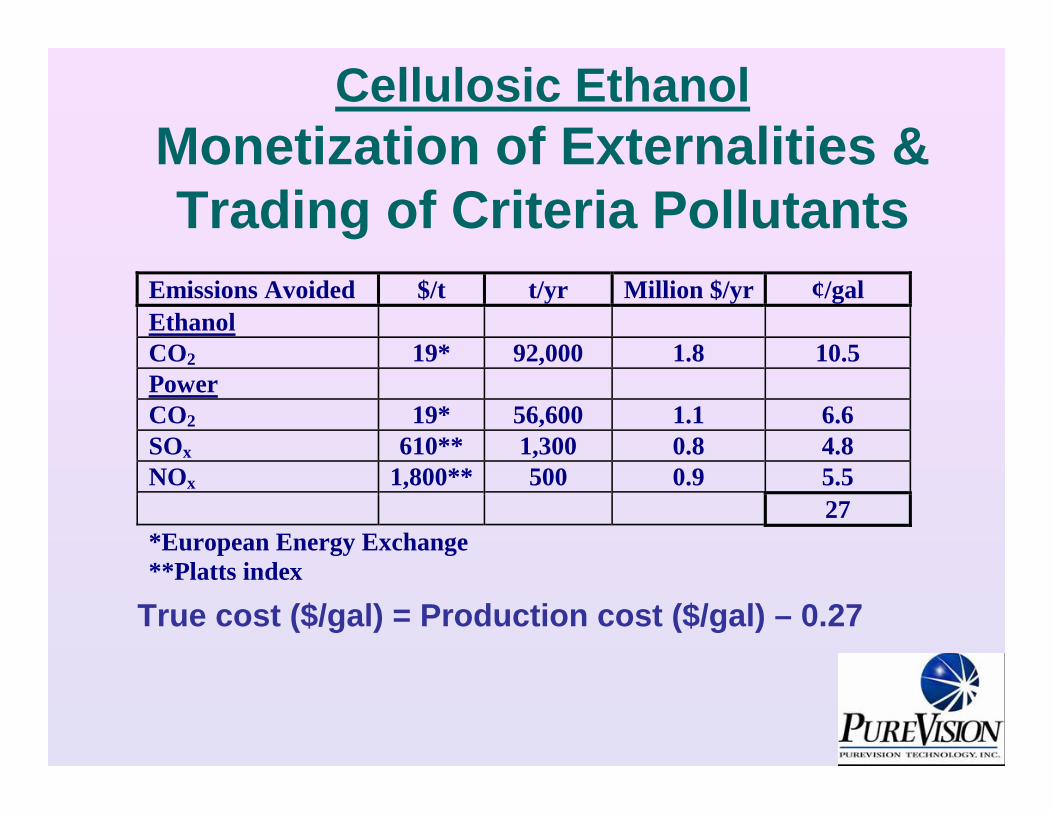
Cellulosic EthanolMonetization of Externalities & Trading of Criteria Pollutants
True cost ($/gal) = Production cost ($/gal) – 0.27
Emissions Avoided $/t t/yr Million $/yr ¢/gal Ethanol CO2 19* 92,000 1.8 10.5 Power CO2 19* 56,600 1.1 6.6 SOx 610** 1,300 0.8 4.8 NOx 1,800** 500 0.9 5.5 27 *European Energy Exchange **Platts index
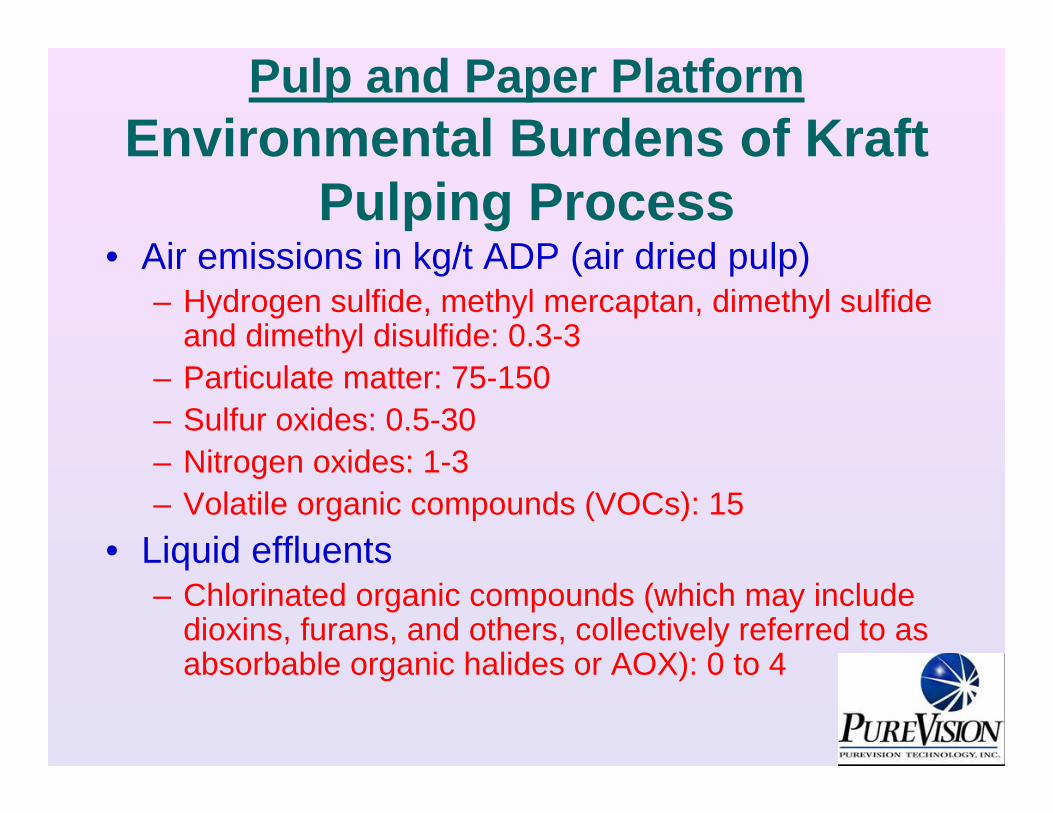
Pulp and Paper PlatformEnvironmental Burdens of Kraft
Pulping Process• Air emissions in kg/t ADP (air dried pulp)
– Hydrogen sulfide, methyl mercaptan, dimethyl sulfide and dimethyl disulfide: 0.3-3
– Particulate matter: 75-150– Sulfur oxides: 0.5-30– Nitrogen oxides: 1-3– Volatile organic compounds (VOCs): 15
• Liquid effluents– Chlorinated organic compounds (which may include
dioxins, furans, and others, collectively referred to as absorbable organic halides or AOX): 0 to 4
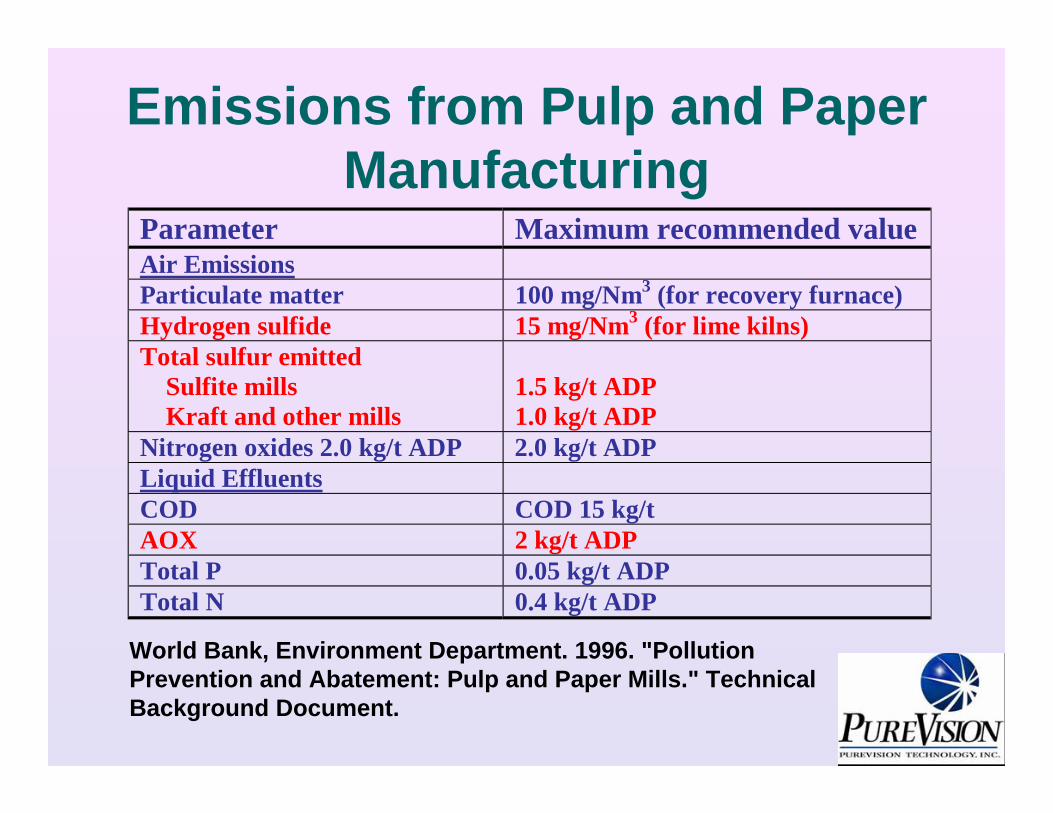
Emissions from Pulp and Paper Manufacturing
World Bank, Environment Department. 1996. "Pollution Prevention and Abatement: Pulp and Paper Mills." Technical Background Document.
Parameter Maximum recommended valueAir Emissions Particulate matter 100 mg/Nm3 (for recovery furnace) Hydrogen sulfide 15 mg/Nm3 (for lime kilns) Total sulfur emitted Sulfite mills Kraft and other mills
1.5 kg/t ADP 1.0 kg/t ADP
Nitrogen oxides 2.0 kg/t ADP 2.0 kg/t ADP Liquid Effluents COD COD 15 kg/t AOX 2 kg/t ADP Total P 0.05 kg/t ADP Total N 0.4 kg/t ADP
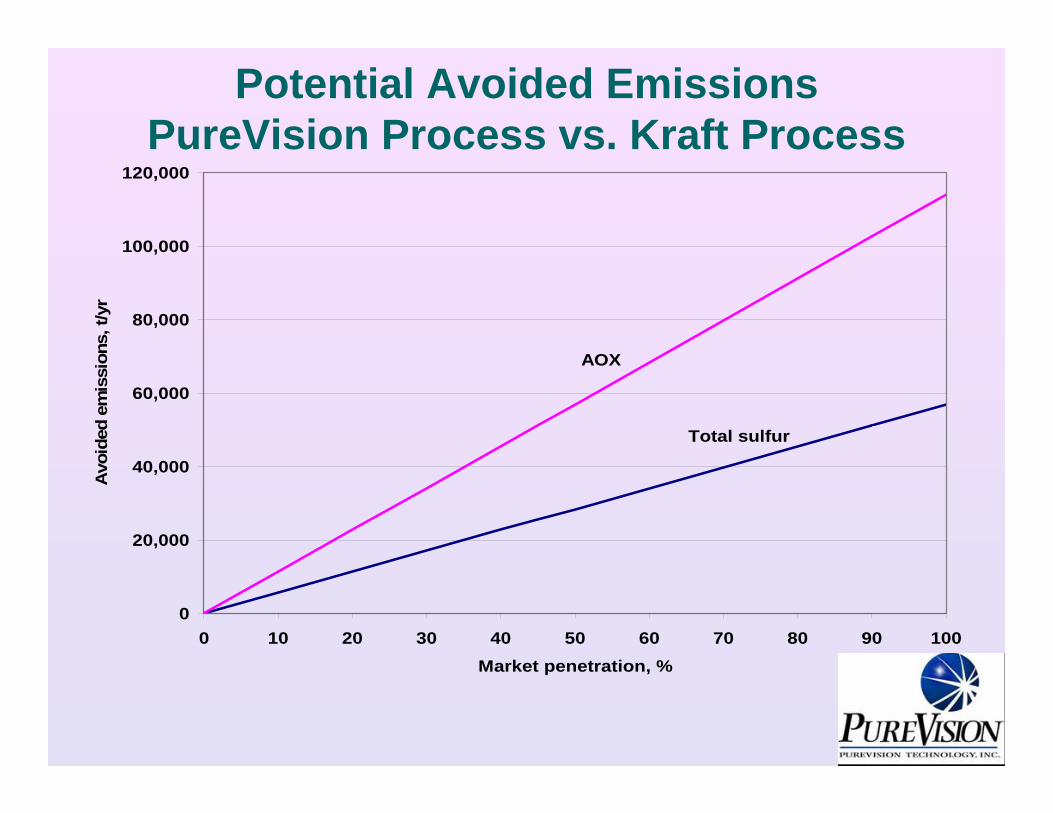
0
20,000
40,000
60,000
80,000
100,000
120,000
0 10 20 30 40 50 60 70 80 90 100Market penetration, %
Avo
ided
em
issi
ons,
t/yr
AOX
Total sulfur
Potential Avoided EmissionsPureVision Process vs. Kraft Process
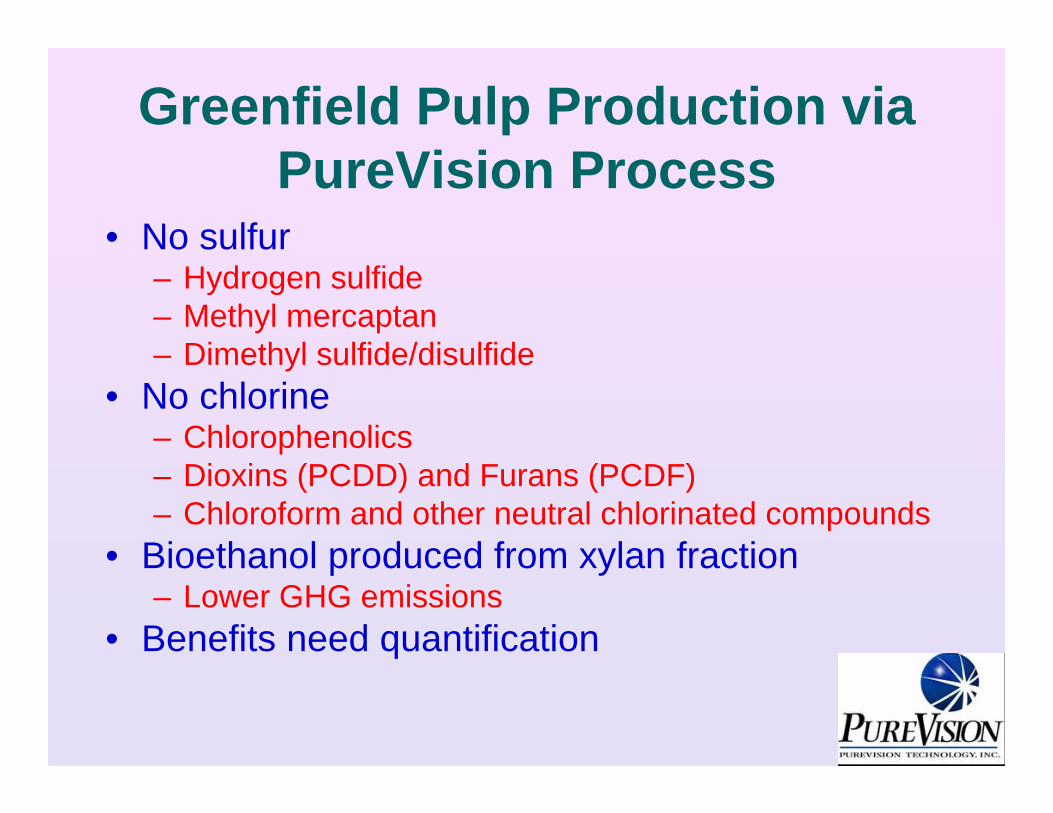
Greenfield Pulp Production via PureVision Process
• No sulfur– Hydrogen sulfide– Methyl mercaptan– Dimethyl sulfide/disulfide
• No chlorine– Chlorophenolics– Dioxins (PCDD) and Furans (PCDF)– Chloroform and other neutral chlorinated compounds
• Bioethanol produced from xylan fraction– Lower GHG emissions
• Benefits need quantification
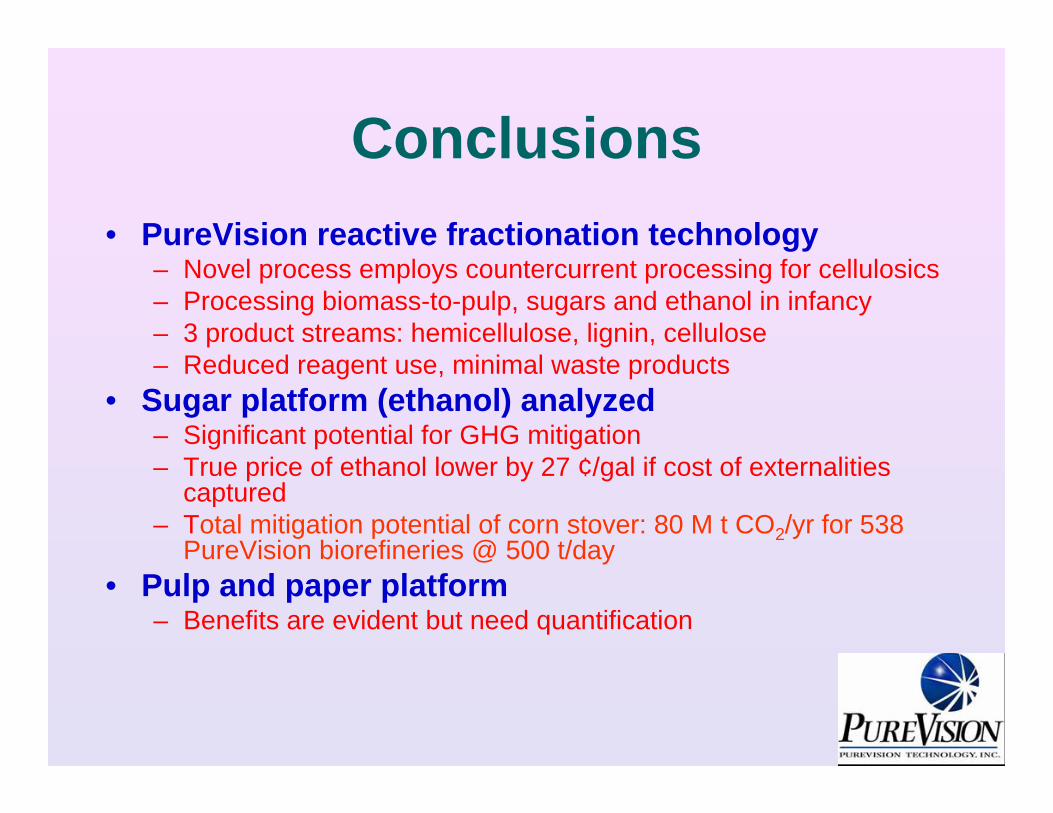
Conclusions• PureVision reactive fractionation technology
– Novel process employs countercurrent processing for cellulosics – Processing biomass-to-pulp, sugars and ethanol in infancy– 3 product streams: hemicellulose, lignin, cellulose– Reduced reagent use, minimal waste products
• Sugar platform (ethanol) analyzed– Significant potential for GHG mitigation– True price of ethanol lower by 27 ¢/gal if cost of externalities
captured– Total mitigation potential of corn stover: 80 M t CO2/yr for 538
PureVision biorefineries @ 500 t/day• Pulp and paper platform
– Benefits are evident but need quantification
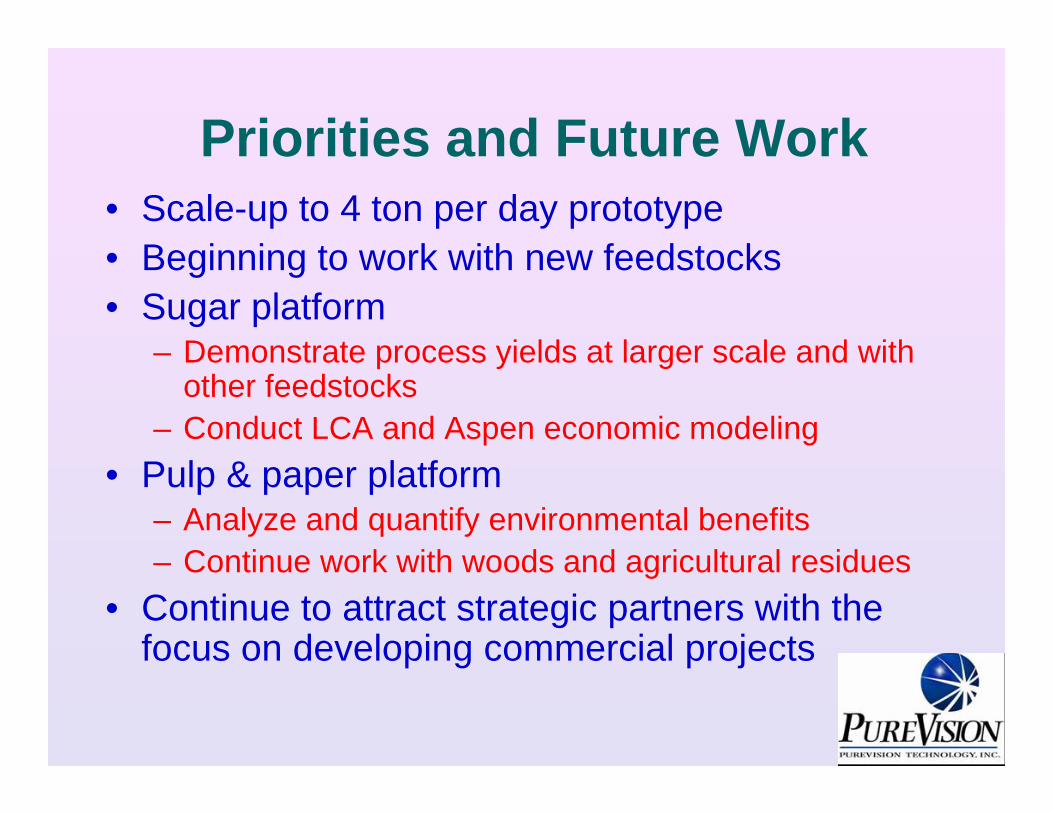
Priorities and Future Work • Scale-up to 4 ton per day prototype• Beginning to work with new feedstocks • Sugar platform
– Demonstrate process yields at larger scale and with other feedstocks
– Conduct LCA and Aspen economic modeling• Pulp & paper platform
– Analyze and quantify environmental benefits– Continue work with woods and agricultural residues
• Continue to attract strategic partners with the focus on developing commercial projects
AcknowledgmentsPureVision would like to thank:
-U.S. Environmental Protection Agency for sponsoring this conference, the
-U.S. Department of Energy, and the-U.S. National Science Foundation for providing
financial assistance awards to support research and development initiatives.
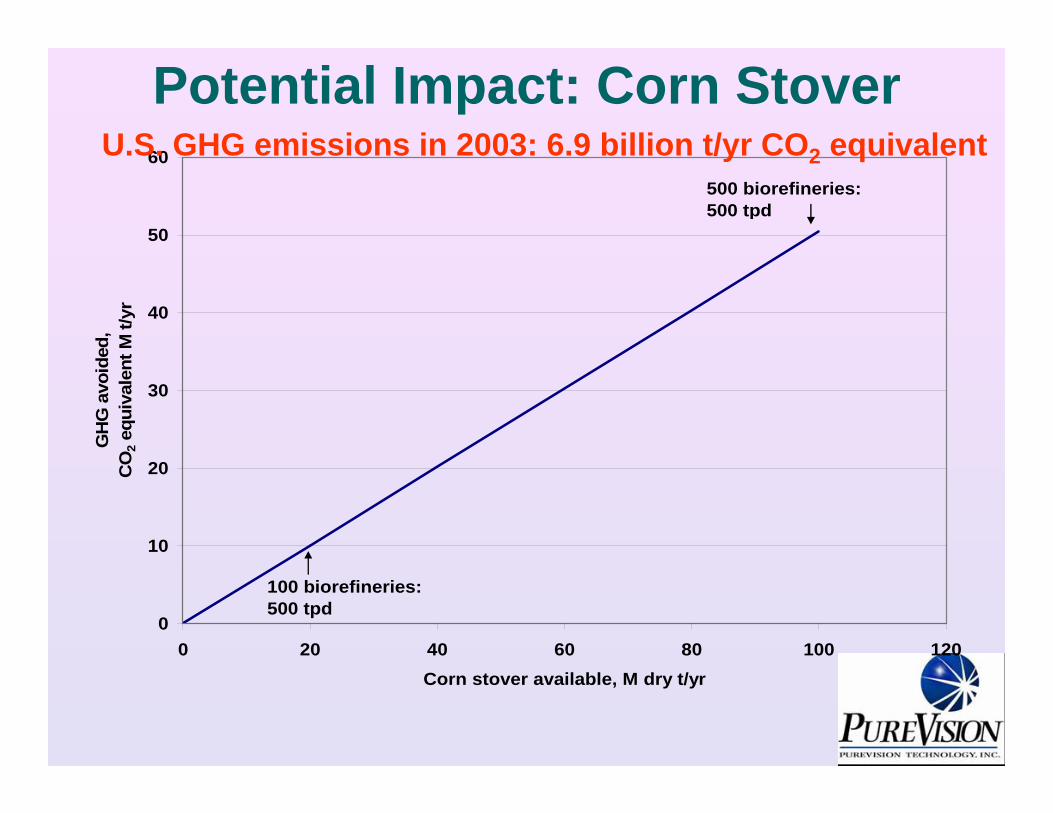
Potential Impact: Corn Stover
0
10
20
30
40
50
60
0 20 40 60 80 100 120Corn stover available, M dry t/yr
GH
G a
void
ed,
CO
2 equ
ival
ent M
t/yr
500 biorefineries: 500 tpd
100 biorefineries:500 tpd
U.S. GHG emissions in 2003: 6.9 billion t/yr CO2 equivalent