Embed Size (px)
Citation preview

. . . . . . . . . . . . . . . . . . . . . . . . . . . . . . . . . . . . . . . . . . . . . . . . . . . . . . . . . .
Preţ: 10,50 EURPreţ: 10,50 EURRO
Jurnalul Oficialal Uniunii Europene
ISSN 1977-1029
C 382
Anul 54
30 decembrie 2011
Ediţia în limba română Comunicări şi informări
Numărul informării Cuprins Pagina
IV Informări
INFORMĂRI PROVENIND DE LA INSTITUŢIILE, ORGANELE ȘI ORGANISMELE UNIUNII EUROPENE
Consiliu
2011/C 382/01 Al treisprezecelea raport anual elaborat în conformitate cu articolul 8 alineatul (2) din Poziţia comună 2008/944/PESC a Consiliului de definire a normelor comune care reglementează controlul exporturilor de tehnologie și echipament militar . . 1

(1)e
ă
(2)
(3)(4)
30.12.2011 RO Jurnalul Oficial al Uniunii Europene C 382/1
IV
(Informări)
INFORMĂRI PROVENIND DE LA INSTITUŢIILE, ORGANELE ŞI ORGANISMELE UNIUNII EUROPENE
CONSILIU
AL TREISPREZECELEA RAPORT ANUAL ELABORAT ÎN CONFORMITATE CU ARTICOLUL 8 ALINEATUL (2) DIN POZIŢIA COMUNĂ 2008/944/PESC A CONSILIULUI DE DEFINIRE A NORMELOR COMUNE CARE REGLEMENTEAZĂ CONTROLUL EXPORTURILOR DE
TEHNOLOGIE ȘI ECHIPAMENT MILITAR
(2011/C 382/01)
INTRODUCERE
Prezentul raport acoperă activităţile întreprinse de UE și statele sale membre în cadrul punerii în aplicare a Poziţiei comune 2008/944/PESC a Consiliului
(1) JO L 335, 13.12.2008, p. 99.
în anii 2010 și 2011. În ceea ce priv ște exporturile de arme convenţionale, raportul acoperă anul calendaristic 2010.
În 2010 și 2011, UE și statele sale membre au continuat punerea în aplicare a Poziţiei comune 2008/944/PESC de definire a normelor comune care reglementează controlul exporturilor de tehnologie și echipament militar, care a înlocuit Codul de conduită al UE privind exporturile de arme în vigoare din iunie 1998.
Următoarele ţări terţe s-au aliniat în mod oficial criteriilor și principiilor enunţate în Poziţia comună 2008/944/PESC: Bosnia și Herţegovina, Canada, Croaţia, Fosta Republică Iugoslavă a Macedoniei, Islanda, Muntenegru și Norvegia. În 2011, Grupul de lucru pentru exportul de arme convenţionale (COARM) al UE a demarat și elaborarea unui sistem specific de schimb de informaţii între UE și ţările terţe care se aliniază poziţiei comune.
Promovarea unor regimuri naţionale eficiente de control al exporturilor de arme s-a desf șurat în 2010 și 2011 în cadrul Deciziei 2009/1012/PESC a Consiliului din 22 decembrie 2009 privind sprijinirea activităţilor UE pentru promovarea în rândul ţărilor terţe a controlului exporturilor de arme și a principiilor și criteriilor prevăzute în Poziţia comună 2008/944/PESC
(2) JO L 348, 29.12.2009, p. 16.
.
UE și statele sale membre au continuat să joace un rol de frunte în procesul referitor la tratatul privind comerţul cu arme printr-o pregătire intensă a tuturor sesiunilor comitetului de pregătire care au avut loc în 2010 și 2011 și printr-o participare activă la acestea. Eforturile UE s-au axat și pe informarea ţărilor terţe, atât prin consultări bilaterale, cât și prin organizarea unor evenimente regionale de informare în cadrul Deciziei 2009/42/PESC a Consiliului din 19 ianuarie 2009
(3) JO L 17, 22.1.2009, p. 39.
și al Deciziei 2010/336/PESC a Consiliului din 14 iunie 2010 relevante
(4) JO L 152, 18.6.2010, p. 14.
.
I. PUNEREA ÎN APLICARE A POZIŢIEI COMUNE 2008/944/PESC
1. Punerea în aplicare a Poziţiei comune 2008/944/PESC în legislaţia naţională sau normele administrative
Statele membre aplică dispoziţiile poziţiei comune, care reprezintă un instrument actualizat și îmbunătăţit faţă de Codul de conduită al UE privind exporturile de arme, pe care l-a înlocuit în decembrie 2008. Poziţia comună merge mult mai departe decât Codul de conduită, incluzând o extindere a controalelor la brokeraj, operaţiuni de tranzit și transferuri intangibile de tehnologie, precum și proceduri consolidate, în vederea armonizării politicilor de export ale statelor membre.
Statele membre trebuie să asigure punerea în aplicare deplină a poziţiei comune în legislaţia naţională sau în normele administrative ale acestora. Situaţia privind transpunerea la nivel naţional a poziţiei comune în regimurile de control al exporturilor de arme ale statelor membre este raportată în tabelul C din anexă.

ă
e
ă
ă
ă
e
ă
C 382/2 RO Jurnalul Oficial al Uniunii Europene 30.12.2011
2. Ghid de utilizare
Ghidul de utilizare este un instrument fundamental care sintetizează orientările convenite pentru punerea în aplicare a dispoziţiilor operative ale Poziţiei comune 2008/944/PESC și pentru interpretarea criteriilor sale.
Menţionat la articolul 13 din poziţia comună, acesta a fost elaborat de către Grupul de lucru al Consiliului pentru exportul de arme convenţionale (COARM) și este actualizat după caz. Acesta este destinat utilizării în primul rând de către oficialităţile însărcinate cu acordarea licenţelor de export, contribuind astfel substanţial, într-un mod pragmatic, la convergenţa politicilor și a procedurilor statelor membre în domeniul controlului exportului de arme. Ghidul este un document public disponibil pe site-ul internet al Serviciului European de Acţiune Externă.
Ghidul de utilizare conţine secţiuni cu privire la următoarele chestiuni, inter alia:
(a) Notificări de refuz și consultări
Notificările de refuz și consultările bilaterale continuă să se desf șoare zilnic, prin intermediul sistemului electronic al Uniunii Europene, COREU. Informaţiile sunt difuzate la timp, asigurându-se astfel transparenţa politicilor statelor membre privind exporturile de arme către anumite ţări de destinaţie finală și către utilizatori finali.
Refuzurile notificate, precum și rezultatele consultărilor bilaterale, sunt incluse în baza de date electronică centrală de notificări de refuz a UE. Baza de date, administrată de Serviciul European de Acţiune Externă, este un sistem dinamic care reflectă politicile statelor membre privind controlul exporturilor de arme. Numărul de refuzuri notificate în 2010 este indicat la linia (d) din tabelele care fac parte din tabelul AI (din anexa la prezentul raport) defalcate pe destinaţie și pe categoriile din lista cuprinzând produsele militare; numărul de consultări iniţiate și primite de fiecare stat membru și numărul de consultări defalcate pe destinaţie sunt indicate în tabelele BI, respectiv BII.
(b) Cele mai bune practici pentru interpretarea criteriilor
Cele mai bune practici pentru interpretarea criteriilor din Poziţia comună 2008/944/PESC au fost elaborate de Grupul de lucru COARM, pe baza celor mai bune practici naţionale și ţinând seama de informaţiile din partea altor părţi interesate relevante.
Scopul acestora este de a asigura o mai bună coerenţă în rândul statelor membre în ceea ce priv ște aplicarea criteriilor poziţiei comune. Acest obiectiv este realizat prin identificarea factorilor care trebuie luaţi în considerare în momentul evaluării cererilor de acordare a licenţei de export. Cele mai bune practici se adresează oficialităţilor însărcinate cu acordarea licenţelor de export și altor funcţionari ai serviciilor și agenţiilor guvernamentale ale căror competenţe, inter alia, în chestiuni de ordin regional, juridic (precum legislaţia drepturilor omului, dreptul internaţional public), tehnic, de dezvoltare, precum și în chestiuni de securitate și militare, ar trebui să influenţeze procesul decizional.
3. Acţiunea de informare
Articolul 11 din poziţia comună cere statelor membre „[să] depun[ă] toate eforturile pentru a încuraja alte state care exportă tehnologie sau echipament militar să aplice criteriile [respectivei] poziţii comune”. Activităţile coordonate de informare ale statelor membre și ale UE au continuat în 2010 și în 2011 până în prezent (a se vedea tabelul D din anexă).
Evenimente în contextul Deciziei 2009/1012/PESC a Consiliului din22 decembrie 2009 privind sprijinirea activităţilor UE pentru promovarea în rândul ţărilor terţe a controlului exporturilor de arme și a principiilor și criteriilor prevăzute în Poziţia comună 2008/944/PESC
Decizia 2009/1012/PESC a alocat fonduri pentru cinci seminare regionale de informare și patru schimburi de personal cu ţări terţe strâns asociate UE. Punerea în aplicare tehnică a fost încredinţată Oficiului Federal german pentru Economie și Controlul Exportului (BAFA).
În 2010, au fost organizate trei seminare de informare în contextul Deciziei 2009/1012/PESC. Primul s-a desf șurat la Alger, în martie 2010, pentru ţările nord-africane (Algeria, Egipt, Libia, Maroc și Tunisia). Al doilea seminar s-a desf șurat la Sarajevo, în Bosnia și Herţegovina, în iunie 2010, pentru ţările din Balcanii de Vest (Albania, Bosnia și Herţegovina, Croaţia, Fosta Republică Iugoslavă a Macedoniei, Muntenegru și Serbia). Al treilea seminar s-a desf șurat la Kiev, în Ucraina, în noiembrie 2010, pentru ţările din Europa de Est și din regiunea Caucazului partenere la politica europeană de vecinătate (Armenia, Azerbaidjan, Belarus, Georgia, Moldova și Ucraina).
În 2011, al patrulea și al cincilea seminar prevăzute de Decizia 2009/1012/PESC au avut loc la Podgorica, în Muntenegru, în mai 2011, pentru ţările din Balcanii de Vest (Albania, Bosnia și Herţegovina, Croaţia, Fosta Republică Iugoslavă a Macedoniei, Muntenegru și Serbia) și, respectiv, la Kiev, în Ucraina, în noiembrie 2011, pentru ţările din Europa de Est și regiunea Caucazului partenere la politica europeană de vecinătate (Armenia, Azerbaidjan, Belarus, Georgia, Moldova și Ucraina).
În ceea ce priv ște schimburile de personal prevăzute de decizia Consiliului, Ungaria a găzduit ofiţeri croaţi însărcinaţi cu controlul exporturilor de arme în iunie 2011, Portugalia a găzduit ofiţeri relevanţi din Fosta Republică Iugoslavă a Macedoniei și din Muntenegru în octombrie 2011, și personal însărcinat cu controlul exporturilor de arme din trei ţări candidate la aderarea la UE (Croaţia, Fosta Republică Iugoslavă a Macedoniei și Muntenegru) a fost găzduit de Polonia în noiembrie 2011. Aceste schimburi de personal au permis funcţionarilor din ţările candidate la aderarea la UE să beneficieze de experienţa statelor membre cu privire la punerea în aplicare în practica cotidiană, între altele, a chestiunilor vamale legate de exporturile de arme, a controalelor la brokeraj și tranzit, a raportării și transparenţei, a programelor de conformitate interne ale exportatorilor, și a punerii în aplicare naţionale a sancţiunilor internaţionale și ale UE. Un schimb suplimentar și final de personal în cadrul deciziei Consiliului se va desf șura în primul trimestru al anului 2012.

ă
(1)
(2)
(3)
r
30.12.2011 RO Jurnalul Oficial al Uniunii Europene C 382/3
4. Reuniunile de dialog politic
Reuniunile de dialog politic privind chestiunile legate de controlul exporturilor de arme s-au desf șurat în 2010 cu Norvegia, Canada, Ucraina, Statele Unite și Federaţia Rusă.
Aceste dialoguri, organizate în general de două ori pe an cu fiecare dintre ţările sus-menţionate, au permis discuţii fructuoase privind chestiuni de interes reciproc precum destinaţiile specifice care reprezintă motive de îngrijorare, chestiuni legate de conformitate și control și procesul referitor la un tratat privind comerţul cu arme. În cadrul acestor reuniuni, partea UE, reprezentată de Serviciul European de Acţiune Externă după intrarea în vigoare a Tratatului de la Lisabona, a informat de asemenea interlocutorii în legătură cu priorităţile și activităţile COARM în răstimpul scurs de la reuniunea anterioară.
În 2011, UE a iniţiat de asemenea un proces de elaborare a unui mecanism de schimb de informaţii care va permite statelor membre ale UE, SEAE și ţărilor terţe aliniate poziţiei comune să facă schimb de informaţii relevante privind politicile naţionale în materie de control al exporturilor de arme.
5. Actualizarea Listei comune a Uniunii Europene cuprinzând produsele militare
Lista comună a Uniunii Europene cuprinzând produsele militare are valoarea unui angajament în cadrul politicii externe și de securitate comune. Acest lucru este reprodus ca lista produselor din domeniul apărării cuprinsă în anexa la Directiva 2009/43/CE a Parlamentului European și a Consiliului din 6 mai 2009 de simplificare a clauzelor și condiţiilor de transfer al produselor din domeniul apărării în interiorul Comunităţii
(1) JO L 146, 10.6.2009, p. 1.
.
La 21 februarie 2011, Consiliul a adoptat o versiune actualizată a listei, care ia în considerare modificările aduse listei muniţiilor prevăzute de Aranjamentul de la Wassenaar, asupra căreia s-a căzut de acord cu ocazia reuniunii plenare a Aranjamentului de la Wassenaar din 2010. Versiunea actualizată a Listei comune a Uniunii Europene cuprinzând produsele militare a fost publicată în Jurnalul Oficial al Uniunii Europene C 86 din 18 martie 2011, p. 1.
6. Brokerajul de armament
COARM a convenit asupra faptului că angajamentele în materie de schimb de informaţii prevăzute de Poziţia comună 2003/468/PESC a Consiliului din 23 iunie 2003 privind controlul brokerajului de armament
(2) JO L 156, 25.6.2003, p. 79.
ar trebui să fie puse în aplicare prin intermediul mecanismului prevăzut în Poziţia comună 2008/944/PESC. În conformitate cu articolul 5 din Poziţia comună 2003/468/PESC, statele membre au instituit aranjamente distincte pentru schimbul de informaţii privind licenţele de brokeraj acordate și refuzate. De asemenea, în conformitate cu articolele 4 și 5 din Poziţia comună 2003/468/PESC, statele membre care au solicitat brokerilor să obţină o autorizaţie scrisă pentru exercitarea unei activităţi de brokeraj și/sau au instituit un registru al brokerilor de armament au introdus modalităţi separate
pentru schimbul de informaţii relevante privind brokerii înregistraţi. Informaţii cu privire la licenţele de brokeraj acordate și refuzate de către statele membre ale UE pot fi consultate în tabelul AIII prevăzut în anexă.
În tabelul C anexat la prezentul raport sunt furnizate informaţii detaliate cu privire la punerea în aplicare la nivel naţional a poziţiei comune privind brokerajul sau, în cazul acelor state membre care nu au aplicat încă integral poziţia comună, informaţii cu privire la situaţia actuală.
7. Transferuri de arme intra-UE
Parlamentul European și Consiliul au adoptat la 6 mai 2009 Directiva 2009/43/CE de simplificare a clauzelor și condiţiilor de transfer al produselor din domeniul apărării în interiorul Comunităţii.
Directiva prevede că statele membre adoptă și publică, până la30 iunie 2011 cel târziu, actele cu putere de lege și actele administrative necesare pentru a se conforma directivei respective. Statele membre au obligaţia de a aplica măsurile adoptate începând cu data de 30 iunie 2012. De la adoptarea directivei, statele membre au purtat discuţii în contextul unui comitet prezidat de Comisie cu privire la cea mai bună modalitate de abordare a aspectelor generate de transpunerea directivei în legislaţiile naţionale. Pe baza informaţiilor furnizate de acest comitet, Comisia a adoptat, la 11 ianuarie 2011, Recomandarea 2011/24/UE
(3) JO L 11, 15.1.2011, p. 62.
privind autorizarea întreprinderilor europene din domeniul apărării în temeiul articolului 9 din Directiva 2009/43/CE.
8. Dialogul cu Parlamentul European și cu ONG-urile
Reuniunile COARM cu Subcomisia pentru securitate și apărare au fost suspendate în 2010, până la înfiinţarea Serviciului European de Acţiune Externă. Pe viitor, ar putea fi decis un nou format pentru aceste reuniuni. Se preconizează reluarea reuniunilor până la sfâ șitul lui 2011.
După cum a fost practica timp de mai mulţi ani, delegaţi COARM din majoritatea statelor membre ale UE au participat la reuniunile informale organizate de organizaţii neguvernamentale (în special Saferworld), la intervale de câte șase luni.
II. TRATATUL PRIVIND COMERŢUL CU ARME (TCA)
1. Implicare în sesiunile comitetului de pregătire
Înfăptuirea unui Tratat privind comerţul cu arme (TCA) cu forţă juridică obligatorie și robust se numără printre principalele priorităţi de politică externă ale UE și ale statelor sale membre. Un TCA poate avea o contribuţie substanţială la reglementarea comerţului internaţional cu arme la nivel internaţional, făcându-l mai transparent și mai responsabil, prin instituirea unor standarde internaţionale comune ridicate. Rezoluţiile relevante ale Adunării generale a ONU din 2006 până în prezent au fost sprijinite de toate statele membre ale UE.

ă
ă
ă
ăe
ă
e
ă
ă
C 382/4 RO Jurnalul Oficial al Uniunii Europene 30.12.2011
Pe parcursul anilor 2010 și 2011 și până în prezent, Uniunea Europeană și statele sale membre au continuat să sprijine procesul în desf șurare referitor la tratatul privind comerţul cu arme condus de ONU și să participe îndeaproape la acesta. În pregătirea sesiunilor comitetului de pregătire (PrepCom) privind TCA, care s-au desf șurat până acum (iulie 2010, februarie și iulie 2011), un subgrup dedicat al Grupului de lucru COARM s-a întrunit periodic pentru a împărt și opinii și pentru a coordona poziţiile, permiţând astfel UE și statelor sale membre să continue să fie extrem de active și să fie factori vizibili în procesul privind TCA. Pe baza poziţiilor coordonate ale UE, UE și statele sale membre au desf șurat și consultări extinse cu ţări terţe și, în special, cu ţări majore producătoare de arme, precum și cu pr ședintele comitetului de pregătire, ambasadorul Garcia Moritàn.
2. Eforturi de informare în contextul Deciziei 2009/42/PESC a Consiliului din 19 ianuarie 2009 și al Deciziei 2010/336/PESC a Consiliului din 14 iunie 2010 privind activităţile UE de susţinere a Tratatului privind comerţul cu arme
Din 2009, UE a fost deosebit de activă în promovarea procesului privind TCA în relaţie cu ţările terţe și cu scopul sporirii participării la consultările ONU și al îmbunătăţirii înţelegerii de către toate statele membre ale ONU a diferitelor elemente ale unui viitor tratat. În acest scop, UE a adoptat în 2009 și 2010 două decizii ale Consiliului care au permis organizarea mai multor evenimente regionale de informare, în cooperare cu Institutul ONU pentru Cercetare în Domeniul Dezarmării (UN Institute for Disarmament Research – „UNIDIR”).
Punerea în aplicare a Deciziei 2009/42/PESC a demarat în 2009 și s-a încheiat în februarie 2010 prin organizarea unui eveniment de informare pentru ţările OSCE și a unui seminar final pentru toate statele membre ale ONU. Ambele evenimente s-au desf șurat la Viena și au încheiat seria de șase seminare de informare finanţate prin Decizia 2009/42/PESC.
Pe baza rezultatelor obţinute în urma primei serii de evenimente de informare, UE a decis să sporească eforturile de cr ștere a participării la procesul privind TCA și a mai bunei înţelegeri a acestuia. O nouă decizie a Consiliului a fost adoptată în acest sens în iunie 2010, care prevede organizarea a șapte ateliere regionale axate asupra aspectelor politice ale tratatului privind comerţul cu arme și asupra aspectelor tehnice ale controalelor naţionale ale exporturilor de arme.
În 2010 și 2011, s-au desf șurat seminare de informare la Katmandu, în Nepal (decembrie 2010) pentru ţările din Asia de Sud și Asia Centrală, la Casablanca, în Maroc (februarie 2011) pentru ţările din Africa de Nord, de Vest și Centrală, la Montevideo, în Uruguay (aprilie 2011) pentru ţările din America și Caraibi, la Bali, în Indonezia (iunie 2011) pentru ţările din Asia de Est și Pacific. Evenimente secundare au fost, de asemenea, organizate în marja sesiunilor comitetului de pregătire a TCA, desf șurate la New York în iulie 2010 și în februarie și iulie 2011, și în marja celei de a 66-a sesiuni a Primului comitet al Adunării generale a ONU în octombrie 2011.
III. ORIENTĂRILE PRIORITARE ALE COARM PENTRU VIITORUL APROPIAT
Odată cu adoptarea Poziţiei comune 2008/944/PESC cu forţă juridică obligatorie, au fost identificate elementele fundamentale ale unei abordări comune a controlului exporturilor de arme convenţionale de către statele membre. În ciuda progreselor reprezentate de adoptarea poziţiei comune, mai sunt multe de realizat, mai ales în anumite domenii care nu au fost abordate în trecut sau în care sunt necesare eforturi suplimentare pentru consolidarea și valorificarea rezultatelor obţinute.
Următoarele orientări sunt prioritare pentru viitorul apropiat:
1. asigurarea faptului că statele membre care nu au făcut încă acest lucru adoptă reglementări sau norme administrative naţionale corespunzătoare pentru punerea în aplicare deplină a:
— Poziţiei comune 2003/468/PESC privind controlul brokerajului cu armament;
— Poziţiei comune 2008/944/PESC de definire a normelor comune care reglementează controlul exporturilor de tehnologie și echipament militar;
2. continuarea coordonării la nivelul UE și a contribuţiei la procesul de negociere cu privire la tratatul privind comerţul cu arme, oferind contribuţii ale experţilor pentru pregătirea sesiunii din februarie 2012 a comitetului de pregătire și a conferinţei diplomatice din iulie 2012 însărcinată să negocieze tratatul;
3. continuarea schimburilor de informaţii relevante între statele membre ale UE cu privire la politicile referitoare la exporturile de arme către anumite destinaţii;
4. finalizarea punerii în aplicare a Deciziei 2009/1012/PESC prin organizarea unor schimburi de personal în 2012 și realizarea unei evaluări a rezultatelor obţinute;
5. finalizarea punerii în aplicare a Deciziei 2010/336/PESC privind activităţile UE de susţinere a tratatului privind comerţul cu arme, precum și asigurarea participării experţilor COARM la seminarele regionale de informare;
6. continuarea dezvoltării schimburilor de informaţii și de cele mai bune practici cu ţările terţe aliniate Poziţiei comune 2008/944/PESC, în consultare cu părţile interesate relevante;
7. reînnoirea dialogului cu Parlamentul European și dezvoltarea în continuare a relaţiilor cu societatea civilă și cu industria;

30.12.2011 RO Jurnalul Oficial al Uniunii Europene C 382/5
8. demararea procesului de pregătire în direcţia revizuirii Poziţiei comune 2008/944/PESC, prevăzută să aibă loc la trei ani de la adoptarea acesteia, astfel cum prevede articolul 15;
9. demararea pregătirilor pentru alte activităţi de informare ale COARM pentru promovarea principiilor și criteriilor Poziţiei comune 2008/944/PESC, ţinând seama de rezultatele evaluării punerii în aplicare a Deciziei 2009/1012/PESC;
10. actualizarea, după caz, a ghidului de utilizare și a Listei comune a Uniunii Europene cuprinzând produsele militare, inclusiv în cadrul procesului de revizuire a Poziţiei comune 2008/944/PESC;
11. asigurarea finalizării timpurii și a publicării celui de al 14-lea raport anual al UE cu privire la exporturile de arme.
C 382/6 RO Jurnalul Oficial al Uniunii Europene 30.12.2011
ANNEX
The attached tables contain the following information:
A.I TABLES SETTING OUT EXPORTS AND LICENCE REFUSALS PER DESTINATION, PER REGION AND WORLD WIDE
A.II TABLE SHOWING EXPORTS TO UNITED NATIONS-MANDATED OR OTHER INTERNATIONAL MISSIONS IN 2010
A.III TABLE PROVIDING INFORMATION ON BROKERING LICENCES GRANTED AND DENIED PER MEMBER STATE
B.I TABLE SHOWING TOTAL NUMBER OF CONSULTATIONS INITIATED AND TOTAL NUMBER OF CONSULTATIONS RECEIVED BY EACH MEMBER STATE IN 2010
B.II TABLE SHOWING TOTAL NUMBER OF CONSULTATIONS FOR EACH DESTINATION CONCERNED IN 2010
C. INFORMATION ON NATIONAL IMPLEMENTATION OF COMMON POSITION 2003/468/CFSP ON THE CONTROL OF ARMS BROKERING AND COMMON POSITION 2008/944/CFSP DEFINING COMMON RULES FOR THE CONTROL OF EXPORTS OF MILITARY TECHNOLOGY AND EQUIPMENT
D. TABLE OF OUTREACH ACTIVITIES CARRIED OUT BY THE EU AND MEMBER STATES (1 JANUARY 2010 TO NOVEMBER 2011)
E. TABLE SHOWING INTERNET ADDRESSES FOR NATIONAL REPORTS ON ARMS EXPORTS

30.12.2011 RO Jurnalul Oficial al Uniunii Europene C 382/7
Brief descriptions of EU Common Military List categories
(cf. OJ C 86 of 18 March 2011 for the full EU Common Military List)
ML1 Smooth-bore weapons with a calibre of less than 20 mm, other arms and automatic weapons with a calibre of 12,7 mm (calibre 0,50 inches) or less and accessories, and specially designed components therefor
ML2 Smooth-bore weapons with a calibre of 20 mm or more, other weapons or armament with a calibre greater than 12,7 mm (calibre 0,50 inches), projectors and accessories, and specially designed components therefor
ML3 Ammunition and fuse setting devices, and specially designed components therefor
ML4 Bombs, torpedoes, rockets, missiles, other explosive devices and charges and related equipment and accessories, and specially designed components therefor
ML5 Fire control, and related alerting and warning equipment, and related systems, test and alignment and countermeasure equipment, specially designed for military use, and specially designed components and accessories therefor
ML6 Ground vehicles and components.
ML7 Chemical or biological toxic agents, ‘riot control agents’, radioactive materials, related equipment, components and materials
ML8 ‘Energetic materials’, and related substances
ML9 Vessels of war, (surface or underwater) special naval equipment, accessories, components and other surface vessels
ML10 ‘Aircraft’, ‘lighter than air vehicles’, unmanned airborne vehicles, aero-engines and ‘aircraft’ equipment, relatedequipment and components, specially designed or modified for military use.
ML11 Electronic equipment, not specified elsewhere on the EU Common Military List, and specially designed componentstherefor
ML12 High velocity kinetic energy weapon systems and related equipment, and specially designed components therefor.
ML13 Armoured or protective equipment, constructions and components
ML14 Specialised equipment for military training or for simulating military scenarios, simulators specially designed fortraining in the use of any firearm or weapon specified by ML1 or ML2, and specially designed components andaccessories therefor
ML15 Imaging or countermeasure equipment, specially designed for military use, and specially designed components andaccessories therefor
ML16 Forgings, castings and other unfinished products the use of which in a specified product is identifiable by materialcomposition, geometry or function, and which are specially designed for any products specified by ML1 to ML4, ML6,ML9, ML10, ML12 or ML19
ML17 Miscellaneous equipment, materials and ‘libraries’, and specially designed components therefor
ML18 Production equipment and components of products referred to in the EU Common Military List
ML19 Directed energy weapon systems (DEW), related or countermeasure equipment and test models, and speciallydesigned components therefor
ML20 Cryogenic and ‘superconductive’ equipment, and specially designed components and accessories therefor
ML21 ‘Software’ specially designed or modified for the ‘development’, ‘production’ ‘use’ of equipment or materials controlledby the EU Common Military List.
ML22 ‘Technology’ for the ‘development’, ‘production’ or ‘use’ of items controlled in the EU Common Military List
(1)
(2)
(3)
C 382/8 RO Jurnalul Oficial al Uniunii Europene 30.12.2011
TABLE A.I
Figures of Table A.I are broken down per Member State, and where possible per EU Common Military List category where (a) = number of licences issued; (b) = value of licences issued in euros; (c) = value of arms exports in euros (if available).
(1) To make the table more readable, nil values and/or the mention ‘not available’ are omitted, and empty rows deleted.
Total EU licence refusals to each destination, region and world wide are provided, broken down by EU Common Military List category; (d) = number of licence refusals (small discrepancies may appear between breakdowns and totals due to refusals concerning more than one ML item or refusals for items other than those appearing in the ML
(2) Concerning refusals (row (d)), totals do not always correspond to the sum of the refusals shown per military list item; this is because insome instances one refusal concerns more than one military list item, and in some instances refusals which have been issued in accordance with the Common Position for items which do not appear on the military list (for example dual use items for military end-use) areincluded in the total.
); (e) = criteria numbers on which refusals are based (the approximate number of times each criterion is invoked is indicated in brackets).
NB: Statistics are compiled differently by each Member State: no uniform standard is used. Consequently, owing to current procedures in the area of arms export reporting or data protection legislation, not all countries have been able to submit the same information
(3) (i) Concerning Austria: With regard to items covered by the EU Common Military List, the Austrian law distinguishes between ‘warmaterial’ (as stipulated in the Austrian War Material Act and Regulation) and ‘equipment on the Common Military List not listed aswar material’ covered by the Austrian Foreign Trade Act. As to category c) value of actual exports by Military List Category figuresmay be inaccurate in particular as such data regarding equipment of the Common Military List not listed as war material is availableto the competent authorities only after expiration or full utilization of the individual export license.
(ii) Concerning Germany: some licenses issued cover goods of more than one ML Category (e.g. one license for the export of rifles andtheir ammunition). In reporting in Table A.I, each time a license concerns a ML category, it is counted as one single license, so thesums in rows a) and column ‘Total per destination’ do not always reflect the actual numbers of licenses granted, but a slightly higherfigure (i.e. the number of times a ML category has been affected by a license for that destination).
(iii) Concerning Greece: the reported export licences include temporary exports for overhaul, repair, exhibitions, demonstrations andfield trials.
(iv) Concerning France: exports to Hong Kong are included in the figures for China (Mainland). Exports to Greenland, the Faeroe Islands,Aruba, the Netherlands Antilles and the islands associated to the United Kingdom are considered without object; exports to NewCaledonia are not included (but can be found in the national report).
(v) Concerning the Netherlands:— As values of global licences cannot always be attributed to individual military list categories or individual countries, quoted
total values may be higher than the sum of the values per ML category or per destination.— The figures on actual exports reported by the Netherlands are based on information provided by exporters in 2010, and may
reflect exports based on a licence issued in a previous year. Although much care has been given to the collection of the dataon actual exports, the actual export figures for 2010 may be higher than the values quoted in this report.
(vi) Concerning Slovenia: in addition to values of licences reported in this report, Slovenia also issued arms export licences and exportedarms and military equipment to: a) Russia - the value of this licence was 0 because the military items were transmitted for destruction, b) Serbia - the value of this licence was 0 because the military items were transmitted because of some technical exchange ofmilitary goods and c) Singapore and Saudi Arabia - the value of these licences were 0 because the military items were transmittedfor testing.
(vii) Concerning Finland: all export licences granted to Afghanistan, Chad, Congo, Kosovo, Pakistan, Somalia, Sudan, Western Saharaand Yemen are for United Nations mandated or other international missions. All actual exports to Chad, Congo, Jordan, Kosovo,Pakistan, Somalia, Sudan and Yemen are for United Nations mandated or other international missions.
.
It is important to note that row (c) of Table A.I is the total of the actual exports by those countries which submitted these data. Belgium, Denmark, Germany, Poland, Greece, Ireland and the United Kingdom could not supply these data; therefore row(c) of the EU total does not reflect total EU actual exports.
Sweden has reported total values only for rows (b) and (c). France and Italy have reported total values only for row (c).
It is important to bear in mind that exports to destinations subject to EU arms embargoes comply with the terms, conditions and possible exceptions set out in the decisions imposing such embargoes. The full list and details of embargoes is available at: http://eeas.europa.eu/cfsp/sanctions/docs/measures_en.pdf
30.12.2011 RO Jurnalul Oficial al Uniunii Europene C 382/9
TABLES SETTING OUT EXPORTS AND REFUSALS PER DESTINATION, PER REGION AND WORLDWIDE
Page
EXPORTS AND REFUSALS PER (NON-EMBARGOED) DESTINATION . . . . . . . . . . . . . . . . . . . . . . . . . . . . . . . . . . . 10
EXPORTS AND REFUSALS PER DESTINATION (WHEN DESTINATION IS SUBJECT TO AN EU ARMS EMBARGO) 346
EXPORTS AND REFUSALS PER REGION:
Central America and the Caribbean(Antigua and Barbuda, Bahamas, Barbados, Belize, Costa Rica, Cuba, Dominica, Dominican Republic, El Salvador, Grenada, Guatemala, Haiti, Honduras, Jamaica, Mexico, Nicaragua, Panama, Saint Kitts and Nevis, Saint Lucia, Saint Vincent and Grenadines, Trinidad and Tobago) . . . . . . . . . . . . . . . . . . . . . . . . . . . . . . . . . . . 360
Central Asia(Kazakhstan, Kyrgyzstan, Tajikistan, Turkmenistan, Uzbekistan) . . . . . . . . . . . . . . . . . . . . . . . . . . . . . . . . . . . . 363
European Union(Austria, Belgium, Bulgaria, Cyprus, Czech Republic, Denmark; Denmark (Greenland), Denmark (Faeroes), Estonia, Finland, France, France (French Polynesia), France (Mayotte), France (New Caledonia), Germany, Greece, Hungary, Ireland, Italy, Latvia, Lithuania, Luxembourg, Malta, Netherlands, Netherlands (Aruba), Netherlands (Netherlands Antilles), Poland, Portugal, Romania, Slovakia, Slovenia, Spain, Sweden, United Kingdom, United Kingdom (Bermuda), United Kingdom (Cayman Islands), United Kingdom (Channel Islands), United Kingdom (Gibraltar), United Kingdom (St Helena), United Kingdom (Turcs and Caicos Islands) . . . . . . . . . . . . . . . . . . . . 366
Middle East(Bahrain, Egypt, Iran, Iraq, Israel, Jordan, Kuwait, Lebanon, Oman, Palestinian controlled territories, Qatar, Saudi Arabia, Syria, United Arab Emirates, Yemen) . . . . . . . . . . . . . . . . . . . . . . . . . . . . . . . . . . . . . . . . . . . . . . . . . . . 375
North Africa(Algeria, Libya, Morocco, Tunisia) . . . . . . . . . . . . . . . . . . . . . . . . . . . . . . . . . . . . . . . . . . . . . . . . . . . . . . . . . . . 383
North America(Canada, United States) . . . . . . . . . . . . . . . . . . . . . . . . . . . . . . . . . . . . . . . . . . . . . . . . . . . . . . . . . . . . . . . . . . . . 388
North East Asia(China (Mainland), China (Hong Kong), China (Macao), Korea (Democratic People’s Rep. of), Korea (Republic of), Japan, Mongolia, Taiwan) . . . . . . . . . . . . . . . . . . . . . . . . . . . . . . . . . . . . . . . . . . . . . . . . . . . . . . . . . . . . . . . 393
Oceania(Australia, Fiji, Kiribati, Marshall Islands, Micronesia (Fed. States of), Nauru, New Zealand, Palau, Papua New Guinea, Samoa, Solomon Islands, Tonga, Tuvalu, Vanuatu) . . . . . . . . . . . . . . . . . . . . . . . . . . . . . . . . . . . . . . . . 398
Other European Countries(Albania, Andorra, Armenia, Azerbaijan, Belarus, Bosnia and Herzegovina, Croatia, Georgia, Holy See, Iceland, Liechtenstein, former Yugoslav Republic of Macedonia, Kosovo (under UNSCR 1244/99); Republic of Moldova, Monaco, Montenegro, Norway, Russian Federation, Serbia, St Marino, Switzerland, Turkey, Ukraine). . . . . . . . 403
South America(Argentina, Bolivia, Brazil, Chile, Colombia, Ecuador, Guyana, Paraguay, Peru, Suriname, Uruguay, Venezuela) 409
South Asia(Afghanistan, Bangladesh, Bhutan, India, Maldives, Nepal, Pakistan, Sri Lanka) . . . . . . . . . . . . . . . . . . . . . . . . . 414
South East Asia(Brunei, Cambodia, Indonesia, Laos, Malaysia, Myanmar, Philippines, Singapore, Thailand, Timor Leste, Vietnam) . . . . . . . . . . . . . . . . . . . . . . . . . . . . . . . . . . . . . . . . . . . . . . . . . . . . . . . . . . . . . . . . . . . . . . . . . . . . . . . 419
Sub-Saharan Africa(Angola, Benin, Botswana, Burkina Faso, Burundi, Cameroon, Cape Verde, Central African Republic, Chad, Comoros, Congo (Republic of), Congo (Democratic Republic of), Djibouti, Equatorial Guinea, Eritrea, Ethiopia, Gabon, Gambia, Ghana, Guinea, Guinea-Bissau, Ivory Coast, Kenya, Lesotho, Liberia, Madagascar, Malawi, Mali, Mauritania, Mauritius, Mozambique, Namibia, Niger, Nigeria, Rwanda, Sao Tome and Principe, Senegal, Seychelles, Sierra Leone, Somalia, South Africa, Sudan, Swaziland, Tanzania, Togo, Uganda, Zambia, Zimbabwe) . . . . . . . . . . . . . . . . . . . . . . . . . . . . . . . . . . . . . . . . . . . . . . . . . . . . . . . . . . . . . . . . . . . . . . . . . . . . . 425
EXPORTS AND REFUSALS WORLD WIDE . . . . . . . . . . . . . . . . . . . . . . . . . . . . . . . . . . . . . . . . . . . . . . . . . . . . . . . . 430

ALBANIA
ML 1 ML 3 ML 4 ML 6 ML 10 ML 11 ML 13 ML 17 TOTAL perdestination
Bulgaria a 1 1
b 1 950 1 950
c 1 950 1 950
Finland a 1 1
b 49 600 49 600
c 53 450 53 450
France a 2 2
b 2 400 000 2 400 000
c
Germany a 1 1 2
b 64 969 1 556 754 1 621 723
c
Italy a 1 2 2 5
b 5 000 485 451 2 663 205 3 153 655
c 687 484
United Kingdom a 1 2 3
b 7 009 3 101 10 110
c
TOTAL PER MLcategory
a 1 4 1 2 2 2 1 1 14
b 5 000 537 001 7 009 2 400 000 2 663 205 3 101 64 969 1 556 754 7 237 038
c 55 400 742 884
d
e
ALGERIA
ML 1 ML 2 ML 3 ML 4 ML 5 ML 6 ML 9 ML 10 ML 11
Austria a 1 1
b 55 708 1 904 000
c 55 708 1 904 000
Belgium a 1 1
b 71 350 151 500
c
Bulgaria a 1 3 3 5 1 4
b 23 962 280 956 24 317 135 12 611 847 72 031 6 587 095
c 672 727 907 528 10 312 065 8 973 770 72 031 6 274 169 121 908
Czech Republic a 2 2 5
b 306 963 9 781 490 13 473 172
c 7 297 346 1 663 877
France a 7 3 4
b 40 202 356 300 203 1 489 957
c
C 382/10 RO Jurnalul Oficial al Uniunii Europene 30.12.2011
EU ARMS EXPORTS PER DESTINATION IN 2010
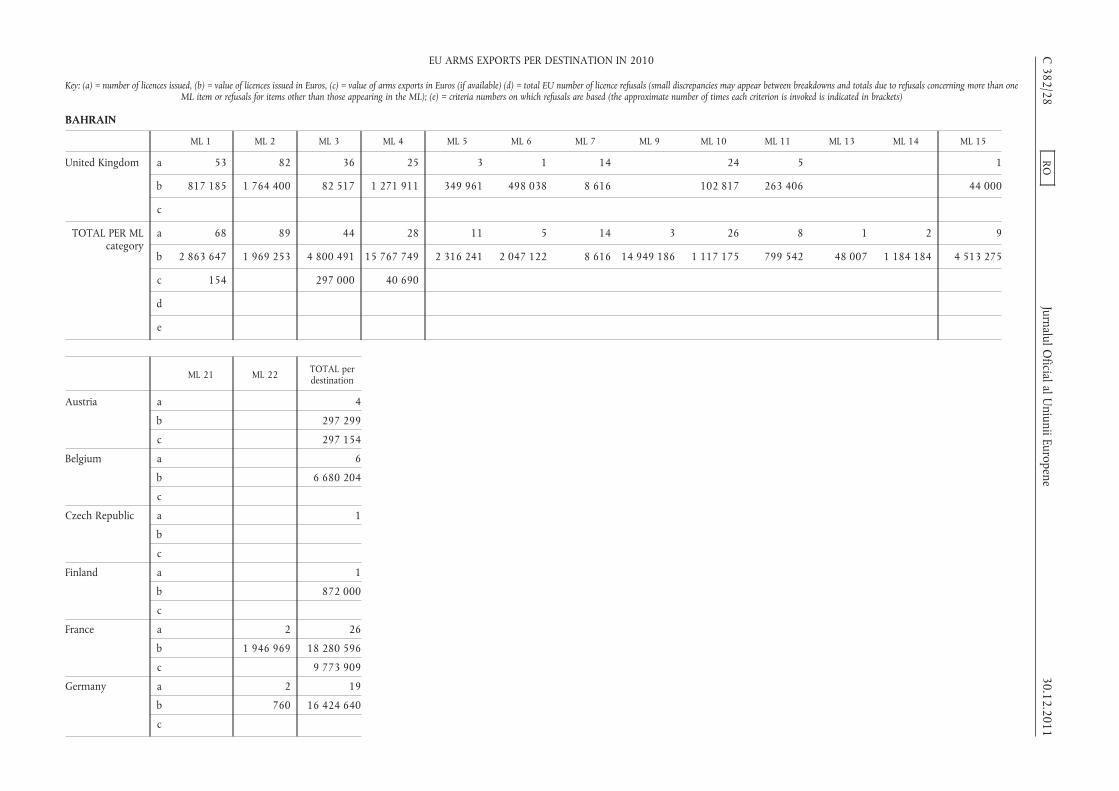
Key: (a) = number of licences issued, (b) = value of licences issued in Euros, (c) = value of arms exports in Euros (if available) (d) = total EU number of licence refusals (small discrepancies mayappear between breakdowns and totals due to refusals concerning more than one ML item or refusals for items other than those appearing in the ML); (e) = criteria numbers on which refusals are
based (the approximate number of times each criterion is invoked is indicated in brackets)

ALGERIA
ML 1 ML 2 ML 3 ML 4 ML 5 ML 6 ML 9 ML 10 ML 11
Germany a 1 7 2
b 3 404 10 304 349 368 360
c
Italy a 1 1 6 4
b 1 252 491 10 368 000 288 388 053 332 737
c
Lithuania a 1 1
b 793 788 140 650
c 18 624 158 929
Poland a 1 1 2 5 7 2
b 19 383 1 477 1 394 195 3 401 483 23 103 117 60 911
c
Slovakia a 1
b 3 825 137
c
Spain a 1
b
c 3 116 626
Sweden a 1
b
c
United Kingdom a 2 6
b 6 690 295 378 150
c
TOTAL PER MLcategory
a 3 4 5 9 6 21 7 28 14
b 1 332 161 300 339 24 624 098 12 691 364 1 621 130 46 171 553 40 202 356 621 436 483 2 392 615
c 728 435 907 528 10 312 065 8 973 770 72 031 15 475 515 4 799 127 280 837
d
e
ML 12 ML 14 ML 15 ML 18 ML 21 ML 22 TOTAL perdestination
Austria a 5 7
b 332 872 2 292 580
c 329 987 2 289 695
Belgium a 2
b 222 850
c
Bulgaria a 17
b 43 893 025
c 180 536 27 514 735
30.12.2011 RO Jurnalul Oficial al Uniunii Europene C 382/11
EU ARMS EXPORTS PER DESTINATION IN 2010
Key: (a) = number of licences issued, (b) = value of licences issued in Euros, (c) = value of arms exports in Euros (if available) (d) = total EU number of licence refusals (small discrepancies mayappear between breakdowns and totals due to refusals concerning more than one ML item or refusals for items other than those appearing in the ML); (e) = criteria numbers on which refusals are
based (the approximate number of times each criterion is invoked is indicated in brackets)

ALGERIA
ML 12 ML 14 ML 15 ML 18 ML 21 ML 22 TOTAL perdestination
Czech Republic a 9
b 23 561 625
c 1 8 961 224
France a 15 1 1 31
b 51 206 764 11 357 11 357 93 221 994
c 62 100 662
Germany a 1 1 12
b 1 100 000 8 060 330 19 836 443
c
Italy a 4 16
b 42 745 861 343 087 142
c 26 656
Lithuania a 2
b 934 438
c 177 553
Poland a 18
b 27 980 566
c
Slovakia a 1 2
b 7 216 000 11 041 137
c
Spain a 1
b
c 3 116 626
Sweden a 1
b 69 890 678
c 1 669 031
United Kingdom a 112 2 122
b 1 623 917 1 100 297 009 857
c
TOTAL PER MLcategory
a 114 20 5 1 3 240
b 9 939 917 102 012 955 332 872 11 357 12 457 932 972 335
c 180 536 329 987 1 105 856 182
d 1 1 2
e 2(1) 7(1) 2(1); 7(1)
C 382/12 RO Jurnalul Oficial al Uniunii Europene 30.12.2011
EU ARMS EXPORTS PER DESTINATION IN 2010
Key: (a) = number of licences issued, (b) = value of licences issued in Euros, (c) = value of arms exports in Euros (if available) (d) = total EU number of licence refusals (small discrepancies mayappear between breakdowns and totals due to refusals concerning more than one ML item or refusals for items other than those appearing in the ML); (e) = criteria numbers on which refusals are
based (the approximate number of times each criterion is invoked is indicated in brackets)

ANDORRA
ML 1 ML 3 ML 4 ML 6 TOTAL perdestination
Belgium a 1 2 1 4
b 13 089 13 545 13 421 40 055
c
France a
b
c 1 955
Germany a 36 6 1 43
b 179 066 61 880 55 400 296 346
c
Italy a
b
c 42 837
Spain a 13 3 16
b 83 252 8 000 91 252
c 17 753 10 453 28 206
Sweden a
b
c 10 610
TOTAL PER MLcategory
a 50 11 1 1 63
b 275 407 83 425 13 421 55 400 427 653
c 17 753 10 453 83 608
d 3 1 4
e 7(3) 7(1) 7 (4)
30.12.2011 RO Jurnalul Oficial al Uniunii Europene C 382/13
EU ARMS EXPORTS PER DESTINATION IN 2010
Key: (a) = number of licences issued, (b) = value of licences issued in Euros, (c) = value of arms exports in Euros (if available) (d) = total EU number of licence refusals (small discrepancies mayappear between breakdowns and totals due to refusals concerning more than one ML item or refusals for items other than those appearing in the ML); (e) = criteria numbers on which refusals are
based (the approximate number of times each criterion is invoked is indicated in brackets)

ANGOLA
ML 1 ML 3 ML 4 ML 6 ML 10 ML 11 ML 13 ML 15 ML 22 TOTAL perdestination
Belgium a 1 1
b 1 032 266 1 032 266
c
France a 2 1 1 4
b 24 867 910 117 089 9 685 24 994 685
c
Germany a 1 3 4
b 615 1 084 350 1 084 965
c
Portugal a 2 2
b 152 315 152 315
c 152 315 152 315
Slovakia a 2 2
b 66 000 66 000
c 104 104
Spain a 3 1 4
b 9 544 38 9 582
c 9 544 38 9 582
United Kingdom a 2 17 1 20
b 540 375 429 756 165 000 1 135 131
c
TOTAL PER MLcategory
a 4 1 4 21 2 2 1 1 1 37
b 10 159 38 606 375 2 546 373 152 315 24 867 910 165 000 117 089 9 685 28 474 945
c 9 544 38 104 152 315 162 001
d 2 2
e 2(1) 6(1)7(1) 8(1)
2(1) 6(1)7(1) 8(1)
C382/14
ROJurnalul O
ficialalUniunii Europene
30.12.2011EU ARMS EXPORTS PER DESTINATION IN 2010
Key: (a) = number of licences issued, (b) = value of licences issued in Euros, (c) = value of arms exports in Euros (if available) (d) = total EU number of licence refusals (small discrepancies may appear between breakdowns and totals due to refusals concerning more than oneML item or refusals for items other than those appearing in the ML); (e) = criteria numbers on which refusals are based (the approximate number of times each criterion is invoked is indicated in brackets)

ANTIGUA AND BARBUDA
ML 3 TOTAL perdestination
United Kingdom a 5 5
b 29 040 29 040
c
TOTAL PER MLcategory
a 5 5
b 29 040 29 040
c
d
e
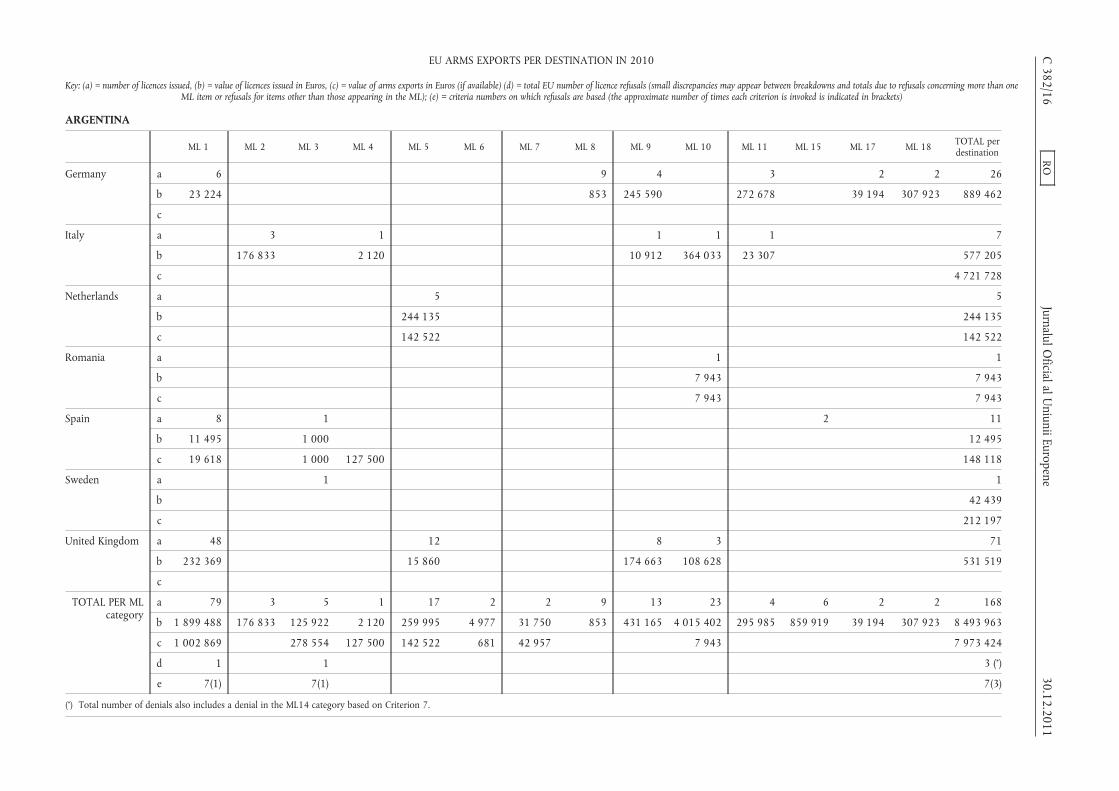
ARGENTINA
ML 1 ML 2 ML 3 ML 4 ML 5 ML 6 ML 7 ML 8 ML 9 ML 10 ML 11 ML 15 ML 17 ML 18 TOTAL perdestination
Austria a 15 1 16
b 1 061 500 681 1 062 181
c 973 356 681 974 037
Belgium a 1 1 2 4
b 500 000 3 690 350 059 853 749
c
Bulgaria a 1 1
b 118 554 118 554
c 277 554 277 554
Finland a 1 2 3
b 70 900 31 750 102 650
c 9 895 42 957 52 852
France a 1 1 18 2 22
b 2 678 4 296 3 534 798 509 860 4 051 632
c 1 436 473
30.12.2011RO
Jurnalul OficialalU
niunii EuropeneC
382/15EU ARMS EXPORTS PER DESTINATION IN 2010
Key: (a) = number of licences issued, (b) = value of licences issued in Euros, (c) = value of arms exports in Euros (if available) (d) = total EU number of licence refusals (small discrepancies may appear between breakdowns and totals due to refusals concerning more than oneML item or refusals for items other than those appearing in the ML); (e) = criteria numbers on which refusals are based (the approximate number of times each criterion is invoked is indicated in brackets)
ARGENTINA
ML 1 ML 2 ML 3 ML 4 ML 5 ML 6 ML 7 ML 8 ML 9 ML 10 ML 11 ML 15 ML 17 ML 18 TOTAL perdestination
Germany a 6 9 4 3 2 2 26
b 23 224 853 245 590 272 678 39 194 307 923 889 462
c
Italy a 3 1 1 1 1 7
b 176 833 2 120 10 912 364 033 23 307 577 205
c 4 721 728
Netherlands a 5 5
b 244 135 244 135
c 142 522 142 522
Romania a 1 1
b 7 943 7 943
c 7 943 7 943
Spain a 8 1 2 11
b 11 495 1 000 12 495
c 19 618 1 000 127 500 148 118
Sweden a 1 1
b 42 439
c 212 197
United Kingdom a 48 12 8 3 71
b 232 369 15 860 174 663 108 628 531 519
c
TOTAL PER MLcategory
a 79 3 5 1 17 2 2 9 13 23 4 6 2 2 168
b 1 899 488 176 833 125 922 2 120 259 995 4 977 31 750 853 431 165 4 015 402 295 985 859 919 39 194 307 923 8 493 963
c 1 002 869 278 554 127 500 142 522 681 42 957 7 943 7 973 424
d 1 1 3 (*)
e 7(1) 7(1) 7(3)
(*) Total number of denials also includes a denial in the ML14 category based on Criterion 7.
C382/16
ROJurnalul O
ficialalUniunii Europene
30.12.2011EU ARMS EXPORTS PER DESTINATION IN 2010
Key: (a) = number of licences issued, (b) = value of licences issued in Euros, (c) = value of arms exports in Euros (if available) (d) = total EU number of licence refusals (small discrepancies may appear between breakdowns and totals due to refusals concerning more than oneML item or refusals for items other than those appearing in the ML); (e) = criteria numbers on which refusals are based (the approximate number of times each criterion is invoked is indicated in brackets)

ARMENIA
ML 1 ML 3 TOTAL perdestination
Austria a 1 1
b 18 650 18 650
c 18 650 18 650
Italy a
b
c 940
TOTAL PER MLcategory
a 1 1
b 18 650 18 650
c 18 650 19 590
d 4 1 5
e 1(4) 7(3) 1(1) 1(5) 7(3)
AUSTRALIA
ML 1 ML 2 ML 3 ML 4 ML 5 ML 6 ML 7 ML 8 ML 9 ML 10 ML 11 ML 13
Austria a 34 2 1 1 1 14
b 1 203 645 12 000 1 000 1 043 784 49 400 97 967 934
c 428 286 12 000 1 000 626 859 49 400 26 654 365
Belgium a 10 4 1 1
b 10 057 683 883 730 12 845 73 810
c
Czech Republic a 3 1 1
b 58 227 2 061
c 7 936 1 441 280
Denmark a 1 3 2
b 16 395 2 496 405 22 576
c
30.12.2011RO
Jurnalul OficialalU
niunii EuropeneC
382/17EU ARMS EXPORTS PER DESTINATION IN 2010
Key: (a) = number of licences issued, (b) = value of licences issued in Euros, (c) = value of arms exports in Euros (if available) (d) = total EU number of licence refusals (small discrepancies may appear between breakdowns and totals due to refusals concerning more than oneML item or refusals for items other than those appearing in the ML); (e) = criteria numbers on which refusals are based (the approximate number of times each criterion is invoked is indicated in brackets)

AUSTRALIA
ML 1 ML 2 ML 3 ML 4 ML 5 ML 6 ML 7 ML 8 ML 9 ML 10 ML 11 ML 13
Finland a 4 2 9 2
b 630 212 804 502 26 676 29 205
c 1 777 65 199 6 985 81 960
France a 10 2 19 16 1 1 6 35 11 3
b 2 261 459 2 104 794 51 108 699 4 476 029 25 228 13 118 35 197 917 763 367 260 12 770 824 8 775 316
c
Germany a 242 3 23 4 36 7 8 29 20 27
b 1 721 221 74 968 3 064 606 779 427 8 226 267 444 1 544 1 744 306 1 644 725 795 915
c
Greece a
b
c
Ireland a 3 4 1
b 13 600 1 574 492 6 905
c
Italy a 1 7 7 6 1
b 13 100 31 903 125 438 856 43 026 583 1 649 370
c
Latvia a 1
b 2 585
c 2 585
Malta a 2
b 300
c 300
C382/18
ROJurnalul O
ficialalUniunii Europene
30.12.2011EU ARMS EXPORTS PER DESTINATION IN 2010
Key: (a) = number of licences issued, (b) = value of licences issued in Euros, (c) = value of arms exports in Euros (if available) (d) = total EU number of licence refusals (small discrepancies may appear between breakdowns and totals due to refusals concerning more than oneML item or refusals for items other than those appearing in the ML); (e) = criteria numbers on which refusals are based (the approximate number of times each criterion is invoked is indicated in brackets)

AUSTRALIA
ML 1 ML 2 ML 3 ML 4 ML 5 ML 6 ML 7 ML 8 ML 9 ML 10 ML 11 ML 13
Netherlands a 1 1 2 1 2
b 1 650 600 000 32 760 775 000 180 000
c 32 760 586 475 96 000
Romania a 2
b 3 259
c 3 259
Slovenia a 1
b 17 496
c 8 748
Spain a 1 5 2 2
b 6 100 10 800 000 305 037 500 20 039 324
c 6 100 17 860 000 6 744 243
Sweden a 3 1 1 1
b
c
United Kingdom a 213 6 35 25 3 38 35 3 164 34 46 4
b 833 451 8 030 14 917 2 449 618 99 000 5 301 687 1 210 226 120 761 428 1 047 720 70 453 963
c
TOTAL PER MLcategory
a 527 19 65 55 29 93 52 11 212 98 93 11
b 16 809 787 3 098 683 3 897 870 87 105 226 6 978 348 111 578 276 1 250 465 1 664 49 016 316 1 114 898 788 38 002 291 8 828 059
c 450 243 13 441 66 199 627 139 49 400 26 695 873 6 985 17 860 000 7 330 718 177 960
d
e
30.12.2011RO
Jurnalul OficialalU
niunii EuropeneC
382/19EU ARMS EXPORTS PER DESTINATION IN 2010
Key: (a) = number of licences issued, (b) = value of licences issued in Euros, (c) = value of arms exports in Euros (if available) (d) = total EU number of licence refusals (small discrepancies may appear between breakdowns and totals due to refusals concerning more than oneML item or refusals for items other than those appearing in the ML); (e) = criteria numbers on which refusals are based (the approximate number of times each criterion is invoked is indicated in brackets)

AUSTRALIA
ML 14 ML 15 ML 16 ML 17 ML 18 ML 21 ML 22 TOTAL perdestination
Austria a 1 54
b 10 000 100 287 763
c 27 771 910
Belgium a 16
b 11 028 068
c
Czech Republic a 5
b 60 288
c 9 657
Denmark a 1 1 8
b 22 442 2 557 818
c
Finland a 17
b 1 490 595
c 155 921
France a 2 18 2 6 5 137
b 5 031 610 10 081 541 18 164 1 702 622 341 434 897 276 015
c 157 522 554
Germany a 2 8 5 14 4 5 437
b 10 063 242 535 356 422 82 658 6 470 166 830 18 918 401
c
Greece a 1 1 2
b 3 033 400 128 403 161
c
Ireland a 8
b 1 594 997
c
Italy a 1 1 24
b 1 200 942 1 347 811 79 579 786
c 2 809 376
C382/20
ROJurnalul O
ficialalUniunii Europene
30.12.2011EU ARMS EXPORTS PER DESTINATION IN 2010
Key: (a) = number of licences issued, (b) = value of licences issued in Euros, (c) = value of arms exports in Euros (if available) (d) = total EU number of licence refusals (small discrepancies may appear between breakdowns and totals due to refusals concerning more than oneML item or refusals for items other than those appearing in the ML); (e) = criteria numbers on which refusals are based (the approximate number of times each criterion is invoked is indicated in brackets)

AUSTRALIA
ML 14 ML 15 ML 16 ML 17 ML 18 ML 21 ML 22 TOTAL perdestination
Latvia a 1
b 2 585
c 2 585
Malta a 2
b 300
c 300
Netherlands a 7
b 1 589 410
c 715 235
Romania a 2
b 3 259
c 3 259
Slovenia a 1
b 17 496
c 8 748
Spain a 10
b 335 882 924
c 24 610 343
Sweden a 6
b 4 243 941
c 27 055 129
United Kingdom a 4 2 1 34 49 34 730
b 3 835 118 800 262 900 546 312 485 533 753 445 13 968 437
c
TOTAL PER MLcategory
a 6 23 8 8 49 62 46 1 467
b 5 035 445 10 213 437 242 535 637 486 628 970 3 818 137 2 619 520 1 468 905 244
c 240 665 017
d
e
30.12.2011RO
Jurnalul OficialalU
niunii EuropeneC
382/21EU ARMS EXPORTS PER DESTINATION IN 2010
Key: (a) = number of licences issued, (b) = value of licences issued in Euros, (c) = value of arms exports in Euros (if available) (d) = total EU number of licence refusals (small discrepancies may appear between breakdowns and totals due to refusals concerning more than oneML item or refusals for items other than those appearing in the ML); (e) = criteria numbers on which refusals are based (the approximate number of times each criterion is invoked is indicated in brackets)

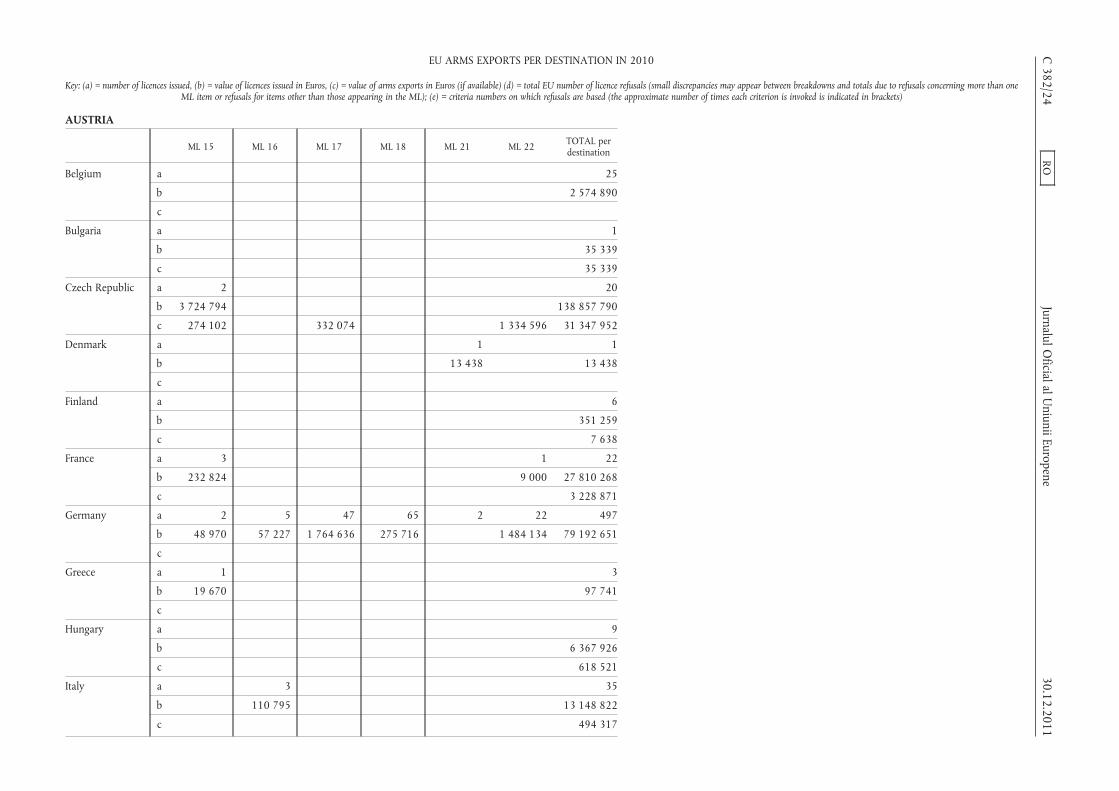
AUSTRIA
ML 1 ML 2 ML 3 ML 4 ML 5 ML 6 ML 7 ML 8 ML 9 ML 10 ML 11 ML 13 ML 14
Belgium a 18 1 6
b 2 420 606 57 190 97 094
c
Bulgaria a 1
b 35 339
c 35 339
Czech Republic a 3 1 6 2 4 2
b 2 530 645 132 400 039 201 086 1 226
c 14 093 257 7 127 882 824 860 4 016 870 169 707 1 689 149 1 485 455
Denmark a
b
c
Finland a 1 1 4
b 1 054 237 000 113 205
c 7 638
France a 3 1 1 4 2 1 2 1 3
b 20 243 52 800 741 669 140 064 21 524 26 299 766 13 400 272 196 6 780
c
Germany a 2 3 21 6 9 268 1 2 25 16 1
b 2 969 28 380 1 943 358 113 961 51 939 68 802 558 20 610 2 157 745 658 3 847 362 3 016
c
Greece a 1 1
b 8 286 69 785
c
Hungary a 1 1 5 2
b 5 880 32 046 5 680 000 650 000
c 570 561 47 960
Italy a 1 4 24 3
b 557 619 2 620 985 8 668 090 1 191 332
c
C382/22
ROJurnalul O
ficialalUniunii Europene
30.12.2011EU ARMS EXPORTS PER DESTINATION IN 2010
Key: (a) = number of licences issued, (b) = value of licences issued in Euros, (c) = value of arms exports in Euros (if available) (d) = total EU number of licence refusals (small discrepancies may appear between breakdowns and totals due to refusals concerning more than oneML item or refusals for items other than those appearing in the ML); (e) = criteria numbers on which refusals are based (the approximate number of times each criterion is invoked is indicated in brackets)

AUSTRIA
ML 1 ML 2 ML 3 ML 4 ML 5 ML 6 ML 7 ML 8 ML 9 ML 10 ML 11 ML 13 ML 14
Latvia a 2
b
c
Netherlands a 6
b 8 699
c 7 100
Poland a 3 1
b 8 817 14 772
c
Romania a 8 1
b 361 746 534 058
c 146 889
Slovenia a 1 1
b 245 238 241 188
c 63 502 728 228
Spain a 7 1 1 5 3
b 3 770 1 155 000 11 780 148 427 1 093 684
c 3 770 2 284 951 11 780 169 205 52 739
Sweden a 2 3 8 1
b
c
United Kingdom a 64 22 18 22 4 45 3
b 513 324 103 483 1 033 556 162 712 1 182 308 1 060 284 1 786
c
TOTAL PER MLcategory
a 118 7 31 18 38 301 25 18 3 57 71 4 6
b 3 382 447 366 750 6 664 862 6 518 197 2 797 932 229 529 377 384 408 760 494 274 353 11 689 740 6 106 984 113 205 4 802
c 193 098 63 502 16 385 846 7 710 223 824 860 4 914 303 169 707 47 960 52 739 1 689 149 1 485 455
d
e
30.12.2011RO
Jurnalul OficialalU
niunii EuropeneC
382/23EU ARMS EXPORTS PER DESTINATION IN 2010
Key: (a) = number of licences issued, (b) = value of licences issued in Euros, (c) = value of arms exports in Euros (if available) (d) = total EU number of licence refusals (small discrepancies may appear between breakdowns and totals due to refusals concerning more than oneML item or refusals for items other than those appearing in the ML); (e) = criteria numbers on which refusals are based (the approximate number of times each criterion is invoked is indicated in brackets)
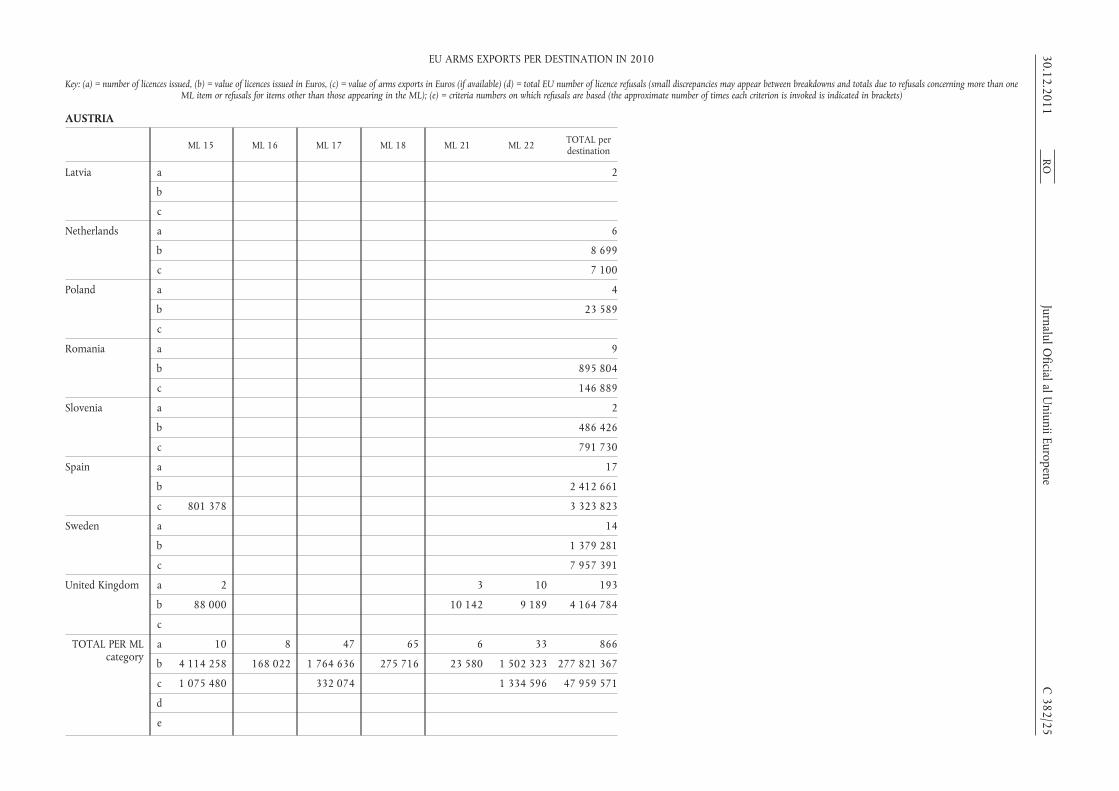
AUSTRIA
ML 15 ML 16 ML 17 ML 18 ML 21 ML 22 TOTAL perdestination
Belgium a 25
b 2 574 890
c
Bulgaria a 1
b 35 339
c 35 339
Czech Republic a 2 20
b 3 724 794 138 857 790
c 274 102 332 074 1 334 596 31 347 952
Denmark a 1 1
b 13 438 13 438
c
Finland a 6
b 351 259
c 7 638
France a 3 1 22
b 232 824 9 000 27 810 268
c 3 228 871
Germany a 2 5 47 65 2 22 497
b 48 970 57 227 1 764 636 275 716 1 484 134 79 192 651
c
Greece a 1 3
b 19 670 97 741
c
Hungary a 9
b 6 367 926
c 618 521
Italy a 3 35
b 110 795 13 148 822
c 494 317
C382/24
ROJurnalul O
ficialalUniunii Europene
30.12.2011EU ARMS EXPORTS PER DESTINATION IN 2010
Key: (a) = number of licences issued, (b) = value of licences issued in Euros, (c) = value of arms exports in Euros (if available) (d) = total EU number of licence refusals (small discrepancies may appear between breakdowns and totals due to refusals concerning more than oneML item or refusals for items other than those appearing in the ML); (e) = criteria numbers on which refusals are based (the approximate number of times each criterion is invoked is indicated in brackets)
AUSTRIA
ML 15 ML 16 ML 17 ML 18 ML 21 ML 22 TOTAL perdestination
Latvia a 2
b
c
Netherlands a 6
b 8 699
c 7 100
Poland a 4
b 23 589
c
Romania a 9
b 895 804
c 146 889
Slovenia a 2
b 486 426
c 791 730
Spain a 17
b 2 412 661
c 801 378 3 323 823
Sweden a 14
b 1 379 281
c 7 957 391
United Kingdom a 2 3 10 193
b 88 000 10 142 9 189 4 164 784
c
TOTAL PER MLcategory
a 10 8 47 65 6 33 866
b 4 114 258 168 022 1 764 636 275 716 23 580 1 502 323 277 821 367
c 1 075 480 332 074 1 334 596 47 959 571
d
e
30.12.2011RO
Jurnalul OficialalU
niunii EuropeneC
382/25EU ARMS EXPORTS PER DESTINATION IN 2010
Key: (a) = number of licences issued, (b) = value of licences issued in Euros, (c) = value of arms exports in Euros (if available) (d) = total EU number of licence refusals (small discrepancies may appear between breakdowns and totals due to refusals concerning more than oneML item or refusals for items other than those appearing in the ML); (e) = criteria numbers on which refusals are based (the approximate number of times each criterion is invoked is indicated in brackets)

AZERBAIJAN
ML 1 ML 2 ML 4 ML 6 ML 8 ML 10 ML 11 ML 17 ML 18 ML 22 TOTAL perdestination
Austria a 3 3
b 59 674 59 674
c 41 026 41 026
Czech Republic a 2 1 1 4
b 4 131 191 341 980 449 912 4 923 083
c 2 514 725 157 419 444 558 3 116 702
Germany a 2 2
b 1 180 668 1 180 668
c
Italy a
b
c 31 625
Poland a 1 1 2
b 75 834 1 000 000 1 075 834
c
Romania a 1 1 1 4 1 8
b 24 138 113 148 4 299 615 642 768 756 225 5 835 894
c 24 138 113 148 2 705 265 2 842 551
Slovakia a 1 1 2
b 27 341 150 000 177 341
c 27 341 150 000 177 341
Sweden a 1 1
b 10 610
c
TOTAL PER MLcategory
a 4 1 1 4 1 2 1 1 5 2 22
b 83 812 113 148 27 341 1 406 502 4 131 191 4 299 615 341 980 1 092 680 1 756 225 13 263 104
c 65 164 113 148 27 341 150 000 2 514 725 2 705 265 157 419 444 558 6 209 245
d 1 1 1 2 4 9
e 1(1) 1(1) 4(1) 1(1) 1(2) 4(1) 1(2) 2(1)4(1) 5(1)
1(7) 2(1)4(3) 5(1)
C382/26
ROJurnalul O
ficialalUniunii Europene
30.12.2011EU ARMS EXPORTS PER DESTINATION IN 2010
Key: (a) = number of licences issued, (b) = value of licences issued in Euros, (c) = value of arms exports in Euros (if available) (d) = total EU number of licence refusals (small discrepancies may appear between breakdowns and totals due to refusals concerning more than oneML item or refusals for items other than those appearing in the ML); (e) = criteria numbers on which refusals are based (the approximate number of times each criterion is invoked is indicated in brackets)

BAHRAIN
ML 1 ML 2 ML 3 ML 4 ML 5 ML 6 ML 7 ML 9 ML 10 ML 11 ML 13 ML 14 ML 15
Austria a 2 2
b 299 297 000
c 154 297 000
Belgium a 3 1 2
b 857 488 4 278 966 1 543 750
c
Czech Republic a 1
b
c
Finland a 1
b 872 000
c
France a 2 1 8 2 2 1 1 7
b 1 067 8 126 063 1 966 280 5 334 533 416 48 007 1 184 184 4 469 275
c
Germany a 7 4 3 2 1
b 315 608 142 008 14 949 186 1 014 358 2 720
c
Italy a 5
b 204 853
c
Spain a 2 1
b 6 369 775
c 40 690
Sweden a 2 1
b
c
30.12.2011RO
Jurnalul OficialalU
niunii EuropeneC
382/27EU ARMS EXPORTS PER DESTINATION IN 2010
Key: (a) = number of licences issued, (b) = value of licences issued in Euros, (c) = value of arms exports in Euros (if available) (d) = total EU number of licence refusals (small discrepancies may appear between breakdowns and totals due to refusals concerning more than oneML item or refusals for items other than those appearing in the ML); (e) = criteria numbers on which refusals are based (the approximate number of times each criterion is invoked is indicated in brackets)
BAHRAIN
ML 1 ML 2 ML 3 ML 4 ML 5 ML 6 ML 7 ML 9 ML 10 ML 11 ML 13 ML 14 ML 15
United Kingdom a 53 82 36 25 3 1 14 24 5 1
b 817 185 1 764 400 82 517 1 271 911 349 961 498 038 8 616 102 817 263 406 44 000
c
TOTAL PER MLcategory
a 68 89 44 28 11 5 14 3 26 8 1 2 9
b 2 863 647 1 969 253 4 800 491 15 767 749 2 316 241 2 047 122 8 616 14 949 186 1 117 175 799 542 48 007 1 184 184 4 513 275
c 154 297 000 40 690
d
e
ML 21 ML 22 TOTAL perdestination
Austria a 4
b 297 299
c 297 154
Belgium a 6
b 6 680 204
c
Czech Republic a 1
b
c
Finland a 1
b 872 000
c
France a 2 26
b 1 946 969 18 280 596
c 9 773 909
Germany a 2 19
b 760 16 424 640
c
C382/28
ROJurnalul O
ficialalUniunii Europene
30.12.2011EU ARMS EXPORTS PER DESTINATION IN 2010
Key: (a) = number of licences issued, (b) = value of licences issued in Euros, (c) = value of arms exports in Euros (if available) (d) = total EU number of licence refusals (small discrepancies may appear between breakdowns and totals due to refusals concerning more than oneML item or refusals for items other than those appearing in the ML); (e) = criteria numbers on which refusals are based (the approximate number of times each criterion is invoked is indicated in brackets)

BAHRAIN
ML 21 ML 22 TOTAL perdestination
Italy a 5
b 204 853
c 11 806
Spain a 3
b 6 369 775
c 40 690
Sweden a 3
b 1 591 478
c 3 289 055
United Kingdom a 1 3 248
b 110 14 989 5 217 950
c
TOTAL PER MLcategory
a 1 7 316
b 110 1 962 718 55 938 795
c 13 412 613
d
e
BAHAMAS
ML 9 TOTAL perdestination
Italy a
b
c 10 387
United Kingdom a 2 2
b 18 876 18 876
c
TOTAL PER MLcategory
a 2 2
b 18 876 18 876
c 10 387
d
e
30.12.2011RO
Jurnalul OficialalU
niunii EuropeneC
382/29EU ARMS EXPORTS PER DESTINATION IN 2010
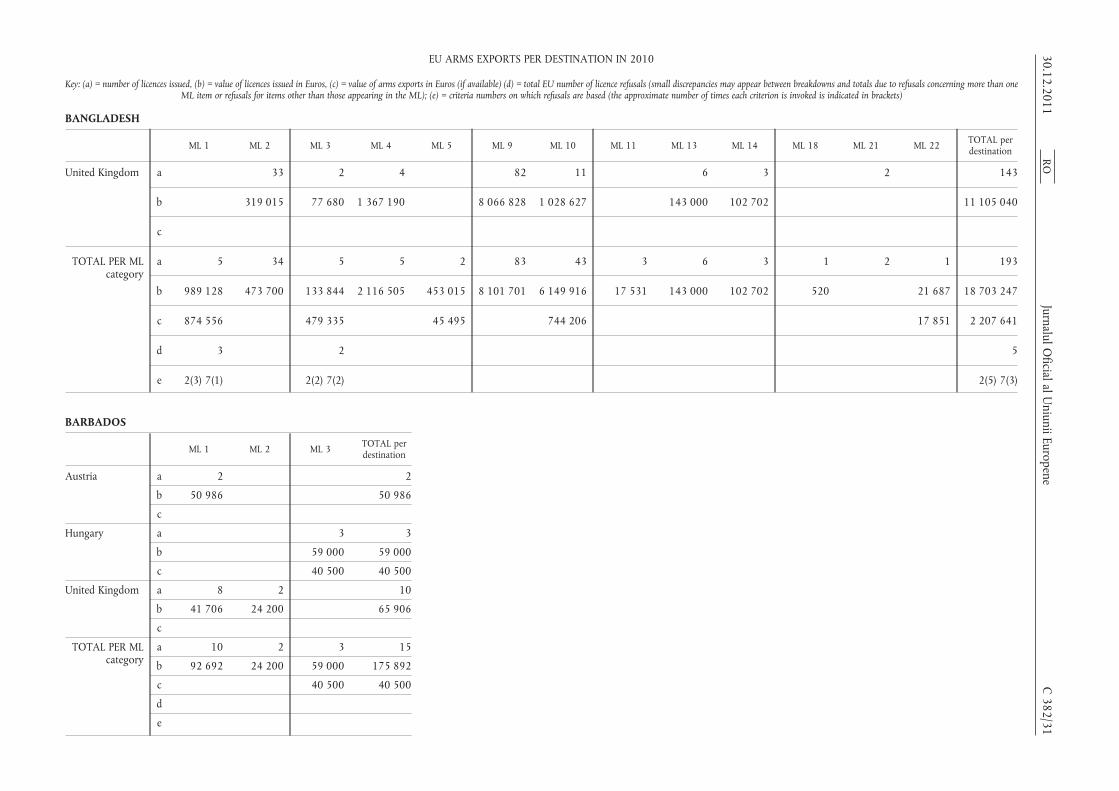
Key: (a) = number of licences issued, (b) = value of licences issued in Euros, (c) = value of arms exports in Euros (if available) (d) = total EU number of licence refusals (small discrepancies may appear between breakdowns and totals due to refusals concerning more than oneML item or refusals for items other than those appearing in the ML); (e) = criteria numbers on which refusals are based (the approximate number of times each criterion is invoked is indicated in brackets)

BANGLADESH
ML 1 ML 2 ML 3 ML 4 ML 5 ML 9 ML 10 ML 11 ML 13 ML 14 ML 18 ML 21 ML 22 TOTAL perdestination
Bulgaria a
b
c 425 000 425 000
Czech Republic a 5 1 20 3 29
b 989 128 49 427 1 541 969 17 531 2 598 055
c 874 556 54 335 509 569 1 438 460
Germany a 2 1 1 1 5
b 6 737 34 873 15 360 520 57 490
c
Italy a 1 1
b 154 685 154 685
c 46 198
Lithuania a 2 2
b 82 826 82 826
c
Netherlands a 2 2
b 453 015 453 015
c 45 495 45 495
Poland a 5 5
b 683 047 683 047
c
Romania a 2 2
b 2 618 089 2 618 089
c 89 010 89 010
Slovakia a 2 1 3
b 179 998 21 687 201 685
c 145 627 17 851 163 478
Spain a 1 1
b 749 315 749 315
c
C382/30
ROJurnalul O
ficialalUniunii Europene
30.12.2011EU ARMS EXPORTS PER DESTINATION IN 2010
Key: (a) = number of licences issued, (b) = value of licences issued in Euros, (c) = value of arms exports in Euros (if available) (d) = total EU number of licence refusals (small discrepancies may appear between breakdowns and totals due to refusals concerning more than oneML item or refusals for items other than those appearing in the ML); (e) = criteria numbers on which refusals are based (the approximate number of times each criterion is invoked is indicated in brackets)
BANGLADESH
ML 1 ML 2 ML 3 ML 4 ML 5 ML 9 ML 10 ML 11 ML 13 ML 14 ML 18 ML 21 ML 22 TOTAL perdestination
United Kingdom a 33 2 4 82 11 6 3 2 143
b 319 015 77 680 1 367 190 8 066 828 1 028 627 143 000 102 702 11 105 040
c
TOTAL PER MLcategory
a 5 34 5 5 2 83 43 3 6 3 1 2 1 193
b 989 128 473 700 133 844 2 116 505 453 015 8 101 701 6 149 916 17 531 143 000 102 702 520 21 687 18 703 247
c 874 556 479 335 45 495 744 206 17 851 2 207 641
d 3 2 5
e 2(3) 7(1) 2(2) 7(2) 2(5) 7(3)
BARBADOS
ML 1 ML 2 ML 3 TOTAL perdestination
Austria a 2 2
b 50 986 50 986
c
Hungary a 3 3
b 59 000 59 000
c 40 500 40 500
United Kingdom a 8 2 10
b 41 706 24 200 65 906
c
TOTAL PER MLcategory
a 10 2 3 15
b 92 692 24 200 59 000 175 892
c 40 500 40 500
d
e
30.12.2011RO
JurnalulOficialalU
niuniiEuropeneC
382/31EU ARMS EXPORTS PER DESTINATION IN 2010
Key: (a) = number of licences issued, (b) = value of licences issued in Euros, (c) = value of arms exports in Euros (if available) (d) = total EU number of licence refusals (small discrepancies may appear between breakdowns and totals due to refusals concerning more than oneML item or refusals for items other than those appearing in the ML); (e) = criteria numbers on which refusals are based (the approximate number of times each criterion is invoked is indicated in brackets)
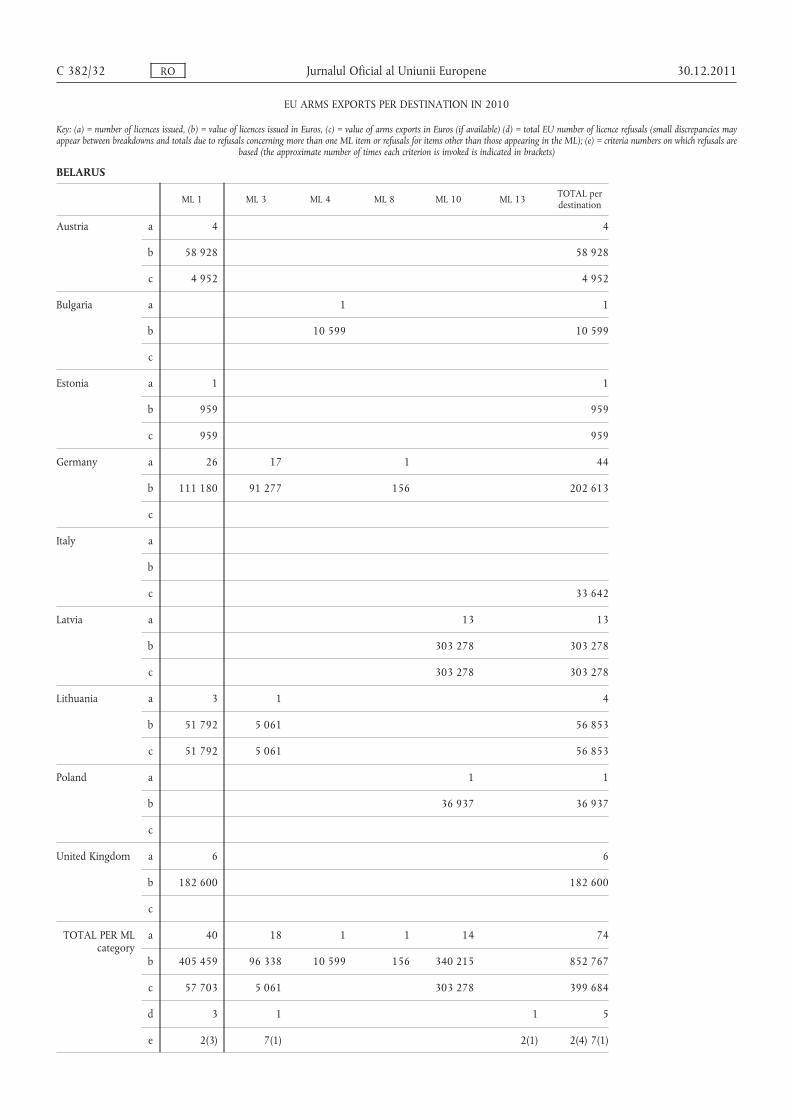
BELARUS
ML 1 ML 3 ML 4 ML 8 ML 10 ML 13 TOTAL perdestination
Austria a 4 4
b 58 928 58 928
c 4 952 4 952
Bulgaria a 1 1
b 10 599 10 599
c
Estonia a 1 1
b 959 959
c 959 959
Germany a 26 17 1 44
b 111 180 91 277 156 202 613
c
Italy a
b
c 33 642
Latvia a 13 13
b 303 278 303 278
c 303 278 303 278
Lithuania a 3 1 4
b 51 792 5 061 56 853
c 51 792 5 061 56 853
Poland a 1 1
b 36 937 36 937
c
United Kingdom a 6 6
b 182 600 182 600
c
TOTAL PER MLcategory
a 40 18 1 1 14 74
b 405 459 96 338 10 599 156 340 215 852 767
c 57 703 5 061 303 278 399 684
d 3 1 1 5
e 2(3) 7(1) 2(1) 2(4) 7(1)
C 382/32 RO Jurnalul Oficial al Uniunii Europene 30.12.2011
EU ARMS EXPORTS PER DESTINATION IN 2010
Key: (a) = number of licences issued, (b) = value of licences issued in Euros, (c) = value of arms exports in Euros (if available) (d) = total EU number of licence refusals (small discrepancies mayappear between breakdowns and totals due to refusals concerning more than one ML item or refusals for items other than those appearing in the ML); (e) = criteria numbers on which refusals are
based (the approximate number of times each criterion is invoked is indicated in brackets)

BELGIUM
ML 1 ML 2 ML 3 ML 4 ML 5 ML 6 ML 7 ML 8 ML 9 ML 10 ML 11 ML 13 ML 14
Austria a 1 2
b 2 500 681 820
c 2 500 681 820
Bulgaria a 1 2 1
b 529 7 650 135 000
c 5 800
Czech Republic a 6 1 4 1 1
b 49 114 4 350 1 168 449 16 954 1 586 715
c 53 665 3 698 719 202 1 011 122
Denmark a 4 2
b 2 297 655 262 581
c
Finland a 1 3 3
b 237 000 7 306 379 205
c 146 705 17 255 2 525
France a 7 5 7 22 8 6 3 2 1 22 14 7 2
b 736 363 445 459 829 550 1 773 744 1 962 652 858 077 312 096 130 234 115 894 6 493 526 11 951 749 4 104 210 741 785
c
Germany a 40 2 25 3 13 153 5 5 51
b 179 773 790 1 091 228 11 464 264 656 7 078 809 344 697 299 6 626 710
c
Greece a 2 1
b 123 774 4 000
c
Hungary a 1
b 5 000
c
Italy a 16 11 5 2 1 2
b 2 007 453 1 405 367 225 619 6 524 313 180 239
c
30.12.2011RO
Jurnalul OficialalU
niunii EuropeneC
382/33EU ARMS EXPORTS PER DESTINATION IN 2010
Key: (a) = number of licences issued, (b) = value of licences issued in Euros, (c) = value of arms exports in Euros (if available) (d) = total EU number of licence refusals (small discrepancies may appear between breakdowns and totals due to refusals concerning more than oneML item or refusals for items other than those appearing in the ML); (e) = criteria numbers on which refusals are based (the approximate number of times each criterion is invoked is indicated in brackets)

BELGIUM
ML 1 ML 2 ML 3 ML 4 ML 5 ML 6 ML 7 ML 8 ML 9 ML 10 ML 11 ML 13 ML 14
Malta a 1
b 200
c 200
Poland a 1 1 3
b 1 625 172 040 62 045
c
Portugal a 1
b 3 346
c 3 346
Romania a 3 1 1 7
b 225 045 6 300 500 000 37 195
c 28 033 92 573 14 274
Spain a 4 8 6 1 1
b 813 578 2 017 920
c 370 595 2 636 076
Sweden a 1 1 2 2 5
b
c
United Kingdom a 214 3 7 11 33 23 5 2 9 3 5
b 963 877 92 197 19 638 211 310 70 240 21 671 5 850 3 410 86 381 23 529 19 960
c
TOTAL PER MLcategory
a 297 9 68 47 32 196 34 9 6 35 77 25 7
b 4 290 254 450 599 6 509 179 4 200 339 2 438 618 15 036 439 341 417 1 716 949 121 744 9 495 236 18 845 079 4 868 765 761 744
c 231 103 3 698 1 794 672 2 636 076 92 573 2 525 1 011 122 3 346 14 274
d
e
C382/34
ROJurnalul O
ficialalUniunii Europene
30.12.2011EU ARMS EXPORTS PER DESTINATION IN 2010
Key: (a) = number of licences issued, (b) = value of licences issued in Euros, (c) = value of arms exports in Euros (if available) (d) = total EU number of licence refusals (small discrepancies may appear between breakdowns and totals due to refusals concerning more than oneML item or refusals for items other than those appearing in the ML); (e) = criteria numbers on which refusals are based (the approximate number of times each criterion is invoked is indicated in brackets)

BELGIUM
ML 15 ML 16 ML 17 ML 18 ML 21 ML 22 TOTAL perdestination
Austria a 3
b 684 320
c 684 320
Bulgaria a 4
b 143 179
c 5 800
Czech Republic a 13
b 2 825 582
c 2 816 1 790 503
Denmark a 1 7
b 2 560 236
c
Finland a 1 1 9
b 460 000 137 600 1 221 111
c 131 608 298 093
France a 8 1 2 11 128
b 5 804 604 43 402 17 516 844 1 126 751 54 946 942
c 32 016 136
Germany a 2 2 8 27 10 32 378
b 92 850 38 245 150 104 1 061 172 87 213 2 422 832 19 803 489
c
Greece a 3
b 127 774
c
Hungary a 1
b 5 000
c
Italy a 6 3 46
b 418 437 932 884 11 694 312
c 225 310
30.12.2011RO
Jurnalul OficialalU
niunii EuropeneC
382/35EU ARMS EXPORTS PER DESTINATION IN 2010
Key: (a) = number of licences issued, (b) = value of licences issued in Euros, (c) = value of arms exports in Euros (if available) (d) = total EU number of licence refusals (small discrepancies may appear between breakdowns and totals due to refusals concerning more than oneML item or refusals for items other than those appearing in the ML); (e) = criteria numbers on which refusals are based (the approximate number of times each criterion is invoked is indicated in brackets)

BELGIUM
ML 15 ML 16 ML 17 ML 18 ML 21 ML 22 TOTAL perdestination
Malta a 1
b 200
c 200
Poland a 5
b 235 710
c
Portugal a 1
b 3 346
c 3 346
Romania a 2 1 15
b 1 529 796 500 000 2 798 336
c 296 251 6 017 437 148
Spain a 20
b 2 831 498
c 3 006 671
Sweden a 11
b 2 121 971
c 636 591
United Kingdom a 4 3 1 2 325
b 106 150 1 744 4 807 11 1 630 774
c
TOTAL PER MLcategory
a 16 8 9 31 15 49 970
b 7 533 400 456 682 650 104 1 106 318 18 068 864 4 620 078 103 633 781
c 296 251 6 017 2 816 131 608 39 104 117
d
e
C382/36
ROJurnalul O
ficialalUniunii Europene
30.12.2011EU ARMS EXPORTS PER DESTINATION IN 2010
Key: (a) = number of licences issued, (b) = value of licences issued in Euros, (c) = value of arms exports in Euros (if available) (d) = total EU number of licence refusals (small discrepancies may appear between breakdowns and totals due to refusals concerning more than oneML item or refusals for items other than those appearing in the ML); (e) = criteria numbers on which refusals are based (the approximate number of times each criterion is invoked is indicated in brackets)

BELIZE
ML 4 TOTAL perdestination
United Kingdom a 2 2
b 8 987 8 987
c
TOTAL PER MLcategory
a 2 2
b 8 987 8 987
c
d
e
BENIN
ML 1 TOTAL perdestination
Belgium a 1 1
b 298 799 298 799
c
Romania a 1 1
b 33 944 33 944
c 33 944 33 944
TOTAL PER MLcategory
a 2 2
b 332 743 332 743
c 33 944 33 944
d
e
BHUTAN
ML 1 ML 3 TOTAL perdestination
Germany a 7 2 9
b 50 918 12 350 63 268
c
TOTAL PER MLcategory
a 7 2 9
b 50 918 12 350 63 268
c
d
e
30.12.2011 RO Jurnalul Oficial al Uniunii Europene C 382/37
EU ARMS EXPORTS PER DESTINATION IN 2010
Key: (a) = number of licences issued, (b) = value of licences issued in Euros, (c) = value of arms exports in Euros (if available) (d) = total EU number of licence refusals (small discrepancies mayappear between breakdowns and totals due to refusals concerning more than one ML item or refusals for items other than those appearing in the ML); (e) = criteria numbers on which refusals are
based (the approximate number of times each criterion is invoked is indicated in brackets)

BOLIVIA
ML 1 ML 6 ML 10 TOTAL perdestination
Germany a 1 1
b 499 499
c
Spain a
b
c 1 950 1 950
United Kingdom a 1 1
b 71 500 71 500
c
TOTAL PER MLcategory
a 1 1 2
b 499 71 500 71 999
c 1 950 1 950
d
e
BOSNIA AND HERZEGOVINA
ML 1 ML 3 ML 8 ML 10 ML 11 ML 22 TOTAL perdestination
Austria a 23 1 24
b 528 610 8 700 537 310
c 380 461 8 700 389 161
Czech Republic a 2 2
b 33 611 33 611
c 27 995 27 995
Denmark a 1 1
b 4 031 4 031
c
Germany a 1 1 2
b 4 055 32 4 087
c
Greece a 3 3
b
c
Italy a
b
c 47 968
Romania a 1 1
b 8 328 8 328
c
C 382/38 RO Jurnalul Oficial al Uniunii Europene 30.12.2011
EU ARMS EXPORTS PER DESTINATION IN 2010
Key: (a) = number of licences issued, (b) = value of licences issued in Euros, (c) = value of arms exports in Euros (if available) (d) = total EU number of licence refusals (small discrepancies mayappear between breakdowns and totals due to refusals concerning more than one ML item or refusals for items other than those appearing in the ML); (e) = criteria numbers on which refusals are
based (the approximate number of times each criterion is invoked is indicated in brackets)

BOSNIA AND HERZEGOVINA
ML 1 ML 3 ML 8 ML 10 ML 11 ML 22 TOTAL perdestination
Slovakia a 1 1
b 329 000 329 000
c 329 000 329 000
Slovenia a 1 1
b 3 442 3 442
c
United Kingdom a 4 1 5
b 6 437 15 523 21 960
c
TOTAL PER MLcategory
a 32 4 1 1 1 1 40
b 543 133 45 753 32 8 328 15 523 329 000 941 769
c 380 461 36 695 329 000 794 124
d 4 1 5
e 7(4) 7(1) 7(5)
BOTSWANA
ML 1 ML 3 ML 4 ML 5 ML 6 ML 10 ML 11 TOTAL perdestination
Austria a 1 1
b 450 806 450 806
c 450 806 450 806
France a 1 2 3
b 571 900 2 179 169 2 751 069
c 143 750
Germany a 15 1 16
b 110 115 360 000 470 115
c
Spain a
b
c 1 404 420 1 404 420
United Kingdom a 4 1 4 9
b 9 648 2 145 14 388 26 180
c
TOTAL PER MLcategory
a 19 1 1 1 1 6 29
b 119 763 360 000 2 145 571 900 450 806 2 193 557 3 698 170
c 450 806 1 404 420 1 998 976
d
e
30.12.2011 RO Jurnalul Oficial al Uniunii Europene C 382/39
EU ARMS EXPORTS PER DESTINATION IN 2010
Key: (a) = number of licences issued, (b) = value of licences issued in Euros, (c) = value of arms exports in Euros (if available) (d) = total EU number of licence refusals (small discrepancies mayappear between breakdowns and totals due to refusals concerning more than one ML item or refusals for items other than those appearing in the ML); (e) = criteria numbers on which refusals are
based (the approximate number of times each criterion is invoked is indicated in brackets)

BRAZIL
ML 1 ML 2 ML 3 ML 4 ML 5 ML 6 ML 7 ML 8 ML 9 ML 10 ML 11 ML 13
Austria a 15 2 1
b 13 078 268 124 680 44 000
c 1 167 968 119 700 44 000
Belgium a 26 1 2 11
b 1 247 980 12 959 6 208 994 2 692 000
c
Bulgaria a
b
c 180 000
Czech Republic a 2 1 2 1
b 154 109 213 524 275 802 134
c 126 285 274 967 135
Finland a 1 1
b 52 250
c 52 250
France a 6 3 2 11 8 1 8 60 25 1
b 4 489 431 897 504 2 522 8 244 616 4 023 150 252 213 541 878 280 064 938 5 304 521 43 522
c
Germany a 12 2 4 3 32 1 17 9 8 16 3
b 59 798 151 055 149 842 524 555 2 499 454 19 570 4 722 7 101 518 10 984 1 720 431 333 473
c
Italy a 1 3 7 1 2 12
b 28 599 4 340 357 2 579 972 2 389 754 94 924 10 502 086
c
Portugal a 37
b 4 728 833
c 4 068 781
C382/40
ROJurnalul O
ficialalUniunii Europene
30.12.2011EU ARMS EXPORTS PER DESTINATION IN 2010
Key: (a) = number of licences issued, (b) = value of licences issued in Euros, (c) = value of arms exports in Euros (if available) (d) = total EU number of licence refusals (small discrepancies may appear between breakdowns and totals due to refusals concerning more than oneML item or refusals for items other than those appearing in the ML); (e) = criteria numbers on which refusals are based (the approximate number of times each criterion is invoked is indicated in brackets)

BRAZIL
ML 1 ML 2 ML 3 ML 4 ML 5 ML 6 ML 7 ML 8 ML 9 ML 10 ML 11 ML 13
Slovenia a 1
b 222
c 222
Spain a 1 4 3 1 2
b 12 606 3 117 401 8 600 183 680 480 000 000
c 12 564 3 270 783 84 072 1 165 441 10 334 608
Sweden a 1 3 1 2
b
c
United Kingdom a 88 18 34 7 16 14 28 125 46 3
b 140 724 89 830 65 144 118 863 42 633 48 554 307 926 965 167 2 037 376 102 117
c
TOTAL PER MLcategory
a 151 28 43 25 18 60 18 33 82 207 87 7
b 19 182 916 1 179 947 483 505 15 821 237 7 127 677 11 802 129 163 048 2 924 536 12 680 155 771 543 175 9 062 328 479 112
c 1 306 817 232 472 3 270 783 478 739 1 209 576 4 068 781 10 334 608
d
e
ML 14 ML 15 ML 16 ML 17 ML 18 ML 21 ML 22 TOTAL perdestination
Austria a 9 27
b 48 268 13 295 216
c 48 268 1 379 936
Belgium a 3 43
b 847 982 11 009 915
c
30.12.2011RO
Jurnalul OficialalU
niunii EuropeneC
382/41EU ARMS EXPORTS PER DESTINATION IN 2010
Key: (a) = number of licences issued, (b) = value of licences issued in Euros, (c) = value of arms exports in Euros (if available) (d) = total EU number of licence refusals (small discrepancies may appear between breakdowns and totals due to refusals concerning more than oneML item or refusals for items other than those appearing in the ML); (e) = criteria numbers on which refusals are based (the approximate number of times each criterion is invoked is indicated in brackets)

BRAZIL
ML 14 ML 15 ML 16 ML 17 ML 18 ML 21 ML 22 TOTAL perdestination
Bulgaria a
b
c 180 000
Czech Republic a 6
b 643 569
c 401 387
Finland a 2
b 52 250
c 52 250
France a 13 1 7 146
b 3 351 637 10 089 21 824 865 329 050 886
c 49 557 561
Germany a 1 4 1 1 5 119
b 211 400 41 385 51 231 18 335 501 200 13 398 953
c
Italy a 26
b 19 935 691
c 519 549
Portugal a 37
b 4 728 833
c 4 068 781
Slovenia a 1
b 222
c 222
Spain a 11
b 483 322 287
c 14 867 468
C382/42
ROJurnalul O
ficialalUniunii Europene
30.12.2011EU ARMS EXPORTS PER DESTINATION IN 2010
Key: (a) = number of licences issued, (b) = value of licences issued in Euros, (c) = value of arms exports in Euros (if available) (d) = total EU number of licence refusals (small discrepancies may appear between breakdowns and totals due to refusals concerning more than oneML item or refusals for items other than those appearing in the ML); (e) = criteria numbers on which refusals are based (the approximate number of times each criterion is invoked is indicated in brackets)

BRAZIL
ML 14 ML 15 ML 16 ML 17 ML 18 ML 21 ML 22 TOTAL perdestination
Sweden a 1 8
b 848 788
c 3 819 548
United Kingdom a 6 2 14 401
b 8 360 154 876 3 927 724
c
TOTAL PER MLcategory
a 2 16 4 1 15 4 26 827
b 211 400 4 199 619 41 385 51 231 56 628 28 578 22 326 941 880 214 334
c 48 268 74 846 702
d 1 1 2
e 7(1) 7(1) 7(2)
BRUNEI
ML 1 ML 2 ML 3 ML 4 ML 5 ML 6 ML 8 ML 10 ML 11 ML 14 ML 15 ML 17
Austria a 1
b 40 000
c 40 000
Belgium a 1 1 1
b 61 365 65 025 805 000
c
Czech Republic a
b
c 20 880
30.12.2011RO
Jurnalul OficialalU
niunii EuropeneC
382/43EU ARMS EXPORTS PER DESTINATION IN 2010
Key: (a) = number of licences issued, (b) = value of licences issued in Euros, (c) = value of arms exports in Euros (if available) (d) = total EU number of licence refusals (small discrepancies may appear between breakdowns and totals due to refusals concerning more than oneML item or refusals for items other than those appearing in the ML); (e) = criteria numbers on which refusals are based (the approximate number of times each criterion is invoked is indicated in brackets)

BRUNEI
ML 1 ML 2 ML 3 ML 4 ML 5 ML 6 ML 8 ML 10 ML 11 ML 14 ML 15 ML 17
France a 7 2 8 1
b 4 127 882 11 736 474 742 434 3 500
c
Germany a 11 2 2
b 434 335 365 160 237 000
c
Italy a 1
b 4 700
c
Netherlands a
b
c 92 114 16 145 906
Sweden a
b
c
United Kingdom a 61 5 9 16 6 3 16 5 3 1
b 708 653 601 066 196 562 101 353 603 383 8 102 1 158 837 112 915 64 900 14 850
c
TOTAL PER MLcategory
a 73 3 8 17 18 15 3 16 6 3 1
b 1 204 353 430 185 842 766 5 129 444 11 837 827 1 385 817 8 102 1 158 837 116 415 64 900 14 850
c 92 114 16 145 906 40 000 20 880
d
e
C382/44
ROJurnalul O
ficialalUniunii Europene
30.12.2011EU ARMS EXPORTS PER DESTINATION IN 2010
Key: (a) = number of licences issued, (b) = value of licences issued in Euros, (c) = value of arms exports in Euros (if available) (d) = total EU number of licence refusals (small discrepancies may appear between breakdowns and totals due to refusals concerning more than oneML item or refusals for items other than those appearing in the ML); (e) = criteria numbers on which refusals are based (the approximate number of times each criterion is invoked is indicated in brackets)

BRUNEI
ML 21 ML 22 TOTAL perdestination
Austria a 1
b 40 000
c 40 000
Belgium a 3
b 931 390
c
Czech Republic a
b
c 20 880
France a 18
b 16 610 290
c 19 232 830
Germany a 15
b 1 036 495
c
Italy a 1
b 4 700
c
Netherlands a
b
c 16 238 020
Sweden a
b
c 16 657 471
United Kingdom a 11 5 141
b 33 221 3 603 841
c
TOTAL PER MLcategory
a 11 5 179
b 33 221 22 226 716
c 52 189 201
d
e
30.12.2011RO
Jurnalul OficialalU
niunii EuropeneC
382/45EU ARMS EXPORTS PER DESTINATION IN 2010
Key: (a) = number of licences issued, (b) = value of licences issued in Euros, (c) = value of arms exports in Euros (if available) (d) = total EU number of licence refusals (small discrepancies may appear between breakdowns and totals due to refusals concerning more than oneML item or refusals for items other than those appearing in the ML); (e) = criteria numbers on which refusals are based (the approximate number of times each criterion is invoked is indicated in brackets)

BULGARIA
ML 1 ML 2 ML 3 ML 4 ML 5 ML 6 ML 7 ML 8 ML 9 ML 10 ML 11 ML 13 ML 15
Austria a 1
b 25 000
c 2 500
Czech Republic a 1 1 3 5 1 3
b 1 187 355 003 3 065 151 2 686 472 695 730 383 688
c 3 910 1 251 542 2 260 700 919 756 212 423 35 427
Denmark a
b
c
Finland a 1 2
b 213 250 29 205
c
France a 2 1 3 6
b 3 360 392 000 128 406 679 9 835 000
c
Germany a 1 1 3 2 1 4
b 3 000 1 040 7 676 266 10 430 811 425 616 49 462
c
Hungary a 2
b 220 000
c
Italy a 2 1
b 13 952 501 442 410
c
Netherlands a 1
b 500
c 2 892
C382/46
ROJurnalul O
ficialalUniunii Europene
30.12.2011EU ARMS EXPORTS PER DESTINATION IN 2010
Key: (a) = number of licences issued, (b) = value of licences issued in Euros, (c) = value of arms exports in Euros (if available) (d) = total EU number of licence refusals (small discrepancies may appear between breakdowns and totals due to refusals concerning more than oneML item or refusals for items other than those appearing in the ML); (e) = criteria numbers on which refusals are based (the approximate number of times each criterion is invoked is indicated in brackets)
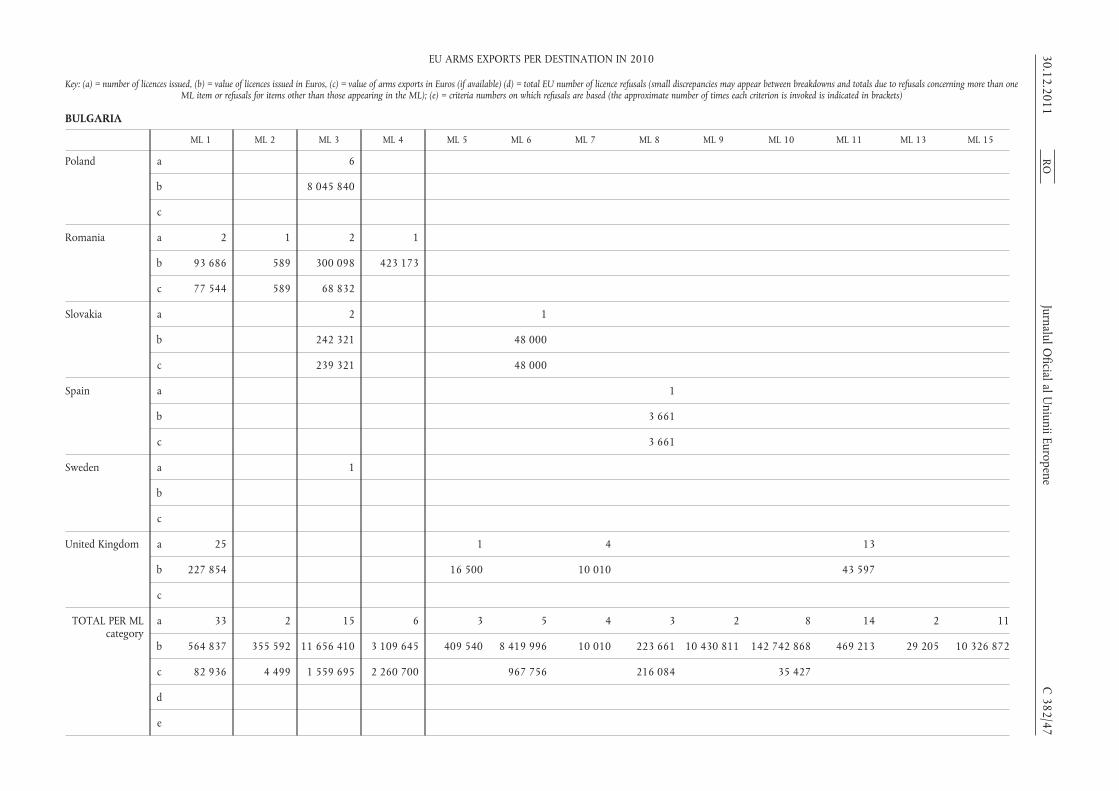
BULGARIA
ML 1 ML 2 ML 3 ML 4 ML 5 ML 6 ML 7 ML 8 ML 9 ML 10 ML 11 ML 13 ML 15
Poland a 6
b 8 045 840
c
Romania a 2 1 2 1
b 93 686 589 300 098 423 173
c 77 544 589 68 832
Slovakia a 2 1
b 242 321 48 000
c 239 321 48 000
Spain a 1
b 3 661
c 3 661
Sweden a 1
b
c
United Kingdom a 25 1 4 13
b 227 854 16 500 10 010 43 597
c
TOTAL PER MLcategory
a 33 2 15 6 3 5 4 3 2 8 14 2 11
b 564 837 355 592 11 656 410 3 109 645 409 540 8 419 996 10 010 223 661 10 430 811 142 742 868 469 213 29 205 10 326 872
c 82 936 4 499 1 559 695 2 260 700 967 756 216 084 35 427
d
e
30.12.2011RO
Jurnalul OficialalU
niunii EuropeneC
382/47EU ARMS EXPORTS PER DESTINATION IN 2010
Key: (a) = number of licences issued, (b) = value of licences issued in Euros, (c) = value of arms exports in Euros (if available) (d) = total EU number of licence refusals (small discrepancies may appear between breakdowns and totals due to refusals concerning more than oneML item or refusals for items other than those appearing in the ML); (e) = criteria numbers on which refusals are based (the approximate number of times each criterion is invoked is indicated in brackets)
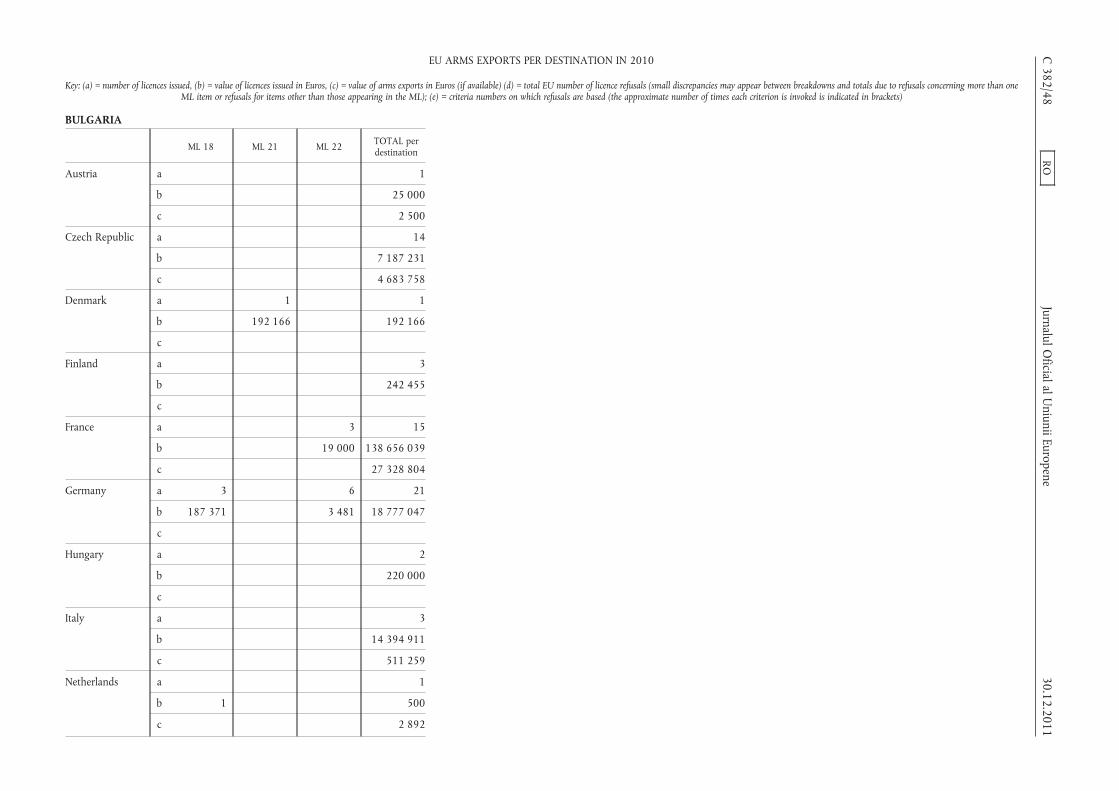
BULGARIA
ML 18 ML 21 ML 22 TOTAL perdestination
Austria a 1
b 25 000
c 2 500
Czech Republic a 14
b 7 187 231
c 4 683 758
Denmark a 1 1
b 192 166 192 166
c
Finland a 3
b 242 455
c
France a 3 15
b 19 000 138 656 039
c 27 328 804
Germany a 3 6 21
b 187 371 3 481 18 777 047
c
Hungary a 2
b 220 000
c
Italy a 3
b 14 394 911
c 511 259
Netherlands a 1
b 1 500
c 2 892
C382/48
ROJurnalul O
ficialalUniunii Europene
30.12.2011EU ARMS EXPORTS PER DESTINATION IN 2010
Key: (a) = number of licences issued, (b) = value of licences issued in Euros, (c) = value of arms exports in Euros (if available) (d) = total EU number of licence refusals (small discrepancies may appear between breakdowns and totals due to refusals concerning more than oneML item or refusals for items other than those appearing in the ML); (e) = criteria numbers on which refusals are based (the approximate number of times each criterion is invoked is indicated in brackets)
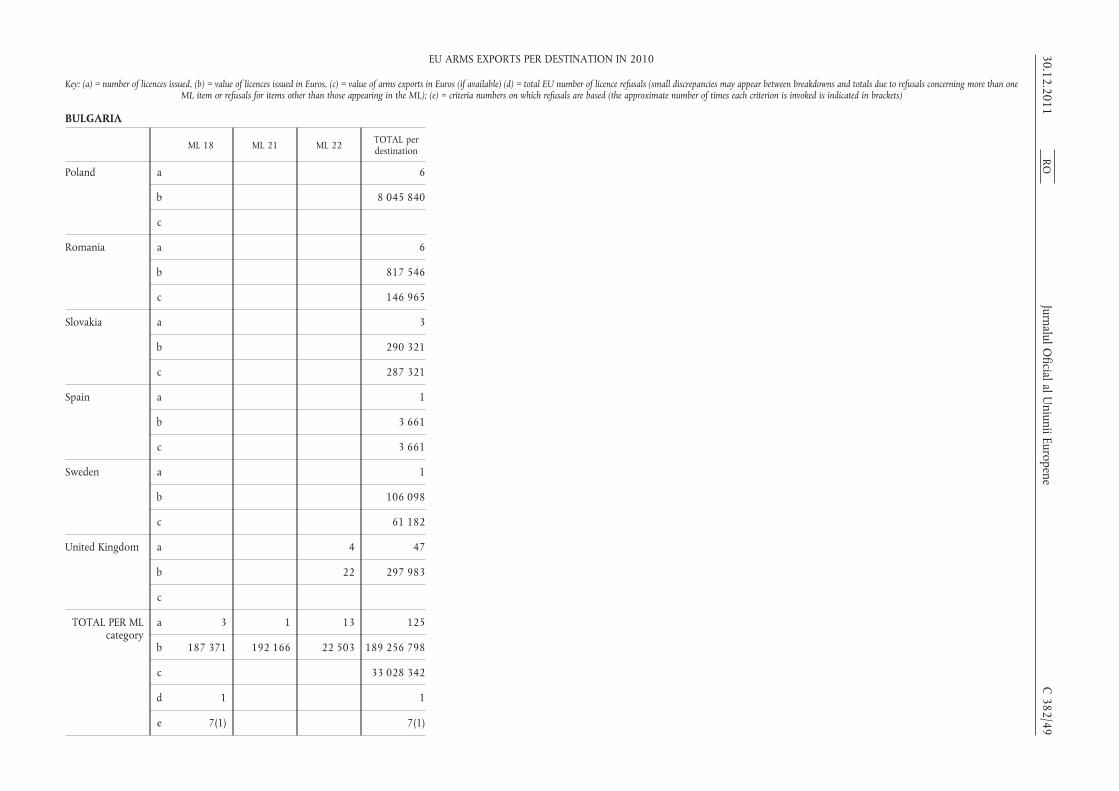
BULGARIA
ML 18 ML 21 ML 22 TOTAL perdestination
Poland a 6
b 8 045 840
c
Romania a 6
b 817 546
c 146 965
Slovakia a 3
b 290 321
c 287 321
Spain a 1
b 3 661
c 3 661
Sweden a 1
b 106 098
c 61 182
United Kingdom a 4 47
b 22 297 983
c
TOTAL PER MLcategory
a 3 1 13 125
b 187 371 192 166 22 503 189 256 798
c 33 028 342
d 1 1
e 7(1) 7(1)
30.12.2011RO
Jurnalul OficialalU
niunii EuropeneC
382/49EU ARMS EXPORTS PER DESTINATION IN 2010
Key: (a) = number of licences issued, (b) = value of licences issued in Euros, (c) = value of arms exports in Euros (if available) (d) = total EU number of licence refusals (small discrepancies may appear between breakdowns and totals due to refusals concerning more than oneML item or refusals for items other than those appearing in the ML); (e) = criteria numbers on which refusals are based (the approximate number of times each criterion is invoked is indicated in brackets)

BURKINA FASO
ML 1 ML 3 ML 4 ML 8 ML 10 ML 11 ML 15 ML 21 TOTAL perdestination
Czech Republic a 1 1
b 126 533 126 533
c
France a 1 1 1 2 5
b 29 332 238 141 109 975 37 200 414 648
c 476 844
Germany a 3 3
b 292 286 292 286
c
Romania a 1 3 1 5
b 47 997 1 069 228 3 017 1 120 242
c 47 997 1 674 735 3 017 45 244 1 770 993
United Kingdom a 1 1
b 99 000 99 000
c
TOTAL PER MLcategory
a 2 4 2 1 3 2 1 15
b 174 530 1 098 560 241 158 109 975 292 286 37 200 99 000 2 052 709
c 47 997 1 674 735 3 017 45 244 2 247 837
d
e
C382/50
ROJurnalul O
ficialalUniunii Europene
30.12.2011EU ARMS EXPORTS PER DESTINATION IN 2010
Key: (a) = number of licences issued, (b) = value of licences issued in Euros, (c) = value of arms exports in Euros (if available) (d) = total EU number of licence refusals (small discrepancies may appear between breakdowns and totals due to refusals concerning more than oneML item or refusals for items other than those appearing in the ML); (e) = criteria numbers on which refusals are based (the approximate number of times each criterion is invoked is indicated in brackets)
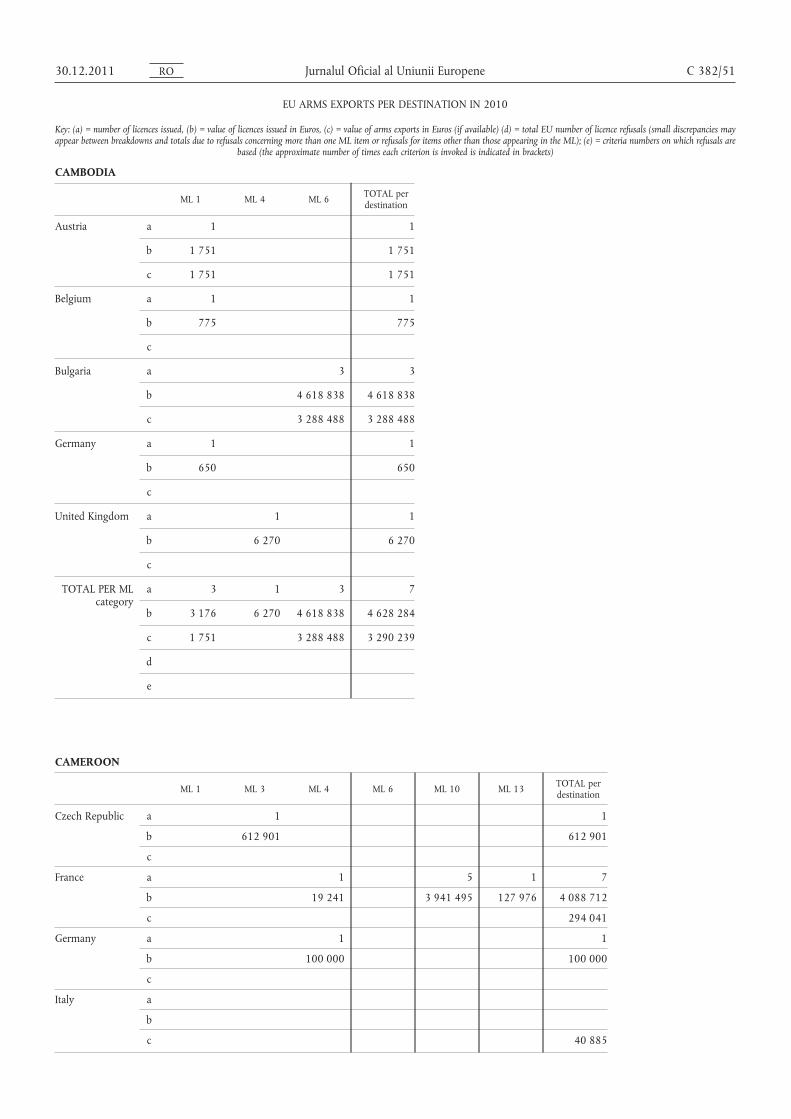
CAMBODIA
ML 1 ML 4 ML 6 TOTAL perdestination
Austria a 1 1
b 1 751 1 751
c 1 751 1 751
Belgium a 1 1
b 775 775
c
Bulgaria a 3 3
b 4 618 838 4 618 838
c 3 288 488 3 288 488
Germany a 1 1
b 650 650
c
United Kingdom a 1 1
b 6 270 6 270
c
TOTAL PER MLcategory
a 3 1 3 7
b 3 176 6 270 4 618 838 4 628 284
c 1 751 3 288 488 3 290 239
d
e
CAMEROON
ML 1 ML 3 ML 4 ML 6 ML 10 ML 13 TOTAL perdestination
Czech Republic a 1 1
b 612 901 612 901
c
France a 1 5 1 7
b 19 241 3 941 495 127 976 4 088 712
c 294 041
Germany a 1 1
b 100 000 100 000
c
Italy a
b
c 40 885
30.12.2011 RO Jurnalul Oficial al Uniunii Europene C 382/51
EU ARMS EXPORTS PER DESTINATION IN 2010
Key: (a) = number of licences issued, (b) = value of licences issued in Euros, (c) = value of arms exports in Euros (if available) (d) = total EU number of licence refusals (small discrepancies mayappear between breakdowns and totals due to refusals concerning more than one ML item or refusals for items other than those appearing in the ML); (e) = criteria numbers on which refusals are
based (the approximate number of times each criterion is invoked is indicated in brackets)

CAMEROON
ML 1 ML 3 ML 4 ML 6 ML 10 ML 13 TOTAL perdestination
Romania a 1 1
b 1 287 1 287
c
Spain a 1 1
b 1 000 1 000
c 1 000 1 000
United Kingdom a 1 1
b 71 940 71 940
c
TOTAL PER MLcategory
a 1 1 2 1 6 1 12
b 1 000 612 901 119 241 71 940 3 942 782 127 976 4 875 840
c 1 000 335 926
d 1 1 2
e 7(1) 2(1) 2(1) 7(1)
C 382/52 RO Jurnalul Oficial al Uniunii Europene 30.12.2011
EU ARMS EXPORTS PER DESTINATION IN 2010
Key: (a) = number of licences issued, (b) = value of licences issued in Euros, (c) = value of arms exports in Euros (if available) (d) = total EU number of licence refusals (small discrepancies mayappear between breakdowns and totals due to refusals concerning more than one ML item or refusals for items other than those appearing in the ML); (e) = criteria numbers on which refusals are
based (the approximate number of times each criterion is invoked is indicated in brackets)

CANADA
ML 1 ML 2 ML 3 ML 4 ML 5 ML 6 ML 7 ML 8 ML 9 ML 10 ML 11 ML 13
Austria a 29 56 1 1 1
b 1 867 708 1 763 083 2 092 1 400 000 1 431 876
c 226 043 1 758 554 2 092
Belgium a 21 3 2 11
b 1 232 969 265 840 239 410 828 1 480 635
c
Bulgaria a 3 3 3 2 1
b 176 630 522 332 1 440 374 313 140 2 944 400
c 176 630 449 332 1 025 006 313 140
Czech Republic a 3 1 5 1
b 36 877 1 064 498 2 189
c 253 121 1 881 296 120 202
Denmark a 1 1
b 1 209 399 785
c
Finland a 2 1 2
b 12 582 869 000 29 205
c 142 783 14 321 157 115
France a 11 2 3 8 1 2 4 6 10 2
b 1 072 201 230 793 957 107 1 247 350 10 370 21 050 357 348 27 527 973 2 657 202 19 834 824
c
Germany a 313 7 22 10 16 209 6 20 3
b 2 114 120 2 943 796 2 106 443 1 219 126 371 320 18 758 091 12 623 769 562 901 623
c
Greece a
b
c
Ireland a 1
b 1 000
c
30.12.2011RO
Jurnalul OficialalU
niunii EuropeneC
382/53EU ARMS EXPORTS PER DESTINATION IN 2010
Key: (a) = number of licences issued, (b) = value of licences issued in Euros, (c) = value of arms exports in Euros (if available) (d) = total EU number of licence refusals (small discrepancies may appear between breakdowns and totals due to refusals concerning more than oneML item or refusals for items other than those appearing in the ML); (e) = criteria numbers on which refusals are based (the approximate number of times each criterion is invoked is indicated in brackets)
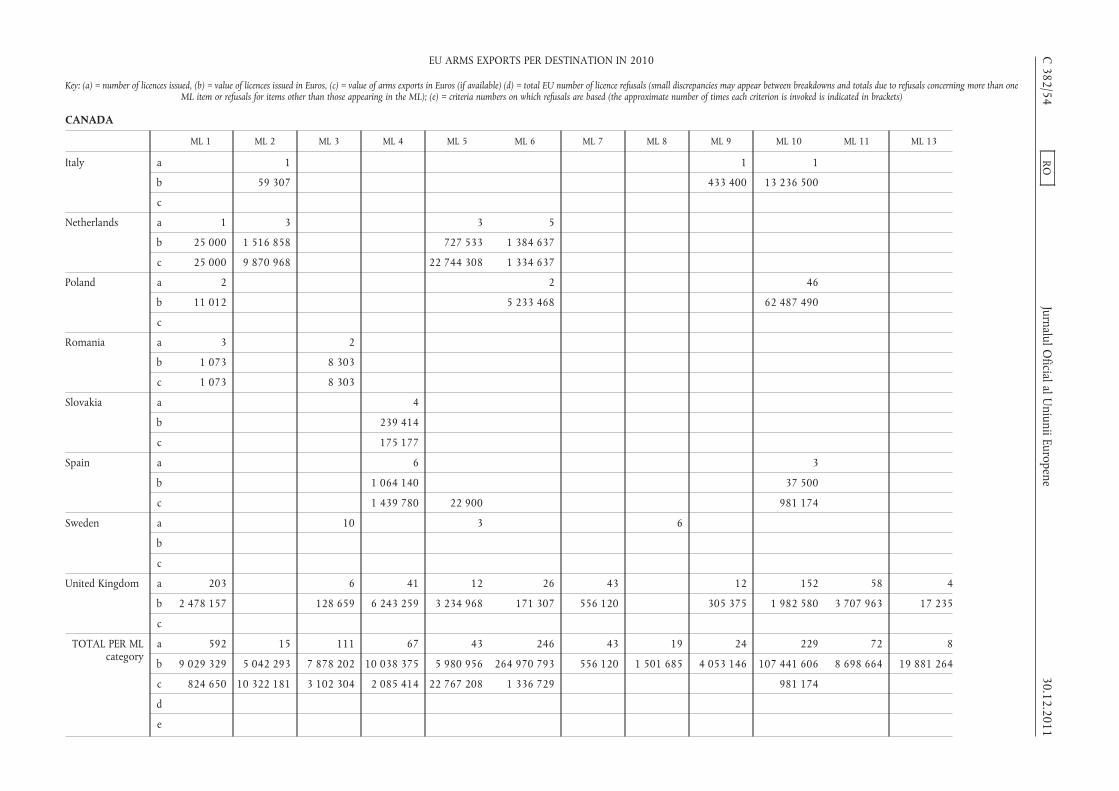
CANADA
ML 1 ML 2 ML 3 ML 4 ML 5 ML 6 ML 7 ML 8 ML 9 ML 10 ML 11 ML 13
Italy a 1 1 1
b 59 307 433 400 13 236 500
c
Netherlands a 1 3 3 5
b 25 000 1 516 858 727 533 1 384 637
c 25 000 9 870 968 22 744 308 1 334 637
Poland a 2 2 46
b 11 012 5 233 468 62 487 490
c
Romania a 3 2
b 1 073 8 303
c 1 073 8 303
Slovakia a 4
b 239 414
c 175 177
Spain a 6 3
b 1 064 140 37 500
c 1 439 780 22 900 981 174
Sweden a 10 3 6
b
c
United Kingdom a 203 6 41 12 26 43 12 152 58 4
b 2 478 157 128 659 6 243 259 3 234 968 171 307 556 120 305 375 1 982 580 3 707 963 17 235
c
TOTAL PER MLcategory
a 592 15 111 67 43 246 43 19 24 229 72 8
b 9 029 329 5 042 293 7 878 202 10 038 375 5 980 956 264 970 793 556 120 1 501 685 4 053 146 107 441 606 8 698 664 19 881 264
c 824 650 10 322 181 3 102 304 2 085 414 22 767 208 1 336 729 981 174
d
e
C382/54
ROJurnalul O
ficialalUniunii Europene
30.12.2011EU ARMS EXPORTS PER DESTINATION IN 2010
Key: (a) = number of licences issued, (b) = value of licences issued in Euros, (c) = value of arms exports in Euros (if available) (d) = total EU number of licence refusals (small discrepancies may appear between breakdowns and totals due to refusals concerning more than oneML item or refusals for items other than those appearing in the ML); (e) = criteria numbers on which refusals are based (the approximate number of times each criterion is invoked is indicated in brackets)

CANADA
ML 14 ML 15 ML 16 ML 17 ML 18 ML 21 ML 22 TOTAL perdestination
Austria a 1 89
b 3 550 6 468 309
c 3 550 1 990 239
Belgium a 1 38
b 242 390 272
c
Bulgaria a 1 13
b 21 991 770 27 388 646
c 3 087 597 5 051 705
Czech Republic a 10
b 1 103 564
c 551 324
Denmark a 2
b 400 994
c
Finland a 5
b 910 787
c 314 219
France a 2 12 3 1 7 74
b 49 750 3 086 603 7 469 168 37 983 281 221 64 840 943
c 17 457 033
Germany a 4 3 13 6 7 5 18 662
b 810 582 155 440 1 066 601 121 135 1 966 505 801 050 2 915 601 37 033 618
c
Greece a 1 1
b 263 720 263 720
c
Ireland a 1
b 1 000
c
30.12.2011RO
Jurnalul OficialalU
niunii EuropeneC
382/55EU ARMS EXPORTS PER DESTINATION IN 2010
Key: (a) = number of licences issued, (b) = value of licences issued in Euros, (c) = value of arms exports in Euros (if available) (d) = total EU number of licence refusals (small discrepancies may appear between breakdowns and totals due to refusals concerning more than oneML item or refusals for items other than those appearing in the ML); (e) = criteria numbers on which refusals are based (the approximate number of times each criterion is invoked is indicated in brackets)

CANADA
ML 14 ML 15 ML 16 ML 17 ML 18 ML 21 ML 22 TOTAL perdestination
Italy a 1 4
b 440 460 14 169 667
c 5 451 202
Netherlands a 1 13
b 80 000 3 734 028
c 412 227 1 500 34 388 640
Poland a 12 62
b 1 086 490 68 818 460
c
Romania a 5
b 9 376
c 9 376
Slovakia a 4
b 239 414
c 175 177
Spain a 9
b 1 101 640
c 2 443 854
Sweden a 1 20
b 23 872 172
c 49 760 217
United Kingdom a 2 12 11 7 4 32 49 674
b 6 424 710 023 810 115 30 431 29 040 71 455 47 659 20 530 769
c
TOTAL PER MLcategory
a 9 29 25 16 13 38 87 1 686
b 1 130 476 4 472 525 23 868 486 7 620 734 1 999 095 910 487 4 330 971 513 277 379
c 412 227 3 087 597 3 550 1 500 117 592 986
d
e
C382/56
ROJurnalul O
ficialalUniunii Europene
30.12.2011EU ARMS EXPORTS PER DESTINATION IN 2010
Key: (a) = number of licences issued, (b) = value of licences issued in Euros, (c) = value of arms exports in Euros (if available) (d) = total EU number of licence refusals (small discrepancies may appear between breakdowns and totals due to refusals concerning more than oneML item or refusals for items other than those appearing in the ML); (e) = criteria numbers on which refusals are based (the approximate number of times each criterion is invoked is indicated in brackets)
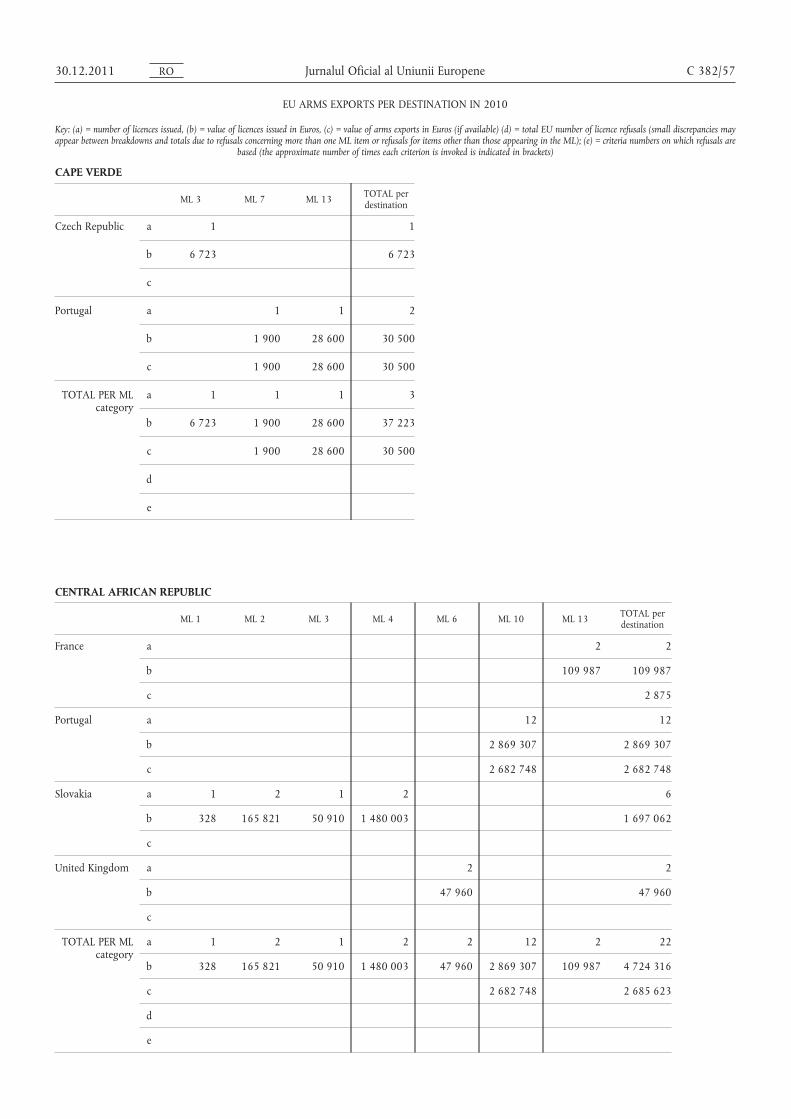
CAPE VERDE
ML 3 ML 7 ML 13 TOTAL perdestination
Czech Republic a 1 1
b 6 723 6 723
c
Portugal a 1 1 2
b 1 900 28 600 30 500
c 1 900 28 600 30 500
TOTAL PER MLcategory
a 1 1 1 3
b 6 723 1 900 28 600 37 223
c 1 900 28 600 30 500
d
e
CENTRAL AFRICAN REPUBLIC
ML 1 ML 2 ML 3 ML 4 ML 6 ML 10 ML 13 TOTAL perdestination
France a 2 2
b 109 987 109 987
c 2 875
Portugal a 12 12
b 2 869 307 2 869 307
c 2 682 748 2 682 748
Slovakia a 1 2 1 2 6
b 328 165 821 50 910 1 480 003 1 697 062
c
United Kingdom a 2 2
b 47 960 47 960
c
TOTAL PER MLcategory
a 1 2 1 2 2 12 2 22
b 328 165 821 50 910 1 480 003 47 960 2 869 307 109 987 4 724 316
c 2 682 748 2 685 623
d
e
30.12.2011 RO Jurnalul Oficial al Uniunii Europene C 382/57
EU ARMS EXPORTS PER DESTINATION IN 2010
Key: (a) = number of licences issued, (b) = value of licences issued in Euros, (c) = value of arms exports in Euros (if available) (d) = total EU number of licence refusals (small discrepancies mayappear between breakdowns and totals due to refusals concerning more than one ML item or refusals for items other than those appearing in the ML); (e) = criteria numbers on which refusals are
based (the approximate number of times each criterion is invoked is indicated in brackets)
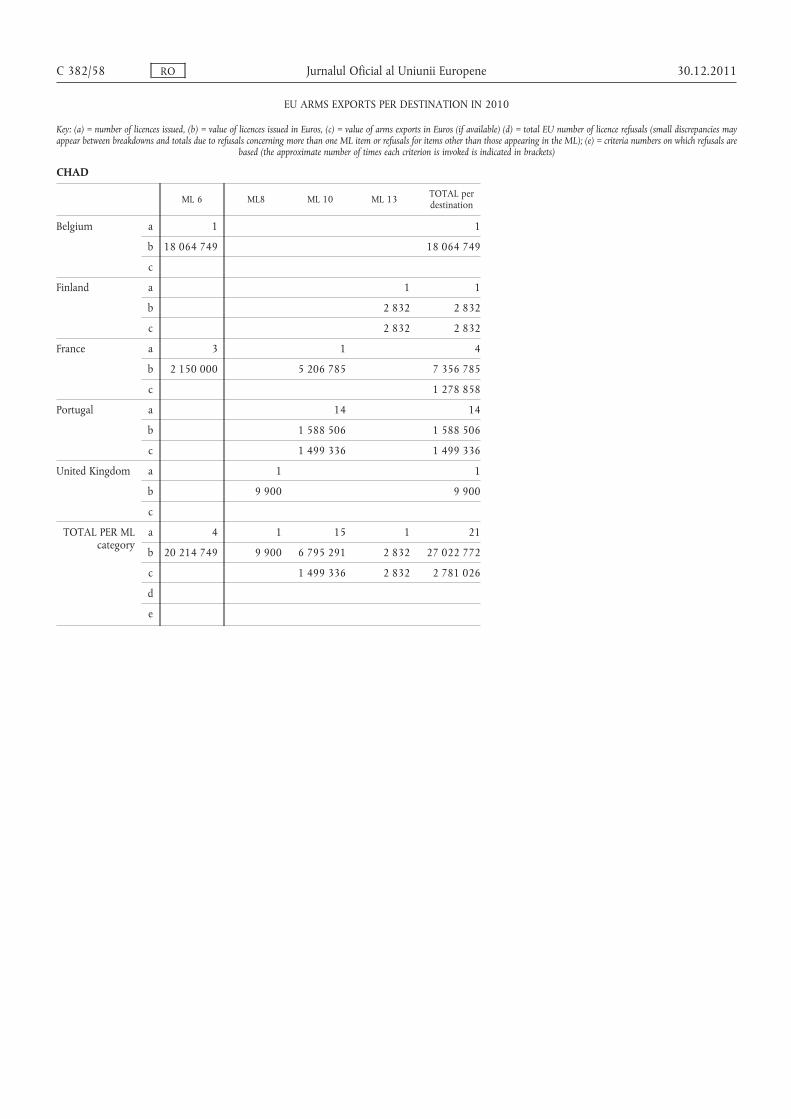
CHAD
ML 6 ML8 ML 10 ML 13 TOTAL perdestination
Belgium a 1 1
b 18 064 749 18 064 749
c
Finland a 1 1
b 2 832 2 832
c 2 832 2 832
France a 3 1 4
b 2 150 000 5 206 785 7 356 785
c 1 278 858
Portugal a 14 14
b 1 588 506 1 588 506
c 1 499 336 1 499 336
United Kingdom a 1 1
b 9 900 9 900
c
TOTAL PER MLcategory
a 4 1 15 1 21
b 20 214 749 9 900 6 795 291 2 832 27 022 772
c 1 499 336 2 832 2 781 026
d
e
C 382/58 RO Jurnalul Oficial al Uniunii Europene 30.12.2011
EU ARMS EXPORTS PER DESTINATION IN 2010
Key: (a) = number of licences issued, (b) = value of licences issued in Euros, (c) = value of arms exports in Euros (if available) (d) = total EU number of licence refusals (small discrepancies mayappear between breakdowns and totals due to refusals concerning more than one ML item or refusals for items other than those appearing in the ML); (e) = criteria numbers on which refusals are
based (the approximate number of times each criterion is invoked is indicated in brackets)

CHILE
ML 1 ML 2 ML 3 ML 4 ML 5 ML 6 ML 7 ML 8 ML 9 ML 10 ML 11 ML 13 ML 14
Austria a 16 3
b 96 352 9 987
c 89 052 8 998
Belgium a 1 1 1
b 509 381 174 448 387 500
c
Czech Republic a 3
b 120 552
c 91 474
Finland a 3
b 9 759
c
France a 1 4 2 6 1 10 7 5 1
b 1 009 17 757 40 357 186 669 1 886 689 184 332 50 356 607 14 644 620 243 453
c
Germany a 8 1 1 1 12 1 2 7 4 12
b 15 706 90 000 70 756 29 700 13 052 560 3 500 88 3 048 352 20 075 553 420
c
Greece a 1
b 78 550
c
Italy a 1 3 2 1
b 761 141 146 2 626 500 1 517 207
c
Netherlands a 8 4
b 90 764 104 420 000
c 61 944 870 000 30 846 544
30.12.2011RO
Jurnalul OficialalU
niunii EuropeneC
382/59EU ARMS EXPORTS PER DESTINATION IN 2010
Key: (a) = number of licences issued, (b) = value of licences issued in Euros, (c) = value of arms exports in Euros (if available) (d) = total EU number of licence refusals (small discrepancies may appear between breakdowns and totals due to refusals concerning more than oneML item or refusals for items other than those appearing in the ML); (e) = criteria numbers on which refusals are based (the approximate number of times each criterion is invoked is indicated in brackets)

CHILE
ML 1 ML 2 ML 3 ML 4 ML 5 ML 6 ML 7 ML 8 ML 9 ML 10 ML 11 ML 13 ML 14
Portugal a
b
c
Romania a 3
b 4 600 189
c 76 817
Slovakia a 1
b 70 000
c 63 794
Spain a 1 1 1 2
b 21 010 128 140 142 137 500
c 654 177 44 040 23 427 082
Sweden a 1 1
b
c
United Kingdom a 29 4 3 4 3 3 4 5 1 2
b 341 883 6 705 189 200 1 661 9 203 10 571 110 185 45 331 51 046 272
c
TOTAL PER MLcategory
a 56 5 19 7 19 17 7 3 20 24 22 2 2
b 965 093 252 156 2 955 950 1 905 010 496 333 14 940 911 22 462 387 588 3 243 255 301 644 556 15 243 371 294 498 272
c 89 052 100 472 717 971 61 944 870 000 44 040 54 350 443
d
e
C382/60
ROJurnalul O
ficialalUniunii Europene
30.12.2011EU ARMS EXPORTS PER DESTINATION IN 2010
Key: (a) = number of licences issued, (b) = value of licences issued in Euros, (c) = value of arms exports in Euros (if available) (d) = total EU number of licence refusals (small discrepancies may appear between breakdowns and totals due to refusals concerning more than oneML item or refusals for items other than those appearing in the ML); (e) = criteria numbers on which refusals are based (the approximate number of times each criterion is invoked is indicated in brackets)

CHILE
ML 15 ML 17 ML 18 ML 21 ML 22 TOTAL perdestination
Austria a 6 25
b 5 372 111 711
c 5 372 103 422
Belgium a 1 4
b 2 474 1 073 803
c
Czech Republic a 3
b 120 552
c 91 474
Finland a 3
b 9 759
c
France a 8 45
b 2 595 963 70 157 456
c 34 431 553
Germany a 2 1 1 53
b 3 101 618 2 700 16 890 576
c
Greece a 2 3
b 153 000 231 550
c
Italy a 7
b 4 285 614
c 183 420
Netherlands a 12
b 104 510 764
c 31 778 488
30.12.2011RO
Jurnalul OficialalU
niunii EuropeneC
382/61EU ARMS EXPORTS PER DESTINATION IN 2010
Key: (a) = number of licences issued, (b) = value of licences issued in Euros, (c) = value of arms exports in Euros (if available) (d) = total EU number of licence refusals (small discrepancies may appear between breakdowns and totals due to refusals concerning more than oneML item or refusals for items other than those appearing in the ML); (e) = criteria numbers on which refusals are based (the approximate number of times each criterion is invoked is indicated in brackets)
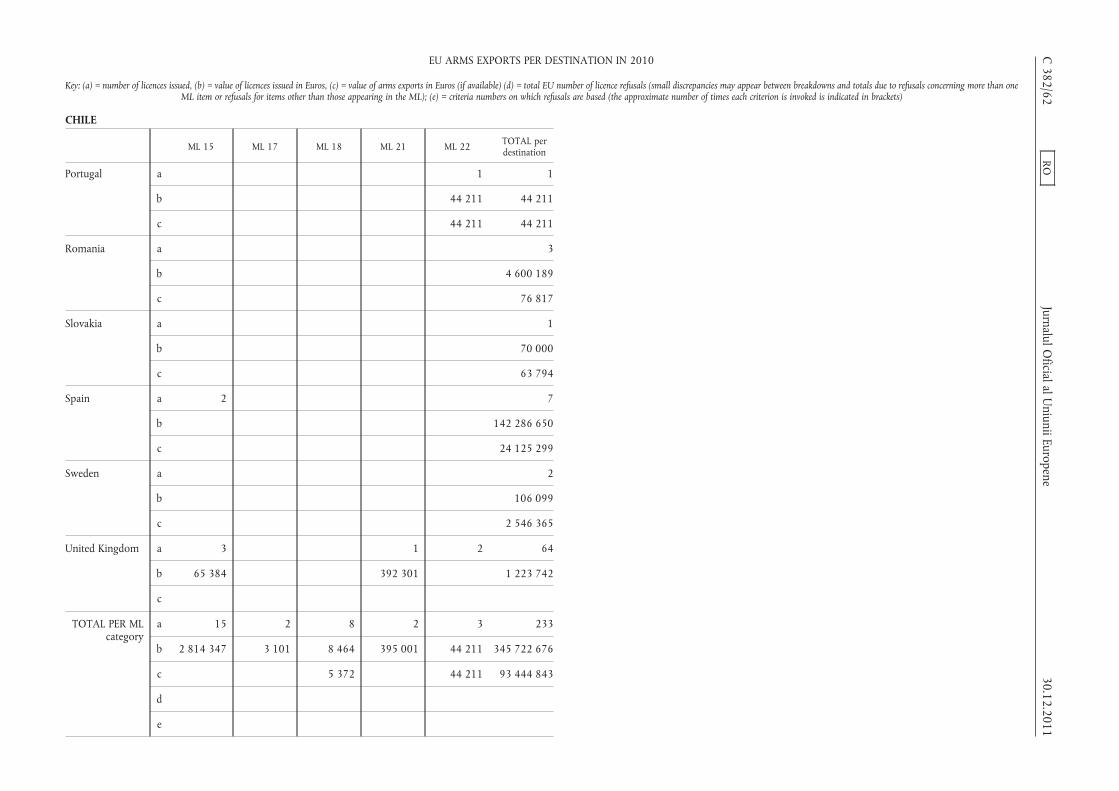
CHILE
ML 15 ML 17 ML 18 ML 21 ML 22 TOTAL perdestination
Portugal a 1 1
b 44 211 44 211
c 44 211 44 211
Romania a 3
b 4 600 189
c 76 817
Slovakia a 1
b 70 000
c 63 794
Spain a 2 7
b 142 286 650
c 24 125 299
Sweden a 2
b 106 099
c 2 546 365
United Kingdom a 3 1 2 64
b 65 384 392 301 1 223 742
c
TOTAL PER MLcategory
a 15 2 8 2 3 233
b 2 814 347 3 101 8 464 395 001 44 211 345 722 676
c 5 372 44 211 93 444 843
d
e
C382/62
ROJurnalul O
ficialalUniunii Europene
30.12.2011EU ARMS EXPORTS PER DESTINATION IN 2010
Key: (a) = number of licences issued, (b) = value of licences issued in Euros, (c) = value of arms exports in Euros (if available) (d) = total EU number of licence refusals (small discrepancies may appear between breakdowns and totals due to refusals concerning more than oneML item or refusals for items other than those appearing in the ML); (e) = criteria numbers on which refusals are based (the approximate number of times each criterion is invoked is indicated in brackets)

COLOMBIA
ML 1 ML 2 ML 3 ML 4 ML 5 ML 7 ML 8 ML 9 ML 10 ML 11 ML 13 ML 15
Austria a
b
c
Belgium a 2
b 291
c
Bulgaria a
b
c 122 500
Czech Republic a 1
b
c
France a 3 2 2 4 4 10 4 6 1 2
b 27 461 1 664 937 54 479 812 427 790 990 4 841 119 468 594 8 777 372 1 237 808 2 630 282
c
Germany a 1 1 1 1 2 1 2 3 3 1
b 2 700 7 010 726 000 6 447 3 000 54 4 161 064 10 311 41 092 12 000
c
Greece a 3
b 57 560
c
Italy a
b
c
30.12.2011RO
Jurnalul OficialalU
niunii EuropeneC
382/63EU ARMS EXPORTS PER DESTINATION IN 2010
Key: (a) = number of licences issued, (b) = value of licences issued in Euros, (c) = value of arms exports in Euros (if available) (d) = total EU number of licence refusals (small discrepancies may appear between breakdowns and totals due to refusals concerning more than oneML item or refusals for items other than those appearing in the ML); (e) = criteria numbers on which refusals are based (the approximate number of times each criterion is invoked is indicated in brackets)

COLOMBIA
ML 1 ML 2 ML 3 ML 4 ML 5 ML 7 ML 8 ML 9 ML 10 ML 11 ML 13 ML 15
Lithuania a 1
b 132 792
c 132 792
Netherlands a 1
b 89 772 020
c 40 618 449
Poland a
b
c
Romania a 1
b
c
Spain a 1 3 1
b 887 400
c 887 400 28 241 486
United Kingdom a 1 1 21 7
b 253 455 16 500 151 152 82 830
c
TOTAL PER MLcategory
a 8 3 3 8 5 3 2 12 29 9 9 7
b 30 452 1 671 947 307 935 2 425 827 797 437 19 500 54 9 002 183 762 849 8 818 464 1 332 638 92 459 862
c 122 500 887 400 40 618 449 28 374 278
d 1
e 2(1) 7(1)
C382/64
ROJurnalul O
ficialalUniunii Europene
30.12.2011EU ARMS EXPORTS PER DESTINATION IN 2010
Key: (a) = number of licences issued, (b) = value of licences issued in Euros, (c) = value of arms exports in Euros (if available) (d) = total EU number of licence refusals (small discrepancies may appear between breakdowns and totals due to refusals concerning more than oneML item or refusals for items other than those appearing in the ML); (e) = criteria numbers on which refusals are based (the approximate number of times each criterion is invoked is indicated in brackets)

COLOMBIA
ML 16 ML 17 ML 18 ML 22 TOTAL perdestination
Austria a 1 1
b 28 093 28 093
c 28 093 28 093
Belgium a 2
b 291
c
Bulgaria a
b
c 122 500
Czech Republic a 1
b
c
France a 1 39
b 34 437 21 339 907
c 16 569 145
Germany a 1 1 18
b 47 599 41 100 5 058 377
c
Greece a 3
b 57 560
c
Italy a
b
c 20 700 750
Lithuania a 1
b 132 792
c 132 792
30.12.2011RO
Jurnalul OficialalU
niunii EuropeneC
382/65EU ARMS EXPORTS PER DESTINATION IN 2010
Key: (a) = number of licences issued, (b) = value of licences issued in Euros, (c) = value of arms exports in Euros (if available) (d) = total EU number of licence refusals (small discrepancies may appear between breakdowns and totals due to refusals concerning more than oneML item or refusals for items other than those appearing in the ML); (e) = criteria numbers on which refusals are based (the approximate number of times each criterion is invoked is indicated in brackets)

COLOMBIA
ML 16 ML 17 ML 18 ML 22 TOTAL perdestination
Netherlands a 1 2
b 20 000 89 792 020
c 40 618 449
Poland a 1 1
b 834 834
c
Romania a 1
b
c
Spain a 5
b 887 400
c 29 128 886
United Kingdom a 30
b 503 937
c
TOTAL PER MLcategory
a 1 1 1 3 104
b 834 47 599 28 093 95 537 117 801 211
c 28 093 107 300 615
d 1
e 2(1) 7(1)
C382/66
ROJurnalul O
ficialalUniunii Europene
30.12.2011EU ARMS EXPORTS PER DESTINATION IN 2010
Key: (a) = number of licences issued, (b) = value of licences issued in Euros, (c) = value of arms exports in Euros (if available) (d) = total EU number of licence refusals (small discrepancies may appear between breakdowns and totals due to refusals concerning more than oneML item or refusals for items other than those appearing in the ML); (e) = criteria numbers on which refusals are based (the approximate number of times each criterion is invoked is indicated in brackets)

CONGO (REPUBLIC OF)
ML 5 ML 6 ML 10 ML 15 TOTAL perdestination
France a 1 1 2
b 11 857 132 000 143 857
c
Italy a
b
c 75 781
Lithuania a 1 1
b 1 752 218 1 752 218
c 1 752 218 1 752 218
United Kingdom a 2 2
b 1 767 150 1 767 150
c
TOTAL PER MLcategory
a 1 2 1 1 5
b 11 857 1 767 150 1 752 218 132 000 3 663 225
c 1 752 218 1 827 999
d
e
COSTA RICA
ML 1 ML 3 ML 13 TOTAL perdestination
Austria a 3 3
b 50 450 50 450
c 50 450 50 450
Czech Republic a 2 1 3
b 6 248 166 628 172 876
c 3 721 148 820 152 541
Germany a 1 1 2
b 4 955 1 126 6 081
c
Italy a
b
c 25 322
TOTAL PER MLcategory
a 6 1 1 8
b 61 653 166 628 1 126 229 407
c 54 171 148 820 228 313
d 1 1
e 7(1) 7(1)
30.12.2011 RO Jurnalul Oficial al Uniunii Europene C 382/67
EU ARMS EXPORTS PER DESTINATION IN 2010
Key: (a) = number of licences issued, (b) = value of licences issued in Euros, (c) = value of arms exports in Euros (if available) (d) = total EU number of licence refusals (small discrepancies mayappear between breakdowns and totals due to refusals concerning more than one ML item or refusals for items other than those appearing in the ML); (e) = criteria numbers on which refusals are
based (the approximate number of times each criterion is invoked is indicated in brackets)
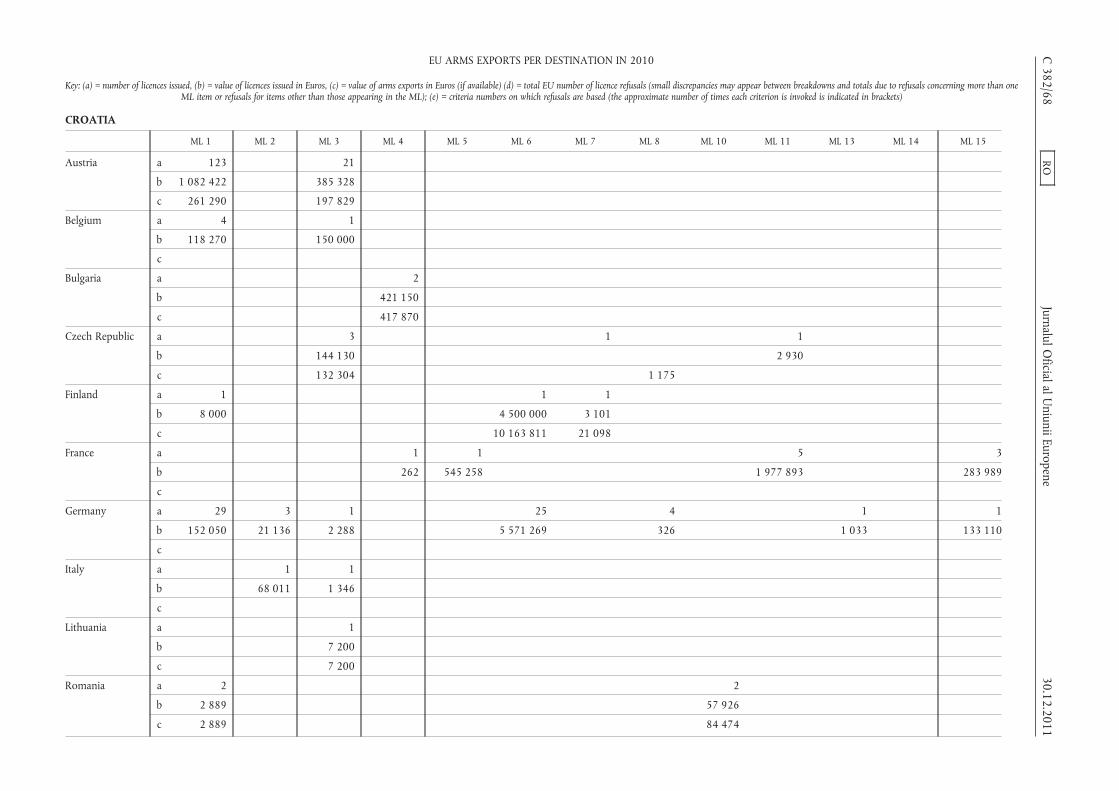
CROATIA
ML 1 ML 2 ML 3 ML 4 ML 5 ML 6 ML 7 ML 8 ML 10 ML 11 ML 13 ML 14 ML 15
Austria a 123 21
b 1 082 422 385 328
c 261 290 197 829
Belgium a 4 1
b 118 270 150 000
c
Bulgaria a 2
b 421 150
c 417 870
Czech Republic a 3 1 1
b 144 130 2 930
c 132 304 1 175
Finland a 1 1 1
b 8 000 4 500 000 3 101
c 10 163 811 21 098
France a 1 1 5 3
b 262 545 258 1 977 893 283 989
c
Germany a 29 3 1 25 4 1 1
b 152 050 21 136 2 288 5 571 269 326 1 033 133 110
c
Italy a 1 1
b 68 011 1 346
c
Lithuania a 1
b 7 200
c 7 200
Romania a 2 2
b 2 889 57 926
c 2 889 84 474
C382/68
ROJurnalul O
ficialalUniunii Europene
30.12.2011EU ARMS EXPORTS PER DESTINATION IN 2010
Key: (a) = number of licences issued, (b) = value of licences issued in Euros, (c) = value of arms exports in Euros (if available) (d) = total EU number of licence refusals (small discrepancies may appear between breakdowns and totals due to refusals concerning more than oneML item or refusals for items other than those appearing in the ML); (e) = criteria numbers on which refusals are based (the approximate number of times each criterion is invoked is indicated in brackets)

CROATIA
ML 1 ML 2 ML 3 ML 4 ML 5 ML 6 ML 7 ML 8 ML 10 ML 11 ML 13 ML 14 ML 15
Slovakia a 1
b
c
Slovenia a 1
b 1 121
c 1 121
Sweden a 1
b
c
United Kingdom a 22 9 2 3 1 1
b 788 105 505 780 935 4 400 55 4 400
c
TOTAL PER MLcategory
a 181 4 30 4 1 26 11 4 2 8 4 1 5
b 2 151 736 89 147 691 413 421 412 545 258 10 071 269 508 881 326 57 926 1 981 758 5 433 55 421 499
c 264 179 338 454 417 870 10 163 811 21 098 1 175 84 474
d 1
e 7(1)
ML 16 ML 18 TOTAL perdestination
Austria a 144
b 1 467 750
c 459 119
Belgium a 5
b 268 270
c
Bulgaria a 2
b 421 150
c 417 870
30.12.2011RO
Jurnalul OficialalU
niunii EuropeneC
382/69EU ARMS EXPORTS PER DESTINATION IN 2010
Key: (a) = number of licences issued, (b) = value of licences issued in Euros, (c) = value of arms exports in Euros (if available) (d) = total EU number of licence refusals (small discrepancies may appear between breakdowns and totals due to refusals concerning more than oneML item or refusals for items other than those appearing in the ML); (e) = criteria numbers on which refusals are based (the approximate number of times each criterion is invoked is indicated in brackets)

CROATIA
ML 16 ML 18 TOTAL perdestination
Czech Republic a 5
b 147 060
c 133 479
Finland a 3
b 4 511 101
c 10 184 909
France a 10
b 2 807 403
c
Germany a 3 67
b 346 770 6 227 982
c
Italy a 2
b 69 357
c 155 866
Lithuania a 1
b 7 200
c 7 200
Romania a 4
b 60 815
c 87 363
Slovakia a 1
b
c
Slovenia a 1 2
b 400 75 700 77 221
c 358 115 700 117 179
C382/70
ROJurnalul O
ficialalUniunii Europene
30.12.2011EU ARMS EXPORTS PER DESTINATION IN 2010
Key: (a) = number of licences issued, (b) = value of licences issued in Euros, (c) = value of arms exports in Euros (if available) (d) = total EU number of licence refusals (small discrepancies may appear between breakdowns and totals due to refusals concerning more than oneML item or refusals for items other than those appearing in the ML); (e) = criteria numbers on which refusals are based (the approximate number of times each criterion is invoked is indicated in brackets)
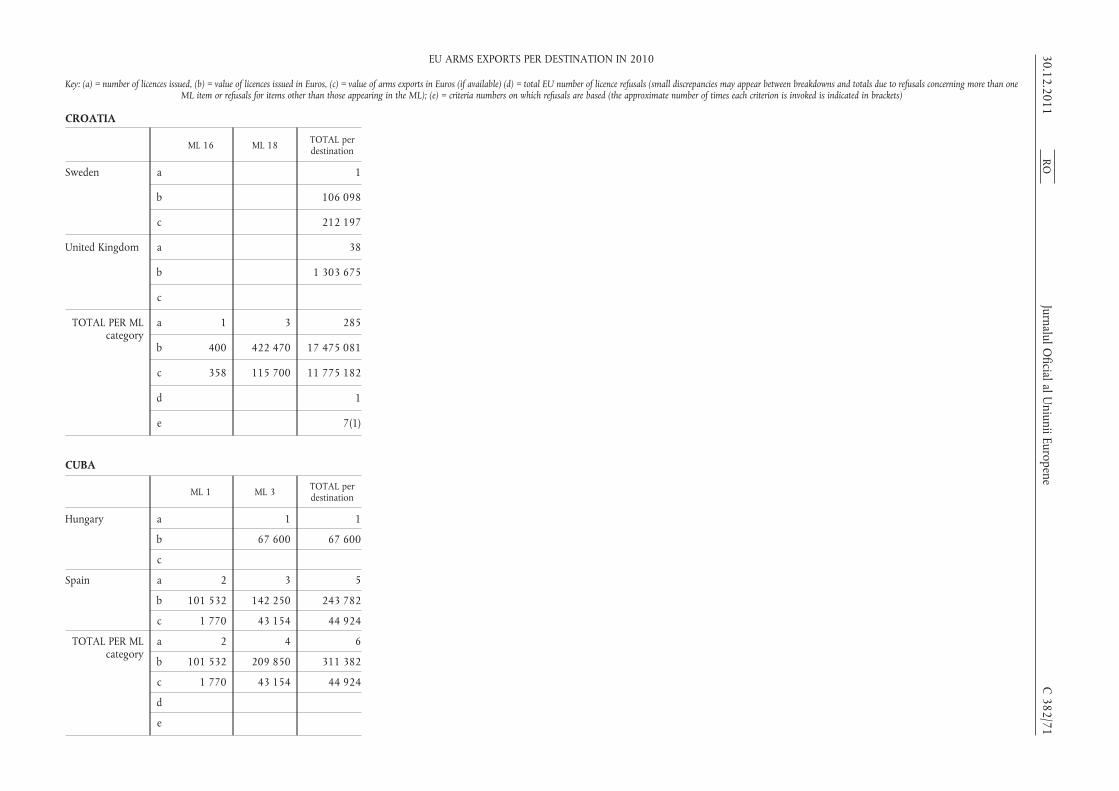
CROATIA
ML 16 ML 18 TOTAL perdestination
Sweden a 1
b 106 098
c 212 197
United Kingdom a 38
b 1 303 675
c
TOTAL PER MLcategory
a 1 3 285
b 400 422 470 17 475 081
c 358 115 700 11 775 182
d 1
e 7(1)
CUBA
ML 1 ML 3 TOTAL perdestination
Hungary a 1 1
b 67 600 67 600
c
Spain a 2 3 5
b 101 532 142 250 243 782
c 1 770 43 154 44 924
TOTAL PER MLcategory
a 2 4 6
b 101 532 209 850 311 382
c 1 770 43 154 44 924
d
e
30.12.2011RO
Jurnalul OficialalU
niunii EuropeneC
382/71EU ARMS EXPORTS PER DESTINATION IN 2010
Key: (a) = number of licences issued, (b) = value of licences issued in Euros, (c) = value of arms exports in Euros (if available) (d) = total EU number of licence refusals (small discrepancies may appear between breakdowns and totals due to refusals concerning more than oneML item or refusals for items other than those appearing in the ML); (e) = criteria numbers on which refusals are based (the approximate number of times each criterion is invoked is indicated in brackets)

CYPRUS
ML 1 ML 2 ML 3 ML 4 ML 5 ML 6 ML 9 ML 10 ML 11 ML 13 ML 15
Belgium a 1 2 1
b 15 661 61 525 7 191 893
c
Finland a 2
b 29 205
c
France a 1 2 2 2 7 1 5 6
b 12 626 316 490 22 870 943 433 607 748 769 419 168 5 326 074 4 186 828
c
Germany a 3 4
b 78 009 455 498
c
Greece a 1 2
b 38 129 427 300 442
c
Italy a 4 1
b 60 700 764 670
c
Slovakia a 1 1
b 89 320 73 880
c 89 320 73 880
United Kingdom a 54 4 4 8 1 41 1 4
b 53 630 18 881 197 655 655 338 1 172 449 364 876 4 400 32 450
c
TOTAL PER MLcategory
a 59 7 4 7 3 22 2 2 46 3 11
b 159 927 466 510 18 881 23 833 268 507 487 40 237 557 300 442 1 591 617 5 690 950 33 605 11 411 171
c 89 320 73 880
d
e
C382/72
ROJurnalul O
ficialalUniunii Europene
30.12.2011EU ARMS EXPORTS PER DESTINATION IN 2010
Key: (a) = number of licences issued, (b) = value of licences issued in Euros, (c) = value of arms exports in Euros (if available) (d) = total EU number of licence refusals (small discrepancies may appear between breakdowns and totals due to refusals concerning more than oneML item or refusals for items other than those appearing in the ML); (e) = criteria numbers on which refusals are based (the approximate number of times each criterion is invoked is indicated in brackets)

CYPRUS
ML 17 ML 18 ML 21 ML 22 TOTAL perdestination
Belgium a 4
b 7 269 079
c
Finland a 2
b 29 205
c
France a 4 30
b 172 140 34 486 645
c 5 685 403
Germany a 2 9
b 1 425 534 932
c
Greece a 3
b 38 429 869
c
Italy a 5
b 825 370
c 645 358
Slovakia a 2
b 163 200
c 163 200
United Kingdom a 1 4 4 126
b 14 434 19 250 15 796 2 549 159
c
TOTAL PER MLcategory
a 1 2 4 8 181
b 14 434 1 425 19 250 187 936 84 287 459
c 6 493 961
d
e
30.12.2011RO
Jurnalul OficialalU
niunii EuropeneC
382/73EU ARMS EXPORTS PER DESTINATION IN 2010
Key: (a) = number of licences issued, (b) = value of licences issued in Euros, (c) = value of arms exports in Euros (if available) (d) = total EU number of licence refusals (small discrepancies may appear between breakdowns and totals due to refusals concerning more than oneML item or refusals for items other than those appearing in the ML); (e) = criteria numbers on which refusals are based (the approximate number of times each criterion is invoked is indicated in brackets)

CZECH REPUBLIC
ML 1 ML 2 ML 3 ML 4 ML 5 ML 6 ML 7 ML 8 ML 10
Austria a 1 2 1
b 90 000 1 387 818 374 404 686
c 139 218 38 750 1 387 818 32 134 287
Belgium a 8 1 2
b 1 813 021 49 950 1 380 000
c
Bulgaria a 5 4 1 3 3
b 1 415 985 116 232 103 000 610 669 106 000
c 257 798 12 947 1 030 558 367 113 200
Denmark a 1
b 1 801 922
c
Estonia a 1
b 3 000
c 3 000
Finland a 2 2 1 1
b 217 800 263 000 95 700 496 256
c 18 950 2 577 95 744
France a 3 1 1 1 6 1 6
b 21 454 3 032 12 273 58 754 1 051 478 1 306 478 798
c
Germany a 8 3 12 5 3 58 16
b 157 387 12 146 504 059 6 700 264 3 255 329 1 876 220 317 679
c
Hungary a 4 9 8 3 8 3 3
b 106 770 955 500 3 246 677 1 600 000 3 988 500 280 890 160 000
c 920 344 305 86 534 276 998 1 334 604 1 165 66 250
C382/74
ROJurnalul O
ficialalUniunii Europene
30.12.2011EU ARMS EXPORTS PER DESTINATION IN 2010
Key: (a) = number of licences issued, (b) = value of licences issued in Euros, (c) = value of arms exports in Euros (if available) (d) = total EU number of licence refusals (small discrepancies may appear between breakdowns and totals due to refusals concerning more than oneML item or refusals for items other than those appearing in the ML); (e) = criteria numbers on which refusals are based (the approximate number of times each criterion is invoked is indicated in brackets)

CZECH REPUBLIC
ML 1 ML 2 ML 3 ML 4 ML 5 ML 6 ML 7 ML 8 ML 10
Italy a 1 2 7
b 8 456 570 5 025 932
c
Lithuania a 1 1
b 4 920 86 594
c 4 920 86 594
Luxembourg a 1 1
b 81 796 18 627
c
Netherlands a 3 7 1
b 425 59 479 260 940
c 1 917 31 544 127 200
Poland a 10 2 10 3 1 6 1 17
b 644 289 84 860 2 177 214 84 275 13 500 418 498 20 000 654 936
c
Portugal a
b
c
Romania a 4 1 1 1
b 1 781 849 617 810 241 887 243 040
c 528 149 159 769 170 128
Slovakia a 8 3 6 4 15 4 6 6
b 1 224 426 1 029 929 1 670 005 155 600 4 644 759 144 419 60 856 1 100 301
c 553 665 112 002 1 140 293 21 029 715 007 115 582 21 853 1 058 301
Spain a 8
b 2 907
c 2 907 1 036 728 104 133 786
30.12.2011RO
Jurnalul OficialalU
niunii EuropeneC
382/75EU ARMS EXPORTS PER DESTINATION IN 2010
Key: (a) = number of licences issued, (b) = value of licences issued in Euros, (c) = value of arms exports in Euros (if available) (d) = total EU number of licence refusals (small discrepancies may appear between breakdowns and totals due to refusals concerning more than oneML item or refusals for items other than those appearing in the ML); (e) = criteria numbers on which refusals are based (the approximate number of times each criterion is invoked is indicated in brackets)
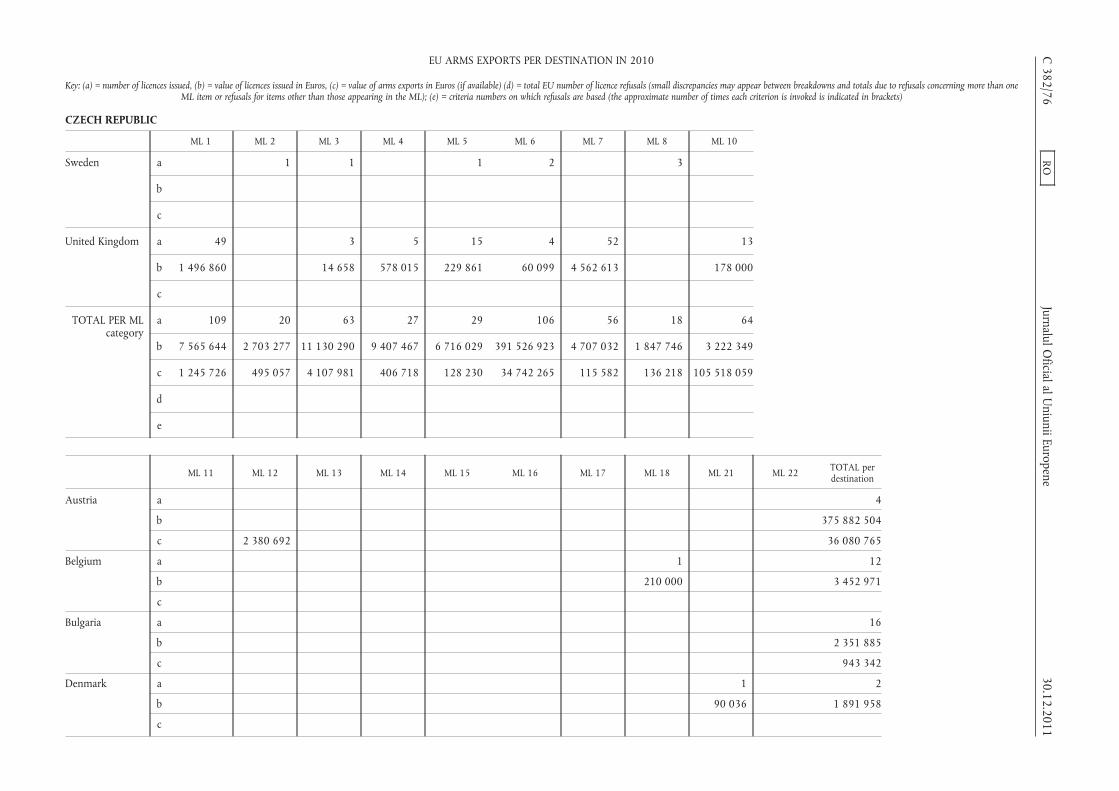
CZECH REPUBLIC
ML 1 ML 2 ML 3 ML 4 ML 5 ML 6 ML 7 ML 8 ML 10
Sweden a 1 1 1 2 3
b
c
United Kingdom a 49 3 5 15 4 52 13
b 1 496 860 14 658 578 015 229 861 60 099 4 562 613 178 000
c
TOTAL PER MLcategory
a 109 20 63 27 29 106 56 18 64
b 7 565 644 2 703 277 11 130 290 9 407 467 6 716 029 391 526 923 4 707 032 1 847 746 3 222 349
c 1 245 726 495 057 4 107 981 406 718 128 230 34 742 265 115 582 136 218 105 518 059
d
e
ML 11 ML 12 ML 13 ML 14 ML 15 ML 16 ML 17 ML 18 ML 21 ML 22 TOTAL perdestination
Austria a 4
b 375 882 504
c 2 380 692 36 080 765
Belgium a 1 12
b 210 000 3 452 971
c
Bulgaria a 16
b 2 351 885
c 943 342
Denmark a 1 2
b 90 036 1 891 958
c
C382/76
ROJurnalulO
ficialalUniuniiEuropene
30.12.2011EU ARMS EXPORTS PER DESTINATION IN 2010
Key: (a) = number of licences issued, (b) = value of licences issued in Euros, (c) = value of arms exports in Euros (if available) (d) = total EU number of licence refusals (small discrepancies may appear between breakdowns and totals due to refusals concerning more than oneML item or refusals for items other than those appearing in the ML); (e) = criteria numbers on which refusals are based (the approximate number of times each criterion is invoked is indicated in brackets)

CZECH REPUBLIC
ML 11 ML 12 ML 13 ML 14 ML 15 ML 16 ML 17 ML 18 ML 21 ML 22 TOTAL perdestination
Estonia a 1
b 3 000
c 3 000
Finland a 2 8
b 29 205 1 101 961
c 117 271
France a 8 5 1 8 1 42
b 1 144 589 121 415 900 244 2 743 826 201 070 6 738 238
c 5 954 806
Germany a 18 1 1 5 1 3 12 146
b 3 612 129 123 325 12 859 30 813 3 800 6 696 358 733 16 971 439
c
Hungary a 2 40
b 56 000 10 394 337
c 36 000 2 146 776
Italy a 10
b 5 034 957
c 352 000
Lithuania a 2
b 91 514
c 91 514
Luxembourg a 2
b 100 423
c
Netherlands a 11
b 320 844
c 160 661
30.12.2011RO
Jurnalul OficialalU
niunii EuropeneC
382/77EU ARMS EXPORTS PER DESTINATION IN 2010
Key: (a) = number of licences issued, (b) = value of licences issued in Euros, (c) = value of arms exports in Euros (if available) (d) = total EU number of licence refusals (small discrepancies may appear between breakdowns and totals due to refusals concerning more than oneML item or refusals for items other than those appearing in the ML); (e) = criteria numbers on which refusals are based (the approximate number of times each criterion is invoked is indicated in brackets)

CZECH REPUBLIC
ML 11 ML 12 ML 13 ML 14 ML 15 ML 16 ML 17 ML 18 ML 21 ML 22 TOTAL perdestination
Poland a 50
b 4 097 572
c
Portugal a 4 4
b 181 572 181 572
c 181 572 181 572
Romania a 7
b 2 884 586
c 858 046
Slovakia a 1 53
b 335 300 10 365 595
c 335 300 4 073 032
Spain a 1 1 10
b 2 907
c 105 173 421
Sweden a 2 10
b 3 607 350
c 3 819 547
United Kingdom a 29 3 24 4 2 1 3 207
b 118 609 1 848 218 556 343 410 20 571 11 000 2 7 834 101
c
TOTAL PER MLcategory
a 61 11 4 33 5 5 4 6 16 637
b 5 112 899 487 768 1 023 569 2 962 382 356 269 30 813 234 371 107 732 559 805 453 309 715
c 217 572 2 380 692 335 300 159 955 753
d
e
C382/78
ROJurnalul O
ficialalUniunii Europene
30.12.2011EU ARMS EXPORTS PER DESTINATION IN 2010
Key: (a) = number of licences issued, (b) = value of licences issued in Euros, (c) = value of arms exports in Euros (if available) (d) = total EU number of licence refusals (small discrepancies may appear between breakdowns and totals due to refusals concerning more than oneML item or refusals for items other than those appearing in the ML); (e) = criteria numbers on which refusals are based (the approximate number of times each criterion is invoked is indicated in brackets)

DENMARK (GREENLAND)
ML 1 ML 3 TOTAL perdestination
Austria a 7 7
b 45 860 45 860
c 42 560 42 560
Germany a 1 1
b 3 750 3 750
c
United Kingdom a 1 1
b 1 397 1 397
c
TOTAL PER MLcategory
a 8 1 9
b 47 257 3 750 51 007
c 42 560 42 560
d
e
DENMARK
ML 1 ML 2 ML 3 ML 4 ML 5 ML 6 ML 7 ML 8 ML 9 ML 10 ML 11
Austria a 1 1
b 997 800 2 080
c 997 800 2 080
Belgium a 12 4 3
b 2 254 098 12 323 000 12 746 800
c
Czech Republic a 1
b 549 071
c 385 290
30.12.2011RO
Jurnalul OficialalU
niunii EuropeneC
382/79EU ARMS EXPORTS PER DESTINATION IN 2010
Key: (a) = number of licences issued, (b) = value of licences issued in Euros, (c) = value of arms exports in Euros (if available) (d) = total EU number of licence refusals (small discrepancies may appear between breakdowns and totals due to refusals concerning more than oneML item or refusals for items other than those appearing in the ML); (e) = criteria numbers on which refusals are based (the approximate number of times each criterion is invoked is indicated in brackets)

DENMARK
ML 1 ML 2 ML 3 ML 4 ML 5 ML 6 ML 7 ML 8 ML 9 ML 10 ML 11
Finland a 3 1
b 120 290 711 000
c 3 290 258 350
France a 4 4 1 3 7
b 763 137 1 242 984 96 450 612 314 2 342 204
c
Germany a 5 5 8 5 4 107 3 9 3 11
b 186 494 376 418 954 041 3 513 040 712 755 13 163 729 85 139 947 54 840 79 827
c
Greece a 1
b 681 400
c
Ireland a 1
b 331 650
c
Italy a 5 1 2 1 1 1
b 105 948 563 424 6 741 30 600 293 340 44 742
c
Lithuania a 1
b 5 080
c 5 080
Netherlands a 2 5 3 3 1 6
b 31 373 111 851 1 833 762 403 616 4 920 132 775
c 15 375 10 912 19 966 306 402 460 99 450
Poland a
b
c
C382/80
ROJurnalul O
ficialalUniunii Europene
30.12.2011EU ARMS EXPORTS PER DESTINATION IN 2010
Key: (a) = number of licences issued, (b) = value of licences issued in Euros, (c) = value of arms exports in Euros (if available) (d) = total EU number of licence refusals (small discrepancies may appear between breakdowns and totals due to refusals concerning more than oneML item or refusals for items other than those appearing in the ML); (e) = criteria numbers on which refusals are based (the approximate number of times each criterion is invoked is indicated in brackets)

DENMARK
ML 1 ML 2 ML 3 ML 4 ML 5 ML 6 ML 7 ML 8 ML 9 ML 10 ML 11
Romania a 1 1
b 25 000 1 612
c 6 387
Spain a 4 10 1 1
b 474 476 5 155 801
c 17 208 810
Sweden a 2 1 11 9 1 2 1
b
c
United Kingdom a 62 3 3 46 7 10 14 1 129 17
b 629 858 9 135 3 218 530 745 769 768 1 247 899 280 645 11 723 67 088 355 667
c
TOTAL PER MLcategory
a 91 18 32 69 28 122 17 3 11 141 44
b 4 010 249 965 977 16 108 246 9 320 258 4 890 919 14 845 844 280 730 248 121 13 779 302 3 636 615
c 25 052 1 646 520 17 221 802 19 966 306 402 460 99 450
d
e
ML 13 ML 14 ML 15 ML 16 ML 17 ML 18 ML 21 ML 22 TOTAL perdestination
Austria a 2
b 999 880
c 999 880
Belgium a 1 1 21
b 368 380 737 314 28 429 592
c
30.12.2011RO
JurnalulOficialalU
niuniiEuropeneC
382/81EU ARMS EXPORTS PER DESTINATION IN 2010
Key: (a) = number of licences issued, (b) = value of licences issued in Euros, (c) = value of arms exports in Euros (if available) (d) = total EU number of licence refusals (small discrepancies may appear between breakdowns and totals due to refusals concerning more than oneML item or refusals for items other than those appearing in the ML); (e) = criteria numbers on which refusals are based (the approximate number of times each criterion is invoked is indicated in brackets)
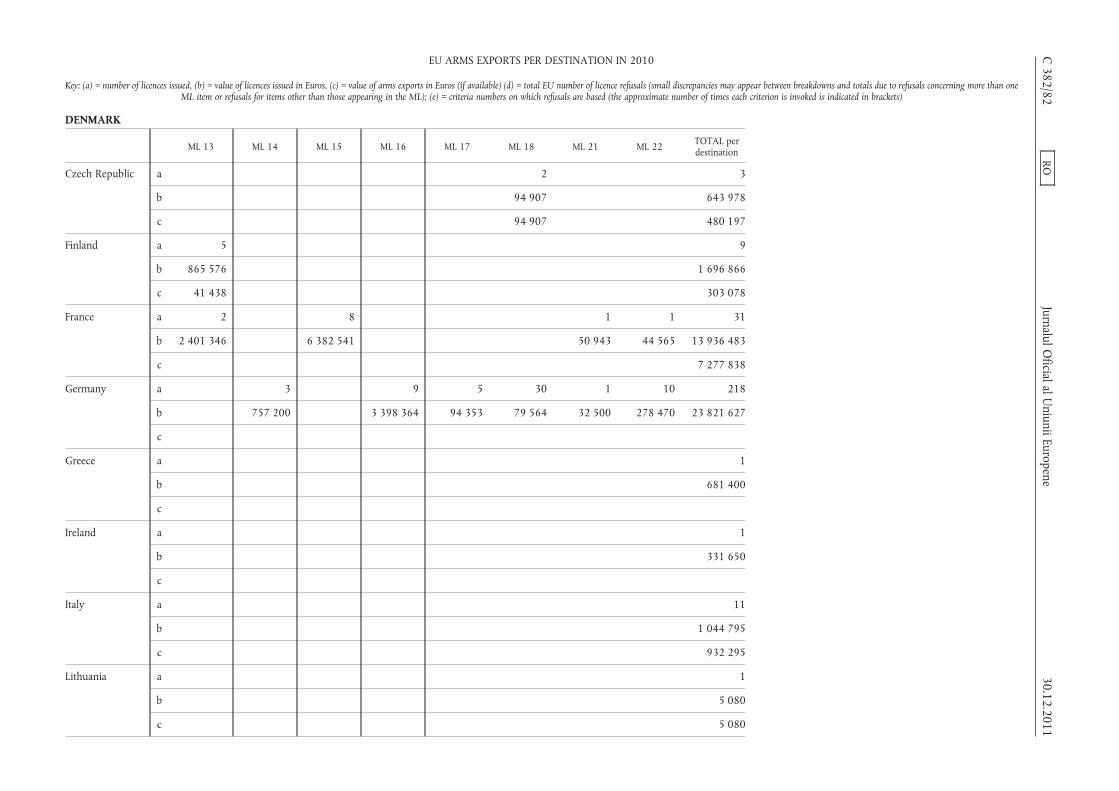
DENMARK
ML 13 ML 14 ML 15 ML 16 ML 17 ML 18 ML 21 ML 22 TOTAL perdestination
Czech Republic a 2 3
b 94 907 643 978
c 94 907 480 197
Finland a 5 9
b 865 576 1 696 866
c 41 438 303 078
France a 2 8 1 1 31
b 2 401 346 6 382 541 50 943 44 565 13 936 483
c 7 277 838
Germany a 3 9 5 30 1 10 218
b 757 200 3 398 364 94 353 79 564 32 500 278 470 23 821 627
c
Greece a 1
b 681 400
c
Ireland a 1
b 331 650
c
Italy a 11
b 1 044 795
c 932 295
Lithuania a 1
b 5 080
c 5 080
C382/82
ROJurnalul O
ficialalUniunii Europene
30.12.2011EU ARMS EXPORTS PER DESTINATION IN 2010
Key: (a) = number of licences issued, (b) = value of licences issued in Euros, (c) = value of arms exports in Euros (if available) (d) = total EU number of licence refusals (small discrepancies may appear between breakdowns and totals due to refusals concerning more than oneML item or refusals for items other than those appearing in the ML); (e) = criteria numbers on which refusals are based (the approximate number of times each criterion is invoked is indicated in brackets)

DENMARK
ML 13 ML 14 ML 15 ML 16 ML 17 ML 18 ML 21 ML 22 TOTAL perdestination
Netherlands a 2 1 2 25
b 448 130 15 475 28 000 3 009 902
c 968 824 21 463 327
Poland a 2 2
b 14 379 220 14 379 220
c
Romania a 1 3
b 25 347 51 959
c 25 347 31 734
Spain a 3 19
b 5 630 277
c 17 208 810
Sweden a 27
b 19 522 132
c 52 094 385
United Kingdom a 6 5 4 1 308
b 356 901 90 200 17 369 4 370 215
c
TOTAL PER MLcategory
a 17 3 18 10 5 33 6 14 682
b 18 396 769 757 200 6 920 871 3 413 839 94 353 911 785 100 812 351 035 118 555 056
c 66 785 968 824 94 907 100 796 624
d
e
30.12.2011RO
Jurnalul OficialalU
niunii EuropeneC
382/83EU ARMS EXPORTS PER DESTINATION IN 2010
Key: (a) = number of licences issued, (b) = value of licences issued in Euros, (c) = value of arms exports in Euros (if available) (d) = total EU number of licence refusals (small discrepancies may appear between breakdowns and totals due to refusals concerning more than oneML item or refusals for items other than those appearing in the ML); (e) = criteria numbers on which refusals are based (the approximate number of times each criterion is invoked is indicated in brackets)

DJIBOUTI
ML 1 ML 3 ML 5 ML 10 ML 11 ML 22 TOTAL perdestination
France a 1 1 5 1 8
b 1 039 153 66 519 574 002 726 1 680 400
c 182 890
Italy a
b
c 122 376
Malta a 4 4 8
b 85 719 42 500 128 219
c 82 054 33 580 115 634
United Kingdom a 27 14 1 42
b 274 743 28 083 13 860 316 686
c
TOTAL PER MLcategory
a 31 18 1 1 6 1 58
b 360 462 70 583 1 039 153 66 519 587 862 726 2 125 305
c 82 054 33 580 420 901
d
e
DOMINICAN REPUBLIC
ML 1 ML 4 ML 5 ML 6 ML 10 ML 11 ML 21 TOTAL perdestination
Austria a 2 2
b 503 486 503 486
c
Belgium a 4 4
b 47 197 47 197
c
France a 1 1 2
b 1 508 82 400 83 908
c 549 456
Germany a 2 1 3
b 343 552 2 500 346 052
c
Italy a
b
c 56 859
Spain a
b
c 418 214 418 214
United Kingdom a 1 9 29 1 40
b 9 702 236 701 3 112 38 979 288 494
c
TOTAL PER MLcategory
a 7 1 10 29 3 1 51
b 560 385 1 508 319 101 3 112 382 531 2 500 1 269 137
c 418 214 1 024 529
d
e
C 382/84 RO Jurnalul Oficial al Uniunii Europene 30.12.2011
EU ARMS EXPORTS PER DESTINATION IN 2010
Key: (a) = number of licences issued, (b) = value of licences issued in Euros, (c) = value of arms exports in Euros (if available) (d) = total EU number of licence refusals (small discrepancies mayappear between breakdowns and totals due to refusals concerning more than one ML item or refusals for items other than those appearing in the ML); (e) = criteria numbers on which refusals are
based (the approximate number of times each criterion is invoked is indicated in brackets)

ECUADOR
ML 1 ML 2 ML 3 ML 4 ML 5 ML 6 ML 7 ML 9 ML 10 ML 11 ML 13 ML 14
Austria a
b
c
Denmark a 2
b 1 393 133
c
Finland a 1
b 47 000
c 75 520
France a 2 5 1
b 206 440 1 552 717 708 712
c
Germany a 11 2 2
b 3 017 531 230 443 171 840
c
Italy a 1 1 1 1
b 1 079 229 17 585 668 295 866 914 142
c
Spain a 1 1 1
b 1 725 000 5 000 000
c 49 925 165 450
Sweden a
b
c
30.12.2011RO
Jurnalul OficialalU
niunii EuropeneC
382/85EU ARMS EXPORTS PER DESTINATION IN 2010
Key: (a) = number of licences issued, (b) = value of licences issued in Euros, (c) = value of arms exports in Euros (if available) (d) = total EU number of licence refusals (small discrepancies may appear between breakdowns and totals due to refusals concerning more than oneML item or refusals for items other than those appearing in the ML); (e) = criteria numbers on which refusals are based (the approximate number of times each criterion is invoked is indicated in brackets)

ECUADOR
ML 1 ML 2 ML 3 ML 4 ML 5 ML 6 ML 7 ML 9 ML 10 ML 11 ML 13 ML 14
United Kingdom a 4 1 1 4
b 295 658 2 749 54 353 25 679
c
TOTAL PER MLcategory
a 1 1 1 4 1 1 14 10 4 5 1
b 1 079 229 17 585 668 295 658 1 725 000 47 000 3 226 719 7 133 379 1 564 973 734 391 914 142
c 49 925 75 520 165 450
d 1
e 7(1)
ML 15 ML 18 ML 22 TOTAL perdestination
Austria a 8 8
b 71 450 71 450
c 71 450 71 450
Denmark a 2
b 1 393 133
c
Finland a 1
b 47 000
c 75 520
France a 2 10
b 225 019 2 692 888
c 16 979 341
Germany a 1 16
b 3 419 814
c
C382/86
ROJurnalul O
ficialalUniunii Europene
30.12.2011EU ARMS EXPORTS PER DESTINATION IN 2010
Key: (a) = number of licences issued, (b) = value of licences issued in Euros, (c) = value of arms exports in Euros (if available) (d) = total EU number of licence refusals (small discrepancies may appear between breakdowns and totals due to refusals concerning more than oneML item or refusals for items other than those appearing in the ML); (e) = criteria numbers on which refusals are based (the approximate number of times each criterion is invoked is indicated in brackets)
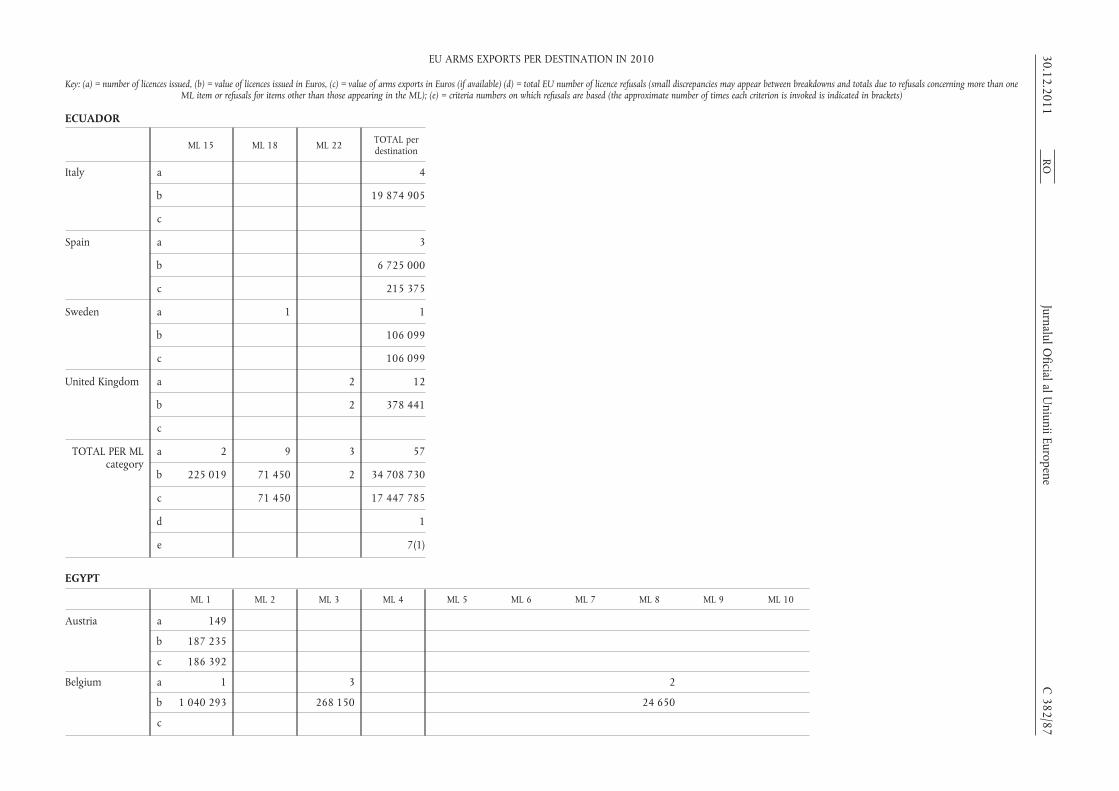
ECUADOR
ML 15 ML 18 ML 22 TOTAL perdestination
Italy a 4
b 19 874 905
c
Spain a 3
b 6 725 000
c 215 375
Sweden a 1 1
b 106 099
c 106 099
United Kingdom a 2 12
b 2 378 441
c
TOTAL PER MLcategory
a 2 9 3 57
b 225 019 71 450 2 34 708 730
c 71 450 17 447 785
d 1
e 7(1)
EGYPT
ML 1 ML 2 ML 3 ML 4 ML 5 ML 6 ML 7 ML 8 ML 9 ML 10
Austria a 149
b 187 235
c 186 392
Belgium a 1 3 2
b 1 040 293 268 150 24 650
c
30.12.2011RO
Jurnalul OficialalU
niunii EuropeneC
382/87EU ARMS EXPORTS PER DESTINATION IN 2010
Key: (a) = number of licences issued, (b) = value of licences issued in Euros, (c) = value of arms exports in Euros (if available) (d) = total EU number of licence refusals (small discrepancies may appear between breakdowns and totals due to refusals concerning more than oneML item or refusals for items other than those appearing in the ML); (e) = criteria numbers on which refusals are based (the approximate number of times each criterion is invoked is indicated in brackets)

EGYPT
ML 1 ML 2 ML 3 ML 4 ML 5 ML 6 ML 7 ML 8 ML 9 ML 10
Bulgaria a 1 2 3 3 3 4
b 9 081 235 977 3 415 090 2 179 475 121 827 328 296
c 9 081 496 722 232 760 58 050 142 554 392 706 7 725
Czech Republic a 2 1 5 9 1
b 4 830 671 3 897 915 197 707
c 4 805 701 2 022 353 78 370 192 085
Denmark a 1
b 1 637 170
c
Finland a 1
b 6 000
c 11 750
France a 2 2 1 11 1 1 62
b 57 228 2 738 561 063 10 407 080 5 611 1 332 394 38 663 053
c
Germany a 1 2 1 9 3 1 1
b 94 613 23 850 45 100 17 647 307 172 389 994 118 965
c
Greece a 1
b 2 000
c
Italy a 2 1 3 3 1 1
b 2 512 850 145 645 555 411 137 710 1 032 083 5 172 000
c
Netherlands a 2 1
b 7 691 301 62 845
c 11 873 646 86 396
C382/88
ROJurnalul O
ficialalUniunii Europene
30.12.2011EU ARMS EXPORTS PER DESTINATION IN 2010
Key: (a) = number of licences issued, (b) = value of licences issued in Euros, (c) = value of arms exports in Euros (if available) (d) = total EU number of licence refusals (small discrepancies may appear between breakdowns and totals due to refusals concerning more than oneML item or refusals for items other than those appearing in the ML); (e) = criteria numbers on which refusals are based (the approximate number of times each criterion is invoked is indicated in brackets)

EGYPT
ML 1 ML 2 ML 3 ML 4 ML 5 ML 6 ML 7 ML 8 ML 9 ML 10
Poland a 1 1 7 24
b 201 440 53 875 721 686 2 022 624
c
Portugal a
b
c
Slovakia a 1 7 1 2
b 7 050 000 4 201 835 505 540 102 115
c 1 874 098 14 944
Slovenia a 2
b 475 699
c 589 232
Spain a 1 18 2
b 3 538 254 46 946
c 103 500 1 955 634 46 946 433 757
Sweden a
b
c
United Kingdom a 18 3 4 13 3 2 9
b 521 107 16 880 13 272 303 887 15 431 418 159 738
c
TOTAL PER MLcategory
a 178 5 22 12 41 77 2 10 2 74
b 4 428 407 583 062 9 166 664 9 941 520 22 435 832 36 892 118 418 2 107 409 391 994 39 043 871
c 195 473 508 472 5 141 961 58 050 12 605 432 6 331 187 78 370 246 756 448 701
d 1 2
e 7(1) 3(2) 4(2)7(2)
30.12.2011RO
Jurnalul OficialalU
niunii EuropeneC
382/89EU ARMS EXPORTS PER DESTINATION IN 2010
Key: (a) = number of licences issued, (b) = value of licences issued in Euros, (c) = value of arms exports in Euros (if available) (d) = total EU number of licence refusals (small discrepancies may appear between breakdowns and totals due to refusals concerning more than oneML item or refusals for items other than those appearing in the ML); (e) = criteria numbers on which refusals are based (the approximate number of times each criterion is invoked is indicated in brackets)
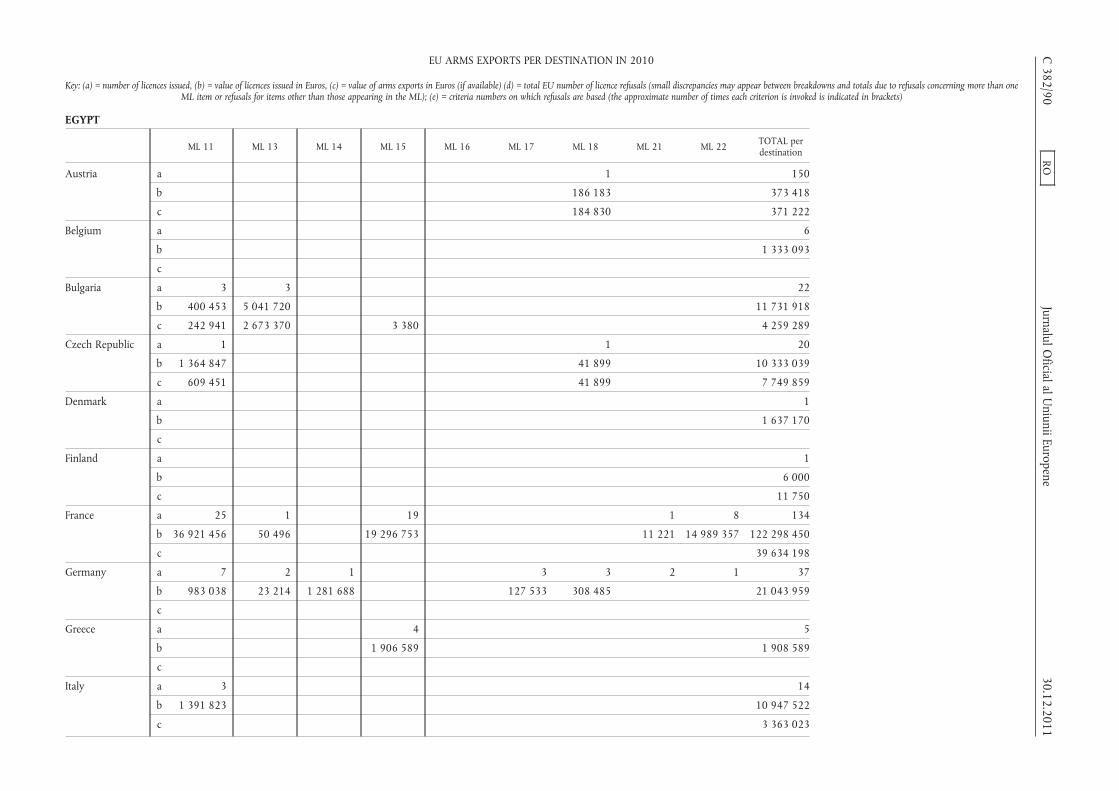
EGYPT
ML 11 ML 13 ML 14 ML 15 ML 16 ML 17 ML 18 ML 21 ML 22 TOTAL perdestination
Austria a 1 150
b 186 183 373 418
c 184 830 371 222
Belgium a 6
b 1 333 093
c
Bulgaria a 3 3 22
b 400 453 5 041 720 11 731 918
c 242 941 2 673 370 3 380 4 259 289
Czech Republic a 1 1 20
b 1 364 847 41 899 10 333 039
c 609 451 41 899 7 749 859
Denmark a 1
b 1 637 170
c
Finland a 1
b 6 000
c 11 750
France a 25 1 19 1 8 134
b 36 921 456 50 496 19 296 753 11 221 14 989 357 122 298 450
c 39 634 198
Germany a 7 2 1 3 3 2 1 37
b 983 038 23 214 1 281 688 127 533 308 485 21 043 959
c
Greece a 4 5
b 1 906 589 1 908 589
c
Italy a 3 14
b 1 391 823 10 947 522
c 3 363 023
C382/90
ROJurnalul O
ficialalUniunii Europene
30.12.2011EU ARMS EXPORTS PER DESTINATION IN 2010
Key: (a) = number of licences issued, (b) = value of licences issued in Euros, (c) = value of arms exports in Euros (if available) (d) = total EU number of licence refusals (small discrepancies may appear between breakdowns and totals due to refusals concerning more than oneML item or refusals for items other than those appearing in the ML); (e) = criteria numbers on which refusals are based (the approximate number of times each criterion is invoked is indicated in brackets)

EGYPT
ML 11 ML 13 ML 14 ML 15 ML 16 ML 17 ML 18 ML 21 ML 22 TOTAL perdestination
Netherlands a 1 1 1 1 7
b 137 810 92 185 151 000 78 917 8 214 058
c 92 185 12 052 227
Poland a 33
b 2 999 625
c
Portugal a 3 3
b 619 842 619 842
c 619 842 619 842
Slovakia a 2 13
b 517 540 12 377 030
c 11 447 1 900 489
Slovenia a 2
b 475 699
c 589 232
Spain a 21
b 3 585 200
c 2 539 837
Sweden a
b
c 21 220
United Kingdom a 7 2 6 2 3 2 1 75
b 81 682 2 072 128 611 88 000 7 644 336 1 339 077
c
TOTAL PER MLcategory
a 50 8 7 26 4 3 5 6 12 544
b 41 900 951 5 117 502 1 410 299 21 383 527 158 644 127 533 536 567 90 138 15 507 233 211 223 690
c 1 472 234 2 673 370 95 565 226 729 11 447 73 112 188
d 1 1 1 6
e 2(1) 7(1) 1(1) 4(1)7(1)
3(1) 4(1)7(1)
1(1) 2(1)3(3) 4(4)
7(6)
30.12.2011RO
Jurnalul OficialalU
niunii EuropeneC
382/91EU ARMS EXPORTS PER DESTINATION IN 2010
Key: (a) = number of licences issued, (b) = value of licences issued in Euros, (c) = value of arms exports in Euros (if available) (d) = total EU number of licence refusals (small discrepancies may appear between breakdowns and totals due to refusals concerning more than oneML item or refusals for items other than those appearing in the ML); (e) = criteria numbers on which refusals are based (the approximate number of times each criterion is invoked is indicated in brackets)

EL SALVADOR
ML 1 ML 4 ML 11 TOTAL perdestination
Austria a 6 6
b 41 551 41 551
c 38 027 38 027
Czech Republic a 1 1
b 47 450 47 450
c
Italy a
b
c 129 185
Spain a 1 2 3
b 153 176 1 722 501 1 875 677
c 153 176 1 633 964 1 787 140
TOTAL PER MLcategory
a 7 1 2 10
b 89 001 153 176 1 722 501 1 964 678
c 38 027 153 176 1 633 964 1 954 352
d
e
EQUATORIAL GUINEA
ML 2 ML 3 ML 5 ML 6 ML 10 ML 15 ML 22 TOTAL perdestination
Bulgaria a 1 1 1 3
b 495 000 66 035 40 625 601 660
c 1 365 000 903 500 63 660 2 332 160
Czech Republic a 1 1
b 61 354 61 354
c 42 172 42 172
France a 2 1 3
b 2 425 000 5 000 2 430 000
c
Germany a 1 1
b 12 390 12 390
c
Portugal a 2 2
b 269 065 269 065
c 269 065 269 065
TOTAL PER MLcategory
a 2 1 1 1 2 2 1 10
b 507 390 66 035 40 625 61 354 269 065 2 425 000 5 000 3 374 469
c 1 365 000 903 500 63 660 42 172 269 065 2 643 397
d 2 4 (*)
e 1(2) 2(1) 1(2) 2(2)3(1) 7(2)
8(1)
(*) Total number of denials also includes a denial in the ML1 category based on Criteria 2 and 7 and a denial in the ML18 category under Criteria 3, 7 and 8.
C 382/92 RO Jurnalul Oficial al Uniunii Europene 30.12.2011
EU ARMS EXPORTS PER DESTINATION IN 2010
Key: (a) = number of licences issued, (b) = value of licences issued in Euros, (c) = value of arms exports in Euros (if available) (d) = total EU number of licence refusals (small discrepancies mayappear between breakdowns and totals due to refusals concerning more than one ML item or refusals for items other than those appearing in the ML); (e) = criteria numbers on which refusals are
based (the approximate number of times each criterion is invoked is indicated in brackets)
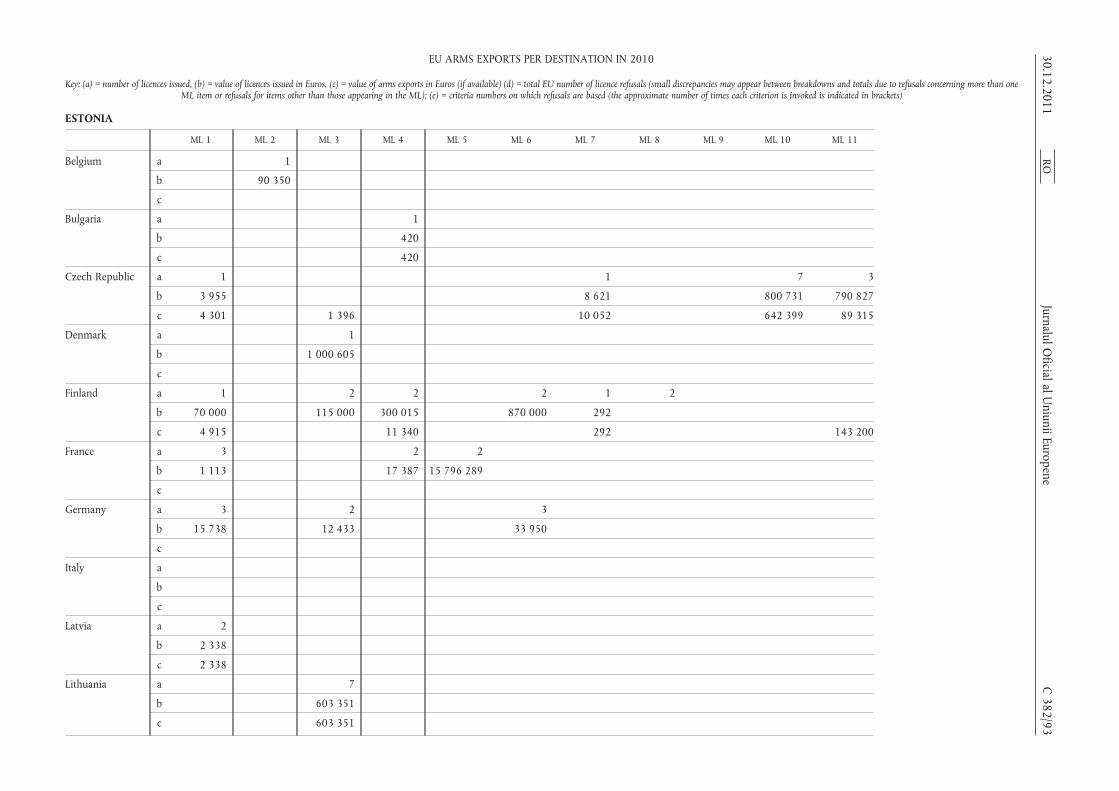
ESTONIA
ML 1 ML 2 ML 3 ML 4 ML 5 ML 6 ML 7 ML 8 ML 9 ML 10 ML 11
Belgium a 1
b 90 350
c
Bulgaria a 1
b 420
c 420
Czech Republic a 1 1 7 3
b 3 955 8 621 800 731 790 827
c 4 301 1 396 10 052 642 399 89 315
Denmark a 1
b 1 000 605
c
Finland a 1 2 2 2 1 2
b 70 000 115 000 300 015 870 000 292
c 4 915 11 340 292 143 200
France a 3 2 2
b 1 113 17 387 15 796 289
c
Germany a 3 2 3
b 15 738 12 433 33 950
c
Italy a
b
c
Latvia a 2
b 2 338
c 2 338
Lithuania a 7
b 603 351
c 603 351
30.12.2011RO
Jurnalul OficialalU
niunii EuropeneC
382/93EU ARMS EXPORTS PER DESTINATION IN 2010
Key: (a) = number of licences issued, (b) = value of licences issued in Euros, (c) = value of arms exports in Euros (if available) (d) = total EU number of licence refusals (small discrepancies may appear between breakdowns and totals due to refusals concerning more than oneML item or refusals for items other than those appearing in the ML); (e) = criteria numbers on which refusals are based (the approximate number of times each criterion is invoked is indicated in brackets)

ESTONIA
ML 1 ML 2 ML 3 ML 4 ML 5 ML 6 ML 7 ML 8 ML 9 ML 10 ML 11
Netherlands a 1 1
b 20 000 2 740 000
c 2 740 000
Poland a
b
c
Portugal a 1
b 121 175
c 121 175
Romania a 3
b 1 954
c 2 012
Spain a 1
b 320 471
c 641 460
Sweden a 1 2 2 2 1
b
c
United Kingdom a 13 2 2 2 7 1 2
b 440 825 832 79 200 14 045 65 648 507 220 4 620
c
TOTAL PER MLcategory
a 28 4 14 7 6 9 9 3 1 7 5
b 555 923 410 821 1 731 389 318 654 15 875 489 3 779 170 74 561 507 220 800 731 795 447
c 13 566 641 460 604 747 11 760 2 861 175 10 344 642 399 232 515
d
e
C382/94
ROJurnalul O
ficialalUniunii Europene
30.12.2011EU ARMS EXPORTS PER DESTINATION IN 2010
Key: (a) = number of licences issued, (b) = value of licences issued in Euros, (c) = value of arms exports in Euros (if available) (d) = total EU number of licence refusals (small discrepancies may appear between breakdowns and totals due to refusals concerning more than oneML item or refusals for items other than those appearing in the ML); (e) = criteria numbers on which refusals are based (the approximate number of times each criterion is invoked is indicated in brackets)

ESTONIA
ML 13 ML 14 ML 15 ML 17 ML 21 ML 22 TOTAL perdestination
Belgium a 1
b 90 350
c
Bulgaria a 1
b 420
c 420
Czech Republic a 12
b 1 604 134
c 747 463
Denmark a 1
b 1 000 605
c
Finland a 2 12
b 29 205 1 384 512
c 159 747
France a 5 1 3 16
b 546 354 1 501 411 702 744 18 565 298
c 2 655 137
Germany a 1 1 10
b 1 103 7 500 70 724
c
Italy a
b
c 55 748
Latvia a 2
b 2 338
c 2 338
Lithuania a 7
b 603 351
c 603 351
30.12.2011RO
Jurnalul OficialalU
niunii EuropeneC
382/95EU ARMS EXPORTS PER DESTINATION IN 2010
Key: (a) = number of licences issued, (b) = value of licences issued in Euros, (c) = value of arms exports in Euros (if available) (d) = total EU number of licence refusals (small discrepancies may appear between breakdowns and totals due to refusals concerning more than oneML item or refusals for items other than those appearing in the ML); (e) = criteria numbers on which refusals are based (the approximate number of times each criterion is invoked is indicated in brackets)

ESTONIA
ML 13 ML 14 ML 15 ML 17 ML 21 ML 22 TOTAL perdestination
Netherlands a 2
b 2 760 000
c 2 740 000
Poland a 2 2
b 22 494 22 494
c
Portugal a 1
b 121 175
c 121 175
Romania a 3
b 1 954
c 2 012
Spain a 1
b 320 471
c 641 460
Sweden a 8
b 636 591
c 26 842 931
United Kingdom a 3 1 2 4 39
b 346 500 198 88 000 4 400 1 551 488
c
TOTAL PER MLcategory
a 7 1 7 1 6 3 118
b 398 199 198 634 354 1 103 1 513 311 702 744 28 735 905
c 34 571 783
d
e
C382/96
ROJurnalul O
ficialalUniunii Europene
30.12.2011EU ARMS EXPORTS PER DESTINATION IN 2010
Key: (a) = number of licences issued, (b) = value of licences issued in Euros, (c) = value of arms exports in Euros (if available) (d) = total EU number of licence refusals (small discrepancies may appear between breakdowns and totals due to refusals concerning more than oneML item or refusals for items other than those appearing in the ML); (e) = criteria numbers on which refusals are based (the approximate number of times each criterion is invoked is indicated in brackets)

ETHIOPIA
ML 2 ML 6 ML 10 ML 11 ML 14 ML 15 TOTAL perdestination
Czech Republic a 1 2 3
b 88 302 513 494 601 796
c 194 574 73 224 486 477 754 275
France a 1 6 1 8
b 1 753 758 2 396 111 56 067 4 205 936
c 919 644
Hungary a 6 6
b 13 800 000 13 800 000
c
Italy a
b
c 1 520
Slovakia a 1 2 3
b 189 578 1 124 225 1 313 803
c 177 067 54 900 231 967
United Kingdom a 1 1
b 177 408 177 408
c
TOTAL PER MLcategory
a 2 11 6 1 1 21
b 277 880 17 191 477 2 396 111 177 408 56 067 20 098 943
c 194 574 250 291 541 377 1 907 406
d
e
30.12.2011 RO Jurnalul Oficial al Uniunii Europene C 382/97
EU ARMS EXPORTS PER DESTINATION IN 2010
Key: (a) = number of licences issued, (b) = value of licences issued in Euros, (c) = value of arms exports in Euros (if available) (d) = total EU number of licence refusals (small discrepancies mayappear between breakdowns and totals due to refusals concerning more than one ML item or refusals for items other than those appearing in the ML); (e) = criteria numbers on which refusals are
based (the approximate number of times each criterion is invoked is indicated in brackets)

FINLAND
ML 1 ML 2 ML 3 ML 4 ML 5 ML 6 ML 7 ML 8 ML 9 ML 10
Austria a 1 1
b 1 500 461 400
c 1 500 461 400
Belgium a 1 1
b 204 217 880
c
Bulgaria a 1 1
b 14 750 56 250
c 14 750 56 250
Czech Republic a 3 1 1 1
b 16 025 197 505 25 702
c 12 771 209 197 505 25 702
Denmark a 1
b 806 289
c
Estonia a 1 1
b 2 550 790 000
c 2 550 474
France a 1 4 22 3 4 7
b 45 772 385 436 21 282 164 762 913 1 475 885 155 768 499
c
Germany a 12 9 15 2 14 46 2 6
b 162 943 406 588 5 836 403 339 992 2 207 804 4 494 141 743 924 118 062
c
Italy a 1 3 1 2
b 57 441 940 117 527 015 11 443 510 99 280
c
C382/98
ROJurnalul O
ficialalUniunii Europene
30.12.2011EU ARMS EXPORTS PER DESTINATION IN 2010
Key: (a) = number of licences issued, (b) = value of licences issued in Euros, (c) = value of arms exports in Euros (if available) (d) = total EU number of licence refusals (small discrepancies may appear between breakdowns and totals due to refusals concerning more than oneML item or refusals for items other than those appearing in the ML); (e) = criteria numbers on which refusals are based (the approximate number of times each criterion is invoked is indicated in brackets)

FINLAND
ML 1 ML 2 ML 3 ML 4 ML 5 ML 6 ML 7 ML 8 ML 9 ML 10
Netherlands a 6 1
b 126 750 7 099
c 21 867 5 000 1 787 800
Poland a 1 1
b 239 400 105 550
c
Romania a 1 1
b 45 000 67 497
c 7 937 6 534
Slovenia a 2
b 111 363
c 111 363
Spain a 2 1 1
b 3 430
c 4 030 49 745
Sweden a 1 6 8 14 7 1 4 1
b
c
United Kingdom a 59 1 1 3 13 10 1 1
b 928 696 794 112 5 528 96 800 402 123 68 305 16 500 3 180
c
TOTAL PER MLcategory
a 87 14 24 21 56 73 11 9 4 18
b 1 538 698 57 954 078 7 137 687 119 264 314 23 705 230 6 749 010 68 305 1 492 385 12 190 614 156 053 338
c 62 855 209 461 400 200 055 116 363 1 870 226 56 279
d
e
30.12.2011RO
Jurnalul OficialalU
niunii EuropeneC
382/99EU ARMS EXPORTS PER DESTINATION IN 2010
Key: (a) = number of licences issued, (b) = value of licences issued in Euros, (c) = value of arms exports in Euros (if available) (d) = total EU number of licence refusals (small discrepancies may appear between breakdowns and totals due to refusals concerning more than oneML item or refusals for items other than those appearing in the ML); (e) = criteria numbers on which refusals are based (the approximate number of times each criterion is invoked is indicated in brackets)

FINLAND
ML 11 ML 13 ML 14 ML 15 ML 16 ML 17 ML 18 ML 21 ML 22 TOTAL perdestination
Austria a 2
b 462 900
c 462 900
Belgium a 2
b 218 084
c
Bulgaria a 2
b 71 000
c 71 000
Czech Republic a 1 7
b 72 110 311 342
c 71 444 307 631
Denmark a 1 2
b 240 140 1 046 429
c
Estonia a 2
b 792 550
c 3 024
France a 9 3 2 19 1 4 79
b 7 413 140 4 766 110 136 504 13 529 467 203 430 319 283 206 088 603
c 50 875 928
Germany a 6 5 6 9 15 3 9 159
b 794 528 142 252 1 377 454 1 030 881 171 118 70 000 217 971 18 114 061
c
Italy a 4 1 2 14
b 1 210 146 75 369 4 138 499 191 935 759
c 1 192 547
C382/100
ROJurnalul O
ficialalUniunii Europene
30.12.2011EU ARMS EXPORTS PER DESTINATION IN 2010
Key: (a) = number of licences issued, (b) = value of licences issued in Euros, (c) = value of arms exports in Euros (if available) (d) = total EU number of licence refusals (small discrepancies may appear between breakdowns and totals due to refusals concerning more than oneML item or refusals for items other than those appearing in the ML); (e) = criteria numbers on which refusals are based (the approximate number of times each criterion is invoked is indicated in brackets)

FINLAND
ML 11 ML 13 ML 14 ML 15 ML 16 ML 17 ML 18 ML 21 ML 22 TOTAL perdestination
Netherlands a 1 8
b 588 000 721 849
c 228 652 2 043 319
Poland a 2
b 344 950
c
Romania a 2
b 112 497
c 14 471
Slovenia a 3 5
b 1 445 112 808
c 1 445 112 808
Spain a 4
b 3 430
c 53 775
Sweden a 2 1 45
b 70 767 729
c 47 001 655
United Kingdom a 5 1 1 1 1 98
b 26 481 30 800 18 605 30 074 1 100 2 422 304
c
TOTAL PER MLcategory
a 25 8 4 25 8 10 15 6 15 433
b 9 516 406 5 595 695 136 504 13 702 519 1 471 428 1 060 955 171 118 274 530 4 675 754 493 526 295
c 71 444 230 097 102 139 058
d
e
30.12.2011RO
Jurnalul OficialalU
niunii EuropeneC
382/101EU ARMS EXPORTS PER DESTINATION IN 2010
Key: (a) = number of licences issued, (b) = value of licences issued in Euros, (c) = value of arms exports in Euros (if available) (d) = total EU number of licence refusals (small discrepancies may appear between breakdowns and totals due to refusals concerning more than oneML item or refusals for items other than those appearing in the ML); (e) = criteria numbers on which refusals are based (the approximate number of times each criterion is invoked is indicated in brackets)

FORMER YUGOSLAV REPUBLIC OF MACEDONIA
ML 1 ML 3 ML 4 ML 7 ML 10 ML 13 ML 15 ML 22 TOTAL perdestination
Austria a 8 1 9
b 139 424 43 015 182 439
c 56 404 43 015 99 419
Bulgaria a 2 1 1 4
b 190 485 41 540 825 000 1 057 025
c 12 618 63 898 56 100 132 616
France a 1 1 1 3
b 1 600 273 600 22 800 298 000
c
Germany a 3 1 1 5
b 5 561 49 770 50 170 105 501
c
Greece a 1 1
b 4 576 4 576
c
Italy a
b
c 17 926
Lithuania a 3 3
b 709 014 709 014
c 709 014 709 014
Poland a 1 1
b 3 840 3 840
c
United Kingdom a 9 2 2 13
b 74 976 132 1 265 76 373
c
TOTAL PER MLcategory
a 14 1 1 12 4 2 2 3 39
b 337 070 41 540 825 000 172 337 712 854 132 323 770 24 065 2 436 768
c 69 022 63 898 56 100 43 015 709 014 958 975
d
e
C 382/102 RO Jurnalul Oficial al Uniunii Europene 30.12.2011
EU ARMS EXPORTS PER DESTINATION IN 2010
Key: (a) = number of licences issued, (b) = value of licences issued in Euros, (c) = value of arms exports in Euros (if available) (d) = total EU number of licence refusals (small discrepancies mayappear between breakdowns and totals due to refusals concerning more than one ML item or refusals for items other than those appearing in the ML); (e) = criteria numbers on which refusals are
based (the approximate number of times each criterion is invoked is indicated in brackets)

FRANCE (NEW CALEDONIA)
ML 1 ML 3 TOTAL perdestination
Austria a 28 28
b 215 174 215 174
c 131 389 131 389
Belgium a 1 1
b 7 950 7 950
c
Finland a 1 1
b 17 700 17 700
c 2 000 2 000
Germany a 13 4 17
b 40 524 2 624 43 148
c
TOTAL PER MLcategory
a 42 5 47
b 273 398 10 574 283 972
c 133 389 133 389
d
e
30.12.2011 RO Jurnalul Oficial al Uniunii Europene C 382/103
EU ARMS EXPORTS PER DESTINATION IN 2010
Key: (a) = number of licences issued, (b) = value of licences issued in Euros, (c) = value of arms exports in Euros (if available) (d) = total EU number of licence refusals (small discrepancies mayappear between breakdowns and totals due to refusals concerning more than one ML item or refusals for items other than those appearing in the ML); (e) = criteria numbers on which refusals are
based (the approximate number of times each criterion is invoked is indicated in brackets)

FRANCE
ML 1 ML 2 ML 3 ML 4 ML 5 ML 6 ML 7 ML 8 ML 9 ML 10 ML 11
Austria a 1 3
b 30 350 804 616
c 892 088
Belgium a 74 7 12 9 3 12 1 54 13
b 17 066 048 3 616 909 172 010 6 782 078 645 176 917 998 13 420 2 965 621 10 349 510
c
Bulgaria a 1 3 2
b 2 000 103 640 122 370
c 119 910
Czech Republic a 3 1 6 4 1 2 1 8 1 5
b 5 932 31 727 30 200 185 595
c 12 205 33 483 70 636 161 626
Denmark a 1
b 945 643
c
Estonia a 2
b 168 800
c 168 800
Finland a 2 1 1 3 10
b 8 248 711 000 308 3 360 1 825 008
c 77 121 198 881 2 933 1 520 2 436 014 69 626 49 850
Germany a 65 20 36 48 22 162 9 13 143 79
b 1 692 996 398 126 14 331 747 28 795 572 2 133 038 17 361 969 474 656 3 356 662 69 445 715 31 273 934
c
Greece a 1 3 5
b 1 280 7 360 448 338 665
c
C382/104
ROJurnalul O
ficialalUniunii Europene
30.12.2011EU ARMS EXPORTS PER DESTINATION IN 2010
Key: (a) = number of licences issued, (b) = value of licences issued in Euros, (c) = value of arms exports in Euros (if available) (d) = total EU number of licence refusals (small discrepancies may appear between breakdowns and totals due to refusals concerning more than oneML item or refusals for items other than those appearing in the ML); (e) = criteria numbers on which refusals are based (the approximate number of times each criterion is invoked is indicated in brackets)

FRANCE
ML 1 ML 2 ML 3 ML 4 ML 5 ML 6 ML 7 ML 8 ML 9 ML 10 ML 11
Italy a 2 7 2 26 21 1 2 4 22 9
b 557 146 9 362 525 545 715 26 804 243 8 306 120 3 436 54 001 219 181 75 547 517 4 316 996
c
Luxembourg a 1
b 30 000
c 30 000
Netherlands a 4 7 4 7 2 12 3
b 3 795 232 975 721 398 1 182 263 40 825 204 688 700 943
c 4 395 30 525 511 113 1 728 332 40 825 177 447 2 377 291
Poland a 3 2
b 92 610 77 087
c
Portugal a 142
b 1 068 704
c 1 068 704
Romania a 4 2 9 9
b 51 708 308 616 230 390 394 750
c 21 708 64 740 176 880 40 404 361 900
Slovakia a 1 3 1
b
c
Slovenia a 1
b 11 685
c 11 685
Spain a 11 1 2 50 6 9 1 31 15
b 26 497 19 500 9 065 193 12 997 249 1 209 684 11 013 211
c 164 161 16 660 220 11 660 985 1 261 057 2 511 800
30.12.2011RO
Jurnalul OficialalU
niunii EuropeneC
382/105EU ARMS EXPORTS PER DESTINATION IN 2010
Key: (a) = number of licences issued, (b) = value of licences issued in Euros, (c) = value of arms exports in Euros (if available) (d) = total EU number of licence refusals (small discrepancies may appear between breakdowns and totals due to refusals concerning more than oneML item or refusals for items other than those appearing in the ML); (e) = criteria numbers on which refusals are based (the approximate number of times each criterion is invoked is indicated in brackets)
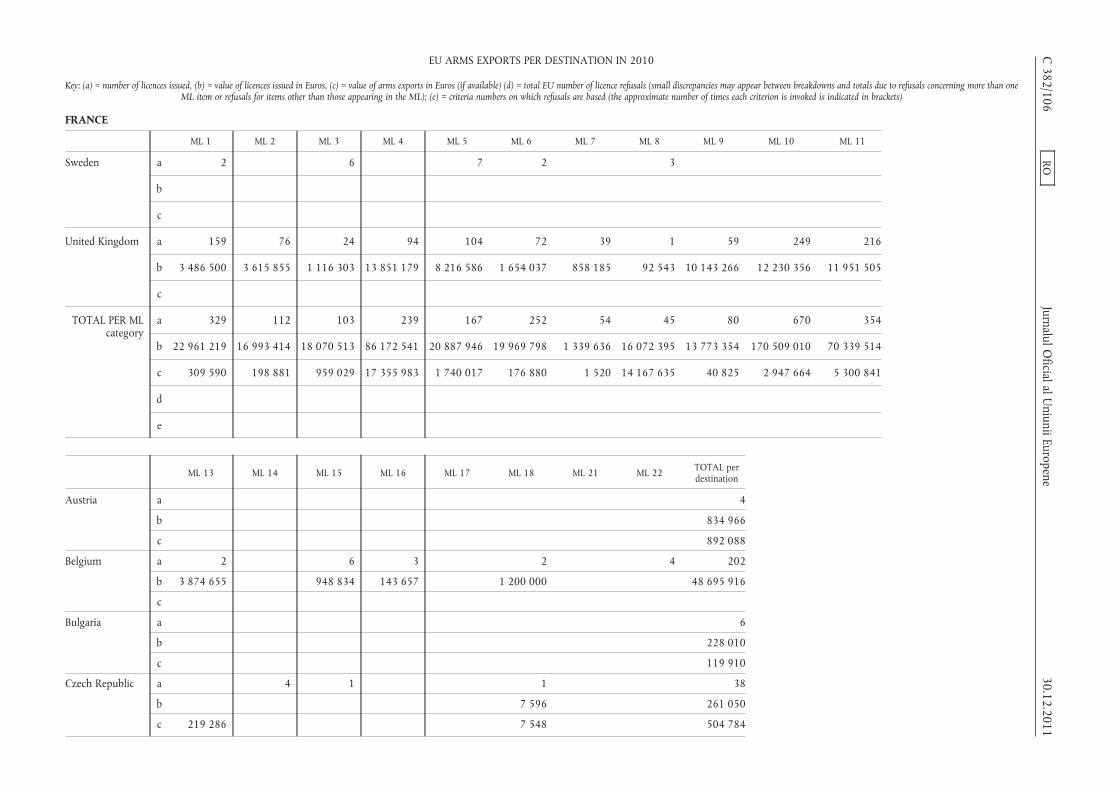
FRANCE
ML 1 ML 2 ML 3 ML 4 ML 5 ML 6 ML 7 ML 8 ML 9 ML 10 ML 11
Sweden a 2 6 7 2 3
b
c
United Kingdom a 159 76 24 94 104 72 39 1 59 249 216
b 3 486 500 3 615 855 1 116 303 13 851 179 8 216 586 1 654 037 858 185 92 543 10 143 266 12 230 356 11 951 505
c
TOTAL PER MLcategory
a 329 112 103 239 167 252 54 45 80 670 354
b 22 961 219 16 993 414 18 070 513 86 172 541 20 887 946 19 969 798 1 339 636 16 072 395 13 773 354 170 509 010 70 339 514
c 309 590 198 881 959 029 17 355 983 1 740 017 176 880 1 520 14 167 635 40 825 2 947 664 5 300 841
d
e
ML 13 ML 14 ML 15 ML 16 ML 17 ML 18 ML 21 ML 22 TOTAL perdestination
Austria a 4
b 834 966
c 892 088
Belgium a 2 6 3 2 4 202
b 3 874 655 948 834 143 657 1 200 000 48 695 916
c
Bulgaria a 6
b 228 010
c 119 910
Czech Republic a 4 1 1 38
b 7 596 261 050
c 219 286 7 548 504 784
C382/106
ROJurnalulO
ficialalUniuniiEuropene
30.12.2011EU ARMS EXPORTS PER DESTINATION IN 2010
Key: (a) = number of licences issued, (b) = value of licences issued in Euros, (c) = value of arms exports in Euros (if available) (d) = total EU number of licence refusals (small discrepancies may appear between breakdowns and totals due to refusals concerning more than oneML item or refusals for items other than those appearing in the ML); (e) = criteria numbers on which refusals are based (the approximate number of times each criterion is invoked is indicated in brackets)

FRANCE
ML 13 ML 14 ML 15 ML 16 ML 17 ML 18 ML 21 ML 22 TOTAL perdestination
Denmark a 1 2
b 63 025 1 008 668
c
Estonia a 1 3
b 27 500 196 300
c 21 000 189 800
Finland a 6 1 24
b 458 025 300 000 3 305 949
c 315 097 3 151 043
Germany a 7 15 53 28 34 22 44 800
b 2 162 419 7 018 034 14 932 561 979 111 474 842 396 004 2 426 192 197 653 578
c
Greece a 1 10
b 1 000 7 701 393
c
Italy a 1 1 1 3 1 103
b 352 186 141 742 15 163 104 337 202 071 126 532 378
c 55 036 704
Luxembourg a 1
b 30 000
c 30 000
Netherlands a 1 1 14 3 58
b 2 550 4 777 818 1 968 091 1 000 000 10 835 346
c 270 000 1 799 047 556 989 98 440 7 594 404
Poland a 5
b 169 697
c
30.12.2011RO
Jurnalul OficialalU
niunii EuropeneC
382/107EU ARMS EXPORTS PER DESTINATION IN 2010
Key: (a) = number of licences issued, (b) = value of licences issued in Euros, (c) = value of arms exports in Euros (if available) (d) = total EU number of licence refusals (small discrepancies may appear between breakdowns and totals due to refusals concerning more than oneML item or refusals for items other than those appearing in the ML); (e) = criteria numbers on which refusals are based (the approximate number of times each criterion is invoked is indicated in brackets)

FRANCE
ML 13 ML 14 ML 15 ML 16 ML 17 ML 18 ML 21 ML 22 TOTAL perdestination
Portugal a 142
b 1 068 704
c 1 068 704
Romania a 5 29
b 175 310 1 160 774
c 70 749 736 381
Slovakia a 5
b
c
Slovenia a 1
b 176 864 188 549
c 176 864 188 549
Spain a 6 1 133
b 34 331 334
c 32 258 223
Sweden a 1 3 1 25
b 91 138 649
c 23 766 074
United Kingdom a 17 3 134 8 10 2 17 36 1 320
b 6 132 501 6 006 3 372 229 341 321 290 285 90 453 1 172 203 404 280 79 025 592
c
TOTAL PER MLcategory
a 32 17 181 65 39 40 44 88 2 911
b 10 643 041 7 325 929 13 748 929 15 432 702 1 270 396 1 772 891 1 912 433 4 032 543 604 366 852
c 605 132 291 000 1 799 047 7 548 733 853 98 440 125 536 664
d
e
C382/108
ROJurnalul O
ficialalUniunii Europene
30.12.2011EU ARMS EXPORTS PER DESTINATION IN 2010
Key: (a) = number of licences issued, (b) = value of licences issued in Euros, (c) = value of arms exports in Euros (if available) (d) = total EU number of licence refusals (small discrepancies may appear between breakdowns and totals due to refusals concerning more than oneML item or refusals for items other than those appearing in the ML); (e) = criteria numbers on which refusals are based (the approximate number of times each criterion is invoked is indicated in brackets)

GAMBIA
ML 1 ML 3 ML 6 TOTAL perdestination
United Kingdom a 1 1
b 3 300 3 300
c
TOTAL PER MLcategory
a 1 1
b 3 300 3 300
c
d 1 1 2
e 2(1) 7(1) 2(1) 7(1) 2(2) 7(2)
GEORGIA
ML 1 ML 4 ML 6 ML 8 ML 11 ML 13 ML 14 TOTAL perdestination
Austria a 2 2
b 12 690 12 690
c 12 690 12 690
Czech Republic a 1 1 2 4
b 978 632 98 310 1 076 942
c 3 923 582 98 310 4 021 893
Estonia a 1 1 2
b 1 740 603 964 605 704
c 300 000 300 000
Germany a 1 1
b 350 350
c
Italy a
b
c 113 996
Poland a 1 2 2 1 6
b 2 585 124 107 277 16 574 1 268 188 3 977 163
c
Romania a
b
c 181 684 181 684
TOTAL PER MLcategory
a 2 2 3 1 1 4 2 15
b 12 690 2 586 864 1 085 909 350 114 884 1 872 152 5 672 849
c 12 690 3 923 582 181 684 98 310 300 000 4 630 263
d 15 1 20 (*)
e 3(5) 4(3)7(15)
3(1) 4(1) 2(1) 3(10)4(7) 7(16)
(*) Total number of denials include 2 denials in the ML 3 category under Criteria 2, 3, 4 and 7; and 2 denials in the ML 5 category under Criteria 3 and 4.
30.12.2011 RO Jurnalul Oficial al Uniunii Europene C 382/109
EU ARMS EXPORTS PER DESTINATION IN 2010
Key: (a) = number of licences issued, (b) = value of licences issued in Euros, (c) = value of arms exports in Euros (if available) (d) = total EU number of licence refusals (small discrepancies mayappear between breakdowns and totals due to refusals concerning more than one ML item or refusals for items other than those appearing in the ML); (e) = criteria numbers on which refusals are
based (the approximate number of times each criterion is invoked is indicated in brackets)

GERMANY
ML 1 ML 2 ML 3 ML 4 ML 5 ML 6 ML 7 ML 8 ML 9 ML 10
Austria a 4 1 5
b 130 220 5 000 195 903
c 118 979 2 500 232 634
Belgium a 46 5 9 5 5 25 24
b 12 112 340 5 657 111 321 878 591 359 232 147 5 401 514 2 230 162
c
Bulgaria a 3 2 3 1 4 2
b 36 748 81 360 224 255 12 822 3 182 810 2 245 559
c 53 780 124 360 228 740 23 622 957 625
Czech Republic a 2 6 5 1 19 3 4 7
b 11 259 2 086 834 67 840 3 796 773 946 25 684 289 762 444 410
c 3 678 133 446 32 739 1 367 561 733 31 994 93 276 420 077
Denmark a 2 1 2 6
b 423 167 3 494 4 110 596 1 904 455
c
Finland a 1 1 2 2
b 1 500 1 800 1 228 500 4 952
c 1 400 2 400 71 542 272 004 9 152 800 000
France a 4 2 30 10 20 9 22 7 91
b 413 729 6 579 5 127 075 4 951 832 3 383 270 212 979 3 452 129 801 324 88 164 387
c
Greece a 1 1 12 6 2
b 13 600 24 750 15 073 306 11 076 481 3 269 123
c
Hungary a 8 1 1
b 8 534 000 800 000 10 000
c 192 840 10 000
Ireland a 1 12
b 3 636 9 065 585
c
C382/110
ROJurnalul O
ficialalUniunii Europene
30.12.2011EU ARMS EXPORTS PER DESTINATION IN 2010
Key: (a) = number of licences issued, (b) = value of licences issued in Euros, (c) = value of arms exports in Euros (if available) (d) = total EU number of licence refusals (small discrepancies may appear between breakdowns and totals due to refusals concerning more than oneML item or refusals for items other than those appearing in the ML); (e) = criteria numbers on which refusals are based (the approximate number of times each criterion is invoked is indicated in brackets)

GERMANY
ML 1 ML 2 ML 3 ML 4 ML 5 ML 6 ML 7 ML 8 ML 9 ML 10
Italy a 1 8 4 21 17 9 1 75
b 7 945 5 127 606 833 061 16 514 442 16 588 899 17 336 666 60 837 110 306 744
c
Latvia a 5 3
b 6 030 12 716
c 6 030 12 716
Luxembourg a 2 1
b 5 500 73 343
c 5 500
Malta a 1
b 1 000
c 1 000
Netherlands a 128 3 10 2 12 30 2 1 4
b 172 004 50 800 856 507 13 389 048 28 769 108 23 915 303 115 500 33 000 273 203
c 144 904 4 894 327 999 16 070 912 4 683 549 19 679 634 17 650 37 189 33 750 846 058
Poland a 3 2 1 1
b 21 541 4 450 1 625 300 000
c
Portugal a 1
b 24 183
c 24 183
Romania a 3 24
b 43 087 438 812
c 48 217 208 299
Slovakia a 1 5 3
b 7 375 1 212 591 995 170
c 80 497 27 125
Slovenia a 1
b 254 422
c 254 422
30.12.2011RO
Jurnalul OficialalU
niunii EuropeneC
382/111EU ARMS EXPORTS PER DESTINATION IN 2010
Key: (a) = number of licences issued, (b) = value of licences issued in Euros, (c) = value of arms exports in Euros (if available) (d) = total EU number of licence refusals (small discrepancies may appear between breakdowns and totals due to refusals concerning more than oneML item or refusals for items other than those appearing in the ML); (e) = criteria numbers on which refusals are based (the approximate number of times each criterion is invoked is indicated in brackets)

GERMANY
ML 1 ML 2 ML 3 ML 4 ML 5 ML 6 ML 7 ML 8 ML 9 ML 10
Spain a 28 1 1 17 15 1 19
b 820 400 173 250 74 945 47 916 1 752 260 11 581 020
c 28 472 231 890 24 050 594 1 164 960 218 595 1 538 208 51 988 049
Sweden a 4 15 2 8 12 5 21 2 1
b
c
United Kingdom a 147 11 59 98 74 330 146 19 64 384
b 3 852 656 106 774 571 847 5 513 061 1 915 885 1 946 011 1 844 306 452 920 4 403 305 46 383 287
c
TOTAL PER MLcategory
a 376 38 127 197 140 458 167 95 79 640
b 17 628 019 11 037 031 15 136 844 56 798 076 64 735 831 64 880 651 2 092 371 11 465 710 10 813 148 263 031 650
c 411 960 134 154 1 431 807 40 449 871 7 061 923 20 564 642 58 796 1 668 673 33 750 54 299 608
d
e
ML 11 ML 13 ML 14 ML 15 ML 16 ML 17 ML 18 ML 21 ML 22 TOTAL perdestination
Austria a 1 11
b 16 457 700 16 788 823
c 7 773 888 8 128 001
Belgium a 15 6 2 1 12 155
b 70 527 764 24 078 472 32 806 30 600 121 216 153
c
Bulgaria a 15
b 5 783 555
c 1 388 127
Czech Republic a 5 2 2 2 4 3 65
b 533 847 4 912 176 620 79 083 79 756 59 304 4 637 053
c 4 323 659 4 945 237 384 53 800 70 550 57 048 6 025 696
C382/112
ROJurnalul O
ficialalUniunii Europene
30.12.2011EU ARMS EXPORTS PER DESTINATION IN 2010
Key: (a) = number of licences issued, (b) = value of licences issued in Euros, (c) = value of arms exports in Euros (if available) (d) = total EU number of licence refusals (small discrepancies may appear between breakdowns and totals due to refusals concerning more than oneML item or refusals for items other than those appearing in the ML); (e) = criteria numbers on which refusals are based (the approximate number of times each criterion is invoked is indicated in brackets)

GERMANY
ML 11 ML 13 ML 14 ML 15 ML 16 ML 17 ML 18 ML 21 ML 22 TOTAL perdestination
Denmark a 3 14 1 1 4 34
b 5 787 005 2 991 467 2 654 035 25 801 251 159 18 151 179
c
Finland a 2 1 1 10
b 29 205 895 000 9 300 2 170 257
c 429 514 429 514 2 015 526
France a 37 11 1 38 1 1 9 293
b 9 432 170 9 837 395 968 637 35 304 328 133 386 6 899 552 387 641 169 476 414
c 39 527 897
Greece a 1 1 24
b 94 500 190 900 29 742 660
c
Hungary a 2 12
b 2 700 000 12 044 000
c 1 369 381 1 572 221
Ireland a 1 2 16
b 640 000 960 100 10 669 321
c
Italy a 16 5 6 3 4 170
b 11 624 831 10 518 036 362 397 27 239 34 902 189 343 606
c 55 804 844
Latvia a 8
b 18 746
c 18 746
Luxembourg a 3
b 78 843
c 5 500
30.12.2011RO
Jurnalul OficialalU
niunii EuropeneC
382/113EU ARMS EXPORTS PER DESTINATION IN 2010
Key: (a) = number of licences issued, (b) = value of licences issued in Euros, (c) = value of arms exports in Euros (if available) (d) = total EU number of licence refusals (small discrepancies may appear between breakdowns and totals due to refusals concerning more than oneML item or refusals for items other than those appearing in the ML); (e) = criteria numbers on which refusals are based (the approximate number of times each criterion is invoked is indicated in brackets)

GERMANY
ML 11 ML 13 ML 14 ML 15 ML 16 ML 17 ML 18 ML 21 ML 22 TOTAL perdestination
Malta a 1
b 1 000
c 1 000
Netherlands a 3 2 2 2 5 206
b 1 549 922 271 000 16 800 98 570 488 898 69 999 663
c 1 277 936 107 060 831 670 570 44 063 775
Poland a 1 1 1 10
b 18 503 33 923 5 227 435 5 607 477
c
Portugal a 10 11
b 776 136 800 319
c 776 136 800 319
Romania a 4 31
b 2 762 007 3 243 906
c 2 401 507 2 658 023
Slovakia a 1 10
b 10 000 2 225 136
c 107 622
Slovenia a 1
b 254 422
c 254 422
Spain a 6 1 3 92
b 6 181 511 3 500 20 634 802
c 632 000 26 153 070 3 500 106 009 338
Sweden a 2 1 4 1 78
b 13 792 811
c 28 116 114
C382/114
ROJurnalul O
ficialalUniunii Europene
30.12.2011EU ARMS EXPORTS PER DESTINATION IN 2010
Key: (a) = number of licences issued, (b) = value of licences issued in Euros, (c) = value of arms exports in Euros (if available) (d) = total EU number of licence refusals (small discrepancies may appear between breakdowns and totals due to refusals concerning more than oneML item or refusals for items other than those appearing in the ML); (e) = criteria numbers on which refusals are based (the approximate number of times each criterion is invoked is indicated in brackets)
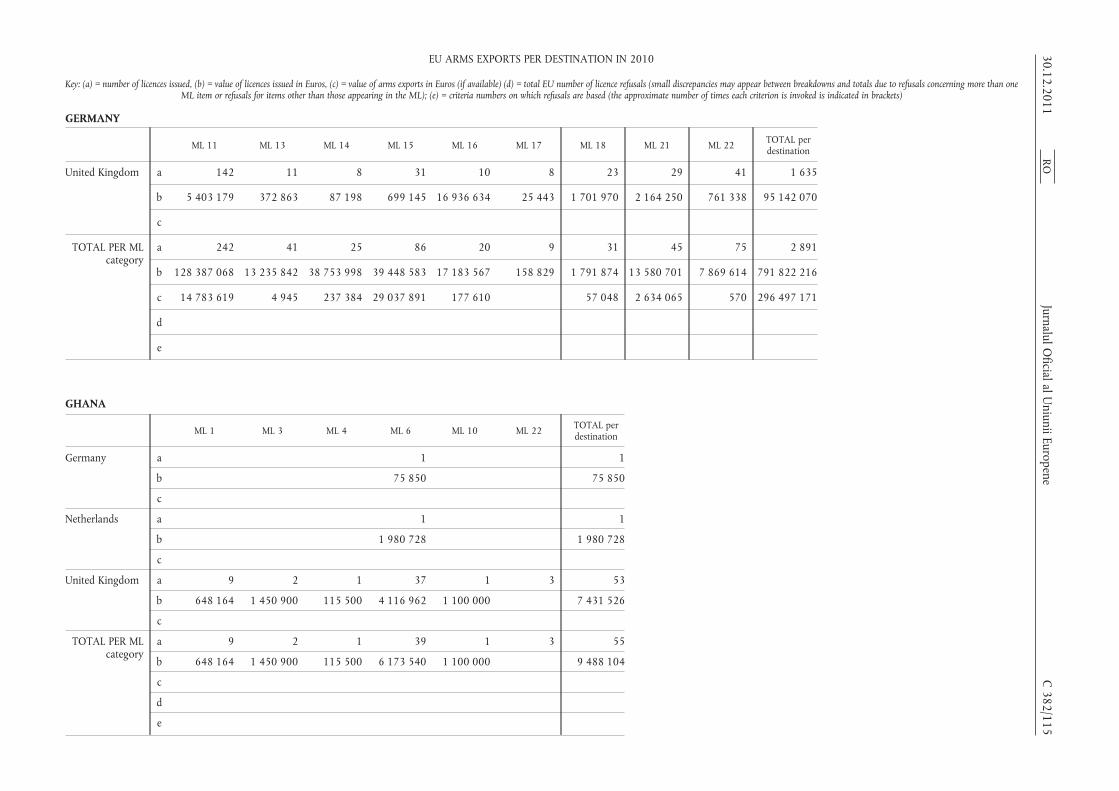
GERMANY
ML 11 ML 13 ML 14 ML 15 ML 16 ML 17 ML 18 ML 21 ML 22 TOTAL perdestination
United Kingdom a 142 11 8 31 10 8 23 29 41 1 635
b 5 403 179 372 863 87 198 699 145 16 936 634 25 443 1 701 970 2 164 250 761 338 95 142 070
c
TOTAL PER MLcategory
a 242 41 25 86 20 9 31 45 75 2 891
b 128 387 068 13 235 842 38 753 998 39 448 583 17 183 567 158 829 1 791 874 13 580 701 7 869 614 791 822 216
c 14 783 619 4 945 237 384 29 037 891 177 610 57 048 2 634 065 570 296 497 171
d
e
GHANA
ML 1 ML 3 ML 4 ML 6 ML 10 ML 22 TOTAL perdestination
Germany a 1 1
b 75 850 75 850
c
Netherlands a 1 1
b 1 980 728 1 980 728
c
United Kingdom a 9 2 1 37 1 3 53
b 648 164 1 450 900 115 500 4 116 962 1 100 000 7 431 526
c
TOTAL PER MLcategory
a 9 2 1 39 1 3 55
b 648 164 1 450 900 115 500 6 173 540 1 100 000 9 488 104
c
d
e
30.12.2011RO
Jurnalul OficialalU
niunii EuropeneC
382/115EU ARMS EXPORTS PER DESTINATION IN 2010
Key: (a) = number of licences issued, (b) = value of licences issued in Euros, (c) = value of arms exports in Euros (if available) (d) = total EU number of licence refusals (small discrepancies may appear between breakdowns and totals due to refusals concerning more than oneML item or refusals for items other than those appearing in the ML); (e) = criteria numbers on which refusals are based (the approximate number of times each criterion is invoked is indicated in brackets)
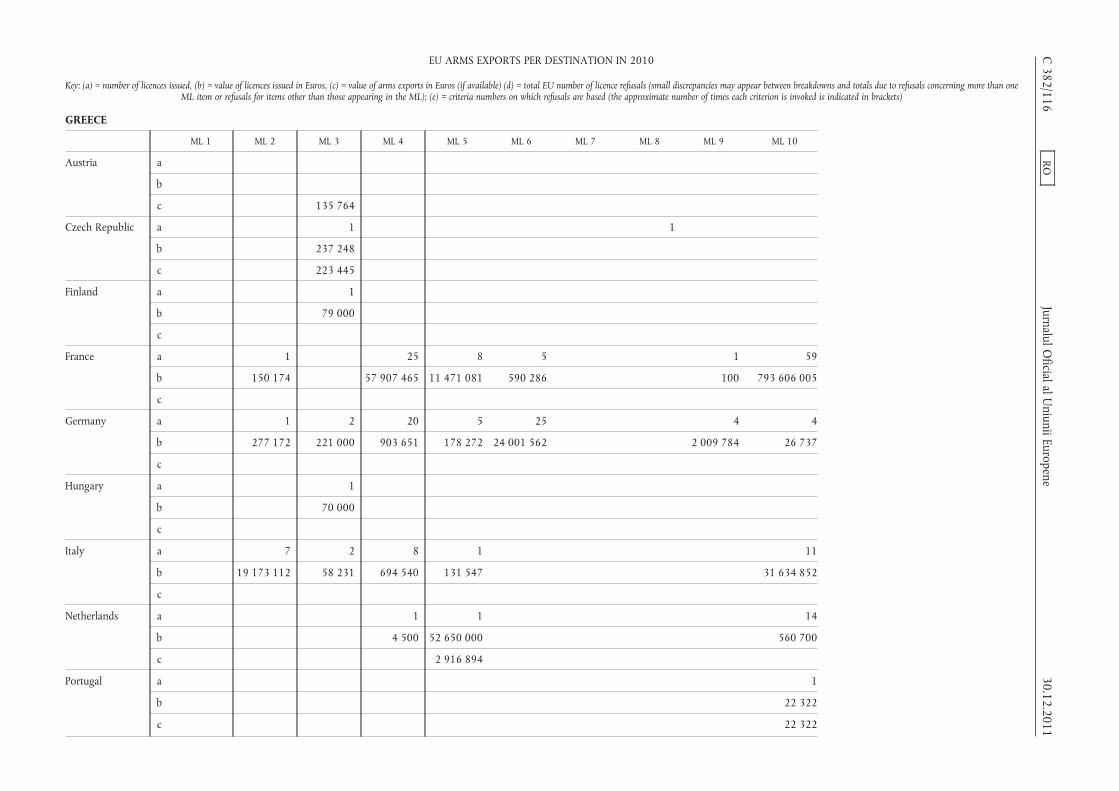
GREECE
ML 1 ML 2 ML 3 ML 4 ML 5 ML 6 ML 7 ML 8 ML 9 ML 10
Austria a
b
c 135 764
Czech Republic a 1 1
b 237 248
c 223 445
Finland a 1
b 79 000
c
France a 1 25 8 5 1 59
b 150 174 57 907 465 11 471 081 590 286 100 793 606 005
c
Germany a 1 2 20 5 25 4 4
b 277 172 221 000 903 651 178 272 24 001 562 2 009 784 26 737
c
Hungary a 1
b 70 000
c
Italy a 7 2 8 1 11
b 19 173 112 58 231 694 540 131 547 31 634 852
c
Netherlands a 1 1 14
b 4 500 52 650 000 560 700
c 2 916 894
Portugal a 1
b 22 322
c 22 322
C382/116
ROJurnalul O
ficialalUniunii Europene
30.12.2011EU ARMS EXPORTS PER DESTINATION IN 2010
Key: (a) = number of licences issued, (b) = value of licences issued in Euros, (c) = value of arms exports in Euros (if available) (d) = total EU number of licence refusals (small discrepancies may appear between breakdowns and totals due to refusals concerning more than oneML item or refusals for items other than those appearing in the ML); (e) = criteria numbers on which refusals are based (the approximate number of times each criterion is invoked is indicated in brackets)

GREECE
ML 1 ML 2 ML 3 ML 4 ML 5 ML 6 ML 7 ML 8 ML 9 ML 10
Slovakia a 1 1
b 84 736
c 84 736
Spain a 1 1 1
b 1 530 33 000 000
c 1 530
Sweden a 1 1 1 2
b
c
United Kingdom a 13 1 7 1 19 15 40
b 11 863 416 847 13 955 5 368 381 733 12 804 982 733
c
TOTAL PER MLcategory
a 16 11 8 61 17 49 15 4 5 130
b 13 393 19 685 194 1 082 326 59 524 111 64 436 268 24 973 581 12 804 33 000 000 2 009 884 826 833 349
c 1 530 84 736 359 209 2 916 894 22 322
d
e
ML 11 ML 13 ML 14 ML 15 ML 16 ML 17 ML 18 ML 21 ML 22 TOTAL perdestination
Austria a
b
c 135 764
Czech Republic a 2
b 237 248
c 223 445
30.12.2011RO
Jurnalul OficialalU
niunii EuropeneC
382/117EU ARMS EXPORTS PER DESTINATION IN 2010
Key: (a) = number of licences issued, (b) = value of licences issued in Euros, (c) = value of arms exports in Euros (if available) (d) = total EU number of licence refusals (small discrepancies may appear between breakdowns and totals due to refusals concerning more than oneML item or refusals for items other than those appearing in the ML); (e) = criteria numbers on which refusals are based (the approximate number of times each criterion is invoked is indicated in brackets)

GREECE
ML 11 ML 13 ML 14 ML 15 ML 16 ML 17 ML 18 ML 21 ML 22 TOTAL perdestination
Finland a 2 3
b 29 205 108 205
c 3 840 3 840
France a 19 3 12 2 5 140
b 7 369 050 612 178 2 175 215 1 148 228 1 046 814 876 076 595
c 67 126 795
Germany a 7 1 11 11 11 2 104
b 4 360 676 199 842 332 234 3 018 590 60 144 210 000 35 799 664
c
Hungary a 1
b 70 000
c
Italy a 2 4 35
b 2 138 267 53 830 550
c
Netherlands a 16
b 53 215 200
c 150 700 2 917 744
Portugal a 1
b 22 322
c 22 322
Slovakia a 2
b 84 736
c 84 736
Spain a 3
b 33 001 530
c 188 180 189 710
C382/118
ROJurnalul O
ficialalUniunii Europene
30.12.2011EU ARMS EXPORTS PER DESTINATION IN 2010
Key: (a) = number of licences issued, (b) = value of licences issued in Euros, (c) = value of arms exports in Euros (if available) (d) = total EU number of licence refusals (small discrepancies may appear between breakdowns and totals due to refusals concerning more than oneML item or refusals for items other than those appearing in the ML); (e) = criteria numbers on which refusals are based (the approximate number of times each criterion is invoked is indicated in brackets)

GREECE
ML 11 ML 13 ML 14 ML 15 ML 16 ML 17 ML 18 ML 21 ML 22 TOTAL perdestination
Sweden a 5
b 212 197
c 212 197
United Kingdom a 7 4 2 7 3 119
b 15 621 76 450 21 450 27 460 40 580 2 006 865
c
TOTAL PER MLcategory
a 35 9 3 12 11 11 18 4 12 431
b 13 883 615 717 833 221 292 2 175 215 332 234 3 018 590 87 604 1 358 228 1 087 394 1 054 665 111
c 188 180 3 840 150 700 70 916 553
d
e
30.12.2011RO
Jurnalul OficialalU
niunii EuropeneC
382/119EU ARMS EXPORTS PER DESTINATION IN 2010
Key: (a) = number of licences issued, (b) = value of licences issued in Euros, (c) = value of arms exports in Euros (if available) (d) = total EU number of licence refusals (small discrepancies may appear between breakdowns and totals due to refusals concerning more than oneML item or refusals for items other than those appearing in the ML); (e) = criteria numbers on which refusals are based (the approximate number of times each criterion is invoked is indicated in brackets)

GUATEMALA
ML 1 ML 3 ML 8 TOTAL perdestination
Bulgaria a 1 1
b 590 590
c
Hungary a 1 1
b 210 000 210 000
c
Italy a
b
c 3 393
TOTAL PER MLcategory
a 1 1 2
b 590 210 000 210 590
c 3 393
d 1 1 2
e 7(1) 7(1) 2(2) 7(2)
GUYANA
ML 1 ML 6 ML 13 TOTAL perdestination
Austria a 6 6
b 125 382 125 382
c 3 900 3 900
United Kingdom a 5 5
b 65 450 65 450
c
TOTAL PER MLcategory
a 6 5 11
b 125 382 65 450 190 832
c 3 900 3 900
d 1 1
e 7(1) 7(1)
HAITI
ML 1 ML 3 ML 4 ML 6 ML 13 TOTAL perdestination
Austria a 2 2
b 23 800 23 800
c 8 950 8 950
France a 1 1
b 6 000 6 000
c
C 382/120 RO Jurnalul Oficial al Uniunii Europene 30.12.2011
EU ARMS EXPORTS PER DESTINATION IN 2010
Key: (a) = number of licences issued, (b) = value of licences issued in Euros, (c) = value of arms exports in Euros (if available) (d) = total EU number of licence refusals (small discrepancies mayappear between breakdowns and totals due to refusals concerning more than one ML item or refusals for items other than those appearing in the ML); (e) = criteria numbers on which refusals are
based (the approximate number of times each criterion is invoked is indicated in brackets)

HAITI
ML 1 ML 3 ML 4 ML 6 ML 13 TOTAL perdestination
Germany a 1 1 2
b 150 29 500 29 650
c
Greece a 1 1
b 1 190 1 190
c
United Kingdom a 5 1 2 8
b 17 804 204 4 290 22 297
c
TOTAL PER MLcategory
a 7 3 1 1 2 14
b 19 144 24 004 6 000 29 500 4 290 82 937
c 8 950 8 950
d
e
HONDURAS
TOTAL perdestination
Italy a
b
c 572 099
TOTAL PER MLcategory
a
b
c 572 099
d
e
30.12.2011 RO Jurnalul Oficial al Uniunii Europene C 382/121
EU ARMS EXPORTS PER DESTINATION IN 2010
Key: (a) = number of licences issued, (b) = value of licences issued in Euros, (c) = value of arms exports in Euros (if available) (d) = total EU number of licence refusals (small discrepancies mayappear between breakdowns and totals due to refusals concerning more than one ML item or refusals for items other than those appearing in the ML); (e) = criteria numbers on which refusals are
based (the approximate number of times each criterion is invoked is indicated in brackets)

HUNGARY
ML 1 ML 2 ML 3 ML 4 ML 5 ML 6 ML 7 ML 8 ML 10 ML 11 ML 13
Austria a 1
b 59 976
c
Bulgaria a 2 1 1
b 2 670 129 762 270 962
c 2 670 270 962
Czech Republic a 1 1 1 1 3 9
b 2 373 328 193 128 582 3 120 79 029 803 830
c 305 422 68 194 75 875 44 590
Denmark a
b
c
Finland a 1 4
b 79 000 253 205
c 3 155
France a 2 2 1 3
b 377 687 549 893 106 2 070 410
c
Germany a 3 3 1 15 1 4
b 70 549 39 532 634 400 1 149 747 250 000 728 208
c
Greece a
b
c
Italy a
b
c
C382/122
ROJurnalul O
ficialalUniunii Europene
30.12.2011EU ARMS EXPORTS PER DESTINATION IN 2010
Key: (a) = number of licences issued, (b) = value of licences issued in Euros, (c) = value of arms exports in Euros (if available) (d) = total EU number of licence refusals (small discrepancies may appear between breakdowns and totals due to refusals concerning more than oneML item or refusals for items other than those appearing in the ML); (e) = criteria numbers on which refusals are based (the approximate number of times each criterion is invoked is indicated in brackets)

HUNGARY
ML 1 ML 2 ML 3 ML 4 ML 5 ML 6 ML 7 ML 8 ML 10 ML 11 ML 13
Lithuania a
b
c 13 674
Netherlands a 1
b 2 171
c 3 676 2 171
Poland a 1 4
b 26 970 597 250
c
Romania a 1 5
b 73 430 69 060
c 11 261 16 817
Spain a 1 1 1
b 1 200 1 123 653 308 080
c 2 730 1 226 053
Sweden a 1 1 1 1
b
c
United Kingdom a 25 1 3
b 3 101 447 3 850 16 723
c
TOTAL PER MLcategory
a 31 4 9 4 9 17 3 4 17 7 4
b 3 235 545 330 863 1 447 548 712 737 1 910 125 1 156 717 16 723 79 029 1 393 958 2 798 618 253 205
c 9 561 308 092 13 432 1 226 053 68 194 75 875 332 369 13 674
d
e
30.12.2011RO
Jurnalul OficialalU
niunii EuropeneC
382/123EU ARMS EXPORTS PER DESTINATION IN 2010
Key: (a) = number of licences issued, (b) = value of licences issued in Euros, (c) = value of arms exports in Euros (if available) (d) = total EU number of licence refusals (small discrepancies may appear between breakdowns and totals due to refusals concerning more than oneML item or refusals for items other than those appearing in the ML); (e) = criteria numbers on which refusals are based (the approximate number of times each criterion is invoked is indicated in brackets)
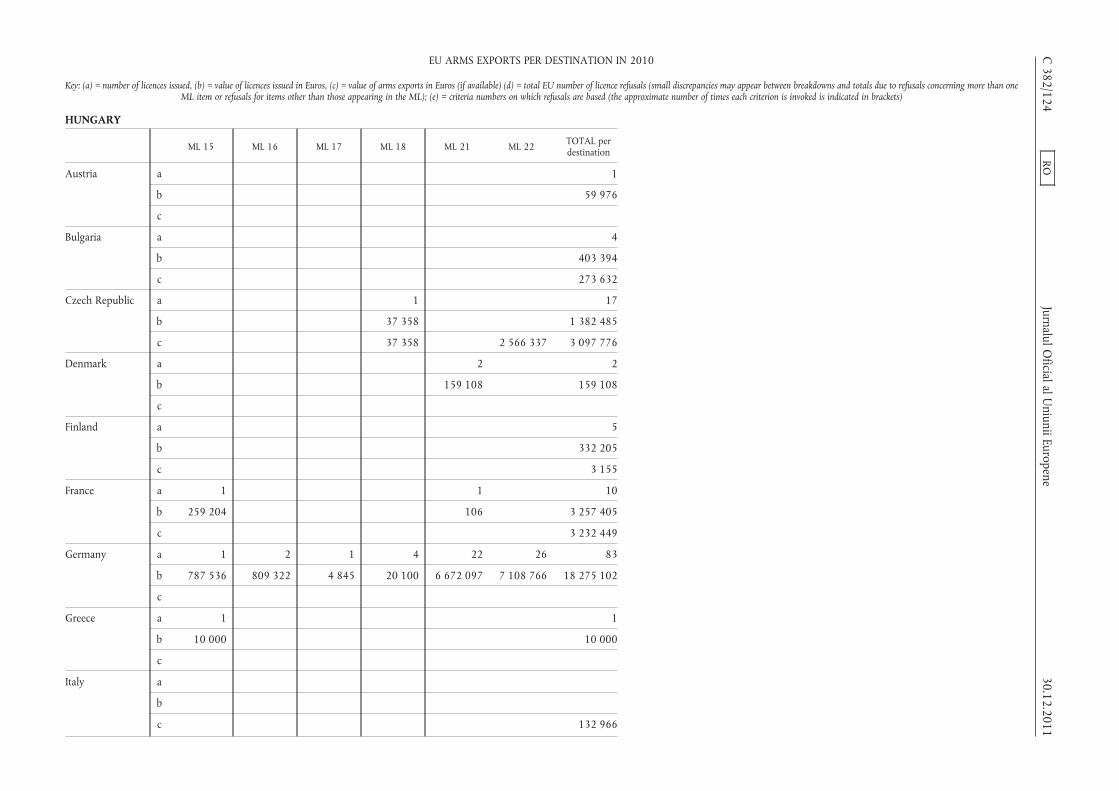
HUNGARY
ML 15 ML 16 ML 17 ML 18 ML 21 ML 22 TOTAL perdestination
Austria a 1
b 59 976
c
Bulgaria a 4
b 403 394
c 273 632
Czech Republic a 1 17
b 37 358 1 382 485
c 37 358 2 566 337 3 097 776
Denmark a 2 2
b 159 108 159 108
c
Finland a 5
b 332 205
c 3 155
France a 1 1 10
b 259 204 106 3 257 405
c 3 232 449
Germany a 1 2 1 4 22 26 83
b 787 536 809 322 4 845 20 100 6 672 097 7 108 766 18 275 102
c
Greece a 1 1
b 10 000 10 000
c
Italy a
b
c 132 966
C382/124
ROJurnalul O
ficialalUniunii Europene
30.12.2011EU ARMS EXPORTS PER DESTINATION IN 2010
Key: (a) = number of licences issued, (b) = value of licences issued in Euros, (c) = value of arms exports in Euros (if available) (d) = total EU number of licence refusals (small discrepancies may appear between breakdowns and totals due to refusals concerning more than oneML item or refusals for items other than those appearing in the ML); (e) = criteria numbers on which refusals are based (the approximate number of times each criterion is invoked is indicated in brackets)

HUNGARY
ML 15 ML 16 ML 17 ML 18 ML 21 ML 22 TOTAL perdestination
Lithuania a
b
c 13 674
Netherlands a 1
b 2 171
c 5 847
Poland a 5
b 624 220
c
Romania a 1 7
b 55 600 198 090
c 55 600 83 678
Spain a 3
b 1 432 933
c 1 228 783
Sweden a 4
b 212 197
c 212 197
United Kingdom a 18 79 126
b 7 011 87 3 129 118
c
TOTAL PER MLcategory
a 3 2 1 23 25 106 269
b 1 056 740 809 322 4 845 64 469 6 831 311 7 164 453 29 478 405
c 37 358 2 621 937 8 284 157
d
e
30.12.2011RO
Jurnalul OficialalU
niunii EuropeneC
382/125EU ARMS EXPORTS PER DESTINATION IN 2010
Key: (a) = number of licences issued, (b) = value of licences issued in Euros, (c) = value of arms exports in Euros (if available) (d) = total EU number of licence refusals (small discrepancies may appear between breakdowns and totals due to refusals concerning more than oneML item or refusals for items other than those appearing in the ML); (e) = criteria numbers on which refusals are based (the approximate number of times each criterion is invoked is indicated in brackets)
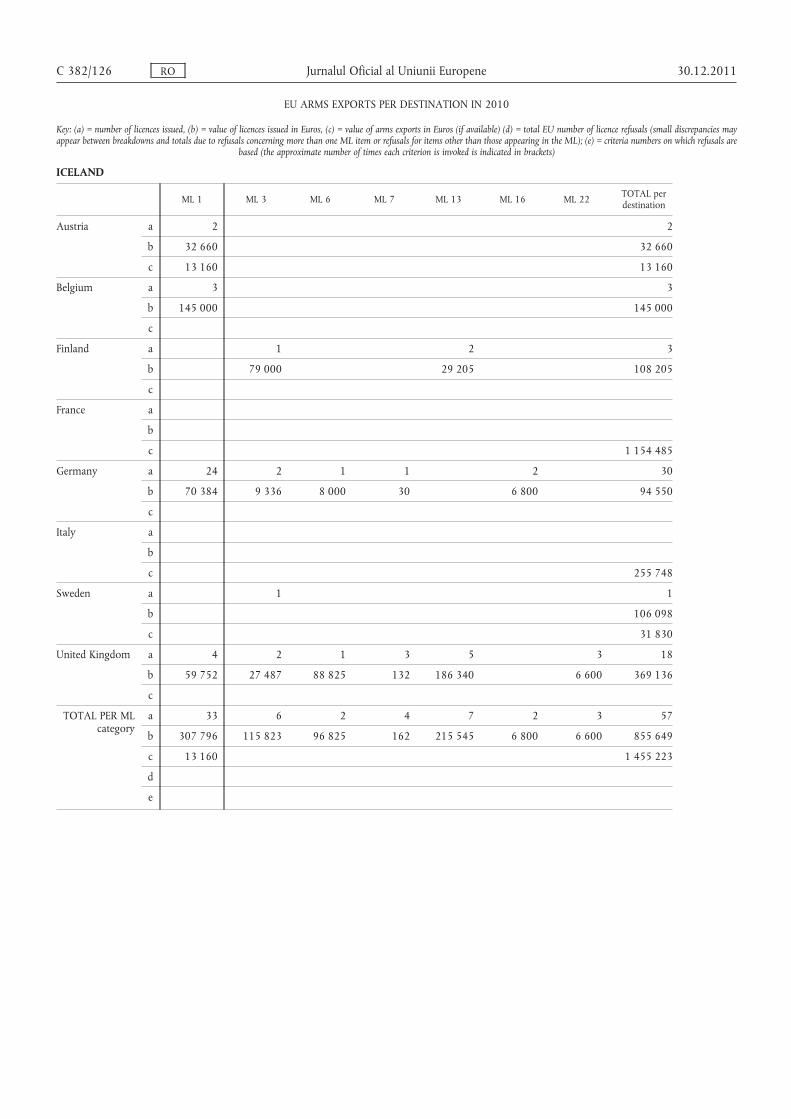
ICELAND
ML 1 ML 3 ML 6 ML 7 ML 13 ML 16 ML 22 TOTAL perdestination
Austria a 2 2
b 32 660 32 660
c 13 160 13 160
Belgium a 3 3
b 145 000 145 000
c
Finland a 1 2 3
b 79 000 29 205 108 205
c
France a
b
c 1 154 485
Germany a 24 2 1 1 2 30
b 70 384 9 336 8 000 30 6 800 94 550
c
Italy a
b
c 255 748
Sweden a 1 1
b 106 098
c 31 830
United Kingdom a 4 2 1 3 5 3 18
b 59 752 27 487 88 825 132 186 340 6 600 369 136
c
TOTAL PER MLcategory
a 33 6 2 4 7 2 3 57
b 307 796 115 823 96 825 162 215 545 6 800 6 600 855 649
c 13 160 1 455 223
d
e
C 382/126 RO Jurnalul Oficial al Uniunii Europene 30.12.2011
EU ARMS EXPORTS PER DESTINATION IN 2010
Key: (a) = number of licences issued, (b) = value of licences issued in Euros, (c) = value of arms exports in Euros (if available) (d) = total EU number of licence refusals (small discrepancies mayappear between breakdowns and totals due to refusals concerning more than one ML item or refusals for items other than those appearing in the ML); (e) = criteria numbers on which refusals are
based (the approximate number of times each criterion is invoked is indicated in brackets)

INDIA
ML 1 ML 2 ML 3 ML 4 ML 5 ML 6 ML 7 ML 8 ML 9 ML 10
Austria a 7 23
b 540 550 131 235
c 532 986 43 447
Belgium a 9 1 1 4
b 960 165 3 116 1 099 071 475 562
c
Bulgaria a 6 6 4 5
b 24 153 256 278 407 239 192 280 900
c 300 000 135 347 690 382 12 921 497 1 308 901
Czech Republic a 2 2 1 2 17 3
b 19 929 31 089 336
c 18 403 29 363 701
Finland a
b
c 5 000
France a 3 2 3 33 40 6 7 45 291
b 264 326 1 830 195 074 96 073 573 88 033 255 14 081 854 1 273 695 274 828 361 153 375 783
c
Germany a 35 1 16 9 24 23 22 37 82 23
b 3 643 424 1 346 791 212 079 4 802 103 22 001 043 20 204 278 251 294 5 329 14 331 737 3 412 712
c
Greece a
b
c
Hungary a 2
b 1 550 000
c 450 109
30.12.2011RO
Jurnalul OficialalU
niunii EuropeneC
382/127EU ARMS EXPORTS PER DESTINATION IN 2010
Key: (a) = number of licences issued, (b) = value of licences issued in Euros, (c) = value of arms exports in Euros (if available) (d) = total EU number of licence refusals (small discrepancies may appear between breakdowns and totals due to refusals concerning more than oneML item or refusals for items other than those appearing in the ML); (e) = criteria numbers on which refusals are based (the approximate number of times each criterion is invoked is indicated in brackets)
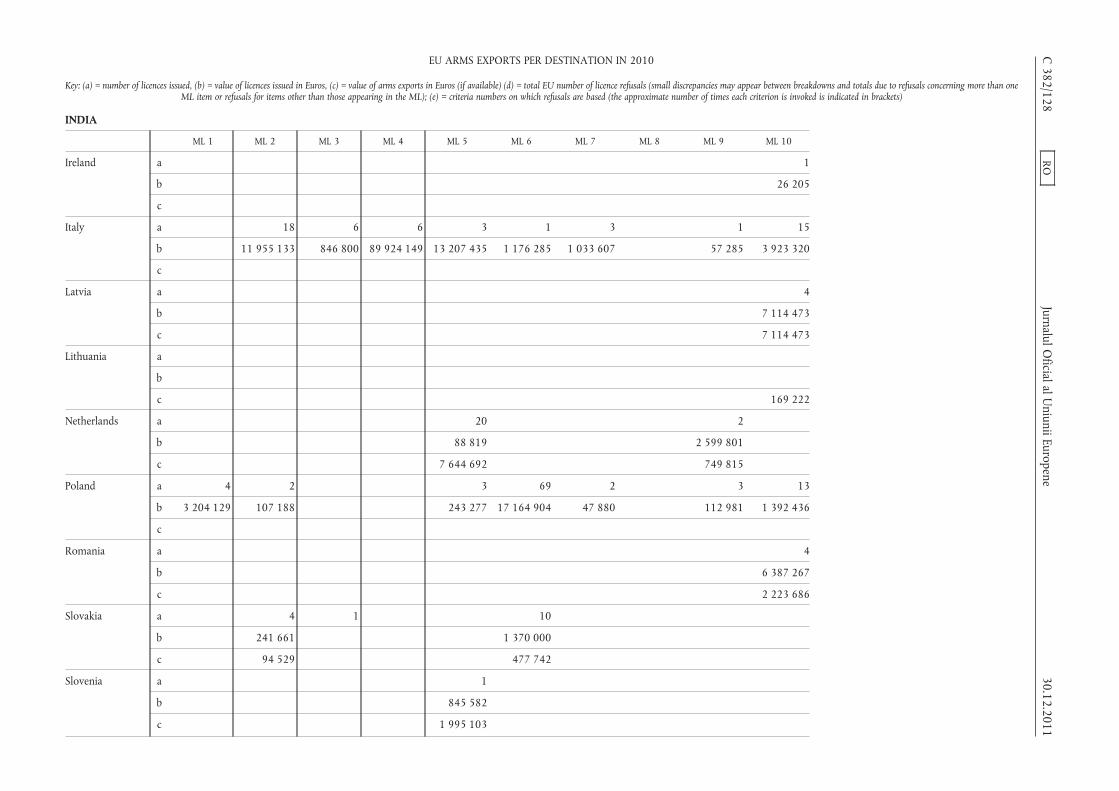
INDIA
ML 1 ML 2 ML 3 ML 4 ML 5 ML 6 ML 7 ML 8 ML 9 ML 10
Ireland a 1
b 26 205
c
Italy a 18 6 6 3 1 3 1 15
b 11 955 133 846 800 89 924 149 13 207 435 1 176 285 1 033 607 57 285 3 923 320
c
Latvia a 4
b 7 114 473
c 7 114 473
Lithuania a
b
c 169 222
Netherlands a 20 2
b 88 819 2 599 801
c 7 644 692 749 815
Poland a 4 2 3 69 2 3 13
b 3 204 129 107 188 243 277 17 164 904 47 880 112 981 1 392 436
c
Romania a 4
b 6 387 267
c 2 223 686
Slovakia a 4 1 10
b 241 661 1 370 000
c 94 529 477 742
Slovenia a 1
b 845 582
c 1 995 103
C382/128
ROJurnalul O
ficialalUniunii Europene
30.12.2011EU ARMS EXPORTS PER DESTINATION IN 2010
Key: (a) = number of licences issued, (b) = value of licences issued in Euros, (c) = value of arms exports in Euros (if available) (d) = total EU number of licence refusals (small discrepancies may appear between breakdowns and totals due to refusals concerning more than oneML item or refusals for items other than those appearing in the ML); (e) = criteria numbers on which refusals are based (the approximate number of times each criterion is invoked is indicated in brackets)
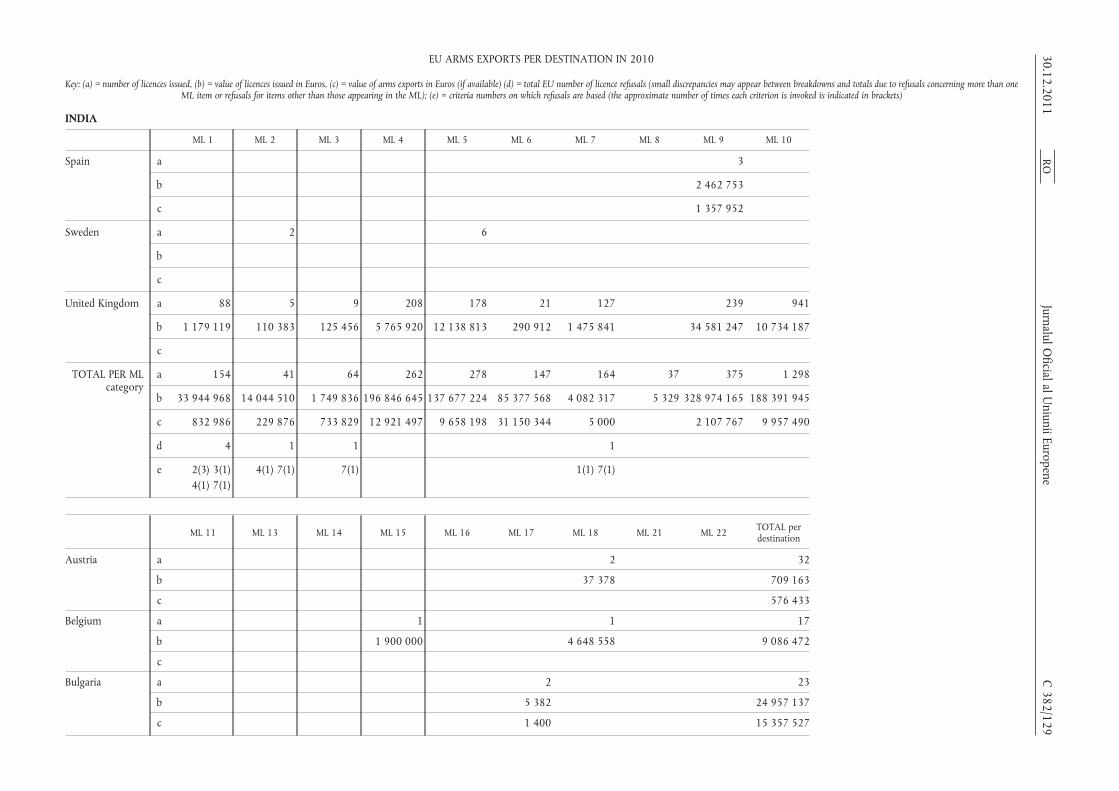
INDIA
ML 1 ML 2 ML 3 ML 4 ML 5 ML 6 ML 7 ML 8 ML 9 ML 10
Spain a 3
b 2 462 753
c 1 357 952
Sweden a 2 6
b
c
United Kingdom a 88 5 9 208 178 21 127 239 941
b 1 179 119 110 383 125 456 5 765 920 12 138 813 290 912 1 475 841 34 581 247 10 734 187
c
TOTAL PER MLcategory
a 154 41 64 262 278 147 164 37 375 1 298
b 33 944 968 14 044 510 1 749 836 196 846 645 137 677 224 85 377 568 4 082 317 5 329 328 974 165 188 391 945
c 832 986 229 876 733 829 12 921 497 9 658 198 31 150 344 5 000 2 107 767 9 957 490
d 4 1 1 1
e 2(3) 3(1)4(1) 7(1)
4(1) 7(1) 7(1) 1(1) 7(1)
ML 11 ML 13 ML 14 ML 15 ML 16 ML 17 ML 18 ML 21 ML 22 TOTAL perdestination
Austria a 2 32
b 37 378 709 163
c 576 433
Belgium a 1 1 17
b 1 900 000 4 648 558 9 086 472
c
Bulgaria a 2 23
b 5 382 24 957 137
c 1 400 15 357 527
30.12.2011RO
Jurnalul OficialalU
niunii EuropeneC
382/129EU ARMS EXPORTS PER DESTINATION IN 2010
Key: (a) = number of licences issued, (b) = value of licences issued in Euros, (c) = value of arms exports in Euros (if available) (d) = total EU number of licence refusals (small discrepancies may appear between breakdowns and totals due to refusals concerning more than oneML item or refusals for items other than those appearing in the ML); (e) = criteria numbers on which refusals are based (the approximate number of times each criterion is invoked is indicated in brackets)

INDIA
ML 11 ML 13 ML 14 ML 15 ML 16 ML 17 ML 18 ML 21 ML 22 TOTAL perdestination
Czech Republic a 1 1 1 30
b 79 515 31 188 781
c 29 382 106
Finland a 1 1 2
b 1 190 5 000 6 190
c 1 190 50 6 240
France a 68 3 1 40 4 13 33 592
b 77 232 325 6 282 536 142 373 32 703 324 838 412 46 889 265 22 001 682 814 217 668
c 301 162 669
Germany a 25 8 7 1 3 12 14 53 395
b 10 695 597 402 562 787 491 12 000 225 930 10 460 764 1 966 393 2 094 504 96 856 031
c
Greece a 3 3
b 108 900 108 900
c
Hungary a 5 7
b 2 650 000 4 200 000
c 581 852 1 031 961
Ireland a 1
b 26 205
c
Italy a 12 1 2 68
b 20 985 377 38 429 4 338 782 147 486 602
c 199 344
Latvia a 4
b 7 114 473
c 7 114 473
C382/130
ROJurnalul O
ficialalUniunii Europene
30.12.2011EU ARMS EXPORTS PER DESTINATION IN 2010
Key: (a) = number of licences issued, (b) = value of licences issued in Euros, (c) = value of arms exports in Euros (if available) (d) = total EU number of licence refusals (small discrepancies may appear between breakdowns and totals due to refusals concerning more than oneML item or refusals for items other than those appearing in the ML); (e) = criteria numbers on which refusals are based (the approximate number of times each criterion is invoked is indicated in brackets)

INDIA
ML 11 ML 13 ML 14 ML 15 ML 16 ML 17 ML 18 ML 21 ML 22 TOTAL perdestination
Lithuania a
b
c 169 222
Netherlands a 22
b 2 688 620
c 40 850 250 8 435 607
Poland a 1 97
b 24 781 22 297 576
c
Romania a 4
b 6 387 267
c 2 223 686
Slovakia a 1 16
b 1 611 661
c 572 271
Slovenia a 1
b 845 582
c 1 995 103
Spain a 4 7
b 10 585 344 13 048 097
c 11 702 730 680 673 13 741 355
Sweden a 8
b 8 487 883
c 73 844 587
30.12.2011RO
Jurnalul OficialalU
niunii EuropeneC
382/131EU ARMS EXPORTS PER DESTINATION IN 2010
Key: (a) = number of licences issued, (b) = value of licences issued in Euros, (c) = value of arms exports in Euros (if available) (d) = total EU number of licence refusals (small discrepancies may appear between breakdowns and totals due to refusals concerning more than oneML item or refusals for items other than those appearing in the ML); (e) = criteria numbers on which refusals are based (the approximate number of times each criterion is invoked is indicated in brackets)

INDIA
ML 11 ML 13 ML 14 ML 15 ML 16 ML 17 ML 18 ML 21 ML 22 TOTAL perdestination
United Kingdom a 551 29 39 36 8 21 41 44 56 2 641
b 16 600 081 254 974 1 574 507 1 797 805 145 854 476 300 1 220 773 502 915 2 640 858 91 615 943
c
TOTAL PER MLcategory
a 666 41 41 88 10 30 57 72 145 3 970
b 138 749 913 6 945 072 1 716 879 37 297 520 182 635 1 546 024 16 446 988 49 397 003 31 075 826 1 282 940 252
c 12 285 772 50 680 673 1 400 40 850 250 455 812 584
d 1 2 1 6 1 19
e 1(1) 2(1) 3(1)7(1)
3(1) 4(1)7(1)
1(1) 3(4)4(4) 7(6)
4(1) 7(1) 1(3) 2(5)3(8) 4(8)
7(14)
INDONESIA
ML 1 ML 2 ML 3 ML 4 ML 5 ML 6 ML 7 ML 8 ML 9 ML 10 ML 11
Austria a 17
b 439 840
c 303 611 971 140
Belgium a 7 3 1 1
b 3 133 766 951 263 2 900 000 23 389
c
Bulgaria a 1 2 4
b 6 000 131 716 312 300
c 2 000 127 716 306 300
Czech Republic a 1 1 1 1 1 2
b 1 266 74 246
c 1 202 29 474 22 917
Denmark a
b
c
C382/132
ROJurnalul O
ficialalUniunii Europene
30.12.2011EU ARMS EXPORTS PER DESTINATION IN 2010
Key: (a) = number of licences issued, (b) = value of licences issued in Euros, (c) = value of arms exports in Euros (if available) (d) = total EU number of licence refusals (small discrepancies may appear between breakdowns and totals due to refusals concerning more than oneML item or refusals for items other than those appearing in the ML); (e) = criteria numbers on which refusals are based (the approximate number of times each criterion is invoked is indicated in brackets)

INDONESIA
ML 1 ML 2 ML 3 ML 4 ML 5 ML 6 ML 7 ML 8 ML 9 ML 10 ML 11
France a 1 1 4 13 7 4 7 18
b 1 014 1 542 006 47 882 283 47 492 762 280 973 389 867 18 798 154 6 124 644
c
Germany a 6 1 3 2 4 2 2 3 6
b 255 465 80 662 202 798 69 386 328 102 136 2 867 144 50 150 1 682 096
c
Italy a
b
c
Netherlands a 2 1
b 3 118 955 1 163
c 107 700 1 121
Poland a 2 4
b 503 369 1 636 804
c
Romania a 2
b 1 010 000
c 1 010 000
Slovakia a 1
b 118 688
c 109 688
Spain a 1 1
b 288 836 115 125
c 466 036 620
30.12.2011RO
Jurnalul OficialalU
niunii EuropeneC
382/133EU ARMS EXPORTS PER DESTINATION IN 2010
Key: (a) = number of licences issued, (b) = value of licences issued in Euros, (c) = value of arms exports in Euros (if available) (d) = total EU number of licence refusals (small discrepancies may appear between breakdowns and totals due to refusals concerning more than oneML item or refusals for items other than those appearing in the ML); (e) = criteria numbers on which refusals are based (the approximate number of times each criterion is invoked is indicated in brackets)

INDONESIA
ML 1 ML 2 ML 3 ML 4 ML 5 ML 6 ML 7 ML 8 ML 9 ML 10 ML 11
United Kingdom a 35 11 8 38 12 171 17 2 270 20
b 828 498 14 157 94 713 370 901 5 002 972 221 667 78 527 770 30 350 658 516 220
c
TOTAL PER MLcategory
a 67 14 16 50 31 184 17 3 8 289 46
b 4 659 848 308 993 2 800 360 48 768 283 56 187 444 949 430 78 527 2 900 136 3 257 781 51 985 443 8 397 206
c 304 813 468 036 1 098 856 306 300 107 700 109 688 29 474 1 011 741 22 917
d 1 1
e 2(1) 3(1) 2(1) 3(1)
ML 13 ML 14 ML 15 ML 17 ML 18 ML 21 ML 22 TOTAL perdestination
Austria a 2 19
b 257 400 697 240
c 250 566 1 525 317
Belgium a 12
b 7 008 418
c
Bulgaria a 7
b 450 016
c 436 016
Czech Republic a 7
b 75 512
c 53 594
Denmark a 1 1
b 1 905 261 1 905 261
c
France a 15 3 2 4 79
b 6 996 815 3 233 266 2 037 760 28 894 134 808 437
c 88 272 020
C382/134
ROJurnalul O
ficialalUniunii Europene
30.12.2011EU ARMS EXPORTS PER DESTINATION IN 2010
Key: (a) = number of licences issued, (b) = value of licences issued in Euros, (c) = value of arms exports in Euros (if available) (d) = total EU number of licence refusals (small discrepancies may appear between breakdowns and totals due to refusals concerning more than oneML item or refusals for items other than those appearing in the ML); (e) = criteria numbers on which refusals are based (the approximate number of times each criterion is invoked is indicated in brackets)

INDONESIA
ML 13 ML 14 ML 15 ML 17 ML 18 ML 21 ML 22 TOTAL perdestination
Germany a 2 2 2 3 38
b 266 137 54 621 100 48 990 5 905 787
c
Italy a
b
c 106 968
Netherlands a 3
b 3 120 118
c 108 821
Poland a 6
b 2 140 173
c
Romania a 2
b 1 010 000
c 1 010 000
Slovakia a 1
b 118 688
c 109 688
Spain a 1 1 4
b 403 961
c 466 656
United Kingdom a 15 44 4 1 2 8 658
b 252 593 449 499 92 400 257 050 7 480 4 152 38 542 257
c
TOTAL PER MLcategory
a 16 45 20 7 3 6 15 837
b 2 157 854 449 499 7 089 215 3 756 803 311 671 2 045 340 82 036 196 185 868
c 250 566 92 089 080
d 1 3
e 2(1) 3(1) 2(3) 3(3)
30.12.2011RO
Jurnalul OficialalU
niunii EuropeneC
382/135EU ARMS EXPORTS PER DESTINATION IN 2010
Key: (a) = number of licences issued, (b) = value of licences issued in Euros, (c) = value of arms exports in Euros (if available) (d) = total EU number of licence refusals (small discrepancies may appear between breakdowns and totals due to refusals concerning more than oneML item or refusals for items other than those appearing in the ML); (e) = criteria numbers on which refusals are based (the approximate number of times each criterion is invoked is indicated in brackets)

IRELAND
ML 1 ML 2 ML 3 ML 4 ML 5 ML 6 ML 7 ML 8 ML 10 ML 11 ML 13 ML 14
Austria a 2 3
b 55 536 4 232 821
c 55 536 2 508 000
Belgium a 2 3
b 373 194 1 698 250
c
Czech Republic a
b
c 16 758
Finland a 1 2 2
b 285 000 426 500 29 205
c 14 675
France a 2 2
b 916 683 4 077 106
c
Germany a 2 1 10 3
b 21 739 120 000 1 560 553 126 541
c
Ireland a 1
b 186 200
c
Italy a 1 2 1
b 961 005 9 177 553 555 952
c
C382/136
ROJurnalul O
ficialalUniunii Europene
30.12.2011EU ARMS EXPORTS PER DESTINATION IN 2010
Key: (a) = number of licences issued, (b) = value of licences issued in Euros, (c) = value of arms exports in Euros (if available) (d) = total EU number of licence refusals (small discrepancies may appear between breakdowns and totals due to refusals concerning more than oneML item or refusals for items other than those appearing in the ML); (e) = criteria numbers on which refusals are based (the approximate number of times each criterion is invoked is indicated in brackets)

IRELAND
ML 1 ML 2 ML 3 ML 4 ML 5 ML 6 ML 7 ML 8 ML 10 ML 11 ML 13 ML 14
Netherlands a
b
c 9 890
Romania a 1
b 25 000
c 9 339
Spain a 3 5 1 1
b 1 999 370 2 570 000
c 899 370 3 807 100
Sweden a 2 2 1
b
c
United Kingdom a 94 1 5 2 4 22 4 5
b 990 544 9 900 1 067 443 2 200 353 841 119 484 95 463 4 510
c
TOTAL PER MLcategory
a 102 7 15 10 3 14 22 5 1 8 4 2
b 1 751 013 5 203 726 5 191 563 11 935 953 1 036 683 1 914 394 119 484 95 463 131 051 4 106 311 555 952
c 89 440 2 508 000 899 370 3 807 100 16 758
d
e
ML 15 ML 17 ML 18 ML 21 ML 22 TOTAL perdestination
Austria a 5
b 4 288 357
c 2 563 536
Belgium a 5
b 2 071 444
c
30.12.2011RO
Jurnalul OficialalU
niunii EuropeneC
382/137EU ARMS EXPORTS PER DESTINATION IN 2010
Key: (a) = number of licences issued, (b) = value of licences issued in Euros, (c) = value of arms exports in Euros (if available) (d) = total EU number of licence refusals (small discrepancies may appear between breakdowns and totals due to refusals concerning more than oneML item or refusals for items other than those appearing in the ML); (e) = criteria numbers on which refusals are based (the approximate number of times each criterion is invoked is indicated in brackets)

IRELAND
ML 15 ML 17 ML 18 ML 21 ML 22 TOTAL perdestination
Czech Republic a
b
c 16 758
Finland a 5
b 740 705
c 14 675
France a 1 5
b 191 864 5 185 653
c 702 092
Germany a 2 1 19
b 85 319 3 900 1 918 052
c
Ireland a 1
b 186 200
c
Italy a 4
b 10 694 511
c 3 773 254
Netherlands a
b
c 9 890
Romania a 1
b 25 000
c 9 339
Spain a 10
b 4 569 370
c 4 706 470
C382/138
ROJurnalul O
ficialalUniunii Europene
30.12.2011EU ARMS EXPORTS PER DESTINATION IN 2010
Key: (a) = number of licences issued, (b) = value of licences issued in Euros, (c) = value of arms exports in Euros (if available) (d) = total EU number of licence refusals (small discrepancies may appear between breakdowns and totals due to refusals concerning more than oneML item or refusals for items other than those appearing in the ML); (e) = criteria numbers on which refusals are based (the approximate number of times each criterion is invoked is indicated in brackets)

IRELAND
ML 15 ML 17 ML 18 ML 21 ML 22 TOTAL perdestination
Sweden a 5
b 2 546 365
c 2 652 464
United Kingdom a 5 1 5 148
b 83 600 110 331 2 727 427
c
TOTAL PER MLcategory
a 6 2 1 1 5 208
b 275 464 85 319 3 900 110 331 34 953 084
c 14 448 478
d
e
ISRAEL
ML 1 ML 2 ML 3 ML 4 ML 5 ML 6 ML 7 ML 8 ML 9 ML 10 ML 11
Austria a 1 1 1
b 84 600 10 000 384 000
c 129 600
Belgium a 1 1 3 3
b 17 250 2 950 433 405 1 153 651
c
Bulgaria a 2 4 4 2 1
b 3 341 145 117 932 1 286 609 126 550 10 680
c 387 791 85 480 1 371 933 106 950 10 680 200
Czech Republic a 1 4 2 9 1 2 5
b 16 353 167 088 40 650 1 180 433 7 513 106 676 12 099
c 11 800 90 732 2 420 871 487 4 906 109 359 23 582
30.12.2011RO
JurnalulOficialalU
niuniiEuropeneC
382/139EU ARMS EXPORTS PER DESTINATION IN 2010
Key: (a) = number of licences issued, (b) = value of licences issued in Euros, (c) = value of arms exports in Euros (if available) (d) = total EU number of licence refusals (small discrepancies may appear between breakdowns and totals due to refusals concerning more than oneML item or refusals for items other than those appearing in the ML); (e) = criteria numbers on which refusals are based (the approximate number of times each criterion is invoked is indicated in brackets)

ISRAEL
ML 1 ML 2 ML 3 ML 4 ML 5 ML 6 ML 7 ML 8 ML 9 ML 10 ML 11
Denmark a
b
c
Finland a 1
b 7 930
c
France a 4 1 7 9 7 4 58 19
b 1 522 071 3 211 1 992 785 1 920 846 5 895 670 374 078 10 071 146 4 050 262
c
Germany a 4 8 9 5 9 32 14 7 55 3 24
b 9 137 53 729 723 730 259 405 424 520 16 919 454 646 517 1 630 4 630 663 85 155 2 871 539
c
Greece a 2 1
b 3 074 680 286 415
c
Hungary a 1 1
b 450 000 192 000
c 37 868 180 896
Ireland a
b
c
Italy a 2 5
b 204 109 697 855
c
Netherlands a 1
b 18 918
c
C382/140
ROJurnalul O
ficialalUniunii Europene
30.12.2011EU ARMS EXPORTS PER DESTINATION IN 2010
Key: (a) = number of licences issued, (b) = value of licences issued in Euros, (c) = value of arms exports in Euros (if available) (d) = total EU number of licence refusals (small discrepancies may appear between breakdowns and totals due to refusals concerning more than oneML item or refusals for items other than those appearing in the ML); (e) = criteria numbers on which refusals are based (the approximate number of times each criterion is invoked is indicated in brackets)

ISRAEL
ML 1 ML 2 ML 3 ML 4 ML 5 ML 6 ML 7 ML 8 ML 9 ML 10 ML 11
Poland a 1 2 1
b 1 209 566 191 520 1 137 240
c
Romania a 1 3 2 2 4 2
b 32 511 608 939 1 056 570 5 645 329 416 618 1 294 222
c 32 511 415 651 273 980 4 593 130 509 960 1 123 470
Slovakia a 1
b
c
Slovenia a 1 3
b 70 000 545 908
c 70 000 545 908
Spain a 1 9 2 2 3
b 135 400 7 200 3 000 000 2 600 000 24 000
c 16 139 135 400 1 255 200 1 496
United Kingdom a 9 1 5 8 30 6 6 8 94 60
b 3 461 11 64 948 480 977 867 126 348 334 29 884 93 332 2 215 284 1 461 082
c
TOTAL PER MLcategory
a 23 13 27 40 53 64 25 12 64 172 115
b 6 568 982 171 672 2 617 606 6 782 706 4 534 012 33 630 408 1 060 478 1 579 788 4 742 913 17 632 799 10 105 135
c 453 598 85 480 1 630 576 1 780 221 524 876 6 021 205 5 106 620 815 1 276 652
d 1 2 2 2 1 3 3
e 2(1) 4(1) 3(1) 4(1)7(1)
2(2) 3(1) 2(2) 3(1)7(1)
2(1) 3(1) 2(2) 3(2)(1)
2(1) 3(1)4(2)
30.12.2011RO
Jurnalul OficialalU
niunii EuropeneC
382/141EU ARMS EXPORTS PER DESTINATION IN 2010
Key: (a) = number of licences issued, (b) = value of licences issued in Euros, (c) = value of arms exports in Euros (if available) (d) = total EU number of licence refusals (small discrepancies may appear between breakdowns and totals due to refusals concerning more than oneML item or refusals for items other than those appearing in the ML); (e) = criteria numbers on which refusals are based (the approximate number of times each criterion is invoked is indicated in brackets)

ISRAEL
ML 12 ML 13 ML 14 ML 15 ML 16 ML 17 ML 18 ML 21 ML 22 TOTAL perdestination
Austria a 1 4
b 5 000 483 600
c 129 600
Belgium a 3 11
b 669 920 2 277 176
c
Bulgaria a 1 14
b 3 622 4 886 538
c 3 421 1 966 454
Czech Republic a 9 4 37
b 1 981 122 75 639 3 587 573
c 221 937 83 584 20 085 1 439 892
Denmark a 3 3
b 228 180 228 180
c
Finland a 1
b 7 930
c
France a 1 5 14 129
b 2 735 817 981 054 3 283 756 32 830 695
c 35 237 103
Germany a 5 1 5 2 3 8 8 18 220
b 22 155 188 120 1 538 613 12 200 38 964 102 946 1 894 960 1 196 981 31 620 418
c
Greece a 3
b 3 361 095
c
C382/142
ROJurnalul O
ficialalUniunii Europene
30.12.2011EU ARMS EXPORTS PER DESTINATION IN 2010
Key: (a) = number of licences issued, (b) = value of licences issued in Euros, (c) = value of arms exports in Euros (if available) (d) = total EU number of licence refusals (small discrepancies may appear between breakdowns and totals due to refusals concerning more than oneML item or refusals for items other than those appearing in the ML); (e) = criteria numbers on which refusals are based (the approximate number of times each criterion is invoked is indicated in brackets)

ISRAEL
ML 12 ML 13 ML 14 ML 15 ML 16 ML 17 ML 18 ML 21 ML 22 TOTAL perdestination
Hungary a 2
b 642 000
c 218 764
Ireland a 2 2
b 24 750 24 750
c
Italy a 6 13
b 413 557 1 315 521
c 161 811
Netherlands a 1 1 2 5
b 4 000 284 111 410 000 717 029
c 284 111 2 500 286 611
Poland a 1 5
b 79 500 2 617 826
c
Romania a 2 1 3 1 1 1 23
b 3 094 214 146 187 1 902 391 655 192 357 583 5 771 15 215 527
c 2 428 364 146 187 1 106 820 366 514 202 397 5 771 11 204 755
Slovakia a 1 2
b 100 000 100 000
c 91 753 91 753
Slovenia a 4
b 615 908
c 615 908
Spain a 1 18
b 5 766 600
c 20 800 1 429 035
30.12.2011RO
Jurnalul OficialalU
niunii EuropeneC
382/143EU ARMS EXPORTS PER DESTINATION IN 2010
Key: (a) = number of licences issued, (b) = value of licences issued in Euros, (c) = value of arms exports in Euros (if available) (d) = total EU number of licence refusals (small discrepancies may appear between breakdowns and totals due to refusals concerning more than oneML item or refusals for items other than those appearing in the ML); (e) = criteria numbers on which refusals are based (the approximate number of times each criterion is invoked is indicated in brackets)

ISRAEL
ML 12 ML 13 ML 14 ML 15 ML 16 ML 17 ML 18 ML 21 ML 22 TOTAL perdestination
United Kingdom a 4 61 1 1 4 9 5 312
b 41 153 1 163 738 7 333 396 000 73 414 33 648 11 651 7 291 374
c
TOTAL PER MLcategory
a 1 17 62 35 11 8 18 18 30 808
b 2 735 817 1 272 542 1 351 858 10 574 957 655 066 2 341 355 1 191 302 2 286 191 1 754 153 113 589 740
c 2 671 101 149 608 1 106 820 734 209 202 397 120 109 52 781 686
d 1 1 1 1 1 1 20
e 4(1) 7(1) 3(1) 4(1) 3(1) 4(1) 2(1) 3(1) 3(1) 4(1) 2(10) 3(11)4(9) 7(3)
ITALY
ML 1 ML 2 ML 3 ML 4 ML 5 ML 6 ML 7 ML 8 ML 9 ML 10
Austria a 19 3 1
b 363 434 9 092 834 6 281
c 420 178 8 300 303 450 142
Belgium a 22 2 1 1 21
b 1 583 472 35 125 2 571 660 950 000 3 378 740
c
Bulgaria a 1
b 24 500
c 391 570
Denmark a 1 1 5
b 960 559 1 097 359
c
Finland a 3 3 1 1
b 31 206 837 545 164 000 3 795
c 36 134 82 237 246 400 3 915
C382/144
ROJurnalul O
ficialalUniunii Europene
30.12.2011EU ARMS EXPORTS PER DESTINATION IN 2010
Key: (a) = number of licences issued, (b) = value of licences issued in Euros, (c) = value of arms exports in Euros (if available) (d) = total EU number of licence refusals (small discrepancies may appear between breakdowns and totals due to refusals concerning more than oneML item or refusals for items other than those appearing in the ML); (e) = criteria numbers on which refusals are based (the approximate number of times each criterion is invoked is indicated in brackets)

ITALY
ML 1 ML 2 ML 3 ML 4 ML 5 ML 6 ML 7 ML 8 ML 9 ML 10
France a 5 2 4 30 14 11 11 7 133
b 56 674 12 698 947 7 531 588 50 465 707 6 663 610 565 159 5 762 180 1 338 820 10 842 697
c
Germany a 17 17 30 10 28 138 9 26 64
b 760 423 5 210 088 17 471 876 512 422 5 567 866 20 470 092 28 831 25 284 409 19 936 580
c
Greece a 3
b 7 034 401
c
Hungary a 3 3 1
b 94 440 1 649 000 553 000
c 4 440 141 157 553 000
Malta a 3
b 1 000
c 1 000
Netherlands a 8 2 1 3
b 48 945 40 000 38 600 1 471 490
c 20 545 363 267 88 440 282 000 702 355
Poland a 1 1
b 5 200 37 350
c
Romania a 1 2
b 50 000 390 500
c 36 049 104 760 109 340
Spain a 7 6 18 4 6 41
b 26 904 235 650 250 000 128 130 7 000 000
c 26 904 474 850 57 331 422
30.12.2011RO
Jurnalul OficialalU
niunii EuropeneC
382/145EU ARMS EXPORTS PER DESTINATION IN 2010
Key: (a) = number of licences issued, (b) = value of licences issued in Euros, (c) = value of arms exports in Euros (if available) (d) = total EU number of licence refusals (small discrepancies may appear between breakdowns and totals due to refusals concerning more than oneML item or refusals for items other than those appearing in the ML); (e) = criteria numbers on which refusals are based (the approximate number of times each criterion is invoked is indicated in brackets)
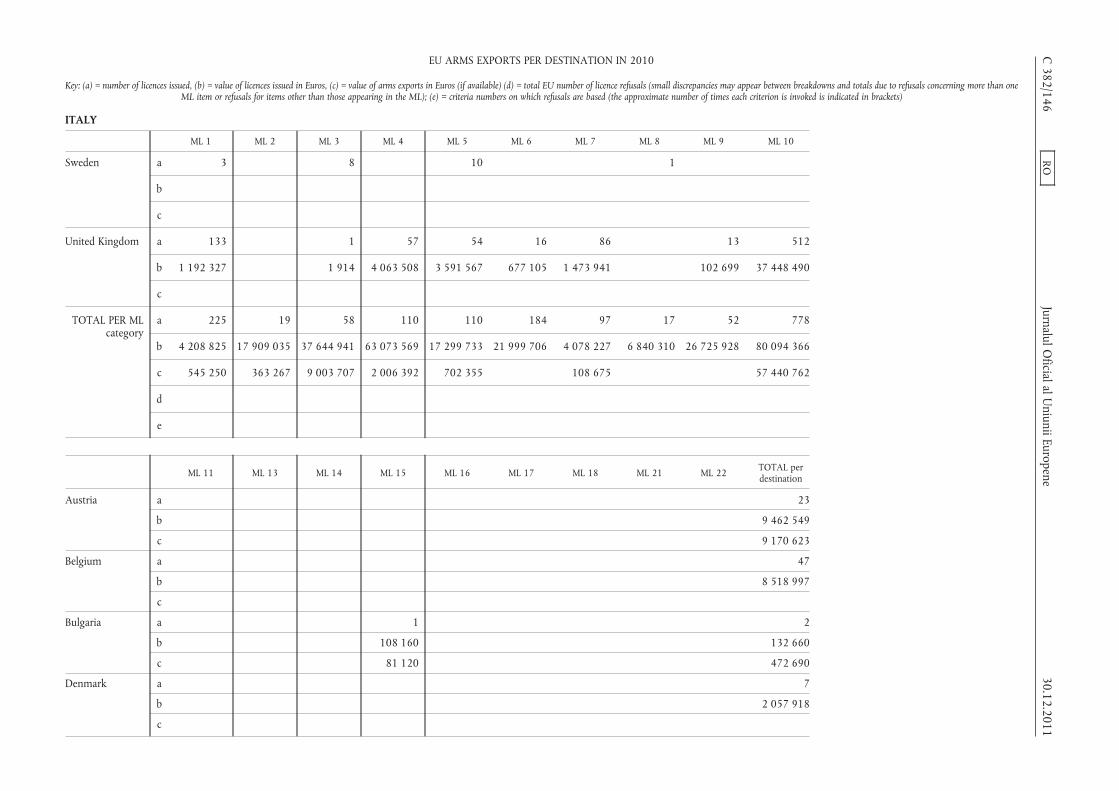
ITALY
ML 1 ML 2 ML 3 ML 4 ML 5 ML 6 ML 7 ML 8 ML 9 ML 10
Sweden a 3 8 10 1
b
c
United Kingdom a 133 1 57 54 16 86 13 512
b 1 192 327 1 914 4 063 508 3 591 567 677 105 1 473 941 102 699 37 448 490
c
TOTAL PER MLcategory
a 225 19 58 110 110 184 97 17 52 778
b 4 208 825 17 909 035 37 644 941 63 073 569 17 299 733 21 999 706 4 078 227 6 840 310 26 725 928 80 094 366
c 545 250 363 267 9 003 707 2 006 392 702 355 108 675 57 440 762
d
e
ML 11 ML 13 ML 14 ML 15 ML 16 ML 17 ML 18 ML 21 ML 22 TOTAL perdestination
Austria a 23
b 9 462 549
c 9 170 623
Belgium a 47
b 8 518 997
c
Bulgaria a 1 2
b 108 160 132 660
c 81 120 472 690
Denmark a 7
b 2 057 918
c
C382/146
ROJurnalul O
ficialalUniunii Europene
30.12.2011EU ARMS EXPORTS PER DESTINATION IN 2010
Key: (a) = number of licences issued, (b) = value of licences issued in Euros, (c) = value of arms exports in Euros (if available) (d) = total EU number of licence refusals (small discrepancies may appear between breakdowns and totals due to refusals concerning more than oneML item or refusals for items other than those appearing in the ML); (e) = criteria numbers on which refusals are based (the approximate number of times each criterion is invoked is indicated in brackets)

ITALY
ML 11 ML 13 ML 14 ML 15 ML 16 ML 17 ML 18 ML 21 ML 22 TOTAL perdestination
Finland a 4 12
b 122 952 1 159 498
c 56 974 425 660
France a 28 8 1 25 1 3 1 9 293
b 3 315 907 9 847 327 8 479 657 16 052 341 297 133 944 489 25 615 424 270 888 160 748 547
c 56 541 192
Germany a 118 1 6 19 40 11 26 36 46 642
b 52 586 967 2 240 000 10 589 324 1 558 108 4 369 505 1 031 242 547 840 1 760 341 13 829 589 183 755 503
c
Greece a 3
b 7 034 401
c
Hungary a 7
b 2 296 440
c 698 597
Malta a 3
b 1 000
c 1 000
Netherlands a 2 1 17
b 127 500 10 000 1 736 535
c 164 351 1 620 958
Poland a 4 6
b 10 844 635 10 887 185
c
Romania a 3
b 440 500
c 250 149
30.12.2011RO
Jurnalul OficialalU
niunii EuropeneC
382/147EU ARMS EXPORTS PER DESTINATION IN 2010
Key: (a) = number of licences issued, (b) = value of licences issued in Euros, (c) = value of arms exports in Euros (if available) (d) = total EU number of licence refusals (small discrepancies may appear between breakdowns and totals due to refusals concerning more than oneML item or refusals for items other than those appearing in the ML); (e) = criteria numbers on which refusals are based (the approximate number of times each criterion is invoked is indicated in brackets)

ITALY
ML 11 ML 13 ML 14 ML 15 ML 16 ML 17 ML 18 ML 21 ML 22 TOTAL perdestination
Spain a 9 3 94
b 47 924 9 335 100 17 023 708
c 14 066 621 71 899 797
Sweden a 22
b 11 352 544
c 13 792 811
United Kingdom a 32 7 20 5 7 39 17 86 1 085
b 528 573 53 136 956 193 258 500 2 142 067 116 820 1 577 114 397 293 54 581 247
c
TOTAL PER MLcategory
a 187 24 27 55 48 14 65 54 142 2 266
b 56 479 371 23 108 049 20 025 175 27 439 709 6 808 706 1 975 731 664 660 28 952 879 14 507 770 471 189 232
c 56 974 14 312 092 154 873 477
d
e
JAMAICA
ML 1 ML 3 ML 4 TOTAL perdestination
Belgium a 2 2
b 30 982 30 982
c
United Kingdom a 1 7 3 11
b 43 641 107 246 3 977 154 864
c
TOTAL PER MLcategory
a 3 7 3 13
b 74 623 107 246 3 977 185 846
c
d
e
C382/148
ROJurnalul O
ficialalUniunii Europene
30.12.2011EU ARMS EXPORTS PER DESTINATION IN 2010
Key: (a) = number of licences issued, (b) = value of licences issued in Euros, (c) = value of arms exports in Euros (if available) (d) = total EU number of licence refusals (small discrepancies may appear between breakdowns and totals due to refusals concerning more than oneML item or refusals for items other than those appearing in the ML); (e) = criteria numbers on which refusals are based (the approximate number of times each criterion is invoked is indicated in brackets)

JAPAN
ML 1 ML 2 ML 3 ML 4 ML 5 ML 6 ML 7 ML 8 ML 9 ML 10 ML 11
Austria a 1 1 1 2
b 49 000 86 736 1 078 080 322 905
c 86 736 1 078 080 258 432
Belgium a 14
b 201 058
c
Denmark a 2
b 4 504 871
c
Finland a 1
b 553 000
c 528 49 000
France a 11 12 5 1 1 12 6
b 2 815 378 638 313 249 966 512 293 514 492 6 714 425 81 533
c
Germany a 47 3 18 3 1 4 1 5 9 15
b 896 526 90 592 3 022 362 152 143 39 258 94 683 76 488 749 1 374 017 1 228 227
c
Greece a
b
c
Ireland a 1
b 25 000
c
Italy a 1 4 2
b 192 530 681 516 811 388
c
30.12.2011RO
Jurnalul OficialalU
niunii EuropeneC
382/149EU ARMS EXPORTS PER DESTINATION IN 2010
Key: (a) = number of licences issued, (b) = value of licences issued in Euros, (c) = value of arms exports in Euros (if available) (d) = total EU number of licence refusals (small discrepancies may appear between breakdowns and totals due to refusals concerning more than oneML item or refusals for items other than those appearing in the ML); (e) = criteria numbers on which refusals are based (the approximate number of times each criterion is invoked is indicated in brackets)

JAPAN
ML 1 ML 2 ML 3 ML 4 ML 5 ML 6 ML 7 ML 8 ML 9 ML 10 ML 11
Latvia a 1
b 136 803
c 136 803
Netherlands a 2 2
b 411 203 15 992 150
c 4 743 490
Poland a 1
b 849 398
c
Spain a 2
b 37 500
c
Sweden a 10 6 2
b
c
United Kingdom a 68 2 1 6 14 37 1 12 12
b 1 381 797 24 478 5 128 346 233 483 334 343 642 185 308 433 103 756
c
TOTAL PER MLcategory
a 131 19 38 24 24 5 38 9 1 39 35
b 2 665 184 805 539 7 473 948 2 308 992 21 269 579 119 683 343 718 1 001 227 514 492 9 115 890 2 224 903
c 136 803 86 736 1 078 608 258 432 4 743 490 49 000
d
e
C382/150
ROJurnalul O
ficialalUniunii Europene
30.12.2011EU ARMS EXPORTS PER DESTINATION IN 2010
Key: (a) = number of licences issued, (b) = value of licences issued in Euros, (c) = value of arms exports in Euros (if available) (d) = total EU number of licence refusals (small discrepancies may appear between breakdowns and totals due to refusals concerning more than oneML item or refusals for items other than those appearing in the ML); (e) = criteria numbers on which refusals are based (the approximate number of times each criterion is invoked is indicated in brackets)

JAPAN
ML 13 ML 14 ML 15 ML 16 ML 17 ML 18 ML 21 ML 22 TOTAL perdestination
Austria a 7 12
b 122 810 1 659 531
c 122 810 1 546 058
Belgium a 14
b 201 058
c
Denmark a 2
b 4 504 871
c
Finland a 2 3
b 29 205 582 205
c 49 528
France a 22 2 72
b 9 434 895 216 086 21 177 380
c 15 837 464
Germany a 5 16 1 10 4 11 153
b 1 220 556 3 030 620 43 203 2 052 785 52 747 1 944 611 15 731 155
c
Greece a 1 1
b 50 50
c
Ireland a 1
b 25 000
c
Italy a 7
b 1 685 434
c 635 484
30.12.2011RO
Jurnalul OficialalU
niunii EuropeneC
382/151EU ARMS EXPORTS PER DESTINATION IN 2010
Key: (a) = number of licences issued, (b) = value of licences issued in Euros, (c) = value of arms exports in Euros (if available) (d) = total EU number of licence refusals (small discrepancies may appear between breakdowns and totals due to refusals concerning more than oneML item or refusals for items other than those appearing in the ML); (e) = criteria numbers on which refusals are based (the approximate number of times each criterion is invoked is indicated in brackets)

JAPAN
ML 13 ML 14 ML 15 ML 16 ML 17 ML 18 ML 21 ML 22 TOTAL perdestination
Latvia a 1
b 136 803
c 136 803
Netherlands a 4
b 16 403 353
c 4 743 490
Poland a 1
b 849 398
c
Spain a 2
b 37 500
c
Sweden a 1 19
b 8 487 883
c 3 182 956
United Kingdom a 3 8 1 1 6 2 174
b 34 167 300 553 1 031 921 4 111 41 467 7 139 4 416 343
c
TOTAL PER MLcategory
a 2 8 46 1 3 18 10 15 466
b 29 205 1 254 723 12 766 068 1 031 921 47 364 2 175 595 94 214 2 167 836 75 897 964
c 122 810 26 131 783
d
e
C382/152
ROJurnalul O
ficialalUniunii Europene
30.12.2011EU ARMS EXPORTS PER DESTINATION IN 2010
Key: (a) = number of licences issued, (b) = value of licences issued in Euros, (c) = value of arms exports in Euros (if available) (d) = total EU number of licence refusals (small discrepancies may appear between breakdowns and totals due to refusals concerning more than oneML item or refusals for items other than those appearing in the ML); (e) = criteria numbers on which refusals are based (the approximate number of times each criterion is invoked is indicated in brackets)
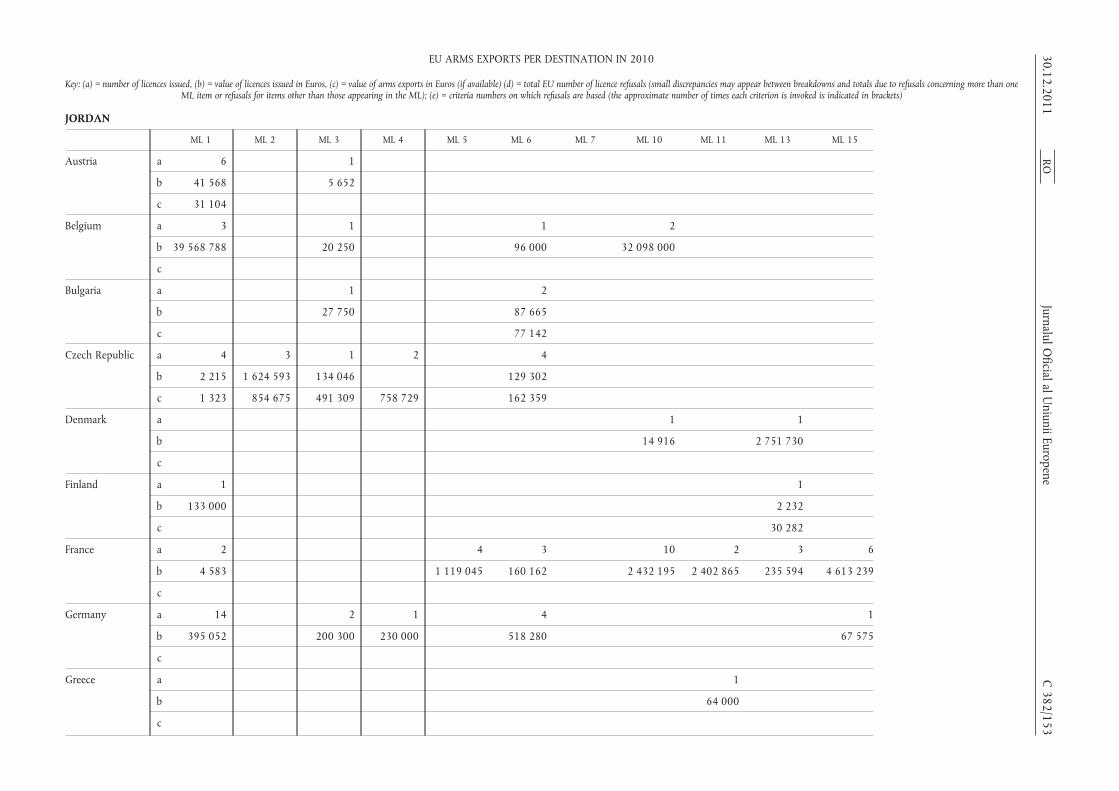
JORDAN
ML 1 ML 2 ML 3 ML 4 ML 5 ML 6 ML 7 ML 10 ML 11 ML 13 ML 15
Austria a 6 1
b 41 568 5 652
c 31 104
Belgium a 3 1 1 2
b 39 568 788 20 250 96 000 32 098 000
c
Bulgaria a 1 2
b 27 750 87 665
c 77 142
Czech Republic a 4 3 1 2 4
b 2 215 1 624 593 134 046 129 302
c 1 323 854 675 491 309 758 729 162 359
Denmark a 1 1
b 14 916 2 751 730
c
Finland a 1 1
b 133 000 2 232
c 30 282
France a 2 4 3 10 2 3 6
b 4 583 1 119 045 160 162 2 432 195 2 402 865 235 594 4 613 239
c
Germany a 14 2 1 4 1
b 395 052 200 300 230 000 518 280 67 575
c
Greece a 1
b 64 000
c
30.12.2011RO
Jurnalul OficialalU
niunii EuropeneC
382/153EU ARMS EXPORTS PER DESTINATION IN 2010
Key: (a) = number of licences issued, (b) = value of licences issued in Euros, (c) = value of arms exports in Euros (if available) (d) = total EU number of licence refusals (small discrepancies may appear between breakdowns and totals due to refusals concerning more than oneML item or refusals for items other than those appearing in the ML); (e) = criteria numbers on which refusals are based (the approximate number of times each criterion is invoked is indicated in brackets)

JORDAN
ML 1 ML 2 ML 3 ML 4 ML 5 ML 6 ML 7 ML 10 ML 11 ML 13 ML 15
Italy a
b
c
Netherlands a 1 1
b 1 361 466 28 368 000
c 4 980 733 60 049
Poland a 1
b 9 570
c
Slovakia a 2
b 63 119
c 19 619
Spain a 2
b 23 908 884
c 199 000 1 416 339
Sweden a 1 1
b
c
United Kingdom a 137 6 9 3 9 10 15 8 16 8 14
b 5 984 297 95 810 884 356 14 290 264 564 1 521 137 105 945 49 201 181 402 54 012 326 700
c
TOTAL PER MLcategory
a 168 9 16 6 15 27 15 23 19 13 21
b 46 129 503 1 720 403 1 281 924 244 290 2 745 075 30 943 664 105 945 58 503 196 2 648 267 3 043 569 5 007 514
c 32 427 854 675 491 309 957 729 4 980 733 259 120 1 476 388 30 282
d 1
e 7(1)
C382/154
ROJurnalul O
ficialalUniunii Europene
30.12.2011EU ARMS EXPORTS PER DESTINATION IN 2010
Key: (a) = number of licences issued, (b) = value of licences issued in Euros, (c) = value of arms exports in Euros (if available) (d) = total EU number of licence refusals (small discrepancies may appear between breakdowns and totals due to refusals concerning more than oneML item or refusals for items other than those appearing in the ML); (e) = criteria numbers on which refusals are based (the approximate number of times each criterion is invoked is indicated in brackets)

JORDAN
ML 17 ML 18 ML 21 ML 22 TOTAL perdestination
Austria a 7
b 47 220
c 31 104
Belgium a 7
b 71 783 038
c
Bulgaria a 3
b 115 415
c 77 142
Czech Republic a 1 15
b 1 890 156
c 2 268 395
Denmark a 2 4
b 192 031 2 958 677
c
Finland a 2
b 135 232
c 30 282
France a 4 34
b 2 223 468 13 191 151
c 777 075
Germany a 1 23
b 829 1 412 036
c
Greece a 1
b 64 000
c
30.12.2011RO
Jurnalul OficialalU
niunii EuropeneC
382/155EU ARMS EXPORTS PER DESTINATION IN 2010
Key: (a) = number of licences issued, (b) = value of licences issued in Euros, (c) = value of arms exports in Euros (if available) (d) = total EU number of licence refusals (small discrepancies may appear between breakdowns and totals due to refusals concerning more than oneML item or refusals for items other than those appearing in the ML); (e) = criteria numbers on which refusals are based (the approximate number of times each criterion is invoked is indicated in brackets)
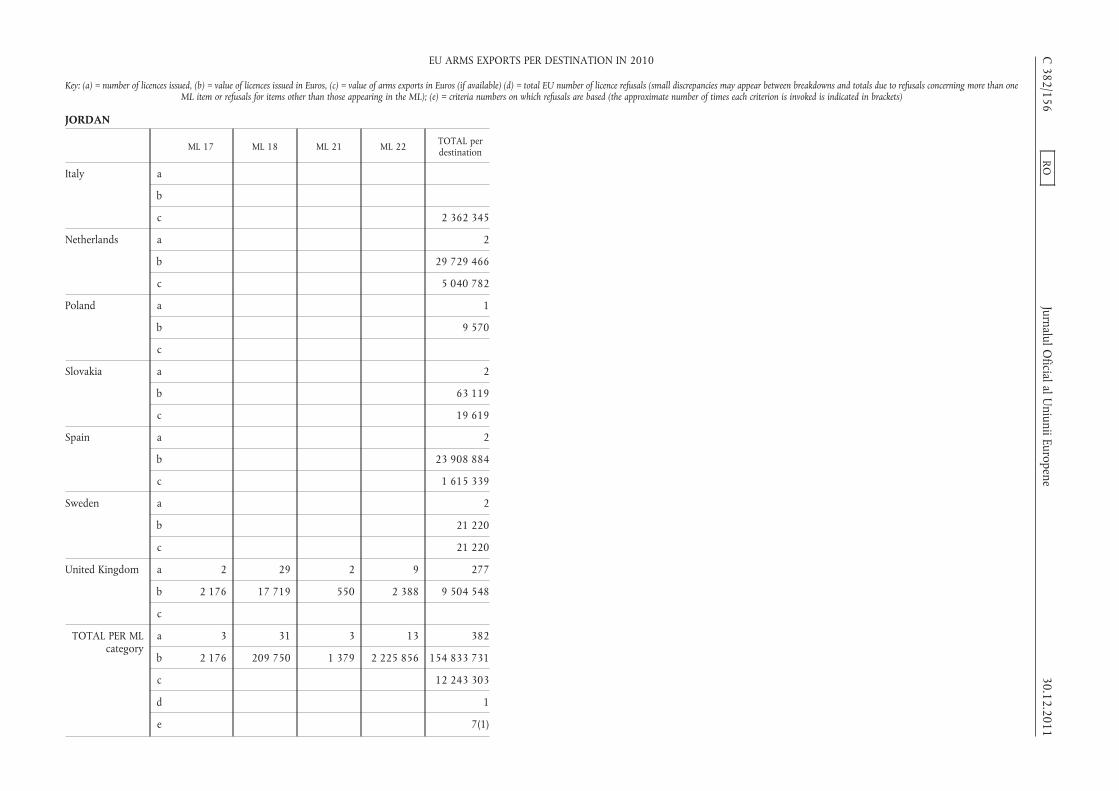
JORDAN
ML 17 ML 18 ML 21 ML 22 TOTAL perdestination
Italy a
b
c 2 362 345
Netherlands a 2
b 29 729 466
c 5 040 782
Poland a 1
b 9 570
c
Slovakia a 2
b 63 119
c 19 619
Spain a 2
b 23 908 884
c 1 615 339
Sweden a 2
b 21 220
c 21 220
United Kingdom a 2 29 2 9 277
b 2 176 17 719 550 2 388 9 504 548
c
TOTAL PER MLcategory
a 3 31 3 13 382
b 2 176 209 750 1 379 2 225 856 154 833 731
c 12 243 303
d 1
e 7(1)
C382/156
ROJurnalul O
ficialalUniunii Europene
30.12.2011EU ARMS EXPORTS PER DESTINATION IN 2010
Key: (a) = number of licences issued, (b) = value of licences issued in Euros, (c) = value of arms exports in Euros (if available) (d) = total EU number of licence refusals (small discrepancies may appear between breakdowns and totals due to refusals concerning more than oneML item or refusals for items other than those appearing in the ML); (e) = criteria numbers on which refusals are based (the approximate number of times each criterion is invoked is indicated in brackets)

KAZAKHSTAN
ML 1 ML 2 ML 3 ML 4 ML 5 ML 6 ML 7 ML 8 ML 10 ML 11 ML 13 ML 14
Austria a 9 2
b 663 200 704
c 377 219 352
Bulgaria a 3 4 1
b 110 169 2 167 520 16 345
c 118 169 1 537 315 16 345 72 000
Czech Republic a 2
b 197 707
c 40 618
France a 2 5 1 22 2
b 20 211 1 799 775 216 545 22 411 733 43 309
c
Germany a 69 23 6 1
b 1 428 555 162 700 2 097 580 75 600
c
Italy a
b
c
Romania a 1 1
b 290 90 337
c 290 90 337
Slovakia a 1 1 1 1
b 1 189 574 57 100
c 1 102 907 33 800
30.12.2011RO
Jurnalul OficialalU
niunii EuropeneC
382/157EU ARMS EXPORTS PER DESTINATION IN 2010
Key: (a) = number of licences issued, (b) = value of licences issued in Euros, (c) = value of arms exports in Euros (if available) (d) = total EU number of licence refusals (small discrepancies may appear between breakdowns and totals due to refusals concerning more than oneML item or refusals for items other than those appearing in the ML); (e) = criteria numbers on which refusals are based (the approximate number of times each criterion is invoked is indicated in brackets)

KAZAKHSTAN
ML 1 ML 2 ML 3 ML 4 ML 5 ML 6 ML 7 ML 8 ML 10 ML 11 ML 13 ML 14
Sweden a
b
c
United Kingdom a 2 2 3 5 1 2
b 5 280 176 000 8 864 1 849 1 970 51 511
c
TOTAL PER MLcategory
a 85 3 32 4 6 1 5 6 3 23 4 1
b 2 315 243 110 169 2 597 261 25 209 1 799 775 1 849 2 097 580 1 481 719 22 413 703 94 820 57 100
c 418 127 118 169 1 628 004 16 345 72 000 1 102 907 33 800
d 3 2 1
e 7(3) 7(2) 7(1)
ML 15 ML 17 ML 18 ML 21 ML 22 TOTAL perdestination
Austria a 11
b 663 904
c 377 571
Bulgaria a 8
b 2 294 034
c 428 510 89 545 2 261 884
Czech Republic a 2
b 197 707
c 40 618
France a 9 1 42
b 4 719 231 43 309 29 254 113
c 8 623 206
C382/158
ROJurnalul O
ficialalUniunii Europene
30.12.2011EU ARMS EXPORTS PER DESTINATION IN 2010
Key: (a) = number of licences issued, (b) = value of licences issued in Euros, (c) = value of arms exports in Euros (if available) (d) = total EU number of licence refusals (small discrepancies may appear between breakdowns and totals due to refusals concerning more than oneML item or refusals for items other than those appearing in the ML); (e) = criteria numbers on which refusals are based (the approximate number of times each criterion is invoked is indicated in brackets)

KAZAKHSTAN
ML 15 ML 17 ML 18 ML 21 ML 22 TOTAL perdestination
Germany a 1 100
b 190 051 3 954 486
c
Italy a
b
c 254 433
Romania a 2
b 90 627
c 90 627
Slovakia a 4
b 1 246 674
c 1 136 707
Sweden a
b
c 106 099
United Kingdom a 15
b 245 474
c
TOTAL PER MLcategory
a 9 1 1 184
b 4 719 231 190 051 43 309 37 947 019
c 428 510 89 545 12 891 145
d 6
e 7(6)
30.12.2011RO
Jurnalul OficialalU
niunii EuropeneC
382/159EU ARMS EXPORTS PER DESTINATION IN 2010
Key: (a) = number of licences issued, (b) = value of licences issued in Euros, (c) = value of arms exports in Euros (if available) (d) = total EU number of licence refusals (small discrepancies may appear between breakdowns and totals due to refusals concerning more than oneML item or refusals for items other than those appearing in the ML); (e) = criteria numbers on which refusals are based (the approximate number of times each criterion is invoked is indicated in brackets)

KENYA
ML 1 ML 2 ML 3 ML 4 ML 6 ML 9 ML 10 ML 11 ML 13 TOTAL perdestination
Austria a 5 5
b 49 669 49 669
c 49 669 49 669
Czech Republic a 2 2
b 41 519 41 519
c 28 844 28 844
France a
b
c 9 956 056
Germany a 1 1
b 138 220 138 220
c
Italy a
b
c 78 190
Netherlands a 6 6
b 5 450 5 450
c 5 450 5 450
Spain a 1 1
b 110 000 110 000
c 621 000 1 364 907 1 985 907
United Kingdom a 70 10 2 6 5 72 2 4 171
b 53 213 84 304 34 513 20 736 391 305 321 172 21 204 4 080 930 526
c
TOTAL PER MLcategory
a 83 10 2 7 6 72 2 4 186
b 149 851 84 304 34 513 130 736 529 525 321 172 21 204 4 080 1 275 384
c 83 963 621 000 1 364 907 12 104 116
d 1 2 (*)
e 2(1) 2(2)
(*) Total number of denials includes a denial in the ML22 category based on Criterion 2.
C382/160
ROJurnalul O
ficialalUniunii Europene
30.12.2011EU ARMS EXPORTS PER DESTINATION IN 2010
Key: (a) = number of licences issued, (b) = value of licences issued in Euros, (c) = value of arms exports in Euros (if available) (d) = total EU number of licence refusals (small discrepancies may appear between breakdowns and totals due to refusals concerning more than oneML item or refusals for items other than those appearing in the ML); (e) = criteria numbers on which refusals are based (the approximate number of times each criterion is invoked is indicated in brackets)

KOREA (REPUBLIC OF)
ML 1 ML 2 ML 3 ML 4 ML 5 ML 6 ML 7 ML 8 ML 9 ML 10 ML 11
Austria a 3 2 5
b 18 313 106 725 220 802
c 18 313 106 725 220 802
Belgium a 1 1
b 3 810 000 22 000 000
c
Denmark a 1
b 3 494
c
Finland a 2 1
b 190 000 15 000
c 75 220 15 000
France a 5 5 35 8 2 6 36 16
b 24 645 1 533 318 9 587 060 6 830 244 887 808 174 037 28 443 242 11 761 434
c
Germany a 22 5 4 4 10 82 13 31 37 10 30
b 399 569 324 875 5 719 200 62 070 268 11 582 916 13 417 509 1 365 035 953 930 11 950 401 108 943 014 14 205 918
c
Hungary a 1
b 460 000
c 49 285
Ireland a 1 2
b 137 040 41 040
c
Italy a 4 1 2 1 6 2
b 78 132 26 450 1 441 988 8 356 000 11 694 487 95 247
c
30.12.2011RO
Jurnalul OficialalU
niunii EuropeneC
382/161EU ARMS EXPORTS PER DESTINATION IN 2010
Key: (a) = number of licences issued, (b) = value of licences issued in Euros, (c) = value of arms exports in Euros (if available) (d) = total EU number of licence refusals (small discrepancies may appear between breakdowns and totals due to refusals concerning more than oneML item or refusals for items other than those appearing in the ML); (e) = criteria numbers on which refusals are based (the approximate number of times each criterion is invoked is indicated in brackets)

KOREA (REPUBLIC OF)
ML 1 ML 2 ML 3 ML 4 ML 5 ML 6 ML 7 ML 8 ML 9 ML 10 ML 11
Netherlands a 2 5 1
b 580 555 4 360 120 1 000
c 79 230 7 683 566 1 200 2 061 131
Poland a 1 1
b 156 739 78 174
c
Slovakia a 1
b 354 000
c 52 221
Spain a 1
b 37 500
c 10 591 057
Sweden a 3 2
b
c
United Kingdom a 201 1 11 45 236 99 2 1 73 251 117
b 455 011 433 263 54 897 572 835 8 797 124 1 100 603 47 300 20 625 3 874 367 2 953 833 3 578 921
c
TOTAL PER MLcategory
a 227 13 23 60 288 200 16 34 117 306 167
b 4 682 893 836 269 6 015 192 66 305 688 34 467 754 44 121 937 1 490 509 1 862 363 24 354 805 152 072 075 30 116 521
c 18 313 75 220 185 955 7 683 566 274 223 12 652 188 64 285
d 2 1
e 7(2) 1(1)
C382/162
ROJurnalul O
ficialalUniunii Europene
30.12.2011EU ARMS EXPORTS PER DESTINATION IN 2010
Key: (a) = number of licences issued, (b) = value of licences issued in Euros, (c) = value of arms exports in Euros (if available) (d) = total EU number of licence refusals (small discrepancies may appear between breakdowns and totals due to refusals concerning more than oneML item or refusals for items other than those appearing in the ML); (e) = criteria numbers on which refusals are based (the approximate number of times each criterion is invoked is indicated in brackets)

KOREA (REPUBLIC OF)
ML 13 ML 14 ML 15 ML 16 ML 17 ML 18 ML 20 ML 21 ML 22 TOTAL perdestination
Austria a 1 21 32
b 1 575 259 99 747 2 020 846
c 99 747 445 587
Belgium a 2
b 25 810 000
c
Denmark a 1
b 3 494
c
Finland a 3
b 205 000
c 90 220
France a 25 6 2 2 12 11 171
b 17 100 673 6 908 365 4 069 061 189 769 12 110 691 5 171 096 104 791 443
c 53 038 354
Germany a 1 2 2 8 2 9 11 20 303
b 468 30 461 000 259 525 1 601 638 14 715 2 146 627 1 336 147 4 109 638 270 862 393
c
Hungary a 1
b 460 000
c 49 285
Ireland a 3
b 178 080
c
Italy a 1 17
b 60 716 21 753 019
c 223 339
30.12.2011RO
Jurnalul OficialalU
niunii EuropeneC
382/163EU ARMS EXPORTS PER DESTINATION IN 2010
Key: (a) = number of licences issued, (b) = value of licences issued in Euros, (c) = value of arms exports in Euros (if available) (d) = total EU number of licence refusals (small discrepancies may appear between breakdowns and totals due to refusals concerning more than oneML item or refusals for items other than those appearing in the ML); (e) = criteria numbers on which refusals are based (the approximate number of times each criterion is invoked is indicated in brackets)

KOREA (REPUBLIC OF)
ML 13 ML 14 ML 15 ML 16 ML 17 ML 18 ML 20 ML 21 ML 22 TOTAL perdestination
Netherlands a 3 11
b 1 063 837 6 005 512
c 1 063 837 10 888 964
Poland a 2
b 234 913
c
Slovakia a 1
b 354 000
c 52 221
Spain a 1
b 37 500
c 10 591 057
Sweden a 1 1 7
b 848 788
c 31 086 873
United Kingdom a 7 7 8 1 11 21 41 1 133
b 21 127 488 593 120 277 103 168 18 834 220 277 168 936 23 029 991
c
TOTAL PER MLcategory
a 8 9 39 15 16 31 2 45 72 1 688
b 21 595 30 949 593 20 119 571 8 613 171 4 163 326 2 246 374 189 769 13 667 115 9 449 670 456 594 978
c 1 063 837 99 747 106 465 901
d 1 1 5
e 1(1) 1(1) 1(3) 7(2)
C382/164
ROJurnalul O
ficialalUniunii Europene
30.12.2011EU ARMS EXPORTS PER DESTINATION IN 2010
Key: (a) = number of licences issued, (b) = value of licences issued in Euros, (c) = value of arms exports in Euros (if available) (d) = total EU number of licence refusals (small discrepancies may appear between breakdowns and totals due to refusals concerning more than oneML item or refusals for items other than those appearing in the ML); (e) = criteria numbers on which refusals are based (the approximate number of times each criterion is invoked is indicated in brackets)
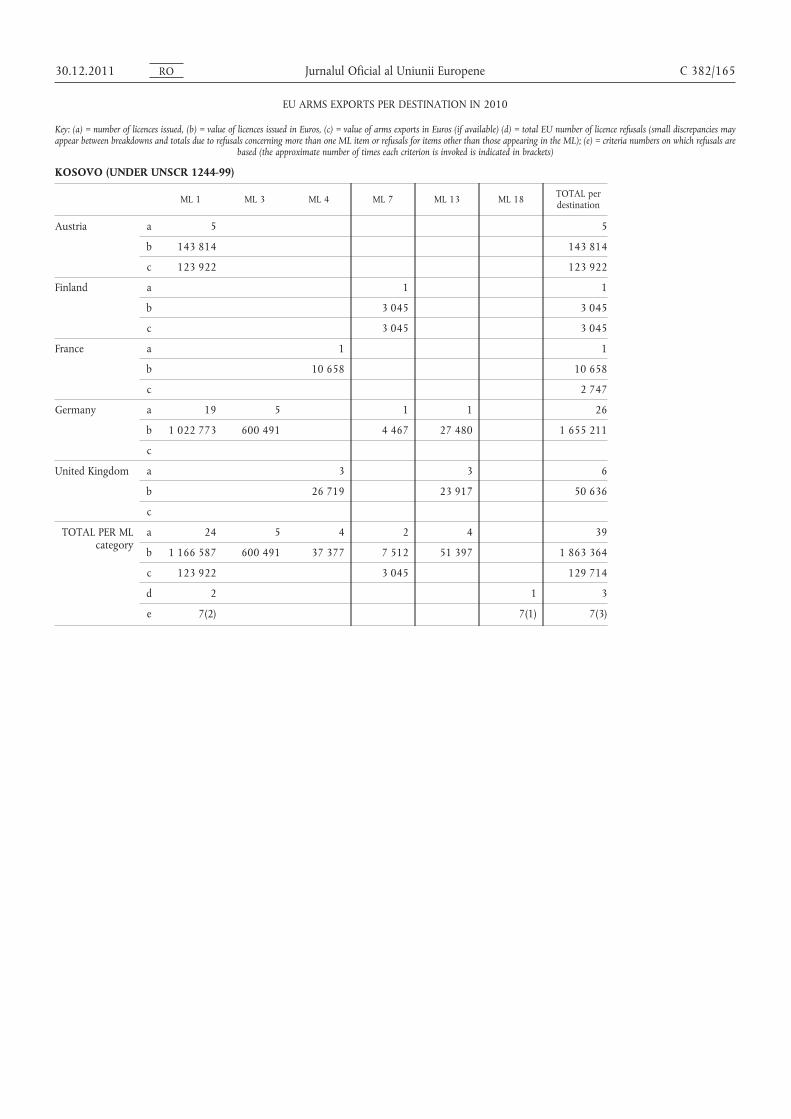
KOSOVO (UNDER UNSCR 1244-99)
ML 1 ML 3 ML 4 ML 7 ML 13 ML 18 TOTAL perdestination
Austria a 5 5
b 143 814 143 814
c 123 922 123 922
Finland a 1 1
b 3 045 3 045
c 3 045 3 045
France a 1 1
b 10 658 10 658
c 2 747
Germany a 19 5 1 1 26
b 1 022 773 600 491 4 467 27 480 1 655 211
c
United Kingdom a 3 3 6
b 26 719 23 917 50 636
c
TOTAL PER MLcategory
a 24 5 4 2 4 39
b 1 166 587 600 491 37 377 7 512 51 397 1 863 364
c 123 922 3 045 129 714
d 2 1 3
e 7(2) 7(1) 7(3)
30.12.2011 RO Jurnalul Oficial al Uniunii Europene C 382/165
EU ARMS EXPORTS PER DESTINATION IN 2010
Key: (a) = number of licences issued, (b) = value of licences issued in Euros, (c) = value of arms exports in Euros (if available) (d) = total EU number of licence refusals (small discrepancies mayappear between breakdowns and totals due to refusals concerning more than one ML item or refusals for items other than those appearing in the ML); (e) = criteria numbers on which refusals are
based (the approximate number of times each criterion is invoked is indicated in brackets)

KUWAIT
ML 1 ML 2 ML 3 ML 4 ML 5 ML 6 ML 7 ML 8 ML 9 ML 10 ML 11
Austria a 23 1 1 7 2
b 97 390 6 830 000 443 500 937 30 230
c 96 340 3 868 072 4 750 388
Belgium a 2 4
b 600 620 6 271 553
c
Bulgaria a
b
c 216 600
Czech Republic a
b
c 41 388
Denmark a
b
c
Finland a 1
b 30 000
c
France a 2 6 6 1 2 2 15 4
b 1 000 15 507 216 301 201 88 016 140 026 31 797 823 20 481 860 1 014 040
c
Germany a 23 5 4 40 3 1 2 5
b 428 376 449 229 152 701 13 464 618 1 962 221 376 630 12 032 1 234 173
c
Greece a
b
c
C382/166
ROJurnalul O
ficialalUniunii Europene
30.12.2011EU ARMS EXPORTS PER DESTINATION IN 2010
Key: (a) = number of licences issued, (b) = value of licences issued in Euros, (c) = value of arms exports in Euros (if available) (d) = total EU number of licence refusals (small discrepancies may appear between breakdowns and totals due to refusals concerning more than oneML item or refusals for items other than those appearing in the ML); (e) = criteria numbers on which refusals are based (the approximate number of times each criterion is invoked is indicated in brackets)

KUWAIT
ML 1 ML 2 ML 3 ML 4 ML 5 ML 6 ML 7 ML 8 ML 9 ML 10 ML 11
Ireland a 1
b 2 161 108
c
Italy a 4 2 2 11
b 3 977 133 6 503 339 25 970 278 4 601 121
c
Portugal a 1
b 155 642
c 155 642
Sweden a 1
b
c
United Kingdom a 62 2 1 6 1 3 6 6 9 3
b 931 500 97 722 30 250 388 861 44 000 1 526 415 6 574 2 253 282 44 696 57 200
c
TOTAL PER MLcategory
a 113 12 12 14 20 50 10 2 9 27 14
b 2 088 886 11 354 083 12 957 843 41 866 356 7 107 429 458 491 970 2 056 811 140 026 34 427 735 20 694 230 2 335 643
c 96 340 3 868 072 4 750 388 41 388 155 642 216 600
d
e
30.12.2011RO
Jurnalul OficialalU
niunii EuropeneC
382/167EU ARMS EXPORTS PER DESTINATION IN 2010
Key: (a) = number of licences issued, (b) = value of licences issued in Euros, (c) = value of arms exports in Euros (if available) (d) = total EU number of licence refusals (small discrepancies may appear between breakdowns and totals due to refusals concerning more than oneML item or refusals for items other than those appearing in the ML); (e) = criteria numbers on which refusals are based (the approximate number of times each criterion is invoked is indicated in brackets)

KUWAIT
ML 13 ML 14 ML 15 ML 17 ML 21 ML 22 TOTAL perdestination
Austria a 1 5 40
b 982 383 41 979 247 493 420 187
c 8 714 800
Belgium a 6
b 6 872 173
c
Bulgaria a 1 1
b 7 080 7 080
c 7 080 223 680
Czech Republic a
b
c 41 388
Denmark a 1 1
b 1 389 505 1 389 505
c
Finland a 1 2
b 490 000 520 000
c
France a 8 1 1 3 51
b 2 872 773 9 370 732 10 002 109 020 81 693 710
c 41 270 522
Germany a 3 2 88
b 1 410 577 167 174 19 657 731
c
Greece a 1 1
b 20 000 20 000
c
C382/168
ROJurnalul O
ficialalUniunii Europene
30.12.2011EU ARMS EXPORTS PER DESTINATION IN 2010
Key: (a) = number of licences issued, (b) = value of licences issued in Euros, (c) = value of arms exports in Euros (if available) (d) = total EU number of licence refusals (small discrepancies may appear between breakdowns and totals due to refusals concerning more than oneML item or refusals for items other than those appearing in the ML); (e) = criteria numbers on which refusals are based (the approximate number of times each criterion is invoked is indicated in brackets)

KUWAIT
ML 13 ML 14 ML 15 ML 17 ML 21 ML 22 TOTAL perdestination
Ireland a 1
b 2 161 108
c
Italy a 19
b 41 051 871
c 2 311 567
Portugal a 1
b 155 642
c 155 642
Sweden a 1
b 743
c 10 610
United Kingdom a 3 7 2 1 112
b 136 785 640 049 105 345 1 6 262 679
c
TOTAL PER MLcategory
a 3 7 16 2 5 8 324
b 136 785 640 049 4 905 775 10 353 115 1 566 682 42 088 267 653 212 428
c 7 080 52 728 209
d
e
30.12.2011RO
Jurnalul OficialalU
niunii EuropeneC
382/169EU ARMS EXPORTS PER DESTINATION IN 2010
Key: (a) = number of licences issued, (b) = value of licences issued in Euros, (c) = value of arms exports in Euros (if available) (d) = total EU number of licence refusals (small discrepancies may appear between breakdowns and totals due to refusals concerning more than oneML item or refusals for items other than those appearing in the ML); (e) = criteria numbers on which refusals are based (the approximate number of times each criterion is invoked is indicated in brackets)

KYRGYZSTAN
ML 1 ML 3 ML 13 TOTAL perdestination
Austria a 3 3
b 45 010 45 010
c 45 010 45 010
France a 1 1
b 55 000 55 000
c
Germany a 6 10 16
b 20 140 14 336 34 476
c
Italy a
b
c 56 782
United Kingdom a 1 7 8
b 1 100 117 943 119 043
c
TOTAL PER MLcategory
a 11 10 7 28
b 121 250 14 336 117 943 253 529
c 45 010 101 792
d 1 1 2
e 7(1) 7(1) 7(2)
LAOS
ML 4 ML 7 ML 10 ML 11 TOTAL perdestination
Belgium a 1 1
b 551 500 551 500
c
United Kingdom a 7 9 1 17
b 46 087 58 190 5 500 109 777
c
TOTAL PER MLcategory
a 7 9 1 1 18
b 46 087 58 190 551 500 5 500 661 277
c
d
e
C 382/170 RO Jurnalul Oficial al Uniunii Europene 30.12.2011
EU ARMS EXPORTS PER DESTINATION IN 2010
Key: (a) = number of licences issued, (b) = value of licences issued in Euros, (c) = value of arms exports in Euros (if available) (d) = total EU number of licence refusals (small discrepancies mayappear between breakdowns and totals due to refusals concerning more than one ML item or refusals for items other than those appearing in the ML); (e) = criteria numbers on which refusals are
based (the approximate number of times each criterion is invoked is indicated in brackets)

LATVIA
ML 1 ML 3 ML 4 ML 5 ML 6 ML 7 ML 9 ML 10 ML 11 ML 13 ML 15
Austria a 1
b 97 560
c 97 560
Czech Republic a 1 3
b 54 320 150 181
c 992 874
Estonia a 1 1
b 85 420 15 000
c 85 420
Finland a 1 2
b 79 000 29 205
c 240 985
France a 1 1 1 1 1 2
b 2 595 367 452 100 000 485 000 22 000 4 518 000
c
Germany a 1 2 1 1
b 1 291 818 2 582 000 7 021 49 265 000
c
Hungary a 1 5
b 64 850 323 500
c 64 850 90 715
Italy a
b
c
30.12.2011RO
Jurnalul OficialalU
niunii EuropeneC
382/171EU ARMS EXPORTS PER DESTINATION IN 2010
Key: (a) = number of licences issued, (b) = value of licences issued in Euros, (c) = value of arms exports in Euros (if available) (d) = total EU number of licence refusals (small discrepancies may appear between breakdowns and totals due to refusals concerning more than oneML item or refusals for items other than those appearing in the ML); (e) = criteria numbers on which refusals are based (the approximate number of times each criterion is invoked is indicated in brackets)

LATVIA
ML 1 ML 3 ML 4 ML 5 ML 6 ML 7 ML 9 ML 10 ML 11 ML 13 ML 15
Lithuania a 2 7 1
b 2 288 407 337 138 600
c 2 288 407 337 138 600
Netherlands a
b
c 16 887
Poland a 1 3
b 15 000 142 234
c
Spain a 1
b 2 233 370
c 495 475
Sweden a 1 1
b
c
United Kingdom a 21 3 5 41 1 2
b 851 510 707 160 353 1 010 067 4 400 33 880
c
TOTAL PER MLcategory
a 26 14 6 1 1 5 2 52 1 6 4
b 910 713 4 541 387 2 668 127 100 000 7 021 160 353 49 750 000 1 652 348 4 400 193 439 4 551 880
c 19 175 1 306 207 85 420 1 222 189
d
e
C382/172
ROJurnalul O
ficialalUniunii Europene
30.12.2011EU ARMS EXPORTS PER DESTINATION IN 2010
Key: (a) = number of licences issued, (b) = value of licences issued in Euros, (c) = value of arms exports in Euros (if available) (d) = total EU number of licence refusals (small discrepancies may appear between breakdowns and totals due to refusals concerning more than oneML item or refusals for items other than those appearing in the ML); (e) = criteria numbers on which refusals are based (the approximate number of times each criterion is invoked is indicated in brackets)

LATVIA
ML 18 ML 22 TOTAL perdestination
Austria a 1
b 97 560
c 97 560
Czech Republic a 4
b 204 501
c 992 874
Estonia a 2
b 100 420
c 85 420
Finland a 3
b 108 205
c 240 985
France a 7
b 5 495 047
c 2 787 373
Germany a 2 1 8
b 620 2 500 53 148 959
c
Hungary a 6
b 388 350
c 155 565
Italy a
b
c 42 732
30.12.2011RO
Jurnalul OficialalU
niunii EuropeneC
382/173EU ARMS EXPORTS PER DESTINATION IN 2010
Key: (a) = number of licences issued, (b) = value of licences issued in Euros, (c) = value of arms exports in Euros (if available) (d) = total EU number of licence refusals (small discrepancies may appear between breakdowns and totals due to refusals concerning more than oneML item or refusals for items other than those appearing in the ML); (e) = criteria numbers on which refusals are based (the approximate number of times each criterion is invoked is indicated in brackets)

LATVIA
ML 18 ML 22 TOTAL perdestination
Lithuania a 10
b 548 225
c 548 225
Netherlands a
b
c 16 887
Poland a 4
b 157 234
c
Spain a 1
b 2 233 370
c 495 475
Sweden a 2
b 106 099
c 954 887
United Kingdom a 73
b 2 060 917
c
TOTAL PER MLcategory
a 2 1 121
b 620 2 500 64 648 887
c 6 417 983
d
e
C382/174
ROJurnalul O
ficialalUniunii Europene
30.12.2011EU ARMS EXPORTS PER DESTINATION IN 2010
Key: (a) = number of licences issued, (b) = value of licences issued in Euros, (c) = value of arms exports in Euros (if available) (d) = total EU number of licence refusals (small discrepancies may appear between breakdowns and totals due to refusals concerning more than oneML item or refusals for items other than those appearing in the ML); (e) = criteria numbers on which refusals are based (the approximate number of times each criterion is invoked is indicated in brackets)
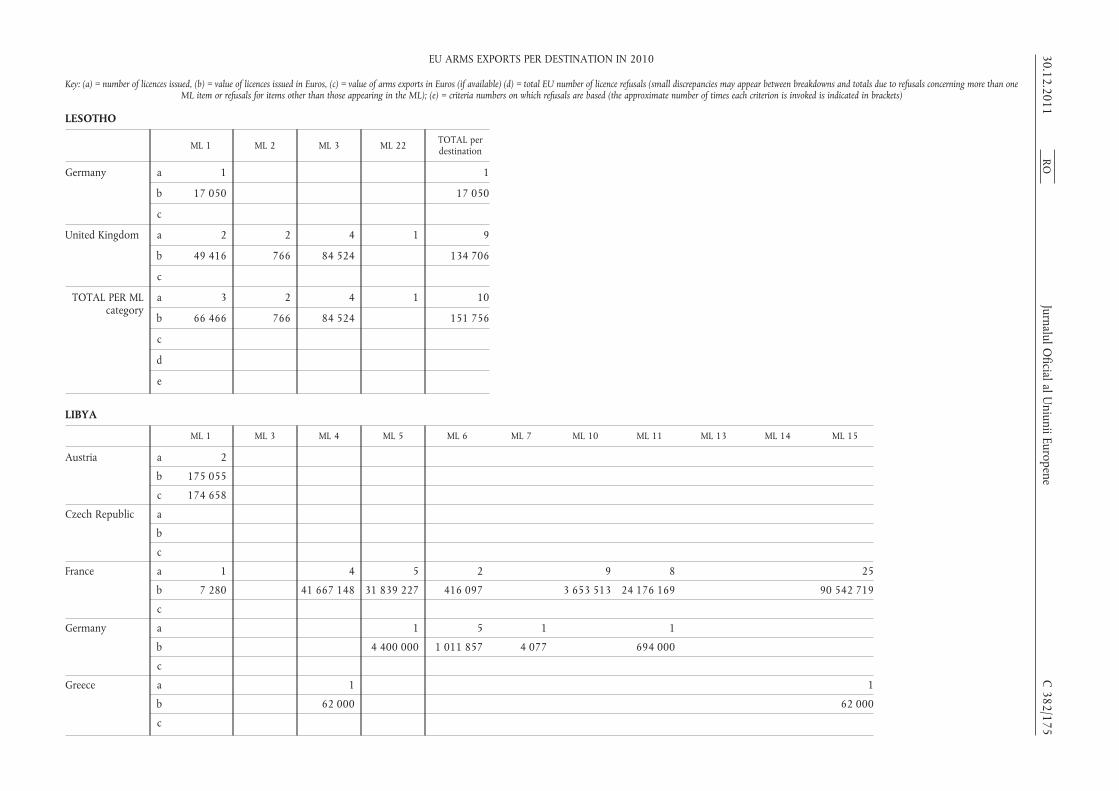
LESOTHO
ML 1 ML 2 ML 3 ML 22 TOTAL perdestination
Germany a 1 1
b 17 050 17 050
c
United Kingdom a 2 2 4 1 9
b 49 416 766 84 524 134 706
c
TOTAL PER MLcategory
a 3 2 4 1 10
b 66 466 766 84 524 151 756
c
d
e
LIBYA
ML 1 ML 3 ML 4 ML 5 ML 6 ML 7 ML 10 ML 11 ML 13 ML 14 ML 15
Austria a 2
b 175 055
c 174 658
Czech Republic a
b
c
France a 1 4 5 2 9 8 25
b 7 280 41 667 148 31 839 227 416 097 3 653 513 24 176 169 90 542 719
c
Germany a 1 5 1 1
b 4 400 000 1 011 857 4 077 694 000
c
Greece a 1 1
b 62 000 62 000
c
30.12.2011RO
Jurnalul OficialalU
niunii EuropeneC
382/175EU ARMS EXPORTS PER DESTINATION IN 2010
Key: (a) = number of licences issued, (b) = value of licences issued in Euros, (c) = value of arms exports in Euros (if available) (d) = total EU number of licence refusals (small discrepancies may appear between breakdowns and totals due to refusals concerning more than oneML item or refusals for items other than those appearing in the ML); (e) = criteria numbers on which refusals are based (the approximate number of times each criterion is invoked is indicated in brackets)
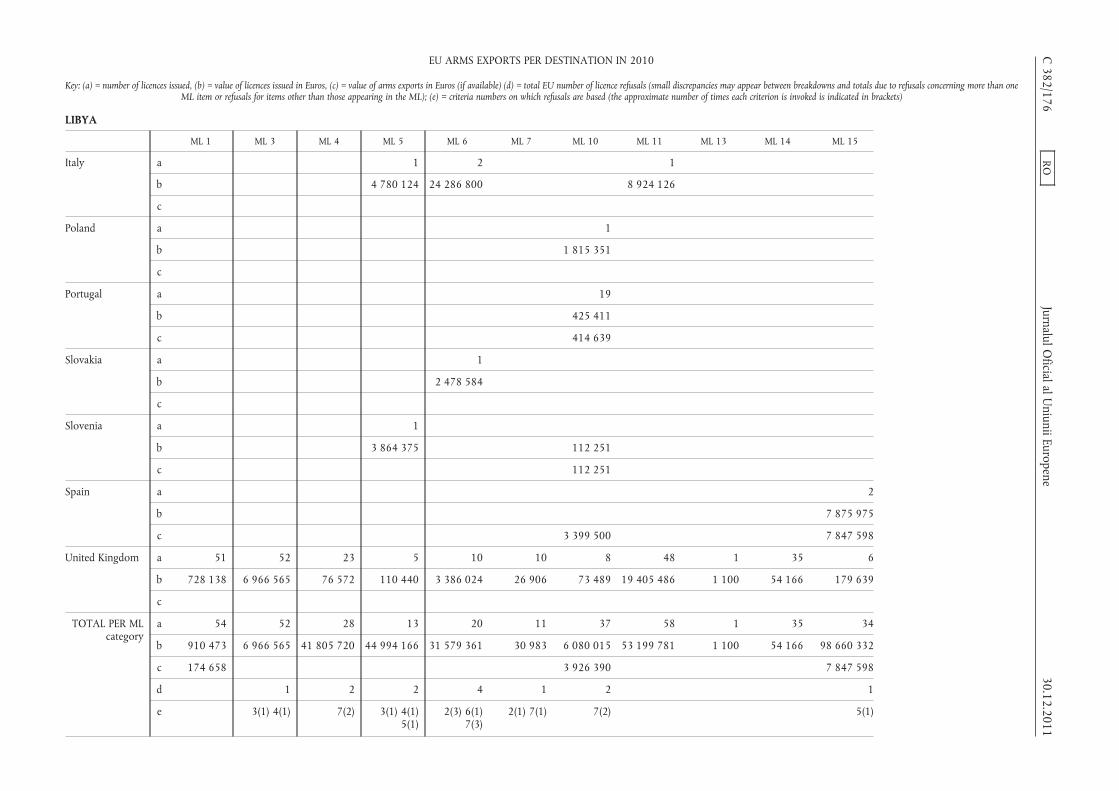
LIBYA
ML 1 ML 3 ML 4 ML 5 ML 6 ML 7 ML 10 ML 11 ML 13 ML 14 ML 15
Italy a 1 2 1
b 4 780 124 24 286 800 8 924 126
c
Poland a 1
b 1 815 351
c
Portugal a 19
b 425 411
c 414 639
Slovakia a 1
b 2 478 584
c
Slovenia a 1
b 3 864 375 112 251
c 112 251
Spain a 2
b 7 875 975
c 3 399 500 7 847 598
United Kingdom a 51 52 23 5 10 10 8 48 1 35 6
b 728 138 6 966 565 76 572 110 440 3 386 024 26 906 73 489 19 405 486 1 100 54 166 179 639
c
TOTAL PER MLcategory
a 54 52 28 13 20 11 37 58 1 35 34
b 910 473 6 966 565 41 805 720 44 994 166 31 579 361 30 983 6 080 015 53 199 781 1 100 54 166 98 660 332
c 174 658 3 926 390 7 847 598
d 1 2 2 4 1 2 1
e 3(1) 4(1) 7(2) 3(1) 4(1)5(1)
2(3) 6(1)7(3)
2(1) 7(1) 7(2) 5(1)
C382/176
ROJurnalul O
ficialalUniunii Europene
30.12.2011EU ARMS EXPORTS PER DESTINATION IN 2010
Key: (a) = number of licences issued, (b) = value of licences issued in Euros, (c) = value of arms exports in Euros (if available) (d) = total EU number of licence refusals (small discrepancies may appear between breakdowns and totals due to refusals concerning more than oneML item or refusals for items other than those appearing in the ML); (e) = criteria numbers on which refusals are based (the approximate number of times each criterion is invoked is indicated in brackets)

LIBYA
ML 17 ML 18 ML 21 ML 22 TOTAL perdestination
Austria a 2
b 175 055
c 174 658
Czech Republic a 3 1 4
b 2 897 741 13 772 2 911 513
c 13 342 13 342
France a 1 1 9 65
b 30 335 10 112 195 257 192 537 857
c 88 368 069
Germany a 8
b 6 109 934
c
Greece a 2
b 124 000
c
Italy a 4
b 37 991 050
c 541 815
Poland a 1
b 1 815 351
c
Portugal a 19
b 425 411
c 414 639
30.12.2011RO
Jurnalul OficialalU
niunii EuropeneC
382/177EU ARMS EXPORTS PER DESTINATION IN 2010
Key: (a) = number of licences issued, (b) = value of licences issued in Euros, (c) = value of arms exports in Euros (if available) (d) = total EU number of licence refusals (small discrepancies may appear between breakdowns and totals due to refusals concerning more than oneML item or refusals for items other than those appearing in the ML); (e) = criteria numbers on which refusals are based (the approximate number of times each criterion is invoked is indicated in brackets)

LIBYA
ML 17 ML 18 ML 21 ML 22 TOTAL perdestination
Slovakia a 1 2
b 56 000 2 534 584
c
Slovenia a 1
b 3 976 626
c 112 251
Spain a 2
b 7 875 975
c 11 247 098
United Kingdom a 5 13 4 271
b 1 528 860 4 832 624 14 156 37 384 165
c
TOTAL PER MLcategory
a 9 1 5 23 381
b 4 456 936 13 772 4 842 736 265 413 293 861 520
c 13 342 100 871 872
d 1 2 2 19 (*)
e 2(1) 7(1) 3(1) 4(1)7(1)
2(1) 7(2) 2(6) 3(3)4(3) 5(3)
6(1) 7(12)
(*) Total number of denials includes a denial in the ML9 category under Criterion 5.
C382/178
ROJurnalul O
ficialalUniunii Europene
30.12.2011EU ARMS EXPORTS PER DESTINATION IN 2010
Key: (a) = number of licences issued, (b) = value of licences issued in Euros, (c) = value of arms exports in Euros (if available) (d) = total EU number of licence refusals (small discrepancies may appear between breakdowns and totals due to refusals concerning more than oneML item or refusals for items other than those appearing in the ML); (e) = criteria numbers on which refusals are based (the approximate number of times each criterion is invoked is indicated in brackets)

LIECHTENSTEIN
ML 1 ML 3 ML 18 TOTAL perdestination
Austria a 3 3
b 312 826 312 826
c 312 826 312 826
Germany a 16 1 1 18
b 108 990 12 000 3 800 124 790
c
TOTAL PER MLcategory
a 19 1 1 21
b 421 816 12 000 3 800 437 616
c 312 826 312 826
d
e
LITHUANIA
ML 1 ML 2 ML 3 ML 4 ML 5 ML 6 ML 7 ML 8 ML 9 ML 10 ML 11 ML 13
Austria a 3
b 1 006 790
c 304 420
Czech Republic a 1 2 1 1 5
b 7 513 371 690 18 791 514 038 26 732
c 6 581 170 291 17 285 398 848 24 492
Estonia a 1 1
b 2 560 2 000
c 2 560 2 000
Finland a 1 1 2
b 117 000 3 035 29 205
c 21 745 3 035
France a 1 2 2 1 1 1
b 118 938 2 875 758 151 020 156 573 12 063 628 380
c
Germany a 2 6 4 4 1 1 1
b 4 927 420 121 494 901 62 015 6 176 1 850 10 000
c
30.12.2011RO
Jurnalul OficialalU
niunii EuropeneC
382/179EU ARMS EXPORTS PER DESTINATION IN 2010
Key: (a) = number of licences issued, (b) = value of licences issued in Euros, (c) = value of arms exports in Euros (if available) (d) = total EU number of licence refusals (small discrepancies may appear between breakdowns and totals due to refusals concerning more than oneML item or refusals for items other than those appearing in the ML); (e) = criteria numbers on which refusals are based (the approximate number of times each criterion is invoked is indicated in brackets)

LITHUANIA
ML 1 ML 2 ML 3 ML 4 ML 5 ML 6 ML 7 ML 8 ML 9 ML 10 ML 11 ML 13
Italy a 2
b 89 067
c
Latvia a 6 2
b 13 704 10 665
c 13 704 10 665
Netherlands a 1 1
b 1 200 15 000
c 1 950
Slovakia a 1
b 400 000
c
Slovenia a
b 49 886
c 49 886
Sweden a 1
b
c
United Kingdom a 11 2 1 7 1 1 3
b 149 626 11 326 34 658 27 199 30 745 000 825 1 096
c
TOTAL PER MLcategory
a 22 7 14 9 3 2 8 1 1 11 2 6
b 293 970 539 059 1 945 258 2 993 782 157 196 158 423 30 234 514 038 30 745 000 539 862 629 205 45 301
c 43 980 535 262 19 845 3 035 398 848 26 492
d
e
C382/180
ROJurnalul O
ficialalUniunii Europene
30.12.2011EU ARMS EXPORTS PER DESTINATION IN 2010
Key: (a) = number of licences issued, (b) = value of licences issued in Euros, (c) = value of arms exports in Euros (if available) (d) = total EU number of licence refusals (small discrepancies may appear between breakdowns and totals due to refusals concerning more than oneML item or refusals for items other than those appearing in the ML); (e) = criteria numbers on which refusals are based (the approximate number of times each criterion is invoked is indicated in brackets)

LITHUANIA
ML 14 ML 15 ML 16 ML 18 ML 21 ML 22 TOTAL perdestination
Austria a 3
b 1 006 790
c 304 420
Czech Republic a 10
b 938 764
c 617 497
Estonia a 2
b 4 560
c 4 560
Finland a 4
b 149 240
c 24 780
France a 4 2 2 16
b 344 461 632 884 5 219 4 925 297
c 2 828 726
Germany a 6 1 26
b 498 637 24 750 1 523 377
c
Italy a 2
b 89 067
c 41 448
Latvia a 8
b 24 369
c 24 369
Netherlands a 2
b 16 200
c 1 950
30.12.2011RO
Jurnalul OficialalU
niunii EuropeneC
382/181EU ARMS EXPORTS PER DESTINATION IN 2010
Key: (a) = number of licences issued, (b) = value of licences issued in Euros, (c) = value of arms exports in Euros (if available) (d) = total EU number of licence refusals (small discrepancies may appear between breakdowns and totals due to refusals concerning more than oneML item or refusals for items other than those appearing in the ML); (e) = criteria numbers on which refusals are based (the approximate number of times each criterion is invoked is indicated in brackets)

LITHUANIA
ML 14 ML 15 ML 16 ML 18 ML 21 ML 22 TOTAL perdestination
Slovakia a 1
b 400 000
c
Slovenia a
b 49 886
c 49 886
Sweden a 1
b 212 197
c 212 197
United Kingdom a 5 4 2 1 38
b 71 397 57 200 44 31 098 370
c
TOTAL PER MLcategory
a 5 8 8 1 3 2 113
b 71 397 401 661 498 681 24 750 632 884 5 219 40 438 116
c 4 109 833
d
e
LUXEMBOURG
ML 1 ML 2 ML 3 ML 4 ML 5 ML 6 ML 7 ML 9 ML 10 ML 11 ML 13
Austria a 2 1
b 27 750 6 291
c 22 530 6 291
Czech Republic a 7 1 2
b 19 174 114 005 51 423
c 17 433 51 367
C382/182
ROJurnalul O
ficialalUniunii Europene
30.12.2011EU ARMS EXPORTS PER DESTINATION IN 2010
Key: (a) = number of licences issued, (b) = value of licences issued in Euros, (c) = value of arms exports in Euros (if available) (d) = total EU number of licence refusals (small discrepancies may appear between breakdowns and totals due to refusals concerning more than oneML item or refusals for items other than those appearing in the ML); (e) = criteria numbers on which refusals are based (the approximate number of times each criterion is invoked is indicated in brackets)

LUXEMBOURG
ML 1 ML 2 ML 3 ML 4 ML 5 ML 6 ML 7 ML 9 ML 10 ML 11 ML 13
Finland a 1 2
b 316 000 29 205
c 7 996
France a 3 6 3 1
b 26 332 694 473 736 858 52 424
c
Germany a 3 6 6 9 129 1 7 6
b 91 500 57 777 1 227 858 187 870 37 738 090 89 145 718 670 985
c
Greece a 1
b 35 000
c
Hungary a 1
b 4 200
c 4 200
Italy a 7 1 1 1
b 763 962 259 940 222 550 158 620
c
Poland a 3
b 352 930
c
Spain a 7 3 3
b
c
Sweden a 2 1 1
b
c
30.12.2011RO
Jurnalul OficialalU
niunii EuropeneC
382/183EU ARMS EXPORTS PER DESTINATION IN 2010
Key: (a) = number of licences issued, (b) = value of licences issued in Euros, (c) = value of arms exports in Euros (if available) (d) = total EU number of licence refusals (small discrepancies may appear between breakdowns and totals due to refusals concerning more than oneML item or refusals for items other than those appearing in the ML); (e) = criteria numbers on which refusals are based (the approximate number of times each criterion is invoked is indicated in brackets)

LUXEMBOURG
ML 1 ML 2 ML 3 ML 4 ML 5 ML 6 ML 7 ML 9 ML 10 ML 11 ML 13
United Kingdom a 24 4 1 3 4
b 987 434 123 200 17 875 11 000 37 400
c
TOTAL PER MLcategory
a 39 2 10 15 20 134 4 1 19 14 6
b 1 152 190 384 268 1 376 863 1 075 032 37 755 965 270 940 89 1 114 164 1 603 863 434 559
c 39 963 18 487 51 367
d
e
ML 14 ML 15 ML 17 ML 21 ML 22 TOTAL perdestination
Austria a 3
b 34 041
c 28 821
Czech Republic a 10
b 184 602
c 68 800
Finland a 3
b 345 205
c 7 996
France a 9 22
b 13 526 965 15 037 052
c 15 479 107
Germany a 1 5 2 3 178
b 19 500 1 794 993 1 000 41 935 380
c
C382/184
ROJurnalulO
ficialalUniuniiEuropene
30.12.2011EU ARMS EXPORTS PER DESTINATION IN 2010
Key: (a) = number of licences issued, (b) = value of licences issued in Euros, (c) = value of arms exports in Euros (if available) (d) = total EU number of licence refusals (small discrepancies may appear between breakdowns and totals due to refusals concerning more than oneML item or refusals for items other than those appearing in the ML); (e) = criteria numbers on which refusals are based (the approximate number of times each criterion is invoked is indicated in brackets)

LUXEMBOURG
ML 14 ML 15 ML 17 ML 21 ML 22 TOTAL perdestination
Greece a 1
b 35 000
c
Hungary a 1
b 4 200
c 4 200
Italy a 10
b 1 405 072
c
Poland a 3
b 352 930
c
Spain a 2 15
b
c
Sweden a 1 5
b 15 808 683
c 1 273 183
United Kingdom a 2 38
b 61 600 1 238 509
c
TOTAL PER MLcategory
a 1 14 5 2 3 289
b 13 608 065 1 794 993 1 000 76 380 674
c 16 862 107
d
e
30.12.2011RO
Jurnalul OficialalU
niunii EuropeneC
382/185EU ARMS EXPORTS PER DESTINATION IN 2010
Key: (a) = number of licences issued, (b) = value of licences issued in Euros, (c) = value of arms exports in Euros (if available) (d) = total EU number of licence refusals (small discrepancies may appear between breakdowns and totals due to refusals concerning more than oneML item or refusals for items other than those appearing in the ML); (e) = criteria numbers on which refusals are based (the approximate number of times each criterion is invoked is indicated in brackets)

MADAGASCAR
ML1 ML3 ML 6 TOTAL perdestination
France a 1 1
b 350 000 350 000
c
TOTAL PER MLcategory
a 1 1
b 350 000 350 000
c
d 1 1 2
e 3(1) 3(1) 3(2)
MALAWI
ML 1 ML 3 ML 10 TOTAL perdestination
France a 1 1
b 100 000 100 000
c 202 285
Romania a 1 1
b 167 459 167 459
c 167 459 167 459
United Kingdom a 5 1 6
b 27 720 28 27 748
c
TOTAL PER MLcategory
a 5 2 1 8
b 27 720 167 487 100 000 295 207
c 167 459 369 744
d
e
C 382/186 RO Jurnalul Oficial al Uniunii Europene 30.12.2011
EU ARMS EXPORTS PER DESTINATION IN 2010
Key: (a) = number of licences issued, (b) = value of licences issued in Euros, (c) = value of arms exports in Euros (if available) (d) = total EU number of licence refusals (small discrepancies mayappear between breakdowns and totals due to refusals concerning more than one ML item or refusals for items other than those appearing in the ML); (e) = criteria numbers on which refusals are
based (the approximate number of times each criterion is invoked is indicated in brackets)

MALAYSIA
ML 1 ML 2 ML 3 ML 4 ML 5 ML 6 ML 7 ML 9 ML 10 ML 11
Austria a 6 2
b 272 691 9 730
c 17 535
Belgium a 4 1
b 1 437 589 2 592 185
c
Czech Republic a 1 1 1 2 2 3
b 64 453 2 893
c 51 984 2 038
Finland a 1 1
b 22 100 456 069
c 23 590 456 069
France a 1 3 25 5 4 12 32
b 18 494 50 349 735 33 150 322 1 217 684 61 478 210 393 677 5 657 640
c
Germany a 39 1 7 3 6 4 6 9 2 12
b 26 042 371 264 600 267 151 167 446 2 873 492 1 454 741 54 765 6 364 801 102 276 2 524 622
c
Hungary a 1
b 150 000
c 14 231
Italy a 5 1 5 1 2 1
b 263 332 41 400 2 924 408 77 780 2 653 850 58 086
c
Latvia a 3
b 20 552
c 20 552
30.12.2011RO
Jurnalul OficialalU
niunii EuropeneC
382/187EU ARMS EXPORTS PER DESTINATION IN 2010
Key: (a) = number of licences issued, (b) = value of licences issued in Euros, (c) = value of arms exports in Euros (if available) (d) = total EU number of licence refusals (small discrepancies may appear between breakdowns and totals due to refusals concerning more than oneML item or refusals for items other than those appearing in the ML); (e) = criteria numbers on which refusals are based (the approximate number of times each criterion is invoked is indicated in brackets)

MALAYSIA
ML 1 ML 2 ML 3 ML 4 ML 5 ML 6 ML 7 ML 9 ML 10 ML 11
Netherlands a 2 2
b 53 100 000 189 383
c 632 898 189 383
Poland a 1 7 17 8
b 2 837 325 983 20 565 410 329 367
c
Slovakia a 1 1
b 220 000
c 220 000
Spain a 1 1 1 1
b 4 476 300 000
c 4 466 22 888
Sweden a 1 2
b
c
United Kingdom a 28 8 73 32 6 210 9 27 40
b 615 352 1 517 1 003 794 816 318 404 781 3 514 295 35 560 1 287 356 1 930 297
c
TOTAL PER MLcategory
a 82 8 22 86 73 33 219 22 59 90
b 28 375 316 527 932 2 994 930 54 665 383 90 343 895 23 642 616 3 591 160 67 878 571 5 696 040 10 360 029
c 22 001 51 984 220 000 655 786 23 590 492 890 189 383
d 1
e 7(1)
C382/188
ROJurnalul O
ficialalUniunii Europene
30.12.2011EU ARMS EXPORTS PER DESTINATION IN 2010
Key: (a) = number of licences issued, (b) = value of licences issued in Euros, (c) = value of arms exports in Euros (if available) (d) = total EU number of licence refusals (small discrepancies may appear between breakdowns and totals due to refusals concerning more than oneML item or refusals for items other than those appearing in the ML); (e) = criteria numbers on which refusals are based (the approximate number of times each criterion is invoked is indicated in brackets)
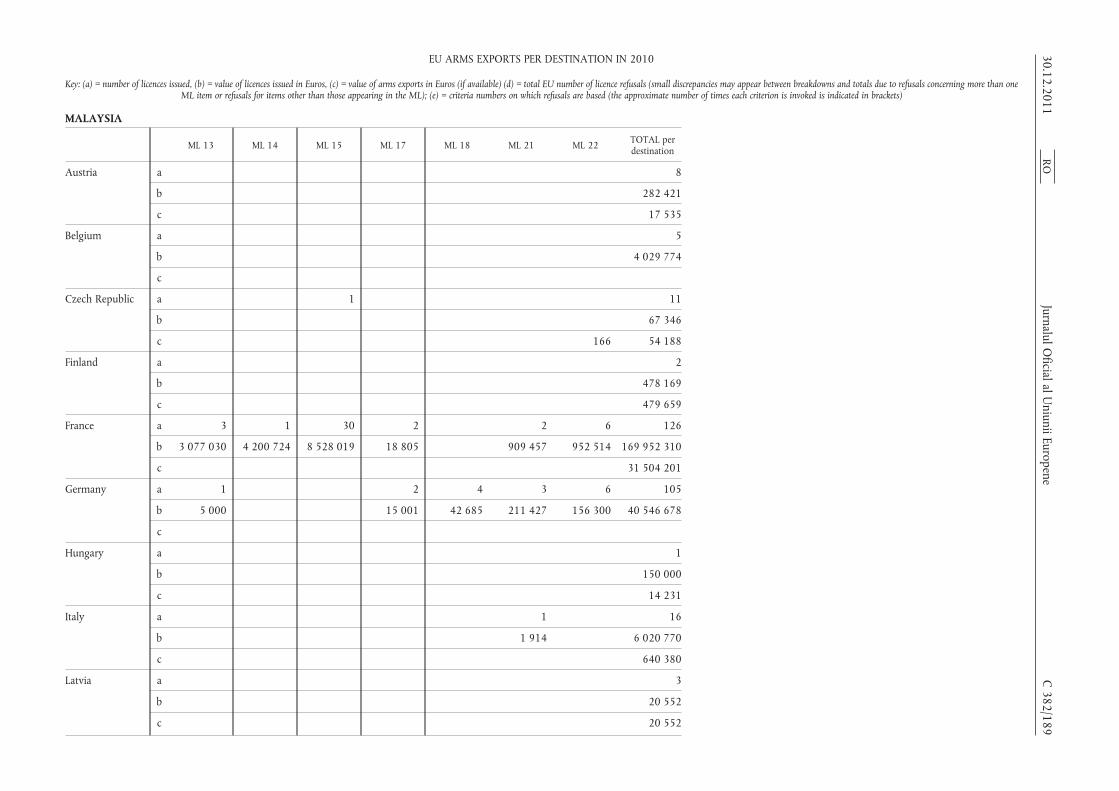
MALAYSIA
ML 13 ML 14 ML 15 ML 17 ML 18 ML 21 ML 22 TOTAL perdestination
Austria a 8
b 282 421
c 17 535
Belgium a 5
b 4 029 774
c
Czech Republic a 1 11
b 67 346
c 166 54 188
Finland a 2
b 478 169
c 479 659
France a 3 1 30 2 2 6 126
b 3 077 030 4 200 724 8 528 019 18 805 909 457 952 514 169 952 310
c 31 504 201
Germany a 1 2 4 3 6 105
b 5 000 15 001 42 685 211 427 156 300 40 546 678
c
Hungary a 1
b 150 000
c 14 231
Italy a 1 16
b 1 914 6 020 770
c 640 380
Latvia a 3
b 20 552
c 20 552
30.12.2011RO
Jurnalul OficialalU
niunii EuropeneC
382/189EU ARMS EXPORTS PER DESTINATION IN 2010
Key: (a) = number of licences issued, (b) = value of licences issued in Euros, (c) = value of arms exports in Euros (if available) (d) = total EU number of licence refusals (small discrepancies may appear between breakdowns and totals due to refusals concerning more than oneML item or refusals for items other than those appearing in the ML); (e) = criteria numbers on which refusals are based (the approximate number of times each criterion is invoked is indicated in brackets)

MALAYSIA
ML 13 ML 14 ML 15 ML 17 ML 18 ML 21 ML 22 TOTAL perdestination
Netherlands a 1 5
b 50 000 53 339 383
c 7 000 829 281
Poland a 1 2 36
b 23 308 46 201 137 67 448 042
c
Slovakia a 2
b 220 000
c 220 000
Spain a 1 5
b 22 888 327 364
c 27 354
Sweden a 3
b 636 591
c 636 591
United Kingdom a 4 5 9 3 21 5 7 487
b 32 824 13 372 261 078 38 671 68 083 5 096 7 986 10 036 381
c
TOTAL PER MLcategory
a 8 7 41 7 25 11 22 815
b 3 114 854 4 237 404 8 811 985 72 476 110 768 1 127 894 47 367 937 353 555 781
c 7 166 34 443 971
d 2
e 7(2)
C382/190
ROJurnalul O
ficialalUniunii Europene
30.12.2011EU ARMS EXPORTS PER DESTINATION IN 2010
Key: (a) = number of licences issued, (b) = value of licences issued in Euros, (c) = value of arms exports in Euros (if available) (d) = total EU number of licence refusals (small discrepancies may appear between breakdowns and totals due to refusals concerning more than oneML item or refusals for items other than those appearing in the ML); (e) = criteria numbers on which refusals are based (the approximate number of times each criterion is invoked is indicated in brackets)

MALI
ML 1 ML 2 ML 3 ML 5 ML 6 ML 10 ML 11 ML 15 TOTAL perdestination
Bulgaria a 1 2 1 1 2 1 8
b 24 000 152 500 405 000 54 000 1 616 310 133 120 2 384 930
c 55 000 303 331 133 120 491 451
Czech Republic a 1 1
b 205 615 205 615
c 181 477 181 477
France a 2 5 1 8
b 253 479 1 570 410 323 315 2 147 205
c 580
Germany a 2 2
b 1 263 500 1 263 500
c
TOTAL PER MLcategory
a 3 2 1 1 4 2 5 1 19
b 277 479 152 500 405 000 54 000 2 879 810 338 735 1 570 410 323 315 6 001 250
c 55 000 303 331 314 597 673 508
d 1 1
e 7(1) 7(1)
MALTA
ML 1 ML 2 ML 5 ML 6 ML 7 ML 10 ML 11 ML 13 ML 15 TOTAL perdestination
Finland a 2 2
b 29 205 29 205
c 8 375 8 375
France a
b
c 702 092
30.12.2011RO
Jurnalul OficialalU
niunii EuropeneC
382/191EU ARMS EXPORTS PER DESTINATION IN 2010
Key: (a) = number of licences issued, (b) = value of licences issued in Euros, (c) = value of arms exports in Euros (if available) (d) = total EU number of licence refusals (small discrepancies may appear between breakdowns and totals due to refusals concerning more than oneML item or refusals for items other than those appearing in the ML); (e) = criteria numbers on which refusals are based (the approximate number of times each criterion is invoked is indicated in brackets)

MALTA
ML 1 ML 2 ML 5 ML 6 ML 7 ML 10 ML 11 ML 13 ML 15 TOTAL perdestination
Germany a 1 1 1 1 4
b 2 470 207 784 000 659 000 1 445 677
c
Italy a
b
c 340 683
Luxembourg a 1 1
b 2 000 2 000
c 2 000 2 000
Netherlands a 1 1
b 495 495
c 2 145 2 145
Romania a 1 1
b 25 000 25 000
c
United Kingdom a 18 1 1 8 2 1 31
b 28 203 8 250 9 625 44 154 15 400 12 705 118 337
c
TOTAL PER MLcategory
a 21 1 1 2 8 2 1 3 1 40
b 55 698 8 250 2 470 9 832 44 154 15 400 784 000 41 910 659 000 1 620 714
c 12 520 1 055 295
d
e
C382/192
ROJurnalul O
ficialalUniunii Europene
30.12.2011EU ARMS EXPORTS PER DESTINATION IN 2010
Key: (a) = number of licences issued, (b) = value of licences issued in Euros, (c) = value of arms exports in Euros (if available) (d) = total EU number of licence refusals (small discrepancies may appear between breakdowns and totals due to refusals concerning more than oneML item or refusals for items other than those appearing in the ML); (e) = criteria numbers on which refusals are based (the approximate number of times each criterion is invoked is indicated in brackets)

MAURITANIA
ML 1 ML 3 ML 6 ML 10 ML 11 ML 13 ML 15 ML 22 TOTAL perdestination
Czech Republic a 1 1 2
b 22 144 22 144
c 6 341 1 6 342
France a 1 4 5 4 5 2 2 23
b 3 674 4 472 306 11 598 054 1 524 113 170 945 315 363 12 171 18 096 627
c 6 031 158
Romania a 1 1
b 377 135 377 135
c 308 600 308 600
Spain a 3 1 1 5
b 2 089 272 2 361
c 2 075 432 2 507
United Kingdom a 1 1
b 1 320 1 320
c
TOTAL PER MLcategory
a 5 2 4 8 4 5 2 2 32
b 27 907 272 4 472 306 11 976 509 1 524 113 170 945 315 363 12 171 18 499 587
c 8 416 433 308 600 6 348 607
d
e
MAURITIUS
ML 1 ML 3 ML 6 ML 7 ML 10 ML 11 ML 13 ML 15 TOTAL perdestination
Austria a 6 5 11b 11 678 26 198 37 876c 11 678 25 547 37 225
France a 1 1 1 2 5b 79 312 3 110 20 995 72 616 176 033c 5 845
Germany a 11 2 13b 49 094 1 034 50 128c
Italy abc 10 850
Malta a 2 2b 9 640 9 640c 9 640 9 640
United Kingdom a 5 2 2 2 1 12b 66 691 11 350 6 208 8 712 4 180 97 141c
TOTAL PER MLcategory
a 24 7 1 1 3 2 4 1 43b 137 103 27 232 79 312 3 110 32 345 6 208 81 328 4 180 370 818c 21 318 25 547 63 560d 1 1e 7(1) 7(1)
30.12.2011 RO Jurnalul Oficial al Uniunii Europene C 382/193
EU ARMS EXPORTS PER DESTINATION IN 2010
Key: (a) = number of licences issued, (b) = value of licences issued in Euros, (c) = value of arms exports in Euros (if available) (d) = total EU number of licence refusals (small discrepancies mayappear between breakdowns and totals due to refusals concerning more than one ML item or refusals for items other than those appearing in the ML); (e) = criteria numbers on which refusals are
based (the approximate number of times each criterion is invoked is indicated in brackets)

MEXICO
ML 1 ML 2 ML 3 ML 4 ML 5 ML 6 ML 7 ML 8 ML 9 ML 10 ML 11 ML 13
Austria a 3 1
b 1 765 967 49 588
c 963 49 588
Belgium a 13 2 1
b 893 989 48 600 157 500
c
Czech Republic a 3 5 1
b 1 405 695 865 453 114 075
c 1 527 070 958 159
Finland a 1
b 130 000
c
France a 1 3 3 1 5 4
b 1 219 83 868 891 965 15 806 629 150 517 960 276
c
Germany a 10 1 1 1 2 13 9
b 1 084 119 9 760 27 600 19 530 28 291 290 456 942 610
c
Italy a 5 1
b 2 030 125 50 000
c
Netherlands a 2
b 181 631
c 30 485
Poland a 1 3
b 31 390 276 300
c
C382/194
ROJurnalul O
ficialalUniunii Europene
30.12.2011EU ARMS EXPORTS PER DESTINATION IN 2010
Key: (a) = number of licences issued, (b) = value of licences issued in Euros, (c) = value of arms exports in Euros (if available) (d) = total EU number of licence refusals (small discrepancies may appear between breakdowns and totals due to refusals concerning more than oneML item or refusals for items other than those appearing in the ML); (e) = criteria numbers on which refusals are based (the approximate number of times each criterion is invoked is indicated in brackets)

MEXICO
ML 1 ML 2 ML 3 ML 4 ML 5 ML 6 ML 7 ML 8 ML 9 ML 10 ML 11 ML 13
Spain a 1 1 3
b 9 600 249 000 323 000 000
c 9 600 249 000 132 458 054
Sweden a
b
c
United Kingdom a 50 1 1 1 1 3 9 12
b 232 384 1 100 1 760 2 750 320 059 24 257 449 682 271 461
TOTAL PER MLcategory
a 87 3 9 2 4 3 1 4 1 23 14 28
b 7 553 099 60 860 965 401 34 140 111 468 891 965 19 530 434 791 320 059 339 397 642 600 199 2 470 054
c 1 537 633 1 007 747 249 000 132 458 054 30 485
d 1
e 7(1)
ML 14 ML 15 ML 16 ML 18 ML 21 ML 22 TOTAL perdestination
Austria a 4
b 1 815 555
c 50 551
Belgium a 16
b 1 100 089
c
Czech Republic a 9
b 2 385 223
c 2 485 229
Finland a 1
b 130 000
c
30.12.2011RO
Jurnalul OficialalU
niunii EuropeneC
382/195EU ARMS EXPORTS PER DESTINATION IN 2010
Key: (a) = number of licences issued, (b) = value of licences issued in Euros, (c) = value of arms exports in Euros (if available) (d) = total EU number of licence refusals (small discrepancies may appear between breakdowns and totals due to refusals concerning more than oneML item or refusals for items other than those appearing in the ML); (e) = criteria numbers on which refusals are based (the approximate number of times each criterion is invoked is indicated in brackets)
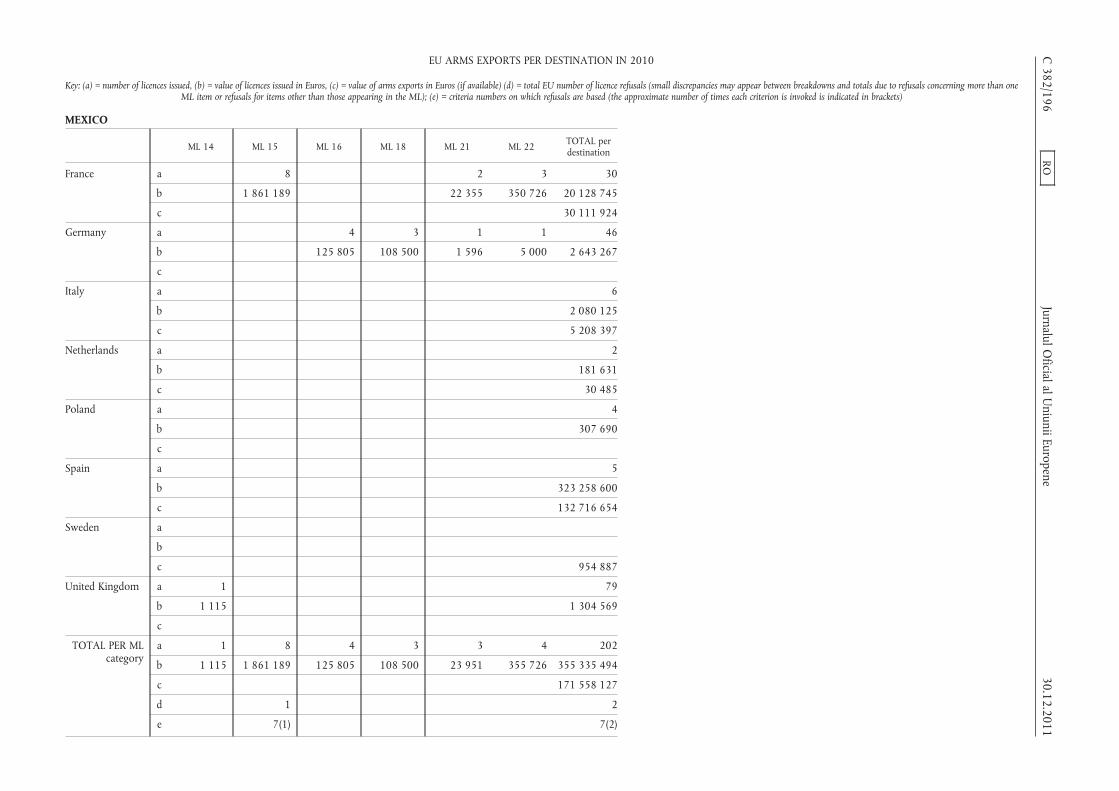
MEXICO
ML 14 ML 15 ML 16 ML 18 ML 21 ML 22 TOTAL perdestination
France a 8 2 3 30
b 1 861 189 22 355 350 726 20 128 745
c 30 111 924
Germany a 4 3 1 1 46
b 125 805 108 500 1 596 5 000 2 643 267
c
Italy a 6
b 2 080 125
c 5 208 397
Netherlands a 2
b 181 631
c 30 485
Poland a 4
b 307 690
c
Spain a 5
b 323 258 600
c 132 716 654
Sweden a
b
c 954 887
United Kingdom a 1 79
b 1 115 1 304 569
c
TOTAL PER MLcategory
a 1 8 4 3 3 4 202
b 1 115 1 861 189 125 805 108 500 23 951 355 726 355 335 494
c 171 558 127
d 1 2
e 7(1) 7(2)
C382/196
ROJurnalul O
ficialalUniunii Europene
30.12.2011EU ARMS EXPORTS PER DESTINATION IN 2010
Key: (a) = number of licences issued, (b) = value of licences issued in Euros, (c) = value of arms exports in Euros (if available) (d) = total EU number of licence refusals (small discrepancies may appear between breakdowns and totals due to refusals concerning more than oneML item or refusals for items other than those appearing in the ML); (e) = criteria numbers on which refusals are based (the approximate number of times each criterion is invoked is indicated in brackets)

MONGOLIA
ML 1 ML 3 ML 6 TOTAL perdestination
Germany a 4 1 1 6
b 47 350 575 140 000 187 925
c
United Kingdom a 1 1
b 11 825 11 825
c
TOTAL PER MLcategory
a 4 1 2 7
b 47 350 575 151 825 199 750
c
d
e
MONTENEGRO
ML 1 ML 2 ML 3 ML 6 ML 7 ML 21 TOTAL perdestination
Austria a 6 3 1 10
b 327 050 16 957 990 000 1 334 007
c 31 205 16 957 990 000 1 038 162
Germany a 14 1 1 1 1 1 19
b 1 405 891 67 500 1 000 11 133 17 895 1 626 1 505 045
c
United Kingdom a 2 2
b 6 507 6 507
c
TOTAL PER MLcategory
a 20 1 4 2 3 1 31
b 1 732 941 67 500 17 957 1 001 133 24 402 1 626 2 845 559
c 31 205 16 957 990 000 1 038 162
d 1 1
e 7(1) 7(1)
30.12.2011 RO Jurnalul Oficial al Uniunii Europene C 382/197
EU ARMS EXPORTS PER DESTINATION IN 2010
Key: (a) = number of licences issued, (b) = value of licences issued in Euros, (c) = value of arms exports in Euros (if available) (d) = total EU number of licence refusals (small discrepancies mayappear between breakdowns and totals due to refusals concerning more than one ML item or refusals for items other than those appearing in the ML); (e) = criteria numbers on which refusals are
based (the approximate number of times each criterion is invoked is indicated in brackets)

MOROCCO
ML 1 ML 2 ML 3 ML 4 ML 5 ML 6 ML 7 ML 8 ML 9 ML 10
Austria a 1 3
b 846 3 204 402
c 846 3 204 402
Belgium a 1 2 1 2
b 168 300 1 540 700 2 137 128 2 180 000
c
Bulgaria a 1 2
b 2 444 475 3 524 400
c
Denmark a 1
b 315 930
c
Finland a 1
b 198 780
c
France a 3 1 3 13 8 3 4 1 7 37
b 57 225 2 049 744 637 249 24 255 315 75 291 388 49 475 583 382 238 295 472 14 274 429 178 275 231
c
Germany a 1 2 2 5
b 66 930 1 951 141 92 6 308 107
c
Greece a 1
b 50 000
c
Italy a 2 1 2 1
b 93 949 1 723 172 6 216 530 485 516
c
C382/198
ROJurnalul O
ficialalUniunii Europene
30.12.2011EU ARMS EXPORTS PER DESTINATION IN 2010
Key: (a) = number of licences issued, (b) = value of licences issued in Euros, (c) = value of arms exports in Euros (if available) (d) = total EU number of licence refusals (small discrepancies may appear between breakdowns and totals due to refusals concerning more than oneML item or refusals for items other than those appearing in the ML); (e) = criteria numbers on which refusals are based (the approximate number of times each criterion is invoked is indicated in brackets)

MOROCCO
ML 1 ML 2 ML 3 ML 4 ML 5 ML 6 ML 7 ML 8 ML 9 ML 10
Netherlands a 1
b 600 000
c 287 433 10 000
Poland a 1
b 285 000
c
Portugal a 1
b 6 900
c 5 369
Romania a 1
b 14 566 105
c 42 565 453
Spain a 1 1
b
c 2 511 998
United Kingdom a 37 2 12 1 2 1
b 550 458 26 098 11 000 3 102 2 629
c
TOTAL PER MLcategory
a 6 40 9 29 10 10 6 4 9 50
b 511 371 2 144 243 4 672 882 30 128 985 77 495 446 54 642 126 385 340 494 344 20 490 959 202 140 418
c 846 287 433 10 000 3 204 402 45 082 820
d 1
e 3(1) 4(1)
30.12.2011RO
Jurnalul OficialalU
niunii EuropeneC
382/199EU ARMS EXPORTS PER DESTINATION IN 2010
Key: (a) = number of licences issued, (b) = value of licences issued in Euros, (c) = value of arms exports in Euros (if available) (d) = total EU number of licence refusals (small discrepancies may appear between breakdowns and totals due to refusals concerning more than oneML item or refusals for items other than those appearing in the ML); (e) = criteria numbers on which refusals are based (the approximate number of times each criterion is invoked is indicated in brackets)
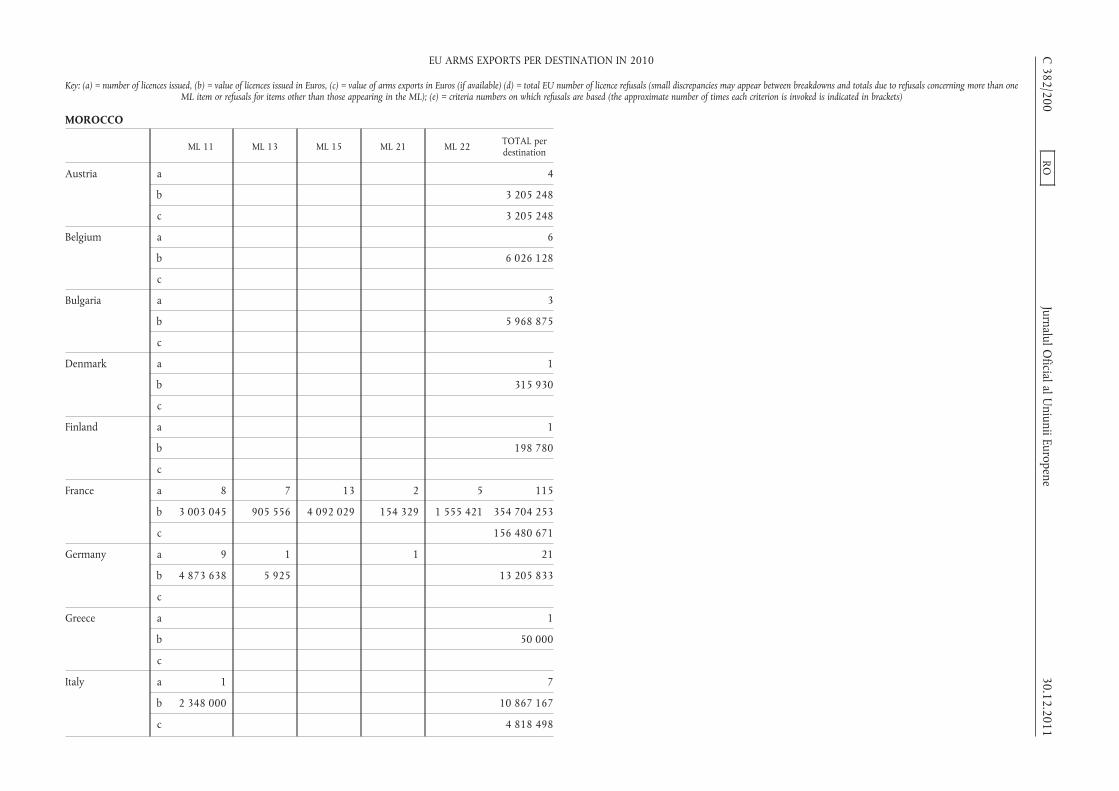
MOROCCO
ML 11 ML 13 ML 15 ML 21 ML 22 TOTAL perdestination
Austria a 4
b 3 205 248
c 3 205 248
Belgium a 6
b 6 026 128
c
Bulgaria a 3
b 5 968 875
c
Denmark a 1
b 315 930
c
Finland a 1
b 198 780
c
France a 8 7 13 2 5 115
b 3 003 045 905 556 4 092 029 154 329 1 555 421 354 704 253
c 156 480 671
Germany a 9 1 1 21
b 4 873 638 5 925 13 205 833
c
Greece a 1
b 50 000
c
Italy a 1 7
b 2 348 000 10 867 167
c 4 818 498
C382/200
ROJurnalul O
ficialalUniunii Europene
30.12.2011EU ARMS EXPORTS PER DESTINATION IN 2010
Key: (a) = number of licences issued, (b) = value of licences issued in Euros, (c) = value of arms exports in Euros (if available) (d) = total EU number of licence refusals (small discrepancies may appear between breakdowns and totals due to refusals concerning more than oneML item or refusals for items other than those appearing in the ML); (e) = criteria numbers on which refusals are based (the approximate number of times each criterion is invoked is indicated in brackets)

MOROCCO
ML 11 ML 13 ML 15 ML 21 ML 22 TOTAL perdestination
Netherlands a 1
b 600 000
c 297 433
Poland a 1 2
b 13 214 298 214
c
Portugal a 1
b 6 900
c 5 369
Romania a 1
b 14 566 105
c 42 565 453
Spain a 2
b
c 2 511 998
United Kingdom a 3 3 4 65
b 161 275 7 429 880 000 1 092 542
c
TOTAL PER MLcategory
a 21 12 17 3 5 231
b 10 385 958 932 124 4 972 029 154 329 1 555 421 411 105 974
c 209 884 670
d 1
e 3(1) 4(1)
30.12.2011RO
Jurnalul OficialalU
niunii EuropeneC
382/201EU ARMS EXPORTS PER DESTINATION IN 2010
Key: (a) = number of licences issued, (b) = value of licences issued in Euros, (c) = value of arms exports in Euros (if available) (d) = total EU number of licence refusals (small discrepancies may appear between breakdowns and totals due to refusals concerning more than oneML item or refusals for items other than those appearing in the ML); (e) = criteria numbers on which refusals are based (the approximate number of times each criterion is invoked is indicated in brackets)

MOZAMBIQUE
ML 1 ML 13 TOTAL perdestination
Spain a 7 7
b 3 474 3 474
c
United Kingdom a 3 3 6
b 90 398 214 500 304 898
c
TOTAL PER MLcategory
a 10 3 13
b 93 872 214 500 308 372
c
d
e
NAMIBIA
ML 1 ML 3 ML 6 ML 7 ML 16 TOTAL perdestination
Austria a 16 16
b 576 790 576 790
c 54 905 54 905
Belgium a 1 1
b 61 622 61 622
c
Czech Republic a 2 2
b 317 518 317 518
c 147 878 147 878
Finland a 1 1
b 377 500 377 500
c 1 599 1 599
Germany a 41 8 2 1 52
b 272 525 20 146 605 250 8 000 905 921
c
Italy a
b
c 3 280
Sweden a
b
c 31 294
United Kingdom a 10 4 4 18
b 799 9 842 910 11 551
c
TOTAL PER MLcategory
a 71 8 6 4 1 90
b 1 606 754 20 146 615 092 910 8 000 2 250 902
c 204 382 238 956
d 1 1
e 7(1) 7(1)
C 382/202 RO Jurnalul Oficial al Uniunii Europene 30.12.2011
EU ARMS EXPORTS PER DESTINATION IN 2010
Key: (a) = number of licences issued, (b) = value of licences issued in Euros, (c) = value of arms exports in Euros (if available) (d) = total EU number of licence refusals (small discrepancies mayappear between breakdowns and totals due to refusals concerning more than one ML item or refusals for items other than those appearing in the ML); (e) = criteria numbers on which refusals are
based (the approximate number of times each criterion is invoked is indicated in brackets)

NEPAL
ML 1 ML 3 ML 4 ML 6 ML 10 ML 11 ML 13 ML 18 TOTAL perdestination
Poland a 1 1
b 136 408 136 408
c
United Kingdom a 1 1 20 1 3 26
b 550 220 154 495 1 091 9 845 166 201
c
TOTAL PER MLcategory
a 1 1 20 1 1 3 27
b 550 220 154 495 136 408 1 091 9 845 302 609
c
d 1 1 1 1 5
e 7(1) 2(1) 3(1) 7(1)8(1)
2(1) 3(1) 2(3) 3(3)7(2) 8(1)
NETHERLANDS (ARUBA)
ML 14 TOTAL perdestination
Netherlands a 1 1
b 10 000 10 000
c
TOTAL PER MLcategory
a 1 1
b 10 000 10 000
c
d
e
NETHERLANDS (NETHERLANDS ANTILLES)
ML 1 ML 3 TOTAL perdestination
Germany a 1 1
b 33 949 33 949
c
Netherlands a
b
c 29 750 29 750
TOTAL PER MLcategory
a 1 1
b 33 949 33 949
c 29 750 29 750
d
e
30.12.2011 RO Jurnalul Oficial al Uniunii Europene C 382/203
EU ARMS EXPORTS PER DESTINATION IN 2010
Key: (a) = number of licences issued, (b) = value of licences issued in Euros, (c) = value of arms exports in Euros (if available) (d) = total EU number of licence refusals (small discrepancies mayappear between breakdowns and totals due to refusals concerning more than one ML item or refusals for items other than those appearing in the ML); (e) = criteria numbers on which refusals are
based (the approximate number of times each criterion is invoked is indicated in brackets)

NETHERLANDS
ML 1 ML 2 ML 3 ML 4 ML 5 ML 6 ML 7 ML 8 ML 9 ML 10 ML 11
Austria a 1
b 2 927 290
c 643
Belgium a 1
b 320 000
c
Bulgaria a 2 1
b 13 760 4 094
c 13 760
Czech Republic a 2 2 2 1
b 22 421 69 879 94 670 1 450
c 5 681 63 548 78 299
Denmark a 7 3
b 742 861 9 272
c
Finland a 2 2
b 103 000 168 675
c 3 986 727
France a 1 4 12 2 2 2 4 30 34
b 5 250 538 668 684 946 304 527 519 146 58 520 33 558 32 190 805 28 276 255
c
Germany a 16 27 8 19 49 306 3 8 29 47
b 2 276 764 10 754 797 240 755 10 986 448 2 700 127 108 989 694 282 1 125 061 957 072 4 248 987
c
Greece a 12
b 55 900 000
c
Ireland a 3
b 2 500 000
c
C382/204
ROJurnalul O
ficialalUniunii Europene
30.12.2011EU ARMS EXPORTS PER DESTINATION IN 2010
Key: (a) = number of licences issued, (b) = value of licences issued in Euros, (c) = value of arms exports in Euros (if available) (d) = total EU number of licence refusals (small discrepancies may appear between breakdowns and totals due to refusals concerning more than oneML item or refusals for items other than those appearing in the ML); (e) = criteria numbers on which refusals are based (the approximate number of times each criterion is invoked is indicated in brackets)

NETHERLANDS
ML 1 ML 2 ML 3 ML 4 ML 5 ML 6 ML 7 ML 8 ML 9 ML 10 ML 11
Italy a 8 2
b 9 277 551 2 550
c
Latvia a 1
b 115
c 115
Lithuania a 1 2
b 612 315 353 642
c 612 315 146 498
Poland a 2
b 2 132 500
c
Romania a 3
b 33 947
c 13 291
Spain a 2 1 4 1
b 65 280
c 5 040 19 400
Sweden a 3 1 7 3 3 1
b
c
United Kingdom a 82 4 5 61 55 33 11 95 17
b 688 499 4 857 1 373 282 1 635 029 908 123 240 747 22 019 712 468 436 325 972
c
TOTAL PER MLcategory
a 110 35 24 37 122 369 41 3 37 168 106
b 3 129 997 20 032 348 3 963 883 13 048 769 7 139 683 110 736 964 394 219 79 080 881 35 038 219 35 346 628
c 19 087 4 064 678 78 299 617 355 165 898
d
e
30.12.2011RO
Jurnalul OficialalU
niunii EuropeneC
382/205EU ARMS EXPORTS PER DESTINATION IN 2010
Key: (a) = number of licences issued, (b) = value of licences issued in Euros, (c) = value of arms exports in Euros (if available) (d) = total EU number of licence refusals (small discrepancies may appear between breakdowns and totals due to refusals concerning more than oneML item or refusals for items other than those appearing in the ML); (e) = criteria numbers on which refusals are based (the approximate number of times each criterion is invoked is indicated in brackets)

NETHERLANDS
ML 13 ML 14 ML 15 ML 16 ML 17 ML 18 ML 21 ML 22 TOTAL perdestination
Austria a 1
b 2 927 290
c 643
Belgium a 1
b 320 000
c
Bulgaria a 3
b 17 854
c 13 760
Czech Republic a 1 1 9
b 198 893 21 452 408 765
c 11 027 22 002 180 557
Denmark a 2 1 2 15
b 157 495 335 954 537 526 1 783 108
c
Finland a 2 6
b 29 205 300 880
c 3 986 727
France a 5 3 8 1 3 6 117
b 4 165 540 42 379 545 14 266 622 610 452 596 348 663 257 125 293 438
c 33 632 544
Germany a 4 9 35 40 11 8 26 645
b 237 176 313 109 6 212 499 905 552 81 575 752 185 4 616 204 155 398 287
c
Greece a 1 2 15
b 266 640 1 400 000 57 566 640
c
C382/206
ROJurnalul O
ficialalUniunii Europene
30.12.2011EU ARMS EXPORTS PER DESTINATION IN 2010
Key: (a) = number of licences issued, (b) = value of licences issued in Euros, (c) = value of arms exports in Euros (if available) (d) = total EU number of licence refusals (small discrepancies may appear between breakdowns and totals due to refusals concerning more than oneML item or refusals for items other than those appearing in the ML); (e) = criteria numbers on which refusals are based (the approximate number of times each criterion is invoked is indicated in brackets)

NETHERLANDS
ML 13 ML 14 ML 15 ML 16 ML 17 ML 18 ML 21 ML 22 TOTAL perdestination
Ireland a 3
b 2 500 000
c
Italy a 3 13
b 6 838 9 286 939
c 88 606 868
Latvia a 1
b 115
c 115
Lithuania a 3
b 965 957
c 758 813
Poland a 2 9 13
b 83 426 2 946 420 5 162 346
c
Romania a 1 4
b 268 115 302 062
c 13 291
Spain a 1 9
b 65 280
c 24 440
Sweden a 1 1 1 21
b 19 522 132
c 223 549 633
United Kingdom a 7 1 23 7 3 4 8 416
b 135 933 5 138 2 557 733 730 298 615 583 24 751 2 468 31 736 560
c
TOTAL PER MLcategory
a 20 9 42 42 44 14 28 44 1 295
b 4 770 491 42 621 859 17 404 104 6 942 797 2 131 586 438 981 6 257 230 5 556 882 413 557 652
c 11 027 22 002 350 767 391
d
e
30.12.2011RO
Jurnalul OficialalU
niunii EuropeneC
382/207EU ARMS EXPORTS PER DESTINATION IN 2010
Key: (a) = number of licences issued, (b) = value of licences issued in Euros, (c) = value of arms exports in Euros (if available) (d) = total EU number of licence refusals (small discrepancies may appear between breakdowns and totals due to refusals concerning more than oneML item or refusals for items other than those appearing in the ML); (e) = criteria numbers on which refusals are based (the approximate number of times each criterion is invoked is indicated in brackets)

NEW ZEALAND
ML 1 ML 2 ML 3 ML 4 ML 5 ML 6 ML 7 ML 9 ML 10 ML 11 ML 13 ML 14
Austria a 19 1 1
b 320 618 168 000 173 250
c 51 998
Belgium a 9
b 6 113 932
c
Bulgaria a
b
c 3 405
Czech Republic a 9
b 20 826
c 14 083
Finland a 1 1 2
b 300 000 355 500 29 205
c 26 775 178
France a 1 1 1 9 1 1
b 127 689 2 731 609 598 1 193 461 2 326 202 341
c
Germany a 112 3 3 1 2 5 4 1 4 4
b 345 535 5 226 36 896 9 239 1 910 8 512 1 765 760 410 664 168 724
c
Ireland a 2
b 4 975
c
C382/208
ROJurnalul O
ficialalUniunii Europene
30.12.2011EU ARMS EXPORTS PER DESTINATION IN 2010
Key: (a) = number of licences issued, (b) = value of licences issued in Euros, (c) = value of arms exports in Euros (if available) (d) = total EU number of licence refusals (small discrepancies may appear between breakdowns and totals due to refusals concerning more than oneML item or refusals for items other than those appearing in the ML); (e) = criteria numbers on which refusals are based (the approximate number of times each criterion is invoked is indicated in brackets)

NEW ZEALAND
ML 1 ML 2 ML 3 ML 4 ML 5 ML 6 ML 7 ML 9 ML 10 ML 11 ML 13 ML 14
Italy a 1 3
b 72 240 147 462
c
Netherlands a 1 1 1 2
b 30 000 50 26 190 938
c 4 395 50 25 251 974
Romania a 4
b 8 497
c 8 497
Spain a 4 1
b 23 250 37 500
c 40 481 3 000
Sweden a 2 2
b
c
United Kingdom a 241 3 5 27 4 4 72 3
b 592 188 2 145 1 499 003 53 773 166 045 204 235 2 474 959 11 626
c
TOTAL PER MLcategory
a 405 7 8 8 3 33 4 4 20 77 3 7
b 7 887 510 175 371 565 696 1 583 213 611 508 88 475 166 045 1 765 1 584 356 2 887 949 231 546 180 350
c 149 634 228 3 000 25 251 974
d
e
30.12.2011RO
Jurnalul OficialalU
niunii EuropeneC
382/209EU ARMS EXPORTS PER DESTINATION IN 2010
Key: (a) = number of licences issued, (b) = value of licences issued in Euros, (c) = value of arms exports in Euros (if available) (d) = total EU number of licence refusals (small discrepancies may appear between breakdowns and totals due to refusals concerning more than oneML item or refusals for items other than those appearing in the ML); (e) = criteria numbers on which refusals are based (the approximate number of times each criterion is invoked is indicated in brackets)

NEW ZEALAND
ML 15 ML 16 ML 18 ML 21 ML 22 TOTAL perdestination
Austria a 21
b 661 868
c 51 998
Belgium a 9
b 6 113 932
c
Bulgaria a
b
c 3 405
Czech Republic a 9
b 20 826
c 14 083
Finland a 4
b 684 705
c 26 953
France a 5 19
b 7 902 068 10 040 213
c 966 728
Germany a 1 4 144
b 4 800 201 461 1 195 492
c
Ireland a 2
b 4 975
c
Italy a 4
b 219 702
c 990 232
C382/210
ROJurnalul O
ficialalUniunii Europene
30.12.2011EU ARMS EXPORTS PER DESTINATION IN 2010
Key: (a) = number of licences issued, (b) = value of licences issued in Euros, (c) = value of arms exports in Euros (if available) (d) = total EU number of licence refusals (small discrepancies may appear between breakdowns and totals due to refusals concerning more than oneML item or refusals for items other than those appearing in the ML); (e) = criteria numbers on which refusals are based (the approximate number of times each criterion is invoked is indicated in brackets)
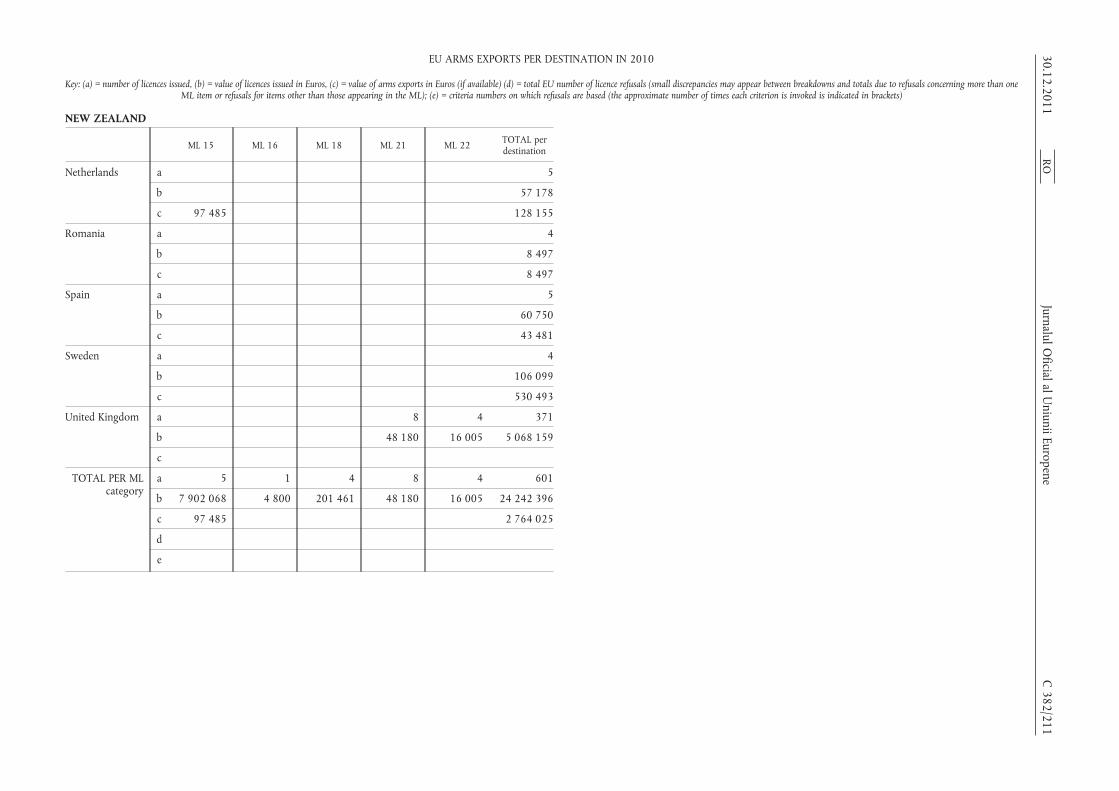
NEW ZEALAND
ML 15 ML 16 ML 18 ML 21 ML 22 TOTAL perdestination
Netherlands a 5
b 57 178
c 97 485 128 155
Romania a 4
b 8 497
c 8 497
Spain a 5
b 60 750
c 43 481
Sweden a 4
b 106 099
c 530 493
United Kingdom a 8 4 371
b 48 180 16 005 5 068 159
c
TOTAL PER MLcategory
a 5 1 4 8 4 601
b 7 902 068 4 800 201 461 48 180 16 005 24 242 396
c 97 485 2 764 025
d
e
30.12.2011RO
Jurnalul OficialalU
niunii EuropeneC
382/211EU ARMS EXPORTS PER DESTINATION IN 2010
Key: (a) = number of licences issued, (b) = value of licences issued in Euros, (c) = value of arms exports in Euros (if available) (d) = total EU number of licence refusals (small discrepancies may appear between breakdowns and totals due to refusals concerning more than oneML item or refusals for items other than those appearing in the ML); (e) = criteria numbers on which refusals are based (the approximate number of times each criterion is invoked is indicated in brackets)

NICARAGUA
ML 1 TOTAL perdestination
Austria a 2 2
b 63 653 63 653
c
Czech Republic a 1 1
b 5 022 5 022
c
TOTAL PER MLcategory
a 3 3
b 68 675 68 675
c
d
e
NIGER
ML 10 TOTAL perdestination
Portugal a 2 2
b 5 785 5 785
c 5 785 5 785
TOTAL PER MLcategory
a 2 2
b 5 785 5 785
c 5 785 5 785
d
e
C 382/212 RO Jurnalul Oficial al Uniunii Europene 30.12.2011
EU ARMS EXPORTS PER DESTINATION IN 2010
Key: (a) = number of licences issued, (b) = value of licences issued in Euros, (c) = value of arms exports in Euros (if available) (d) = total EU number of licence refusals (small discrepancies mayappear between breakdowns and totals due to refusals concerning more than one ML item or refusals for items other than those appearing in the ML); (e) = criteria numbers on which refusals are
based (the approximate number of times each criterion is invoked is indicated in brackets)

NIGERIA
ML 1 ML 2 ML 3 ML 4 ML 5 ML 6 ML 10 ML 11 ML 13 ML 17 TOTAL perdestination
Austria a 2 2
b 486 800 486 800
c 209 800 209 800
Belgium a 4 4
b 1 103 927 1 103 927
c
Bulgaria a 1 1 2
b 78 000 1 442 500 1 520 500
c 186 000 51 248 665 432 2 187 460 3 090 140
Czech Republic a 3 3
b 150 712 150 712
c 117 624 117 624
France a 1 1
b 118 755 118 755
c 9 956 056
Germany a 9 9
b 2 813 565 2 813 565
c
Italy a 1 1 1 3
b 412 581 488 000 2 814 787 3 715 368
c 5 792 991
Portugal a 14 14
b 169 404 169 404
c 109 603 109 603
30.12.2011RO
Jurnalul OficialalU
niunii EuropeneC
382/213EU ARMS EXPORTS PER DESTINATION IN 2010
Key: (a) = number of licences issued, (b) = value of licences issued in Euros, (c) = value of arms exports in Euros (if available) (d) = total EU number of licence refusals (small discrepancies may appear between breakdowns and totals due to refusals concerning more than oneML item or refusals for items other than those appearing in the ML); (e) = criteria numbers on which refusals are based (the approximate number of times each criterion is invoked is indicated in brackets)

NIGERIA
ML 1 ML 2 ML 3 ML 4 ML 5 ML 6 ML 10 ML 11 ML 13 ML 17 TOTAL perdestination
United Kingdom a 3 20 4 3 4 34
b 36 012 934 846 11 396 46 475 82 297 1 111 025
c
TOTAL PER MLcategory
a 6 4 1 31 18 5 3 4 72
b 1 594 508 1 478 512 488 000 4 235 211 3 134 903 130 151 46 475 82 297 11 190 057
c 186 000 51 248 665 432 2 187 460 209 800 227 227 19 276 214
d 2 2
e 2(1) 7(1) 2(1) 7(1)
NORWAY
ML 1 ML 2 ML 3 ML 4 ML 5 ML 6 ML 7 ML 8 ML 9 ML 10 ML 11
Austria a 12 1 2
b 411 431 8 370 20 829
c 129 567 8 200
Belgium a 21 2 5 1
b 2 103 535 447 500 589 183 37 265
c
Bulgaria a 1
b 1 178
c 459
Czech Republic a 1 1
b
c 1 000 937
Denmark a 12 6 17 12 11 1
b 12 217 966 13 582 208 108 177 144 326 10 654 975 29 026
c
C382/214
ROJurnalulO
ficialalUniuniiEuropene
30.12.2011EU ARMS EXPORTS PER DESTINATION IN 2010
Key: (a) = number of licences issued, (b) = value of licences issued in Euros, (c) = value of arms exports in Euros (if available) (d) = total EU number of licence refusals (small discrepancies may appear between breakdowns and totals due to refusals concerning more than oneML item or refusals for items other than those appearing in the ML); (e) = criteria numbers on which refusals are based (the approximate number of times each criterion is invoked is indicated in brackets)

NORWAY
ML 1 ML 2 ML 3 ML 4 ML 5 ML 6 ML 7 ML 8 ML 9 ML 10 ML 11
Estonia a 1
b 8 600
c
Finland a 4 4 1
b 365 596 2 626 797 107
c 20 561 69 273 12 600
France a 2 2 2 11 6 3 15 16
b 122 169 57 461 590 598 7 706 422 3 210 464 1 139 133 156 430 474 27 291 133
c
Germany a 441 7 94 17 22 94 1 32 1 10
b 11 728 164 137 420 9 931 395 6 988 487 1 107 279 38 218 604 1 461 3 343 957 750 7 621 920
c
Greece a 2
b 1 737 087
c
Ireland a 1 1
b 800 12 000
c
Italy a 1 1 1 4 4 4
b 5 499 2 637 85 223 1 043 645 415 734 1 108 858
c
Lithuania a 6
b 6 242 522
c 5 011 378
Netherlands a 3 4 5 1 5 1
b 1 640 428 128 610 208 35 1 135 332 20 000
c 1 390 7 560 132 169 7 259 20 000
30.12.2011RO
Jurnalul OficialalU
niunii EuropeneC
382/215EU ARMS EXPORTS PER DESTINATION IN 2010
Key: (a) = number of licences issued, (b) = value of licences issued in Euros, (c) = value of arms exports in Euros (if available) (d) = total EU number of licence refusals (small discrepancies may appear between breakdowns and totals due to refusals concerning more than oneML item or refusals for items other than those appearing in the ML); (e) = criteria numbers on which refusals are based (the approximate number of times each criterion is invoked is indicated in brackets)

NORWAY
ML 1 ML 2 ML 3 ML 4 ML 5 ML 6 ML 7 ML 8 ML 9 ML 10 ML 11
Poland a 1 6 1
b 2 200 632 353 81
c
Romania a 3 1
b 4 744 20 367
c 4 744 20 367
Slovenia a 3
b 20 826
c 20 826
Spain a 1 9 1 1 1 1 1
b 12 398 2 309 484 34 913 99 225 400 000 000
c 12 398 850 434 3 465 437 687 375 130 523
Sweden a 3 6 13 1 12 3 12 9
b
c
United Kingdom a 182 2 15 29 34 2 30 6 3 8
b 497 177 4 038 90 283 2 270 702 367 324 13 888 187 448 158 278 22 484 220 513
c
TOTAL PER MLcategory
a 686 25 171 74 97 107 31 21 43 42 39
b 27 467 820 13 786 626 17 193 911 18 883 115 22 195 410 39 489 677 187 555 689 985 404 545 881 158 100 031 36 262 423
c 168 660 1 957 230 3 478 496 5 143 547 687 375 130 523 27 626 20 000
d
e
C382/216
ROJurnalul O
ficialalUniunii Europene
30.12.2011EU ARMS EXPORTS PER DESTINATION IN 2010
Key: (a) = number of licences issued, (b) = value of licences issued in Euros, (c) = value of arms exports in Euros (if available) (d) = total EU number of licence refusals (small discrepancies may appear between breakdowns and totals due to refusals concerning more than oneML item or refusals for items other than those appearing in the ML); (e) = criteria numbers on which refusals are based (the approximate number of times each criterion is invoked is indicated in brackets)
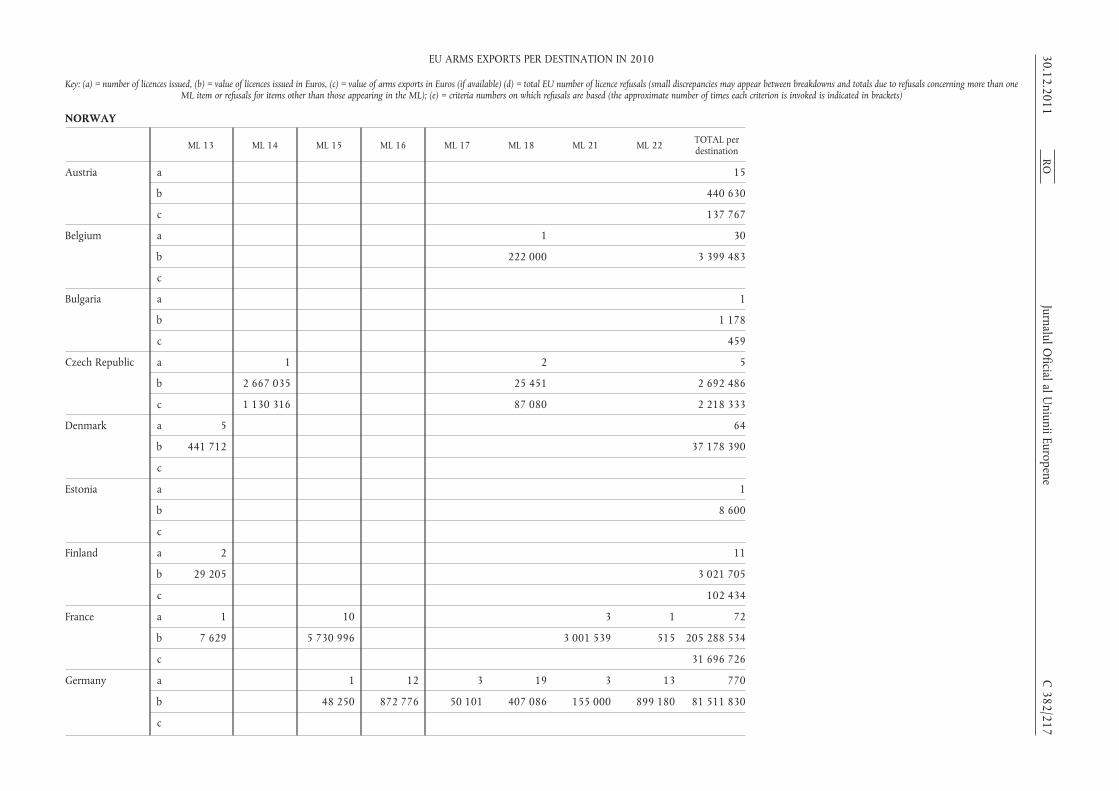
NORWAY
ML 13 ML 14 ML 15 ML 16 ML 17 ML 18 ML 21 ML 22 TOTAL perdestination
Austria a 15
b 440 630
c 137 767
Belgium a 1 30
b 222 000 3 399 483
c
Bulgaria a 1
b 1 178
c 459
Czech Republic a 1 2 5
b 2 667 035 25 451 2 692 486
c 1 130 316 87 080 2 218 333
Denmark a 5 64
b 441 712 37 178 390
c
Estonia a 1
b 8 600
c
Finland a 2 11
b 29 205 3 021 705
c 102 434
France a 1 10 3 1 72
b 7 629 5 730 996 3 001 539 515 205 288 534
c 31 696 726
Germany a 1 12 3 19 3 13 770
b 48 250 872 776 50 101 407 086 155 000 899 180 81 511 830
c
30.12.2011RO
Jurnalul OficialalU
niunii EuropeneC
382/217EU ARMS EXPORTS PER DESTINATION IN 2010
Key: (a) = number of licences issued, (b) = value of licences issued in Euros, (c) = value of arms exports in Euros (if available) (d) = total EU number of licence refusals (small discrepancies may appear between breakdowns and totals due to refusals concerning more than oneML item or refusals for items other than those appearing in the ML); (e) = criteria numbers on which refusals are based (the approximate number of times each criterion is invoked is indicated in brackets)

NORWAY
ML 13 ML 14 ML 15 ML 16 ML 17 ML 18 ML 21 ML 22 TOTAL perdestination
Greece a 2
b 1 737 087
c
Ireland a 2
b 12 800
c
Italy a 15
b 2 661 596
c 2 525 422
Lithuania a 6
b 6 242 522
c 5 011 378
Netherlands a 1 20
b 51 068 2 246 411
c 153 971 322 349
Poland a 3 1 12
b 10 639 855 384 226 11 658 715
c
Romania a 4
b 25 111
c 25 111
Slovenia a 3
b 20 826
c 20 826
Spain a 15
b 402 456 020
c 5 146 167
C382/218
ROJurnalul O
ficialalUniunii Europene
30.12.2011EU ARMS EXPORTS PER DESTINATION IN 2010
Key: (a) = number of licences issued, (b) = value of licences issued in Euros, (c) = value of arms exports in Euros (if available) (d) = total EU number of licence refusals (small discrepancies may appear between breakdowns and totals due to refusals concerning more than oneML item or refusals for items other than those appearing in the ML); (e) = criteria numbers on which refusals are based (the approximate number of times each criterion is invoked is indicated in brackets)
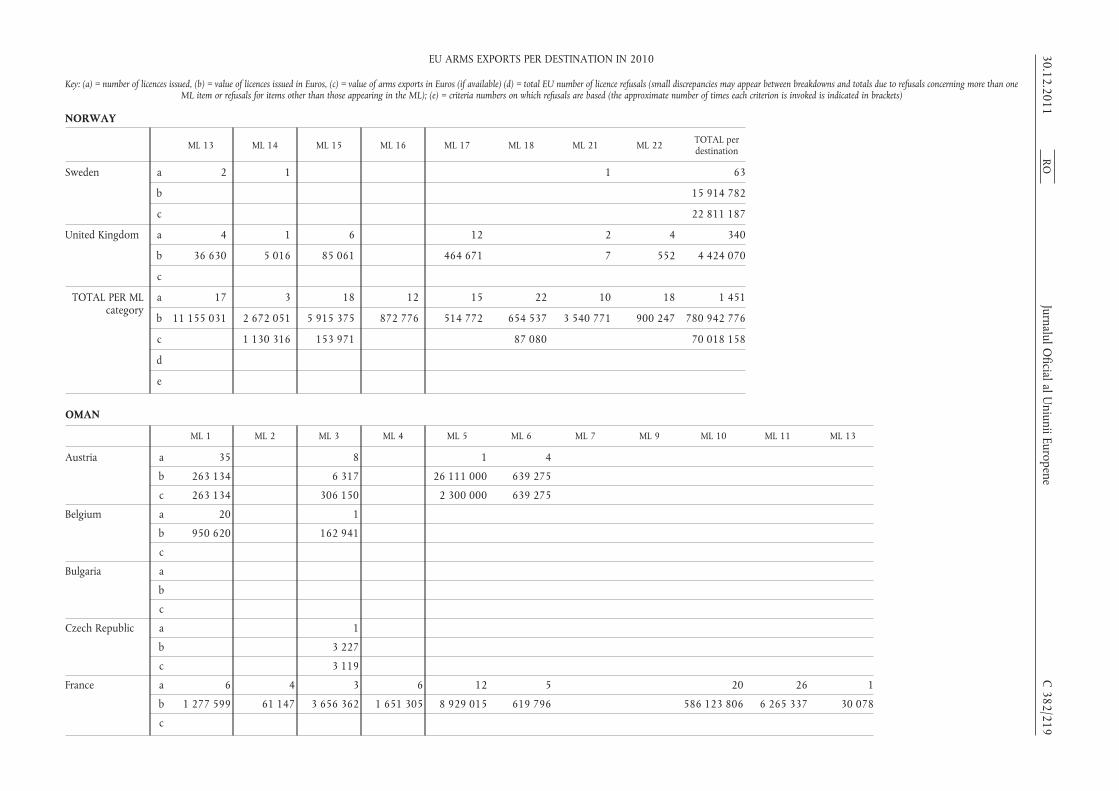
NORWAY
ML 13 ML 14 ML 15 ML 16 ML 17 ML 18 ML 21 ML 22 TOTAL perdestination
Sweden a 2 1 1 63
b 15 914 782
c 22 811 187
United Kingdom a 4 1 6 12 2 4 340
b 36 630 5 016 85 061 464 671 7 552 4 424 070
c
TOTAL PER MLcategory
a 17 3 18 12 15 22 10 18 1 451
b 11 155 031 2 672 051 5 915 375 872 776 514 772 654 537 3 540 771 900 247 780 942 776
c 1 130 316 153 971 87 080 70 018 158
d
e
OMAN
ML 1 ML 2 ML 3 ML 4 ML 5 ML 6 ML 7 ML 9 ML 10 ML 11 ML 13
Austria a 35 8 1 4
b 263 134 6 317 26 111 000 639 275
c 263 134 306 150 2 300 000 639 275
Belgium a 20 1
b 950 620 162 941
c
Bulgaria a
b
c
Czech Republic a 1
b 3 227
c 3 119
France a 6 4 3 6 12 5 20 26 1
b 1 277 599 61 147 3 656 362 1 651 305 8 929 015 619 796 586 123 806 6 265 337 30 078
c
30.12.2011RO
JurnalulOficialalU
niuniiEuropeneC
382/219EU ARMS EXPORTS PER DESTINATION IN 2010
Key: (a) = number of licences issued, (b) = value of licences issued in Euros, (c) = value of arms exports in Euros (if available) (d) = total EU number of licence refusals (small discrepancies may appear between breakdowns and totals due to refusals concerning more than oneML item or refusals for items other than those appearing in the ML); (e) = criteria numbers on which refusals are based (the approximate number of times each criterion is invoked is indicated in brackets)

OMAN
ML 1 ML 2 ML 3 ML 4 ML 5 ML 6 ML 7 ML 9 ML 10 ML 11 ML 13
Germany a 73 1 15 3 1 12 2 1 4 2
b 895 109 29 995 177 041 188 340 138 600 1 013 806 18 400 1 000 000 15 647 308 126 290
c
Italy a 1 5 1 1 1 2 5 1
b 1 057 288 11 439 338 30 700 240 800 11 197 495 24 490 55 050 566 303 296
c
Netherlands a 2 1 3
b 35 363 549 180 746
c 13 423 876 255 701 211 472
Poland a 1
b 116 600
c
Romania a 1 12
b 1 250 2 484 192
c 1 250 2 620 492
Spain a 1 8
b 331 1 100 112
c 331 3 021 192 173 672
Sweden a 5
b
c
United Kingdom a 122 9 39 9 3 44 7 124 144 1
b 462 035 1 511 519 235 85 498 59 708 568 408 396 006 055 417 948 422 341 330
c
TOTAL PER MLcategory
a 258 20 68 27 25 66 4 7 163 178 4
b 4 907 035 11 532 322 4 555 823 3 266 055 35 390 286 14 038 781 42 890 396 006 055 645 077 061 22 819 029 156 698
c 264 384 331 309 269 3 021 192 15 723 876 639 275 3 049 865 211 472
d
e
C382/220
ROJurnalul O
ficialalUniunii Europene
30.12.2011EU ARMS EXPORTS PER DESTINATION IN 2010
Key: (a) = number of licences issued, (b) = value of licences issued in Euros, (c) = value of arms exports in Euros (if available) (d) = total EU number of licence refusals (small discrepancies may appear between breakdowns and totals due to refusals concerning more than oneML item or refusals for items other than those appearing in the ML); (e) = criteria numbers on which refusals are based (the approximate number of times each criterion is invoked is indicated in brackets)

OMAN
ML 14 ML 15 ML 17 ML 18 ML 21 ML 22 TOTAL perdestination
Austria a 48
b 27 019 726
c 3 508 559
Belgium a 21
b 1 113 561
c
Bulgaria a 1 1
b 43 480 43 480
c
Czech Republic a 1
b 3 227
c 3 119
France a 22 1 1 6 113
b 8 437 584 26 168 401 036 1 251 231 618 730 463
c 221 059 062
Germany a 1 3 118
b 35 859 260 000 19 530 748
c
Italy a 17
b 79 343 974
c 17 310
Netherlands a 6
b 216 658
c 13 891 049
Poland a 1
b 116 600
c
30.12.2011RO
Jurnalul OficialalU
niunii EuropeneC
382/221EU ARMS EXPORTS PER DESTINATION IN 2010
Key: (a) = number of licences issued, (b) = value of licences issued in Euros, (c) = value of arms exports in Euros (if available) (d) = total EU number of licence refusals (small discrepancies may appear between breakdowns and totals due to refusals concerning more than oneML item or refusals for items other than those appearing in the ML); (e) = criteria numbers on which refusals are based (the approximate number of times each criterion is invoked is indicated in brackets)

OMAN
ML 14 ML 15 ML 17 ML 18 ML 21 ML 22 TOTAL perdestination
Romania a 13
b 2 485 442
c 2 621 742
Spain a 2 11
b 1 100 443
c 3 195 195
Sweden a 1 2 1 2 11
b 6 896 405
c 3 182 956
United Kingdom a 3 10 10 14 539
b 23 205 545 706 9 351 22 442 399 143 771
c
TOTAL PER MLcategory
a 4 38 10 2 6 20 900
b 23 205 9 062 628 9 351 26 168 661 036 1 273 673 1 155 744 498
c 247 478 992
d
e
PAKISTAN
ML 1 ML 2 ML 3 ML 4 ML 5 ML 6 ML 7 ML 8 ML 9 ML 10 ML 11
Belgium a 1 1
b 52 462 2 208 000
c
Bulgaria a 2
b 619 650
c 130 900 262 800
C382/222
ROJurnalul O
ficialalUniunii Europene
30.12.2011EU ARMS EXPORTS PER DESTINATION IN 2010
Key: (a) = number of licences issued, (b) = value of licences issued in Euros, (c) = value of arms exports in Euros (if available) (d) = total EU number of licence refusals (small discrepancies may appear between breakdowns and totals due to refusals concerning more than oneML item or refusals for items other than those appearing in the ML); (e) = criteria numbers on which refusals are based (the approximate number of times each criterion is invoked is indicated in brackets)

PAKISTAN
ML 1 ML 2 ML 3 ML 4 ML 5 ML 6 ML 7 ML 8 ML 9 ML 10 ML 11
Czech Republic a 5 2
b 5 065 072
c 543 072 1 342 880
Finland a
b
c
France a 1 1 26 10 1 2 55 248 13
b 3 694 20 520 2 295 291 44 647 424 25 650 834 505 48 350 272 138 797 641 10 438 218
c
Germany a 1 2 24 4 7 1 2 3 1 25
b 50 000 213 380 47 627 790 398 900 2 063 375 81 79 204 932 9 367 030 29 718 611
c
Italy a 9 9
b 3 877 598 6 641 655
c
Netherlands a 1 2 2
b 500 000 901 665 24 591
c 1 497 175 23 446 1 086 000
Poland a 2 2 2
b 3 300 155 000 156 500
c
Romania a 2 16
b 1 512 446 1 376 557
c 252 734 30 720
Slovakia a 1
b 8 755
c 8 755
30.12.2011RO
Jurnalul OficialalU
niunii EuropeneC
382/223EU ARMS EXPORTS PER DESTINATION IN 2010
Key: (a) = number of licences issued, (b) = value of licences issued in Euros, (c) = value of arms exports in Euros (if available) (d) = total EU number of licence refusals (small discrepancies may appear between breakdowns and totals due to refusals concerning more than oneML item or refusals for items other than those appearing in the ML); (e) = criteria numbers on which refusals are based (the approximate number of times each criterion is invoked is indicated in brackets)

PAKISTAN
ML 1 ML 2 ML 3 ML 4 ML 5 ML 6 ML 7 ML 8 ML 9 ML 10 ML 11
Spain a 2 1
b 51 000 000
c 390 045
Sweden a 1 4
b
c
United Kingdom a 73 5 15 12 10 4 1 21 27 24
b 768 003 8 242 584 030 1 864 632 742 500 4 837 140 5 569 89 538 397 495 1 407 518
c
TOTAL PER MLcategory
a 77 6 24 67 38 12 3 3 81 310 65
b 827 459 58 242 3 105 026 51 944 213 50 166 422 6 926 165 834 586 5 648 49 546 407 163 886 795 92 564 347
c 926 706 1 497 175 1 795 846 1 348 800
d 22 2
e 2(4) 3(3)4(12) 6(4)
7(21)
7(2)
ML 13 ML 14 ML 15 ML 16 ML 17 ML 18 ML 21 ML 22 TOTAL perdestination
Belgium a 1 2 5
b 2 684 100 000 2 363 146
c
Bulgaria a 2
b 619 650
c 393 700
Czech Republic a 2 1 10
b 1 494 662 25 228 6 584 962
c 1 313 703 25 258 255 923 3 480 837
C382/224
ROJurnalulO
ficialalUniuniiEuropene
30.12.2011EU ARMS EXPORTS PER DESTINATION IN 2010
Key: (a) = number of licences issued, (b) = value of licences issued in Euros, (c) = value of arms exports in Euros (if available) (d) = total EU number of licence refusals (small discrepancies may appear between breakdowns and totals due to refusals concerning more than oneML item or refusals for items other than those appearing in the ML); (e) = criteria numbers on which refusals are based (the approximate number of times each criterion is invoked is indicated in brackets)

PAKISTAN
ML 13 ML 14 ML 15 ML 16 ML 17 ML 18 ML 21 ML 22 TOTAL perdestination
Finland a 2 2
b 61 600 61 600
c 59 600 59 600
France a 2 15 9 383
b 15 647 14 755 100 1 040 302 261 224 263
c 73 171 885
Germany a 1 3 3 3 4 84
b 2 743 000 3 827 228 140 992 200 418 121 325 96 677 141
c
Italy a 1 19
b 31 674 10 550 927
c 25 462 000
Netherlands a 5
b 1 426 256
c 2 606 621
Poland a 6
b 314 800
c
Romania a 18
b 2 889 003
c 283 454
Slovakia a 1
b 8 755
c 8 755
Spain a 1 5 9
b 1 300 000 25 825 000 78 125 000
c 390 045
30.12.2011RO
Jurnalul OficialalU
niunii EuropeneC
382/225EU ARMS EXPORTS PER DESTINATION IN 2010
Key: (a) = number of licences issued, (b) = value of licences issued in Euros, (c) = value of arms exports in Euros (if available) (d) = total EU number of licence refusals (small discrepancies may appear between breakdowns and totals due to refusals concerning more than oneML item or refusals for items other than those appearing in the ML); (e) = criteria numbers on which refusals are based (the approximate number of times each criterion is invoked is indicated in brackets)

PAKISTAN
ML 13 ML 14 ML 15 ML 16 ML 17 ML 18 ML 21 ML 22 TOTAL perdestination
Sweden a 5
b 20 370 920
c 142 172 049
United Kingdom a 13 1 6 2 20 234
b 237 892 2 200 299 200 44 000 13 409 11 301 368
c
TOTAL PER MLcategory
a 18 8 26 3 2 3 3 34 783
b 3 058 139 6 626 774 40 879 300 140 992 44 000 125 228 200 418 1 206 710 492 517 791
c 59 600 1 313 703 25 258 255 923 248 028 946
d 1 25
e 2(1) 3(1)7(1)
2(5) 3(4)4(12) 6(4)
7(24)
C382/226
ROJurnalul O
ficialalUniunii Europene
30.12.2011EU ARMS EXPORTS PER DESTINATION IN 2010
Key: (a) = number of licences issued, (b) = value of licences issued in Euros, (c) = value of arms exports in Euros (if available) (d) = total EU number of licence refusals (small discrepancies may appear between breakdowns and totals due to refusals concerning more than oneML item or refusals for items other than those appearing in the ML); (e) = criteria numbers on which refusals are based (the approximate number of times each criterion is invoked is indicated in brackets)
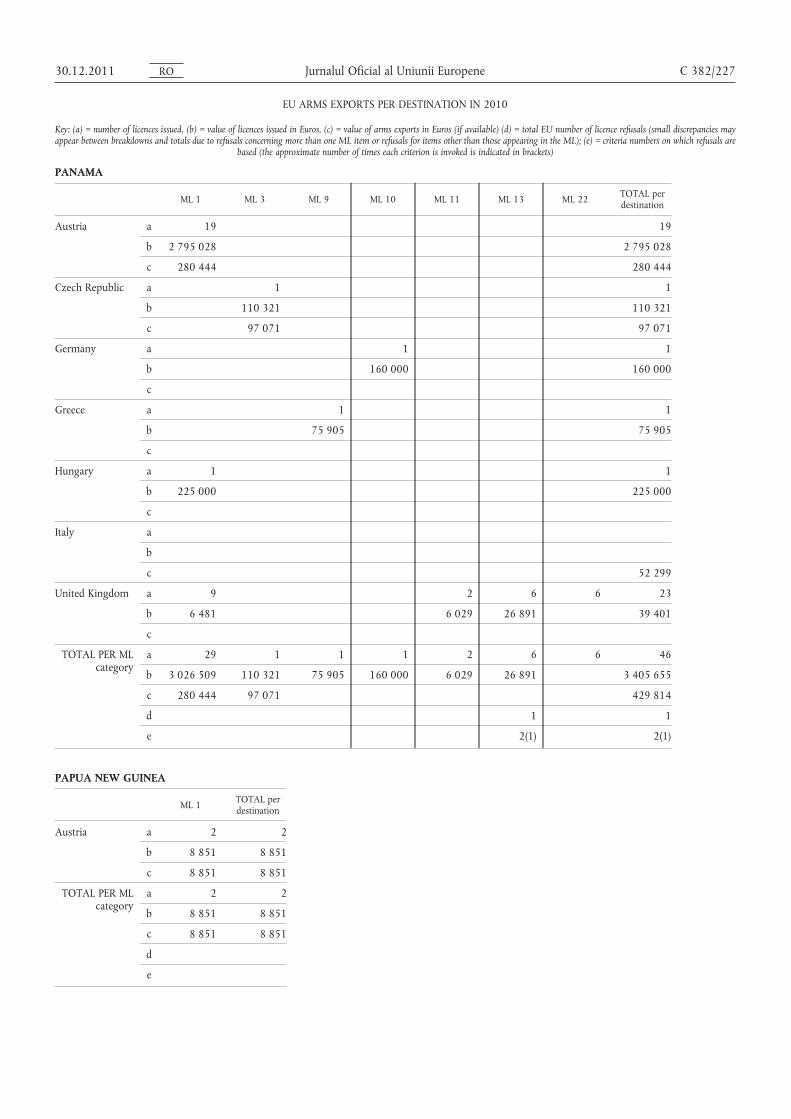
PANAMA
ML 1 ML 3 ML 9 ML 10 ML 11 ML 13 ML 22 TOTAL perdestination
Austria a 19 19
b 2 795 028 2 795 028
c 280 444 280 444
Czech Republic a 1 1
b 110 321 110 321
c 97 071 97 071
Germany a 1 1
b 160 000 160 000
c
Greece a 1 1
b 75 905 75 905
c
Hungary a 1 1
b 225 000 225 000
c
Italy a
b
c 52 299
United Kingdom a 9 2 6 6 23
b 6 481 6 029 26 891 39 401
c
TOTAL PER MLcategory
a 29 1 1 1 2 6 6 46
b 3 026 509 110 321 75 905 160 000 6 029 26 891 3 405 655
c 280 444 97 071 429 814
d 1 1
e 2(1) 2(1)
PAPUA NEW GUINEA
ML 1 TOTAL perdestination
Austria a 2 2
b 8 851 8 851
c 8 851 8 851
TOTAL PER MLcategory
a 2 2
b 8 851 8 851
c 8 851 8 851
d
e
30.12.2011 RO Jurnalul Oficial al Uniunii Europene C 382/227
EU ARMS EXPORTS PER DESTINATION IN 2010
Key: (a) = number of licences issued, (b) = value of licences issued in Euros, (c) = value of arms exports in Euros (if available) (d) = total EU number of licence refusals (small discrepancies mayappear between breakdowns and totals due to refusals concerning more than one ML item or refusals for items other than those appearing in the ML); (e) = criteria numbers on which refusals are
based (the approximate number of times each criterion is invoked is indicated in brackets)

PARAGUAY
ML 1 ML 3 ML 10 TOTAL perdestination
Austria a 1 1
b 190 000 190 000
c 190 000 190 000
Czech Republic a 1 1
b 7 909 7 909
c
Spain a
b
c 44 022 44 022
United Kingdom a 6 6
b 19 849 19 849
c
TOTAL PER MLcategory
a 8 8
b 217 758 217 758
c 190 000 44 022 234 022
d 1 1 2
e 7(1) 7(1) 7(2)
C 382/228 RO Jurnalul Oficial al Uniunii Europene 30.12.2011
EU ARMS EXPORTS PER DESTINATION IN 2010
Key: (a) = number of licences issued, (b) = value of licences issued in Euros, (c) = value of arms exports in Euros (if available) (d) = total EU number of licence refusals (small discrepancies mayappear between breakdowns and totals due to refusals concerning more than one ML item or refusals for items other than those appearing in the ML); (e) = criteria numbers on which refusals are
based (the approximate number of times each criterion is invoked is indicated in brackets)
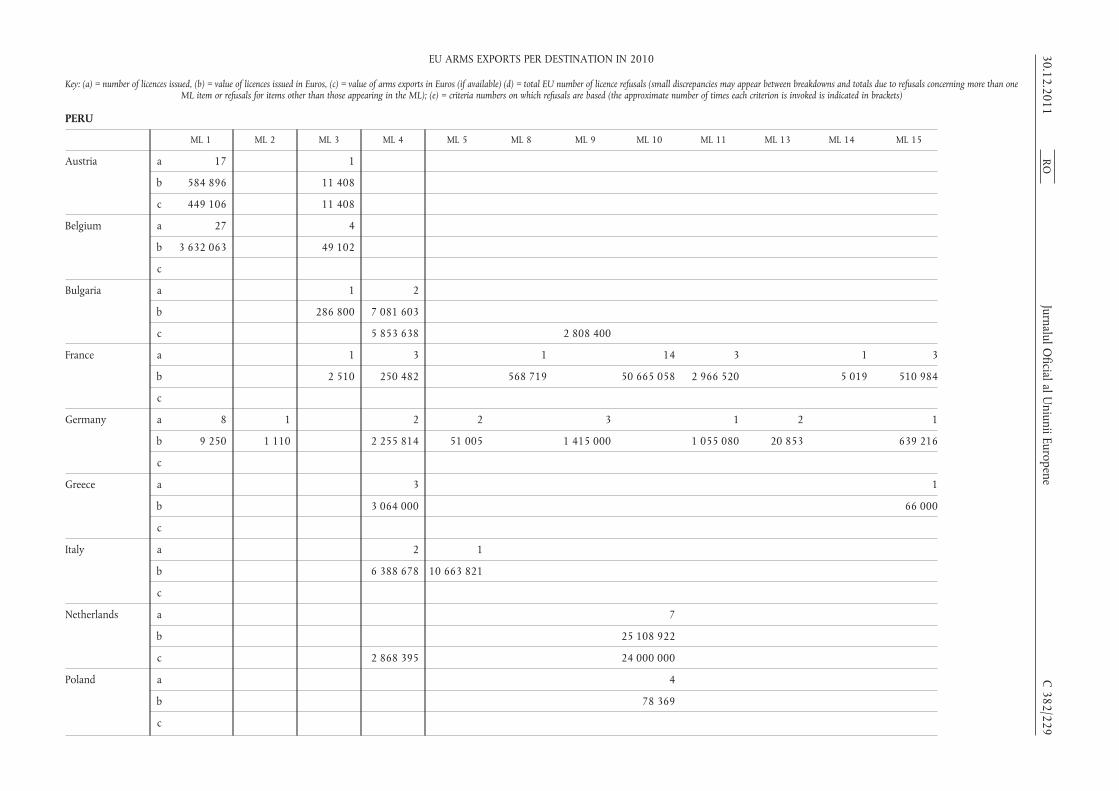
PERU
ML 1 ML 2 ML 3 ML 4 ML 5 ML 8 ML 9 ML 10 ML 11 ML 13 ML 14 ML 15
Austria a 17 1
b 584 896 11 408
c 449 106 11 408
Belgium a 27 4
b 3 632 063 49 102
c
Bulgaria a 1 2
b 286 800 7 081 603
c 5 853 638 2 808 400
France a 1 3 1 14 3 1 3
b 2 510 250 482 568 719 50 665 058 2 966 520 5 019 510 984
c
Germany a 8 1 2 2 3 1 2 1
b 9 250 1 110 2 255 814 51 005 1 415 000 1 055 080 20 853 639 216
c
Greece a 3 1
b 3 064 000 66 000
c
Italy a 2 1
b 6 388 678 10 663 821
c
Netherlands a 7
b 25 108 922
c 2 868 395 24 000 000
Poland a 4
b 78 369
c
30.12.2011RO
Jurnalul OficialalU
niunii EuropeneC
382/229EU ARMS EXPORTS PER DESTINATION IN 2010
Key: (a) = number of licences issued, (b) = value of licences issued in Euros, (c) = value of arms exports in Euros (if available) (d) = total EU number of licence refusals (small discrepancies may appear between breakdowns and totals due to refusals concerning more than oneML item or refusals for items other than those appearing in the ML); (e) = criteria numbers on which refusals are based (the approximate number of times each criterion is invoked is indicated in brackets)
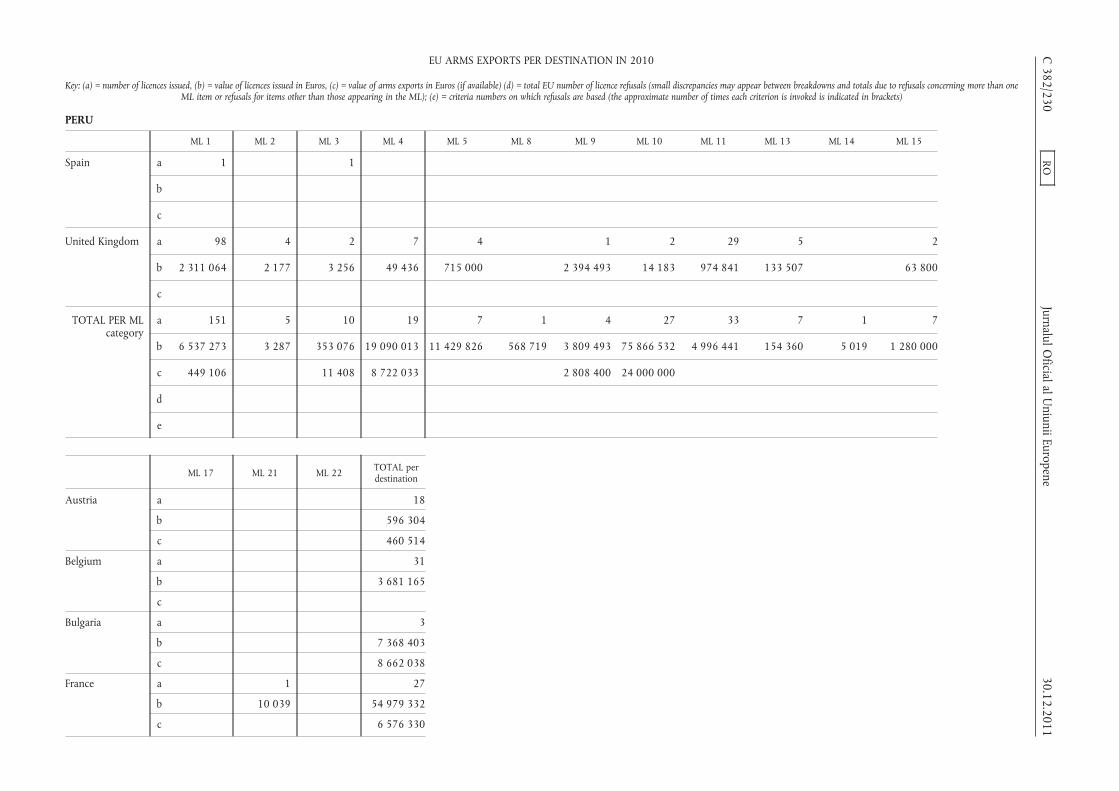
PERU
ML 1 ML 2 ML 3 ML 4 ML 5 ML 8 ML 9 ML 10 ML 11 ML 13 ML 14 ML 15
Spain a 1 1
b
c
United Kingdom a 98 4 2 7 4 1 2 29 5 2
b 2 311 064 2 177 3 256 49 436 715 000 2 394 493 14 183 974 841 133 507 63 800
c
TOTAL PER MLcategory
a 151 5 10 19 7 1 4 27 33 7 1 7
b 6 537 273 3 287 353 076 19 090 013 11 429 826 568 719 3 809 493 75 866 532 4 996 441 154 360 5 019 1 280 000
c 449 106 11 408 8 722 033 2 808 400 24 000 000
d
e
ML 17 ML 21 ML 22 TOTAL perdestination
Austria a 18
b 596 304
c 460 514
Belgium a 31
b 3 681 165
c
Bulgaria a 3
b 7 368 403
c 8 662 038
France a 1 27
b 10 039 54 979 332
c 6 576 330
C382/230
ROJurnalul O
ficialalUniunii Europene
30.12.2011EU ARMS EXPORTS PER DESTINATION IN 2010
Key: (a) = number of licences issued, (b) = value of licences issued in Euros, (c) = value of arms exports in Euros (if available) (d) = total EU number of licence refusals (small discrepancies may appear between breakdowns and totals due to refusals concerning more than oneML item or refusals for items other than those appearing in the ML); (e) = criteria numbers on which refusals are based (the approximate number of times each criterion is invoked is indicated in brackets)

PERU
ML 17 ML 21 ML 22 TOTAL perdestination
Germany a 2 22
b 162 223 5 609 551
c
Greece a 4
b 3 130 000
c
Italy a 3
b 17 052 499
c 313 993
Netherlands a 7
b 25 108 922
c 26 868 395
Poland a 4
b 78 369
c
Spain a 2
b
c
United Kingdom a 3 17 174
b 842 1 085 6 663 684
c
TOTAL PER MLcategory
a 2 4 17 295
b 162 223 10 880 1 085 124 268 229
c 42 881 270
d
e
30.12.2011RO
Jurnalul OficialalU
niunii EuropeneC
382/231EU ARMS EXPORTS PER DESTINATION IN 2010
Key: (a) = number of licences issued, (b) = value of licences issued in Euros, (c) = value of arms exports in Euros (if available) (d) = total EU number of licence refusals (small discrepancies may appear between breakdowns and totals due to refusals concerning more than oneML item or refusals for items other than those appearing in the ML); (e) = criteria numbers on which refusals are based (the approximate number of times each criterion is invoked is indicated in brackets)

PHILIPPINES
ML 1 ML 2 ML 3 ML 5 ML 6 ML 10 ML 11 ML 13 ML 15 ML 16 ML 18 TOTAL perdestination
Austria a 1 1
b 9 942 9 942
c 9 942 9 942
Belgium a 2 2
b 335 060 335 060
c
Bulgaria a 3 3
b 444 612 444 612
c 444 612 444 612
Czech Republic a 3 3
b 601 820 601 820
c 365 297 365 297
France a 2 2
b 472 900 472 900
c 76 510
Germany a 17 2 3 1 1 24
b 626 600 3 000 151 000 80 000 981 805 1 842 405
c
Hungary a 1 1
b 120 850 120 850
c 111 100 111 100
Italy a
b
c 40 940
Romania a 2 3 5
b 40 959 26 778 67 737
c
C382/232
ROJurnalul O
ficialalUniunii Europene
30.12.2011EU ARMS EXPORTS PER DESTINATION IN 2010
Key: (a) = number of licences issued, (b) = value of licences issued in Euros, (c) = value of arms exports in Euros (if available) (d) = total EU number of licence refusals (small discrepancies may appear between breakdowns and totals due to refusals concerning more than oneML item or refusals for items other than those appearing in the ML); (e) = criteria numbers on which refusals are based (the approximate number of times each criterion is invoked is indicated in brackets)
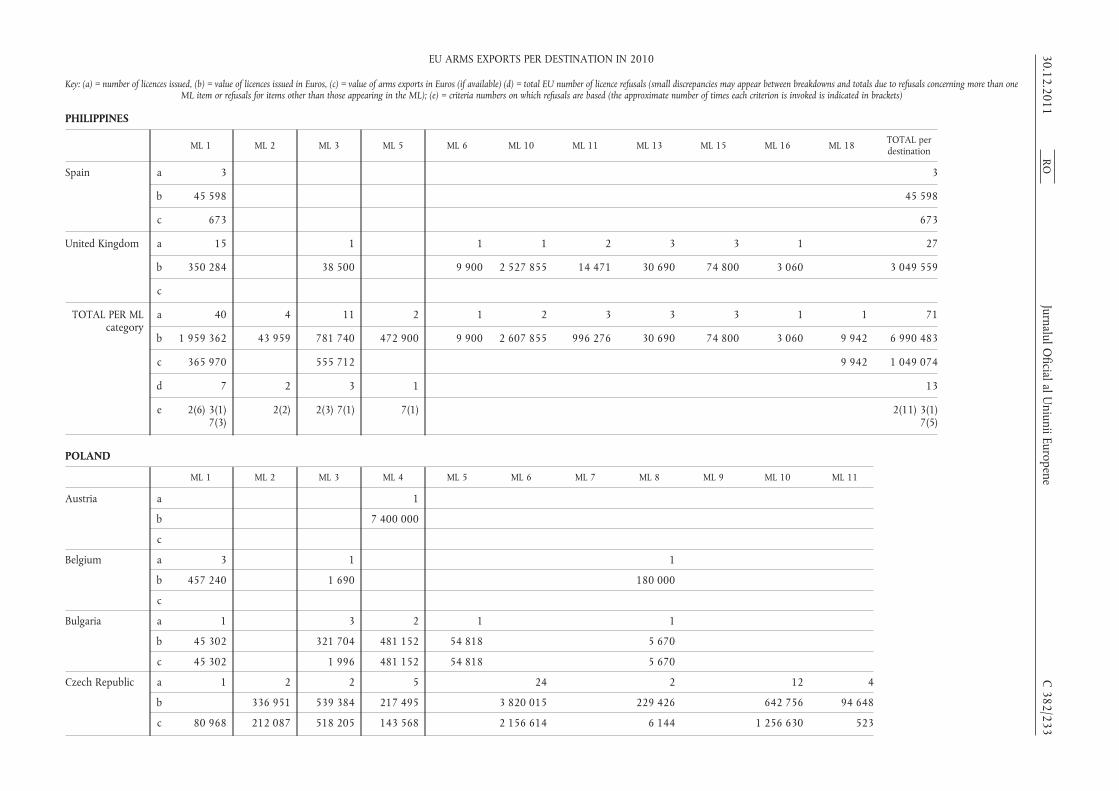
PHILIPPINES
ML 1 ML 2 ML 3 ML 5 ML 6 ML 10 ML 11 ML 13 ML 15 ML 16 ML 18 TOTAL perdestination
Spain a 3 3
b 45 598 45 598
c 673 673
United Kingdom a 15 1 1 1 2 3 3 1 27
b 350 284 38 500 9 900 2 527 855 14 471 30 690 74 800 3 060 3 049 559
c
TOTAL PER MLcategory
a 40 4 11 2 1 2 3 3 3 1 1 71
b 1 959 362 43 959 781 740 472 900 9 900 2 607 855 996 276 30 690 74 800 3 060 9 942 6 990 483
c 365 970 555 712 9 942 1 049 074
d 7 2 3 1 13
e 2(6) 3(1)7(3)
2(2) 2(3) 7(1) 7(1) 2(11) 3(1)7(5)
POLAND
ML 1 ML 2 ML 3 ML 4 ML 5 ML 6 ML 7 ML 8 ML 9 ML 10 ML 11
Austria a 1
b 7 400 000
c
Belgium a 3 1 1
b 457 240 1 690 180 000
c
Bulgaria a 1 3 2 1 1
b 45 302 321 704 481 152 54 818 5 670
c 45 302 1 996 481 152 54 818 5 670
Czech Republic a 1 2 2 5 24 2 12 4
b 336 951 539 384 217 495 3 820 015 229 426 642 756 94 648
c 80 968 212 087 518 205 143 568 2 156 614 6 144 1 256 630 523
30.12.2011RO
Jurnalul OficialalU
niunii EuropeneC
382/233EU ARMS EXPORTS PER DESTINATION IN 2010
Key: (a) = number of licences issued, (b) = value of licences issued in Euros, (c) = value of arms exports in Euros (if available) (d) = total EU number of licence refusals (small discrepancies may appear between breakdowns and totals due to refusals concerning more than oneML item or refusals for items other than those appearing in the ML); (e) = criteria numbers on which refusals are based (the approximate number of times each criterion is invoked is indicated in brackets)

POLAND
ML 1 ML 2 ML 3 ML 4 ML 5 ML 6 ML 7 ML 8 ML 9 ML 10 ML 11
Denmark a 2 1 1
b 14 513 1 733 521 14 724 451
c
Estonia a
b
c
Finland a 1 2 1
b 474 000 3 336 733 670
c 7 575 13 206 246 400 15 222 340 3 096 749 382 846 496
France a 1 2 1 3 2 1 4 20
b 10 344 2 353 80 043 941 238 1 183 402 1 155 313 1 685 725 5 129 036
c
Germany a 16 7 10 3 17 73 7 10 47
b 1 237 021 178 726 380 378 8 044 1 497 719 8 190 610 178 454 135 865 1 195 493
c
Hungary a 1
b 125 000
c
Italy a 6 3 1 5
b 20 218 134 2 144 586 293 800 5 459 709
c
Latvia a 1
b 42 000
c 42 000
Lithuania a 3 1
b 105 541 32 355
c 29 341 32 355
C382/234
ROJurnalul O
ficialalUniunii Europene
30.12.2011EU ARMS EXPORTS PER DESTINATION IN 2010
Key: (a) = number of licences issued, (b) = value of licences issued in Euros, (c) = value of arms exports in Euros (if available) (d) = total EU number of licence refusals (small discrepancies may appear between breakdowns and totals due to refusals concerning more than oneML item or refusals for items other than those appearing in the ML); (e) = criteria numbers on which refusals are based (the approximate number of times each criterion is invoked is indicated in brackets)

POLAND
ML 1 ML 2 ML 3 ML 4 ML 5 ML 6 ML 7 ML 8 ML 9 ML 10 ML 11
Netherlands a 4 2
b 3 917 41 286
c 2 500 789 580 11 284
Romania a 3 1 1
b 214 433 445 354 1 415 101
c 18 769 1 415 101
Slovakia a 1 2 18 2
b 71 900 45 903 1 270 593 608 000
c 71 900 42 185 588 242 48 000
Spain a 2 1
b 748 340
c 748 340 378 024
Sweden a 1 7
b
c
United Kingdom a 45 1 9 5 5 3 102 19 19
b 1 873 245 29 876 57 774 93 399 136 641 280 445 1 636 747 130 917 69 418
c
TOTAL PER MLcategory
a 74 18 36 19 31 122 104 12 8 52 96
b 3 903 058 21 219 385 2 677 068 8 321 419 4 789 515 15 163 865 1 640 083 1 570 409 1 911 975 5 426 389 26 672 756
c 227 014 1 001 667 1 353 273 882 404 54 818 17 967 196 3 096 11 814 3 921 492 847 019
d
e
30.12.2011RO
Jurnalul OficialalU
niunii EuropeneC
382/235EU ARMS EXPORTS PER DESTINATION IN 2010
Key: (a) = number of licences issued, (b) = value of licences issued in Euros, (c) = value of arms exports in Euros (if available) (d) = total EU number of licence refusals (small discrepancies may appear between breakdowns and totals due to refusals concerning more than oneML item or refusals for items other than those appearing in the ML); (e) = criteria numbers on which refusals are based (the approximate number of times each criterion is invoked is indicated in brackets)
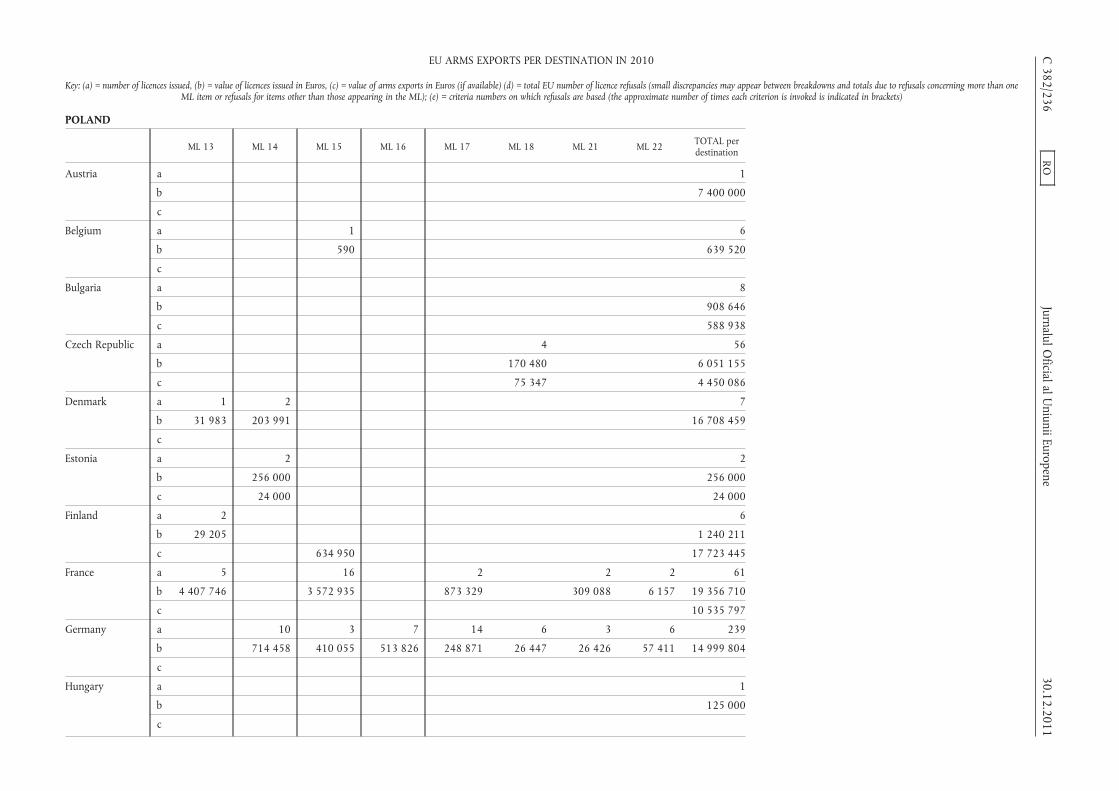
POLAND
ML 13 ML 14 ML 15 ML 16 ML 17 ML 18 ML 21 ML 22 TOTAL perdestination
Austria a 1
b 7 400 000
c
Belgium a 1 6
b 590 639 520
c
Bulgaria a 8
b 908 646
c 588 938
Czech Republic a 4 56
b 170 480 6 051 155
c 75 347 4 450 086
Denmark a 1 2 7
b 31 983 203 991 16 708 459
c
Estonia a 2 2
b 256 000 256 000
c 24 000 24 000
Finland a 2 6
b 29 205 1 240 211
c 634 950 17 723 445
France a 5 16 2 2 2 61
b 4 407 746 3 572 935 873 329 309 088 6 157 19 356 710
c 10 535 797
Germany a 10 3 7 14 6 3 6 239
b 714 458 410 055 513 826 248 871 26 447 26 426 57 411 14 999 804
c
Hungary a 1
b 125 000
c
C382/236
ROJurnalul O
ficialalUniunii Europene
30.12.2011EU ARMS EXPORTS PER DESTINATION IN 2010
Key: (a) = number of licences issued, (b) = value of licences issued in Euros, (c) = value of arms exports in Euros (if available) (d) = total EU number of licence refusals (small discrepancies may appear between breakdowns and totals due to refusals concerning more than oneML item or refusals for items other than those appearing in the ML); (e) = criteria numbers on which refusals are based (the approximate number of times each criterion is invoked is indicated in brackets)

POLAND
ML 13 ML 14 ML 15 ML 16 ML 17 ML 18 ML 21 ML 22 TOTAL perdestination
Italy a 1 16
b 547 810 28 664 040
c 13 608 066
Latvia a 1
b 42 000
c 42 000
Lithuania a 4
b 137 896
c 61 696
Netherlands a 6
b 45 203
c 803 364
Romania a 5
b 2 074 888
c 1 433 870
Slovakia a 23
b 1 996 396
c 750 327
Spain a 3
b 748 340
c 1 126 364
Sweden a 8
b 2 970 759
c 3 607 351
United Kingdom a 3 1 13 1 103 2 9 340
b 2 860 110 192 847 10 962 2 176 933 1 705 3 574 6 697 452
c
TOTAL PER MLcategory
a 11 15 34 7 17 113 7 17 793
b 4 471 794 1 174 559 4 724 237 513 826 1 133 162 2 373 860 337 219 67 142 111 062 479
c 24 000 634 950 75 347 54 755 304
d
e
30.12.2011RO
Jurnalul OficialalU
niunii EuropeneC
382/237EU ARMS EXPORTS PER DESTINATION IN 2010
Key: (a) = number of licences issued, (b) = value of licences issued in Euros, (c) = value of arms exports in Euros (if available) (d) = total EU number of licence refusals (small discrepancies may appear between breakdowns and totals due to refusals concerning more than oneML item or refusals for items other than those appearing in the ML); (e) = criteria numbers on which refusals are based (the approximate number of times each criterion is invoked is indicated in brackets)

PORTUGAL
ML 1 ML 2 ML 3 ML 4 ML 5 ML 6 ML 7 ML 8 ML 9 ML 10 ML 11
Austria a 5
b 347 452 180
c 15 567 132
Belgium a 1 1
b 1 152 10 000 000
c
CzechRepublic a 5
b 645 301
c 641 653
Denmark a
b
c
Finland a 1 1 1
b 540 000 27 900 627
c 627
France a 2 1 3 1 12 5
b 51 317 122 329 623 146 14 151 1 016 888 139 456
c
Germany a 1 3 2 1 25 15 6 20
b 21 1 747 499 1 267 500 000 1 999 109 805 172 455 22 033 2 216 326
c
Hungary a 2
b 117 812
c
C382/238
ROJurnalul O
ficialalUniunii Europene
30.12.2011EU ARMS EXPORTS PER DESTINATION IN 2010
Key: (a) = number of licences issued, (b) = value of licences issued in Euros, (c) = value of arms exports in Euros (if available) (d) = total EU number of licence refusals (small discrepancies may appear between breakdowns and totals due to refusals concerning more than oneML item or refusals for items other than those appearing in the ML); (e) = criteria numbers on which refusals are based (the approximate number of times each criterion is invoked is indicated in brackets)

PORTUGAL
ML 1 ML 2 ML 3 ML 4 ML 5 ML 6 ML 7 ML 8 ML 9 ML 10 ML 11
Italy a 3 1 3 4
b 19 747 500 304 000 284 595 320 784
c
Netherlands a 3
b 655 634
c 20 000 6 639 160 1 321 321 120 000 000
Poland a
b
c
Spain a 7 2 1 1 3
b 7 898 599 400 477 946 214 860
c 12 077 112 946 634 455 151 062 212 038 42 840 654
Sweden a 1 1 1
b
c
United Kingdom a 25 7 2 13 4 3
b 396 112 424 2 475 131 846 14 410 3 886
c
TOTAL PER MLcategory
a 36 2 19 8 7 33 15 1 16 30 32
b 996 479 21 2 538 936 20 470 496 1 778 780 349 931 710 146 624 214 860 805 476 455 11 337 926 2 680 451
c 12 077 112 946 661 653 7 273 615 1 321 321 15 718 194 627 212 038 120 000 000 42 840 654
d
e
30.12.2011RO
Jurnalul OficialalU
niunii EuropeneC
382/239EU ARMS EXPORTS PER DESTINATION IN 2010
Key: (a) = number of licences issued, (b) = value of licences issued in Euros, (c) = value of arms exports in Euros (if available) (d) = total EU number of licence refusals (small discrepancies may appear between breakdowns and totals due to refusals concerning more than oneML item or refusals for items other than those appearing in the ML); (e) = criteria numbers on which refusals are based (the approximate number of times each criterion is invoked is indicated in brackets)

PORTUGAL
ML 13 ML 14 ML 15 ML 17 ML 18 ML 21 ML 22 TOTAL perdestination
Austria a 5
b 347 452 180
c 15 567 132
Belgium a 2
b 10 001 152
c
CzechRepublic a 5
b 645 301
c 641 653
Denmark a 1 1
b 6 047 6 047
c
Finland a 2 5
b 29 205 597 732
c 627
France a 1 9 2 36
b 68 994 19 827 150 97 864 21 961 294
c 6 278 197
Germany a 3 6 3 1 3 89
b 36 149 29 880 3 655 5 000 5 807 811 739 201
c
Hungary a 2
b 117 812
c
Italy a 11
b 20 656 879
c 863 202
C382/240
ROJurnalul O
ficialalUniunii Europene
30.12.2011EU ARMS EXPORTS PER DESTINATION IN 2010
Key: (a) = number of licences issued, (b) = value of licences issued in Euros, (c) = value of arms exports in Euros (if available) (d) = total EU number of licence refusals (small discrepancies may appear between breakdowns and totals due to refusals concerning more than oneML item or refusals for items other than those appearing in the ML); (e) = criteria numbers on which refusals are based (the approximate number of times each criterion is invoked is indicated in brackets)

PORTUGAL
ML 13 ML 14 ML 15 ML 17 ML 18 ML 21 ML 22 TOTAL perdestination
Netherlands a 1 1 5
b 885 000 29 250 1 569 884
c 29 250 128 009 731
Poland a 1 1
b 633 633
c
Spain a 14
b 1 300 104
c 43 963 232
Sweden a 3
b 212 197
c 74 269
United Kingdom a 9 1 1 65
b 2 183 676 19 008 110 2 751 947
c
TOTAL PER MLcategory
a 13 1 12 8 3 5 3 244
b 2 282 508 885 000 19 863 299 78 138 3 655 109 021 5 807 1 219 012 362
c 29 250 195 398 043
d
e
30.12.2011RO
Jurnalul OficialalU
niunii EuropeneC
382/241EU ARMS EXPORTS PER DESTINATION IN 2010
Key: (a) = number of licences issued, (b) = value of licences issued in Euros, (c) = value of arms exports in Euros (if available) (d) = total EU number of licence refusals (small discrepancies may appear between breakdowns and totals due to refusals concerning more than oneML item or refusals for items other than those appearing in the ML); (e) = criteria numbers on which refusals are based (the approximate number of times each criterion is invoked is indicated in brackets)

QATAR
ML 1 ML 2 ML 3 ML 4 ML 5 ML 6 ML 7 ML 10 ML 11 ML 12 ML 13
Austria a 3 1
b 99 448 3 000
c 99 448
Belgium a 5 1
b 119 362 31 336
c
Czech Republic a 1
b 4 441
c 4 940
France a 1 2 2 16 20 15 2 51 8 1 3
b 1 069 4 917 061 2 531 217 18 848 785 33 523 929 6 018 272 324 954 33 143 885 8 892 170 245 853 63 310
c
Germany a 6 2 1 1 2 3
b 198 542 171 000 280 000 6 720 205 220 2 478 550
c
Greece a 1 1
b 2 792 2 000 000
c
Italy a 1
b 5 650
c
Netherlands a 2
b 183 192
c 839 652
Spain a 6 1
b 884 110 154 000
c 876 596 153 888
C382/242
ROJurnalul O
ficialalUniunii Europene
30.12.2011EU ARMS EXPORTS PER DESTINATION IN 2010
Key: (a) = number of licences issued, (b) = value of licences issued in Euros, (c) = value of arms exports in Euros (if available) (d) = total EU number of licence refusals (small discrepancies may appear between breakdowns and totals due to refusals concerning more than oneML item or refusals for items other than those appearing in the ML); (e) = criteria numbers on which refusals are based (the approximate number of times each criterion is invoked is indicated in brackets)

QATAR
ML 1 ML 2 ML 3 ML 4 ML 5 ML 6 ML 7 ML 10 ML 11 ML 12 ML 13
Sweden a 1
b
c
United Kingdom a 43 2 21 1 30 8 5
b 1 074 617 5 684 224 490 44 000 334 290 482 780 361 295
c
TOTAL PER MLcategory
a 58 3 8 37 24 23 34 54 20 1 8
b 1 493 038 4 922 711 2 715 343 19 073 275 33 751 121 7 213 718 668 756 35 349 105 12 007 500 245 853 424 606
c 99 448 4 940 839 652 876 596 153 888
d
e
ML 14 ML 15 ML 17 ML 21 ML 22 TOTAL perdestination
Austria a 4
b 102 448
c 99 448
Belgium a 6
b 150 698
c
Czech Republic a 1
b 4 441
c 4 940
France a 8 1 1 3 134
b 5 790 374 2 137 853 437 049 1 944 911 118 820 691
c 36 923 933
30.12.2011RO
Jurnalul OficialalU
niunii EuropeneC
382/243EU ARMS EXPORTS PER DESTINATION IN 2010
Key: (a) = number of licences issued, (b) = value of licences issued in Euros, (c) = value of arms exports in Euros (if available) (d) = total EU number of licence refusals (small discrepancies may appear between breakdowns and totals due to refusals concerning more than oneML item or refusals for items other than those appearing in the ML); (e) = criteria numbers on which refusals are based (the approximate number of times each criterion is invoked is indicated in brackets)

QATAR
ML 14 ML 15 ML 17 ML 21 ML 22 TOTAL perdestination
Germany a 1 1 17
b 576 576 75 750 3 992 358
c
Greece a 2
b 2 002 792
c
Italy a 1
b 5 650
c 114 135
Netherlands a 2
b 183 192
c 839 652
Spain a 7
b 1 038 110
c 1 030 484
Sweden a 1
b 5 305
c
United Kingdom a 5 1 3 8 127
b 540 777 44 000 123 233 1 268 827 4 503 994
c
TOTAL PER MLcategory
a 6 10 1 4 11 302
b 1 117 353 5 910 124 2 137 853 560 282 3 213 738 130 809 678
c 39 012 592
d
e
C382/244
ROJurnalul O
ficialalUniunii Europene
30.12.2011EU ARMS EXPORTS PER DESTINATION IN 2010
Key: (a) = number of licences issued, (b) = value of licences issued in Euros, (c) = value of arms exports in Euros (if available) (d) = total EU number of licence refusals (small discrepancies may appear between breakdowns and totals due to refusals concerning more than oneML item or refusals for items other than those appearing in the ML); (e) = criteria numbers on which refusals are based (the approximate number of times each criterion is invoked is indicated in brackets)

REPUBLIC OF MOLDOVA
ML 1 ML 3 ML 4 ML 10 TOTAL perdestination
Austria a 7 7
b 60 769 60 769
c 58 904 58 904
Bulgaria a 2 2
b 507 633 507 633
c 507 633 507 633
Czech Republic a 1 1
b 16 353 16 353
c 11 800 23 596 35 396
Italy a
b
c 143 224
Romania a 4 1 5
b 2 948 147 092 150 040
c 2 948 2 948
United Kingdom a 12 12
b 8 712 8 712
c
TOTAL PER MLcategory
a 24 2 1 27
b 88 782 507 633 147 092 743 507
c 73 652 23 596 507 633 748 105
d
e
30.12.2011 RO Jurnalul Oficial al Uniunii Europene C 382/245
EU ARMS EXPORTS PER DESTINATION IN 2010
Key: (a) = number of licences issued, (b) = value of licences issued in Euros, (c) = value of arms exports in Euros (if available) (d) = total EU number of licence refusals (small discrepancies mayappear between breakdowns and totals due to refusals concerning more than one ML item or refusals for items other than those appearing in the ML); (e) = criteria numbers on which refusals are
based (the approximate number of times each criterion is invoked is indicated in brackets)
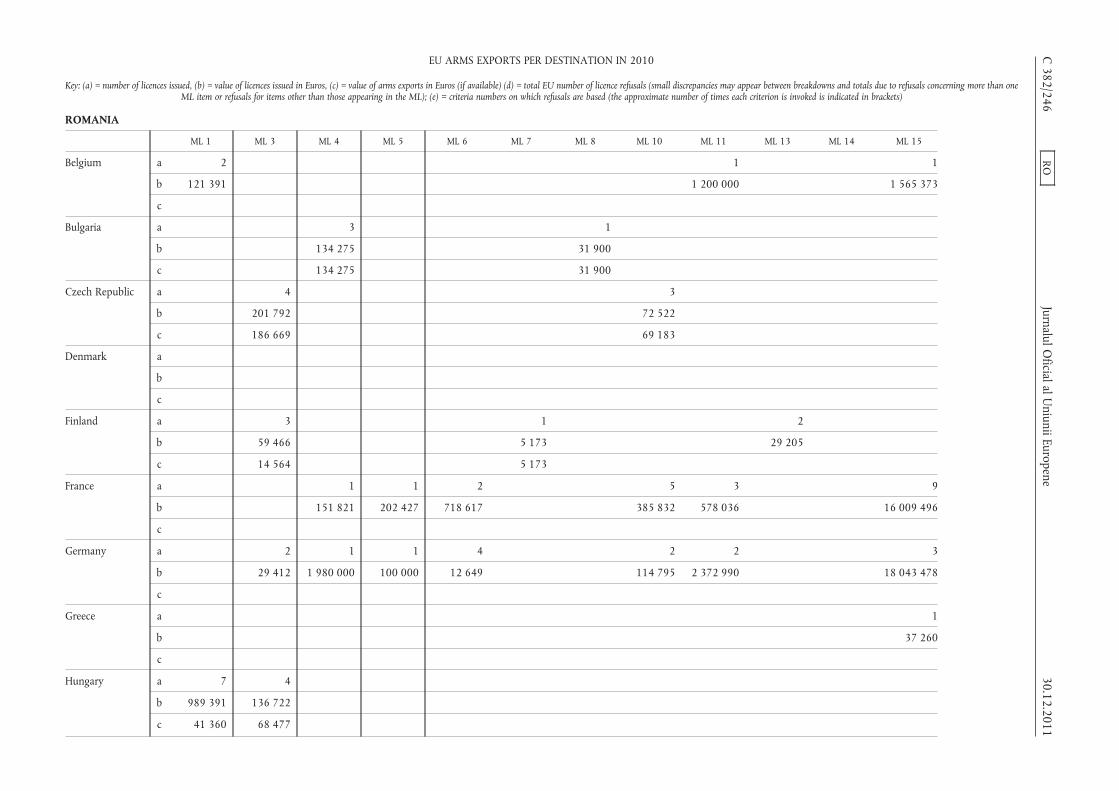
ROMANIA
ML 1 ML 3 ML 4 ML 5 ML 6 ML 7 ML 8 ML 10 ML 11 ML 13 ML 14 ML 15
Belgium a 2 1 1
b 121 391 1 200 000 1 565 373
c
Bulgaria a 3 1
b 134 275 31 900
c 134 275 31 900
Czech Republic a 4 3
b 201 792 72 522
c 186 669 69 183
Denmark a
b
c
Finland a 3 1 2
b 59 466 5 173 29 205
c 14 564 5 173
France a 1 1 2 5 3 9
b 151 821 202 427 718 617 385 832 578 036 16 009 496
c
Germany a 2 1 1 4 2 2 3
b 29 412 1 980 000 100 000 12 649 114 795 2 372 990 18 043 478
c
Greece a 1
b 37 260
c
Hungary a 7 4
b 989 391 136 722
c 41 360 68 477
C382/246
ROJurnalul O
ficialalUniunii Europene
30.12.2011EU ARMS EXPORTS PER DESTINATION IN 2010
Key: (a) = number of licences issued, (b) = value of licences issued in Euros, (c) = value of arms exports in Euros (if available) (d) = total EU number of licence refusals (small discrepancies may appear between breakdowns and totals due to refusals concerning more than oneML item or refusals for items other than those appearing in the ML); (e) = criteria numbers on which refusals are based (the approximate number of times each criterion is invoked is indicated in brackets)

ROMANIA
ML 1 ML 3 ML 4 ML 5 ML 6 ML 7 ML 8 ML 10 ML 11 ML 13 ML 14 ML 15
Italy a 1 1 2
b 19 978 7 376 222 009
c
Lithuania a 1
b 50 000
c 50 000
Netherlands a 8
b 726
c 726 8 000
Poland a 1
b 37 500
c
Spain a 5 3
b 17 785 1 485 325
c 22 695 1 059 375
Sweden a 1
b
c
United Kingdom a 27 2 1 10 8 2 2
b 5 302 22 000 157 32 604 478 433 16 500 344
c
TOTAL PER MLcategory
a 49 17 6 2 9 12 1 19 10 3 2 14
b 1 134 595 469 370 2 266 253 302 427 2 216 591 45 153 31 900 1 101 582 4 389 535 66 705 344 35 655 607
c 64 781 269 710 134 275 1 059 375 5 173 31 900 119 183 8 000
d
e
30.12.2011RO
Jurnalul OficialalU
niunii EuropeneC
382/247EU ARMS EXPORTS PER DESTINATION IN 2010
Key: (a) = number of licences issued, (b) = value of licences issued in Euros, (c) = value of arms exports in Euros (if available) (d) = total EU number of licence refusals (small discrepancies may appear between breakdowns and totals due to refusals concerning more than oneML item or refusals for items other than those appearing in the ML); (e) = criteria numbers on which refusals are based (the approximate number of times each criterion is invoked is indicated in brackets)

ROMANIA
ML 16 ML 17 ML 18 ML 20 ML 21 ML 22 TOTAL perdestination
Belgium a 4
b 2 886 764
c
Bulgaria a 4
b 166 175
c 166 175
Czech Republic a 7
b 274 314
c 255 852
Denmark a 3 3
b 61 009 61 009
c
Finland a 6
b 93 844
c 19 737
France a 1 4 26
b 53 643 129 554 18 229 426
c 5 632 479
Germany a 1 1 4 21
b 580 20 000 2 003 500 24 677 404
c
Greece a 1
b 37 260
c
Hungary a 11
b 1 126 113
c 109 837
C382/248
ROJurnalul O
ficialalUniunii Europene
30.12.2011EU ARMS EXPORTS PER DESTINATION IN 2010
Key: (a) = number of licences issued, (b) = value of licences issued in Euros, (c) = value of arms exports in Euros (if available) (d) = total EU number of licence refusals (small discrepancies may appear between breakdowns and totals due to refusals concerning more than oneML item or refusals for items other than those appearing in the ML); (e) = criteria numbers on which refusals are based (the approximate number of times each criterion is invoked is indicated in brackets)
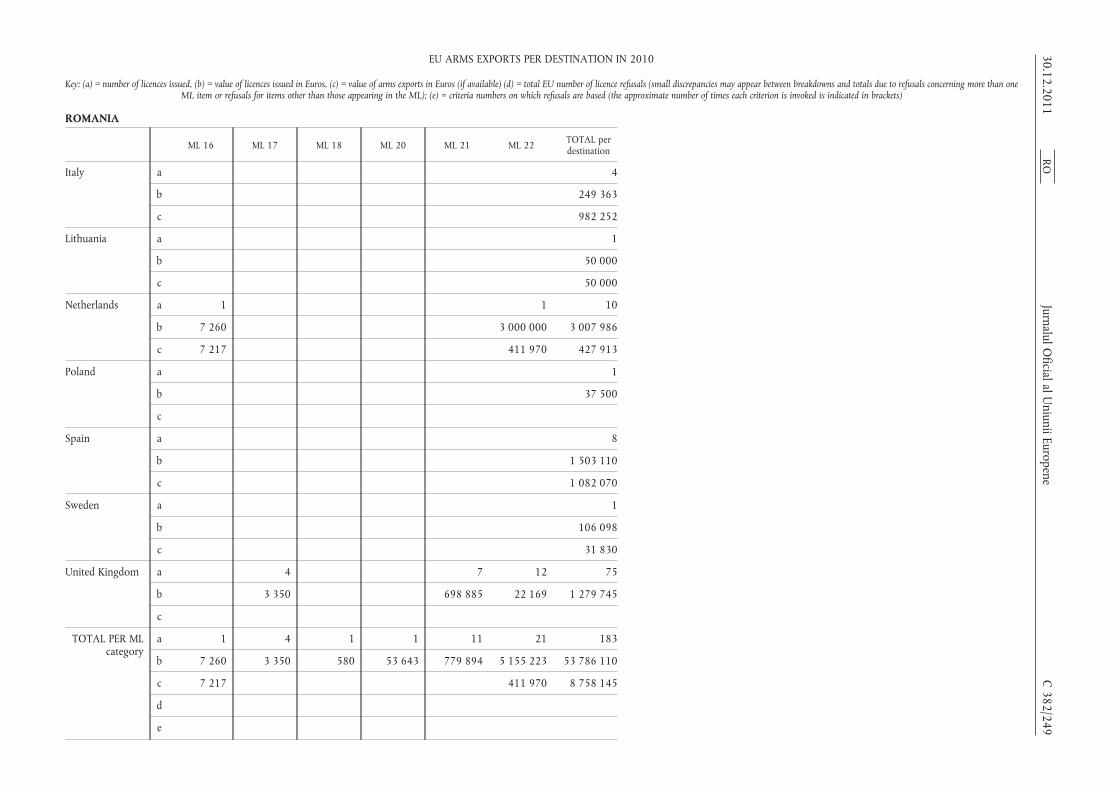
ROMANIA
ML 16 ML 17 ML 18 ML 20 ML 21 ML 22 TOTAL perdestination
Italy a 4
b 249 363
c 982 252
Lithuania a 1
b 50 000
c 50 000
Netherlands a 1 1 10
b 7 260 3 000 000 3 007 986
c 7 217 411 970 427 913
Poland a 1
b 37 500
c
Spain a 8
b 1 503 110
c 1 082 070
Sweden a 1
b 106 098
c 31 830
United Kingdom a 4 7 12 75
b 3 350 698 885 22 169 1 279 745
c
TOTAL PER MLcategory
a 1 4 1 1 11 21 183
b 7 260 3 350 580 53 643 779 894 5 155 223 53 786 110
c 7 217 411 970 8 758 145
d
e
30.12.2011RO
Jurnalul OficialalU
niunii EuropeneC
382/249EU ARMS EXPORTS PER DESTINATION IN 2010
Key: (a) = number of licences issued, (b) = value of licences issued in Euros, (c) = value of arms exports in Euros (if available) (d) = total EU number of licence refusals (small discrepancies may appear between breakdowns and totals due to refusals concerning more than oneML item or refusals for items other than those appearing in the ML); (e) = criteria numbers on which refusals are based (the approximate number of times each criterion is invoked is indicated in brackets)
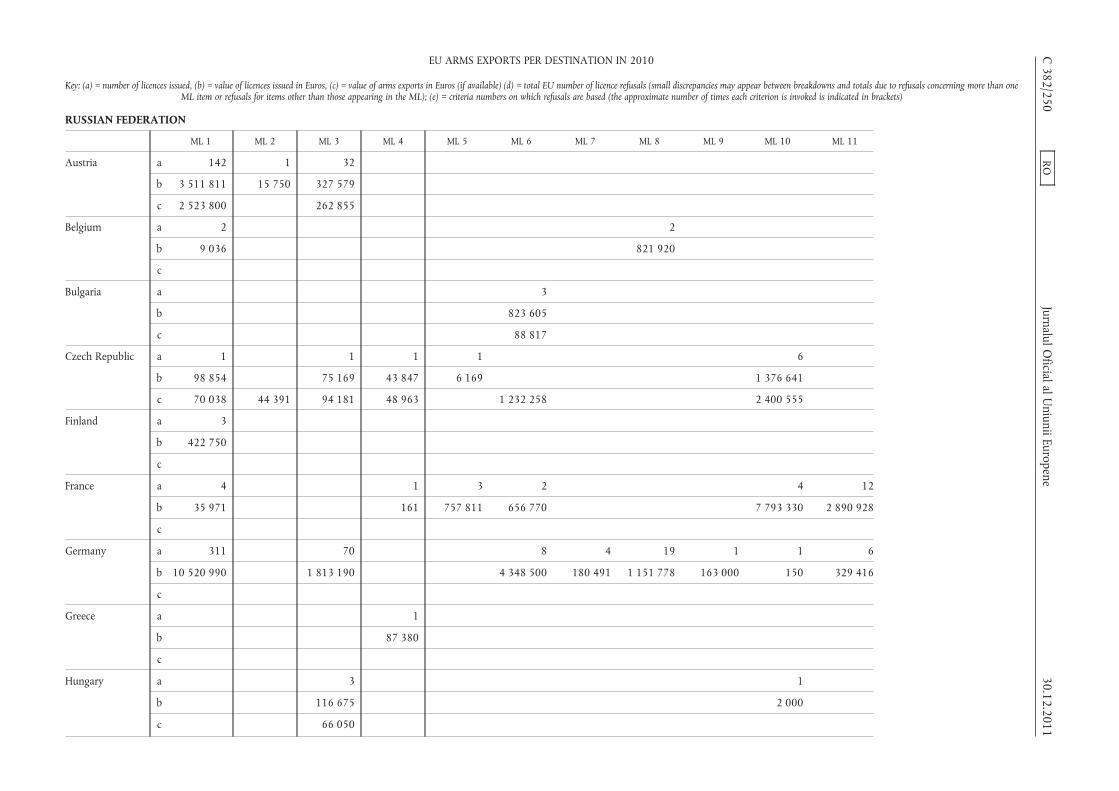
RUSSIAN FEDERATION
ML 1 ML 2 ML 3 ML 4 ML 5 ML 6 ML 7 ML 8 ML 9 ML 10 ML 11
Austria a 142 1 32
b 3 511 811 15 750 327 579
c 2 523 800 262 855
Belgium a 2 2
b 9 036 821 920
c
Bulgaria a 3
b 823 605
c 88 817
Czech Republic a 1 1 1 1 6
b 98 854 75 169 43 847 6 169 1 376 641
c 70 038 44 391 94 181 48 963 1 232 258 2 400 555
Finland a 3
b 422 750
c
France a 4 1 3 2 4 12
b 35 971 161 757 811 656 770 7 793 330 2 890 928
c
Germany a 311 70 8 4 19 1 1 6
b 10 520 990 1 813 190 4 348 500 180 491 1 151 778 163 000 150 329 416
c
Greece a 1
b 87 380
c
Hungary a 3 1
b 116 675 2 000
c 66 050
C382/250
ROJurnalul O
ficialalUniunii Europene
30.12.2011EU ARMS EXPORTS PER DESTINATION IN 2010
Key: (a) = number of licences issued, (b) = value of licences issued in Euros, (c) = value of arms exports in Euros (if available) (d) = total EU number of licence refusals (small discrepancies may appear between breakdowns and totals due to refusals concerning more than oneML item or refusals for items other than those appearing in the ML); (e) = criteria numbers on which refusals are based (the approximate number of times each criterion is invoked is indicated in brackets)

RUSSIAN FEDERATION
ML 1 ML 2 ML 3 ML 4 ML 5 ML 6 ML 7 ML 8 ML 9 ML 10 ML 11
Italy a 1 1
b 470 000 59 720
c
Malta a 2
b 2 700
c 1 200
Poland a 1
b 9 800
c
Slovakia a 2
b 202 796
c
Slovenia a
b 37 520
c
Sweden a 3
b
c
United Kingdom a 153 5 17 6 4 2
b 3 078 980 825 000 8 220 350 194 564 258 518 2 399
c
TOTAL PER MLcategory
a 619 1 114 3 4 30 4 21 7 19 21
b 18 151 092 15 750 3 157 613 168 908 763 980 14 049 224 180 491 1 973 698 357 564 9 643 234 3 282 463
c 2 595 038 44 391 423 086 48 963 1 321 075 2 400 555
d 3 1 1 2
e 7(3) 7(1) 7(1) 5(1) 7(2)
30.12.2011RO
Jurnalul OficialalU
niunii EuropeneC
382/251EU ARMS EXPORTS PER DESTINATION IN 2010
Key: (a) = number of licences issued, (b) = value of licences issued in Euros, (c) = value of arms exports in Euros (if available) (d) = total EU number of licence refusals (small discrepancies may appear between breakdowns and totals due to refusals concerning more than oneML item or refusals for items other than those appearing in the ML); (e) = criteria numbers on which refusals are based (the approximate number of times each criterion is invoked is indicated in brackets)

RUSSIAN FEDERATION
ML 13 ML 15 ML 16 ML 17 ML 18 ML 22 TOTAL perdestination
Austria a 175
b 3 855 140
c 2 786 655
Belgium a 4
b 830 956
c
Bulgaria a 2 5
b 84 924 908 529
c 84 924 173 741
Czech Republic a 10
b 1 600 680
c 3 890 386
Finland a 3
b 422 750
c
France a 3 37 1 7 74
b 8 420 292 43 367 531 1 035 675 95 833 65 054 301
c 31 591 710
Germany a 4 1 1 4 430
b 3 347 33 760 6 746 52 100 18 603 468
c
Greece a 1
b 87 380
c
Hungary a 4
b 118 675
c 66 050
C382/252
ROJurnalul O
ficialalUniunii Europene
30.12.2011EU ARMS EXPORTS PER DESTINATION IN 2010
Key: (a) = number of licences issued, (b) = value of licences issued in Euros, (c) = value of arms exports in Euros (if available) (d) = total EU number of licence refusals (small discrepancies may appear between breakdowns and totals due to refusals concerning more than oneML item or refusals for items other than those appearing in the ML); (e) = criteria numbers on which refusals are based (the approximate number of times each criterion is invoked is indicated in brackets)

RUSSIAN FEDERATION
ML 13 ML 15 ML 16 ML 17 ML 18 ML 22 TOTAL perdestination
Italy a 2
b 529 720
c 14 337 672
Malta a 2
b 2 700
c 1 200
Poland a 1
b 9 800
c
Slovakia a 2
b 202 796
c
Slovenia a
b 37 520
c
Sweden a 3
b 742 690
c 1 697 577
United Kingdom a 3 7 197
b 341 000 26 631 12 947 441
c
TOTAL PER MLcategory
a 7 39 1 3 9 11 913
b 8 423 639 43 452 455 33 760 341 000 1 069 052 147 933 105 954 546
c 84 924 54 544 991
d 2 1 11 (*)
e 7(2) 7(1) 5(1) 7(11)
(*) Total number of denials also includes a denial in the ML21 category based on Criterion 7.
30.12.2011RO
Jurnalul OficialalU
niunii EuropeneC
382/253EU ARMS EXPORTS PER DESTINATION IN 2010
Key: (a) = number of licences issued, (b) = value of licences issued in Euros, (c) = value of arms exports in Euros (if available) (d) = total EU number of licence refusals (small discrepancies may appear between breakdowns and totals due to refusals concerning more than oneML item or refusals for items other than those appearing in the ML); (e) = criteria numbers on which refusals are based (the approximate number of times each criterion is invoked is indicated in brackets)

RWANDA
ML 10 TOTAL perdestination
United Kingdom a 1 1
b 64 350 64 350
c
TOTAL PER MLcategory
a 1 1
b 64 350 64 350
c
d
e
SAINT LUCIA
ML 1 ML 3 TOTAL perdestination
Austria a 4 4
b 55 262 55 262
c 6 747 6 747
Hungary a 1 1
b 14 000 14 000
c 13 965 13 965
TOTAL PER MLcategory
a 4 1 5
b 55 262 14 000 69 262
c 6 747 13 965 20 712
d
e
SAN MARINO
ML 1 ML 18 TOTAL perdestination
TOTAL PER MLcategory
a
b
c
d 1 1 2
e 7(1) 7(1) 7(2)
C 382/254 RO Jurnalul Oficial al Uniunii Europene 30.12.2011
EU ARMS EXPORTS PER DESTINATION IN 2010
Key: (a) = number of licences issued, (b) = value of licences issued in Euros, (c) = value of arms exports in Euros (if available) (d) = total EU number of licence refusals (small discrepancies mayappear between breakdowns and totals due to refusals concerning more than one ML item or refusals for items other than those appearing in the ML); (e) = criteria numbers on which refusals are
based (the approximate number of times each criterion is invoked is indicated in brackets)

SAO TOME AND PRINCIPE
ML 3 TOTAL perdestination
Italy a
b
c 23 106
Portugal a 1 1
b 13 100 13 100
c 13 100 13 100
TOTAL PER MLcategory
a 1 1
b 13 100 13 100
c 13 100 36 206
d
e
SAUDI ARABIA
ML 1 ML 2 ML 3 ML 4 ML 5 ML 6 ML 7 ML 8 ML 9 ML 10
Austria a 10 1 1
b 301 956 3 327 003 812 750
c 305 118 3 327 003 812 750
Belgium a 11 5 1
b 19 498 926 28 392 995 259 000
c
Czech Republic a 1 2
b 5 890 076 204 861
c 2 148 291 195 241
Denmark a 1
b
c
30.12.2011RO
Jurnalul OficialalU
niunii EuropeneC
382/255EU ARMS EXPORTS PER DESTINATION IN 2010
Key: (a) = number of licences issued, (b) = value of licences issued in Euros, (c) = value of arms exports in Euros (if available) (d) = total EU number of licence refusals (small discrepancies may appear between breakdowns and totals due to refusals concerning more than oneML item or refusals for items other than those appearing in the ML); (e) = criteria numbers on which refusals are based (the approximate number of times each criterion is invoked is indicated in brackets)
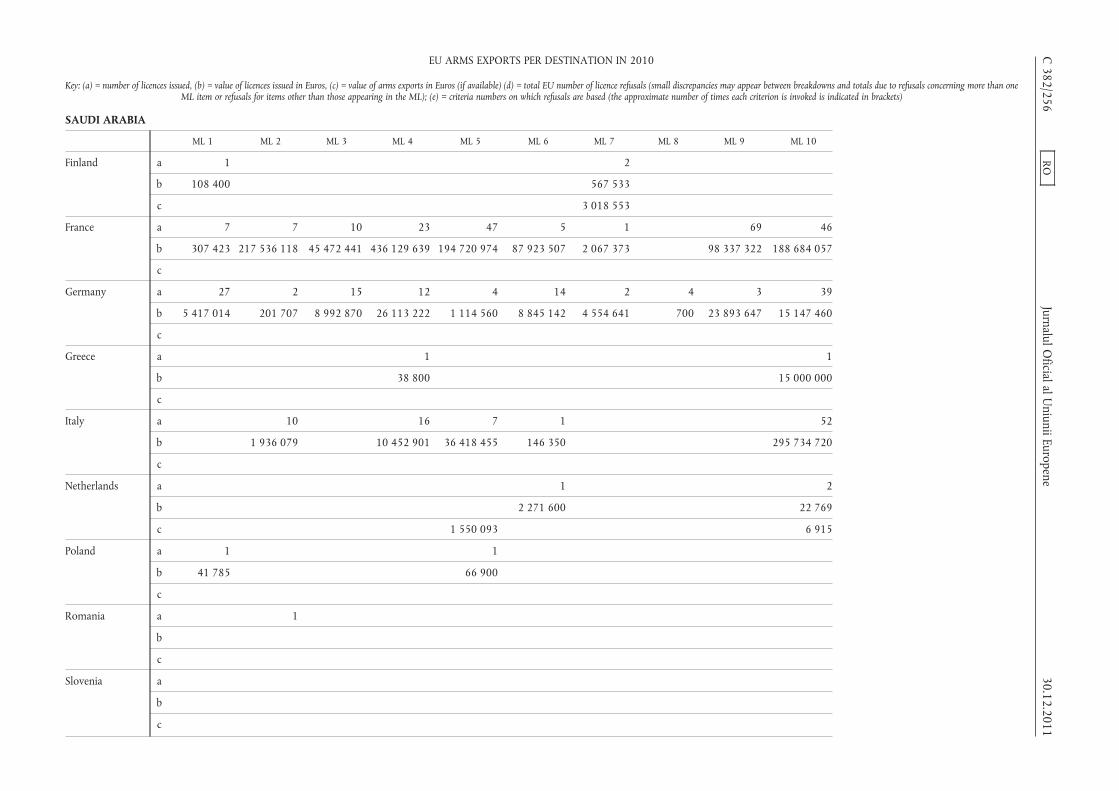
SAUDI ARABIA
ML 1 ML 2 ML 3 ML 4 ML 5 ML 6 ML 7 ML 8 ML 9 ML 10
Finland a 1 2
b 108 400 567 533
c 3 018 553
France a 7 7 10 23 47 5 1 69 46
b 307 423 217 536 118 45 472 441 436 129 639 194 720 974 87 923 507 2 067 373 98 337 322 188 684 057
c
Germany a 27 2 15 12 4 14 2 4 3 39
b 5 417 014 201 707 8 992 870 26 113 222 1 114 560 8 845 142 4 554 641 700 23 893 647 15 147 460
c
Greece a 1 1
b 38 800 15 000 000
c
Italy a 10 16 7 1 52
b 1 936 079 10 452 901 36 418 455 146 350 295 734 720
c
Netherlands a 1 2
b 2 271 600 22 769
c 1 550 093 6 915
Poland a 1 1
b 41 785 66 900
c
Romania a 1
b
c
Slovenia a
b
c
C382/256
ROJurnalul O
ficialalUniunii Europene
30.12.2011EU ARMS EXPORTS PER DESTINATION IN 2010
Key: (a) = number of licences issued, (b) = value of licences issued in Euros, (c) = value of arms exports in Euros (if available) (d) = total EU number of licence refusals (small discrepancies may appear between breakdowns and totals due to refusals concerning more than oneML item or refusals for items other than those appearing in the ML); (e) = criteria numbers on which refusals are based (the approximate number of times each criterion is invoked is indicated in brackets)

SAUDI ARABIA
ML 1 ML 2 ML 3 ML 4 ML 5 ML 6 ML 7 ML 8 ML 9 ML 10
Spain a 1 1
b 3 530 810 4 202 301
c 5 439 405 385 526
Sweden a 1 4 2
b
c
United Kingdom a 57 6 1 34 5 187 7 11 35
b 3 199 235 287 105 211 922 124 75 706 49 887 061 468 732 230 853 2 752 509
c
TOTAL PER MLcategory
a 116 27 32 92 66 211 12 5 83 175
b 28 874 740 223 001 194 88 748 487 689 000 246 232 396 595 153 480 821 7 658 279 259 700 122 461 822 517 341 515
c 305 118 3 327 003 2 148 291 812 750 1 550 093 5 634 646 3 018 553 392 441
d
e
ML 11 ML 12 ML 13 ML 14 ML 15 ML 16 ML 17 ML 18 ML 21 ML 22 TOTAL perdestination
Austria a 1 13
b 1 150 000 5 591 709
c 1 150 000 5 594 871
Belgium a 1 18
b 1 673 802 49 824 723
c
Czech Republic a 1 1 5
b 6 272 824 12 367 761
c 6 212 681 8 556 213
30.12.2011RO
Jurnalul OficialalU
niunii EuropeneC
382/257EU ARMS EXPORTS PER DESTINATION IN 2010
Key: (a) = number of licences issued, (b) = value of licences issued in Euros, (c) = value of arms exports in Euros (if available) (d) = total EU number of licence refusals (small discrepancies may appear between breakdowns and totals due to refusals concerning more than oneML item or refusals for items other than those appearing in the ML); (e) = criteria numbers on which refusals are based (the approximate number of times each criterion is invoked is indicated in brackets)

SAUDI ARABIA
ML 11 ML 12 ML 13 ML 14 ML 15 ML 16 ML 17 ML 18 ML 21 ML 22 TOTAL perdestination
Denmark a 1
b
c
Finland a 4 7
b 605 789 1 281 722
c 605 789 3 624 342
France a 20 1 3 4 32 1 1 6 283
b 14 589 028 4 098 920 10 564 798 81 149 255 87 151 218 88 421 781 398 1 359 015 1 470 960 908
c 697 602 881
Germany a 8 2 5 10 2 80 3 3 235
b 45 500 182 203 000 2 846 508 522 821 2 454 290 5 081 532 602 641 1 001 000 152 492 937
c
Greece a 1 3
b 40 000 15 078 800
c
Italy a 17 2 105
b 89 787 097 807 648 435 283 249
c 46 458
Netherlands a 3
b 2 294 369
c 76 898 1 633 906
Poland a 2
b 108 685
c
Romania a 1
b
c
C382/258
ROJurnalul O
ficialalUniunii Europene
30.12.2011EU ARMS EXPORTS PER DESTINATION IN 2010
Key: (a) = number of licences issued, (b) = value of licences issued in Euros, (c) = value of arms exports in Euros (if available) (d) = total EU number of licence refusals (small discrepancies may appear between breakdowns and totals due to refusals concerning more than oneML item or refusals for items other than those appearing in the ML); (e) = criteria numbers on which refusals are based (the approximate number of times each criterion is invoked is indicated in brackets)

SAUDI ARABIA
ML 11 ML 12 ML 13 ML 14 ML 15 ML 16 ML 17 ML 18 ML 21 ML 22 TOTAL perdestination
Slovenia a 1 1 2
b
c
Spain a 1 3
b 7 733 111
c 5 824 931
Sweden a 1 1 1 10
b 57 081 017
c 26 100 242
United Kingdom a 86 10 4 41 4 23 9 45 565
b 48 166 853 1 049 687 558 129 3 069 683 3 941 275 000 248 499 6 900 103 328 808 507
c
TOTAL PER MLcategory
a 135 1 18 15 85 6 5 105 13 54 1 256
b 198 648 950 4 098 920 19 240 308 84 553 892 90 783 722 3 350 359 3 941 7 030 334 1 632 538 9 260 119 2 538 907 498
c 682 687 7 362 681 748 983 844
d
e
SENEGAL
ML 1 ML 3 ML 4 ML 6 ML 11 ML 13 ML 15 ML 22 TOTAL perdestination
Belgium a 3 3
b 143 250 143 250
c
France a 1 1 4 1 1 1 9
b 2 887 487 360 025 70 689 165 702 15 064 614 855
c 175 530
30.12.2011RO
Jurnalul OficialalU
niunii EuropeneC
382/259EU ARMS EXPORTS PER DESTINATION IN 2010
Key: (a) = number of licences issued, (b) = value of licences issued in Euros, (c) = value of arms exports in Euros (if available) (d) = total EU number of licence refusals (small discrepancies may appear between breakdowns and totals due to refusals concerning more than oneML item or refusals for items other than those appearing in the ML); (e) = criteria numbers on which refusals are based (the approximate number of times each criterion is invoked is indicated in brackets)
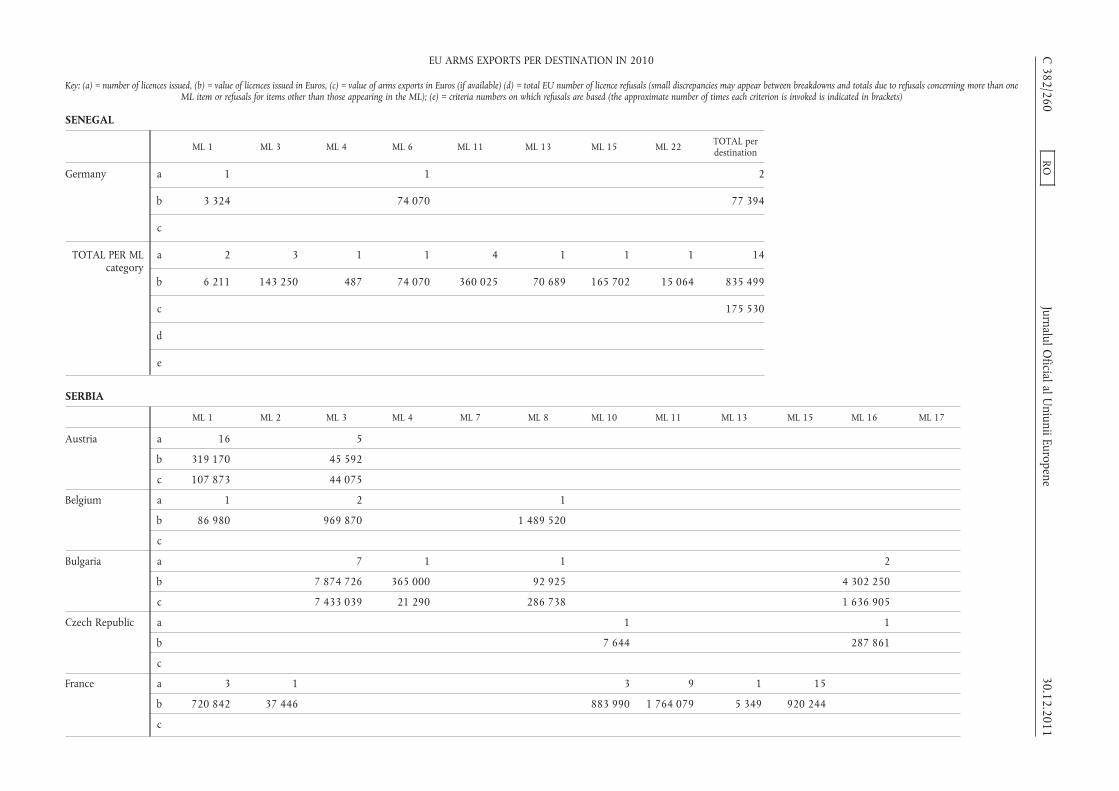
SENEGAL
ML 1 ML 3 ML 4 ML 6 ML 11 ML 13 ML 15 ML 22 TOTAL perdestination
Germany a 1 1 2
b 3 324 74 070 77 394
c
TOTAL PER MLcategory
a 2 3 1 1 4 1 1 1 14
b 6 211 143 250 487 74 070 360 025 70 689 165 702 15 064 835 499
c 175 530
d
e
SERBIA
ML 1 ML 2 ML 3 ML 4 ML 7 ML 8 ML 10 ML 11 ML 13 ML 15 ML 16 ML 17
Austria a 16 5
b 319 170 45 592
c 107 873 44 075
Belgium a 1 2 1
b 86 980 969 870 1 489 520
c
Bulgaria a 7 1 1 2
b 7 874 726 365 000 92 925 4 302 250
c 7 433 039 21 290 286 738 1 636 905
Czech Republic a 1 1
b 7 644 287 861
c
France a 3 1 3 9 1 15
b 720 842 37 446 883 990 1 764 079 5 349 920 244
c
C382/260
ROJurnalul O
ficialalUniunii Europene
30.12.2011EU ARMS EXPORTS PER DESTINATION IN 2010
Key: (a) = number of licences issued, (b) = value of licences issued in Euros, (c) = value of arms exports in Euros (if available) (d) = total EU number of licence refusals (small discrepancies may appear between breakdowns and totals due to refusals concerning more than oneML item or refusals for items other than those appearing in the ML); (e) = criteria numbers on which refusals are based (the approximate number of times each criterion is invoked is indicated in brackets)

SERBIA
ML 1 ML 2 ML 3 ML 4 ML 7 ML 8 ML 10 ML 11 ML 13 ML 15 ML 16 ML 17
Germany a 33 1 2 1 1 1
b 197 555 4 507 111 660 37 73 084 75
c
Greece a 1 1
b 1 000
c
Hungary a 1
b 4 315
c 4 315
Netherlands a 2
b 300
c 150
Slovenia a 1 1
b 293 020
c
Spain a 2 1 1
b 7 322 636 186 143 597
c 7 321
United Kingdom a 15 3 1 4 3 2
b 8 167 35 492 550 962 597 70 938 1 815
c
TOTAL PER MLcategory
a 72 1 19 5 3 4 8 13 3 15 3 2
b 1 344 351 37 446 9 824 201 400 492 112 210 1 726 079 1 854 231 1 908 101 7 164 920 244 4 590 111 1 075
c 119 509 7 477 264 21 290 286 738 1 636 905
d 2
e 7(2)
30.12.2011RO
Jurnalul OficialalU
niunii EuropeneC
382/261EU ARMS EXPORTS PER DESTINATION IN 2010
Key: (a) = number of licences issued, (b) = value of licences issued in Euros, (c) = value of arms exports in Euros (if available) (d) = total EU number of licence refusals (small discrepancies may appear between breakdowns and totals due to refusals concerning more than oneML item or refusals for items other than those appearing in the ML); (e) = criteria numbers on which refusals are based (the approximate number of times each criterion is invoked is indicated in brackets)

SERBIA
ML 18 ML 22 TOTAL perdestination
Austria a 21
b 364 762
c 151 948
Belgium a 4
b 2 546 370
c
Bulgaria a 11
b 12 634 901
c 9 377 971
Czech Republic a 2
b 295 505
c
France a 4 36
b 20 061 4 352 011
c 4 457 723
Germany a 39
b 386 918
c
Greece a 2
b 1 000
c
Hungary a 1
b 4 315
c 4 315
Netherlands a 2
b 300
c 150
C382/262
ROJurnalul O
ficialalUniunii Europene
30.12.2011EU ARMS EXPORTS PER DESTINATION IN 2010
Key: (a) = number of licences issued, (b) = value of licences issued in Euros, (c) = value of arms exports in Euros (if available) (d) = total EU number of licence refusals (small discrepancies may appear between breakdowns and totals due to refusals concerning more than oneML item or refusals for items other than those appearing in the ML); (e) = criteria numbers on which refusals are based (the approximate number of times each criterion is invoked is indicated in brackets)
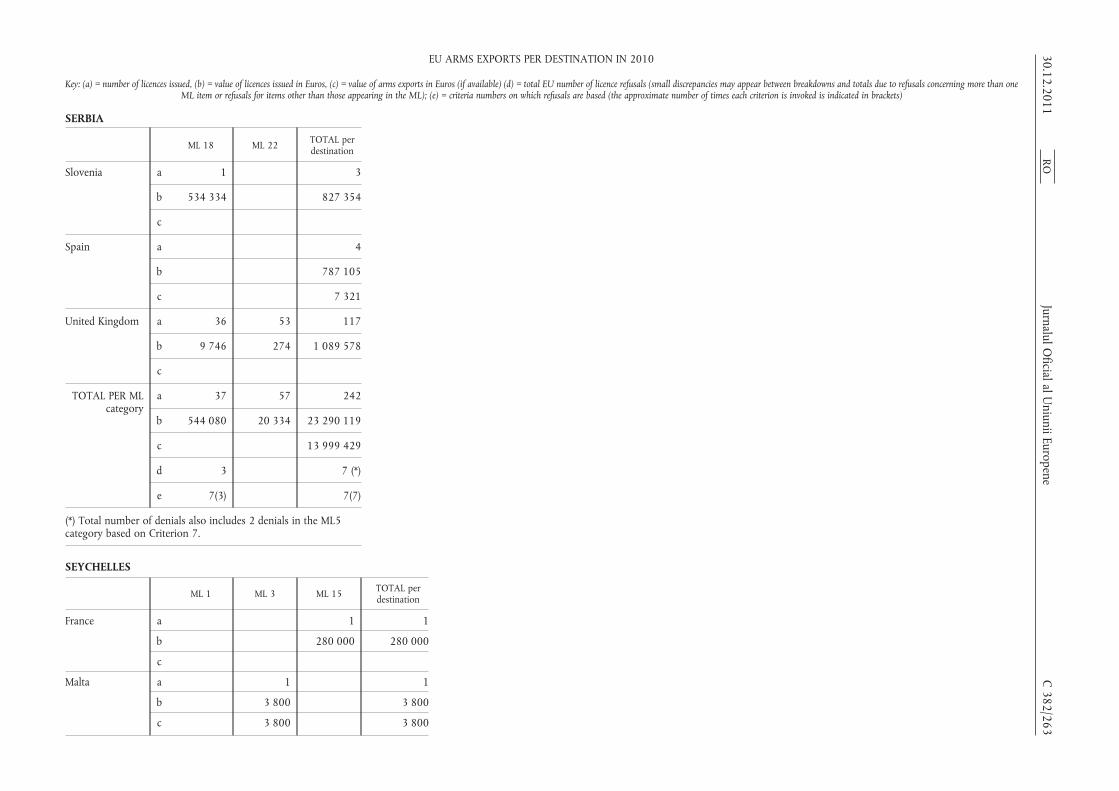
SERBIA
ML 18 ML 22 TOTAL perdestination
Slovenia a 1 3
b 534 334 827 354
c
Spain a 4
b 787 105
c 7 321
United Kingdom a 36 53 117
b 9 746 274 1 089 578
c
TOTAL PER MLcategory
a 37 57 242
b 544 080 20 334 23 290 119
c 13 999 429
d 3 7 (*)
e 7(3) 7(7)
(*) Total number of denials also includes 2 denials in the ML5category based on Criterion 7.
SEYCHELLES
ML 1 ML 3 ML 15 TOTAL perdestination
France a 1 1
b 280 000 280 000
c
Malta a 1 1
b 3 800 3 800
c 3 800 3 800
30.12.2011RO
Jurnalul OficialalU
niunii EuropeneC
382/263EU ARMS EXPORTS PER DESTINATION IN 2010
Key: (a) = number of licences issued, (b) = value of licences issued in Euros, (c) = value of arms exports in Euros (if available) (d) = total EU number of licence refusals (small discrepancies may appear between breakdowns and totals due to refusals concerning more than oneML item or refusals for items other than those appearing in the ML); (e) = criteria numbers on which refusals are based (the approximate number of times each criterion is invoked is indicated in brackets)

SEYCHELLES
ML 1 ML 3 ML 15 TOTAL perdestination
United Kingdom a 17 8 25
b 154 545 67 386 221 931
c
TOTAL PER MLcategory
a 17 9 1 27
b 154 545 71 186 280 000 505 731
c 3 800 3 800
d 1 1 2
e 7(1) 7(1) 7(2)
SINGAPORE
ML 1 ML 2 ML 3 ML 4 ML 5 ML 6 ML 7 ML 8 ML 9 ML 10 ML 11
Austria a 1 36 2 2 2 7
b 86 827 528 957 446 872 104 000 250 103 11 441 410
c 86 827 306 957 445 978 104 000 250 103 3 529 822
Belgium a 3 1 3
b 85 878 16 400 89 262
c
Denmark a 1 1
b 155 883 3 374 051
c
France a 1 4 3 37 14 1 2 22 2 25
b 1 058 574 253 417 467 62 480 592 23 369 791 14 814 198 083 76 485 612 49 367 85 995 504
c
Germany a 5 3 10 2 6 47 7 7 12 1 20
b 15 836 20 154 000 852 194 139 429 817 150 18 389 162 969 711 1 125 637 211 14 000 1 448 079
c
C382/264
ROJurnalul O
ficialalUniunii Europene
30.12.2011EU ARMS EXPORTS PER DESTINATION IN 2010
Key: (a) = number of licences issued, (b) = value of licences issued in Euros, (c) = value of arms exports in Euros (if available) (d) = total EU number of licence refusals (small discrepancies may appear between breakdowns and totals due to refusals concerning more than oneML item or refusals for items other than those appearing in the ML); (e) = criteria numbers on which refusals are based (the approximate number of times each criterion is invoked is indicated in brackets)

SINGAPORE
ML 1 ML 2 ML 3 ML 4 ML 5 ML 6 ML 7 ML 8 ML 9 ML 10 ML 11
Greece a 2
b 99 197
c
Hungary a 1
b 200 000
c
Ireland a 3
b 89 825
c
Italy a 10 1 6 2 1 2
b 9 817 985 9 322 725 39 881 049 137 943 708 469 20 891 165
c
Netherlands a 3 2 2 2
b 226 271 39 508 566 517 13 227
c 194 630 69 508 600 793 34 746
Poland a 1
b 1 570 831
c
Slovenia a 1
b
c
Spain a 3 4
b 3 978 268 18 729
c 2 322 268 16 382
Sweden a 1 1 2 2 1 2 2
b
c
30.12.2011RO
Jurnalul OficialalU
niunii EuropeneC
382/265EU ARMS EXPORTS PER DESTINATION IN 2010
Key: (a) = number of licences issued, (b) = value of licences issued in Euros, (c) = value of arms exports in Euros (if available) (d) = total EU number of licence refusals (small discrepancies may appear between breakdowns and totals due to refusals concerning more than oneML item or refusals for items other than those appearing in the ML); (e) = criteria numbers on which refusals are based (the approximate number of times each criterion is invoked is indicated in brackets)

SINGAPORE
ML 1 ML 2 ML 3 ML 4 ML 5 ML 6 ML 7 ML 8 ML 9 ML 10 ML 11
United Kingdom a 81 1 7 32 26 356 47 2 103 46 72
b 1 742 008 385 000 180 574 3 232 596 632 220 6 500 062 143 239 51 3 029 645 667 454 1 755 085
c
TOTAL PER MLcategory
a 92 55 26 86 59 419 56 14 141 52 120
b 1 931 607 31 460 195 11 436 233 109 915 131 25 679 186 37 974 516 1 311 034 90 438 80 718 985 1 452 517 113 463 884
c 86 827 306 957 445 978 2 426 268 444 733 3 615 712 600 793 34 746
d
e
ML 13 ML 14 ML 15 ML 16 ML 17 ML 18 ML 21 ML 22 TOTAL perdestination
Austria a 5 55
b 15 128 12 873 297
c 15 128 4 738 815
Belgium a 2 9
b 1 171 908 1 363 448
c
Denmark a 2
b 3 529 934
c
France a 3 3 19 4 10 150
b 808 087 199 057 9 730 800 37 576 291 6 648 487 304 549 264
c 46 757 380
Germany a 3 5 3 3 9 3 3 19 168
b 47 608 6 795 671 92 750 476 047 148 921 341 350 1 016 300 1 670 901 54 027 445
c
C382/266
ROJurnalul O
ficialalUniunii Europene
30.12.2011EU ARMS EXPORTS PER DESTINATION IN 2010
Key: (a) = number of licences issued, (b) = value of licences issued in Euros, (c) = value of arms exports in Euros (if available) (d) = total EU number of licence refusals (small discrepancies may appear between breakdowns and totals due to refusals concerning more than oneML item or refusals for items other than those appearing in the ML); (e) = criteria numbers on which refusals are based (the approximate number of times each criterion is invoked is indicated in brackets)

SINGAPORE
ML 13 ML 14 ML 15 ML 16 ML 17 ML 18 ML 21 ML 22 TOTAL perdestination
Greece a 2
b 99 197
c
Hungary a 1
b 200 000
c
Ireland a 3
b 89 825
c
Italy a 2 24
b 2 115 989 82 875 325
c 77 232
Netherlands a 1 10
b 50 000 895 523
c 899 677
Poland a 1
b 1 570 831
c
Slovenia a 1
b
c
Spain a 1 8
b 3 996 997
c 2 338 650
Sweden a 11
b 330 284 770
c 64 826 210
30.12.2011RO
JurnalulOficialalU
niuniiEuropeneC
382/267EU ARMS EXPORTS PER DESTINATION IN 2010
Key: (a) = number of licences issued, (b) = value of licences issued in Euros, (c) = value of arms exports in Euros (if available) (d) = total EU number of licence refusals (small discrepancies may appear between breakdowns and totals due to refusals concerning more than oneML item or refusals for items other than those appearing in the ML); (e) = criteria numbers on which refusals are based (the approximate number of times each criterion is invoked is indicated in brackets)

SINGAPORE
ML 13 ML 14 ML 15 ML 16 ML 17 ML 18 ML 21 ML 22 TOTAL perdestination
United Kingdom a 14 6 9 1 14 7 34 858
b 1 052 910 232 221 151 258 31 563 25 707 24 785 247 578 20 033 958
c
TOTAL PER MLcategory
a 20 16 34 4 9 22 14 64 1 303
b 1 908 606 9 342 938 11 146 717 507 610 148 921 382 185 38 617 376 8 616 966 816 389 814
c 15 128 119 637 963
d 1 1
e 7(1) 7(1)
SLOVAKIA
ML 1 ML 2 ML 3 ML 4 ML 5 ML 6 ML 7 ML 8 ML 10 ML 11 ML 13 ML 14
Austria a 1 1
b 15 901 32 342
c 2 633 32 342
Belgium a 2 3
b 74 444 28 185
c
Bulgaria a 1 1 1 1
b 36 000 12 454 285 000 12 000
c 12 454 37 500
Czech Republic a 16 8 8 1 2 19 7 6 20 16 1 3
b 635 463 1 592 572 1 895 981 680 843 62 533 2 656 069 187 224 61 680 1 445 409 1 850 861 1 389 673
c 937 733 1 546 586 123 856 111 169 5 274 473 190 161 81 846 445 280 413 817 1 389 673
Estonia a 1
b 1 920
c 1 900
C382/268
ROJurnalul O
ficialalUniunii Europene
30.12.2011EU ARMS EXPORTS PER DESTINATION IN 2010
Key: (a) = number of licences issued, (b) = value of licences issued in Euros, (c) = value of arms exports in Euros (if available) (d) = total EU number of licence refusals (small discrepancies may appear between breakdowns and totals due to refusals concerning more than oneML item or refusals for items other than those appearing in the ML); (e) = criteria numbers on which refusals are based (the approximate number of times each criterion is invoked is indicated in brackets)

SLOVAKIA
ML 1 ML 2 ML 3 ML 4 ML 5 ML 6 ML 7 ML 8 ML 10 ML 11 ML 13 ML 14
Finland a 1 1 2
b 276 500 5 817 29 205
c 5 817
France a 1 2
b 153 458 869 594
c
Germany a 4 1 3 1
b 20 400 46 905 196 009 630 000
c
Hungary a 11 3 2 2 2
b 971 572 1 324 000 22 710 70 000 120 000
c 741 866 30 261
Italy a
b
c
Netherlands a 2
b 2 150
c 4 704
Poland a 1 2 1 1
b 20 590 121 300 1 920 7 177
c
Romania a 1
b 30 000
c 6 803
Spain a
b
c 57 079 735
30.12.2011RO
Jurnalul OficialalU
niunii EuropeneC
382/269EU ARMS EXPORTS PER DESTINATION IN 2010
Key: (a) = number of licences issued, (b) = value of licences issued in Euros, (c) = value of arms exports in Euros (if available) (d) = total EU number of licence refusals (small discrepancies may appear between breakdowns and totals due to refusals concerning more than oneML item or refusals for items other than those appearing in the ML); (e) = criteria numbers on which refusals are based (the approximate number of times each criterion is invoked is indicated in brackets)
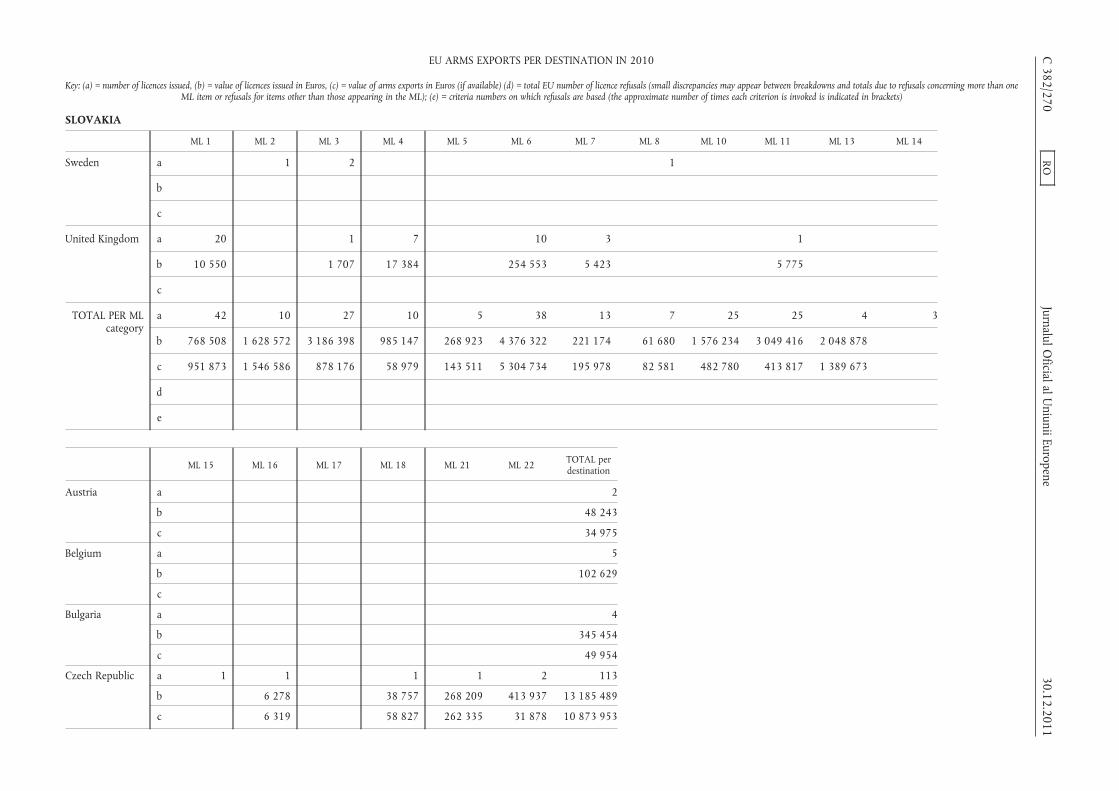
SLOVAKIA
ML 1 ML 2 ML 3 ML 4 ML 5 ML 6 ML 7 ML 8 ML 10 ML 11 ML 13 ML 14
Sweden a 1 2 1
b
c
United Kingdom a 20 1 7 10 3 1
b 10 550 1 707 17 384 254 553 5 423 5 775
c
TOTAL PER MLcategory
a 42 10 27 10 5 38 13 7 25 25 4 3
b 768 508 1 628 572 3 186 398 985 147 268 923 4 376 322 221 174 61 680 1 576 234 3 049 416 2 048 878
c 951 873 1 546 586 878 176 58 979 143 511 5 304 734 195 978 82 581 482 780 413 817 1 389 673
d
e
ML 15 ML 16 ML 17 ML 18 ML 21 ML 22 TOTAL perdestination
Austria a 2
b 48 243
c 34 975
Belgium a 5
b 102 629
c
Bulgaria a 4
b 345 454
c 49 954
Czech Republic a 1 1 1 1 2 113
b 6 278 38 757 268 209 413 937 13 185 489
c 6 319 58 827 262 335 31 878 10 873 953
C382/270
ROJurnalul O
ficialalUniunii Europene
30.12.2011EU ARMS EXPORTS PER DESTINATION IN 2010
Key: (a) = number of licences issued, (b) = value of licences issued in Euros, (c) = value of arms exports in Euros (if available) (d) = total EU number of licence refusals (small discrepancies may appear between breakdowns and totals due to refusals concerning more than oneML item or refusals for items other than those appearing in the ML); (e) = criteria numbers on which refusals are based (the approximate number of times each criterion is invoked is indicated in brackets)

SLOVAKIA
ML 15 ML 16 ML 17 ML 18 ML 21 ML 22 TOTAL perdestination
Estonia a 1
b 1 920
c 1 900
Finland a 4
b 311 522
c 5 817
France a 3 6
b 219 592 1 242 644
c 1 856 577
Germany a 4 1 5 19
b 19 829 17 240 17 240 947 623
c
Hungary a 20
b 2 508 282
c 772 127
Italy a
b
c 316 234
Netherlands a 2
b 2 150
c 4 704
Poland a 5
b 150 987
c
Romania a 1
b 30 000
c 6 803
30.12.2011RO
Jurnalul OficialalU
niunii EuropeneC
382/271EU ARMS EXPORTS PER DESTINATION IN 2010
Key: (a) = number of licences issued, (b) = value of licences issued in Euros, (c) = value of arms exports in Euros (if available) (d) = total EU number of licence refusals (small discrepancies may appear between breakdowns and totals due to refusals concerning more than oneML item or refusals for items other than those appearing in the ML); (e) = criteria numbers on which refusals are based (the approximate number of times each criterion is invoked is indicated in brackets)

SLOVAKIA
ML 15 ML 16 ML 17 ML 18 ML 21 ML 22 TOTAL perdestination
Spain a
b
c 57 814
Sweden a 4
b 318 296
c 424 394
United Kingdom a 42
b 295 392
c
TOTAL PER MLcategory
a 8 1 1 6 1 2 228
b 239 421 6 278 17 240 55 997 268 209 413 937 19 490 630
c 6 319 58 827 262 335 31 878 14 405 252
d
e
SLOVENIA
ML 1 ML 2 ML 3 ML 4 ML 5 ML 6 ML 7 ML 8 ML 10 ML 11 ML 13 ML 14
Austria a 2
b 143 000
c 145 700 293 600
Belgium a 8 3 1
b 657 319 3 517 480 85 000
c
Czech Republic a 1 1 1 1 1 1
b 27 679 4 360
c 9 435 4 431
Finland a 1 1 1 2
b 78 000 79 000 1 800 29 205
c 2 188 577 1 833
C382/272
ROJurnalul O
ficialalUniunii Europene
30.12.2011EU ARMS EXPORTS PER DESTINATION IN 2010
Key: (a) = number of licences issued, (b) = value of licences issued in Euros, (c) = value of arms exports in Euros (if available) (d) = total EU number of licence refusals (small discrepancies may appear between breakdowns and totals due to refusals concerning more than oneML item or refusals for items other than those appearing in the ML); (e) = criteria numbers on which refusals are based (the approximate number of times each criterion is invoked is indicated in brackets)

SLOVENIA
ML 1 ML 2 ML 3 ML 4 ML 5 ML 6 ML 7 ML 8 ML 10 ML 11 ML 13 ML 14
France a 1 1 2 3 1
b 2 887 8 354 860 043 1 994 818 64 954
c
Germany a 5 5 5 4 4 1 1
b 160 440 134 160 74 716 2 358 777 82 598 1 235 038 349 000
c
Lithuania a 1
b 10 138
c
Netherlands a 2 1
b 550 127 410
c 100 127 410
Romania a 2
b 35 000
c 4 911
Spain a 3
b 5 570
c 7 280
Sweden a 1 6
b
c
United Kingdom a 31 3 2 9 5 4
b 1 353 037 2 412 88 000 90 926 18 705 136 950
c
TOTAL PER MLcategory
a 55 7 11 9 10 5 10 2 2 9 7 1
b 2 385 482 212 160 3 681 334 2 496 953 948 043 82 598 92 726 89 360 1 235 038 2 013 523 231 109 349 000
c 167 426 421 010 2 188 577 1 833 4 431
d
e
30.12.2011RO
Jurnalul OficialalU
niunii EuropeneC
382/273EU ARMS EXPORTS PER DESTINATION IN 2010
Key: (a) = number of licences issued, (b) = value of licences issued in Euros, (c) = value of arms exports in Euros (if available) (d) = total EU number of licence refusals (small discrepancies may appear between breakdowns and totals due to refusals concerning more than oneML item or refusals for items other than those appearing in the ML); (e) = criteria numbers on which refusals are based (the approximate number of times each criterion is invoked is indicated in brackets)
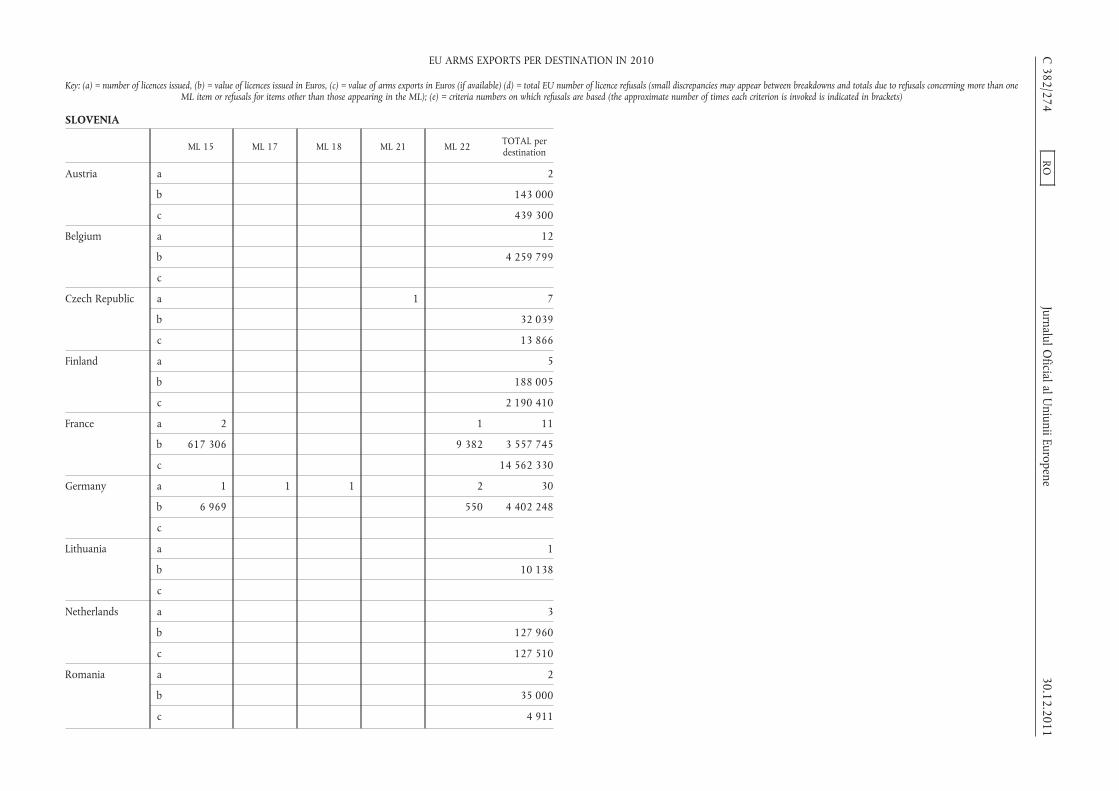
SLOVENIA
ML 15 ML 17 ML 18 ML 21 ML 22 TOTAL perdestination
Austria a 2
b 143 000
c 439 300
Belgium a 12
b 4 259 799
c
Czech Republic a 1 7
b 32 039
c 13 866
Finland a 5
b 188 005
c 2 190 410
France a 2 1 11
b 617 306 9 382 3 557 745
c 14 562 330
Germany a 1 1 1 2 30
b 6 969 550 4 402 248
c
Lithuania a 1
b 10 138
c
Netherlands a 3
b 127 960
c 127 510
Romania a 2
b 35 000
c 4 911
C382/274
ROJurnalul O
ficialalUniunii Europene
30.12.2011EU ARMS EXPORTS PER DESTINATION IN 2010
Key: (a) = number of licences issued, (b) = value of licences issued in Euros, (c) = value of arms exports in Euros (if available) (d) = total EU number of licence refusals (small discrepancies may appear between breakdowns and totals due to refusals concerning more than oneML item or refusals for items other than those appearing in the ML); (e) = criteria numbers on which refusals are based (the approximate number of times each criterion is invoked is indicated in brackets)
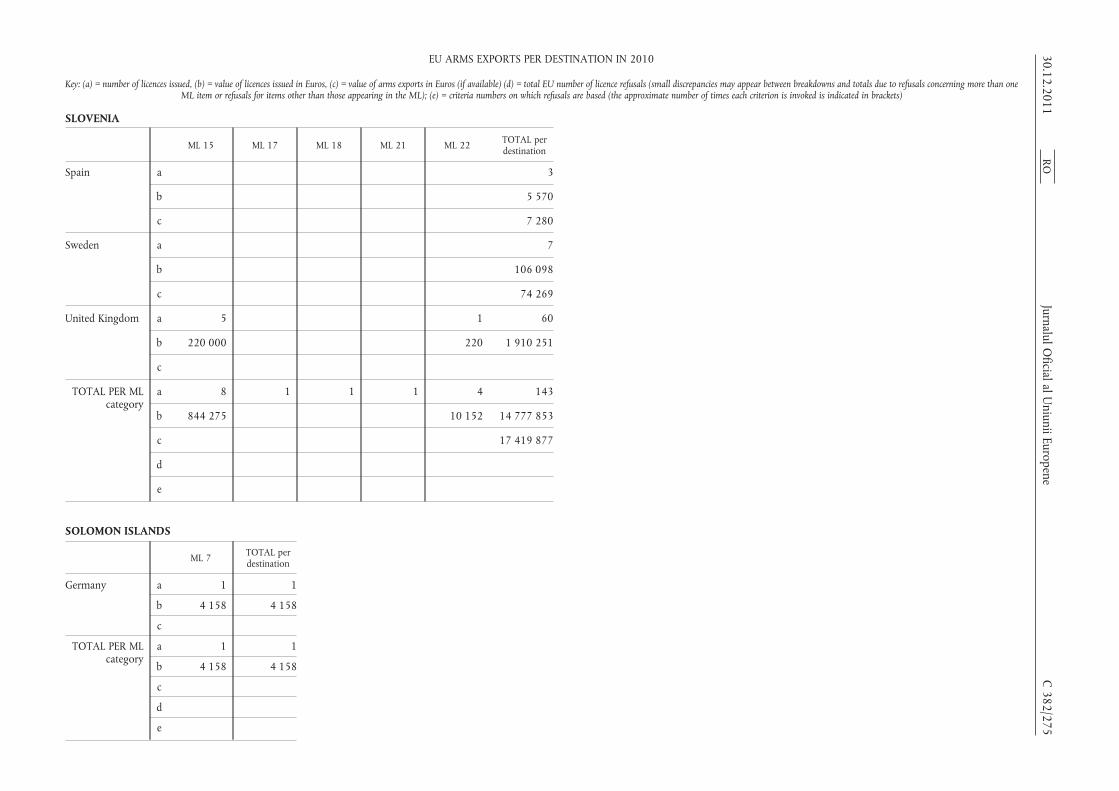
SLOVENIA
ML 15 ML 17 ML 18 ML 21 ML 22 TOTAL perdestination
Spain a 3
b 5 570
c 7 280
Sweden a 7
b 106 098
c 74 269
United Kingdom a 5 1 60
b 220 000 220 1 910 251
c
TOTAL PER MLcategory
a 8 1 1 1 4 143
b 844 275 10 152 14 777 853
c 17 419 877
d
e
SOLOMON ISLANDS
ML 7 TOTAL perdestination
Germany a 1 1
b 4 158 4 158
c
TOTAL PER MLcategory
a 1 1
b 4 158 4 158
c
d
e
30.12.2011RO
Jurnalul OficialalU
niunii EuropeneC
382/275EU ARMS EXPORTS PER DESTINATION IN 2010
Key: (a) = number of licences issued, (b) = value of licences issued in Euros, (c) = value of arms exports in Euros (if available) (d) = total EU number of licence refusals (small discrepancies may appear between breakdowns and totals due to refusals concerning more than oneML item or refusals for items other than those appearing in the ML); (e) = criteria numbers on which refusals are based (the approximate number of times each criterion is invoked is indicated in brackets)

SOUTH AFRICA
ML 1 ML 2 ML 3 ML 4 ML 5 ML 6 ML 7 ML 8 ML 9 ML 10 ML 11 ML 13
Austria a 28 2 3
b 3 878 146 23 933 459 950
c 1 493 293 3 143 390 000
Belgium a 4 1 1
b 402 600 325 20 000
c
Bulgaria a 4 1 2 4
b 193 298 12 640 282 000 1 195 824
c 402 258
Czech Republic a 2 1 1
b 1 786
c 1 783 1
Denmark a 2
b 378 284
c
Finland a 1 1 1
b 163 400 640 350 000
c 11 180 640 375 002
France a 2 2 1 7 9 6 1 26 5 1
b 54 146 695 407 140 143 117 560 3 232 907 259 258 5 648 39 478 984 747 494 530 845
c
Germany a 65 1 21 7 19 9 4 7 8 8
b 416 441 277 038 515 671 6 231 114 10 109 894 105 081 14 965 920 198 426 633 770
c
Hungary a 1
b 8 900
c 8 900
C382/276
ROJurnalul O
ficialalUniunii Europene
30.12.2011EU ARMS EXPORTS PER DESTINATION IN 2010
Key: (a) = number of licences issued, (b) = value of licences issued in Euros, (c) = value of arms exports in Euros (if available) (d) = total EU number of licence refusals (small discrepancies may appear between breakdowns and totals due to refusals concerning more than oneML item or refusals for items other than those appearing in the ML); (e) = criteria numbers on which refusals are based (the approximate number of times each criterion is invoked is indicated in brackets)

SOUTH AFRICA
ML 1 ML 2 ML 3 ML 4 ML 5 ML 6 ML 7 ML 8 ML 9 ML 10 ML 11 ML 13
Italy a 6 1 1 2
b 1 092 657 70 785 270 945 323 800
c
Malta a 3 1
b 8 560 1 800
c 8 560 572
Netherlands a 2 3 1
b 800 99 472 18 901
c 200 59 904
Romania a 2
b 13 779
c 13 779
Spain a 4 1
b 306 182 37 500
c 9 982
Sweden a 1 1
b
c
United Kingdom a 247 6 43 38 34 6 46 2 97 32
b 4 606 219 3 212 3 592 617 4 653 916 1 148 617 885 479 92 794 11 241 10 747 802 835 453
c
TOTAL PER MLcategory
a 363 10 72 63 65 28 50 9 3 136 46 4
b 10 052 471 988 297 4 557 129 13 311 071 14 590 890 2 130 553 107 759 6 568 282 186 50 788 298 2 216 717 928 030
c 1 948 152 4 355 59 904 765 002 1 783 1
d 5
e 7(5)
30.12.2011RO
Jurnalul OficialalU
niunii EuropeneC
382/277EU ARMS EXPORTS PER DESTINATION IN 2010
Key: (a) = number of licences issued, (b) = value of licences issued in Euros, (c) = value of arms exports in Euros (if available) (d) = total EU number of licence refusals (small discrepancies may appear between breakdowns and totals due to refusals concerning more than oneML item or refusals for items other than those appearing in the ML); (e) = criteria numbers on which refusals are based (the approximate number of times each criterion is invoked is indicated in brackets)

SOUTH AFRICA
ML 14 ML 15 ML 16 ML 17 ML 18 ML 21 ML 22 TOTAL perdestination
Austria a 34 67
b 142 747 4 504 776
c 123 547 2 009 983
Belgium a 6
b 422 925
c
Bulgaria a 11
b 1 683 762
c 402 258
Czech Republic a 4
b 1 786
c 1 784
Denmark a 2
b 378 284
c
Finland a 1 4
b 193 000 707 040
c 250 500 637 322
France a 1 24 1 1 6 93
b 22 869 4 848 203 53 085 10 617 161 223 50 358 390
c 23 665 029
Germany a 6 5 4 4 6 10 184
b 2 273 199 214 540 9 703 22 867 236 018 908 600 22 168 247
c
Hungary a 1
b 8 900
c 8 900
C382/278
ROJurnalul O
ficialalUniunii Europene
30.12.2011EU ARMS EXPORTS PER DESTINATION IN 2010
Key: (a) = number of licences issued, (b) = value of licences issued in Euros, (c) = value of arms exports in Euros (if available) (d) = total EU number of licence refusals (small discrepancies may appear between breakdowns and totals due to refusals concerning more than oneML item or refusals for items other than those appearing in the ML); (e) = criteria numbers on which refusals are based (the approximate number of times each criterion is invoked is indicated in brackets)

SOUTH AFRICA
ML 14 ML 15 ML 16 ML 17 ML 18 ML 21 ML 22 TOTAL perdestination
Italy a 10
b 1 758 187
c 1 645 014
Malta a 4
b 10 360
c 9 132
Netherlands a 6
b 119 173
c 240 10 000 70 344
Romania a 2
b 13 779
c 13 779
Spain a 5
b 343 682
c 9 982
Sweden a 2
b 1 043 144
c 112 555 290
United Kingdom a 21 19 4 2 1 8 18 624
b 294 984 955 286 23 400 232 227 12 870 93 643 15 455 28 205 215
c
TOTAL PER MLcategory
a 22 49 9 6 40 16 34 1 025
b 317 853 8 076 688 237 940 241 930 231 569 533 278 1 085 278 111 727 649
c 123 547 250 740 10 000 141 028 817
d 1 6
e 7(1) 7(6)
30.12.2011RO
Jurnalul OficialalU
niunii EuropeneC
382/279EU ARMS EXPORTS PER DESTINATION IN 2010
Key: (a) = number of licences issued, (b) = value of licences issued in Euros, (c) = value of arms exports in Euros (if available) (d) = total EU number of licence refusals (small discrepancies may appear between breakdowns and totals due to refusals concerning more than oneML item or refusals for items other than those appearing in the ML); (e) = criteria numbers on which refusals are based (the approximate number of times each criterion is invoked is indicated in brackets)

SPAIN
ML 1 ML 2 ML 3 ML 4 ML 5 ML 6 ML 7 ML 8 ML 9 ML 10 ML 11
Austria a 2
b 320 648
c 320 648
Belgium a 17 7 4 3 34
b 812 175 49 507 827 040 167 000 1 077 977
c
Bulgaria a 1
b 18 900
c 18 900
Czech Republic a 2 1 2
b 34 284 1 522 115 592
c 181 778 34 186 1 490 8 311 024
Denmark a 2 1
b
c
Finland a 1 7 2
b 540 000 919 113 6 188
c 42 770 237 779 3 808
France a 2 1 13 22 7 6 3 90 54
b 1 105 707 54 264 3 006 756 29 012 381 1 493 200 7 024 016 441 848 144 907 002 63 156 702
c
Germany a 21 10 23 18 12 196 6 15 60 64
b 5 244 408 552 231 1 858 139 31 114 622 769 780 8 514 506 332 4 565 476 4 335 899 20 218 956
c
Greece a 1
b 395 694
c
C382/280
ROJurnalul O
ficialalUniunii Europene
30.12.2011EU ARMS EXPORTS PER DESTINATION IN 2010
Key: (a) = number of licences issued, (b) = value of licences issued in Euros, (c) = value of arms exports in Euros (if available) (d) = total EU number of licence refusals (small discrepancies may appear between breakdowns and totals due to refusals concerning more than oneML item or refusals for items other than those appearing in the ML); (e) = criteria numbers on which refusals are based (the approximate number of times each criterion is invoked is indicated in brackets)

SPAIN
ML 1 ML 2 ML 3 ML 4 ML 5 ML 6 ML 7 ML 8 ML 9 ML 10 ML 11
Italy a 4 16 1 21 13 3 28 9
b 84 096 3 712 963 5 200 7 216 478 24 479 224 172 947 26 413 572 10 189 908
c
Netherlands a 7 1 1 3
b 57 070 36 500 24 154 67 300
c 6 644 126 739 63 671 2 536
Portugal a 3
b 3 623 829
c 3 623 829
Romania a 1 1
b 15 000 826
c 3 728
Slovenia a 2
b 241 849
c
Sweden a 1 3 2 1 1
b
c
United Kingdom a 119 22 4 29 9 24 74 11 230 53
b 1 334 527 56 940 13 830 243 443 2 354 448 214 324 947 570 56 725 14 531 743 4 018 654
c
TOTAL PER MLcategory
a 169 37 82 72 53 247 82 6 35 444 180
b 9 108 886 747 532 10 157 915 60 807 840 11 876 960 41 126 410 954 090 168 522 8 860 825 191 381 785 97 584 221
c 234 920 592 613 145 639 63 671 3 808 1 490 3 623 829 8 311 024 2 536
d
e
30.12.2011RO
Jurnalul OficialalU
niunii EuropeneC
382/281EU ARMS EXPORTS PER DESTINATION IN 2010
Key: (a) = number of licences issued, (b) = value of licences issued in Euros, (c) = value of arms exports in Euros (if available) (d) = total EU number of licence refusals (small discrepancies may appear between breakdowns and totals due to refusals concerning more than oneML item or refusals for items other than those appearing in the ML); (e) = criteria numbers on which refusals are based (the approximate number of times each criterion is invoked is indicated in brackets)

SPAIN
ML 13 ML 14 ML 15 ML 16 ML 17 ML 18 ML 19 ML 21 ML 22 TOTAL perdestination
Austria a 2
b 320 648
c 320 648
Belgium a 2 67
b 9 540 2 943 239
c
Bulgaria a 1
b 18 900
c 18 900
Czech Republic a 5
b 151 398
c 8 528 478
Denmark a 2 3 8
b 567 896 74 044 641 940
c
Finland a 3 13
b 99 205 1 564 506
c 49 505 333 862
France a 4 30 1 1 7 5 246
b 299 297 17 108 808 621 950 887 009 362 839 662 523 270 144 300
c 102 382 463
Germany a 2 8 25 21 24 10 21 536
b 1 470 114 2 200 435 1 516 173 459 084 790 903 49 515 649 453 84 310 026
c
Greece a 1
b 395 694
c
C382/282
ROJurnalul O
ficialalUniunii Europene
30.12.2011EU ARMS EXPORTS PER DESTINATION IN 2010
Key: (a) = number of licences issued, (b) = value of licences issued in Euros, (c) = value of arms exports in Euros (if available) (d) = total EU number of licence refusals (small discrepancies may appear between breakdowns and totals due to refusals concerning more than oneML item or refusals for items other than those appearing in the ML); (e) = criteria numbers on which refusals are based (the approximate number of times each criterion is invoked is indicated in brackets)

SPAIN
ML 13 ML 14 ML 15 ML 16 ML 17 ML 18 ML 19 ML 21 ML 22 TOTAL perdestination
Italy a 2 1 4 2 104
b 392 124 19 490 606 172 498 822 73 790 997
c 50 888 708
Netherlands a 1 1 14
b 9 000 7 000 000 7 194 024
c 9 000 100 208 690
Portugal a 3
b 3 623 829
c 3 623 829
Romania a 2
b 15 826
c 3 728
Slovenia a 2
b 241 849
c
Sweden a 1 9
b 3 076 858
c 4 562 237
United Kingdom a 10 11 17 11 1 3 2 630
b 30 115 59 930 316 903 267 743 5 995 47 575 24 500 464
c
TOTAL PER MLcategory
a 20 13 59 38 21 30 1 23 31 1 643
b 996 512 1 530 044 20 027 810 2 425 356 459 084 1 412 070 887 009 533 973 8 810 798 472 934 499
c 49 505 9 000 100 170 871 543
d
e
30.12.2011RO
Jurnalul OficialalU
niunii EuropeneC
382/283EU ARMS EXPORTS PER DESTINATION IN 2010
Key: (a) = number of licences issued, (b) = value of licences issued in Euros, (c) = value of arms exports in Euros (if available) (d) = total EU number of licence refusals (small discrepancies may appear between breakdowns and totals due to refusals concerning more than oneML item or refusals for items other than those appearing in the ML); (e) = criteria numbers on which refusals are based (the approximate number of times each criterion is invoked is indicated in brackets)

SRI LANKA
ML 1 ML 3 ML 4 ML 6 ML 10 ML 11 ML 17 ML 22 TOTAL perdestination
Bulgaria a
b
c 75 545 75 545
Czech Republic a 1 2 3
b 70 370 75 773 146 143
c 69 811 173 025 101 575 344 411
Greece a 1 1
b 6 763 6 763
c
Poland a 6 6
b 67 054 67 054
c
Slovakia a 2 2
b 1 140 000 1 140 000
c 1 001 498 1 001 498
Spain a
b
c 160 000 160 000
United Kingdom a 5 8 9 2 5 29
b 4 315 726 83 582 59 241 55 733 203 596
c
TOTAL PER MLcategory
a 5 8 2 1 18 2 5 41
b 4 315 726 1 140 000 70 370 233 172 59 241 55 733 1 563 556
c 75 545 1 161 498 69 811 173 025 101 575 1 581 454
d 1 1 1 3
e 3(1) 6(1) 3(1) 3(1) 3(3) 6(1)
C382/284
ROJurnalul O
ficialalUniunii Europene
30.12.2011EU ARMS EXPORTS PER DESTINATION IN 2010
Key: (a) = number of licences issued, (b) = value of licences issued in Euros, (c) = value of arms exports in Euros (if available) (d) = total EU number of licence refusals (small discrepancies may appear between breakdowns and totals due to refusals concerning more than oneML item or refusals for items other than those appearing in the ML); (e) = criteria numbers on which refusals are based (the approximate number of times each criterion is invoked is indicated in brackets)

ST MARINO
ML 1 ML 3 ML 18 TOTAL perdestination
Austria a 4 4
b 4 185 4 185
c 317 317
Germany a 9 2 1 12
b 32 896 984 115 33 995
c
Italy a 1 1
b 897 897
c
United Kingdom a 1 1
b 3 300 3 300
c
TOTAL PER MLcategory
a 15 2 1 18
b 41 278 984 115 42 377
c 317 317
d
e
SURINAME
ML 1 ML 3 TOTAL perdestination
Austria a 3 3
b 20 184 20 184
c 11 184 11 184
Belgium a 2 2
b 400 107 400 107
c
Czech Republic a 1 1 2
b 3 955 3 955 7 910
c 5 336 5 336
Netherlands a 1 1
b 40 40
c 40 40
TOTAL PER MLcategory
a 6 2 8
b 424 246 3 995 428 241
c 16 520 40 16 560
d 1 1
e 7(1) 7(1)
30.12.2011 RO Jurnalul Oficial al Uniunii Europene C 382/285
EU ARMS EXPORTS PER DESTINATION IN 2010
Key: (a) = number of licences issued, (b) = value of licences issued in Euros, (c) = value of arms exports in Euros (if available) (d) = total EU number of licence refusals (small discrepancies mayappear between breakdowns and totals due to refusals concerning more than one ML item or refusals for items other than those appearing in the ML); (e) = criteria numbers on which refusals are
based (the approximate number of times each criterion is invoked is indicated in brackets)

SWAZILAND
ML 1 ML 3 ML 7 ML 11 ML 13 ML 22 TOTAL perdestination
United Kingdom a 2 1 4 7
b 70 030 9 192 75 603 154 825
c
TOTAL PER MLcategory
a 2 1 4 7
b 70 030 9 192 75 603 154 825
c
d 2 1 1 4
e 2(2) 2(1) 2(1) 2(4)
SWEDEN
ML 1 ML 2 ML 3 ML 4 ML 5 ML 6 ML 7 ML 8 ML 9 ML 10 ML 11
Austria a 1 2
b 2 633 3 657 639
c 2 633 3 657 639
Belgium a 13 7 4
b 3 550 520 1 463 819 7 977
c
Bulgaria a 2
b 138 052
c 138 052
Czech Republic a 2 1
b 862 855
c 2 229 132 1
Denmark a 1 2 2 2
b 1 344 146 073 756 030 240 543
c
C382/286
ROJurnalul O
ficialalUniunii Europene
30.12.2011EU ARMS EXPORTS PER DESTINATION IN 2010
Key: (a) = number of licences issued, (b) = value of licences issued in Euros, (c) = value of arms exports in Euros (if available) (d) = total EU number of licence refusals (small discrepancies may appear between breakdowns and totals due to refusals concerning more than oneML item or refusals for items other than those appearing in the ML); (e) = criteria numbers on which refusals are based (the approximate number of times each criterion is invoked is indicated in brackets)

SWEDEN
ML 1 ML 2 ML 3 ML 4 ML 5 ML 6 ML 7 ML 8 ML 9 ML 10 ML 11
Finland a 8 1 1
b 4 199 856 63 900 49 560
c 22 040 1 186 131 541 520 59 000 440 000 111 910
France a 2 1 5 16 2 8 2 7 1 38 24
b 2 445 6 752 169 841 7 574 634 860 429 3 025 265 341 316 1 172 766 186 275 314 246 504 4 214 170
c
Germany a 16 15 28 16 30 64 7 32 16
b 151 571 746 047 8 695 195 3 548 339 598 148 16 709 324 67 302 1 215 241 828 291
c
Greece a 1
b 31 908
c
Ireland a 1 1
b 750 000 606
c
Italy a 7 9 4 2
b 374 865 8 286 172 5 301 296 800 962
c
Lithuania a 1
b 1 736 399
c 1 736 399
Malta a 1
b 3 000
c 3 000
Netherlands a 2 2 2 4 1 3
b 14 621 1 696 33 016 676 154 1 588 535 600
c 5 655 1 696 4 800 2 186 704 6 736 991 714
30.12.2011RO
Jurnalul OficialalU
niunii EuropeneC
382/287EU ARMS EXPORTS PER DESTINATION IN 2010
Key: (a) = number of licences issued, (b) = value of licences issued in Euros, (c) = value of arms exports in Euros (if available) (d) = total EU number of licence refusals (small discrepancies may appear between breakdowns and totals due to refusals concerning more than oneML item or refusals for items other than those appearing in the ML); (e) = criteria numbers on which refusals are based (the approximate number of times each criterion is invoked is indicated in brackets)

SWEDEN
ML 1 ML 2 ML 3 ML 4 ML 5 ML 6 ML 7 ML 8 ML 9 ML 10 ML 11
Poland a
b
c
Romania a 1 1 1
b 15 000 150 864 10 500 000
c 63 271 10 500 000
Slovenia a 1
b 446
c 446
Spain a 3 2
b 159 115
c
United Kingdom a 62 41 8 42 47 30 69 3 18 283 33
b 1 545 126 3 892 312 42 942 1 936 116 2 728 638 1 496 307 949 016 36 520 562 820 5 258 581 952 327
c
TOTAL PER MLcategory
a 99 57 55 90 93 116 71 15 27 362 80
b 5 286 260 4 645 112 14 992 448 17 603 523 14 012 433 23 612 018 1 290 332 1 266 823 11 316 397 326 886 065 7 363 257
c 33 328 2 924 672 4 400 482 4 800 2 186 704 59 000 10 500 000 2 675 868 1 103 625
d
e
ML 13 ML 14 ML 15 ML 16 ML 17 ML 18 ML 21 ML 22 TOTAL perdestination
Austria a 3
b 3 660 272
c 3 660 272
Belgium a 1 2 27
b 2 000 000 2 372 7 024 688
c
Bulgaria a 2
b 138 052
c 138 052
C382/288
ROJurnalul O
ficialalUniunii Europene
30.12.2011EU ARMS EXPORTS PER DESTINATION IN 2010
Key: (a) = number of licences issued, (b) = value of licences issued in Euros, (c) = value of arms exports in Euros (if available) (d) = total EU number of licence refusals (small discrepancies may appear between breakdowns and totals due to refusals concerning more than oneML item or refusals for items other than those appearing in the ML); (e) = criteria numbers on which refusals are based (the approximate number of times each criterion is invoked is indicated in brackets)

SWEDEN
ML 13 ML 14 ML 15 ML 16 ML 17 ML 18 ML 21 ML 22 TOTAL perdestination
Czech Republic a 3
b 862 855
c 5 922 2 235 055
Denmark a 3 3 3 16
b 714 506 117 584 5 362 494 7 338 574
c
Finland a 2 12
b 29 205 4 342 521
c 2 360 601
France a 3 4 15 2 1 3 134
b 3 860 797 1 252 448 7 070 955 369 129 40 627 574 559 344 968 911
c 28 815 427
Germany a 5 3 44 11 20 5 19 331
b 181 727 14 565 12 115 511 3 069 566 1 236 767 50 178 1 511 385 50 739 157
c
Greece a 1 1 3
b 96 745 200 000 328 653
c
Ireland a 2
b 750 606
c
Italy a 1 1 4 28
b 1 620 8 792 633 335 15 407 042
c
Lithuania a 1
b 1 736 399
c 1 736 399
Malta a 1
b 3 000
c 3 000
30.12.2011RO
Jurnalul OficialalU
niunii EuropeneC
382/289EU ARMS EXPORTS PER DESTINATION IN 2010
Key: (a) = number of licences issued, (b) = value of licences issued in Euros, (c) = value of arms exports in Euros (if available) (d) = total EU number of licence refusals (small discrepancies may appear between breakdowns and totals due to refusals concerning more than oneML item or refusals for items other than those appearing in the ML); (e) = criteria numbers on which refusals are based (the approximate number of times each criterion is invoked is indicated in brackets)

SWEDEN
ML 13 ML 14 ML 15 ML 16 ML 17 ML 18 ML 21 ML 22 TOTAL perdestination
Netherlands a 3 17
b 838 198 2 100 873
c 1 079 148 4 276 453
Poland a 4 2 6
b 233 262 25 456 258 718
c
Romania a 3
b 10 665 864
c 10 563 271
Slovenia a 1
b 446
c 446
Spain a 1 1 7
b 159 115
c
United Kingdom a 5 16 26 21 3 4 13 10 734
b 30 380 64 950 556 020 773 780 728 296 1 517 1 114 949 58 032 22 728 631
c
TOTAL PER MLcategory
a 19 27 54 65 18 24 23 36 1 331
b 6 869 770 1 507 917 8 696 440 12 889 291 4 192 447 1 238 284 6 768 248 2 777 312 473 214 376
c 1 079 148 5 922 53 788 976
d
e
C382/290
ROJurnalul O
ficialalUniunii Europene
30.12.2011EU ARMS EXPORTS PER DESTINATION IN 2010
Key: (a) = number of licences issued, (b) = value of licences issued in Euros, (c) = value of arms exports in Euros (if available) (d) = total EU number of licence refusals (small discrepancies may appear between breakdowns and totals due to refusals concerning more than oneML item or refusals for items other than those appearing in the ML); (e) = criteria numbers on which refusals are based (the approximate number of times each criterion is invoked is indicated in brackets)
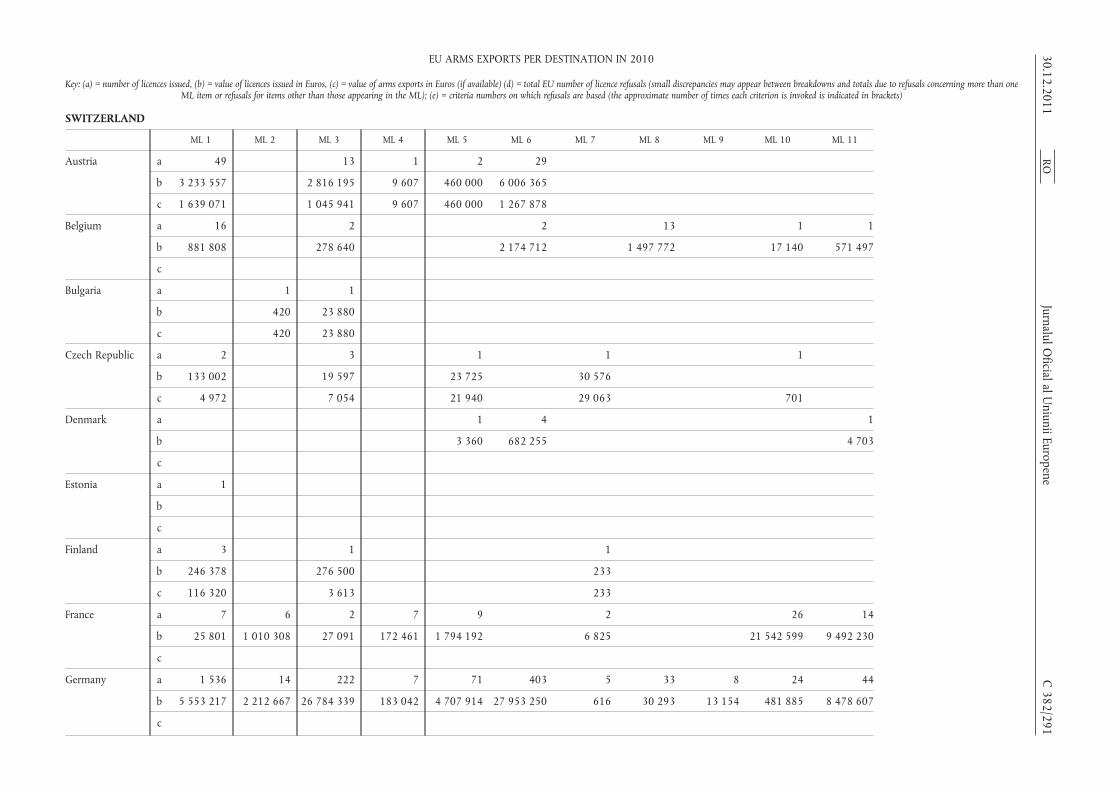
SWITZERLAND
ML 1 ML 2 ML 3 ML 4 ML 5 ML 6 ML 7 ML 8 ML 9 ML 10 ML 11
Austria a 49 13 1 2 29
b 3 233 557 2 816 195 9 607 460 000 6 006 365
c 1 639 071 1 045 941 9 607 460 000 1 267 878
Belgium a 16 2 2 13 1 1
b 881 808 278 640 2 174 712 1 497 772 17 140 571 497
c
Bulgaria a 1 1
b 420 23 880
c 420 23 880
Czech Republic a 2 3 1 1 1
b 133 002 19 597 23 725 30 576
c 4 972 7 054 21 940 29 063 701
Denmark a 1 4 1
b 3 360 682 255 4 703
c
Estonia a 1
b
c
Finland a 3 1 1
b 246 378 276 500 233
c 116 320 3 613 233
France a 7 6 2 7 9 2 26 14
b 25 801 1 010 308 27 091 172 461 1 794 192 6 825 21 542 599 9 492 230
c
Germany a 1 536 14 222 7 71 403 5 33 8 24 44
b 5 553 217 2 212 667 26 784 339 183 042 4 707 914 27 953 250 616 30 293 13 154 481 885 8 478 607
c
30.12.2011RO
Jurnalul OficialalU
niunii EuropeneC
382/291EU ARMS EXPORTS PER DESTINATION IN 2010
Key: (a) = number of licences issued, (b) = value of licences issued in Euros, (c) = value of arms exports in Euros (if available) (d) = total EU number of licence refusals (small discrepancies may appear between breakdowns and totals due to refusals concerning more than oneML item or refusals for items other than those appearing in the ML); (e) = criteria numbers on which refusals are based (the approximate number of times each criterion is invoked is indicated in brackets)

SWITZERLAND
ML 1 ML 2 ML 3 ML 4 ML 5 ML 6 ML 7 ML 8 ML 9 ML 10 ML 11
Greece a 3
b 34 096
c
Hungary a 2 1 3
b 14 200 60 000 5 825 000
c 14 200 37 605 32 039
Ireland a 1
b 61 698
c
Italy a 1 1 1 5
b 41 553 2 027 18 800 28 150 000
c
Malta a 1
b 700
c
Netherlands a 2 10 2 1 20
b 50 500 158 893 324 167 230 7 175 211
c 1 000 140 017 324 2 285 630 1 161 217
Poland a 1 8
b 13 725 2 844 455
c
Romania a 1 1
b 1 383 757 30 975
c 2 044 131 30 975
Slovenia a 4 2
b 115 502 190 672
c 114 889 153 046
C382/292
ROJurnalul O
ficialalUniunii Europene
30.12.2011EU ARMS EXPORTS PER DESTINATION IN 2010
Key: (a) = number of licences issued, (b) = value of licences issued in Euros, (c) = value of arms exports in Euros (if available) (d) = total EU number of licence refusals (small discrepancies may appear between breakdowns and totals due to refusals concerning more than oneML item or refusals for items other than those appearing in the ML); (e) = criteria numbers on which refusals are based (the approximate number of times each criterion is invoked is indicated in brackets)

SWITZERLAND
ML 1 ML 2 ML 3 ML 4 ML 5 ML 6 ML 7 ML 8 ML 9 ML 10 ML 11
Spain a 8 4 2 1
b 17 995 50 000 215 244 37 500
c 17 995 320 640 49 800 794 493 35 572
Sweden a 3 1 6 17 1 1
b
c
United Kingdom a 79 6 44 2 5 1 2 1 93 11
b 1 553 094 92 921 129 121 8 785 496 200 23 100 45 317 17 5 092 017 12 771
c
TOTAL PER MLcategory
a 1 710 28 314 23 111 470 11 48 8 151 76
b 11 723 977 3 316 316 32 123 515 6 240 772 7 907 018 47 074 592 83 567 1 528 082 13 154 27 255 012 46 709 808
c 1 793 558 321 060 3 466 930 41 970 634 986 4 348 001 29 296 35 572 31 676 1 161 217
d 1
e 7(1)
ML 12 ML 13 ML 14 ML 15 ML 16 ML 17 ML 18 ML 21 ML 22 TOTAL perdestination
Austria a 11 1 1 4 111
b 128 810 7 000 2 199 727 75 185 14 936 446
c 124 599 1 649 795 49 500 6 246 391
Belgium a 1 36
b 46 583 5 468 152
c
Bulgaria a 2
b 24 300
c 24 300
30.12.2011RO
Jurnalul OficialalU
niunii EuropeneC
382/293EU ARMS EXPORTS PER DESTINATION IN 2010
Key: (a) = number of licences issued, (b) = value of licences issued in Euros, (c) = value of arms exports in Euros (if available) (d) = total EU number of licence refusals (small discrepancies may appear between breakdowns and totals due to refusals concerning more than oneML item or refusals for items other than those appearing in the ML); (e) = criteria numbers on which refusals are based (the approximate number of times each criterion is invoked is indicated in brackets)

SWITZERLAND
ML 12 ML 13 ML 14 ML 15 ML 16 ML 17 ML 18 ML 21 ML 22 TOTAL perdestination
Czech Republic a 4 2 14
b 334 322 33 148 574 370
c 1 223 128 33 148 1 320 006
Denmark a 1 28 35
b 1 478 8 215 279 8 907 075
c
Estonia a 1
b
c
Finland a 6 11
b 548 135 1 071 246
c 46 842 167 008
France a 2 1 11 2 2 91
b 13 678 26 691 744 4 148 902 188 842 18 376 65 133 050
c 56 927 478
Germany a 17 10 46 21 96 18 44 2 619
b 7 184 756 561 804 2 942 018 2 193 930 1 314 484 1 603 717 468 967 92 668 660
c
Greece a 3
b 34 096
c
Hungary a 6
b 5 899 200
c 83 844
Ireland a 1
b 61 698
c
Italy a 8
b 28 212 380
c 4 900 258
C382/294
ROJurnalul O
ficialalUniunii Europene
30.12.2011EU ARMS EXPORTS PER DESTINATION IN 2010
Key: (a) = number of licences issued, (b) = value of licences issued in Euros, (c) = value of arms exports in Euros (if available) (d) = total EU number of licence refusals (small discrepancies may appear between breakdowns and totals due to refusals concerning more than oneML item or refusals for items other than those appearing in the ML); (e) = criteria numbers on which refusals are based (the approximate number of times each criterion is invoked is indicated in brackets)

SWITZERLAND
ML 12 ML 13 ML 14 ML 15 ML 16 ML 17 ML 18 ML 21 ML 22 TOTAL perdestination
Malta a 1
b 700
c
Netherlands a 6 41
b 76 813 7 628 971
c 1 557 639 973 4 229 718
Poland a 1 10
b 19 626 2 877 806
c
Romania a 2
b 1 414 732
c 2 075 106
Slovenia a 1 7
b 2 183 170 2 489 344
c 476 000 743 935
Spain a 1 1 17
b 320 739
c 23 387 216 24 605 716
Sweden a 29
b 954 887
c 2 440 266
United Kingdom a 13 1 16 1 2 1 75 353
b 130 657 22 000 308 404 13 180 720 2 200 000 466 128 10 594 432
c
TOTAL PER MLcategory
a 1 61 23 38 55 22 101 22 125 3 398
b 1 478 9 056 185 34 232 822 5 019 110 5 261 764 2 200 930 3 548 079 3 992 559 1 028 656 249 272 283
c 171 441 1 224 685 1 115 973 1 682 943 23 387 216 49 500 103 764 026
d 1
e 7(1)
30.12.2011RO
Jurnalul OficialalU
niunii EuropeneC
382/295EU ARMS EXPORTS PER DESTINATION IN 2010
Key: (a) = number of licences issued, (b) = value of licences issued in Euros, (c) = value of arms exports in Euros (if available) (d) = total EU number of licence refusals (small discrepancies may appear between breakdowns and totals due to refusals concerning more than oneML item or refusals for items other than those appearing in the ML); (e) = criteria numbers on which refusals are based (the approximate number of times each criterion is invoked is indicated in brackets)

SYRIA
ML 3 ML 7 ML 10 ML 13 ML 15 TOTAL perdestination
Greece a 1 1
b 520 987 520 987
c
United Kingdom a 1 1
b 33 000 33 000
c
TOTAL PER MLcategory
a 1 1 2
b 33 000 520 987 553 987
c
d 4 1 1 6
e 1(3) 4(1) 3(1) 7(1) 4(1) 1(3) 3(1)4 (2) 7(1)
TAIWAN
ML 1 ML 3 ML 4 ML 5 ML 6 ML 7 ML 8 ML 9 ML 10 ML 11 ML 13 ML 14
Austria a 2
b 136
c 136
Belgium a 2
b 77 413
c
Bulgaria a 1
b 2 855 000
c 2 855 000
Finland a 1
b 7 500
c 3 283
C382/296
ROJurnalul O
ficialalUniunii Europene
30.12.2011EU ARMS EXPORTS PER DESTINATION IN 2010
Key: (a) = number of licences issued, (b) = value of licences issued in Euros, (c) = value of arms exports in Euros (if available) (d) = total EU number of licence refusals (small discrepancies may appear between breakdowns and totals due to refusals concerning more than oneML item or refusals for items other than those appearing in the ML); (e) = criteria numbers on which refusals are based (the approximate number of times each criterion is invoked is indicated in brackets)

TAIWAN
ML 1 ML 3 ML 4 ML 5 ML 6 ML 7 ML 8 ML 9 ML 10 ML 11 ML 13 ML 14
Germany a 3 1 1 2 2 9 3 3 1
b 3 454 1 111 500 96 518 303 513 2 025 356 2 976 268 1 438 100 13 000
c
Italy a 1 1
b 4 001 748 1 162 040
c
Netherlands a 5
b 27 026 622
c 828 290 11 796 442
United Kingdom a 1 13 13 8 9 68 51 42 4 10
b 13 200 275 183 139 038 134 908 131 821 493 933 15 864 638 14 186 181 127 493 636 521
c
TOTAL PER MLcategory
a 7 1 2 13 15 11 18 77 52 46 5 10
b 81 003 1 111 500 109 718 275 183 442 551 144 433 132 177 33 351 823 19 866 386 16 786 321 140 493 636 521
c 136 828 290 3 283 14 651 442
d 1 2 4
e 2(1) 8(1) 4(2) 4(4)
ML 15 ML 16 ML 17 ML 18 ML 21 ML 22 TOTAL perdestination
Austria a 2
b 136
c 136
Belgium a 2
b 77 413
c
30.12.2011RO
Jurnalul OficialalU
niunii EuropeneC
382/297EU ARMS EXPORTS PER DESTINATION IN 2010
Key: (a) = number of licences issued, (b) = value of licences issued in Euros, (c) = value of arms exports in Euros (if available) (d) = total EU number of licence refusals (small discrepancies may appear between breakdowns and totals due to refusals concerning more than oneML item or refusals for items other than those appearing in the ML); (e) = criteria numbers on which refusals are based (the approximate number of times each criterion is invoked is indicated in brackets)

TAIWAN
ML 15 ML 16 ML 17 ML 18 ML 21 ML 22 TOTAL perdestination
Bulgaria a 1
b 2 855 000
c 2 855 000
Finland a 1
b 7 500
c 3 283
Germany a 1 2 28
b 2 773 067 10 001 8 727 802
c
Italy a 2
b 5 163 788
c 72 262
Netherlands a 1 6
b 10 000 27 036 622
c 12 624 732
United Kingdom a 3 5 1 2 54 284
b 168 080 125 887 182 660 1 576 433 33 874 157
c
TOTAL PER MLcategory
a 3 6 1 2 57 326
b 168 080 2 898 954 182 660 1 596 434 77 742 419
c 15 555 413
d 1 1 2 12
e 1(1) 4(1) 4(1) 7(1) 4(2) 1(1)2(1) 4(10)
7(2) 8(1)
C382/298
ROJurnalul O
ficialalUniunii Europene
30.12.2011EU ARMS EXPORTS PER DESTINATION IN 2010
Key: (a) = number of licences issued, (b) = value of licences issued in Euros, (c) = value of arms exports in Euros (if available) (d) = total EU number of licence refusals (small discrepancies may appear between breakdowns and totals due to refusals concerning more than oneML item or refusals for items other than those appearing in the ML); (e) = criteria numbers on which refusals are based (the approximate number of times each criterion is invoked is indicated in brackets)
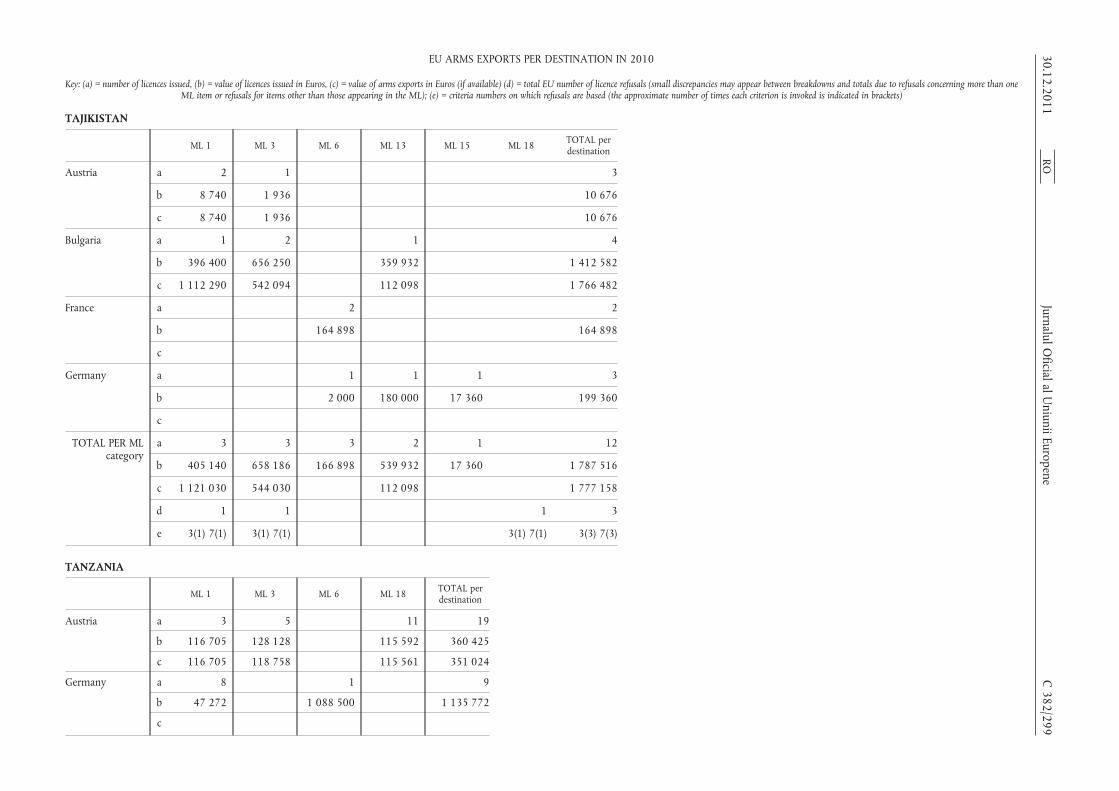
TAJIKISTAN
ML 1 ML 3 ML 6 ML 13 ML 15 ML 18 TOTAL perdestination
Austria a 2 1 3
b 8 740 1 936 10 676
c 8 740 1 936 10 676
Bulgaria a 1 2 1 4
b 396 400 656 250 359 932 1 412 582
c 1 112 290 542 094 112 098 1 766 482
France a 2 2
b 164 898 164 898
c
Germany a 1 1 1 3
b 2 000 180 000 17 360 199 360
c
TOTAL PER MLcategory
a 3 3 3 2 1 12
b 405 140 658 186 166 898 539 932 17 360 1 787 516
c 1 121 030 544 030 112 098 1 777 158
d 1 1 1 3
e 3(1) 7(1) 3(1) 7(1) 3(1) 7(1) 3(3) 7(3)
TANZANIA
ML 1 ML 3 ML 6 ML 18 TOTAL perdestination
Austria a 3 5 11 19
b 116 705 128 128 115 592 360 425
c 116 705 118 758 115 561 351 024
Germany a 8 1 9
b 47 272 1 088 500 1 135 772
c
30.12.2011RO
Jurnalul OficialalU
niunii EuropeneC
382/299EU ARMS EXPORTS PER DESTINATION IN 2010
Key: (a) = number of licences issued, (b) = value of licences issued in Euros, (c) = value of arms exports in Euros (if available) (d) = total EU number of licence refusals (small discrepancies may appear between breakdowns and totals due to refusals concerning more than oneML item or refusals for items other than those appearing in the ML); (e) = criteria numbers on which refusals are based (the approximate number of times each criterion is invoked is indicated in brackets)

TANZANIA
ML 1 ML 3 ML 6 ML 18 TOTAL perdestination
Italy a
b
c 8 900
Netherlands a 1 2 3
b 3 000 2 3 002
c
Spain a 1 1
b 1 600 1 600
c 1 600 1 600
Sweden a
b
c 10 431
United Kingdom a 10 7 16 33
b 81 051 1 753 228 943 311 747
c
TOTAL PER MLcategory
a 23 14 17 11 65
b 249 628 129 883 1 317 443 115 592 1 812 546
c 118 305 118 758 115 561 371 955
d 1 1
e 7(1) 7(1)
C382/300
ROJurnalul O
ficialalUniunii Europene
30.12.2011EU ARMS EXPORTS PER DESTINATION IN 2010
Key: (a) = number of licences issued, (b) = value of licences issued in Euros, (c) = value of arms exports in Euros (if available) (d) = total EU number of licence refusals (small discrepancies may appear between breakdowns and totals due to refusals concerning more than oneML item or refusals for items other than those appearing in the ML); (e) = criteria numbers on which refusals are based (the approximate number of times each criterion is invoked is indicated in brackets)

THAILAND
ML 1 ML 2 ML 3 ML 4 ML 5 ML 6 ML 7 ML 8 ML 9 ML 10 ML 11
Austria a 33 2 2
b 128 045 2 034 642 69 553
c 94 895
Belgium a 2 3
b 1 343 913 14 928 395
c
Bulgaria a 1
b 75 900
c 75 900
Czech Republic a 48 6 1 9
b 6 478 100 574 974 150 258 2 732 170
c 4 946 686 198 360 145 178 606 719
Finland a 2 3 3
b 19 910 17 903 131 900
c 28 280 18 401 131 940
France a 1 1 6 1 12 23
b 1 239 356 150 987 3 231 384 765 695 3 671 907 5 685 318
c
Germany a 4 1 2 6 1 2 18 16
b 29 472 72 423 138 864 110 725 49 129 689 5 376 628 5 901 799
c
Ireland a 1
b 928 000
c
Italy a 1 4 2 2
b 1 184 838 6 488 296 1 454 862 101 700
c
30.12.2011RO
Jurnalul OficialalU
niunii EuropeneC
382/301EU ARMS EXPORTS PER DESTINATION IN 2010
Key: (a) = number of licences issued, (b) = value of licences issued in Euros, (c) = value of arms exports in Euros (if available) (d) = total EU number of licence refusals (small discrepancies may appear between breakdowns and totals due to refusals concerning more than oneML item or refusals for items other than those appearing in the ML); (e) = criteria numbers on which refusals are based (the approximate number of times each criterion is invoked is indicated in brackets)

THAILAND
ML 1 ML 2 ML 3 ML 4 ML 5 ML 6 ML 7 ML 8 ML 9 ML 10 ML 11
Malta a 8
b 233 241
c 233 241
Netherlands a 7
b 18 888 461
c 5 227 611
Romania a 2 2
b 691 175 747 341
c 691 175 747 341
Spain a 1 2
b 3 485 122 850
c 3 485 122 850 650 256
Sweden a 3 1 2 4
b
c
United Kingdom a 42 55 1 28 12 16 40 2 13 44
b 642 008 871 124 11 298 316 155 1 019 895 86 107 171 363 478 147 105 210 621 299
c
TOTAL PER MLcategory
a 139 65 14 35 32 16 49 2 5 58 89
b 10 043 102 9 289 950 16 281 918 2 117 277 24 308 303 86 107 299 991 150 307 1 373 531 13 920 557 12 485 769
c 5 278 307 691 175 973 981 122 850 5 227 611 18 401 145 178 1 256 975 207 840
d 1 1 2
e 3(1) 7(1) 7(1) 2(2) 3(2)
C382/302
ROJurnalul O
ficialalUniunii Europene
30.12.2011EU ARMS EXPORTS PER DESTINATION IN 2010
Key: (a) = number of licences issued, (b) = value of licences issued in Euros, (c) = value of arms exports in Euros (if available) (d) = total EU number of licence refusals (small discrepancies may appear between breakdowns and totals due to refusals concerning more than oneML item or refusals for items other than those appearing in the ML); (e) = criteria numbers on which refusals are based (the approximate number of times each criterion is invoked is indicated in brackets)

THAILAND
ML 13 ML 14 ML 15 ML 17 ML 18 ML 21 ML 22 TOTAL perdestination
Austria a 1 1 39
b 631 766 13 893 2 877 899
c 13 893 108 788
Belgium a 5
b 16 272 308
c
Bulgaria a 1 2
b 32 900 108 800
c 75 900
Czech Republic a 64
b 9 935 502
c 5 896 943
Finland a 8
b 169 713
c 178 621
France a 2 15 1 5 67
b 122 721 2 909 025 12 582 492 496 18 281 472
c 4 235 757
Germany a 6 1 2 1 4 3 67
b 1 038 254 188 770 21 240 1 063 12 000 10 513 13 031 489
c
Ireland a 1
b 928 000
c
Italy a 9
b 9 229 696
c 2 295 395
30.12.2011RO
Jurnalul OficialalU
niunii EuropeneC
382/303EU ARMS EXPORTS PER DESTINATION IN 2010
Key: (a) = number of licences issued, (b) = value of licences issued in Euros, (c) = value of arms exports in Euros (if available) (d) = total EU number of licence refusals (small discrepancies may appear between breakdowns and totals due to refusals concerning more than oneML item or refusals for items other than those appearing in the ML); (e) = criteria numbers on which refusals are based (the approximate number of times each criterion is invoked is indicated in brackets)

THAILAND
ML 13 ML 14 ML 15 ML 17 ML 18 ML 21 ML 22 TOTAL perdestination
Malta a 8
b 233 241
c 233 241
Netherlands a 1 8
b 123 050 19 011 511
c 1 000 5 228 611
Romania a 4
b 1 438 516
c 1 438 516
Spain a 3
b 126 335
c 776 591
Sweden a 2 2 14
b 408 903 790
c 52 837 075
United Kingdom a 8 9 4 11 7 4 296
b 131 360 332 929 127 600 60 210 10 276 26 070 5 011 052
c
TOTAL PER MLcategory
a 14 12 24 13 2 14 12 595
b 1 169 614 578 701 3 890 061 81 450 14 956 34 858 529 079 505 559 323
c 1 000 13 893 73 305 438
d 1 5
e 2(1) 3(1) 2(3) 3(4)7(2)
C382/304
ROJurnalul O
ficialalUniunii Europene
30.12.2011EU ARMS EXPORTS PER DESTINATION IN 2010
Key: (a) = number of licences issued, (b) = value of licences issued in Euros, (c) = value of arms exports in Euros (if available) (d) = total EU number of licence refusals (small discrepancies may appear between breakdowns and totals due to refusals concerning more than oneML item or refusals for items other than those appearing in the ML); (e) = criteria numbers on which refusals are based (the approximate number of times each criterion is invoked is indicated in brackets)

TIMOR LESTE
ML 5 TOTAL perdestination
Germany a 1 1
b 15 105 15 105
c
TOTAL PER MLcategory
a 1 1
b 15 105 15 105
c
d
e
TOGO
ML 1 ML 6 ML 11 TOTAL perdestination
Czech Republic a 1 1
b 37 407 37 407
c 35 331 35 331
France a 1 1
b 161 892 161 892
c
Germany a 3 3
b 131 152 131 152
c
United Kingdom a 203 203
b 1 475 406 1 475 406
c
TOTAL PER MLcategory
a 1 206 1 208
b 37 407 1 606 558 161 892 1 805 857
c 35 331 35 331
d
e
30.12.2011 RO Jurnalul Oficial al Uniunii Europene C 382/305
EU ARMS EXPORTS PER DESTINATION IN 2010
Key: (a) = number of licences issued, (b) = value of licences issued in Euros, (c) = value of arms exports in Euros (if available) (d) = total EU number of licence refusals (small discrepancies mayappear between breakdowns and totals due to refusals concerning more than one ML item or refusals for items other than those appearing in the ML); (e) = criteria numbers on which refusals are
based (the approximate number of times each criterion is invoked is indicated in brackets)
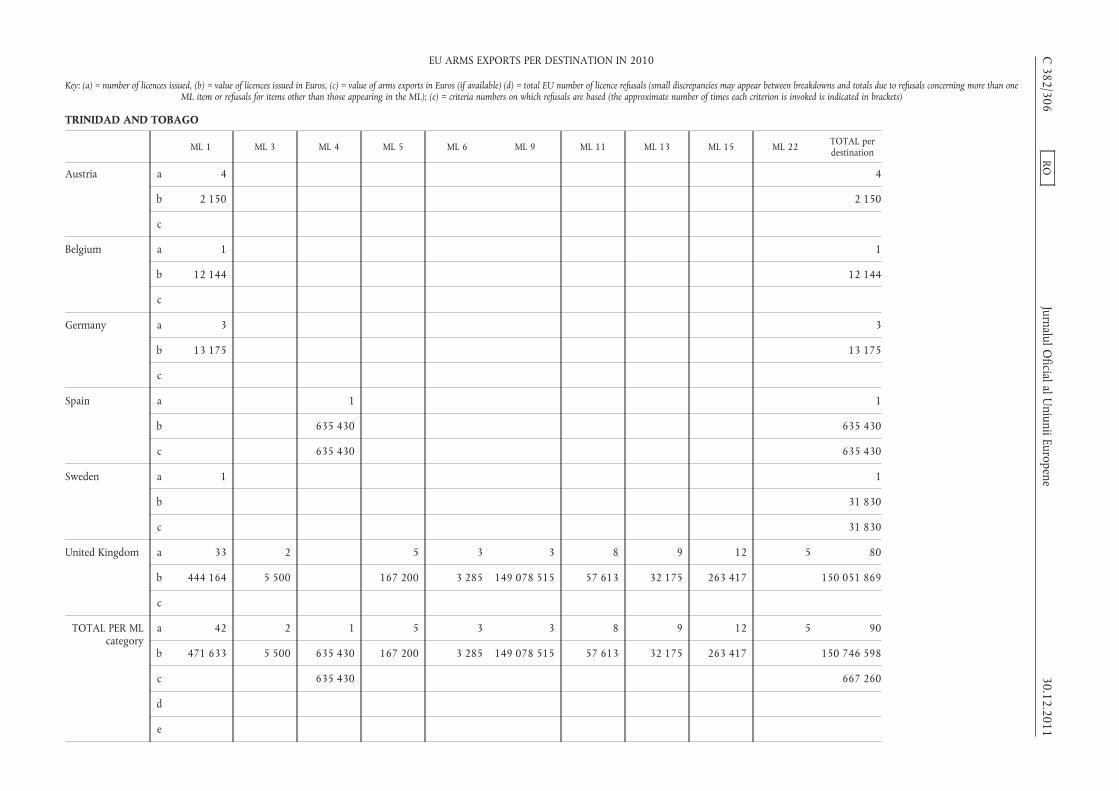
TRINIDAD AND TOBAGO
ML 1 ML 3 ML 4 ML 5 ML 6 ML 9 ML 11 ML 13 ML 15 ML 22 TOTAL perdestination
Austria a 4 4
b 2 150 2 150
c
Belgium a 1 1
b 12 144 12 144
c
Germany a 3 3
b 13 175 13 175
c
Spain a 1 1
b 635 430 635 430
c 635 430 635 430
Sweden a 1 1
b 31 830
c 31 830
United Kingdom a 33 2 5 3 3 8 9 12 5 80
b 444 164 5 500 167 200 3 285 149 078 515 57 613 32 175 263 417 150 051 869
c
TOTAL PER MLcategory
a 42 2 1 5 3 3 8 9 12 5 90
b 471 633 5 500 635 430 167 200 3 285 149 078 515 57 613 32 175 263 417 150 746 598
c 635 430 667 260
d
e
C382/306
ROJurnalul O
ficialalUniunii Europene
30.12.2011EU ARMS EXPORTS PER DESTINATION IN 2010
Key: (a) = number of licences issued, (b) = value of licences issued in Euros, (c) = value of arms exports in Euros (if available) (d) = total EU number of licence refusals (small discrepancies may appear between breakdowns and totals due to refusals concerning more than oneML item or refusals for items other than those appearing in the ML); (e) = criteria numbers on which refusals are based (the approximate number of times each criterion is invoked is indicated in brackets)

TUNISIA
ML 1 ML 2 ML 3 ML 4 ML 5 ML 6 ML 7 ML 8 ML 9 ML 10 ML 11 ML 12 ML 13
Austria a 1 1
b 9 040 85 256
c 9 040 87 500 85 256
Belgium a 1
b 1 680
c
Czech Republic a 1
b 197 707
c 406 636
Finland a 1
b 11 210
c 2 213
France a 3 2 1 2 10 1 2 5 1 6
b 90 598 775 451 320 806 234 985 1 234 082 5 342 281 191 242 252 497 234 985 376 675
c
Germany a 3 2 1 1
b 243 697 127 1 400 000 4 300
c
Italy a 2
b 86 854
c
Netherlands a
b
c 273 260
Portugal a 31
b 2 331 271
c 2 331 271
30.12.2011RO
Jurnalul OficialalU
niunii EuropeneC
382/307EU ARMS EXPORTS PER DESTINATION IN 2010
Key: (a) = number of licences issued, (b) = value of licences issued in Euros, (c) = value of arms exports in Euros (if available) (d) = total EU number of licence refusals (small discrepancies may appear between breakdowns and totals due to refusals concerning more than oneML item or refusals for items other than those appearing in the ML); (e) = criteria numbers on which refusals are based (the approximate number of times each criterion is invoked is indicated in brackets)

TUNISIA
ML 1 ML 2 ML 3 ML 4 ML 5 ML 6 ML 7 ML 8 ML 9 ML 10 ML 11 ML 12 ML 13
Spain a 1 1 1 1 2 5
b 778 480
c 778 480
Sweden a 1 1
b
c
United Kingdom a 2 4 3 12 1 1
b 6 912 4 086 37 376 64 055 660 2 825
c
TOTAL PER MLcategory
a 7 5 6 6 23 4 1 3 1 35 10 1 12
b 108 230 862 305 324 892 272 361 1 298 137 328 953 778 607 5 342 281 4 120 220 268 667 234 985 379 500
c 9 040 778 480 360 760 85 256 2 737 907 2 213
d 1
e 2(1)
ML 14 ML 15 ML 17 ML 21 ML 22 TOTAL perdestination
Austria a 2
b 94 296
c 181 796
Belgium a 1 2
b 6 230 7 910
c
Czech Republic a 1
b 197 707
c 112 693 519 329
Finland a 1
b 11 210
c 2 213
France a 3 1 37
b 6 678 530 67 430 15 799 561
c 957 074
C382/308
ROJurnalulO
ficialalUniuniiEuropene
30.12.2011EU ARMS EXPORTS PER DESTINATION IN 2010
Key: (a) = number of licences issued, (b) = value of licences issued in Euros, (c) = value of arms exports in Euros (if available) (d) = total EU number of licence refusals (small discrepancies may appear between breakdowns and totals due to refusals concerning more than oneML item or refusals for items other than those appearing in the ML); (e) = criteria numbers on which refusals are based (the approximate number of times each criterion is invoked is indicated in brackets)

TUNISIA
ML 14 ML 15 ML 17 ML 21 ML 22 TOTAL perdestination
Germany a 7
b 1 648 124
c
Italy a 2
b 86 854
c 55 173
Netherlands a
b
c 273 260
Portugal a 31
b 2 331 271
c 2 331 271
Spain a 1 12
b 778 480
c 778 480
Sweden a 1 3
b 5 111 407
c 83 452
United Kingdom a 5 1 29
b 18 607 4 367 138 889
c
TOTAL PER MLcategory
a 6 4 1 2 127
b 18 607 6 678 530 6 230 71 797 26 205 709
c 112 693 5 182 047
d 1
e 2(1)
30.12.2011RO
Jurnalul OficialalU
niunii EuropeneC
382/309EU ARMS EXPORTS PER DESTINATION IN 2010
Key: (a) = number of licences issued, (b) = value of licences issued in Euros, (c) = value of arms exports in Euros (if available) (d) = total EU number of licence refusals (small discrepancies may appear between breakdowns and totals due to refusals concerning more than oneML item or refusals for items other than those appearing in the ML); (e) = criteria numbers on which refusals are based (the approximate number of times each criterion is invoked is indicated in brackets)

TURKEY
ML 1 ML 2 ML 3 ML 4 ML 5 ML 6 ML 7 ML 8 ML 9 ML 10 ML 11
Austria a 16 2 2
b 374 290 1 280 435 900
c 374 290 680
Belgium a 6 2 3 1
b 85 199 139 123 1 443 251 26 920 779
c
Bulgaria a
b
c 34 500
Czech Republic a 1
b 5 536
c 4 778
Denmark a 1
b 4 868 507
c
Estonia a
b
c
Finland a 1 3
b 49 490 35 800
c 49 490 38 000
France a 1 2 16 21 1 8 12 7
b 285 616 252 106 13 642 721 14 897 356 790 538 89 800 366 5 552 747 2 378 548
c
Germany a 53 1 5 6 22 36 5 7 19 24 39
b 775 397 176 400 324 528 11 999 842 2 466 938 156 844 675 1 403 815 952 3 692 984 1 029 784 5 440 891
c
C382/310
ROJurnalul O
ficialalUniunii Europene
30.12.2011EU ARMS EXPORTS PER DESTINATION IN 2010
Key: (a) = number of licences issued, (b) = value of licences issued in Euros, (c) = value of arms exports in Euros (if available) (d) = total EU number of licence refusals (small discrepancies may appear between breakdowns and totals due to refusals concerning more than oneML item or refusals for items other than those appearing in the ML); (e) = criteria numbers on which refusals are based (the approximate number of times each criterion is invoked is indicated in brackets)

TURKEY
ML 1 ML 2 ML 3 ML 4 ML 5 ML 6 ML 7 ML 8 ML 9 ML 10 ML 11
Greece a 1 5
b 600 4 286 537
c
Hungary a 1
b 50 000
c
Italy a 11 7 10 9
b 42 254 650 5 596 539 8 563 245 12 024 536
c
Malta a 1
b 23 500
c 23 500
Netherlands a 2 1 15 1
b 3 168 19 500 7 323 605 121 750
c 694 400 19 500 20 668 003 121 750 40
Poland a 1
b 10 511
c
Romania a 1 2 1
b 16 897 1 787 309 147 500
c 16 897 22 333
Slovakia a 1
b 609 863
c 609 863
Slovenia a 1
b 191 300
c 191 300
30.12.2011RO
Jurnalul OficialalU
niunii EuropeneC
382/311EU ARMS EXPORTS PER DESTINATION IN 2010
Key: (a) = number of licences issued, (b) = value of licences issued in Euros, (c) = value of arms exports in Euros (if available) (d) = total EU number of licence refusals (small discrepancies may appear between breakdowns and totals due to refusals concerning more than oneML item or refusals for items other than those appearing in the ML); (e) = criteria numbers on which refusals are based (the approximate number of times each criterion is invoked is indicated in brackets)

TURKEY
ML 1 ML 2 ML 3 ML 4 ML 5 ML 6 ML 7 ML 8 ML 9 ML 10 ML 11
Spain a 1 1
b 5 000 000
c 357 000
Sweden a 4
b
c
United Kingdom a 25 13 3 42 71 36 36 26 82 59
b 586 304 221 571 54 255 3 802 574 1 599 070 636 278 4 121 830 3 587 451 6 310 357 12 416 416
c
TOTAL PER MLcategory
a 105 27 15 68 138 81 43 10 53 135 118
b 2 116 110 42 904 726 609 073 31 861 809 36 943 315 158 839 652 10 673 145 1 444 203 97 080 801 52 663 449 32 346 191
c 379 762 34 500 90 967 1 008 696 20 859 303 121 750 40 38 000
d 1 1
e 7(1) 7(1)
ML 13 ML 14 ML 15 ML 16 ML 17 ML 18 ML 21 ML 22 TOTAL perdestination
Austria a 1 21
b 16 613 828 083
c 16 613 391 583
Belgium a 12
b 28 588 352
c
Bulgaria a
b
c 34 500
Czech Republic a 3 4
b 274 724 280 260
c 351 355 356 133
C382/312
ROJurnalulO
ficialalUniuniiEuropene
30.12.2011EU ARMS EXPORTS PER DESTINATION IN 2010
Key: (a) = number of licences issued, (b) = value of licences issued in Euros, (c) = value of arms exports in Euros (if available) (d) = total EU number of licence refusals (small discrepancies may appear between breakdowns and totals due to refusals concerning more than oneML item or refusals for items other than those appearing in the ML); (e) = criteria numbers on which refusals are based (the approximate number of times each criterion is invoked is indicated in brackets)

TURKEY
ML 13 ML 14 ML 15 ML 16 ML 17 ML 18 ML 21 ML 22 TOTAL perdestination
Denmark a 1 2
b 19 082 4 887 589
c
Estonia a 1 1
b 2 840 2 840
c 3 036 3 036
Finland a 4
b 85 290
c 87 490
France a 1 1 8 1 4 83
b 74 126 112 292 6 874 504 1 112 642 1 675 953 137 449 515
c 30 382 535
Germany a 8 5 10 5 7 4 17 273
b 7 713 236 1 904 175 2 777 643 243 339 1 120 061 32 613 1 020 701 198 967 974
c
Greece a 6
b 4 287 137
c
Hungary a 1
b 50 000
c
Italy a 37
b 68 438 970
c 25 394 024
Malta a 1
b 23 500
c 23 500
Netherlands a 2 1 22
b 1 430 800 125 000 9 023 823
c 2 194 20 812 581
30.12.2011RO
Jurnalul OficialalU
niunii EuropeneC
382/313EU ARMS EXPORTS PER DESTINATION IN 2010
Key: (a) = number of licences issued, (b) = value of licences issued in Euros, (c) = value of arms exports in Euros (if available) (d) = total EU number of licence refusals (small discrepancies may appear between breakdowns and totals due to refusals concerning more than oneML item or refusals for items other than those appearing in the ML); (e) = criteria numbers on which refusals are based (the approximate number of times each criterion is invoked is indicated in brackets)

TURKEY
ML 13 ML 14 ML 15 ML 16 ML 17 ML 18 ML 21 ML 22 TOTAL perdestination
Poland a 1
b 10 511
c
Romania a 3 7
b 313 040 2 264 746
c 5 940 45 170
Slovakia a 1 2
b 609 863 1 219 726
c 609 863 1 219 726
Slovenia a 1
b 191 300
c 191 300
Spain a 2
b 5 000 000
c 357 000
Sweden a 4
b 21 220
c 21 220
United Kingdom a 17 2 12 17 3 15 459
b 7 190 092 44 1 357 011 702 229 22 19 789 42 605 291
c
TOTAL PER MLcategory
a 26 4 25 10 22 14 8 41 943
b 14 977 455 115 176 10 135 690 2 777 643 945 568 3 954 840 51 717 3 764 346 504 226 127
c 3 036 367 968 617 997 79 319 798
d 1 3
e 7(1) 7(3)
C382/314
ROJurnalul O
ficialalUniunii Europene
30.12.2011EU ARMS EXPORTS PER DESTINATION IN 2010
Key: (a) = number of licences issued, (b) = value of licences issued in Euros, (c) = value of arms exports in Euros (if available) (d) = total EU number of licence refusals (small discrepancies may appear between breakdowns and totals due to refusals concerning more than oneML item or refusals for items other than those appearing in the ML); (e) = criteria numbers on which refusals are based (the approximate number of times each criterion is invoked is indicated in brackets)

TURKMENISTAN
ML 1 ML 3 ML 6 ML 10 ML 11 ML 13 ML 15 ML 22 TOTAL perdestination
Austria a 5 2 1 8
b 16 134 960 4 000 000 4 017 094
c 4 000 000 4 000 000
Bulgaria a 1 1
b 34 800 34 800
c 34 800 34 800
France a 3 2 1 6
b 170 867 369 073 25 060 565 000
c
Germany a 3 1 1 5
b 2 166 200 6 160 000 9 580 8 335 780
c
Italy a 2 2
b 8 856 651 8 856 651
c 4 920
TOTAL PER MLcategory
a 5 3 4 5 1 1 2 1 22
b 16 134 35 760 6 166 200 9 027 518 6 160 000 9 580 369 073 25 060 21 809 325
c 34 800 4 000 000 4 039 720
d 3 2 3 2 10
e 2(3) 4(1) 2(2) 2(3) 2(1) 5(1) 2(9) 4(1)5(1)
30.12.2011RO
Jurnalul OficialalU
niunii EuropeneC
382/315EU ARMS EXPORTS PER DESTINATION IN 2010
Key: (a) = number of licences issued, (b) = value of licences issued in Euros, (c) = value of arms exports in Euros (if available) (d) = total EU number of licence refusals (small discrepancies may appear between breakdowns and totals due to refusals concerning more than oneML item or refusals for items other than those appearing in the ML); (e) = criteria numbers on which refusals are based (the approximate number of times each criterion is invoked is indicated in brackets)
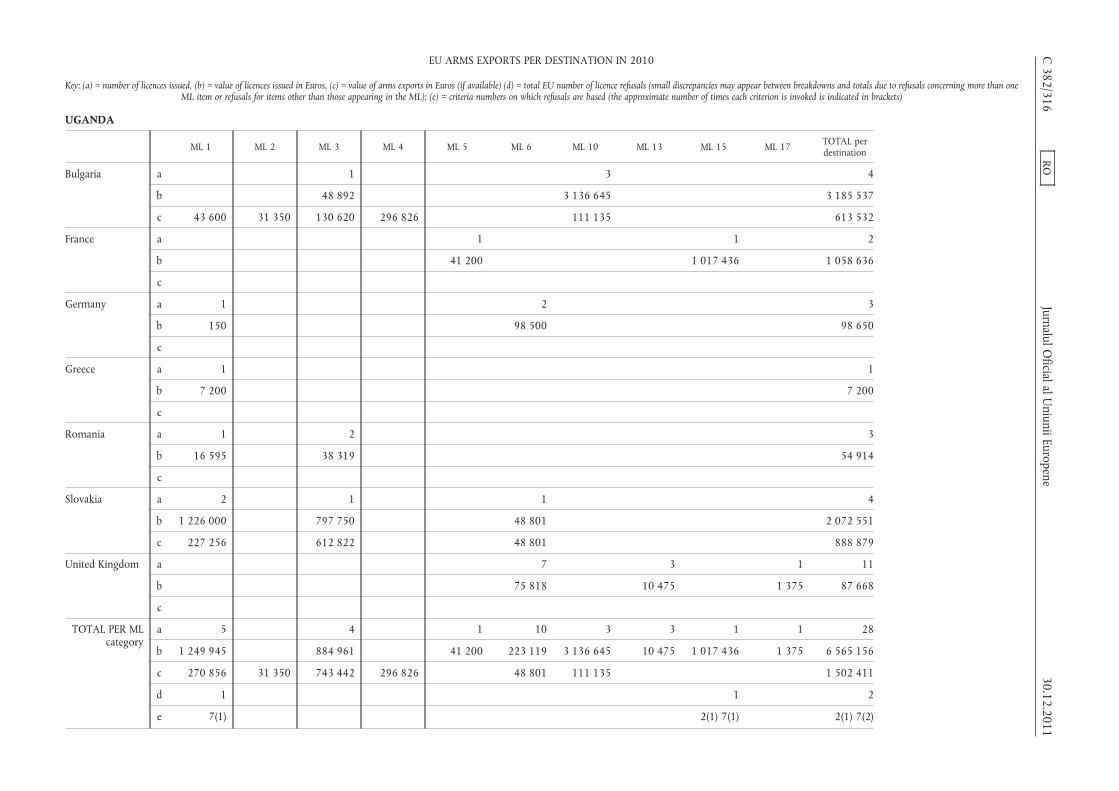
UGANDA
ML 1 ML 2 ML 3 ML 4 ML 5 ML 6 ML 10 ML 13 ML 15 ML 17 TOTAL perdestination
Bulgaria a 1 3 4
b 48 892 3 136 645 3 185 537
c 43 600 31 350 130 620 296 826 111 135 613 532
France a 1 1 2
b 41 200 1 017 436 1 058 636
c
Germany a 1 2 3
b 150 98 500 98 650
c
Greece a 1 1
b 7 200 7 200
c
Romania a 1 2 3
b 16 595 38 319 54 914
c
Slovakia a 2 1 1 4
b 1 226 000 797 750 48 801 2 072 551
c 227 256 612 822 48 801 888 879
United Kingdom a 7 3 1 11
b 75 818 10 475 1 375 87 668
c
TOTAL PER MLcategory
a 5 4 1 10 3 3 1 1 28
b 1 249 945 884 961 41 200 223 119 3 136 645 10 475 1 017 436 1 375 6 565 156
c 270 856 31 350 743 442 296 826 48 801 111 135 1 502 411
d 1 1 2
e 7(1) 2(1) 7(1) 2(1) 7(2)
C382/316
ROJurnalul O
ficialalUniunii Europene
30.12.2011EU ARMS EXPORTS PER DESTINATION IN 2010
Key: (a) = number of licences issued, (b) = value of licences issued in Euros, (c) = value of arms exports in Euros (if available) (d) = total EU number of licence refusals (small discrepancies may appear between breakdowns and totals due to refusals concerning more than oneML item or refusals for items other than those appearing in the ML); (e) = criteria numbers on which refusals are based (the approximate number of times each criterion is invoked is indicated in brackets)

UKRAINE
ML 1 ML 2 ML 3 ML 4 ML 6 ML 7 ML 8 ML 10 ML 11 ML 13 ML 15 ML 18
Austria a 43 9 1
b 1 764 444 364 210 64 550
c 694 175 345 347 64 550
Bulgaria a 2 3 1
b 2 827 375 2 043 817 93 920
c 467 255 63 232 36 000 93 920
Czech Republic a 1 3 2 13 4
b 771 056 1 453 540 329 601 1 601 493 1 191 038
c 870 736 802 693 286 688 391 648 815 291 239 165
Finland a 1 1 2
b 1 120 1 120 60 000
c 60 000
France a 2 3
b 25 246 1 994 317
c
Germany a 86 27 2 2 1
b 2 009 153 329 026 1 142 090 93 684 27
c
Hungary a 1 5 1 1 2 1
b 300 000 3 293 587 119 500 100 000 73 870 255 000
c 300 000 783 712 51 797 63 563 217 756
Italy a
b
c
Latvia a 1
b 3 860
c 3 860
30.12.2011RO
Jurnalul OficialalU
niunii EuropeneC
382/317EU ARMS EXPORTS PER DESTINATION IN 2010
Key: (a) = number of licences issued, (b) = value of licences issued in Euros, (c) = value of arms exports in Euros (if available) (d) = total EU number of licence refusals (small discrepancies may appear between breakdowns and totals due to refusals concerning more than oneML item or refusals for items other than those appearing in the ML); (e) = criteria numbers on which refusals are based (the approximate number of times each criterion is invoked is indicated in brackets)

UKRAINE
ML 1 ML 2 ML 3 ML 4 ML 6 ML 7 ML 8 ML 10 ML 11 ML 13 ML 15 ML 18
Lithuania a 2
b 568 479
c 307 549
Poland a 1
b 8 550
c
Romania a 1
b 22 500
c 22 500
Slovakia a 1 2 1
b 1 658 500 1 475 800 75 800
c 994 400 14 400
Sweden a 1 1
b
c
United Kingdom a 41 1 6
b 1 208 063 220 000 58 300
c
TOTAL PER MLcategory
a 178 2 46 1 10 3 1 20 4 1 9 4
b 9 497 761 1 071 056 5 660 363 119 500 5 091 308 94 804 27 2 368 812 390 800 64 550 2 052 617 1 191 038
c 2 036 026 1 102 693 1 415 747 51 797 1 512 843 36 000 1 239 260 292 156 64 550 239 165
d 4 2 3
e 7(4) 7(2) 7(3)
C382/318
ROJurnalul O
ficialalUniunii Europene
30.12.2011EU ARMS EXPORTS PER DESTINATION IN 2010
Key: (a) = number of licences issued, (b) = value of licences issued in Euros, (c) = value of arms exports in Euros (if available) (d) = total EU number of licence refusals (small discrepancies may appear between breakdowns and totals due to refusals concerning more than oneML item or refusals for items other than those appearing in the ML); (e) = criteria numbers on which refusals are based (the approximate number of times each criterion is invoked is indicated in brackets)
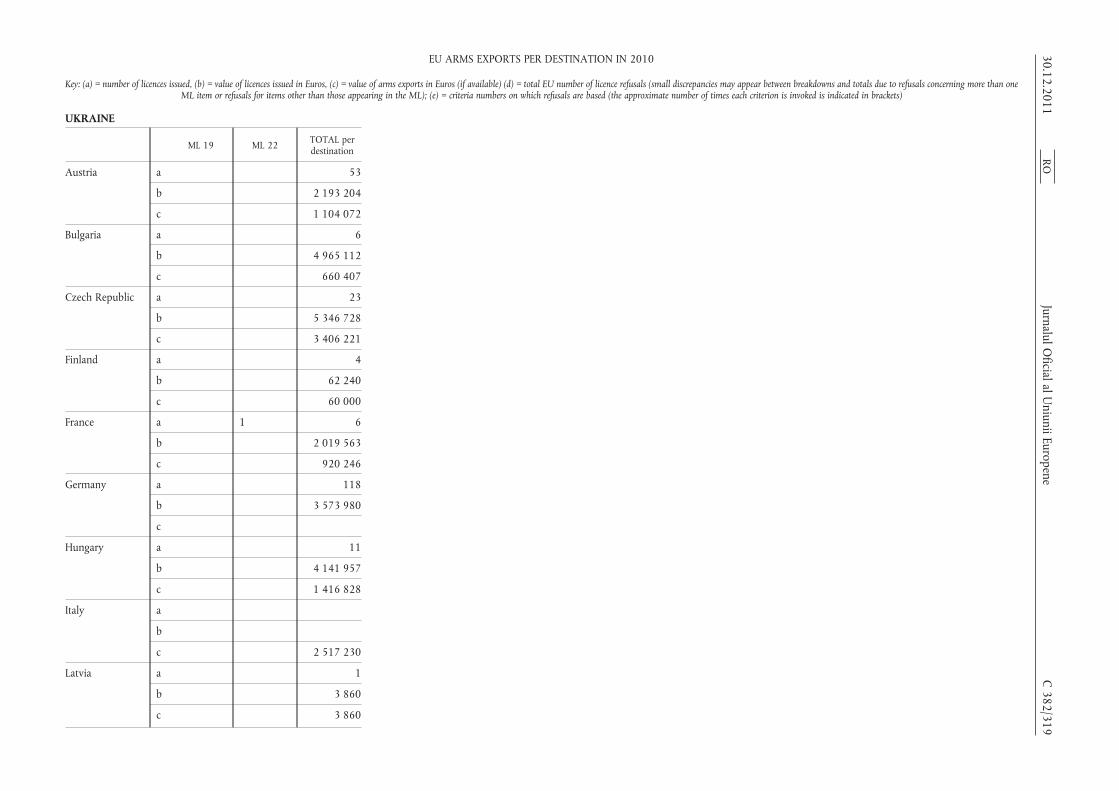
UKRAINE
ML 19 ML 22 TOTAL perdestination
Austria a 53
b 2 193 204
c 1 104 072
Bulgaria a 6
b 4 965 112
c 660 407
Czech Republic a 23
b 5 346 728
c 3 406 221
Finland a 4
b 62 240
c 60 000
France a 1 6
b 2 019 563
c 920 246
Germany a 118
b 3 573 980
c
Hungary a 11
b 4 141 957
c 1 416 828
Italy a
b
c 2 517 230
Latvia a 1
b 3 860
c 3 860
30.12.2011RO
Jurnalul OficialalU
niunii EuropeneC
382/319EU ARMS EXPORTS PER DESTINATION IN 2010
Key: (a) = number of licences issued, (b) = value of licences issued in Euros, (c) = value of arms exports in Euros (if available) (d) = total EU number of licence refusals (small discrepancies may appear between breakdowns and totals due to refusals concerning more than oneML item or refusals for items other than those appearing in the ML); (e) = criteria numbers on which refusals are based (the approximate number of times each criterion is invoked is indicated in brackets)

UKRAINE
ML 19 ML 22 TOTAL perdestination
Lithuania a 2
b 568 479
c 307 549
Poland a 1
b 8 550
c
Romania a 1
b 22 500
c 22 500
Slovakia a 4
b 3 210 100
c 1 008 800
Sweden a 2
b 212 197
c 106 099
United Kingdom a 6 54
b 26 400 1 512 763
c
TOTAL PER MLcategory
a 7 286
b 26 400 27 841 233
c 11 533 812
d 1 1 12 (*)
e 7(1) 7(1) 7(12)
(*) Total number of denials includes a denial in Category ML 5 under Crite-rion 7.
C382/320
ROJurnalul O
ficialalUniunii Europene
30.12.2011EU ARMS EXPORTS PER DESTINATION IN 2010
Key: (a) = number of licences issued, (b) = value of licences issued in Euros, (c) = value of arms exports in Euros (if available) (d) = total EU number of licence refusals (small discrepancies may appear between breakdowns and totals due to refusals concerning more than oneML item or refusals for items other than those appearing in the ML); (e) = criteria numbers on which refusals are based (the approximate number of times each criterion is invoked is indicated in brackets)
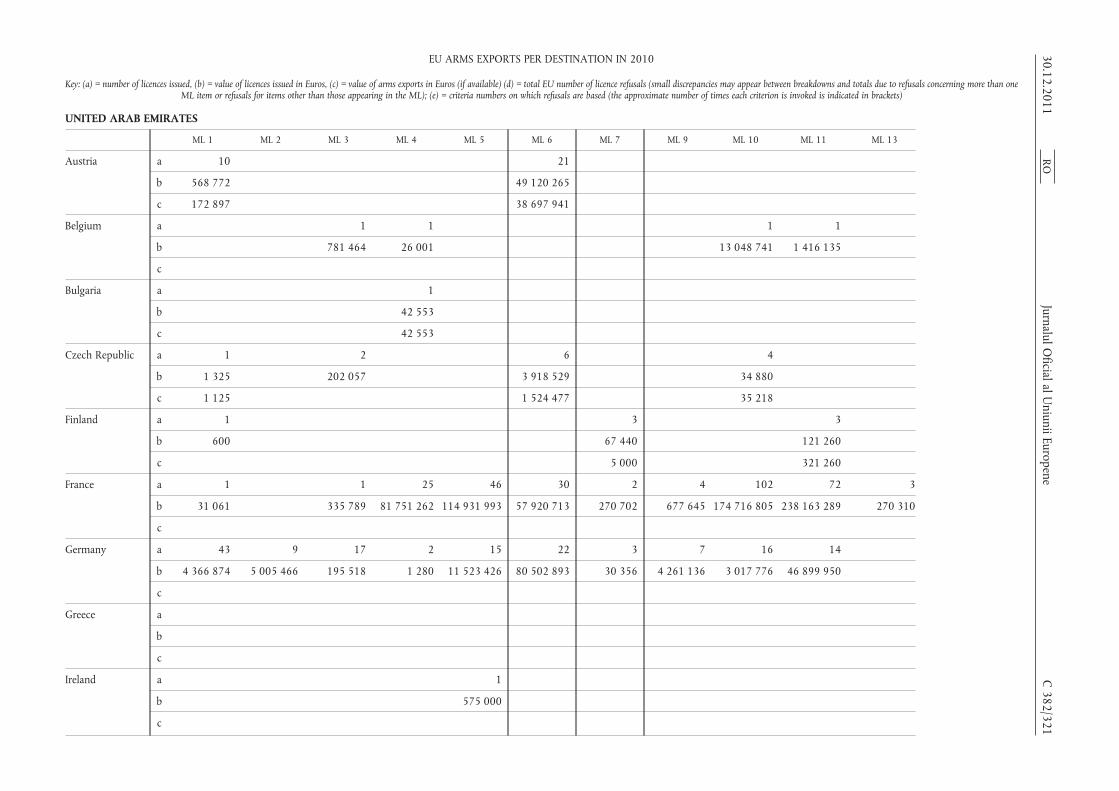
UNITED ARAB EMIRATES
ML 1 ML 2 ML 3 ML 4 ML 5 ML 6 ML 7 ML 9 ML 10 ML 11 ML 13
Austria a 10 21
b 568 772 49 120 265
c 172 897 38 697 941
Belgium a 1 1 1 1
b 781 464 26 001 13 048 741 1 416 135
c
Bulgaria a 1
b 42 553
c 42 553
Czech Republic a 1 2 6 4
b 1 325 202 057 3 918 529 34 880
c 1 125 1 524 477 35 218
Finland a 1 3 3
b 600 67 440 121 260
c 5 000 321 260
France a 1 1 25 46 30 2 4 102 72 3
b 31 061 335 789 81 751 262 114 931 993 57 920 713 270 702 677 645 174 716 805 238 163 289 270 310
c
Germany a 43 9 17 2 15 22 3 7 16 14
b 4 366 874 5 005 466 195 518 1 280 11 523 426 80 502 893 30 356 4 261 136 3 017 776 46 899 950
c
Greece a
b
c
Ireland a 1
b 575 000
c
30.12.2011RO
Jurnalul OficialalU
niunii EuropeneC
382/321EU ARMS EXPORTS PER DESTINATION IN 2010
Key: (a) = number of licences issued, (b) = value of licences issued in Euros, (c) = value of arms exports in Euros (if available) (d) = total EU number of licence refusals (small discrepancies may appear between breakdowns and totals due to refusals concerning more than oneML item or refusals for items other than those appearing in the ML); (e) = criteria numbers on which refusals are based (the approximate number of times each criterion is invoked is indicated in brackets)

UNITED ARAB EMIRATES
ML 1 ML 2 ML 3 ML 4 ML 5 ML 6 ML 7 ML 9 ML 10 ML 11 ML 13
Italy a 4 2 2 1 1 10 4
b 10 034 835 175 339 317 18 875 980 28 300 1 993 686 39 804 569 30 866 542
c
Netherlands a 1 1 2
b 100 000 1 008 079 640 820
c 193 369 189 000 3 999 351
Poland a
b
c
Romania a 2
b 713 893
c 679 972
Spain a 1 3
b
c
Sweden a 5
b
c
United Kingdom a 122 3 12 53 78 8 86 26 241 58 20
b 1 848 270 32 588 85 942 1 338 441 1 281 897 571 509 290 726 1 017 686 2 496 433 3 321 449 1 841 500
c
TOTAL PER MLcategory
a 178 16 33 85 147 92 94 38 377 154 23
b 6 816 902 15 072 888 1 600 770 258 498 855 147 188 296 192 162 209 659 225 7 950 153 234 841 176 321 429 445 2 111 810
c 174 022 193 369 42 553 40 411 418 5 000 715 190 4 320 611
d 1 1 1
e 7(1) 1(1) 7(1)
C382/322
ROJurnalul O
ficialalUniunii Europene
30.12.2011EU ARMS EXPORTS PER DESTINATION IN 2010
Key: (a) = number of licences issued, (b) = value of licences issued in Euros, (c) = value of arms exports in Euros (if available) (d) = total EU number of licence refusals (small discrepancies may appear between breakdowns and totals due to refusals concerning more than oneML item or refusals for items other than those appearing in the ML); (e) = criteria numbers on which refusals are based (the approximate number of times each criterion is invoked is indicated in brackets)

UNITED ARAB EMIRATES
ML 14 ML 15 ML 16 ML 17 ML 18 ML 21 ML 22 TOTAL perdestination
Austria a 2 2 8 43
b 5 584 476 304 000 434 831 56 012 344
c 304 000 433 500 39 608 338
Belgium a 4
b 15 272 341
c
Bulgaria a 1
b 42 553
c 42 553
Czech Republic a 13
b 4 156 791
c 1 560 820
Finland a 1 8
b 13 000 202 300
c 326 260
France a 2 36 8 15 23 370
b 559 649 29 509 273 14 866 646 75 764 729 15 581 918 805 351 786
c 257 916 238
Germany a 7 2 4 2 7 9 179
b 96 700 713 104 047 6 855 641 120 000 2 349 040 579 238 262 513 354
c
Greece a 3 3
b 5 585 000 5 585 000
c
Ireland a 1
b 575 000
c
30.12.2011RO
Jurnalul OficialalU
niunii EuropeneC
382/323EU ARMS EXPORTS PER DESTINATION IN 2010
Key: (a) = number of licences issued, (b) = value of licences issued in Euros, (c) = value of arms exports in Euros (if available) (d) = total EU number of licence refusals (small discrepancies may appear between breakdowns and totals due to refusals concerning more than oneML item or refusals for items other than those appearing in the ML); (e) = criteria numbers on which refusals are based (the approximate number of times each criterion is invoked is indicated in brackets)

UNITED ARAB EMIRATES
ML 14 ML 15 ML 16 ML 17 ML 18 ML 21 ML 22 TOTAL perdestination
Italy a 1 1 26
b 66 436 57 357 277 067 022
c 10 683 529
Netherlands a 1 2 7
b 543 300 3 000 2 295 199
c 4 381 720
Poland a 1 1
b 7 797 7 797
c
Romania a 2
b 713 893
c 679 972
Spain a 1 5
b
c
Sweden a 1 6
b 18 142 851
c 85 303 230
United Kingdom a 14 18 20 10 769
b 205 517 392 224 20 341 14 744 523
c
TOTAL PER MLcategory
a 26 61 1 16 10 44 43 1 438
b 103 593 655 30 325 544 66 436 27 315 084 554 831 78 134 110 16 218 513 1 462 682 754
c 304 000 433 500 400 502 660
d 3
e 1(1) 7(2)
C382/324
ROJurnalul O
ficialalUniunii Europene
30.12.2011EU ARMS EXPORTS PER DESTINATION IN 2010
Key: (a) = number of licences issued, (b) = value of licences issued in Euros, (c) = value of arms exports in Euros (if available) (d) = total EU number of licence refusals (small discrepancies may appear between breakdowns and totals due to refusals concerning more than oneML item or refusals for items other than those appearing in the ML); (e) = criteria numbers on which refusals are based (the approximate number of times each criterion is invoked is indicated in brackets)

UNITED KINGDOM (BERMUDA)
ML 1 ML 3 ML 4 ML 7 ML 8 TOTAL perdestination
Austria a 1 1
b 3 531 3 531
c 3 531 3 531
Germany a 2 2
b 20 860 20 860
c
United Kingdom a 2 6 6 3 1 18
b 25 871 33 930 15 434 7 810 1 980 85 024
c
TOTAL PER MLcategory
a 5 6 6 3 1 21
b 50 262 33 930 15 434 7 810 1 980 109 415
c 3 531 3 531
d
e
UNITED KINGDOM (BRITISH VIRGIN ISLANDS)
ML 6 TOTAL perdestination
United Kingdom a 2 2
b 2 2
c
TOTAL PER MLcategory
a 2 2
b 2 2
c
d
e
UNITED KINGDOM (CAYMAN ISLANDS)
ML 1 TOTAL perdestination
United Kingdom a 1 1
b 2 134 2 134
c
TOTAL PER MLcategory
a 1 1
b 2 134 2 134
c
d
e
30.12.2011 RO Jurnalul Oficial al Uniunii Europene C 382/325
EU ARMS EXPORTS PER DESTINATION IN 2010
Key: (a) = number of licences issued, (b) = value of licences issued in Euros, (c) = value of arms exports in Euros (if available) (d) = total EU number of licence refusals (small discrepancies mayappear between breakdowns and totals due to refusals concerning more than one ML item or refusals for items other than those appearing in the ML); (e) = criteria numbers on which refusals are
based (the approximate number of times each criterion is invoked is indicated in brackets)

UNITED KINGDOM (FALKLAND ISLANDS)
ML 1 ML 11 ML 14 ML 22 TOTAL perdestination
United Kingdom a 27 4 1 2 34
b 49 408 6 243 374 3 56 028
c
TOTAL PER MLcategory
a 27 4 1 2 34
b 49 408 6 243 374 3 56 028
c
d
e
UNITED KINGDOM (GIBRALTAR)
ML 1 ML 3 TOTAL perdestination
United Kingdom a 25 4 29
b 2 175 2 277 4 452
c
TOTAL PER MLcategory
a 25 4 29
b 2 175 2 277 4 452
c
d
e
UNITED KINGDOM (ST HELENA)
ML 1 ML 3 TOTAL perdestination
United Kingdom a 6 4 10
b 4 659 5 048 9 707
c
TOTAL PER MLcategory
a 6 4 10
b 4 659 5 048 9 707
c
d
e
C 382/326 RO Jurnalul Oficial al Uniunii Europene 30.12.2011
EU ARMS EXPORTS PER DESTINATION IN 2010
Key: (a) = number of licences issued, (b) = value of licences issued in Euros, (c) = value of arms exports in Euros (if available) (d) = total EU number of licence refusals (small discrepancies mayappear between breakdowns and totals due to refusals concerning more than one ML item or refusals for items other than those appearing in the ML); (e) = criteria numbers on which refusals are
based (the approximate number of times each criterion is invoked is indicated in brackets)

UNITED KINGDOM
ML 1 ML 2 ML 3 ML 4 ML 5 ML 6 ML 7 ML 8 ML 9 ML 10
Austria a 3 2 7 1 1
b 10 807 25 435 33 255 712 3 100 000 33 500
c 19 960 819 412 47 841 656
Belgium a 15 3 3 1 2 10 4 56
b 3 620 041 2 540 970 6 480 2 925 1 571 268 2 719 440 33 604 19 664 032
c
Bulgaria a 2 2 6
b 4 112 155 850 2 224 315
c 300 151 605 19 647 2 193 716
Czech Republic a 1 3 4 3 1 8
b 673 2 572 54 390 23 885 620 492
c 582 4 800 20 485 758 970
Denmark a 2 3 5 38
b 4 300 723 376 3 661 493 9 568 501
c
Estonia a 1
b 3 100
c
Finland a 4 1
b 1 081 300 9 900
c 107 475 203 819 4 555
France a 6 3 13 45 24 30 18 29 162
b 18 233 423 21 656 429 1 510 777 31 865 806 11 548 858 3 840 175 14 288 642 30 469 039 52 819 371
c
Germany a 65 62 49 46 32 115 5 1 25 149
b 7 035 148 7 748 326 69 567 747 19 252 638 15 830 379 21 067 886 4 274 314 2 364 550 63 599 562
c
30.12.2011RO
Jurnalul OficialalU
niunii EuropeneC
382/327EU ARMS EXPORTS PER DESTINATION IN 2010
Key: (a) = number of licences issued, (b) = value of licences issued in Euros, (c) = value of arms exports in Euros (if available) (d) = total EU number of licence refusals (small discrepancies may appear between breakdowns and totals due to refusals concerning more than oneML item or refusals for items other than those appearing in the ML); (e) = criteria numbers on which refusals are based (the approximate number of times each criterion is invoked is indicated in brackets)

UNITED KINGDOM
ML 1 ML 2 ML 3 ML 4 ML 5 ML 6 ML 7 ML 8 ML 9 ML 10
Greece a 1
b 28 140
c
Hungary a 2 1 2
b 9 250 600 000 48 000
c
Ireland a 13 12
b 844 688 1 144 222
c
Italy a 2 5 18 19 2 2 98
b 488 829 27 894 358 8 401 318 19 007 332 1 155 240 24 669 204 466 548
c
Lithuania a 2
b 146 100
c 61 800
Malta a 7
b 14 158
c 14 079
Netherlands a 8 11 4 1 4
b 19 620 128 458 2 483 840 62 820 10 586 438
c 20 620 74 482 13 865 910 1 338 500 39 500 2 989 796
Poland a 3 3 1 1 3
b 16 950 6 500 6 730 500 86 920 6 858 770
c
Portugal a 2 2
b 18 300 61 477
c 18 300 61 477
C382/328
ROJurnalul O
ficialalUniunii Europene
30.12.2011EU ARMS EXPORTS PER DESTINATION IN 2010
Key: (a) = number of licences issued, (b) = value of licences issued in Euros, (c) = value of arms exports in Euros (if available) (d) = total EU number of licence refusals (small discrepancies may appear between breakdowns and totals due to refusals concerning more than oneML item or refusals for items other than those appearing in the ML); (e) = criteria numbers on which refusals are based (the approximate number of times each criterion is invoked is indicated in brackets)

UNITED KINGDOM
ML 1 ML 2 ML 3 ML 4 ML 5 ML 6 ML 7 ML 8 ML 9 ML 10
Romania a 1 1 13
b 60 000 12 446 2 409 610
c 35 635 12 446 805 338
Slovakia a 1
b
c
Spain a 6 1 9 1 1 22
b 32 400 9 244 271 54 058 351
c 35 479 8 414 558 172 058 95 417 375
Sweden a 1 2 14 13 1 12
b
c
TOTAL PERML category
a 122 79 121 132 97 174 8 42 67 557
b 29 545 412 31 980 232 134 464 358 69 608 721 56 327 210 35 699 089 14 174 17 008 396 35 178 997 424 749 752
c 234 130 824 212 48 364 108 8 434 205 14 037 968 1 358 985 39 500 2 193 716 100 037 511
d
e
ML 11 ML 13 ML 14 ML 15 ML 16 ML 17 ML 18 ML 21 ML 22 TOTAL perdestination
Austria a 14
b 36 425 454
c 48 681 028
Belgium a 1 2 2 99
b 42 600 41 939 5 274 588 35 517 887
c
30.12.2011RO
Jurnalul OficialalU
niunii EuropeneC
382/329EU ARMS EXPORTS PER DESTINATION IN 2010
Key: (a) = number of licences issued, (b) = value of licences issued in Euros, (c) = value of arms exports in Euros (if available) (d) = total EU number of licence refusals (small discrepancies may appear between breakdowns and totals due to refusals concerning more than oneML item or refusals for items other than those appearing in the ML); (e) = criteria numbers on which refusals are based (the approximate number of times each criterion is invoked is indicated in brackets)

UNITED KINGDOM
ML 11 ML 13 ML 14 ML 15 ML 16 ML 17 ML 18 ML 21 ML 22 TOTAL perdestination
Bulgaria a 1 11
b 7 740 2 392 017
c 2 365 268
Czech Republic a 3 1 24
b 852 554 703 418
c 1 533 554 786 924
Denmark a 5 10 2 65
b 1 069 677 2 156 689 29 967 17 214 003
c
Estonia a 1
b 3 100
c
Finland a 2 7
b 29 205 1 120 405
c 702 642 1 018 491
France a 39 7 1 24 1 1 6 25 434
b 15 403 797 22 840 126 1 792 603 9 276 916 115 689 10 914 813 699 4 413 659 240 899 922
c 76 390 925
Germany a 109 9 22 31 26 23 36 65 870
b 54 594 619 1 073 671 1 898 715 11 850 581 11 729 231 22 644 378 1 533 900 143 256 159 455 052 078
c
Greece a 1 1 3
b 1 500 1 400 31 040
c
Hungary a 13 18
b 19 138 535 19 795 785
c 1 060 227 1 060 227
C382/330
ROJurnalul O
ficialalUniunii Europene
30.12.2011EU ARMS EXPORTS PER DESTINATION IN 2010
Key: (a) = number of licences issued, (b) = value of licences issued in Euros, (c) = value of arms exports in Euros (if available) (d) = total EU number of licence refusals (small discrepancies may appear between breakdowns and totals due to refusals concerning more than oneML item or refusals for items other than those appearing in the ML); (e) = criteria numbers on which refusals are based (the approximate number of times each criterion is invoked is indicated in brackets)

UNITED KINGDOM
ML 11 ML 13 ML 14 ML 15 ML 16 ML 17 ML 18 ML 21 ML 22 TOTAL per desti-nation
Ireland a 3 28
b 37 712 2 026 622
c
Italy a 26 1 3 5 7 4 192
b 25 400 110 257 406 242 547 9 481 821 5 250 097 388 995 302 459 270
c 74 175 293
Lithuania a 2
b 146 100
c 61 800
Malta a 7
b 14 158
c 14 079
Netherlands a 1 1 1 7 2 2 42
b 49 500 900 000 175 000 2 391 179 106 860 1 005 000 17 908 715
c 264 000 35 900 2 749 993 37 691 159 750 133 540 21 709 682
Poland a 11
b 13 699 640
c
Portugal a 4
b 79 777
c 79 777
Romania a 2 1 18
b 62 213 102 346 2 646 615
c 32 419 885 838
Slovakia a 1 2
b
c
30.12.2011RO
Jurnalul OficialalU
niunii EuropeneC
382/331EU ARMS EXPORTS PER DESTINATION IN 2010
Key: (a) = number of licences issued, (b) = value of licences issued in Euros, (c) = value of arms exports in Euros (if available) (d) = total EU number of licence refusals (small discrepancies may appear between breakdowns and totals due to refusals concerning more than oneML item or refusals for items other than those appearing in the ML); (e) = criteria numbers on which refusals are based (the approximate number of times each criterion is invoked is indicated in brackets)

UNITED KINGDOM
ML 11 ML 13 ML 14 ML 15 ML 16 ML 17 ML 18 ML 21 ML 22 TOTAL perdestination
Spain a 5 2 2 1 50
b 12 618 988 75 954 010
c 1 205 844 16 371 274 121 616 588
Sweden a 5 1 1 2 52
b 64 401 816
c 151 402 623
TOTAL PERML category
a 195 24 14 74 40 28 27 54 99 1 954
b 109 181 643 25 988 233 3 298 679 32 957 586 21 481 201 11 947 266 27 929 880 7 627 662 149 101 525 1 288 491 832
c 2 174 019 68 319 20 182 048 37 691 159 750 133 540 500 248 543
d
e
UNITED STATES
ML 1 ML 2 ML 3 ML 4 ML 5 ML 6 ML 7 ML 8 ML 9 ML 10
Austria a 75 2 2 9 2
b 155 219 463 68 490 21 400 16 193 080 900 000
c 110 005 240 68 490 7 900 69 000 5 728
Belgium a 137 1 9 2 1 8
b 81 062 861 2 500 000 3 906 039 3 353 330 19 320 000 14 664 028
c
Bulgaria a 9 2 3 6 1
b 5 824 151 523 778 3 326 487 2 487 677 1 498
c 168 265 504 828 2 828 395 2 478 397 1 498
Czech Republic a 6 2 4 4 2 9 1 24
b 167 669 75 129 1 300 914 828 127 7 177 109 1 405 932 77 283 410
c 266 902 759 436 995 096 975 879 115 871 7 520 871
C382/332
ROJurnalul O
ficialalUniunii Europene
30.12.2011EU ARMS EXPORTS PER DESTINATION IN 2010
Key: (a) = number of licences issued, (b) = value of licences issued in Euros, (c) = value of arms exports in Euros (if available) (d) = total EU number of licence refusals (small discrepancies may appear between breakdowns and totals due to refusals concerning more than oneML item or refusals for items other than those appearing in the ML); (e) = criteria numbers on which refusals are based (the approximate number of times each criterion is invoked is indicated in brackets)
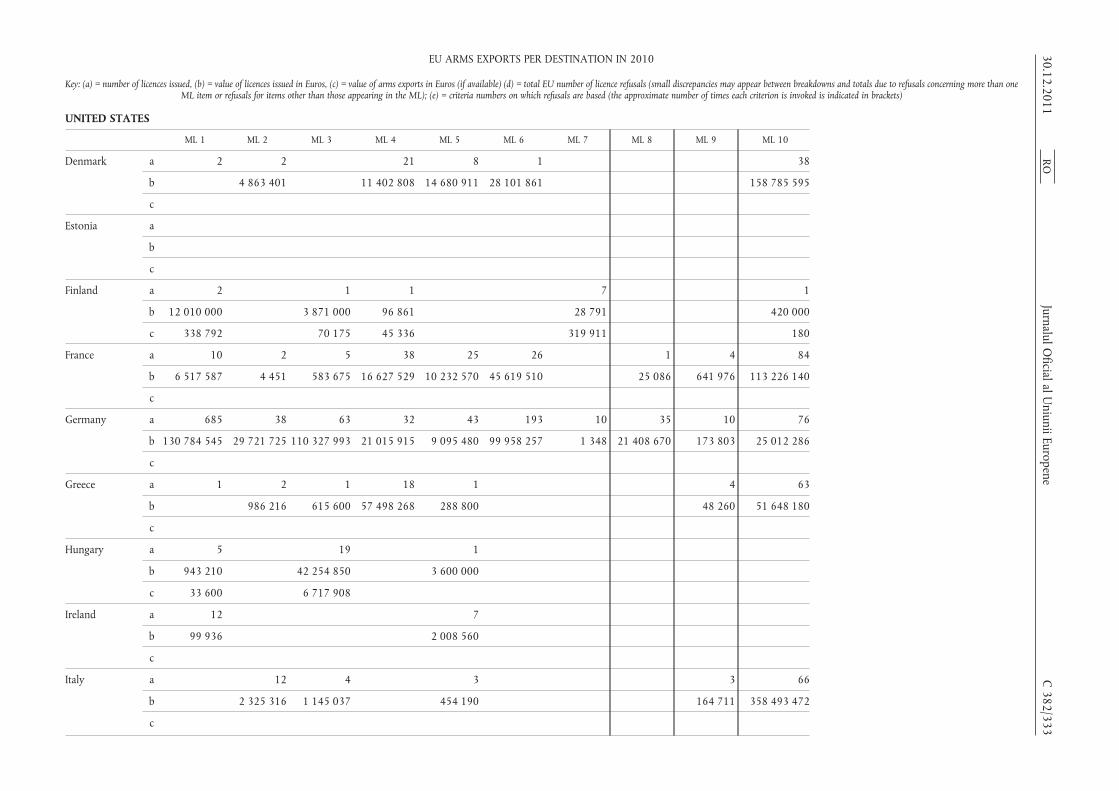
UNITED STATES
ML 1 ML 2 ML 3 ML 4 ML 5 ML 6 ML 7 ML 8 ML 9 ML 10
Denmark a 2 2 21 8 1 38
b 4 863 401 11 402 808 14 680 911 28 101 861 158 785 595
c
Estonia a
b
c
Finland a 2 1 1 7 1
b 12 010 000 3 871 000 96 861 28 791 420 000
c 338 792 70 175 45 336 319 911 180
France a 10 2 5 38 25 26 1 4 84
b 6 517 587 4 451 583 675 16 627 529 10 232 570 45 619 510 25 086 641 976 113 226 140
c
Germany a 685 38 63 32 43 193 10 35 10 76
b 130 784 545 29 721 725 110 327 993 21 015 915 9 095 480 99 958 257 1 348 21 408 670 173 803 25 012 286
c
Greece a 1 2 1 18 1 4 63
b 986 216 615 600 57 498 268 288 800 48 260 51 648 180
c
Hungary a 5 19 1
b 943 210 42 254 850 3 600 000
c 33 600 6 717 908
Ireland a 12 7
b 99 936 2 008 560
c
Italy a 12 4 3 3 66
b 2 325 316 1 145 037 454 190 164 711 358 493 472
c
30.12.2011RO
Jurnalul OficialalU
niunii EuropeneC
382/333EU ARMS EXPORTS PER DESTINATION IN 2010
Key: (a) = number of licences issued, (b) = value of licences issued in Euros, (c) = value of arms exports in Euros (if available) (d) = total EU number of licence refusals (small discrepancies may appear between breakdowns and totals due to refusals concerning more than oneML item or refusals for items other than those appearing in the ML); (e) = criteria numbers on which refusals are based (the approximate number of times each criterion is invoked is indicated in brackets)

UNITED STATES
ML 1 ML 2 ML 3 ML 4 ML 5 ML 6 ML 7 ML 8 ML 9 ML 10
Lithuania a
b
c
Malta a 2
b 4 650
c 310
Netherlands a 5 1 10 15 4 10 3 24
b 6 093 4 177 987 1 223 2 760 67 863 1 958 437 1 903 925 292 325 421
c 2 690 34 016 571 248 1 478 229 763 3 586 523 2 107 086 83 818 604
Poland a 17 6 2 2 18
b 2 877 204 784 734 212 718 2 516 217 325 646
c
Portugal a 4
b 62 396
c 62 396
Romania a 72 2 13 1 1 1 1 3
b 17 819 540 866 659 9 148 557 75 432 10 998 20 020 50 348 5 891 537
c 6 648 411 862 925 1 208 337 75 432 10 998 50 348 5 388 288
Slovakia a 1 1
b 69 557
c 68 846
Spain a 35 1 2 20 6 3 32
b 22 319 535 8 500 45 454 834 9 277 768 4 204 614
c 9 588 976 33 621 383 10 464 057 1 548 565 15 307 481 4 563 993
Sweden a 4 8 25 1 2 13 1
b
c
C382/334
ROJurnalul O
ficialalUniunii Europene
30.12.2011EU ARMS EXPORTS PER DESTINATION IN 2010
Key: (a) = number of licences issued, (b) = value of licences issued in Euros, (c) = value of arms exports in Euros (if available) (d) = total EU number of licence refusals (small discrepancies may appear between breakdowns and totals due to refusals concerning more than oneML item or refusals for items other than those appearing in the ML); (e) = criteria numbers on which refusals are based (the approximate number of times each criterion is invoked is indicated in brackets)

UNITED STATES
ML 1 ML 2 ML 3 ML 4 ML 5 ML 6 ML 7 ML 8 ML 9 ML 10
United Kingdom a 308 35 19 110 121 155 118 4 111 1 662
b 11 557 461 5 480 659 3 801 507 438 223 419 14 489 404 1 516 736 4 653 960 1 658 940 13 401 517 137 905 883
c
TOTAL PERML category
a 1 387 111 187 269 221 412 136 56 139 2 104
b 447 213 905 51 671 868 226 543 850 557 749 281 54 932 789 203 898 340 6 090 031 43 312 696 16 384 540 1 457 248 608
c 127 053 186 35 521 660 45 213 783 14 059 795 1 790 824 4 631 402 435 782 15 313 209 2 157 434 101 354 332
d
e
ML 11 ML 13 ML 14 ML 15 ML 16 ML 17 ML 18 ML 21 ML 22 TOTAL perdestination
Austria a 1 2 3 96
b 1 810 608 22 149 147 310 174 382 500
c 176 682 19 514 110 352 554
Belgium a 2 2 3 165
b 25 132 992 455 401 150 394 651
c
Bulgaria a 2 23
b 132 417 12 296 008
c 41 105 6 022 487
Czech Republic a 10 15 2 79
b 131 674 739 932 1 352 89 111 248
c 2 866 983 481 16 584 73 452 168 224 11 878 662
Denmark a 4 2 10 2 2 92
b 760 062 143 923 3 829 873 7 556 003 1 837 936 231 962 373
c
Estonia a 1 1
b 1 384 1 384
c 1 384 1 384
30.12.2011RO
Jurnalul OficialalU
niunii EuropeneC
382/335EU ARMS EXPORTS PER DESTINATION IN 2010
Key: (a) = number of licences issued, (b) = value of licences issued in Euros, (c) = value of arms exports in Euros (if available) (d) = total EU number of licence refusals (small discrepancies may appear between breakdowns and totals due to refusals concerning more than oneML item or refusals for items other than those appearing in the ML); (e) = criteria numbers on which refusals are based (the approximate number of times each criterion is invoked is indicated in brackets)

UNITED STATES
ML 11 ML 13 ML 14 ML 15 ML 16 ML 17 ML 18 ML 21 ML 22 TOTAL perdestination
Finland a 5 17
b 86 205 16 512 857
c 5 616 695 250 6 391 340
France a 45 3 2 36 10 2 5 30 328
b 12 996 838 236 775 31 905 20 063 801 6 107 600 533 927 96 841 1 646 883 235 193 094
c 186 184 280
Germany a 75 31 30 62 33 42 15 80 1 553
b 34 817 977 1 726 880 16 735 680 28 774 370 36 910 725 15 218 929 1 761 606 18 647 831 602 094 020
c
Greece a 1 3 1 95
b 5 826 1 028 271 151 894 112 271 315
c
Hungary a 3 28
b 1 445 000 48 243 060
c 1 071 000 7 822 508
Ireland a 1 20
b 100 000 2 208 496
c
Italy a 9 2 2 1 1 2 5 110
b 5 683 677 505 804 553 952 192 164 062 196 491 895 246 370 980 750
c 96 797 048
Lithuania a 1 1
b 260 928 260 928
c 40 143 40 143
Malta a 2
b 4 650
c 310
Netherlands a 1 1 7 2 1 1 85
b 4 883 667 816 1 995 624 231 535 20 000 14 067 664 317 431 231
c 4 883 687 249 2 400 693 126 535 20 000 127 002 323
C382/336
ROJurnalul O
ficialalUniunii Europene
30.12.2011EU ARMS EXPORTS PER DESTINATION IN 2010
Key: (a) = number of licences issued, (b) = value of licences issued in Euros, (c) = value of arms exports in Euros (if available) (d) = total EU number of licence refusals (small discrepancies may appear between breakdowns and totals due to refusals concerning more than oneML item or refusals for items other than those appearing in the ML); (e) = criteria numbers on which refusals are based (the approximate number of times each criterion is invoked is indicated in brackets)

UNITED STATES
ML 11 ML 13 ML 14 ML 15 ML 16 ML 17 ML 18 ML 21 ML 22 TOTAL perdestination
Poland a 1 1 12 6 65
b 1 281 275 124 753 289 201 1 605 140 224 503 187
c
Portugal a 4
b 62 396
c 62 396
Romania a 1 2 97
b 671 894 98 061 34 653 046
c 298 620 9 655 14 553 014
Slovakia a 1 3
b 160 000 229 557
c 91 183 160 029
Spain a 2 3 104
b 81 265 251
c 71 475 7 000 75 172 930
Sweden a 9 1 64
b 92 730 127
c 134 108 560
United Kingdom a 508 31 46 20 21 16 42 157 149 3 633
b 24 635 370 1 284 712 8 569 426 1 708 512 718 193 720 815 662 254 2 778 788 218 709 673 986 262
c
TOTAL PERML category
a 660 42 109 106 87 61 112 184 282 6 665
b 105 614 298 3 924 104 11 881 820 43 073 249 31 169 435 44 535 787 20 576 332 26 769 287 25 458 043 3 470 778 391
c 6 766 919 176 932 1 672 114 2 465 382 126 535 298 620 39 514 164 635 218 022 776 549 968
d
e
30.12.2011RO
Jurnalul OficialalU
niunii EuropeneC
382/337EU ARMS EXPORTS PER DESTINATION IN 2010
Key: (a) = number of licences issued, (b) = value of licences issued in Euros, (c) = value of arms exports in Euros (if available) (d) = total EU number of licence refusals (small discrepancies may appear between breakdowns and totals due to refusals concerning more than oneML item or refusals for items other than those appearing in the ML); (e) = criteria numbers on which refusals are based (the approximate number of times each criterion is invoked is indicated in brackets)
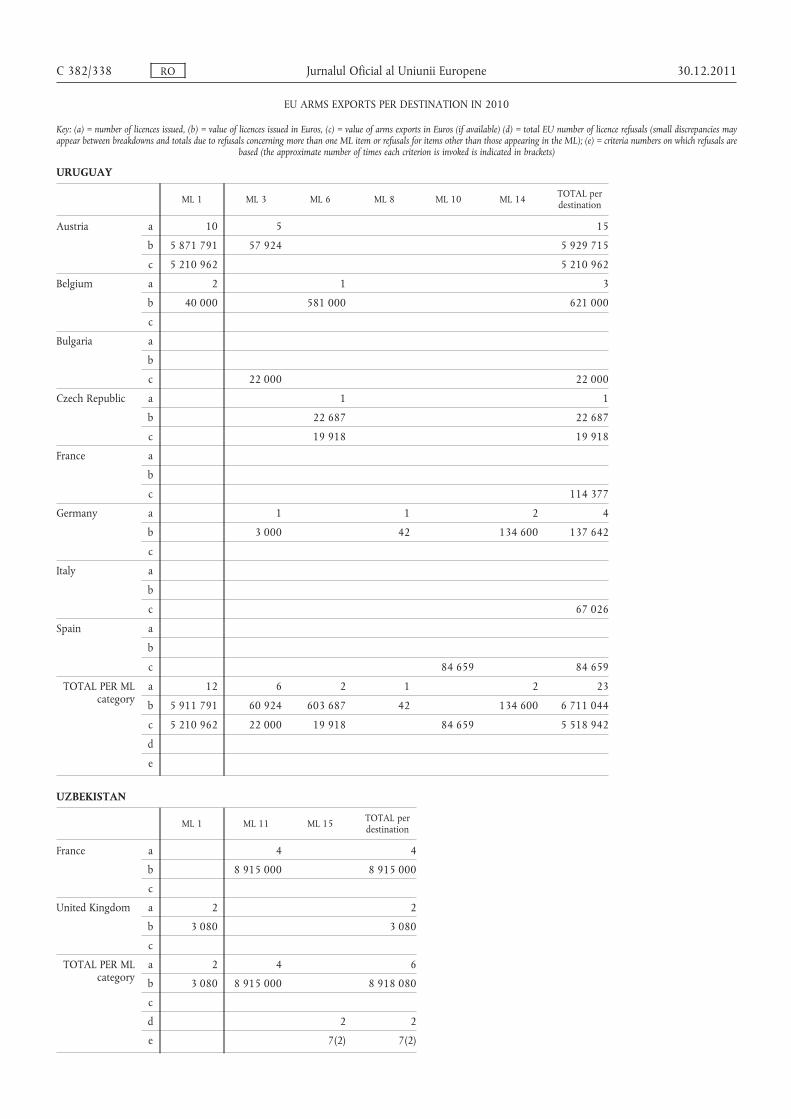
URUGUAY
ML 1 ML 3 ML 6 ML 8 ML 10 ML 14 TOTAL perdestination
Austria a 10 5 15
b 5 871 791 57 924 5 929 715
c 5 210 962 5 210 962
Belgium a 2 1 3
b 40 000 581 000 621 000
c
Bulgaria a
b
c 22 000 22 000
Czech Republic a 1 1
b 22 687 22 687
c 19 918 19 918
France a
b
c 114 377
Germany a 1 1 2 4
b 3 000 42 134 600 137 642
c
Italy a
b
c 67 026
Spain a
b
c 84 659 84 659
TOTAL PER MLcategory
a 12 6 2 1 2 23
b 5 911 791 60 924 603 687 42 134 600 6 711 044
c 5 210 962 22 000 19 918 84 659 5 518 942
d
e
UZBEKISTAN
ML 1 ML 11 ML 15 TOTAL perdestination
France a 4 4
b 8 915 000 8 915 000
c
United Kingdom a 2 2
b 3 080 3 080
c
TOTAL PER MLcategory
a 2 4 6
b 3 080 8 915 000 8 918 080
c
d 2 2
e 7(2) 7(2)
C 382/338 RO Jurnalul Oficial al Uniunii Europene 30.12.2011
EU ARMS EXPORTS PER DESTINATION IN 2010
Key: (a) = number of licences issued, (b) = value of licences issued in Euros, (c) = value of arms exports in Euros (if available) (d) = total EU number of licence refusals (small discrepancies mayappear between breakdowns and totals due to refusals concerning more than one ML item or refusals for items other than those appearing in the ML); (e) = criteria numbers on which refusals are
based (the approximate number of times each criterion is invoked is indicated in brackets)

VENEZUELA
ML 1 ML 3 ML 5 ML 9 ML 10 ML 11 ML 15 ML 22 TOTAL perdestination
Austria a 1 1
b 4 662 4 662
c
France a 1 1 3 15 5 2 27
b 1 230 860 1 186 735 2 086 700 3 295 493 1 371 198 68 433 9 239 418
c 8 078 103
Germany a 1 1 1 3
b 5 130 000 9 486 5 139 486
c
Italy a
b
c 13 901 688
Netherlands a
b
c 49 445 704 49 445 704
Spain a 2 1 3
b 92 500 000 92 500 000
c 212 000 000 212 000 000
United Kingdom a 3 50 1 54
b 95 603 185 522 220 281 344
c
TOTAL PER MLcategory
a 1 2 1 3 6 65 6 4 88
b 4 662 1 230 860 98 816 735 2 182 303 3 481 014 1 380 684 68 653 107 164 910
c 49 445 704 212 000 000 283 425 494
d 5 2 10 (*)
e 2(1) 4(4)6(1) 7(5)
3(1) 4(2) 2(1) 3(1)4(8) 6(2)
7(6)
(*) Total number of denials includes a denial in Category ML 4 under Criterion 4, and a denial in Category 21 under Criterion 4.
30.12.2011 RO Jurnalul Oficial al Uniunii Europene C 382/339
EU ARMS EXPORTS PER DESTINATION IN 2010
Key: (a) = number of licences issued, (b) = value of licences issued in Euros, (c) = value of arms exports in Euros (if available) (d) = total EU number of licence refusals (small discrepancies mayappear between breakdowns and totals due to refusals concerning more than one ML item or refusals for items other than those appearing in the ML); (e) = criteria numbers on which refusals are
based (the approximate number of times each criterion is invoked is indicated in brackets)

VIETNAM
ML 1 ML 2 ML 3 ML 4 ML 5 ML 6 ML 7 ML 10 ML 11 ML 13 ML 14 ML 15
Austria a 1
b 21 109
c 21 109
Czech Republic a 5 2 2 1 5 1
b 1 482 801 77 5 733 490 789 953 300 795 430 705
c 77 3 915 347 374 511 290 878 481 881
Finland a 1
b 2 200
c 2 200
France a 9 8
b 1 765 363 2 976 537
c
Germany a 3 1 3
b 2 968 183 24 450 271 663
c
Greece a 1
b 29 000
c
Hungary a 1 1 1
b 2 000 000 500 000 11 500
c 1 001 960 11 500
Italy a
b
c
Lithuania a 2
b 75 008
c 448 103
C382/340
ROJurnalul O
ficialalUniunii Europene
30.12.2011EU ARMS EXPORTS PER DESTINATION IN 2010
Key: (a) = number of licences issued, (b) = value of licences issued in Euros, (c) = value of arms exports in Euros (if available) (d) = total EU number of licence refusals (small discrepancies may appear between breakdowns and totals due to refusals concerning more than oneML item or refusals for items other than those appearing in the ML); (e) = criteria numbers on which refusals are based (the approximate number of times each criterion is invoked is indicated in brackets)

VIETNAM
ML 1 ML 2 ML 3 ML 4 ML 5 ML 6 ML 7 ML 10 ML 11 ML 13 ML 14 ML 15
Poland a 1 1 2 1
b 497 702 275 300 8 665 600 22 300
c
Romania a 1
b 1 232 154
c 1 232 154
Slovakia a 1 1
b
c
United Kingdom a 19 1 29 33 11 5
b 257 176 39 710 95 072 1 112 366 145 173 532 400
c
TOTAL PER MLcategory
a 26 1 3 30 11 2 36 5 20 3 2 15
b 2 258 788 275 300 39 787 2 095 072 10 430 963 5 733 490 4 080 549 2 597 115 506 418 271 663 430 705 3 537 937
c 21 109 77 1 001 960 3 915 347 2 054 768 304 578 481 881
d 2
e 2(2)
ML 17 ML 18 ML 21 ML 22 TOTAL perdestination
Austria a 1
b 21 109
c 21 109
Czech Republic a 2 18
b 102 304 8 840 125
c 96 026 5 158 720
30.12.2011RO
Jurnalul OficialalU
niunii EuropeneC
382/341EU ARMS EXPORTS PER DESTINATION IN 2010
Key: (a) = number of licences issued, (b) = value of licences issued in Euros, (c) = value of arms exports in Euros (if available) (d) = total EU number of licence refusals (small discrepancies may appear between breakdowns and totals due to refusals concerning more than oneML item or refusals for items other than those appearing in the ML); (e) = criteria numbers on which refusals are based (the approximate number of times each criterion is invoked is indicated in brackets)

VIETNAM
ML 17 ML 18 ML 21 ML 22 TOTAL perdestination
Finland a 1
b 2 200
c 2 200
France a 17
b 4 741 900
c
Germany a 5 12
b 243 292 3 507 588
c
Greece a 1
b 29 000
c
Hungary a 1 4
b 1 520 000 4 031 500
c 1 013 460
Italy a
b
c 20 969
Lithuania a 2
b 75 008
c 448 103
Poland a 5
b 9 460 902
c
Romania a 1
b 1 232 154
c 1 232 154
C382/342
ROJurnalul O
ficialalUniunii Europene
30.12.2011EU ARMS EXPORTS PER DESTINATION IN 2010
Key: (a) = number of licences issued, (b) = value of licences issued in Euros, (c) = value of arms exports in Euros (if available) (d) = total EU number of licence refusals (small discrepancies may appear between breakdowns and totals due to refusals concerning more than oneML item or refusals for items other than those appearing in the ML); (e) = criteria numbers on which refusals are based (the approximate number of times each criterion is invoked is indicated in brackets)

VIETNAM
ML 17 ML 18 ML 21 ML 22 TOTAL perdestination
Slovakia a 2
b
c
United Kingdom a 4 4 3 109
b 6 820 18 761 55 2 207 533
c
TOTAL PER MLcategory
a 4 3 9 3 173
b 6 820 1 622 304 262 053 55 34 149 019
c 96 026 7 896 715
d 2
e 2(2)
YEMEN
ML 1 ML 2 ML 3 ML 4 ML 6 ML 10 ML 11 ML 13 ML 15 ML 22 TOTAL perdestination
Bulgaria a 1 1 5 3 10
b 2 466 667 960 000 6 115 879 1 227 482 10 770 029
c 11 166 667 2 690 489 32 307 261 42 940 693 12 880 89 117 990
Czech Republic a 2 4 7 13
b 1 275 722 14 981 022 2 081 278 18 338 022
c 1 822 272 7 491 706 3 211 004 12 524 982
Finland a 2 2
b 44 800 44 800
c 63 120 63 120
France a 6 6
b 4 265 703 4 265 703
c 738 622
30.12.2011RO
Jurnalul OficialalU
niunii EuropeneC
382/343EU ARMS EXPORTS PER DESTINATION IN 2010
Key: (a) = number of licences issued, (b) = value of licences issued in Euros, (c) = value of arms exports in Euros (if available) (d) = total EU number of licence refusals (small discrepancies may appear between breakdowns and totals due to refusals concerning more than oneML item or refusals for items other than those appearing in the ML); (e) = criteria numbers on which refusals are based (the approximate number of times each criterion is invoked is indicated in brackets)

YEMEN
ML 1 ML 2 ML 3 ML 4 ML 6 ML 10 ML 11 ML 13 ML 15 ML 22 TOTAL perdestination
Germany a 1 1
b 120 000 120 000
c
Greece a 1 1
b 33 000 33 000
c
Italy a
b
c 252 454
Netherlands a
b
c 194 557 194 557
Poland a 1 1 1 3 6
b 53 296 30 294 152 768 212 829 449 187
c
Slovakia a 1 1
b 245 000 245 000
c 231 840 231 840
United Kingdom a 2 6 16 143 1 168
b 79 652 17 368 3 999 75 250 176 270
c
TOTAL PER MLcategory
a 1 4 10 5 9 4 12 18 144 1 208
b 2 466 667 2 289 018 21 127 195 1 307 134 2 354 046 457 829 4 283 071 48 799 108 250 34 442 011
c 11 166 667 4 512 761 39 798 967 42 940 693 3 405 561 231 840 76 000 103 123 565
d 1 3 2 3 1 1 13 (*)
e 3(1) 2(1) 3(3) 2(1) 3(2) 2(2) 3(3)7(2)
3(1) 7(1) 2(4) 3(12)7(4)
(*) Total number of denials includes a denial in Category ML 16 under Criteria 3 and 7, and a denial in Category ML 21 under Criterion 3.
C382/344
ROJurnalul O
ficialalUniunii Europene
30.12.2011EU ARMS EXPORTS PER DESTINATION IN 2010
Key: (a) = number of licences issued, (b) = value of licences issued in Euros, (c) = value of arms exports in Euros (if available) (d) = total EU number of licence refusals (small discrepancies may appear between breakdowns and totals due to refusals concerning more than oneML item or refusals for items other than those appearing in the ML); (e) = criteria numbers on which refusals are based (the approximate number of times each criterion is invoked is indicated in brackets)

ZAMBIA
ML 1 ML 3 ML 6 ML 10 TOTAL perdestination
Austria a 4 4
b 40 876 40 876
c 40 876 40 876
Czech Republic a 1 1
b 49 427 49 427
c
France a 1 1
b 4 749 890 4 749 890
c
Germany a 4 4
b 29 075 29 075
c
Greece a 1 1
b 229 200 229 200
c
Italy a 1 1
b 11 983 000 11 983 000
c
United Kingdom a 9 20 2 31
b 7 645 208 790 25 036 241 471
c
TOTAL PER MLcategory
a 17 22 3 1 43
b 77 596 487 417 4 774 926 11 983 000 17 322 939
c 40 876 40 876
d
e
30.12.2011 RO Jurnalul Oficial al Uniunii Europene C 382/345
EU ARMS EXPORTS PER DESTINATION IN 2010
Key: (a) = number of licences issued, (b) = value of licences issued in Euros, (c) = value of arms exports in Euros (if available) (d) = total EU number of licence refusals (small discrepancies mayappear between breakdowns and totals due to refusals concerning more than one ML item or refusals for items other than those appearing in the ML); (e) = criteria numbers on which refusals are
based (the approximate number of times each criterion is invoked is indicated in brackets)
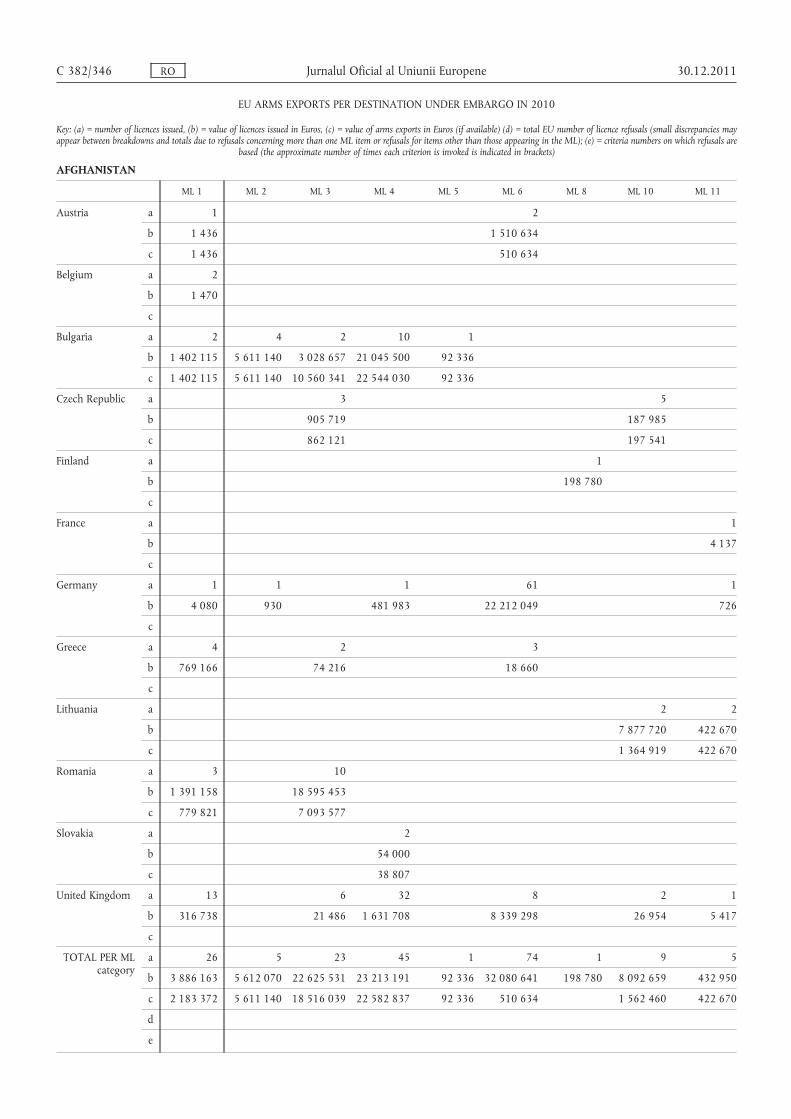
AFGHANISTAN
ML 1 ML 2 ML 3 ML 4 ML 5 ML 6 ML 8 ML 10 ML 11
Austria a 1 2
b 1 436 1 510 634
c 1 436 510 634
Belgium a 2
b 1 470
c
Bulgaria a 2 4 2 10 1
b 1 402 115 5 611 140 3 028 657 21 045 500 92 336
c 1 402 115 5 611 140 10 560 341 22 544 030 92 336
Czech Republic a 3 5
b 905 719 187 985
c 862 121 197 541
Finland a 1
b 198 780
c
France a 1
b 4 137
c
Germany a 1 1 1 61 1
b 4 080 930 481 983 22 212 049 726
c
Greece a 4 2 3
b 769 166 74 216 18 660
c
Lithuania a 2 2
b 7 877 720 422 670
c 1 364 919 422 670
Romania a 3 10
b 1 391 158 18 595 453
c 779 821 7 093 577
Slovakia a 2
b 54 000
c 38 807
United Kingdom a 13 6 32 8 2 1
b 316 738 21 486 1 631 708 8 339 298 26 954 5 417
c
TOTAL PER MLcategory
a 26 5 23 45 1 74 1 9 5
b 3 886 163 5 612 070 22 625 531 23 213 191 92 336 32 080 641 198 780 8 092 659 432 950
c 2 183 372 5 611 140 18 516 039 22 582 837 92 336 510 634 1 562 460 422 670
d
e
C 382/346 RO Jurnalul Oficial al Uniunii Europene 30.12.2011
EU ARMS EXPORTS PER DESTINATION UNDER EMBARGO IN 2010
Key: (a) = number of licences issued, (b) = value of licences issued in Euros, (c) = value of arms exports in Euros (if available) (d) = total EU number of licence refusals (small discrepancies mayappear between breakdowns and totals due to refusals concerning more than one ML item or refusals for items other than those appearing in the ML); (e) = criteria numbers on which refusals are
based (the approximate number of times each criterion is invoked is indicated in brackets)

AFGHANISTAN
ML 13 ML 14 ML 15 ML 17 ML 22 TOTAL perdestination
Austria a 3
b 1 512 070
c 512 070
Belgium a 2
b 1 470
c
Bulgaria a 19
b 31 179 748
c 40 209 961
Czech Republic a 8
b 1 093 704
c 1 500 198 2 559 860
Finland a 1
b 198 780
c
France a 1
b 4 137
c
Germany a 4 1 70
b 11 492 914 1 000 34 193 682
c
Greece a 2 2 13
b 50 581 44 420 957 043
c
Lithuania a 4
b 8 300 390
c 1 787 589
Romania a 1 14
b 226 296 20 212 907
c 7 873 398
Slovakia a 2
b 54 000
c 38 807
United Kingdom a 44 1 9 116
b 2 910 501 11 000 152 378 13 415 479
c
TOTAL PER MLcategory
a 46 1 2 5 10 253
b 2 961 082 226 296 44 420 11 503 914 153 378 111 123 409
c 1 500 198 52 981 685
d 1 1
e 7(1) 7 (1)
30.12.2011 RO Jurnalul Oficial al Uniunii Europene C 382/347
EU ARMS EXPORTS PER DESTINATION UNDER EMBARGO IN 2010
Key: (a) = number of licences issued, (b) = value of licences issued in Euros, (c) = value of arms exports in Euros (if available) (d) = total EU number of licence refusals (small discrepancies mayappear between breakdowns and totals due to refusals concerning more than one ML item or refusals for items other than those appearing in the ML); (e) = criteria numbers on which refusals are
based (the approximate number of times each criterion is invoked is indicated in brackets)

CHINA (HONG KONG)
ML 1 ML 2 ML 3 ML 4 ML 7 ML 10 ML 11 ML 13 ML 14
Austria a 6
b 35 274
c 34 273
Germany a 7 1 1
b 54 768 26 888 17 500
c
Hungary a 1
b 55 000
c
Italy a
b
c
Spain a
b
c
United Kingdom a 85 1 36 3 12 8 3 9 14
b 184 362 11 1 025 475 6 743 234 325 31 322 13 904 51 970 33 781
c
TOTAL PER MLcategory
a 98 1 37 3 13 8 3 10 14
b 274 404 11 1 080 475 6 743 261 213 31 322 13 904 69 470 33 781
c 34 273
d
e
ML 15 ML 17 ML 21 TOTAL perdestination
Austria a 6
b 35 274
c 34 273
Germany a 2 1 12
b 179 577 2 444 281 177
c
Hungary a 1
b 55 000
c
Italy a
b
c 19 338
Spain a
b
c 50 000 50 000
C 382/348 RO Jurnalul Oficial al Uniunii Europene 30.12.2011
EU ARMS EXPORTS PER DESTINATION UNDER EMBARGO IN 2010
Key: (a) = number of licences issued, (b) = value of licences issued in Euros, (c) = value of arms exports in Euros (if available) (d) = total EU number of licence refusals (small discrepancies mayappear between breakdowns and totals due to refusals concerning more than one ML item or refusals for items other than those appearing in the ML); (e) = criteria numbers on which refusals are
based (the approximate number of times each criterion is invoked is indicated in brackets)

CHINA (HONG KONG)
ML 15 ML 17 ML 21 TOTAL perdestination
United Kingdom a 9 180
b 385 193 1 967 086
c
TOTAL PER MLcategory (*)
a 9 2 1 199
b 385 193 179 577 2 444 2 338 537
c 50 000 103 611
d 2
e 2(1); 7(1)
(*) Total number of denials also includes two denials in the ML 6 and 13 categories respec-tively based on Criteria 2 and 7.
CHINA (MACAO)
ML 1 ML 3 ML 4 ML 13 TOTAL perdestination
Austria a 10 3 1 14
b 52 860 5 850 25 500 84 210
c 22 690 5 850 25 500 54 040
Czech Republic a 1 1
b 24 200 24 200
c
United Kingdom a 2 1 3
b 38 500 2 057 40 557
c
TOTAL PER MLcategory
a 10 6 1 1 18
b 52 860 68 550 2 057 25 500 148 967
c 22 690 5 850 25 500 54 040
d 1 1
e 1(1); 7(1) 1(1); 7(1)
30.12.2011 RO Jurnalul Oficial al Uniunii Europene C 382/349
EU ARMS EXPORTS PER DESTINATION UNDER EMBARGO IN 2010
Key: (a) = number of licences issued, (b) = value of licences issued in Euros, (c) = value of arms exports in Euros (if available) (d) = total EU number of licence refusals (small discrepancies mayappear between breakdowns and totals due to refusals concerning more than one ML item or refusals for items other than those appearing in the ML); (e) = criteria numbers on which refusals are
based (the approximate number of times each criterion is invoked is indicated in brackets)

CHINA (MAINLAND)
ML 1 ML 3 ML 4 ML 5 ML 7 ML 8 ML 9 ML 10 ML 11
Austria a
b
c
Czech Republic a 4 2
b 827 232 8 265
c 910 995 10 341
France a 2 3 23 4 1 47 15
b 1 027 4 839 650 5 501 115 1 420 352 98 442 94 400 631 11 139 996
c
Germany a 19 1
b 1 571 717 42 950
c
Italy a
b
c
United Kingdom a 1 29 3 144 48 7 38
b 23 100 271 962 2 480 592 12 193 963 891 594 965 735 937 915
c
TOTAL PER MLcategory
a 2 1 32 26 148 19 49 58 56
b 1 027 23 100 5 111 612 7 981 707 13 614 315 1 571 717 990 036 96 193 598 12 129 126
c 910 995 10 341
d 1 2 3 1 3
e 7(1) 1(2) 2(1)7(1)
1(3) 7(1) 7(1) 1(3) 4(2)
ML 13 ML 14 ML 15 ML 16 ML 18 ML 20 ML 21 ML 22 TOTAL perdestination
Austria a 9 9
b 43 886 43 886
c 43 886 43 886
Czech Republic a 6
b 835 497
c 921 336
France a 3 5 55 1 4 163
b 11 893 5 035 897 72 969 308 3 082 908 274 196 329 666
c 68 403 408
Germany a 1 21
b 30 404 1 645 071
c
C 382/350 RO Jurnalul Oficial al Uniunii Europene 30.12.2011
EU ARMS EXPORTS PER DESTINATION UNDER EMBARGO IN 2010
Key: (a) = number of licences issued, (b) = value of licences issued in Euros, (c) = value of arms exports in Euros (if available) (d) = total EU number of licence refusals (small discrepancies mayappear between breakdowns and totals due to refusals concerning more than one ML item or refusals for items other than those appearing in the ML); (e) = criteria numbers on which refusals are
based (the approximate number of times each criterion is invoked is indicated in brackets)

CHINA (MAINLAND)
ML 13 ML 14 ML 15 ML 16 ML 18 ML 20 ML 21 ML 22 TOTAL perdestination
Italy a 1 1 2
b 359 293 298 450 657 743
c 142 252
United Kingdom a 6 3 1 2 19 48 349
b 6 952 62 604 29 264 880 147 783 14 413 18 026 759
c
TOTAL PER MLcategory
a 10 6 58 1 11 1 20 52 550
b 49 249 5 395 190 73 031 912 29 264 44 766 3 082 446 233 922 687 217 538 622
c 43 886 69 510 882
d 3 4 1 1 30
e 1(3) 2(4) 1(1) 1(1) 7(1) 1(14) 2(6)4(2) 5(3)
7(14)
Total number of denials also includes a denial in the ML19 category based on Criteria 1 and 2.
CONGO (DEMOCRATIC REPUBLIC OF)
ML 1 ML 3 ML 8 ML 11 ML 13 TOTAL perdestination
Belgium a 1 1
b 250 250
c
Czech Republic a 1 1
b 115 857 115 857
c
Finland a 1 1
b 198 780 198 780
c 10 610 10 610
France a 1 6 7
b 63 846 1 151 997 1 215 843
c
Germany a 2 2
b 59 814 59 814
c
United Kingdom a 6 2 8
b 979 123 58 724 1 037 847
c
TOTAL PER MLcategory
a 1 1 1 13 4 20
b 63 846 250 198 780 2 246 977 118 538 2 628 391
c 10 610 10 610
d
e
30.12.2011 RO Jurnalul Oficial al Uniunii Europene C 382/351
EU ARMS EXPORTS PER DESTINATION UNDER EMBARGO IN 2010
Key: (a) = number of licences issued, (b) = value of licences issued in Euros, (c) = value of arms exports in Euros (if available) (d) = total EU number of licence refusals (small discrepancies mayappear between breakdowns and totals due to refusals concerning more than one ML item or refusals for items other than those appearing in the ML); (e) = criteria numbers on which refusals are
based (the approximate number of times each criterion is invoked is indicated in brackets)

ERITREA
ML 4 ML 6 ML 10 TOTAL perdestination
Belgium a 1 1
b 201 422 201 422
c
TOTAL PER MLcategory
a 1 1
b 201 422 201 422
c
d 1 1 2
e 1(1) 1(1) 1(2)
GUINEA
ML 6 ML 13 TOTAL perdestination
United Kingdom a 3 3
b 4 092 4 092
c
TOTAL PER MLcategory
a 3 3
b 4 092 4 092
c
d 1 1
e 1(1) 1(1)
C 382/352 RO Jurnalul Oficial al Uniunii Europene 30.12.2011
EU ARMS EXPORTS PER DESTINATION UNDER EMBARGO IN 2010
Key: (a) = number of licences issued, (b) = value of licences issued in Euros, (c) = value of arms exports in Euros (if available) (d) = total EU number of licence refusals (small discrepancies mayappear between breakdowns and totals due to refusals concerning more than one ML item or refusals for items other than those appearing in the ML); (e) = criteria numbers on which refusals are
based (the approximate number of times each criterion is invoked is indicated in brackets)

IRAQ
ML 1 ML 2 ML 3 ML 4 ML 5 ML 6 ML 10 ML 11 ML 13 ML 14 ML 15
Austria a 1
b 2 290
c 2 290
Bulgaria a 1 2
b 31 653 000 27 353 333
c 121 000 11 023 977 10 596 240
Czech Republic a 3
b 2 412 022
c 1 490 610
Finland a 1
b 945 000
c 945 000
France a 4 1 1 1 3 1 1
b 1 211 506 5 771 670 77 364 301 428 6 982 915 1 005 843 1 227 647
c
Germany a 2 1 1 5 1 9 1 2 1 1 1
b 11 295 68 400 3 035 418 4 466 130 46 369 013 275 000
c
Italy a
b
c
Poland a 1 1
b 223 059 141 805
c
Romania a 3
b 3 110 247
c 10 572 212
30.12.2011RO
Jurnalul OficialalU
niunii EuropeneC
382/353EU ARMS EXPORTS PER DESTINATION UNDER EMBARGO IN 2010
Key: (a) = number of licences issued, (b) = value of licences issued in Euros, (c) = value of arms exports in Euros (if available) (d) = total EU number of licence refusals (small discrepancies may appear between breakdowns and totals due to refusals concerning more than oneML item or refusals for items other than those appearing in the ML); (e) = criteria numbers on which refusals are based (the approximate number of times each criterion is invoked is indicated in brackets)

IRAQ
ML 1 ML 2 ML 3 ML 4 ML 5 ML 6 ML 10 ML 11 ML 13 ML 14 ML 15
United Kingdom a 2 1 11 17 10 17 22
b 34 650 9 350 759 320 2 049 274 1 544 094 1 684 876 507 884
c
TOTAL PER MLcategory
a 13 2 8 19 1 26 14 21 24 1 1
b 3 894 822 5 771 670 35 060 166 31 449 498 6 515 404 54 896 022 3 910 718 1 735 531
c 1 613 900 21 596 189 10 596 240 945 000
d 1
e 1(1)
ML 17 ML 18 ML 21 ML 22 TOTAL perdestination
Austria a 1
b 2 290
c 2 290
Bulgaria a 3
b 59 006 333
c 21 741 217
Czech Republic a 3
b 2 412 022
c 1 490 610
Finland a 1
b 945 000
c 945 000
France a 1 13
b 225 703 16 804 075
c 2 940 396
Germany a 1 1 2 3 32
b 61 937 1 000 54 288 193
c
Italy a
b
c 651
C382/354
ROJurnalul O
ficialalUniunii Europene
30.12.2011EU ARMS EXPORTS PER DESTINATION UNDER EMBARGO IN 2010
Key: (a) = number of licences issued, (b) = value of licences issued in Euros, (c) = value of arms exports in Euros (if available) (d) = total EU number of licence refusals (small discrepancies may appear between breakdowns and totals due to refusals concerning more than oneML item or refusals for items other than those appearing in the ML); (e) = criteria numbers on which refusals are based (the approximate number of times each criterion is invoked is indicated in brackets)

IRAQ
ML 17 ML 18 ML 21 ML 22 TOTAL perdestination
Poland a 2
b 364 864
c
Romania a 3
b 3 110 247
c 10 572 212
United Kingdom a 1 6 87
b 6 600 156 591 6 752 638
c
TOTAL PER MLcategory
a 1 1 3 10 145
b 68 537 383 293 143 685 662
c 37 692 376
d 1
e 1(1)
IVORY COAST
ML 3 ML 5 TOTAL perdestination
France a 2 2
b 4 045 400 4 045 400
c
Germany a 1 1
b 28 900 28 900
c
TOTAL PER MLcategory
a 1 2 3
b 28 900 4 045 400 4 074 300
c
d
e
30.12.2011RO
Jurnalul OficialalU
niunii EuropeneC
382/355EU ARMS EXPORTS PER DESTINATION UNDER EMBARGO IN 2010
Key: (a) = number of licences issued, (b) = value of licences issued in Euros, (c) = value of arms exports in Euros (if available) (d) = total EU number of licence refusals (small discrepancies may appear between breakdowns and totals due to refusals concerning more than oneML item or refusals for items other than those appearing in the ML); (e) = criteria numbers on which refusals are based (the approximate number of times each criterion is invoked is indicated in brackets)

LEBANON
ML 1 ML 2 ML 3 ML 4 ML 5 ML 6 ML 7 ML 11 ML 13 ML 21 TOTAL perdestination
Austria a 14 5 19
b 311 882 17 880 329 762
c 222 961 17 880 240 841
Belgium a 2 2
b 122 734 122 734
c
Bulgaria a 1 1
b 139 300 139 300
c
Czech Republic a 1 1
b 128 114 128 114
c 23 746 23 746
Finland a 1 1
b 51 000 51 000
c
France a 1 1 1 4 1 2 10
b 183 580 1 557 055 9 838 81 447 336 828 43 374 2 212 122
c 618 883
Germany a 10 8 5 1 2 26
b 631 349 101 278 78 295 16 980 4 241 832 143
c
Italy a
b
c 137 905
Romania a 2 2
b 603 266 603 266
c 417 704 46 466 464 170
United Kingdom a 1 1 1 2 5
b 3 278 121 000 13 734 19 149 157 160
c
C382/356
ROJurnalul O
ficialalUniunii Europene
30.12.2011EU ARMS EXPORTS PER DESTINATION UNDER EMBARGO IN 2010
Key: (a) = number of licences issued, (b) = value of licences issued in Euros, (c) = value of arms exports in Euros (if available) (d) = total EU number of licence refusals (small discrepancies may appear between breakdowns and totals due to refusals concerning more than oneML item or refusals for items other than those appearing in the ML); (e) = criteria numbers on which refusals are based (the approximate number of times each criterion is invoked is indicated in brackets)

LEBANON
ML 1 ML 2 ML 3 ML 4 ML 5 ML 6 ML 7 ML 11 ML 13 ML 21 TOTAL perdestination
TOTAL PER MLcategory
a 27 1 14 5 1 1 10 1 5 2 67
b 1 249 545 1 557 055 1 032 796 84 725 336 828 121 000 96 175 13 734 79 503 4 241 4 575 601
c 222 961 441 450 46 466 17 880 1 485 545
d
e
LIBERIA
ML 1 ML 3 ML 4 ML 5 ML 6 TOTAL perdestination
Bulgaria a 1 1
b 12 577 12 577
c 12 577 12 577
United Kingdom a 4 6 2 1 1 14
b 60 012 84 449 15 275 13 200 172 935
c
TOTAL PER MLcategory
a 4 6 2 2 1 15
b 60 012 84 449 15 275 12 577 13 200 185 512
c 12 577 12 577
d 1 1
e 1(1) 1(1)
MYANMAR
ML17 TOTAL perdestination
TOTAL PER MLcategory
a
d 1 2
e 1(1) 1(1) 7(1)
30.12.2011RO
JurnalulOficialalU
niuniiEuropeneC
382/357EU ARMS EXPORTS PER DESTINATION UNDER EMBARGO IN 2010
Key: (a) = number of licences issued, (b) = value of licences issued in Euros, (c) = value of arms exports in Euros (if available) (d) = total EU number of licence refusals (small discrepancies may appear between breakdowns and totals due to refusals concerning more than oneML item or refusals for items other than those appearing in the ML); (e) = criteria numbers on which refusals are based (the approximate number of times each criterion is invoked is indicated in brackets)

SIERRA LEONE
ML 6 TOTAL perdestination
TOTAL PER MLcategory
a
b
c
d 2 2
e 1(2) 1(2)
SOMALIA
ML 4 ML 6 ML 8 ML 11 ML 13 TOTAL perdestination
Finland a 1 1
b 198 780 198 780
c 28 504 28 504
Germany a 1 1
b 3 000 000 3 000 000
c
United Kingdom a 1 3 1 5 10
b 5 500 1 567 500 10 634 141 274 1 724 907
c
TOTAL PER MLcategory
a 1 4 1 1 5 12
b 5 500 4 567 500 198 780 10 634 141 274 4 923 687
c 28 504 28 504
d
e
SUDAN
ML 3 ML 4 ML 6 ML 8 ML 13 ML 17 TOTAL perdestination
Finland a 1 2 3
b 198 780 19 236 218 016
c 61 864 61 864
Germany a 1 4 1 6
b 31 015 650 000 185 000 866 015
c
Slovakia a 1 1
b 80 000 80 000
c 79 986 79 986
C 382/358 RO Jurnalul Oficial al Uniunii Europene 30.12.2011
EU ARMS EXPORTS PER DESTINATION UNDER EMBARGO IN 2010
Key: (a) = number of licences issued, (b) = value of licences issued in Euros, (c) = value of arms exports in Euros (if available) (d) = total EU number of licence refusals (small discrepancies mayappear between breakdowns and totals due to refusals concerning more than one ML item or refusals for items other than those appearing in the ML); (e) = criteria numbers on which refusals are
based (the approximate number of times each criterion is invoked is indicated in brackets)

SUDAN
ML 3 ML 4 ML 6 ML 8 ML 13 ML 17 TOTAL perdestination
United Kingdom a 1 6 7
b 1 230 44 220 45 450
c
TOTAL PER MLcategory
a 1 2 4 1 8 1 17
b 31 015 81 230 650 000 198 780 63 456 185 000 1 209 481
c 79 986 61 864 141 850
d 2
e 7(2)
ZIMBABWE
ML 6 ML 7 TOTAL perdestination
Germany a 1 1
b 4 036 4 036
c
TOTAL PER MLcategory
a 1 1
b 4 036 4 036
c
d 1 1
e 1(1) 1(1)
30.12.2011 RO Jurnalul Oficial al Uniunii Europene C 382/359
EU ARMS EXPORTS PER DESTINATION UNDER EMBARGO IN 2010
Key: (a) = number of licences issued, (b) = value of licences issued in Euros, (c) = value of arms exports in Euros (if available) (d) = total EU number of licence refusals (small discrepancies mayappear between breakdowns and totals due to refusals concerning more than one ML item or refusals for items other than those appearing in the ML); (e) = criteria numbers on which refusals are
based (the approximate number of times each criterion is invoked is indicated in brackets)

CENTRAL AMERICA AND THE CARIBBEAN
ML 1 ML 2 ML 3 ML 4 ML 5 ML 6 ML 7 ML 8 ML 9 ML 10 ML 11 ML 13
Austria a 45 3
b 5 328 533 73 388
c 376 631 58 538
Belgium a 20 2 1
b 984 312 48 600 157 500
c
Bulgaria a 1
b 590
c
Czech Republic a 7 7 1
b 1 464 415 1 142 402 114 075
c 1 530 791 1 204 050
Finland a 1
b 130 000
c
France a 1 2 4 3 1 5 4
b 1 219 7 508 166 268 891 965 15 806 629 150 517 960 276
c
Germany a 15 1 1 1 1 2 14 2 10
b 1 102 399 9 760 27 600 29 500 19 530 28 291 450 456 343 552 943 736
c
Greece a 1 1
b 1 190 75 905
c
Hungary a 1 6
b 225 000 350 600
c 54 465
Italy a 5 1
b 2 030 125 50 000
c
C382/360
ROJurnalul O
ficialalUniunii Europene
30.12.2011EU ARMS EXPORTS PER REGION IN 2010
Key: (a) = number of licences issued, (b) = value of licences issued in Euros, (c) = value of arms exports in Euros (if available) (d) = total EU number of licence refusals (small discrepancies may appear between breakdowns and totals due to refusals concerning more than oneML item or refusals for items other than those appearing in the ML); (e) = criteria numbers on which refusals are based (the approximate number of times each criterion is invoked is indicated in brackets)

CENTRAL AMERICA AND THE CARIBBEAN
ML 1 ML 2 ML 3 ML 4 ML 5 ML 6 ML 7 ML 8 ML 9 ML 10 ML 11 ML 13
Netherlands a 2
b 181 631
c 30 485
Poland a 1 3
b 31 390 276 300
c
Spain a 3 3 2 1 3 2
b 111 132 142 250 788 606 249 000 323 000 000 1 722 501
c 11 370 43 154 788 606 249 000 132 876 268 1 633 964
Sweden a 1
b
c
United Kingdom a 107 3 16 6 14 32 6 3 20 29
b 795 882 25 300 143 749 15 714 403 901 6 397 149 417 451 24 257 552 302 334 817
c
TOTAL PER MLcategory
a 208 5 37 11 19 36 1 4 7 24 29 46
b 12 174 797 85 060 1 900 989 843 218 597 770 927 862 19 530 434 791 149 493 356 339 557 642 2 768 872 2 534 536
c 1 918 792 1 360 207 788 606 249 000 132 876 268 1 633 964 30 485
d 3 1 1
e 7(3) 7(1) 2(1)
ML 14 ML 15 ML 16 ML 18 ML 21 ML 22 TOTAL perdestination
Austria a 48b 5 401 921c 435 169
Belgium a 23b 1 190 412c
30.12.2011RO
Jurnalul OficialalU
niunii EuropeneC
382/361EU ARMS EXPORTS PER REGION IN 2010
Key: (a) = number of licences issued, (b) = value of licences issued in Euros, (c) = value of arms exports in Euros (if available) (d) = total EU number of licence refusals (small discrepancies may appear between breakdowns and totals due to refusals concerning more than oneML item or refusals for items other than those appearing in the ML); (e) = criteria numbers on which refusals are based (the approximate number of times each criterion is invoked is indicated in brackets)
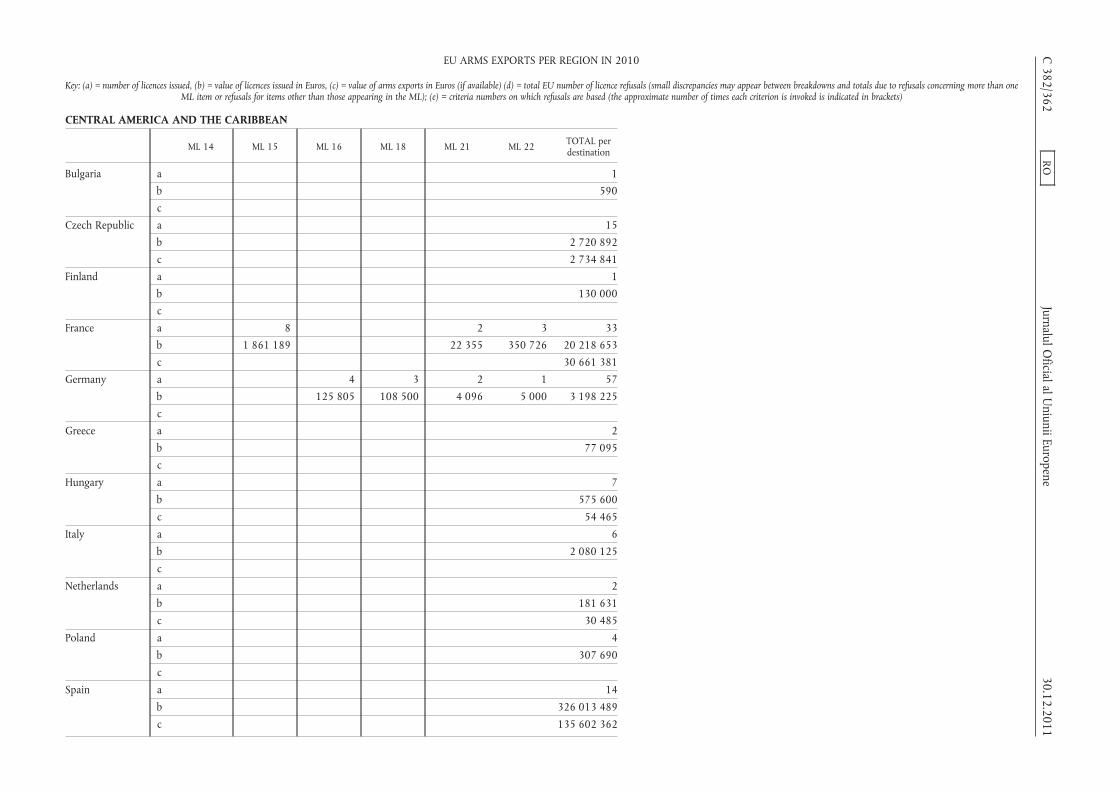
CENTRAL AMERICA AND THE CARIBBEAN
ML 14 ML 15 ML 16 ML 18 ML 21 ML 22 TOTAL perdestination
Bulgaria a 1b 590c
Czech Republic a 15b 2 720 892c 2 734 841
Finland a 1b 130 000c
France a 8 2 3 33b 1 861 189 22 355 350 726 20 218 653c 30 661 381
Germany a 4 3 2 1 57b 125 805 108 500 4 096 5 000 3 198 225c
Greece a 2b 77 095c
Hungary a 7
b 575 600
c 54 465
Italy a 6
b 2 080 125
c
Netherlands a 2
b 181 631
c 30 485
Poland a 4
b 307 690
c
Spain a 14
b 326 013 489
c 135 602 362
C382/362
ROJurnalul O
ficialalUniunii Europene
30.12.2011EU ARMS EXPORTS PER REGION IN 2010
Key: (a) = number of licences issued, (b) = value of licences issued in Euros, (c) = value of arms exports in Euros (if available) (d) = total EU number of licence refusals (small discrepancies may appear between breakdowns and totals due to refusals concerning more than oneML item or refusals for items other than those appearing in the ML); (e) = criteria numbers on which refusals are based (the approximate number of times each criterion is invoked is indicated in brackets)

CENTRAL AMERICA AND THE CARIBBEAN
ML 14 ML 15 ML 16 ML 18 ML 21 ML 22 TOTAL perdestination
Sweden a 1b 31 830c 986 717
United Kingdom a 1 12 11 260b 1 115 263 417 151 984 302c
TOTAL PER MLcategory
a 1 20 4 3 4 15 474b 1 115 2 124 606 125 805 108 500 26 451 355 726 514 112 455c 170 505 420d 1 6e 7(1) 2(1) 7(5)
CENTRAL ASIA
ML 1 ML 2 ML 3 ML 4 ML 5 ML 6 ML 7 ML 8 ML 10 ML 11 ML 13 ML 14 ML 15
Austria a 19 5 1
b 733 084 3 600 4 000 000
c 430 969 2 288 4 000 000
Bulgaria a 1 3 7 1 1
b 396 400 110 169 2 858 570 16 345 359 932
c 1 112 290 118 169 2 114 209 16 345 72 000 112 098
Czech Republic a 2
b 197 707
c 40 618
France a 3 5 2 4 26 2 11
b 75 211 1 799 775 164 898 387 412 31 326 733 43 309 5 088 304
c
Germany a 75 33 4 6 1 1 2 1
b 1 448 695 177 036 2 168 200 2 097 580 75 600 6 160 000 189 580 17 360
c
Italy a 2
b 8 856 651
c
30.12.2011RO
Jurnalul OficialalU
niunii EuropeneC
382/363EU ARMS EXPORTS PER REGION IN 2010
Key: (a) = number of licences issued, (b) = value of licences issued in Euros, (c) = value of arms exports in Euros (if available) (d) = total EU number of licence refusals (small discrepancies may appear between breakdowns and totals due to refusals concerning more than oneML item or refusals for items other than those appearing in the ML); (e) = criteria numbers on which refusals are based (the approximate number of times each criterion is invoked is indicated in brackets)
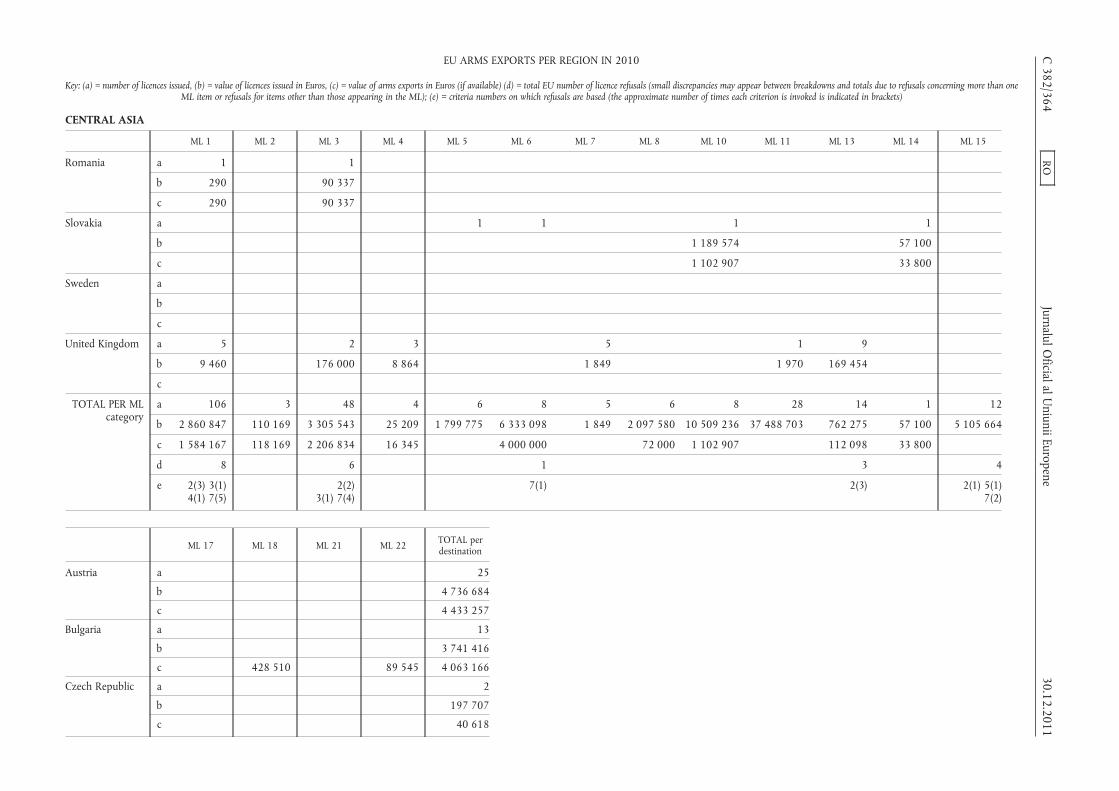
CENTRAL ASIA
ML 1 ML 2 ML 3 ML 4 ML 5 ML 6 ML 7 ML 8 ML 10 ML 11 ML 13 ML 14 ML 15
Romania a 1 1
b 290 90 337
c 290 90 337
Slovakia a 1 1 1 1
b 1 189 574 57 100
c 1 102 907 33 800
Sweden a
b
c
United Kingdom a 5 2 3 5 1 9
b 9 460 176 000 8 864 1 849 1 970 169 454
c
TOTAL PER MLcategory
a 106 3 48 4 6 8 5 6 8 28 14 1 12
b 2 860 847 110 169 3 305 543 25 209 1 799 775 6 333 098 1 849 2 097 580 10 509 236 37 488 703 762 275 57 100 5 105 664
c 1 584 167 118 169 2 206 834 16 345 4 000 000 72 000 1 102 907 112 098 33 800
d 8 6 1 3 4
e 2(3) 3(1)4(1) 7(5)
2(2)3(1) 7(4)
7(1) 2(3) 2(1) 5(1)7(2)
ML 17 ML 18 ML 21 ML 22 TOTAL perdestination
Austria a 25
b 4 736 684
c 4 433 257
Bulgaria a 13
b 3 741 416
c 428 510 89 545 4 063 166
Czech Republic a 2
b 197 707
c 40 618
C382/364
ROJurnalul O
ficialalUniunii Europene
30.12.2011EU ARMS EXPORTS PER REGION IN 2010
Key: (a) = number of licences issued, (b) = value of licences issued in Euros, (c) = value of arms exports in Euros (if available) (d) = total EU number of licence refusals (small discrepancies may appear between breakdowns and totals due to refusals concerning more than oneML item or refusals for items other than those appearing in the ML); (e) = criteria numbers on which refusals are based (the approximate number of times each criterion is invoked is indicated in brackets)

CENTRAL ASIA
ML 17 ML 18 ML 21 ML 22 TOTAL perdestination
France a 1 1 55
b 43 309 25 060 38 954 011
c 8 623 206
Germany a 1 124
b 190 051 12 524 102
c
Italy a 2
b 8 856 651
c 316 135
Romania a 2
b 90 627
c 90 627
Slovakia a 4
b 1 246 674
c 1 136 707
Sweden a
b
c 106 099
United Kingdom a 25
b 367 597
c
TOTAL PER MLcategory
a 1 1 1 252
b 190 051 43 309 25 060 70 715 468
c 428 510 89 545 18 809 815
d 1 23
e 3(1) 7(1) 2(9) 3(3)7 (13)
30.12.2011RO
Jurnalul OficialalU
niunii EuropeneC
382/365EU ARMS EXPORTS PER REGION IN 2010
Key: (a) = number of licences issued, (b) = value of licences issued in Euros, (c) = value of arms exports in Euros (if available) (d) = total EU number of licence refusals (small discrepancies may appear between breakdowns and totals due to refusals concerning more than oneML item or refusals for items other than those appearing in the ML); (e) = criteria numbers on which refusals are based (the approximate number of times each criterion is invoked is indicated in brackets)

EUROPEAN UNION
ML 1 ML 2 ML 3 ML 4 ML 5 ML 6 ML 7 ML 8 ML 9
Austria a 76 6 32 5 1 7
b 1 223 172 4 263 256 51 236 482 11 066 000 32 342 724 956 866
c 1 111 347 3 368 662 61 660 845 4 403 461 32 342 47 701 419
Belgium a 245 16 50 14 1 25 1 65 5
b 46 932 926 11 905 340 18 268 695 7 373 437 2 925 5 338 855 2 571 660 11 906 023 47 024
c
Bulgaria a 10 5 23 18 7 4 5 8
b 138 780 120 030 2 409 560 1 429 417 3 359 528 666 919 143 570 4 469 874
c 149 471 127 030 1 063 722 930 025 1 032 373 614 617 150 770 2 193 716
Czech Republic a 47 19 57 24 6 78 17 31
b 857 088 2 619 641 14 740 191 4 030 105 194 911 140 398 506 517 285 2 997 304
c 1 327 056 2 076 712 19 729 464 9 799 028 937 396 13 060 585 480 213 1 996 108
Denmark a 2 8 3 10 9 1 1
b 1 344 2 111 537 1 229 456 4 244 978 8 012 632 1 733 521
c
Estonia a 4 1
b 92 450 790 000
c 92 430 474
Finland a 21 2 47 6 3 20 13
b 2 266 048 79 800 12 605 355 623 923 1 366 256 55 581 1 874 568
c 518 325 201 281 6 333 741 1 413 408 17 410 917 40 792 2 495 014
France a 50 21 52 223 131 105 17 67 56
b 21 458 656 35 520 209 14 756 699 211 500 333 83 974 142 49 676 739 939 062 27 450 549 34 240 505
c
Germany a 320 193 299 220 254 1 915 41 1 137
b 19 626 132 27 244 137 126 853 388 114 012 374 37 319 768 371 459 038 529 414 314 904 706 081
c
Greece a 3 1 4 17 8 16
b 137 374 8 286 58 170 22 538 401 49 275 693 59 469 565
c
C382/366
ROJurnalul O
ficialalUniunii Europene
30.12.2011EU ARMS EXPORTS PER REGION IN 2010
Key: (a) = number of licences issued, (b) = value of licences issued in Euros, (c) = value of arms exports in Euros (if available) (d) = total EU number of licence refusals (small discrepancies may appear between breakdowns and totals due to refusals concerning more than oneML item or refusals for items other than those appearing in the ML); (e) = criteria numbers on which refusals are based (the approximate number of times each criterion is invoked is indicated in brackets)

EUROPEAN UNION
ML 1 ML 2 ML 3 ML 4 ML 5 ML 6 ML 7 ML 8 ML 9
Hungary a 17 10 40 9 16 2 7
b 1 205 731 987 546 15 394 833 7 833 000 6 290 500 22 710 1 150 890
c 46 720 344 305 1 299 924 1 400 559 1 364 865 49 125
Ireland a 15 17 13
b 1 034 524 12 647 235 1 144 828
c
Italy a 22 51 44 98 102 35 3 3 14
b 3 069 830 121 812 618 35 033 668 200 801 325 65 066 082 54 845 775 270 752 54 001 12 227 693
c
Latvia a 16 5
b 22 187 23 381
c 22 187 23 381
Lithuania a 2 23
b 2 288 3 018 866
c 2 288 2 848 228
Luxembourg a 4 2 1
b 37 500 155 139 18 627
c 37 500
Malta a 13
b 19 358
c 19 279
Netherlands a 194 3 40 17 38 41 2 4
b 512 840 50 800 1 321 286 14 470 593 89 371 306 27 802 373 115 500 136 645
c 294 492 1 157 741 606 607 23 652 791 45 448 406 28 198 769 57 150 37 189 120 074 575
Poland a 18 6 17 5 11 13 2 2
b 911 081 196 910 10 395 094 126 017 7 459 650 685 609 4 450 21 625
c
Portugal a 2 2 3
b 18 300 145 358 3 623 829
c 18 300 145 358 3 623 829
30.12.2011RO
Jurnalul OficialalU
niunii EuropeneC
382/367EU ARMS EXPORTS PER REGION IN 2010
Key: (a) = number of licences issued, (b) = value of licences issued in Euros, (c) = value of arms exports in Euros (if available) (d) = total EU number of licence refusals (small discrepancies may appear between breakdowns and totals due to refusals concerning more than oneML item or refusals for items other than those appearing in the ML); (e) = criteria numbers on which refusals are based (the approximate number of times each criterion is invoked is indicated in brackets)

EUROPEAN UNION
ML 1 ML 2 ML 3 ML 4 ML 5 ML 6 ML 7 ML 8 ML 9
Romania a 44 3 8 2 4 1
b 3 132 455 1 063 753 636 599 574 037 1 342 674 10 500 000
c 995 401 589 252 308 128 011 269 453 104 760 10 500 000
Slovakia a 10 5 10 7 1 42 5 6
b 1 296 326 1 203 985 1 958 229 162 975 73 880 7 175 942 144 419 60 856
c 625 565 286 058 1 421 799 21 029 73 880 1 431 746 115 582 21 853
Slovenia a 1 3 4 1
b 245 238 292 181 377 470 241 188
c 63 502 50 332 377 470 728 228
Spain a 90 9 19 117 53 2 20 7
b 950 291 794 947 8 266 061 29 442 155 2 409 614 48 096 160
c 312 035 754 406 6 067 349 75 181 575 1 337 018 1 598 237 13 415 627
Sweden a 18 20 85 12 81 30 6 75 2
b
c
United Kingdom a 1 658 156 155 425 422 658 782 29 185
b 27 199 079 7 729 042 4 293 532 28 493 307 22 302 283 11 870 607 13 782 440 695 926 68 561 500
c
TOTAL PER MLcategory
a 2 880 527 1 025 1 242 1 086 3 063 898 327 439
b 131 000 486 215 845 538 323 847 245 656 852 455 326 426 500 1 465 895 972 18 837 772 94 567 288 1 099 716 237
c 5 461 666 8 380 286 101 376 000 117 022 316 49 238 885 112 524 668 798 497 18 165 686 136 392 120
d
e
ML 10 ML 11 ML 12 ML 13 ML 14 ML 15 ML 16 ML 17 ML 18
Austria a 1 1
b 33 500 16 457 700
c 7 773 888 2 380 692
Belgium a 193 30 4 6 13 7 7
b 52 063 332 82 119 874 6 243 035 24 078 472 9 718 602 218 402 7 452 502
c
C382/368
ROJurnalulO
ficialalUniuniiEuropene
30.12.2011EU ARMS EXPORTS PER REGION IN 2010
Key: (a) = number of licences issued, (b) = value of licences issued in Euros, (c) = value of arms exports in Euros (if available) (d) = total EU number of licence refusals (small discrepancies may appear between breakdowns and totals due to refusals concerning more than oneML item or refusals for items other than those appearing in the ML); (e) = criteria numbers on which refusals are based (the approximate number of times each criterion is invoked is indicated in brackets)

EUROPEAN UNION
ML 10 ML 11 ML 12 ML 13 ML 14 ML 15 ML 16 ML 17 ML 18
Bulgaria
a 2 2
b 282 962 115 900
c 308 462 81 120
Czech Republic
a 91 43 4 11 7 5 13
b 19 309 126 3 344 371 1 593 478 176 620 3 804 431 86 034 429 854
c 21 913 558 6 589 441 1 624 931 1 722 839 328 456 76 869 332 074 361 775
Denmark
a 60 12 35 3 3 1 1
b 15 610 831 21 590 405 7 122 757 2 858 026 117 584 25 801 335 954
c
Estonia
a 6 3
b 191 900 283 500
c 173 800 45 000
Finland
a 1 67 1
b 733 670 2 846 268 300 000
c 2 063 563 1 854 098 466 854 1 064 464
France
a 674 321 69 15 271 2 10 2
b 1 732 750 842 171 499 175 71 548 964 56 651 423 203 603 601 919 083 3 046 473 54 316
c
Germany
a 565 629 2 50 106 277 253 316
b 163 410 698 191 789 154 2 870 000 17 861 272 33 319 016 58 034 998 26 445 414 27 713 907
c
Greece
a 3 9 7 1
b 7 360 448 1 147 973 622 615 1 000
c
Hungary
a 11 4 13
b 563 500 176 000 19 138 535
c 166 965 36 000 1 060 227
Ireland
a
b
c
30.12.2011RO
Jurnalul OficialalU
niunii EuropeneC
382/369EU ARMS EXPORTS PER REGION IN 2010
Key: (a) = number of licences issued, (b) = value of licences issued in Euros, (c) = value of arms exports in Euros (if available) (d) = total EU number of licence refusals (small discrepancies may appear between breakdowns and totals due to refusals concerning more than oneML item or refusals for items other than those appearing in the ML); (e) = criteria numbers on which refusals are based (the approximate number of times each criterion is invoked is indicated in brackets)
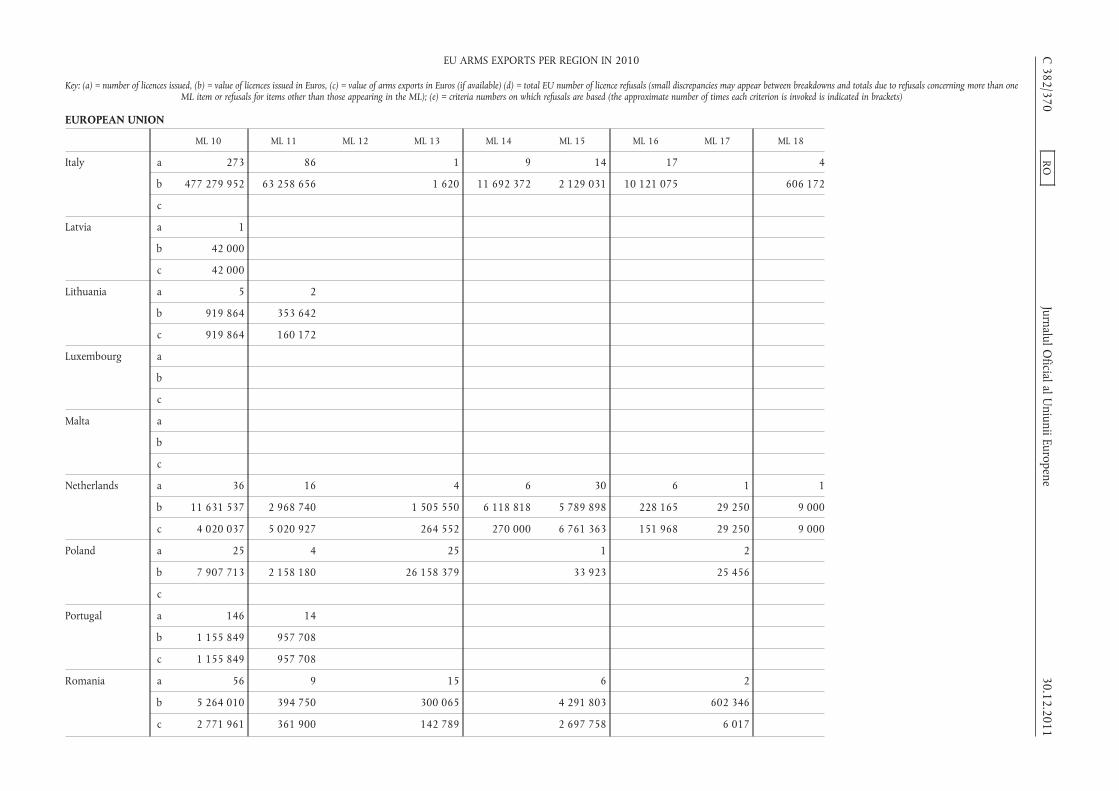
EUROPEAN UNION
ML 10 ML 11 ML 12 ML 13 ML 14 ML 15 ML 16 ML 17 ML 18
Italy a 273 86 1 9 14 17 4
b 477 279 952 63 258 656 1 620 11 692 372 2 129 031 10 121 075 606 172
c
Latvia a 1
b 42 000
c 42 000
Lithuania a 5 2
b 919 864 353 642
c 919 864 160 172
Luxembourg a
b
c
Malta a
b
c
Netherlands a 36 16 4 6 30 6 1 1
b 11 631 537 2 968 740 1 505 550 6 118 818 5 789 898 228 165 29 250 9 000
c 4 020 037 5 020 927 264 552 270 000 6 761 363 151 968 29 250 9 000
Poland a 25 4 25 1 2
b 7 907 713 2 158 180 26 158 379 33 923 25 456
c
Portugal a 146 14
b 1 155 849 957 708
c 1 155 849 957 708
Romania a 56 9 15 6 2
b 5 264 010 394 750 300 065 4 291 803 602 346
c 2 771 961 361 900 142 789 2 697 758 6 017
C382/370
ROJurnalul O
ficialalUniunii Europene
30.12.2011EU ARMS EXPORTS PER REGION IN 2010
Key: (a) = number of licences issued, (b) = value of licences issued in Euros, (c) = value of arms exports in Euros (if available) (d) = total EU number of licence refusals (small discrepancies may appear between breakdowns and totals due to refusals concerning more than oneML item or refusals for items other than those appearing in the ML); (e) = criteria numbers on which refusals are based (the approximate number of times each criterion is invoked is indicated in brackets)

EUROPEAN UNION
ML 10 ML 11 ML 12 ML 13 ML 14 ML 15 ML 16 ML 17 ML 18
Slovakia a 12 1 1 1
b 3 103 471 335 300 10 000
c 1 133 426 335 300
Slovenia a 3
b 1 445
c 1 445
Spain a 133 38 2 1 20
b 75 008 019 29 861 634 9 335 100
c 353 457 891 4 557 224 57 392 343
Sweden a 6 7 4 8 3 7
b
c
United Kingdom a 2 016 706 97 79 309 71 32 202
b 121 556 110 25 424 006 9 901 840 1 295 035 9 063 813 21 553 902 1 737 433 4 150 473
c
TOTAL PER MLcategory
a 4 316 1 931 333 192 806 387 301 553
b 2 696 179 335 613 501 968 130 428 701 121 015 537 301 383 851 91 197 460 31 887 372 40 752 178
c 388 127 376 27 311 358 2 380 692 2 835 871 2 037 839 69 385 731 228 837 367 341 370 775
d 1
e 7(1)
ML 19 ML 20 ML 21 ML 22 TOTAL perdestination
Austria a 129
b 809 269 318
c 128 432 656
Belgium a 16 698
b 286 241 104
c
30.12.2011RO
Jurnalul OficialalU
niunii EuropeneC
382/371EU ARMS EXPORTS PER REGION IN 2010
Key: (a) = number of licences issued, (b) = value of licences issued in Euros, (c) = value of arms exports in Euros (if available) (d) = total EU number of licence refusals (small discrepancies may appear between breakdowns and totals due to refusals concerning more than oneML item or refusals for items other than those appearing in the ML); (e) = criteria numbers on which refusals are based (the approximate number of times each criterion is invoked is indicated in brackets)

EUROPEAN UNION
ML 19 ML 20 ML 21 ML 22 TOTAL perdestination
Bulgaria a 84
b 13 136 540
c 6 651 306
Czech Republic a 2 2 457
b 268 209 413 937 195 781 091
c 262 335 3 932 811 86 551 651
Denmark a 25 174
b 6 840 019 71 834 845
c
Estonia a 14
b 1 357 850
c 311 704
Finland a 2 2 185
b 1 355 000 146 900 24 253 368
c 561 122 34 423 579
France a 1 1 33 99 2 220
b 887 009 53 643 55 789 286 10 764 205 2 787 084 915
c 604 037 386
Germany a 168 357 6 103
b 11 679 555 180 234 137 2 315 108 797
c
Greece a 3 72
b 1 600 000 142 219 525
c
Hungary a 2 131
b 2 700 000 55 463 245
c 1 369 381 7 138 071
C382/372
ROJurnalul O
ficialalUniunii Europene
30.12.2011EU ARMS EXPORTS PER REGION IN 2010
Key: (a) = number of licences issued, (b) = value of licences issued in Euros, (c) = value of arms exports in Euros (if available) (d) = total EU number of licence refusals (small discrepancies may appear between breakdowns and totals due to refusals concerning more than oneML item or refusals for items other than those appearing in the ML); (e) = criteria numbers on which refusals are based (the approximate number of times each criterion is invoked is indicated in brackets)

EUROPEAN UNION
ML 19 ML 20 ML 21 ML 22 TOTAL perdestination
Ireland a 1 5 51
b 640 000 997 812 16 464 399
c
Italy a 13 27 816
b 5 381 673 6 836 347 1 070 488 640
c 349 046 290
Latvia a 22
b 87 568
c 87 568
Lithuania a 32
b 4 294 660
c 3 930 552
Luxembourg a 7
b 211 266
c 37 500
Malta a 13
b 19 358
c 19 279
Netherlands a 15 454
b 12 531 898 174 594 199
c 1 548 559 645 320 238 248 696
Poland a 9 1 141
b 2 946 420 5 227 435 64 257 942
c
Portugal a 167
b 5 901 044
c 5 901 044
30.12.2011RO
Jurnalul OficialalU
niunii EuropeneC
382/373EU ARMS EXPORTS PER REGION IN 2010
Key: (a) = number of licences issued, (b) = value of licences issued in Euros, (c) = value of arms exports in Euros (if available) (d) = total EU number of licence refusals (small discrepancies may appear between breakdowns and totals due to refusals concerning more than oneML item or refusals for items other than those appearing in the ML); (e) = criteria numbers on which refusals are based (the approximate number of times each criterion is invoked is indicated in brackets)

EUROPEAN UNION
ML 19 ML 20 ML 21 ML 22 TOTAL perdestination
Romania a 2 152
b 323 715 28 426 207
c 55 600 18 286 547
Slovakia a 101
b 15 525 384
c 5 466 238
Slovenia a 12
b 176 864 1 334 386
c 176 864 1 397 841
Spain a 6 517
b 3 500 204 167 481
c 3 500 514 077 205
Sweden a 4 368
b 324 237 148
c 593 277 596
United Kingdom a 113 318 8 413
b 6 869 720 1 715 396 388 195 445
c
TOTAL PER MLcategory
a 1 1 381 844 21 533
b 887 009 53 643 96 250 246 219 191 782 8 999 955 725
c 3 921 761 4 633 731 2 597 322 710
d 1
e 7(1)
C382/374
ROJurnalul O
ficialalUniunii Europene
30.12.2011EU ARMS EXPORTS PER REGION IN 2010
Key: (a) = number of licences issued, (b) = value of licences issued in Euros, (c) = value of arms exports in Euros (if available) (d) = total EU number of licence refusals (small discrepancies may appear between breakdowns and totals due to refusals concerning more than oneML item or refusals for items other than those appearing in the ML); (e) = criteria numbers on which refusals are based (the approximate number of times each criterion is invoked is indicated in brackets)

MIDDLE EAST
ML 1 ML 2 ML 3 ML 4 ML 5 ML 6 ML 7 ML 8 ML 9
Austria a 253 2 13 1 1 33 6
b 1 873 974 10 157 003 311 969 812 750 26 111 000 493 345 077 27 880
c 1 379 838 7 195 075 603 150 812 750 2 300 000 44 087 604 17 880
Belgium a 48 16 1 1 4 6
b 62 776 081 40 176 319 26 001 2 950 1 671 086 717 055
c
Bulgaria a 4 7 15 11 3 7
b 5 816 893 1 313 909 42 637 628 30 929 393 121 827 426 641
c 11 684 539 3 272 691 44 935 931 53 744 486 142 554 480 528 7 925
Czech Republic a 11 6 21 4 37 2
b 2 431 915 2 900 315 26 340 742 40 650 11 412 318 205 220
c 1 504 858 2 676 947 15 059 544 761 149 7 986 921 78 370 238 379
Denmark a 1 1
b 1 637 170
c
Finland a 6 1 5
b 1 150 000 51 000 634 973
c 11 750 3 023 553
France a 32 15 21 90 164 68 10 3 75
b 4 598 187 229 843 051 52 088 960 564 950 993 368 157 191 158 549 065 3 125 123 1 472 420 130 812 791
c
Germany a 210 26 79 28 31 144 30 14 70
b 12 762 969 5 740 126 10 948 696 29 827 665 13 246 206 143 777 630 7 297 150 2 502 48 501 256
c
Greece a 3 1 1
b 3 113 480 2 792 2 000
c
30.12.2011RO
Jurnalul OficialalU
niunii EuropeneC
382/375EU ARMS EXPORTS PER REGION IN 2010
Key: (a) = number of licences issued, (b) = value of licences issued in Euros, (c) = value of arms exports in Euros (if available) (d) = total EU number of licence refusals (small discrepancies may appear between breakdowns and totals due to refusals concerning more than oneML item or refusals for items other than those appearing in the ML); (e) = criteria numbers on which refusals are based (the approximate number of times each criterion is invoked is indicated in brackets)

MIDDLE EAST
ML 1 ML 2 ML 3 ML 4 ML 5 ML 6 ML 7 ML 8 ML 9
Hungary a 1 1
b 450 000 192 000
c 37 868 180 896
Ireland a 2
b 2 736 108
c
Italy a 3 30 8 24 21 4 2 1
b 3 570 138 27 743 533 7 293 559 212 141 006 60 927 639 16 544 145 24 490 1 993 686
c
Netherlands a 7 4 1
b 9 271 322 30 802 445 18 918
c 193 369 32 668 000 469 953
Poland a 3 2 4 2 9 25 1
b 1 474 410 254 736 235 544 191 520 905 186 2 175 392 1 137 240
c
Portugal a
b
c
Romania a 1 1 6 3 2 2
b 1 250 3 746 024 608 939 1 056 570 5 645 329
c 1 250 11 022 427 462 117 273 980 4 593 130
Slovakia a 1 10 1
b 7 050 000 4 264 954 505 540
c 1 893 717
Slovenia a 3 3
b 545 699 545 908
c 659 232 545 908
C382/376
ROJurnalul O
ficialalUniunii Europene
30.12.2011EU ARMS EXPORTS PER REGION IN 2010
Key: (a) = number of licences issued, (b) = value of licences issued in Euros, (c) = value of arms exports in Euros (if available) (d) = total EU number of licence refusals (small discrepancies may appear between breakdowns and totals due to refusals concerning more than oneML item or refusals for items other than those appearing in the ML); (e) = criteria numbers on which refusals are based (the approximate number of times each criterion is invoked is indicated in brackets)

MIDDLE EAST
ML 1 ML 2 ML 3 ML 4 ML 5 ML 6 ML 7 ML 8 ML 9
Spain a 1 1 1 21 30 2
b 331 135 400 11 007 897 11 624 665 46 946
c 16 139 331 238 900 4 516 082 8 271 635 46 946
Sweden a 2 2 4 15
b
c
United Kingdom a 625 109 110 177 143 280 166 58
b 14 876 356 1 992 329 1 732 267 216 582 114 3 290 848 57 106 605 1 245 185 399 601 208
c
TOTAL PER MLcategory
a 1 201 201 295 370 404 651 220 29 206
b 111 782 173 279 945 333 185 698 108 1 077 282 409 488 201 716 937 891 260 12 357 593 4 086 923 580 929 859
c 14 624 492 13 350 163 71 859 952 60 296 584 36 224 662 68 329 396 3 119 803 293 250
d 5 7 1 3 5 4 1
e 2(1) 3(1)4(1) 7(3)
2(1) 3(6)4(3) 7(3)
1(1) 2(2) 3(1)7(1)
1(1) 2(3)3(3) 7(1)
1(3) 4(1) 2(1) 3(1)
ML 10 ML 11 ML 12 ML 13 ML 14 ML 15 ML 16 ML 17 ML 18 ML 21
Austria a 3 1 2 2 1 9
b 414 230 1 150 000 5 584 476 304 000 982 383 621 014
c 129 600 1 150 000 304 000 618 330
Belgium a 6 1 3 1
b 46 300 392 1 416 135 669 920 1 673 802
c
Bulgaria a 3 3 2 1
b 400 453 5 041 720 50 560 3 622
c 459 541 2 686 250 10 460 3 421
30.12.2011RO
Jurnalul OficialalU
niunii EuropeneC
382/377EU ARMS EXPORTS PER REGION IN 2010
Key: (a) = number of licences issued, (b) = value of licences issued in Euros, (c) = value of arms exports in Euros (if available) (d) = total EU number of licence refusals (small discrepancies may appear between breakdowns and totals due to refusals concerning more than oneML item or refusals for items other than those appearing in the ML); (e) = criteria numbers on which refusals are based (the approximate number of times each criterion is invoked is indicated in brackets)

MIDDLE EAST
ML 10 ML 11 ML 12 ML 13 ML 14 ML 15 ML 16 ML 17 ML 18 ML 21
Czech Republic a 6 6 1 9 2 5
b 141 556 1 376 946 6 272 824 1 981 122 117 538
c 144 577 633 033 6 212 681 221 937 125 483
Denmark a 1 4 2 1
b 14 916 2 979 910 192 031 1 389 505
c
Finland a 9 3 2
b 1 679 979 47 032 503 000
c 1 872 049 93 402
France a 367 185 3 23 7 152 1 10 1 20
b 1 061 299 721 318 103 411 7 080 590 13 514 668 82 893 088 165 424 244 88 421 26 375 230 26 168 77 405 434
c
Germany a 67 68 13 16 24 4 11 94 30
b 66 969 979 115 892 460 391 639 101 593 605 3 755 242 2 466 490 7 022 138 5 612 963 5 340 822
c
Greece a 4 1 7 3
b 17 807 402 64 000 1 999 589 5 585 000
c
Hungary a
b
c
Ireland a
b
c
C382/378
ROJurnalul O
ficialalUniunii Europene
30.12.2011EU ARMS EXPORTS PER REGION IN 2010
Key: (a) = number of licences issued, (b) = value of licences issued in Euros, (c) = value of arms exports in Euros (if available) (d) = total EU number of licence refusals (small discrepancies may appear between breakdowns and totals due to refusals concerning more than oneML item or refusals for items other than those appearing in the ML); (e) = criteria numbers on which refusals are based (the approximate number of times each criterion is invoked is indicated in brackets)

MIDDLE EAST
ML 10 ML 11 ML 12 ML 13 ML 14 ML 15 ML 16 ML 17 ML 18 ML 21
Italy a 72 25 9
b 391 287 710 122 348 759 1 287 641
c
Netherlands a 4 6 1 3 1 1 1 1
b 1 031 397 959 376 543 300 95 185 151 000 4 000 284 111 78 917
c 322 665 4 287 721 92 185 284 111
Poland a 3 1 1
b 212 829 79 500 7 797
c
Portugal a 1 3
b 155 642 619 842
c 155 642 619 842
Romania a 18 2 2 1 3 1 1
b 3 614 703 1 294 222 3 094 214 146 187 1 902 391 655 192 357 583
c 3 810 424 1 123 470 2 428 364 146 187 1 106 820 366 514 202 397
Slovakia a 3
b 347 115
c 246 784
Slovenia a 1 1
b
c
Spain a 4 4 1 4 1
b 26 508 884 178 000
c 2 410 790 153 888 20 800
Sweden a 3 3 2 3
b
c
30.12.2011RO
Jurnalul OficialalU
niunii EuropeneC
382/379EU ARMS EXPORTS PER REGION IN 2010
Key: (a) = number of licences issued, (b) = value of licences issued in Euros, (c) = value of arms exports in Euros (if available) (d) = total EU number of licence refusals (small discrepancies may appear between breakdowns and totals due to refusals concerning more than oneML item or refusals for items other than those appearing in the ML); (e) = criteria numbers on which refusals are based (the approximate number of times each criterion is invoked is indicated in brackets)

MIDDLE EAST
ML 10 ML 11 ML 12 ML 13 ML 14 ML 15 ML 16 ML 17 ML 18 ML 21
United Kingdom a 554 411 93 100 233 3 17 56 48
b 9 782 720 56 154 172 4 017 867 3 260 026 4 698 240 7 644 411 468 366 133 432 982
c
TOTAL PER MLcategory
a 1 110 727 3 142 130 446 22 49 172 105
b 1 625 474 966 620 901 984 7 080 590 33 415 660 193 874 494 182 575 316 4 230 505 42 290 408 9 548 952 85 005 243
c 7 090 882 9 279 144 10 142 333 3 077 746 149 608 1 106 820 1 394 438 202 397
d 6 4 2 3 3 1 3
e 2(4) 3(5)4(1) 7(2)
2(1) 3(2)4(2)
3(1) 4(1)7(1)
4(1) 7(2) 2(1) 3(2)4(1) 7(2)
3(1) 4(1) 1(1) 2(1)3(2) 4(1)
7(1)
ML 22 TOTAL perdestination
Austria a 6 333
b 41 984 247 583 680 003
c 58 598 227
Belgium a 87
b 155 429 741
c
Bulgaria a 56
b 86 742 646
c 117 428 325
Czech Republic a 110
b 53 221 146
c 20 085 35 663 964
Denmark a 10
b 6 213 532
c
C382/380
ROJurnalul O
ficialalUniunii Europene
30.12.2011EU ARMS EXPORTS PER REGION IN 2010
Key: (a) = number of licences issued, (b) = value of licences issued in Euros, (c) = value of arms exports in Euros (if available) (d) = total EU number of licence refusals (small discrepancies may appear between breakdowns and totals due to refusals concerning more than oneML item or refusals for items other than those appearing in the ML); (e) = criteria numbers on which refusals are based (the approximate number of times each criterion is invoked is indicated in brackets)

MIDDLE EAST
ML 22 TOTAL perdestination
Finland a 26
b 4 065 984
c 5 000 754
France a 56 1 303
b 39 631 593 3 305 440 350
c 1 344 492 820
Germany a 36 995
b 2 778 979 583 928 517
c
Greece a 20
b 28 574 263
c
Hungary a 2
b 642 000
c 218 764
Ireland a 2 4
b 24 750 2 760 858
c
Italy a 1 200
b 57 357 845 219 662
c 19 462 994
Netherlands a 2 32
b 410 000 43 649 971
c 2 500 38 320 504
Poland a 51
b 6 674 154
c
30.12.2011RO
Jurnalul OficialalU
niunii EuropeneC
382/381EU ARMS EXPORTS PER REGION IN 2010
Key: (a) = number of licences issued, (b) = value of licences issued in Euros, (c) = value of arms exports in Euros (if available) (d) = total EU number of licence refusals (small discrepancies may appear between breakdowns and totals due to refusals concerning more than oneML item or refusals for items other than those appearing in the ML); (e) = criteria numbers on which refusals are based (the approximate number of times each criterion is invoked is indicated in brackets)

MIDDLE EAST
ML 22 TOTAL perdestination
Portugal a 4
b 775 484
c 775 484
Romania a 1 44
b 5 771 22 128 375
c 5 771 25 542 851
Slovakia a 3 18
b 617 540 12 785 149
c 103 200 2 243 701
Slovenia a 8
b 1 091 607
c 1 205 140
Spain a 70
b 49 502 123
c 15 675 511
Sweden a 34
b 83 739 019
c 117 928 533
United Kingdom a 102 3 285
b 8 377 326 783 935 490
c
TOTAL PER MLcategory
a 209 6 692
b 93 887 563 6 660 200 074
c 131 556 1 782 557 573
d 2 53
e 3(2) 4(2)7(1)
1(6) 2(16)4 (15) 7(19)
C382/382
ROJurnalul O
ficialalUniunii Europene
30.12.2011EU ARMS EXPORTS PER REGION IN 2010
Key: (a) = number of licences issued, (b) = value of licences issued in Euros, (c) = value of arms exports in Euros (if available) (d) = total EU number of licence refusals (small discrepancies may appear between breakdowns and totals due to refusals concerning more than oneML item or refusals for items other than those appearing in the ML); (e) = criteria numbers on which refusals are based (the approximate number of times each criterion is invoked is indicated in brackets)
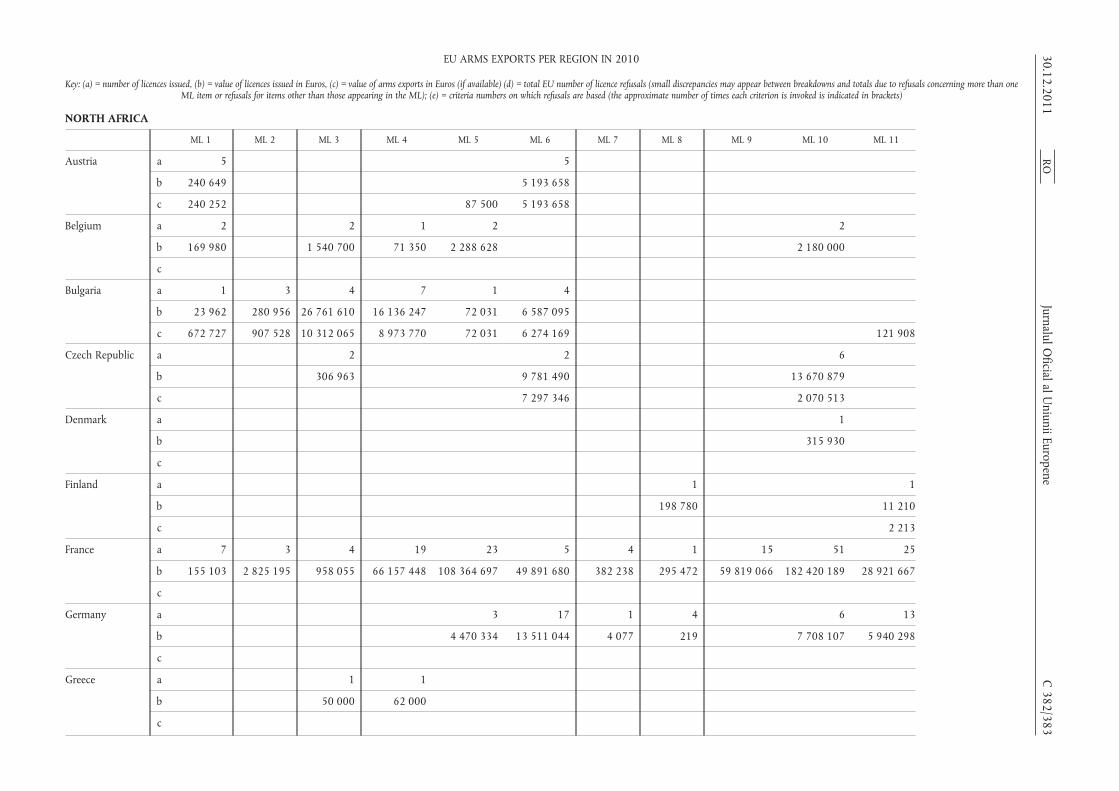
NORTH AFRICA
ML 1 ML 2 ML 3 ML 4 ML 5 ML 6 ML 7 ML 8 ML 9 ML 10 ML 11
Austria a 5 5
b 240 649 5 193 658
c 240 252 87 500 5 193 658
Belgium a 2 2 1 2 2
b 169 980 1 540 700 71 350 2 288 628 2 180 000
c
Bulgaria a 1 3 4 7 1 4
b 23 962 280 956 26 761 610 16 136 247 72 031 6 587 095
c 672 727 907 528 10 312 065 8 973 770 72 031 6 274 169 121 908
Czech Republic a 2 2 6
b 306 963 9 781 490 13 670 879
c 7 297 346 2 070 513
Denmark a 1
b 315 930
c
Finland a 1 1
b 198 780 11 210
c 2 213
France a 7 3 4 19 23 5 4 1 15 51 25
b 155 103 2 825 195 958 055 66 157 448 108 364 697 49 891 680 382 238 295 472 59 819 066 182 420 189 28 921 667
c
Germany a 3 17 1 4 6 13
b 4 470 334 13 511 044 4 077 219 7 708 107 5 940 298
c
Greece a 1 1
b 50 000 62 000
c
30.12.2011RO
Jurnalul OficialalU
niunii EuropeneC
382/383EU ARMS EXPORTS PER REGION IN 2010
Key: (a) = number of licences issued, (b) = value of licences issued in Euros, (c) = value of arms exports in Euros (if available) (d) = total EU number of licence refusals (small discrepancies may appear between breakdowns and totals due to refusals concerning more than oneML item or refusals for items other than those appearing in the ML); (e) = criteria numbers on which refusals are based (the approximate number of times each criterion is invoked is indicated in brackets)

NORTH AFRICA
ML 1 ML 2 ML 3 ML 4 ML 5 ML 6 ML 7 ML 8 ML 9 ML 10 ML 11
Italy a 1 4 1 1 3 2 7 6
b 1 252 491 180 803 1 723 172 4 780 124 34 654 800 6 216 530 288 873 569 11 604 863
c
Lithuania a 1 1
b 793 788 140 650
c 18 624 158 929
Netherlands a 1
b 600 000
c 287 433 283 260
Poland a 1 1 1 2 5 8 2
b 285 000 19 383 1 477 1 394 195 3 401 483 24 918 468 60 911
c
Portugal a 51
b 2 763 582
c 2 751 279
Romania a 1
b 14 566 105
c 42 565 453
Slovakia a 2
b 6 303 721
c
Slovenia a 1
b 3 864 375 112 251
c 112 251
Spain a 1 1 1 1 1 1 3
b 778 480
c 778 480 9 028 124
C382/384
ROJurnalul O
ficialalUniunii Europene
30.12.2011EU ARMS EXPORTS PER REGION IN 2010
Key: (a) = number of licences issued, (b) = value of licences issued in Euros, (c) = value of arms exports in Euros (if available) (d) = total EU number of licence refusals (small discrepancies may appear between breakdowns and totals due to refusals concerning more than oneML item or refusals for items other than those appearing in the ML); (e) = criteria numbers on which refusals are based (the approximate number of times each criterion is invoked is indicated in brackets)

NORTH AFRICA
ML 1 ML 2 ML 3 ML 4 ML 5 ML 6 ML 7 ML 8 ML 9 ML 10 ML 11
Sweden a 1 2
b
c
United Kingdom a 53 37 58 40 17 11 12 15 52
b 735 050 550 6 971 109 146 736 174 495 3 397 024 30 008 295 454 267 19 567 421
c
TOTAL PER MLcategory
a 70 49 72 72 52 55 18 7 17 150 103
b 2 862 235 3 306 887 36 588 437 84 898 430 125 408 880 132 721 994 416 323 1 272 951 66 035 596 833 777 136 66 247 021
c 912 979 907 528 10 312 065 10 039 683 442 791 18 765 173 56 546 244 283 050
d 1 2 2 2 4 1 1 2
e 2(1) 3(2) 4(2) 7(2) 3(1)4(1) 5(1)
2(3) 6(1)7(3)
2(1) 7(1) 5(1) 7(2)
ML 12 ML 13 ML 14 ML 15 ML 17 ML 18 ML 21 ML 22 TOTAL perdestination
Austria a 5 15
b 332 872 5 767 179
c 329 987 5 851 397
Belgium a 1 10
b 6 230 6 256 888
c
Bulgaria a 20
b 49 861 900
c 180 536 27 514 735
Czech Republic a 3 1 14
b 2 897 741 13 772 26 670 845
c 13 342 112 694 9 493 895
30.12.2011RO
Jurnalul OficialalU
niunii EuropeneC
382/385EU ARMS EXPORTS PER REGION IN 2010
Key: (a) = number of licences issued, (b) = value of licences issued in Euros, (c) = value of arms exports in Euros (if available) (d) = total EU number of licence refusals (small discrepancies may appear between breakdowns and totals due to refusals concerning more than oneML item or refusals for items other than those appearing in the ML); (e) = criteria numbers on which refusals are based (the approximate number of times each criterion is invoked is indicated in brackets)

NORTH AFRICA
ML 12 ML 13 ML 14 ML 15 ML 17 ML 18 ML 21 ML 22 TOTAL perdestination
Denmark a 1
b 315 930
c
Finland a 2
b 209 990
c 2 213
France a 1 13 56 1 5 15 248
b 234 985 1 282 231 152 520 041 30 335 243 229 1 762 035 656 263 664
c 307 906 476
Germany a 1 1 1 1 48
b 5 925 1 100 000 8 060 330 40 800 334
c
Greece a 1 3
b 62 000 174 000
c
Italy a 4 29
b 42 745 861 392 032 214
c 5 442 141
Lithuania a 2
b 934 438
c 177 553
Netherlands a 1
b 600 000
c 570 693
Poland a 1 21
b 13 214 30 094 131
c
C382/386
ROJurnalul O
ficialalUniunii Europene
30.12.2011EU ARMS EXPORTS PER REGION IN 2010
Key: (a) = number of licences issued, (b) = value of licences issued in Euros, (c) = value of arms exports in Euros (if available) (d) = total EU number of licence refusals (small discrepancies may appear between breakdowns and totals due to refusals concerning more than oneML item or refusals for items other than those appearing in the ML); (e) = criteria numbers on which refusals are based (the approximate number of times each criterion is invoked is indicated in brackets)

NORTH AFRICA
ML 12 ML 13 ML 14 ML 15 ML 17 ML 18 ML 21 ML 22 TOTAL perdestination
Portugal a 51
b 2 763 582
c 2 751 279
Romania a 1
b 14 566 105
c 42 565 453
Slovakia a 1 1 4
b 7 216 000 56 000 13 575 721
c
Slovenia a 1
b 3 976 626
c 112 251
Spain a 5 3 17
b 7 875 975 8 654 455
c 7 847 598 17 654 202
Sweden a 1 4
b 75 002 085
c 1 752 483
United Kingdom a 5 152 10 5 5 15 487
b 11 354 1 696 690 1 059 639 1 528 860 4 836 991 15 256 335 625 451
c
TOTAL PER MLcategory
a 1 25 155 75 10 6 11 31 979
b 234 985 1 312 724 10 012 690 212 323 845 4 463 166 346 644 5 080 220 1 833 290 1 664 145 538
c 180 536 7 847 598 343 329 112 694 421 794 771
d 2 2 2 2 23
e 2(1) 5(1) 2(1) 7(2) 3(1) 4(1)7(1)
2(1) 7(2) 2(8) 3(4)6(1) 7(13)
30.12.2011RO
Jurnalul OficialalU
niunii EuropeneC
382/387EU ARMS EXPORTS PER REGION IN 2010
Key: (a) = number of licences issued, (b) = value of licences issued in Euros, (c) = value of arms exports in Euros (if available) (d) = total EU number of licence refusals (small discrepancies may appear between breakdowns and totals due to refusals concerning more than oneML item or refusals for items other than those appearing in the ML); (e) = criteria numbers on which refusals are based (the approximate number of times each criterion is invoked is indicated in brackets)

NORTH AMERICA
ML 1 ML 2 ML 3 ML 4 ML 5 ML 6 ML 7 ML 8 ML 9 ML 10
Austria a 104 2 58 10 2 1
b 157 087 171 68 490 1 784 483 16 195 172 900 000 1 400 000
c 110 231 283 68 490 1 766 454 71 092 5 728
Belgium a 158 1 12 4 12 8
b 82 295 830 4 171 879 242 764 158 20 800 635 14 664 028
c
Bulgaria a 12 5 6 8 1 1
b 6 000 781 1 046 110 4 766 861 2 800 817 1 498 2 944 400
c 344 895 954 160 3 853 401 2 791 537 1 498
Czech Republic a 9 3 9 5 2 9 1 24
b 204 546 75 129 2 365 412 830 316 7 177 109 1 405 932 77 283 410
c 520 023 1 881 1 055 556 995 298 975 879 115 871 7 520 871
Denmark a 2 2 1 21 9 1 38
b 4 863 401 1 209 11 402 808 15 080 696 28 101 861 158 785 595
c
Estonia a
b
c
Finland a 4 2 1 7 1
b 12 022 582 4 740 000 96 861 28 791 420 000
c 481 575 84 496 202 451 319 911 180
France a 21 2 7 41 33 27 3 8 90
b 7 589 788 4 451 814 469 17 584 636 11 479 920 45 629 880 46 136 999 325 140 754 113
c
Germany a 998 45 85 42 59 402 10 35 16 96
b 132 898 665 32 665 521 112 434 436 22 235 041 9 466 800 118 716 348 1 348 21 408 670 186 426 25 781 848
c
C382/388
ROJurnalul O
ficialalUniunii Europene
30.12.2011EU ARMS EXPORTS PER REGION IN 2010
Key: (a) = number of licences issued, (b) = value of licences issued in Euros, (c) = value of arms exports in Euros (if available) (d) = total EU number of licence refusals (small discrepancies may appear between breakdowns and totals due to refusals concerning more than oneML item or refusals for items other than those appearing in the ML); (e) = criteria numbers on which refusals are based (the approximate number of times each criterion is invoked is indicated in brackets)

NORTH AMERICA
ML 1 ML 2 ML 3 ML 4 ML 5 ML 6 ML 7 ML 8 ML 9 ML 10
Greece a 1 2 1 18 1 4 63
b 986 216 615 600 57 498 268 288 800 48 260 51 648 180
c
Hungary a 5 19 1
b 943 210 42 254 850 3 600 000
c 33 600 6 717 908
Ireland a 13 7
b 100 936 2 008 560
c
Italy a 13 4 3 4 67
b 2 384 622 1 145 037 454 190 598 111 371 729 973
c
Lithuania a
b
c
Malta a 2
b 4 650
c 310
Netherlands a 6 4 10 15 7 15 3 24
b 31 093 5 694 845 1 223 2 760 795 396 3 343 074 1 903 925 292 325 421
c 27 690 43 887 539 248 1 478 22 974 071 4 921 160 2 107 086 83 818 604
Poland a 19 6 2 2 2 64
b 2 888 216 784 734 212 718 2 516 5 233 468 217 325 646
c
Portugal a 4
b 62 396
c 62 396
30.12.2011RO
Jurnalul OficialalU
niunii EuropeneC
382/389EU ARMS EXPORTS PER REGION IN 2010
Key: (a) = number of licences issued, (b) = value of licences issued in Euros, (c) = value of arms exports in Euros (if available) (d) = total EU number of licence refusals (small discrepancies may appear between breakdowns and totals due to refusals concerning more than oneML item or refusals for items other than those appearing in the ML); (e) = criteria numbers on which refusals are based (the approximate number of times each criterion is invoked is indicated in brackets)

NORTH AMERICA
ML 1 ML 2 ML 3 ML 4 ML 5 ML 6 ML 7 ML 8 ML 9 ML 10
Romania a 75 2 15 1 1 1 1 3
b 17 820 613 866 659 9 156 860 75 432 10 998 20 020 50 348 5 891 537
c 6 649 484 862 925 1 216 640 75 432 10 998 50 348 5 388 288
Slovakia a 1 1 4
b 69 557 239 414
c 68 846 175 177
Spain a 35 1 2 26 6 3 35
b 22 319 535 8 500 45 454 834 10 341 908 4 242 114
c 9 588 976 33 621 383 11 903 837 1 571 465 15 307 481 5 545 167
Sweden a 4 8 35 1 5 19 1
b
c
United Kingdom a 511 35 25 151 133 181 161 4 123 1 814
b 14 035 617 5 480 659 3 930 166 444 466 678 17 724 372 1 688 044 5 210 080 1 658 940 13 706 891 139 888 463
c
TOTAL PER MLcategory
a 1 979 126 298 336 264 658 179 75 163 2 333
b 456 243 234 54 214 161 234 422 052 567 787 656 60 913 745 468 869 133 6 646 150 44 814 381 20 437 686 1 502 202 724
c 127 877 836 45 843 841 48 316 086 16 145 209 24 558 032 5 968 131 435 782 15 313 209 2 157 434 102 335 506
d
e
ML 11 ML 13 ML 14 ML 15 ML 16 ML 17 ML 18 ML 21 ML 22 TOTAL perdestination
Austria a 1 1 3 3 185
b 1 431 876 1 810 608 25 699 147 310 180 850 809
c 176 682 23 064 112 342 793
Belgium a 2 2 4 203
b 25 132 992 455 401 390 284 923
c
C382/390
ROJurnalul O
ficialalUniunii Europene
30.12.2011EU ARMS EXPORTS PER REGION IN 2010
Key: (a) = number of licences issued, (b) = value of licences issued in Euros, (c) = value of arms exports in Euros (if available) (d) = total EU number of licence refusals (small discrepancies may appear between breakdowns and totals due to refusals concerning more than oneML item or refusals for items other than those appearing in the ML); (e) = criteria numbers on which refusals are based (the approximate number of times each criterion is invoked is indicated in brackets)

NORTH AMERICA
ML 11 ML 13 ML 14 ML 15 ML 16 ML 17 ML 18 ML 21 ML 22 TOTAL perdestination
Bulgaria a 2 1 36
b 132 417 21 991 770 39 684 654
c 41 105 3 087 597 11 074 192
Czech Republic a 10 15 2 89
b 131 674 739 932 1 352 90 214 812
c 2 866 983 481 16 584 73 452 168 224 12 429 986
Denmark a 4 2 10 2 2 94
b 760 062 143 923 3 829 873 7 556 003 1 837 936 232 363 367
c
Estonia a 1 1
b 1 384 1 384
c 1 384 1 384
Finland a 7 22
b 115 410 17 423 644
c 5 616 695 250 6 705 559
France a 55 5 4 48 13 2 6 37 402
b 15 654 040 20 071 599 81 655 23 150 403 13 576 767 533 927 134 823 1 928 105 300 034 037
c 203 641 313
Germany a 78 35 33 75 39 49 20 98 2 215
b 35 719 600 2 537 462 16 891 120 29 840 971 37 031 860 17 185 434 2 562 656 21 563 432 639 127 638
c
Greece a 1 1 3 1 96
b 5 826 263 720 1 028 271 151 894 112 535 035
c
Hungary a 3 28
b 1 445 000 48 243 060
c 1 071 000 7 822 508
30.12.2011RO
Jurnalul OficialalU
niunii EuropeneC
382/391EU ARMS EXPORTS PER REGION IN 2010
Key: (a) = number of licences issued, (b) = value of licences issued in Euros, (c) = value of arms exports in Euros (if available) (d) = total EU number of licence refusals (small discrepancies may appear between breakdowns and totals due to refusals concerning more than oneML item or refusals for items other than those appearing in the ML); (e) = criteria numbers on which refusals are based (the approximate number of times each criterion is invoked is indicated in brackets)

NORTH AMERICA
ML 11 ML 13 ML 14 ML 15 ML 16 ML 17 ML 18 ML 21 ML 22 TOTAL perdestination
Ireland a 1 21
b 100 000 2 209 496
c
Italy a 9 2 2 2 1 2 5 114
b 5 683 677 505 804 553 1 392 652 164 062 196 491 895 246 385 150 416
c 102 248 250
Lithuania a 1 1
b 260 928 260 928
c 40 143 40 143
Malta a 2
b 4 650
c 310
Netherlands a 1 1 8 2 1 1 98
b 4 883 667 816 2 075 624 231 535 20 000 14 067 664 321 165 259
c 4 883 687 249 2 812 920 126 535 20 000 1 500 161 390 963
Poland a 1 1 12 18 127
b 1 281 275 124 753 289 201 2 691 630 230 834 157
c
Portugal a 4
b 62 396
c 62 396
Romania a 1 2 102
b 671 894 98 061 34 662 422
c 298 620 9 655 14 562 390
Slovakia a 1 7
b 160 000 468 971
c 91 183 335 206
C382/392
ROJurnalul O
ficialalUniunii Europene
30.12.2011EU ARMS EXPORTS PER REGION IN 2010
Key: (a) = number of licences issued, (b) = value of licences issued in Euros, (c) = value of arms exports in Euros (if available) (d) = total EU number of licence refusals (small discrepancies may appear between breakdowns and totals due to refusals concerning more than oneML item or refusals for items other than those appearing in the ML); (e) = criteria numbers on which refusals are based (the approximate number of times each criterion is invoked is indicated in brackets)

NORTH AMERICA
ML 11 ML 13 ML 14 ML 15 ML 16 ML 17 ML 18 ML 21 ML 22 TOTAL perdestination
Spain a 2 3 113
b 82 366 891
c 71 475 7 000 77 616 784
Sweden a 9 2 84
b 116 602 299
c 183 868 777
United Kingdom a 566 35 48 32 32 23 46 189 198 4 307
b 28 343 333 1 301 947 8 575 850 2 418 534 1 528 309 751 246 691 294 2 850 243 266 367 694 517 031
c
TOTAL PER MLcategory
a 732 50 118 135 112 77 125 222 369 8 351
b 114 312 962 23 805 368 13 012 296 47 545 774 55 037 922 52 156 520 22 575 427 27 679 774 29 789 014 3 919 068 279
c 6 766 919 176 932 1 672 114 2 877 609 3 214 132 298 620 43 064 166 135 218 022 894 142 954
d
e
NORTH EAST ASIA
ML 1 ML 2 ML 3 ML 4 ML 5 ML 6 ML 7 ML 8 ML 9 ML 10 ML 11
Austria a 22 1 4 4 5
b 155 583 86 736 1 083 930 429 630 220 802
c 75 412 86 736 1 083 930 365 157 220 802
Belgium a 17 1
b 4 088 471 22 000 000
c
Bulgaria a 1
b 2 855 000
c 2 855 000
30.12.2011RO
Jurnalul OficialalU
niunii EuropeneC
382/393EU ARMS EXPORTS PER REGION IN 2010
Key: (a) = number of licences issued, (b) = value of licences issued in Euros, (c) = value of arms exports in Euros (if available) (d) = total EU number of licence refusals (small discrepancies may appear between breakdowns and totals due to refusals concerning more than oneML item or refusals for items other than those appearing in the ML); (e) = criteria numbers on which refusals are based (the approximate number of times each criterion is invoked is indicated in brackets)
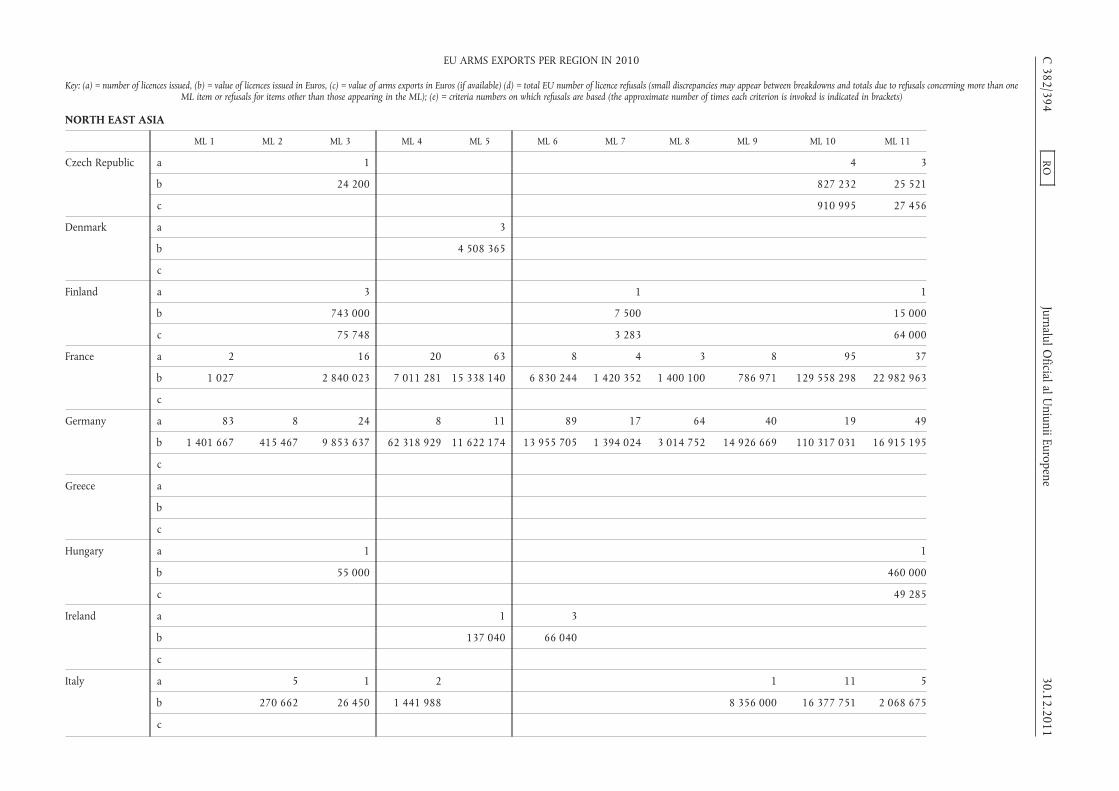
NORTH EAST ASIA
ML 1 ML 2 ML 3 ML 4 ML 5 ML 6 ML 7 ML 8 ML 9 ML 10 ML 11
Czech Republic a 1 4 3
b 24 200 827 232 25 521
c 910 995 27 456
Denmark a 3
b 4 508 365
c
Finland a 3 1 1
b 743 000 7 500 15 000
c 75 748 3 283 64 000
France a 2 16 20 63 8 4 3 8 95 37
b 1 027 2 840 023 7 011 281 15 338 140 6 830 244 1 420 352 1 400 100 786 971 129 558 298 22 982 963
c
Germany a 83 8 24 8 11 89 17 64 40 19 49
b 1 401 667 415 467 9 853 637 62 318 929 11 622 174 13 955 705 1 394 024 3 014 752 14 926 669 110 317 031 16 915 195
c
Greece a
b
c
Hungary a 1 1
b 55 000 460 000
c 49 285
Ireland a 1 3
b 137 040 66 040
c
Italy a 5 1 2 1 11 5
b 270 662 26 450 1 441 988 8 356 000 16 377 751 2 068 675
c
C382/394
ROJurnalul O
ficialalUniunii Europene
30.12.2011EU ARMS EXPORTS PER REGION IN 2010
Key: (a) = number of licences issued, (b) = value of licences issued in Euros, (c) = value of arms exports in Euros (if available) (d) = total EU number of licence refusals (small discrepancies may appear between breakdowns and totals due to refusals concerning more than oneML item or refusals for items other than those appearing in the ML); (e) = criteria numbers on which refusals are based (the approximate number of times each criterion is invoked is indicated in brackets)

NORTH EAST ASIA
ML 1 ML 2 ML 3 ML 4 ML 5 ML 6 ML 7 ML 8 ML 9 ML 10 ML 11
Latvia a 1
b 136 803
c 136 803
Netherlands a 2 2 7 1 5
b 411 203 580 555 20 352 270 1 000 27 026 622
c 79 230 13 255 346 1 200 11 796 442 2 061 131
Poland a 1 1 1
b 849 398 156 739 78 174
c
Slovakia a 1
b 354 000
c 52 221
Spain a 3
b 75 000
c 10 591 057
Sweden a 13 6 2 2
b
c
United Kingdom a 354 4 51 85 266 113 203 11 189 329 212
b 2 021 170 457 751 1 147 100 1 213 029 12 036 233 1 251 466 12 954 139 152 631 5 259 894 20 123 961 18 820 677
c
TOTAL PER MLcategory
a 479 33 107 122 351 222 226 80 244 463 308
b 7 804 721 1 641 819 15 773 340 73 844 810 63 994 223 44 835 996 15 854 189 4 567 483 59 211 156 277 279 273 61 288 031
c 212 215 86 736 1 159 678 444 387 13 255 346 274 223 3 283 14 651 442 13 563 183 140 741
d 3 2 3 1 3 1 5 4
e 1(1) 7(3) 1(1) 7(1) 1(2) 2(2)7(1) 8(1)
2(1) 1(3) 7(1) 7(1) 1(3) 4(4) 4(4)
30.12.2011RO
Jurnalul OficialalU
niunii EuropeneC
382/395EU ARMS EXPORTS PER REGION IN 2010
Key: (a) = number of licences issued, (b) = value of licences issued in Euros, (c) = value of arms exports in Euros (if available) (d) = total EU number of licence refusals (small discrepancies may appear between breakdowns and totals due to refusals concerning more than oneML item or refusals for items other than those appearing in the ML); (e) = criteria numbers on which refusals are based (the approximate number of times each criterion is invoked is indicated in brackets)

NORTH EAST ASIA
ML 13 ML 14 ML 15 ML 16 ML 17 ML 18 ML 20 ML 21 ML 22 TOTAL perdestination
Austria a 1 1 37 75
b 25 500 1 575 259 266 443 3 843 883
c 25 500 266 443 2 123 980
Belgium a 18
b 26 088 471
c
Bulgaria a 1
b 2 855 000
c 2 855 000
Czech Republic a 1 9
b 37 718 914 671
c 938 451
Denmark a 3
b 4 508 365
c
Finland a 2 7
b 29 205 794 705
c 143 031
France a 3 5 102 6 2 3 12 17 406
b 11 893 5 035 897 99 504 876 6 908 365 4 069 061 192 851 12 110 691 6 295 456 322 298 489
c
Germany a 4 7 18 9 5 19 16 33 523
b 61 372 31 681 556 3 290 145 4 374 705 237 495 4 199 412 1 391 338 6 064 250 297 435 523
c
Greece a 1 1
b 50 50
c
C382/396
ROJurnalul O
ficialalUniunii Europene
30.12.2011EU ARMS EXPORTS PER REGION IN 2010
Key: (a) = number of licences issued, (b) = value of licences issued in Euros, (c) = value of arms exports in Euros (if available) (d) = total EU number of licence refusals (small discrepancies may appear between breakdowns and totals due to refusals concerning more than oneML item or refusals for items other than those appearing in the ML); (e) = criteria numbers on which refusals are based (the approximate number of times each criterion is invoked is indicated in brackets)

NORTH EAST ASIA
ML 13 ML 14 ML 15 ML 16 ML 17 ML 18 ML 20 ML 21 ML 22 TOTAL perdestination
Hungary a 2
b 515 000
c 49 285
Ireland a 4
b 203 080
c
Italy a 1 1 1 28
b 359 293 60 716 298 450 29 259 984
c 1 092 675
Latvia a 1
b 136 803
c 136 803
Netherlands a 3 1 21
b 1 063 837 10 000 49 445 487
c 1 063 837 28 257 186
Poland a 3
b 1 084 311
c
Slovakia a 1
b 354 000
c 52 221
Spain a 3
b 75 000
c 50 000 10 641 057
Sweden a 2 1 26
b 9 336 671
c 34 269 829
30.12.2011RO
Jurnalul OficialalU
niunii EuropeneC
382/397EU ARMS EXPORTS PER REGION IN 2010
Key: (a) = number of licences issued, (b) = value of licences issued in Euros, (c) = value of arms exports in Euros (if available) (d) = total EU number of licence refusals (small discrepancies may appear between breakdowns and totals due to refusals concerning more than oneML item or refusals for items other than those appearing in the ML); (e) = criteria numbers on which refusals are based (the approximate number of times each criterion is invoked is indicated in brackets)
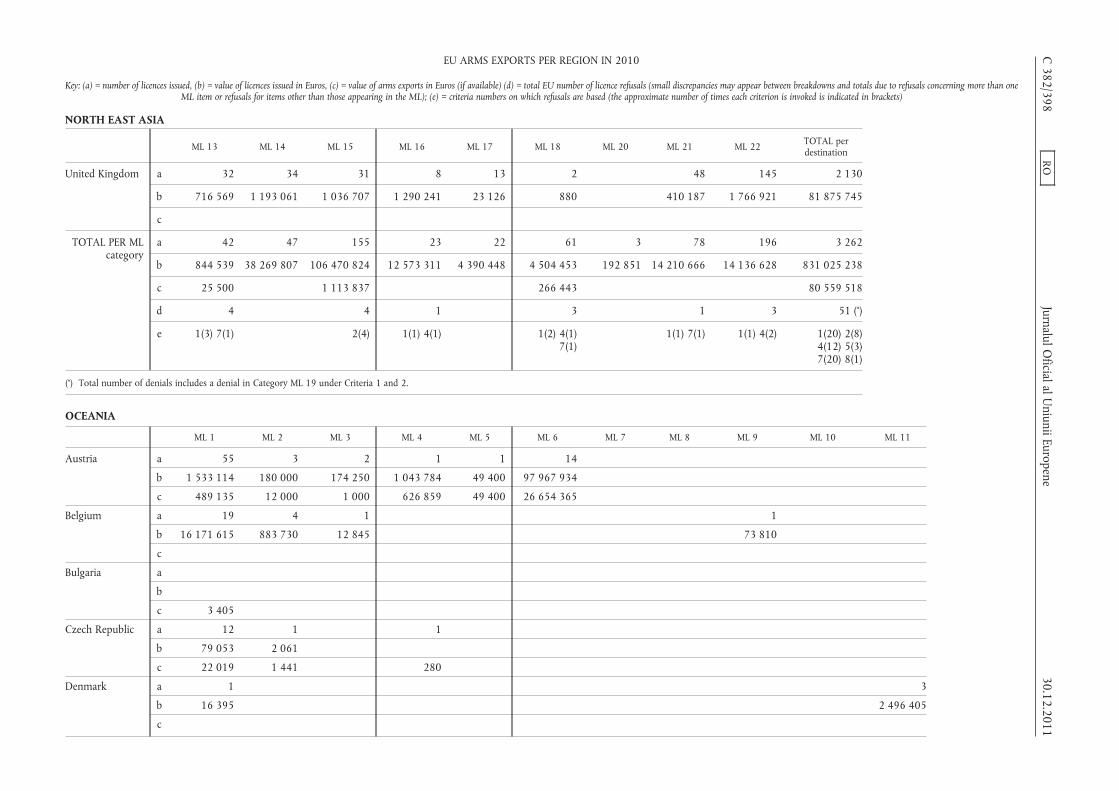
NORTH EAST ASIA
ML 13 ML 14 ML 15 ML 16 ML 17 ML 18 ML 20 ML 21 ML 22 TOTAL perdestination
United Kingdom a 32 34 31 8 13 2 48 145 2 130
b 716 569 1 193 061 1 036 707 1 290 241 23 126 880 410 187 1 766 921 81 875 745
c
TOTAL PER MLcategory
a 42 47 155 23 22 61 3 78 196 3 262
b 844 539 38 269 807 106 470 824 12 573 311 4 390 448 4 504 453 192 851 14 210 666 14 136 628 831 025 238
c 25 500 1 113 837 266 443 80 559 518
d 4 4 1 3 1 3 51 (*)
e 1(3) 7(1) 2(4) 1(1) 4(1) 1(2) 4(1)7(1)
1(1) 7(1) 1(1) 4(2) 1(20) 2(8)4(12) 5(3)7(20) 8(1)
(*) Total number of denials includes a denial in Category ML 19 under Criteria 1 and 2.
OCEANIA
ML 1 ML 2 ML 3 ML 4 ML 5 ML 6 ML 7 ML 8 ML 9 ML 10 ML 11
Austria a 55 3 2 1 1 14
b 1 533 114 180 000 174 250 1 043 784 49 400 97 967 934
c 489 135 12 000 1 000 626 859 49 400 26 654 365
Belgium a 19 4 1 1
b 16 171 615 883 730 12 845 73 810
c
Bulgaria a
b
c 3 405
Czech Republic a 12 1 1
b 79 053 2 061
c 22 019 1 441 280
Denmark a 1 3
b 16 395 2 496 405
c
C382/398
ROJurnalul O
ficialalUniunii Europene
30.12.2011EU ARMS EXPORTS PER REGION IN 2010
Key: (a) = number of licences issued, (b) = value of licences issued in Euros, (c) = value of arms exports in Euros (if available) (d) = total EU number of licence refusals (small discrepancies may appear between breakdowns and totals due to refusals concerning more than oneML item or refusals for items other than those appearing in the ML); (e) = criteria numbers on which refusals are based (the approximate number of times each criterion is invoked is indicated in brackets)
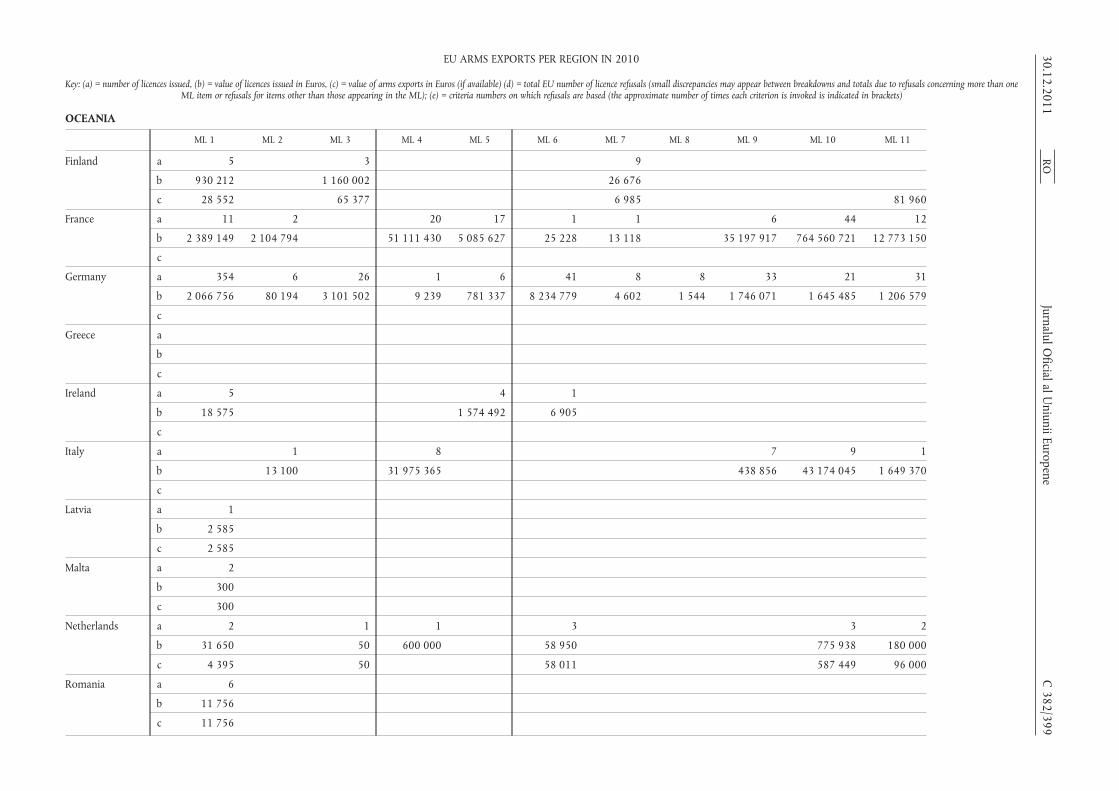
OCEANIA
ML 1 ML 2 ML 3 ML 4 ML 5 ML 6 ML 7 ML 8 ML 9 ML 10 ML 11
Finland a 5 3 9
b 930 212 1 160 002 26 676
c 28 552 65 377 6 985 81 960
France a 11 2 20 17 1 1 6 44 12
b 2 389 149 2 104 794 51 111 430 5 085 627 25 228 13 118 35 197 917 764 560 721 12 773 150
c
Germany a 354 6 26 1 6 41 8 8 33 21 31
b 2 066 756 80 194 3 101 502 9 239 781 337 8 234 779 4 602 1 544 1 746 071 1 645 485 1 206 579
c
Greece a
b
c
Ireland a 5 4 1
b 18 575 1 574 492 6 905
c
Italy a 1 8 7 9 1
b 13 100 31 975 365 438 856 43 174 045 1 649 370
c
Latvia a 1
b 2 585
c 2 585
Malta a 2
b 300
c 300
Netherlands a 2 1 1 3 3 2
b 31 650 50 600 000 58 950 775 938 180 000
c 4 395 50 58 011 587 449 96 000
Romania a 6
b 11 756
c 11 756
30.12.2011RO
Jurnalul OficialalU
niunii EuropeneC
382/399EU ARMS EXPORTS PER REGION IN 2010
Key: (a) = number of licences issued, (b) = value of licences issued in Euros, (c) = value of arms exports in Euros (if available) (d) = total EU number of licence refusals (small discrepancies may appear between breakdowns and totals due to refusals concerning more than oneML item or refusals for items other than those appearing in the ML); (e) = criteria numbers on which refusals are based (the approximate number of times each criterion is invoked is indicated in brackets)

OCEANIA
ML 1 ML 2 ML 3 ML 4 ML 5 ML 6 ML 7 ML 8 ML 9 ML 10 ML 11
Slovenia a 1
b 17 496
c 8 748
Spain a 5 5 3 2
b 29 350 10 800 000 305 075 000 20 039 324
c 46 581 3 000 17 860 000 6 744 243
Sweden a 2 5 1 1 1
b
c
United Kingdom a 454 9 35 30 3 65 39 3 164 38 118
b 1 425 639 10 175 14 917 3 948 621 99 000 5 355 460 1 376 271 120 761 428 1 251 954 2 545 412
c
TOTAL PER MLcategory
a 934 26 73 63 32 126 57 11 216 118 170
b 24 706 148 3 274 054 4 463 566 88 688 439 7 589 856 111 666 751 1 420 668 1 664 49 018 081 1 116 483 144 40 890 240
c 608 728 13 441 66 427 630 139 49 400 26 721 124 6 985 17 860 000 7 331 692 177 960
d
e
ML 13 ML 14 ML 15 ML 16 ML 17 ML 18 ML 21 ML 22 TOTAL perdestination
Austria a 1 77
b 10 000 100 958 482
c 27 832 759
Belgium a 25
b 17 142 000
c
Bulgaria a
b
c 3 405
C382/400
ROJurnalul O
ficialalUniunii Europene
30.12.2011EU ARMS EXPORTS PER REGION IN 2010
Key: (a) = number of licences issued, (b) = value of licences issued in Euros, (c) = value of arms exports in Euros (if available) (d) = total EU number of licence refusals (small discrepancies may appear between breakdowns and totals due to refusals concerning more than oneML item or refusals for items other than those appearing in the ML); (e) = criteria numbers on which refusals are based (the approximate number of times each criterion is invoked is indicated in brackets)

OCEANIA
ML 13 ML 14 ML 15 ML 16 ML 17 ML 18 ML 21 ML 22 TOTAL perdestination
Czech Republic a 14
b 81 114
c 23 740
Denmark a 2 1 1 8
b 22 576 22 442 2 557 818
c
Finland a 4 21
b 58 410 2 175 300
c 182 874
France a 4 2 23 2 6 5 156
b 8 977 656 5 031 610 17 983 609 18 164 1 702 622 341 434 907 316 228
c 158 489 282
Germany a 4 2 9 5 18 4 5 582
b 168 724 10 063 247 335 356 422 284 119 6 470 166 830 20 118 051
c
Greece a 1 1 2
b 3 033 400 128 403 161
c
Ireland a 10
b 1 599 972
c
Italy a 1 1 28
b 1 200 942 1 347 811 79 799 489
c 3 799 609
Latvia a 1
b 2 585
c 2 585
30.12.2011RO
Jurnalul OficialalU
niunii EuropeneC
382/401EU ARMS EXPORTS PER REGION IN 2010
Key: (a) = number of licences issued, (b) = value of licences issued in Euros, (c) = value of arms exports in Euros (if available) (d) = total EU number of licence refusals (small discrepancies may appear between breakdowns and totals due to refusals concerning more than oneML item or refusals for items other than those appearing in the ML); (e) = criteria numbers on which refusals are based (the approximate number of times each criterion is invoked is indicated in brackets)

OCEANIA
ML 13 ML 14 ML 15 ML 16 ML 17 ML 18 ML 21 ML 22 TOTAL perdestination
Malta a 2
b 300
c 300
Netherlands a 12
b 1 646 588
c 97 485 843 390
Romania a 6
b 11 756
c 11 756
Slovenia a 1
b 17 496
c 8 748
Spain a 15
b 335 943 674
c 24 653 824
Sweden a 10
b 4 350 040
c 27 585 622
United Kingdom a 4 7 2 1 34 57 38 1 101
b 963 15 461 118 800 262 900 546 312 533 713 769 450 19 036 596
c
TOTAL PER MLcategory
a 14 13 28 9 8 53 70 50 2 071
b 9 059 605 5 215 795 18 115 505 247 335 637 486 830 431 3 866 317 2 635 525 1 493 160 649
c 97 485 243 437 894
d
e
C382/402
ROJurnalul O
ficialalUniunii Europene
30.12.2011EU ARMS EXPORTS PER REGION IN 2010
Key: (a) = number of licences issued, (b) = value of licences issued in Euros, (c) = value of arms exports in Euros (if available) (d) = total EU number of licence refusals (small discrepancies may appear between breakdowns and totals due to refusals concerning more than oneML item or refusals for items other than those appearing in the ML); (e) = criteria numbers on which refusals are based (the approximate number of times each criterion is invoked is indicated in brackets)
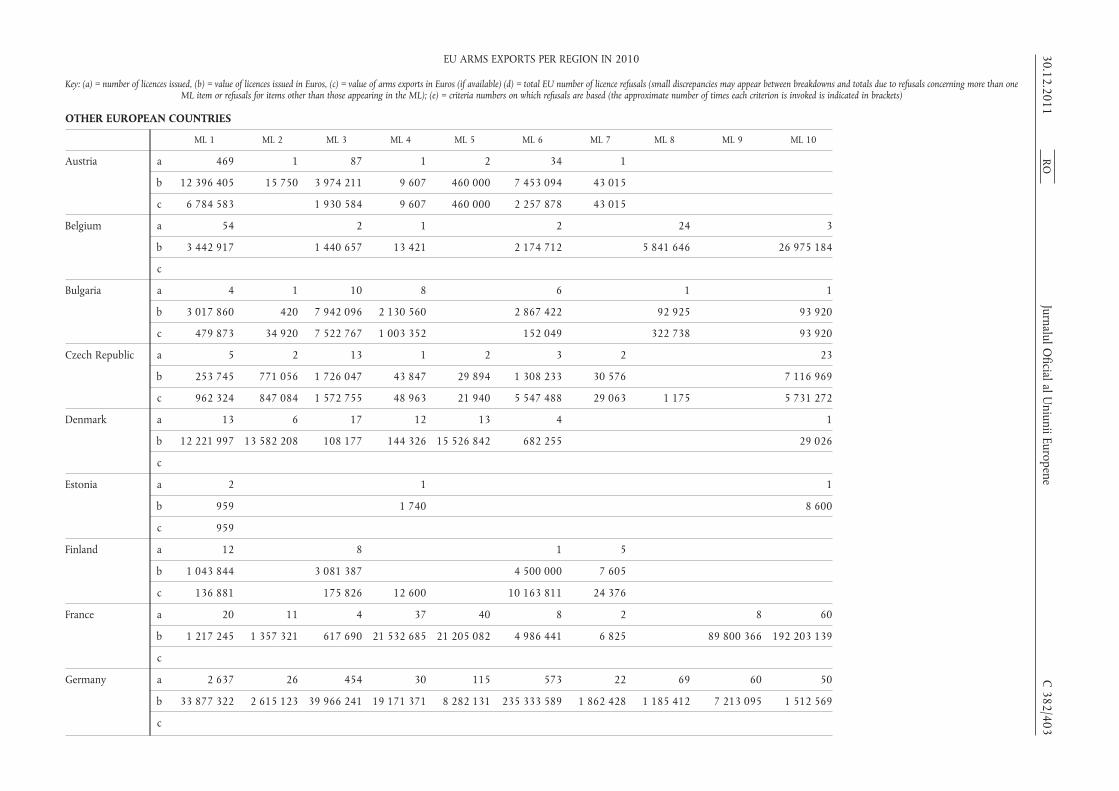
OTHER EUROPEAN COUNTRIES
ML 1 ML 2 ML 3 ML 4 ML 5 ML 6 ML 7 ML 8 ML 9 ML 10
Austria a 469 1 87 1 2 34 1
b 12 396 405 15 750 3 974 211 9 607 460 000 7 453 094 43 015
c 6 784 583 1 930 584 9 607 460 000 2 257 878 43 015
Belgium a 54 2 1 2 24 3
b 3 442 917 1 440 657 13 421 2 174 712 5 841 646 26 975 184
c
Bulgaria a 4 1 10 8 6 1 1
b 3 017 860 420 7 942 096 2 130 560 2 867 422 92 925 93 920
c 479 873 34 920 7 522 767 1 003 352 152 049 322 738 93 920
Czech Republic a 5 2 13 1 2 3 2 23
b 253 745 771 056 1 726 047 43 847 29 894 1 308 233 30 576 7 116 969
c 962 324 847 084 1 572 755 48 963 21 940 5 547 488 29 063 1 175 5 731 272
Denmark a 13 6 17 12 13 4 1
b 12 221 997 13 582 208 108 177 144 326 15 526 842 682 255 29 026
c
Estonia a 2 1 1
b 959 1 740 8 600
c 959
Finland a 12 8 1 5
b 1 043 844 3 081 387 4 500 000 7 605
c 136 881 175 826 12 600 10 163 811 24 376
France a 20 11 4 37 40 8 2 8 60
b 1 217 245 1 357 321 617 690 21 532 685 21 205 082 4 986 441 6 825 89 800 366 192 203 139
c
Germany a 2 637 26 454 30 115 573 22 69 60 50
b 33 877 322 2 615 123 39 966 241 19 171 371 8 282 131 235 333 589 1 862 428 1 185 412 7 213 095 1 512 569
c
30.12.2011RO
Jurnalul OficialalU
niunii EuropeneC
382/403EU ARMS EXPORTS PER REGION IN 2010
Key: (a) = number of licences issued, (b) = value of licences issued in Euros, (c) = value of arms exports in Euros (if available) (d) = total EU number of licence refusals (small discrepancies may appear between breakdowns and totals due to refusals concerning more than oneML item or refusals for items other than those appearing in the ML); (e) = criteria numbers on which refusals are based (the approximate number of times each criterion is invoked is indicated in brackets)

OTHER EUROPEAN COUNTRIES
ML 1 ML 2 ML 3 ML 4 ML 5 ML 6 ML 7 ML 8 ML 9 ML 10
Greece a 5 3 1 8
b 30 224 1 824 467 4 576 4 320 633
c
Hungary a 3 1 9 4 1 3
b 18 515 300 000 3 470 262 5 944 500 100 000 75 870
c 18 515 300 000 887 367 83 836 63 563
Ireland a 1 1 1
b 800 61 698 12 000
c
Italy a 3 13 3 1 9 1 4 17
b 475 897 42 328 160 486 796 41 553 5 601 203 85 223 1 043 645 11 660 983
c
Latvia a 1 13
b 3 860 303 278
c 3 860 303 278
Lithuania a 3 2 6 5
b 51 792 12 261 6 242 522 1 277 493
c 51 792 12 261 5 011 378 1 016 563
Malta a 3 1
b 3 400 23 500
c 1 200 23 500
Netherlands a 7 16 3 21 21 1 5
b 55 308 587 321 19 824 8 101 043 7 296 961 35 1 135 332
c 3 084 148 127 19 824 20 800 172 2 407 380 40 7 259
Poland a 2 6 1 12 1 4
b 15 925 632 353 2 585 124 3 038 077 81 59 127
c
C382/404
ROJurnalul O
ficialalUniunii Europene
30.12.2011EU ARMS EXPORTS PER REGION IN 2010
Key: (a) = number of licences issued, (b) = value of licences issued in Euros, (c) = value of arms exports in Euros (if available) (d) = total EU number of licence refusals (small discrepancies may appear between breakdowns and totals due to refusals concerning more than oneML item or refusals for items other than those appearing in the ML); (e) = criteria numbers on which refusals are based (the approximate number of times each criterion is invoked is indicated in brackets)

OTHER EUROPEAN COUNTRIES
ML 1 ML 2 ML 3 ML 4 ML 5 ML 6 ML 7 ML 8 ML 9 ML 10
Romania a 10 1 2 2 1 7
b 34 719 113 148 1 400 654 1 787 309 147 500 287 188
c 34 719 113 148 2 061 028 22 333 181 684 158 316
Slovakia a 1 3 3 2
b 1 658 500 637 204 1 625 800 202 796
c 637 204 1 144 400
Slovenia a 10 1 3
b 433 911 37 520 381 972
c 136 836 344 346
Spain a 24 17 1 3 1 2 1 3
b 120 967 3 003 670 34 913 215 244 5 000 000 242 822 400 000 000 37 500
c 55 467 320 640 910 687 3 822 437 794 493 687 375 166 095
Sweden a 7 7 25 1 29 8 14 9
b
c
United Kingdom a 544 21 70 80 110 57 92 1 38 186
b 7 980 692 318 530 1 346 145 6 151 281 2 462 594 8 982 440 4 942 539 17 3 940 293 12 645 972
c
TOTAL PER MLcategory
a 3 830 90 756 191 351 738 127 113 111 401
b 77 922 892 61 401 716 70 253 379 62 111 253 68 354 981 280 661 491 12 045 064 7 362 938 501 997 400 259 945 580
c 8 533 257 1 615 792 15 381 737 5 660 156 26 637 836 22 531 062 96 454 1 193 012 166 095 7 310 608
d 44 1 11 6 2 2
e 1(5) 2(3)3(5) 4(3)
7(39)
1(1) 4(1) 1(1) 2(1)3(2) 4(1)
7(9)
3(2) 4(2)7(4)
1(1) 7(1) 1(2) 4(1)
30.12.2011RO
Jurnalul OficialalU
niunii EuropeneC
382/405EU ARMS EXPORTS PER REGION IN 2010
Key: (a) = number of licences issued, (b) = value of licences issued in Euros, (c) = value of arms exports in Euros (if available) (d) = total EU number of licence refusals (small discrepancies may appear between breakdowns and totals due to refusals concerning more than oneML item or refusals for items other than those appearing in the ML); (e) = criteria numbers on which refusals are based (the approximate number of times each criterion is invoked is indicated in brackets)

OTHER EUROPEAN COUNTRIES
ML 11 ML 12 ML 13 ML 14 ML 15 ML 16 ML 17 ML 18 ML 21 ML 22 TOTAL perdestination
Austria a 12 1 2 4 614
b 193 360 7 000 2 216 340 75 185 26 843 967
c 189 149 1 666 408 49 500 13 390 724
Belgium a 1 1 1 89
b 571 497 46 583 222 000 40 728 617
c
Bulgaria a 2 2 35
b 84 924 4 302 250 20 532 376
c 84 924 1 636 905 11 331 447
Czech Republic a 2 2 5 1 1 12 74
b 2 930 98 310 3 001 357 287 861 341 980 1 974 273 16 987 078
c 98 310 2 353 444 157 419 1 155 306 18 526 543
Denmark a 1 1 33 1 102
b 4 703 1 478 8 656 991 19 082 50 977 085
c
Estonia a 2 6
b 606 804 618 103
c 303 036 303 995
Finland a 5 10 41
b 95 800 606 545 9 335 181
c 98 000 46 842 10 658 335
France a 63 8 2 88 2 5 20 378
b 45 794 812 8 521 075 26 804 036 63 594 083 2 148 317 3 190 381 1 833 537 484 813 035
c 157 135 606
Germany a 100 15 17 18 71 31 128 26 78 4 520
b 21 943 918 7 810 065 7 184 756 2 697 509 6 632 997 4 044 199 3 199 062 1 792 956 2 440 948 408 765 691
c
C382/406
ROJurnalul O
ficialalUniunii Europene
30.12.2011EU ARMS EXPORTS PER REGION IN 2010
Key: (a) = number of licences issued, (b) = value of licences issued in Euros, (c) = value of arms exports in Euros (if available) (d) = total EU number of licence refusals (small discrepancies may appear between breakdowns and totals due to refusals concerning more than oneML item or refusals for items other than those appearing in the ML); (e) = criteria numbers on which refusals are based (the approximate number of times each criterion is invoked is indicated in brackets)
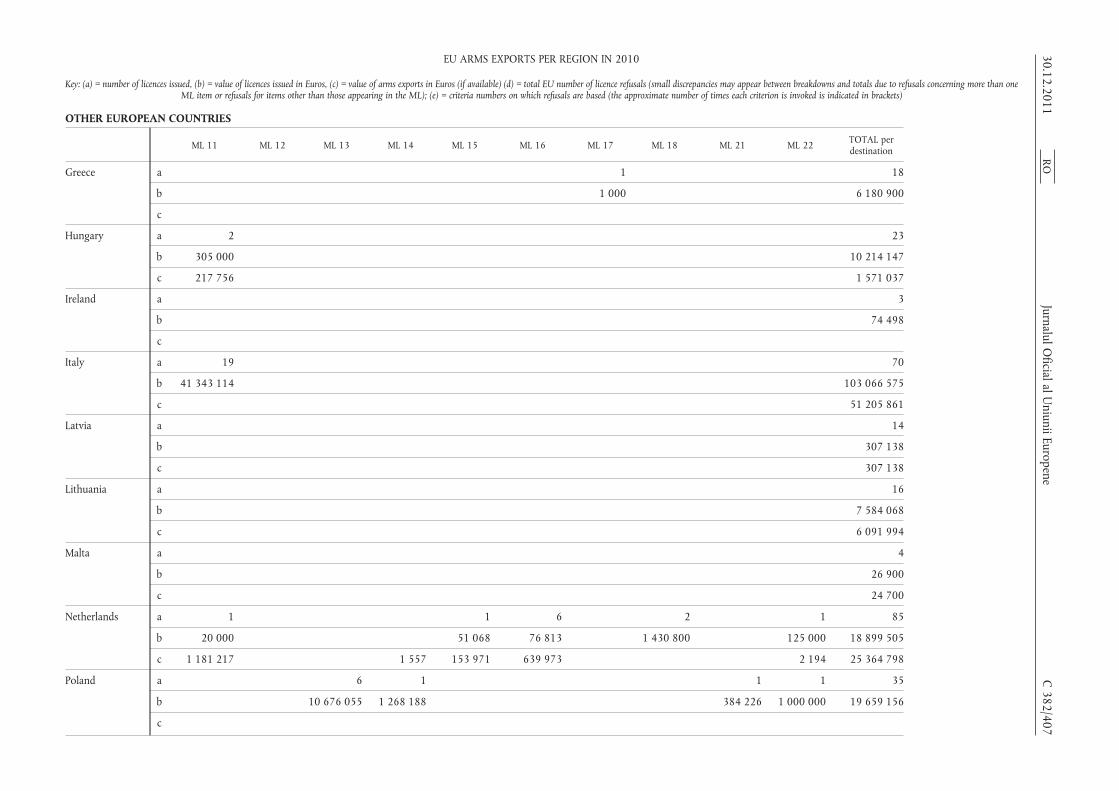
OTHER EUROPEAN COUNTRIES
ML 11 ML 12 ML 13 ML 14 ML 15 ML 16 ML 17 ML 18 ML 21 ML 22 TOTAL perdestination
Greece a 1 18
b 1 000 6 180 900
c
Hungary a 2 23
b 305 000 10 214 147
c 217 756 1 571 037
Ireland a 3
b 74 498
c
Italy a 19 70
b 41 343 114 103 066 575
c 51 205 861
Latvia a 14
b 307 138
c 307 138
Lithuania a 16
b 7 584 068
c 6 091 994
Malta a 4
b 26 900
c 24 700
Netherlands a 1 1 6 2 1 85
b 20 000 51 068 76 813 1 430 800 125 000 18 899 505
c 1 181 217 1 557 153 971 639 973 2 194 25 364 798
Poland a 6 1 1 1 35
b 10 676 055 1 268 188 384 226 1 000 000 19 659 156
c
30.12.2011RO
Jurnalul OficialalU
niunii EuropeneC
382/407EU ARMS EXPORTS PER REGION IN 2010
Key: (a) = number of licences issued, (b) = value of licences issued in Euros, (c) = value of arms exports in Euros (if available) (d) = total EU number of licence refusals (small discrepancies may appear between breakdowns and totals due to refusals concerning more than oneML item or refusals for items other than those appearing in the ML); (e) = criteria numbers on which refusals are based (the approximate number of times each criterion is invoked is indicated in brackets)

OTHER EUROPEAN COUNTRIES
ML 11 ML 12 ML 13 ML 14 ML 15 ML 16 ML 17 ML 18 ML 21 ML 22 TOTAL perdestination
Romania a 1 4 4 32
b 4 299 615 642 768 1 069 265 9 782 166
c 2 705 265 5 940 5 282 433
Slovakia a 1 2 12
b 75 800 938 863 5 138 963
c 14 400 938 863 2 734 867
Slovenia a 2 1 17
b 2 183 570 610 034 3 647 007
c 476 358 115 700 1 073 240
Spain a 1 1 54
b 408 655 116
c 23 387 216 30 144 410
Sweden a 2 1 1 104
b 18 068 582
c 27 330 986
United Kingdom a 88 49 5 41 1 32 45 6 158 1 624
b 12 742 595 7 573 983 27 115 1 813 175 13 180 1 507 900 37 097 2 200 029 521 008 75 206 584
c
TOTAL PER MLcategory
a 284 1 137 33 151 84 66 197 41 268 7 970
b 127 199 784 1 478 44 136 384 38 892 256 68 240 759 13 543 254 5 902 079 12 480 691 7 586 673 8 003 806 1 746 112 439
c 4 216 638 334 301 2 658 037 238 895 2 753 236 157 419 2 937 414 23 387 216 996 497 362 478 114
d 6 2 3 8 1 3 89
e 1(2) 2(1)4(1) 5(2)
7(2)
2(1) 3(1)4(1)
7(3) 7(8) 7(1) 7(3) 1(12) 2(6)3(10) 4(10)
5(2) 7(70)
C382/408
ROJurnalul O
ficialalUniunii Europene
30.12.2011EU ARMS EXPORTS PER REGION IN 2010
Key: (a) = number of licences issued, (b) = value of licences issued in Euros, (c) = value of arms exports in Euros (if available) (d) = total EU number of licence refusals (small discrepancies may appear between breakdowns and totals due to refusals concerning more than oneML item or refusals for items other than those appearing in the ML); (e) = criteria numbers on which refusals are based (the approximate number of times each criterion is invoked is indicated in brackets)
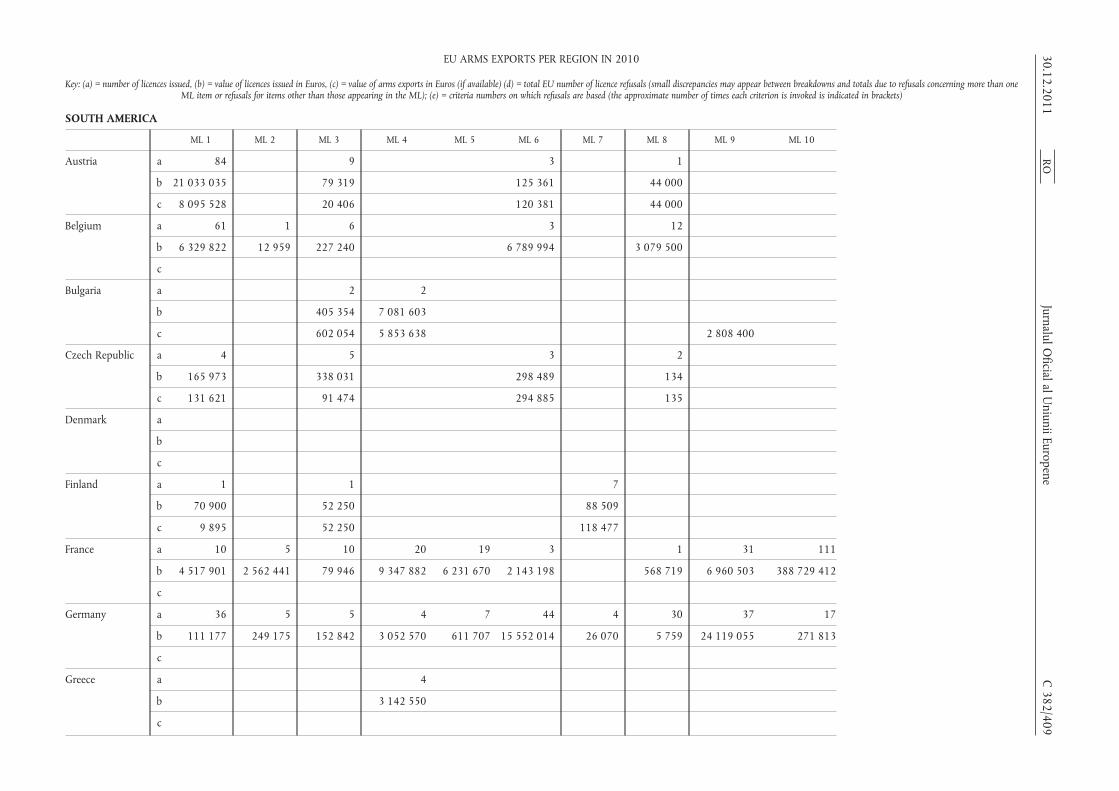
SOUTH AMERICA
ML 1 ML 2 ML 3 ML 4 ML 5 ML 6 ML 7 ML 8 ML 9 ML 10
Austria a 84 9 3 1
b 21 033 035 79 319 125 361 44 000
c 8 095 528 20 406 120 381 44 000
Belgium a 61 1 6 3 12
b 6 329 822 12 959 227 240 6 789 994 3 079 500
c
Bulgaria a 2 2
b 405 354 7 081 603
c 602 054 5 853 638 2 808 400
Czech Republic a 4 5 3 2
b 165 973 338 031 298 489 134
c 131 621 91 474 294 885 135
Denmark a
b
c
Finland a 1 1 7
b 70 900 52 250 88 509
c 9 895 52 250 118 477
France a 10 5 10 20 19 3 1 31 111
b 4 517 901 2 562 441 79 946 9 347 882 6 231 670 2 143 198 568 719 6 960 503 388 729 412
c
Germany a 36 5 5 4 7 44 4 30 37 17
b 111 177 249 175 152 842 3 052 570 611 707 15 552 014 26 070 5 759 24 119 055 271 813
c
Greece a 4
b 3 142 550
c
30.12.2011RO
Jurnalul OficialalU
niunii EuropeneC
382/409EU ARMS EXPORTS PER REGION IN 2010
Key: (a) = number of licences issued, (b) = value of licences issued in Euros, (c) = value of arms exports in Euros (if available) (d) = total EU number of licence refusals (small discrepancies may appear between breakdowns and totals due to refusals concerning more than oneML item or refusals for items other than those appearing in the ML); (e) = criteria numbers on which refusals are based (the approximate number of times each criterion is invoked is indicated in brackets)

SOUTH AMERICA
ML 1 ML 2 ML 3 ML 4 ML 5 ML 6 ML 7 ML 8 ML 9 ML 10
Italy a 1 7 3 8 8 1 2 1 14
b 761 346 578 3 705 729 29 834 029 13 243 794 2 389 754 94 924 10 912 11 161 984
c
Lithuania a 1
b 132 792
c 132 792
Netherlands a 1 13 11
b 40 334 899 129 528 922
c 40 2 868 395 90 268 619 870 000 54 846 544
Poland a 4
b 78 369
c
Portugal a 37
b 4 728 833
c 4 068 781
Romania a 1 4
b 4 608 132
c 84 760
Slovakia a 1
b 70 000
c 63 794
Slovenia a 1
b 222
c 222
Spain a 11 2 5 8 4 1 1 5
b 24 101 21 010 1 000 4 132 941 1 733 600 183 680 92 500 000 627 137 500
c 32 182 1 000 4 939 860 133 997 1 165 441 212 044 040 62 299 257
Sweden a 1 3 2 1 1 2
b
c
C382/410
ROJurnalul O
ficialalUniunii Europene
30.12.2011EU ARMS EXPORTS PER REGION IN 2010
Key: (a) = number of licences issued, (b) = value of licences issued in Euros, (c) = value of arms exports in Euros (if available) (d) = total EU number of licence refusals (small discrepancies may appear between breakdowns and totals due to refusals concerning more than oneML item or refusals for items other than those appearing in the ML); (e) = criteria numbers on which refusals are based (the approximate number of times each criterion is invoked is indicated in brackets)

SOUTH AMERICA
ML 1 ML 2 ML 3 ML 4 ML 5 ML 6 ML 7 ML 8 ML 9 ML 10
United Kingdom a 269 22 41 14 23 26 18 41 159
b 3 045 889 92 007 328 561 168 299 1 215 718 181 244 74 257 2 890 402 1 499 271
c
TOTAL PER MLcategory
a 479 45 91 61 71 88 31 49 148 326
b 35 299 559 3 284 170 5 370 534 56 829 874 21 637 787 29 213 654 283 760 3 881 792 131 209 704 1 163 148 196
c 8 269 226 767 446 13 725 687 90 268 619 1 419 263 118 477 1 209 576 218 921 221 117 363 353
d 9 2 1
e 2(1) 4(4)6(1) 7(9)
7(2) 4(1)
ML 11 ML 13 ML 14 ML 15 ML 16 ML 17 ML 18 ML 21 ML 22 TOTAL perdestination
Austria a 24 121
b 153 183 21 434 898
c 153 183 8 433 498
Belgium a 5 1 89
b 1 198 041 2 474 17 640 030
c
Bulgaria a 4
b 7 486 957
c 9 264 092
Czech Republic a 14
b 802 627
c 518 115
Denmark a 2 2
b 1 393 133 1 393 133
c
30.12.2011RO
Jurnalul OficialalU
niunii EuropeneC
382/411EU ARMS EXPORTS PER REGION IN 2010
Key: (a) = number of licences issued, (b) = value of licences issued in Euros, (c) = value of arms exports in Euros (if available) (d) = total EU number of licence refusals (small discrepancies may appear between breakdowns and totals due to refusals concerning more than oneML item or refusals for items other than those appearing in the ML); (e) = criteria numbers on which refusals are based (the approximate number of times each criterion is invoked is indicated in brackets)

SOUTH AMERICA
ML 11 ML 13 ML 14 ML 15 ML 16 ML 17 ML 18 ML 21 ML 22 TOTAL perdestination
Finland a 9
b 211 659
c 180 622
France a 54 4 1 35 2 10 316
b 34 988 526 2 233 495 5 019 11 194 944 20 127 21 927 735 491 511 518
c 133 742 882
Germany a 37 6 3 2 4 8 3 2 8 262
b 3 814 541 366 326 346 000 648 702 41 385 303 348 308 541 21 035 542 300 50 544 360
c
Greece a 6 10
b 276 560 3 419 110
c
Italy a 1 1 47
b 23 307 914 142 61 725 914
c 40 408 152
Lithuania a 1
b 132 792
c 132 792
Netherlands a 1 1 27
b 89 772 020 20 000 219 655 881
c 148 853 598
Poland a 1 5
b 834 79 203
c
Portugal a 1 38
b 44 211 4 773 044
c 44 211 4 112 992
C382/412
ROJurnalul O
ficialalUniunii Europene
30.12.2011EU ARMS EXPORTS PER REGION IN 2010
Key: (a) = number of licences issued, (b) = value of licences issued in Euros, (c) = value of arms exports in Euros (if available) (d) = total EU number of licence refusals (small discrepancies may appear between breakdowns and totals due to refusals concerning more than oneML item or refusals for items other than those appearing in the ML); (e) = criteria numbers on which refusals are based (the approximate number of times each criterion is invoked is indicated in brackets)
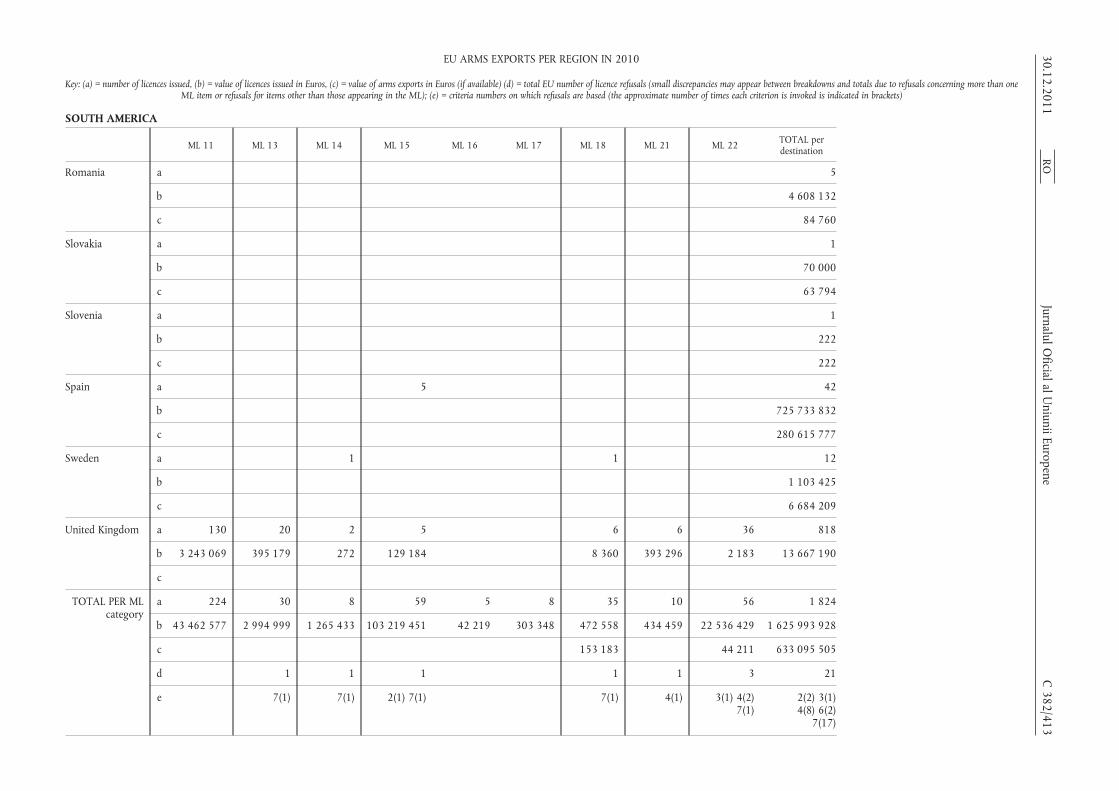
SOUTH AMERICA
ML 11 ML 13 ML 14 ML 15 ML 16 ML 17 ML 18 ML 21 ML 22 TOTAL perdestination
Romania a 5
b 4 608 132
c 84 760
Slovakia a 1
b 70 000
c 63 794
Slovenia a 1
b 222
c 222
Spain a 5 42
b 725 733 832
c 280 615 777
Sweden a 1 1 12
b 1 103 425
c 6 684 209
United Kingdom a 130 20 2 5 6 6 36 818
b 3 243 069 395 179 272 129 184 8 360 393 296 2 183 13 667 190
c
TOTAL PER MLcategory
a 224 30 8 59 5 8 35 10 56 1 824
b 43 462 577 2 994 999 1 265 433 103 219 451 42 219 303 348 472 558 434 459 22 536 429 1 625 993 928
c 153 183 44 211 633 095 505
d 1 1 1 1 1 3 21
e 7(1) 7(1) 2(1) 7(1) 7(1) 4(1) 3(1) 4(2)7(1)
2(2) 3(1)4(8) 6(2)
7(17)
30.12.2011RO
Jurnalul OficialalU
niunii EuropeneC
382/413EU ARMS EXPORTS PER REGION IN 2010
Key: (a) = number of licences issued, (b) = value of licences issued in Euros, (c) = value of arms exports in Euros (if available) (d) = total EU number of licence refusals (small discrepancies may appear between breakdowns and totals due to refusals concerning more than oneML item or refusals for items other than those appearing in the ML); (e) = criteria numbers on which refusals are based (the approximate number of times each criterion is invoked is indicated in brackets)

SOUTH ASIA
ML 1 ML 2 ML 3 ML 4 ML 5 ML 6 ML 7 ML 8 ML 9 ML 10
Austria a 8 23 2
b 541 986 131 235 1 510 634
c 534 422 43 447 510 634
Belgium a 12 1 1 5
b 1 014 097 3 116 1 099 071 2 683 562
c
Bulgaria a 8 10 8 15 1
b 25 555 371 5 889 547 3 887 499 21 326 400 92 336
c 1 702 115 5 746 487 11 882 168 35 465 527 92 336 1 308 901
Czech Republic a 7 6 1 2 18 3 32
b 989 128 955 146 19 929 31 159 706 6 870 799
c 874 556 1 459 528 18 403 29 433 512 2 223 015
Finland a 1
b 198 780
c 5 000
France a 4 2 4 59 50 7 9 100 539
b 268 019 1 830 215 594 98 368 864 132 680 679 14 107 504 2 108 200 323 178 633 292 173 424
c
Germany a 43 3 22 34 28 91 23 39 86 25
b 3 698 422 1 397 721 444 546 52 911 876 22 399 943 44 479 702 251 375 5 408 14 571 542 12 795 102
c
Greece a 4 2 3 1
b 769 166 74 216 18 660 6 763
c
Hungary a 2
b 1 550 000
c 450 109
Ireland a 1
b 26 205
c
C382/414
ROJurnalul O
ficialalUniunii Europene
30.12.2011EU ARMS EXPORTS PER REGION IN 2010
Key: (a) = number of licences issued, (b) = value of licences issued in Euros, (c) = value of arms exports in Euros (if available) (d) = total EU number of licence refusals (small discrepancies may appear between breakdowns and totals due to refusals concerning more than oneML item or refusals for items other than those appearing in the ML); (e) = criteria numbers on which refusals are based (the approximate number of times each criterion is invoked is indicated in brackets)

SOUTH ASIA
ML 1 ML 2 ML 3 ML 4 ML 5 ML 6 ML 7 ML 8 ML 9 ML 10
Italy a 19 6 6 12 1 3 1 24
b 12 109 818 846 800 89 924 149 17 085 033 1 176 285 1 033 607 57 285 10 564 975
c
Latvia a 4
b 7 114 473
c 7 114 473
Lithuania a 4
b 7 960 546
c 1 534 141
Netherlands a 23 4 2
b 1 041 834 3 501 466 24 591
c 9 187 362 749 815 23 446
Poland a 6 2 2 2 3 69 2 3 25
b 3 207 429 107 188 155 000 156 500 243 277 17 164 904 47 880 112 981 2 278 945
c
Romania a 3 12 22
b 1 391 158 20 107 899 10 381 913
c 779 821 7 346 311 2 343 416
Slovakia a 4 1 4 10 3
b 241 661 1 194 000 1 370 000 188 753
c 94 529 1 040 305 477 742 154 382
Slovenia a 1
b 845 582
c 1 995 103
Spain a 3 3
b 749 315 2 462 753
c 160 000 1 357 952 390 045
Sweden a 2 1 10
b
c
30.12.2011RO
Jurnalul OficialalU
niunii EuropeneC
382/415EU ARMS EXPORTS PER REGION IN 2010
Key: (a) = number of licences issued, (b) = value of licences issued in Euros, (c) = value of arms exports in Euros (if available) (d) = total EU number of licence refusals (small discrepancies may appear between breakdowns and totals due to refusals concerning more than oneML item or refusals for items other than those appearing in the ML); (e) = criteria numbers on which refusals are based (the approximate number of times each criterion is invoked is indicated in brackets)

SOUTH ASIA
ML 1 ML 2 ML 3 ML 4 ML 5 ML 6 ML 7 ML 8 ML 9 ML 10
United Kingdom a 180 43 41 276 188 33 127 1 342 990
b 2 268 724 437 640 809 597 10 783 946 12 881 313 13 467 350 1 475 841 34 586 815 42 737 612 12 270 844
c
TOTAL PER MLcategory
a 275 86 127 401 319 234 167 41 539 1 679
b 39 703 501 20 188 522 27 627 533 275 415 048 188 388 997 124 454 745 4 916 903 34 791 003 386 622 273 366 890 895
c 3 890 914 5 841 016 20 731 454 36 665 832 11 293 204 31 730 789 5 000 2 107 767 14 233 027
d 30 1 6 1 1 1 1
e 2(10) 3(5)4(13) 6(5)
7(23)
4(1) 7(1) 2(2) 7(6) 2(1) 3(1) 7(1)8(1)
1(1) 7(1) 3(1)
ML 11 ML 13 ML 14 ML 15 ML 16 ML 17 ML 18 ML 21 ML 22 TOTAL perdestination
Austria a 2 35
b 37 378 2 221 233
c 1 088 503
Belgium a 1 1 3 24
b 2 684 1 900 000 4 748 558 11 451 088
c
Bulgaria a 2 44
b 5 382 56 756 535
c 262 800 1 400 56 461 733
Czech Republic a 5 3 1 2 80
b 17 531 1 494 662 104 743 41 611 644
c 1 313 703 25 258 1 857 696 37 205 671
Finland a 1 3 5
b 1 190 66 600 266 570
c 1 190 59 650 65 840
C382/416
ROJurnalul O
ficialalUniunii Europene
30.12.2011EU ARMS EXPORTS PER REGION IN 2010
Key: (a) = number of licences issued, (b) = value of licences issued in Euros, (c) = value of arms exports in Euros (if available) (d) = total EU number of licence refusals (small discrepancies may appear between breakdowns and totals due to refusals concerning more than oneML item or refusals for items other than those appearing in the ML); (e) = criteria numbers on which refusals are based (the approximate number of times each criterion is invoked is indicated in brackets)

SOUTH ASIA
ML 11 ML 13 ML 14 ML 15 ML 16 ML 17 ML 18 ML 21 ML 22 TOTAL perdestination
France a 82 5 1 55 4 13 42 976
b 87 674 680 6 298 183 142 373 47 458 424 838 412 46 889 265 23 041 984 1 075 446 068
c 374 334 554
Germany a 51 9 3 7 4 7 13 17 58 563
b 40 414 934 3 145 562 3 827 228 787 491 152 992 11 718 844 10 461 284 2 166 811 2 216 829 227 847 612
c
Greece a 2 5 17
b 50 581 153 320 1 072 706
c
Hungary a 5 7
b 2 650 000 4 200 000
c 581 852 1 031 961
Ireland a 1
b 26 205
c
Italy a 12 1 3 88
b 20 985 377 38 429 4 370 456 158 192 213
c 25 707 541
Latvia a 4
b 7 114 473
c 7 114 473
Lithuania a 2 6
b 422 670 8 383 216
c 422 670 1 956 811
Netherlands a 29
b 4 567 891
c 1 086 000 40 850 250 11 087 723
30.12.2011RO
Jurnalul OficialalU
niunii EuropeneC
382/417EU ARMS EXPORTS PER REGION IN 2010
Key: (a) = number of licences issued, (b) = value of licences issued in Euros, (c) = value of arms exports in Euros (if available) (d) = total EU number of licence refusals (small discrepancies may appear between breakdowns and totals due to refusals concerning more than oneML item or refusals for items other than those appearing in the ML); (e) = criteria numbers on which refusals are based (the approximate number of times each criterion is invoked is indicated in brackets)

SOUTH ASIA
ML 11 ML 13 ML 14 ML 15 ML 16 ML 17 ML 18 ML 21 ML 22 TOTAL perdestination
Poland a 1 115
b 24 781 23 498 885
c
Romania a 1 38
b 226 296 32 107 266
c 10 469 548
Slovakia a 2 24
b 21 687 3 016 101
c 17 851 1 784 809
Slovenia a 1
b 845 582
c 1 995 103
Spain a 5 1 5 17
b 61 585 344 1 300 000 25 825 000 91 922 412
c 11 702 730 680 673 14 291 400
Sweden a 13
b 28 858 803
c 216 016 636
United Kingdom a 579 95 43 42 8 29 41 46 85 3 189
b 18 073 347 3 556 212 1 679 408 2 097 005 145 854 587 033 1 220 773 502 915 2 806 645 162 388 874
c
TOTAL PER MLcategory
a 742 114 53 116 13 42 61 77 190 5 276
b 231 825 073 13 117 137 8 672 651 78 221 240 323 627 13 149 671 16 572 736 49 597 421 32 457 600 1 941 795 377
c 14 057 242 59 650 1 313 703 680 673 1 400 25 258 40 850 1 875 797 760 612 307
d 2 1 2 1 8 1 58
e 1(1) 3(1) 7(1) 2(1) 3(1)7(1)
3(1) 4(1)7(1)
1(1) 2(2)3(6) 4(4)
7(7)
4(1) 7(1) 1(3) 2(18)3(18) 4(20)
6(5) 7(44)8(1)
C382/418
ROJurnalul O
ficialalUniunii Europene
30.12.2011EU ARMS EXPORTS PER REGION IN 2010
Key: (a) = number of licences issued, (b) = value of licences issued in Euros, (c) = value of arms exports in Euros (if available) (d) = total EU number of licence refusals (small discrepancies may appear between breakdowns and totals due to refusals concerning more than oneML item or refusals for items other than those appearing in the ML); (e) = criteria numbers on which refusals are based (the approximate number of times each criterion is invoked is indicated in brackets)

SOUTH EAST ASIA
ML 1 ML 2 ML 3 ML 4 ML 5 ML 6 ML 7 ML 8 ML 9 ML 10
Austria a 59 36 4 2 2 8 2
b 950 263 528 957 456 602 104 000 250 103 11 481 410 2 034 642
c 525 728 306 957 1 417 118 104 000 250 103 3 569 822
Belgium a 20 1 8 1 4 2
b 6 398 346 65 025 18 488 243 805 000 2 989 262 574 889
c
Bulgaria a 1 5 4 3
b 6 000 576 328 312 300 4 618 838
c 2 000 572 328 306 300 3 288 488
Czech Republic a 58 1 10 2 3 2 1 12
b 8 563 987 639 504 5 733 490 150 258 3 525 016
c 5 313 185 250 421 3 915 347 195 532 983 268
Denmark a 1
b 155 883
c
Finland a 2 4 1
b 19 910 40 003 456 069
c 28 280 41 991 456 069
France a 2 5 5 52 71 21 2 31 33
b 2 072 1 813 609 1 977 967 164 991 479 121 218 995 2 255 904 198 083 139 119 384 22 913 106
c
Germany a 83 8 23 9 17 55 22 10 25 25
b 27 404 729 20 786 760 1 588 007 582 096 3 913 997 20 172 005 4 103 384 1 310 9 998 845 5 623 054
c
30.12.2011RO
Jurnalul OficialalU
niunii EuropeneC
382/419EU ARMS EXPORTS PER REGION IN 2010
Key: (a) = number of licences issued, (b) = value of licences issued in Euros, (c) = value of arms exports in Euros (if available) (d) = total EU number of licence refusals (small discrepancies may appear between breakdowns and totals due to refusals concerning more than oneML item or refusals for items other than those appearing in the ML); (e) = criteria numbers on which refusals are based (the approximate number of times each criterion is invoked is indicated in brackets)
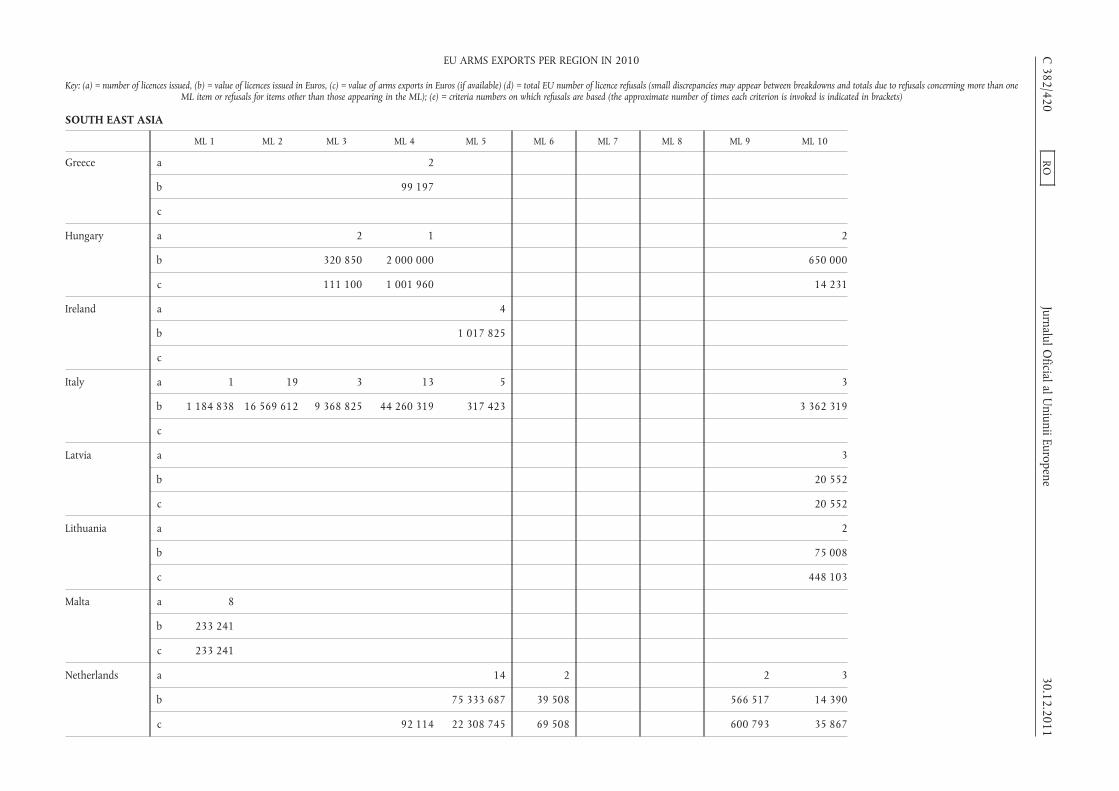
SOUTH EAST ASIA
ML 1 ML 2 ML 3 ML 4 ML 5 ML 6 ML 7 ML 8 ML 9 ML 10
Greece a 2
b 99 197
c
Hungary a 2 1 2
b 320 850 2 000 000 650 000
c 111 100 1 001 960 14 231
Ireland a 4
b 1 017 825
c
Italy a 1 19 3 13 5 3
b 1 184 838 16 569 612 9 368 825 44 260 319 317 423 3 362 319
c
Latvia a 3
b 20 552
c 20 552
Lithuania a 2
b 75 008
c 448 103
Malta a 8
b 233 241
c 233 241
Netherlands a 14 2 2 3
b 75 333 687 39 508 566 517 14 390
c 92 114 22 308 745 69 508 600 793 35 867
C382/420
ROJurnalul O
ficialalUniunii Europene
30.12.2011EU ARMS EXPORTS PER REGION IN 2010
Key: (a) = number of licences issued, (b) = value of licences issued in Euros, (c) = value of arms exports in Euros (if available) (d) = total EU number of licence refusals (small discrepancies may appear between breakdowns and totals due to refusals concerning more than oneML item or refusals for items other than those appearing in the ML); (e) = criteria numbers on which refusals are based (the approximate number of times each criterion is invoked is indicated in brackets)

SOUTH EAST ASIA
ML 1 ML 2 ML 3 ML 4 ML 5 ML 6 ML 7 ML 8 ML 9 ML 10
Poland a 2 1 11 18 12
b 500 539 275 300 9 494 952 22 136 241 1 966 171
c
Romania a 4 5 3
b 732 134 774 119 2 242 154
c 691 175 747 341 2 242 154
Slovakia a 1 1 1
b 220 000 118 688
c 220 000 109 688
Slovenia a 1
b
c
Spain a 5 1 1 5 5 2
b 53 559 288 836 4 101 118 18 729 415 125
c 8 624 466 036 2 445 118 22 888 16 382 650 876
Sweden a 2 6 3 4 1 2 2 4
b
c
United Kingdom a 271 67 31 217 98 556 356 2 116 360
b 5 143 979 1 270 281 967 378 5 267 437 7 572 758 7 825 901 5 077 980 51 3 544 122 34 946 634
c
TOTAL PER MLcategory
a 512 150 100 312 227 673 386 19 176 469
b 50 435 553 42 336 514 35 177 733 222 742 947 219 275 623 74 400 715 9 419 451 3 140 881 153 228 868 78 819 129
c 6 080 778 1 466 168 3 126 588 4 169 492 22 581 736 10 969 235 41 991 195 532 600 793 4 851 120
d 12 2 3 3 2
e 2(9) 3(3)7(5)
2(2) 2(3) 7(1) 2(1) 3(1)7(2)
2(2) 3(2)
30.12.2011RO
Jurnalul OficialalU
niunii EuropeneC
382/421EU ARMS EXPORTS PER REGION IN 2010
Key: (a) = number of licences issued, (b) = value of licences issued in Euros, (c) = value of arms exports in Euros (if available) (d) = total EU number of licence refusals (small discrepancies may appear between breakdowns and totals due to refusals concerning more than oneML item or refusals for items other than those appearing in the ML); (e) = criteria numbers on which refusals are based (the approximate number of times each criterion is invoked is indicated in brackets)

SOUTH EAST ASIA
ML 11 ML 13 ML 14 ML 15 ML 16 ML 17 ML 18 ML 21 ML 22 TOTAL perdestination
Austria a 2 1 2 7 125
b 69 553 631 766 257 400 38 963 16 803 659
c 250 566 38 963 6 463 257
Belgium a 2 38
b 1 171 908 30 492 673
c
Bulgaria a 1 1 15
b 75 900 32 900 5 622 267
c 75 900 4 245 016
Czech Republic a 10 1 1 2 103
b 375 041 430 705 102 304 19 520 305
c 313 795 481 881 96 026 166 11 549 621
Denmark a 1 1 3
b 3 374 051 1 905 261 5 435 195
c
Finland a 4 11
b 134 100 650 082
c 134 140 660 480
France a 98 6 7 87 5 9 25 459
b 103 463 106 3 885 118 4 526 002 31 141 197 3 252 070 40 536 090 8 122 390 649 416 572
c 190 078 696
Germany a 56 13 5 4 3 15 10 17 31 431
b 12 562 851 1 362 525 6 795 671 281 520 476 047 451 299 439 719 1 483 119 1 886 704 119 913 642
c
Greece a 1 3
b 29 000 128 197
c
C382/422
ROJurnalul O
ficialalUniunii Europene
30.12.2011EU ARMS EXPORTS PER REGION IN 2010
Key: (a) = number of licences issued, (b) = value of licences issued in Euros, (c) = value of arms exports in Euros (if available) (d) = total EU number of licence refusals (small discrepancies may appear between breakdowns and totals due to refusals concerning more than oneML item or refusals for items other than those appearing in the ML); (e) = criteria numbers on which refusals are based (the approximate number of times each criterion is invoked is indicated in brackets)

SOUTH EAST ASIA
ML 11 ML 13 ML 14 ML 15 ML 16 ML 17 ML 18 ML 21 ML 22 TOTAL perdestination
Hungary a 1 1 7
b 11 500 1 520 000 4 502 350
c 11 500 1 138 791
Ireland a 4
b 1 017 825
c
Italy a 3 2 1 50
b 20 949 251 2 115 989 1 914 98 130 491
c 3 181 883
Latvia a 3
b 20 552
c 20 552
Lithuania a 2
b 75 008
c 448 103
Malta a 8
b 233 241
c 233 241
Netherlands a 2 1 2 26
b 189 383 123 050 100 000 76 366 535
c 189 383 1 000 7 000 23 304 410
Poland a 1 1 2 48
b 22 300 23 308 46 201 137 80 619 948
c
Romania a 12
b 3 748 407
c 3 680 670
30.12.2011RO
Jurnalul OficialalU
niunii EuropeneC
382/423EU ARMS EXPORTS PER REGION IN 2010
Key: (a) = number of licences issued, (b) = value of licences issued in Euros, (c) = value of arms exports in Euros (if available) (d) = total EU number of licence refusals (small discrepancies may appear between breakdowns and totals due to refusals concerning more than oneML item or refusals for items other than those appearing in the ML); (e) = criteria numbers on which refusals are based (the approximate number of times each criterion is invoked is indicated in brackets)

SOUTH EAST ASIA
ML 11 ML 13 ML 14 ML 15 ML 16 ML 17 ML 18 ML 21 ML 22 TOTAL perdestination
Slovakia a 1 1 5
b 338 688
c 329 688
Slovenia a 1
b
c
Spain a 1 3 23
b 22 888 4 900 255
c 3 609 924
Sweden a 2 2 28
b 739 825 151
c 134 957 347
United Kingdom a 206 44 69 37 2 19 36 36 61 2 584
b 6 146 882 1 500 377 1 140 935 1 304 437 34 622 120 550 350 841 99 619 285 842 82 600 628
c
TOTAL PER MLcategory
a 385 64 88 140 5 41 56 65 121 3 989
b 147 373 918 8 653 281 15 155 660 34 615 616 510 669 4 081 320 2 451 827 42 120 742 56 596 073 1 940 361 671
c 724 718 482 881 250 566 134 989 7 166 383 901 679
d 1 1 1 1 28
e 2(1) 3(1) 2(1) 3(1) 1(1) 7(1) 1(1) 2(19)3(8) 7(11)
C382/424
ROJurnalul O
ficialalUniunii Europene
30.12.2011EU ARMS EXPORTS PER REGION IN 2010
Key: (a) = number of licences issued, (b) = value of licences issued in Euros, (c) = value of arms exports in Euros (if available) (d) = total EU number of licence refusals (small discrepancies may appear between breakdowns and totals due to refusals concerning more than oneML item or refusals for items other than those appearing in the ML); (e) = criteria numbers on which refusals are based (the approximate number of times each criterion is invoked is indicated in brackets)
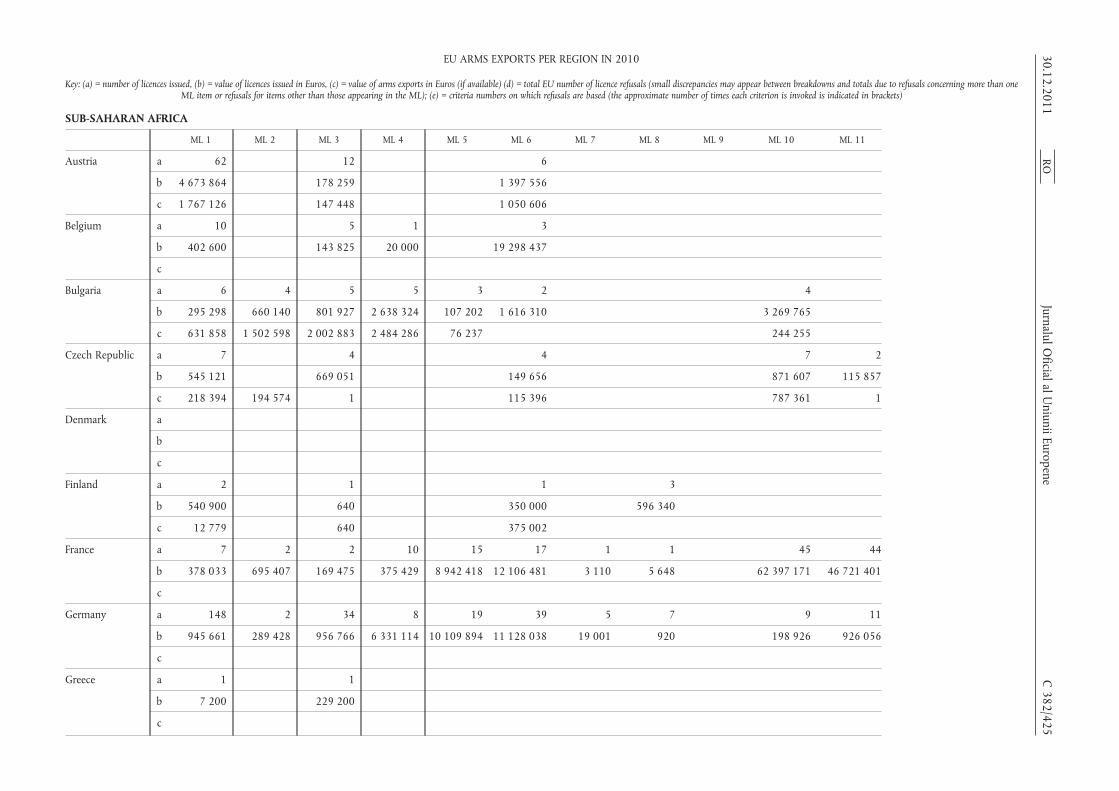
SUB-SAHARAN AFRICA
ML 1 ML 2 ML 3 ML 4 ML 5 ML 6 ML 7 ML 8 ML 9 ML 10 ML 11
Austria a 62 12 6
b 4 673 864 178 259 1 397 556
c 1 767 126 147 448 1 050 606
Belgium a 10 5 1 3
b 402 600 143 825 20 000 19 298 437
c
Bulgaria a 6 4 5 5 3 2 4
b 295 298 660 140 801 927 2 638 324 107 202 1 616 310 3 269 765
c 631 858 1 502 598 2 002 883 2 484 286 76 237 244 255
Czech Republic a 7 4 4 7 2
b 545 121 669 051 149 656 871 607 115 857
c 218 394 194 574 1 115 396 787 361 1
Denmark a
b
c
Finland a 2 1 1 3
b 540 900 640 350 000 596 340
c 12 779 640 375 002
France a 7 2 2 10 15 17 1 1 45 44
b 378 033 695 407 169 475 375 429 8 942 418 12 106 481 3 110 5 648 62 397 171 46 721 401
c
Germany a 148 2 34 8 19 39 5 7 9 11
b 945 661 289 428 956 766 6 331 114 10 109 894 11 128 038 19 001 920 198 926 926 056
c
Greece a 1 1
b 7 200 229 200
c
30.12.2011RO
Jurnalul OficialalU
niunii EuropeneC
382/425EU ARMS EXPORTS PER REGION IN 2010
Key: (a) = number of licences issued, (b) = value of licences issued in Euros, (c) = value of arms exports in Euros (if available) (d) = total EU number of licence refusals (small discrepancies may appear between breakdowns and totals due to refusals concerning more than oneML item or refusals for items other than those appearing in the ML); (e) = criteria numbers on which refusals are based (the approximate number of times each criterion is invoked is indicated in brackets)

SUB-SAHARAN AFRICA
ML 1 ML 2 ML 3 ML 4 ML 5 ML 6 ML 7 ML 8 ML 9 ML 10 ML 11
Hungary a 1 6
b 8 900 13 800 000
c 8 900
Italy a 1 6 1 1 1 4
b 412 581 1 092 657 488 000 70 785 270 945 15 121 587
c
Lithuania a 1
b 1 752 218
c 1 752 218
Malta a 9 6
b 103 919 48 100
c 100 254 37 952
Netherlands a 9 2 3 1
b 9 250 2 99 472 1 980 728
c 5 650 59 904
Portugal a 1 1 52
b 13 100 1 900 6 683 256
c 13 100 1 900 6 347 726
Romania a 5 6 1 2
b 112 315 1 275 006 3 017 378 422
c 95 720 1 842 194 3 017 45 244 308 600
Slovakia a 3 2 2 5 2 2
b 1 226 328 165 821 848 660 1 626 003 238 379 1 124 225
c 227 256 612 822 80 090 225 868 54 900
Spain a 19 2 1 2
b 323 889 310 110 000 37 500
c 24 201 470 621 000 1 364 907 1 709 747
C382/426
ROJurnalul O
ficialalUniunii Europene
30.12.2011EU ARMS EXPORTS PER REGION IN 2010
Key: (a) = number of licences issued, (b) = value of licences issued in Euros, (c) = value of arms exports in Euros (if available) (d) = total EU number of licence refusals (small discrepancies may appear between breakdowns and totals due to refusals concerning more than oneML item or refusals for items other than those appearing in the ML); (e) = criteria numbers on which refusals are based (the approximate number of times each criterion is invoked is indicated in brackets)
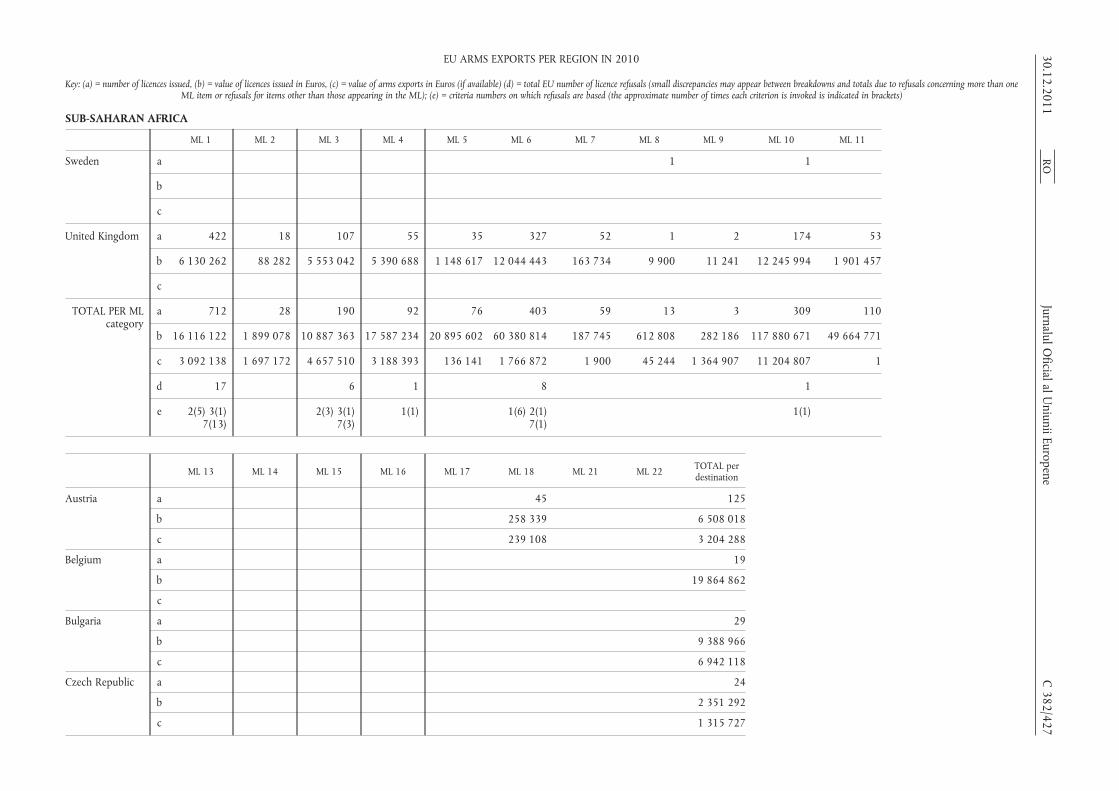
SUB-SAHARAN AFRICA
ML 1 ML 2 ML 3 ML 4 ML 5 ML 6 ML 7 ML 8 ML 9 ML 10 ML 11
Sweden a 1 1
b
c
United Kingdom a 422 18 107 55 35 327 52 1 2 174 53
b 6 130 262 88 282 5 553 042 5 390 688 1 148 617 12 044 443 163 734 9 900 11 241 12 245 994 1 901 457
c
TOTAL PER MLcategory
a 712 28 190 92 76 403 59 13 3 309 110
b 16 116 122 1 899 078 10 887 363 17 587 234 20 895 602 60 380 814 187 745 612 808 282 186 117 880 671 49 664 771
c 3 092 138 1 697 172 4 657 510 3 188 393 136 141 1 766 872 1 900 45 244 1 364 907 11 204 807 1
d 17 6 1 8 1
e 2(5) 3(1)7(13)
2(3) 3(1)7(3)
1(1) 1(6) 2(1)7(1)
1(1)
ML 13 ML 14 ML 15 ML 16 ML 17 ML 18 ML 21 ML 22 TOTAL perdestination
Austria a 45 125
b 258 339 6 508 018
c 239 108 3 204 288
Belgium a 19
b 19 864 862
c
Bulgaria a 29
b 9 388 966
c 6 942 118
Czech Republic a 24
b 2 351 292
c 1 315 727
30.12.2011RO
JurnalulOficialalU
niuniiEuropeneC
382/427EU ARMS EXPORTS PER REGION IN 2010
Key: (a) = number of licences issued, (b) = value of licences issued in Euros, (c) = value of arms exports in Euros (if available) (d) = total EU number of licence refusals (small discrepancies may appear between breakdowns and totals due to refusals concerning more than oneML item or refusals for items other than those appearing in the ML); (e) = criteria numbers on which refusals are based (the approximate number of times each criterion is invoked is indicated in brackets)

SUB-SAHARAN AFRICA
ML 13 ML 14 ML 15 ML 16 ML 17 ML 18 ML 21 ML 22 TOTAL perdestination
Denmark a 2 2
b 378 284 378 284
c
Finland a 3 1 11
b 22 068 193 000 1 702 948
c 103 810 250 500 742 731
France a 12 1 39 1 1 13 211
b 1 083 059 22 869 9 843 226 53 085 10 617 208 064 143 015 493
c 53 475 558
Germany a 2 6 6 5 4 6 10 321
b 59 814 2 273 199 222 540 194 703 22 867 236 018 908 600 34 823 545
c
Greece a 2
b 236 400
c
Hungary a 7
b 13 808 900
c 8 900
Italy a 14
b 17 456 555
c 7 802 894
Lithuania a 1
b 1 752 218
c 1 752 218
Malta a 15
b 152 019
c 138 206
C382/428
ROJurnalul O
ficialalUniunii Europene
30.12.2011EU ARMS EXPORTS PER REGION IN 2010
Key: (a) = number of licences issued, (b) = value of licences issued in Euros, (c) = value of arms exports in Euros (if available) (d) = total EU number of licence refusals (small discrepancies may appear between breakdowns and totals due to refusals concerning more than oneML item or refusals for items other than those appearing in the ML); (e) = criteria numbers on which refusals are based (the approximate number of times each criterion is invoked is indicated in brackets)

SUB-SAHARAN AFRICA
ML 13 ML 14 ML 15 ML 16 ML 17 ML 18 ML 21 ML 22 TOTAL perdestination
Netherlands a 1 16
b 18 901 2 108 353
c 240 10 000 75 794
Portugal a 1 55
b 28 600 6 726 856
c 28 600 6 391 326
Romania a 14
b 1 768 760
c 2 294 775
Slovakia a 16
b 5 229 416
c 1 200 936
Spain a 24
b 471 699
c 3 720 325
Sweden a 2
b 1 043 144
c 112 597 015
United Kingdom a 36 22 20 4 7 1 9 22 1 367
b 773 154 472 392 959 466 23 400 315 899 12 870 192 643 15 455 47 452 938
c
TOTAL PER MLcategory
a 57 23 65 10 12 51 18 45 2 275
b 2 363 880 495 261 13 075 891 245 940 510 602 347 161 642 178 1 132 119 316 240 668
c 132 410 239 108 250 740 10 000 201 662 810
d 5 1 3 46
e 1(2) 2(3)6(1) 7(2)
8(1)
3(1) 7(1)8(1)
2(2) 7(1) 1(12) 2(15)3(3) 6(1)
7(23) 8(2)
30.12.2011RO
Jurnalul OficialalU
niunii EuropeneC
382/429EU ARMS EXPORTS PER REGION IN 2010
Key: (a) = number of licences issued, (b) = value of licences issued in Euros, (c) = value of arms exports in Euros (if available) (d) = total EU number of licence refusals (small discrepancies may appear between breakdowns and totals due to refusals concerning more than oneML item or refusals for items other than those appearing in the ML); (e) = criteria numbers on which refusals are based (the approximate number of times each criterion is invoked is indicated in brackets)

WORLDWIDE
ML 1 ML 2 ML 3 ML 4 ML 5 ML 6 ML 7 ML 8 ML 9 ML 10
Austria a 1 261 51 252 14 7 128 7 3 4
b 207 770 833 15 300 192 59 487 728 13 465 771 26 902 845 1 363 847 564 70 895 944 000 3 468 142
c 132 042 254 11 037 920 68 735 208 6 321 834 3 179 345 135 438 261 60 895 49 728
d 39 2
e 2(9) 3(2)4(16) 6(5)
7(37)
3(1) 4(1)7(2)
Belgium a 666 24 4 19 5 42 1 124 6 219
b 231 006 997 12 870 170 84 519 003 8 309 209 3 393 574 300 037 242 2 571 660 45 491 621 120 834 145 441 387
c
d 2 2 1
e 2(1) 3(2)7(1)
2(2) 3(1)8(1)
7(1)
Bulgaria a 47 39 85 79 16 26 6 10 7
b 41 245 935 9 427 281 93 047 433 84 801 406 3 754 422 16 783 225 236 495 10 269 274 3 646 647
c 16 781 173 12 665 582 84 861 528 111 569 266 1 417 028 12 118 752 553 433 7 857 116 646 637
d 1 1
e 1(1) 1(1)
Czech Republic a 169 32 135 38 12 157 25 36 205
b 15 752 678 6 368 202 49 247 689 4 944 918 244 734 207 418 997 1 953 793 3 352 916 129 616 594
c 12 445 445 5 798 639 40 422 793 11 604 718 977 739 68 627 359 703 517 2 431 329 42 285 430
d 4 2
e 2(1) 3(1)7(3)
2(1) 3(1)7(1)
Denmark a 19 8 26 36 37 14 1 1 101
b 12 239 736 18 445 609 2 220 923 12 776 590 41 153 934 36 796 748 1 733 521 174 756 298
c
d
e
C382/430
ROJurnalul O
ficialalUniunii Europene
30.12.2011EU ARMS EXPORTS WORLDWIDE IN 2010
Key: (a) = number of licences issued, (b) = value of licences issued in Euros, (c) = value of arms exports in Euros (if available) (d) = total EU number of licence refusals (small discrepancies may appear between breakdowns and totals due to refusals concerning more than oneML item or refusals for items other than those appearing in the ML); (e) = criteria numbers on which refusals are based (the approximate number of times each criterion is invoked is indicated in brackets)
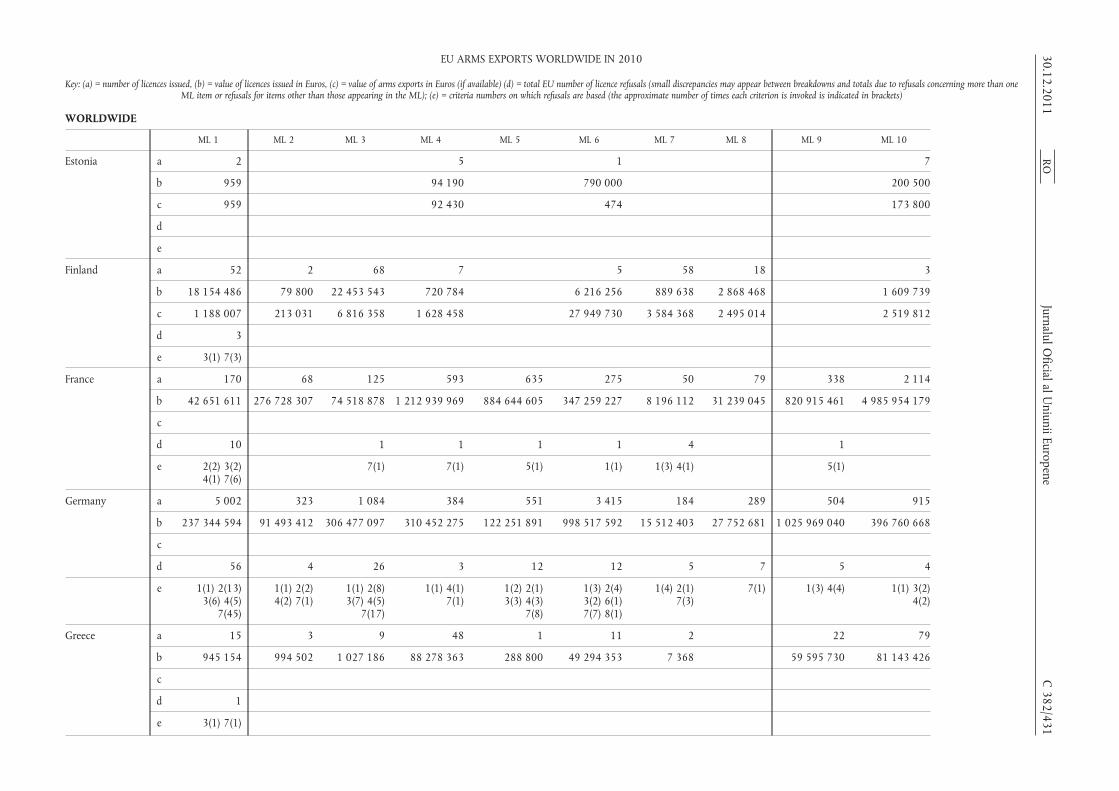
WORLDWIDE
ML 1 ML 2 ML 3 ML 4 ML 5 ML 6 ML 7 ML 8 ML 9 ML 10
Estonia a 2 5 1 7
b 959 94 190 790 000 200 500
c 959 92 430 474 173 800
d
e
Finland a 52 2 68 7 5 58 18 3
b 18 154 486 79 800 22 453 543 720 784 6 216 256 889 638 2 868 468 1 609 739
c 1 188 007 213 031 6 816 358 1 628 458 27 949 730 3 584 368 2 495 014 2 519 812
d 3
e 3(1) 7(3)
France a 170 68 125 593 635 275 50 79 338 2 114
b 42 651 611 276 728 307 74 518 878 1 212 939 969 884 644 605 347 259 227 8 196 112 31 239 045 820 915 461 4 985 954 179
c
d 10 1 1 1 1 4 1
e 2(2) 3(2)4(1) 7(6)
7(1) 7(1) 5(1) 1(1) 1(3) 4(1) 5(1)
Germany a 5 002 323 1 084 384 551 3 415 184 289 504 915
b 237 344 594 91 493 412 306 477 097 310 452 275 122 251 891 998 517 592 15 512 403 27 752 681 1 025 969 040 396 760 668
c
d 56 4 26 3 12 12 5 7 5 4
e 1(1) 2(13)3(6) 4(5)
7(45)
1(1) 2(2)4(2) 7(1)
1(1) 2(8)3(7) 4(5)
7(17)
1(1) 4(1)7(1)
1(2) 2(1)3(3) 4(3)
7(8)
1(3) 2(4)3(2) 6(1)7(7) 8(1)
1(4) 2(1)7(3)
7(1) 1(3) 4(4) 1(1) 3(2)4(2)
Greece a 15 3 9 48 1 11 2 22 79
b 945 154 994 502 1 027 186 88 278 363 288 800 49 294 353 7 368 59 595 730 81 143 426
c
d 1
e 3(1) 7(1)
30.12.2011RO
Jurnalul OficialalU
niunii EuropeneC
382/431EU ARMS EXPORTS WORLDWIDE IN 2010
Key: (a) = number of licences issued, (b) = value of licences issued in Euros, (c) = value of arms exports in Euros (if available) (d) = total EU number of licence refusals (small discrepancies may appear between breakdowns and totals due to refusals concerning more than oneML item or refusals for items other than those appearing in the ML); (e) = criteria numbers on which refusals are based (the approximate number of times each criterion is invoked is indicated in brackets)

WORLDWIDE
ML 1 ML 2 ML 3 ML 4 ML 5 ML 6 ML 7 ML 8 ML 9 ML 10
Hungary a 28 11 77 14 2 17 2 7 24
b 2 851 356 1 287 546 61 846 395 15 777 500 3 792 000 6 390 500 22 710 1 150 890 16 639 370
c 145 603 644 305 9 070 764 2 486 355 180 896 1 428 428 49 125 631 305
d 2 1
e 3(2) 3(1)
Ireland a 19 15 36 18 1
b 120 311 1 034 524 20 182 958 1 229 773 26 205
c
d
e
Italy a 37 163 72 167 162 46 10 3 36 503
b 11 996 661 223 809 506 57 906 863 613 235 562 167 963 488 109 766 767 1 423 773 54 001 31 213 663 1 649 451 499
c
d 9 5
e 1(5) 7(7) 1(1) 7(4)
Latvia a 19 5 21
b 165 435 23 381 7 480 303
c 165 435 23 381 7 480 303
d 1 2
e 2(1) 2(2) 3(2)7(2)
Lithuania a 5 25 6 19
b 54 080 3 031 127 6 242 522 12 911 709
c 54 080 2 860 489 5 011 378 5 822 305
d
e
C382/432
ROJurnalul O
ficialalUniunii Europene
30.12.2011EU ARMS EXPORTS WORLDWIDE IN 2010
Key: (a) = number of licences issued, (b) = value of licences issued in Euros, (c) = value of arms exports in Euros (if available) (d) = total EU number of licence refusals (small discrepancies may appear between breakdowns and totals due to refusals concerning more than oneML item or refusals for items other than those appearing in the ML); (e) = criteria numbers on which refusals are based (the approximate number of times each criterion is invoked is indicated in brackets)

WORLDWIDE
ML 1 ML 2 ML 3 ML 4 ML 5 ML 6 ML 7 ML 8 ML 9 ML 10
Luxembourg a 4 2 1
b 37 500 155 139 18 627
c 37 500
d
e
Malta a 37 7
b 364 868 71 600
c 354 584 61 452
d
e
Netherlands a 218 9 70 39 133 88 3 19 88
b 640 141 6 156 848 1 909 922 16 273 732 204 701 229 71 325 039 115 535 33 154 093 436 467 528
c 335 311 45 238 649 755 072 27 001 265 257 253 885 36 995 981 57 150 37 229 135 328 711 145 723 002
d 1
e 2(1) 3(1)
Poland a 51 12 35 15 38 145 5 4 3 148
b 9 282 600 853 517 12 202 725 4 154 144 19 499 776 53 991 913 130 504 1 158 946 112 981 255 023 568
c
d
e
Portugal a 3 2 1 40 254
b 31 400 145 358 1 900 8 352 662 10 820 725
c 31 400 145 358 1 900 7 692 610 10 472 892
d
e
30.12.2011RO
Jurnalul OficialalU
niunii EuropeneC
382/433EU ARMS EXPORTS WORLDWIDE IN 2010
Key: (a) = number of licences issued, (b) = value of licences issued in Euros, (c) = value of arms exports in Euros (if available) (d) = total EU number of licence refusals (small discrepancies may appear between breakdowns and totals due to refusals concerning more than oneML item or refusals for items other than those appearing in the ML); (e) = criteria numbers on which refusals are based (the approximate number of times each criterion is invoked is indicated in brackets)

WORLDWIDE
ML 1 ML 2 ML 3 ML 4 ML 5 ML 6 ML 7 ML 8 ML 9 ML 10
Romania a 146 11 55 9 3 7 1 2 116
b 22 504 556 2 775 694 37 187 498 3 048 734 1 067 568 7 008 023 147 500 10 550 348 47 234 164
c 8 568 441 1 667 837 24 578 586 690 910 284 978 4 862 583 104 760 226 928 10 550 348 59 673 372
d
e
Slovakia a 15 12 14 26 2 72 5 7 23
b 4 181 154 1 681 024 2 806 889 11 199 597 73 880 21 451 484 144 419 566 396 6 155 934
c 852 821 449 433 2 034 621 2 237 599 73 880 5 335 382 115 582 21 853 2 692 399
d
e
Slovenia a 1 15 1 12 5
b 245 238 726 314 37 520 6 015 098 804 592 112 251
c 63 502 187 390 3 376 151 1 282 884 112 251
d
e
Spain a 193 14 51 185 102 4 27 20 194
b 23 932 824 1 113 624 57 003 525 60 708 853 16 001 852 5 000 000 49 597 088 505 762 753 1 361 536 642
c 10 095 575 1 541 413 40 882 943 105 159 995 2 931 371 10 814 744 30 871 870 232 792 994 585 703 465
d
e
Sweden a 37 62 158 23 148 40 6 115 4 23
b
c
d 2 1
e 7(2) 2(1) 7(1)
C382/434
ROJurnalul O
ficialalUniunii Europene
30.12.2011EU ARMS EXPORTS WORLDWIDE IN 2010
Key: (a) = number of licences issued, (b) = value of licences issued in Euros, (c) = value of arms exports in Euros (if available) (d) = total EU number of licence refusals (small discrepancies may appear between breakdowns and totals due to refusals concerning more than oneML item or refusals for items other than those appearing in the ML); (e) = criteria numbers on which refusals are based (the approximate number of times each criterion is invoked is indicated in brackets)

WORLDWIDE
ML 1 ML 2 ML 3 ML 4 ML 5 ML 6 ML 7 ML 8 ML 9 ML 10
United Kingdom a 5 453 524 742 1 559 1 452 2 339 2 013 52 1 264 6 638
b 85 667 800 17 902 546 27 413 563 722 636 715 81 312 132 123 176 979 46 334 322 37 104 400 690 432 041 661 690 449
c
d 7 5 1 2 8 1 3
e 2(6) 3(1)6(1)
2(3) 3(1)7(2)
2(1) 2(2) 3(1) 1(4) 2(4)3(2)
2(1) 3(1) 1(1) 2(2)3(2)
TOTAL PER MLcategory
a 13 665 1 369 3 119 3 277 3 258 6 955 2 374 773 2 269 11 706
b 968 912 269 687 533 019 955 315 822 3 184 908 982 1 593 485 456 3 738 253 484 82 406 997 201 622 583 3 198 182 401 10 388 147 927
c 183 067 188 79 320 312 281 321 985 268 792 830 274 686 651 304 999 936 4 628 172 36 736 509 394 221 779 863 936 973
d 132 4 45 6 17 24 9 3 6 10
e 1(6) 2(33)3(16) 4(22)6(6) 7(103
1(1) 2(2)4(2) 7(1)
1(2) 2(12)3(12) 4(6)
7(29)
1(2) 2(1)4(1) 7(2)
1(2) 2(5)3(5) 4(3)5(1) 7(8)
8(1)
1(8) 2(10)3(6) 6(1)7(8) 8(1)
1(7) 2(1)4(1) 7(3)
2(1) 3(1)7(2)
1(3) 4(4)5(1)
1(3) 2(4)3(6) 4(2)
7(2)
ML 11 ML 12 ML 13 ML 14 ML 15 ML 16 ML 17 ML 18 ML 19
Austria a 7 15 2 4 4 134
b 18 373 359 3 179 468 5 584 476 2 511 025 1 246 783 3 950 231
c 7 903 488 2 380 692 1 541 331 304 000 250 566 3 335 486
d
e
Belgium a 34 4 7 26 8 1 13
b 109 240 498 6 243 035 24 081 156 15 113 872 264 985 6 230 14 099 336
c
d 4
e 2(4) 3(2)6(1) 8(1)
30.12.2011RO
Jurnalul OficialalU
niunii EuropeneC
382/435EU ARMS EXPORTS WORLDWIDE IN 2010
Key: (a) = number of licences issued, (b) = value of licences issued in Euros, (c) = value of arms exports in Euros (if available) (d) = total EU number of licence refusals (small discrepancies may appear between breakdowns and totals due to refusals concerning more than oneML item or refusals for items other than those appearing in the ML); (e) = criteria numbers on which refusals are based (the approximate number of times each criterion is invoked is indicated in brackets)

WORLDWIDE
ML 11 ML 12 ML 13 ML 14 ML 15 ML 16 ML 17 ML 18 ML 19
Bulgaria a 4 4 9 4 2
b 476 353 5 401 652 416 701 26 297 642 5 382
c 920 149 180 536 2 798 348 217 609 4 727 923 1 400 428 510
d
e
Czech Republic a 81 8 35 20 6 6 36
b 5 389 871 8 078 687 5 843 276 5 786 905 373 895 3 239 721 2 780 202
c 7 566 592 7 935 922 6 855 348 566 977 76 869 489 493 1 777 190
d
e
Denmark a 23 1 77 5 3 1 14
b 29 618 759 1 478 21 065 779 3 001 949 117 584 25 801 4 357 858
c
d
e
Estonia a 6
b 891 688
c 349 420
d
e
Finland a 21 99 3
b 1 937 279 3 791 538 803 000
c 9 724 345 770 808 1 064 464
d 1
e 4(1)
C382/436
ROJurnalul O
ficialalUniunii Europene
30.12.2011EU ARMS EXPORTS WORLDWIDE IN 2010
Key: (a) = number of licences issued, (b) = value of licences issued in Euros, (c) = value of arms exports in Euros (if available) (d) = total EU number of licence refusals (small discrepancies may appear between breakdowns and totals due to refusals concerning more than oneML item or refusals for items other than those appearing in the ML); (e) = criteria numbers on which refusals are based (the approximate number of times each criterion is invoked is indicated in brackets)
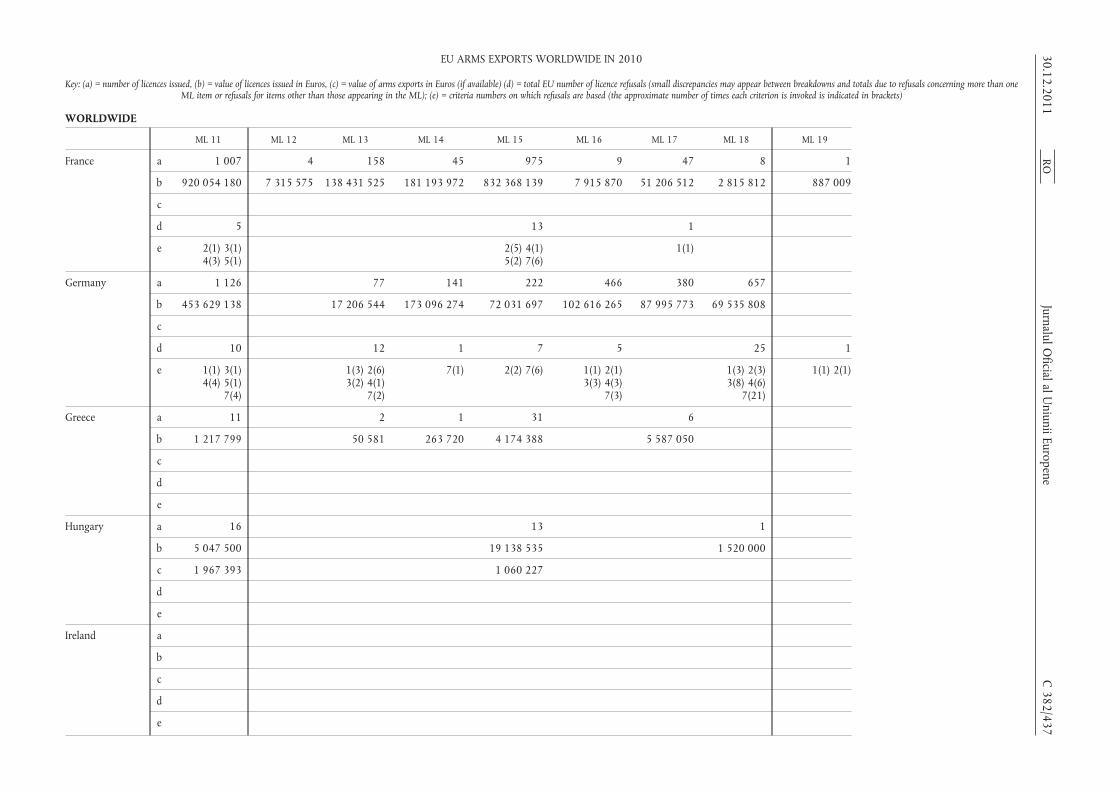
WORLDWIDE
ML 11 ML 12 ML 13 ML 14 ML 15 ML 16 ML 17 ML 18 ML 19
France a 1 007 4 158 45 975 9 47 8 1
b 920 054 180 7 315 575 138 431 525 181 193 972 832 368 139 7 915 870 51 206 512 2 815 812 887 009
c
d 5 13 1
e 2(1) 3(1)4(3) 5(1)
2(5) 4(1)5(2) 7(6)
1(1)
Germany a 1 126 77 141 222 466 380 657
b 453 629 138 17 206 544 173 096 274 72 031 697 102 616 265 87 995 773 69 535 808
c
d 10 12 1 7 5 25 1
e 1(1) 3(1)4(4) 5(1)
7(4)
1(3) 2(6)3(2) 4(1)
7(2)
7(1) 2(2) 7(6) 1(1) 2(1)3(3) 4(3)
7(3)
1(3) 2(3)3(8) 4(6)
7(21)
1(1) 2(1)
Greece a 11 2 1 31 6
b 1 217 799 50 581 263 720 4 174 388 5 587 050
c
d
e
Hungary a 16 13 1
b 5 047 500 19 138 535 1 520 000
c 1 967 393 1 060 227
d
e
Ireland a
b
c
d
e
30.12.2011RO
Jurnalul OficialalU
niunii EuropeneC
382/437EU ARMS EXPORTS WORLDWIDE IN 2010
Key: (a) = number of licences issued, (b) = value of licences issued in Euros, (c) = value of arms exports in Euros (if available) (d) = total EU number of licence refusals (small discrepancies may appear between breakdowns and totals due to refusals concerning more than oneML item or refusals for items other than those appearing in the ML); (e) = criteria numbers on which refusals are based (the approximate number of times each criterion is invoked is indicated in brackets)

WORLDWIDE
ML 11 ML 12 ML 13 ML 14 ML 15 ML 16 ML 17 ML 18 ML 19
Italy a 167 3 15 20 27 1 4
b 289 915 048 507 424 15 082 350 46 267 543 11 572 778 60 716 606 172
c
d
e
Latvia a
b
c
d
e
Lithuania a 5
b 916 962
c 741 771
d 2
e 1(2) 2(1)
Luxembourg a
b
c
d
e
Malta a
b
c
d
e
C382/438
ROJurnalul O
ficialalUniunii Europene
30.12.2011EU ARMS EXPORTS WORLDWIDE IN 2010
Key: (a) = number of licences issued, (b) = value of licences issued in Euros, (c) = value of arms exports in Euros (if available) (d) = total EU number of licence refusals (small discrepancies may appear between breakdowns and totals due to refusals concerning more than oneML item or refusals for items other than those appearing in the ML); (e) = criteria numbers on which refusals are based (the approximate number of times each criterion is invoked is indicated in brackets)

WORLDWIDE
ML 11 ML 12 ML 13 ML 14 ML 15 ML 16 ML 17 ML 18 ML 19
Netherlands a 28 7 9 46 15 2 5
b 4 322 382 1 706 082 7 452 984 98 847 632 687 513 33 250 1 743 911
c 11 866 131 295 037 959 806 10 981 761 918 476 29 250 313 111
d
e
Poland a 7 32 2 1 4 4 12
b 2 241 391 36 847 648 1 291 496 33 923 1 386 390 158 006 289 201
c
d 1
e 3(1) 7(1)8(1)
Portugal a 17 1
b 1 577 550 28 600
c 1 577 550 28 600
d
e
Romania a 12 15 1 8 1 6 5
b 5 988 587 300 065 226 296 7 386 017 146 187 3 176 631 1 297 960
c 4 190 635 142 789 5 126 122 146 187 1 411 457 366 514
d
e
Slovakia a 1 1 4 1 1
b 75 800 335 300 7 273 100 10 000
c 14 400 335 300 33 800
d
e
30.12.2011RO
Jurnalul OficialalU
niunii EuropeneC
382/439EU ARMS EXPORTS WORLDWIDE IN 2010
Key: (a) = number of licences issued, (b) = value of licences issued in Euros, (c) = value of arms exports in Euros (if available) (d) = total EU number of licence refusals (small discrepancies may appear between breakdowns and totals due to refusals concerning more than oneML item or refusals for items other than those appearing in the ML); (e) = criteria numbers on which refusals are based (the approximate number of times each criterion is invoked is indicated in brackets)

WORLDWIDE
ML 11 ML 12 ML 13 ML 14 ML 15 ML 16 ML 17 ML 18 ML 19
Slovenia a 4 3 1
b 1 445 2 183 570 610 034
c 1 445 476 358 115 700
d
e
Spain a 56 7 4 44
b 113 386 803 1 300 000 43 058 963
c 18 119 281 65 317 741 680 673
d
e
Sweden a 8 6 23 8 14
b
c
d 1
e 3(1) 7(1)
United Kingdom a 3 142 548 562 774 129 178 469
b 193 516 645 30 253 716 19 357 360 24 962 417 24 597 152 7 246 415 7 385 032
c
d 3 1
e 1(2) 2(1)3(1)
7(1)
TOTAL PER MLcategory
a 5 773 5 1 068 862 2 208 674 637 1 373 1
b 2 156 925 905 7 317 053 273 429 089 445 940 096 1 173 018 341 178 078 047 159 962 470 110 991 557 887 009
c 64 591 735 2 561 228 13 849 580 8 198 374 84 638 901 7 026 486 2 182 166 6 336 511
d 18 15 1 26 5 1 26 1
e 1(3) 2(2)3(3) 4(7)5(2) 7(4)
1(3) 2(6)3(3) 4(2)
7(4)
7(1) 1(2) 2(12)3(2) 4(1)5(2) 6(1)
7(12) 8(1)
1(1) 2(1)3(3’) 4(3)
7(3)
1(1) 1(3) 2(3)3(9) 4(6)
7(22) 8(1)
1(1) 2(1)
C382/440
ROJurnalul O
ficialalUniunii Europene
30.12.2011EU ARMS EXPORTS WORLDWIDE IN 2010
Key: (a) = number of licences issued, (b) = value of licences issued in Euros, (c) = value of arms exports in Euros (if available) (d) = total EU number of licence refusals (small discrepancies may appear between breakdowns and totals due to refusals concerning more than oneML item or refusals for items other than those appearing in the ML); (e) = criteria numbers on which refusals are based (the approximate number of times each criterion is invoked is indicated in brackets)

WORLDWIDE
ML 20 ML 21 ML 22 TOTAL perdestination
Austria a 14 1 907
b 42 216 742 1 768 320 054
c 49 500 372 630 508
d 41
e 2(9) 3(3)4(17) 6(5)
7(39)
Belgium a 20 1 223
b 1 002 810 809
c
d 10
e 2(8) 3(6)6(1) 7(3)
8(2)
Bulgaria a 338
b 295 809 848
c 89 545 257 834 535
d 2
e 1(2)
Czech Republic a 2 2 1 005
b 268 209 413 937 451 075 224
c 335 787 6 091 676 216 992 823
d 6
e 2(2) 3(2)7(4)
30.12.2011RO
Jurnalul OficialalU
niunii EuropeneC
382/441EU ARMS EXPORTS WORLDWIDE IN 2010
Key: (a) = number of licences issued, (b) = value of licences issued in Euros, (c) = value of arms exports in Euros (if available) (d) = total EU number of licence refusals (small discrepancies may appear between breakdowns and totals due to refusals concerning more than oneML item or refusals for items other than those appearing in the ML); (e) = criteria numbers on which refusals are based (the approximate number of times each criterion is invoked is indicated in brackets)

WORLDWIDE
ML 20 ML 21 ML 22 TOTAL perdestination
Denmark a 30 2 399
b 15 827 051 1 837 936 375 977 554
c 2
d 7(2)
e
Estonia a 21
b 1 977 337
c 617 083
d
e
Finland a 3 2 341
b 1 548 000 146 900 61 219 431
c 811 622 58 766 018
d 5
e 3(1) 4(1)6(1) 7(4)
France a 4 115 343 7 163
b 246 494 238 098 229 116 232 323 11 181 813 034
c 3 703 898 387
d 1 39
e 3(1) 4(1) 1(5) 2(8)3(4) 4(7)
5(5) 7(14)
C382/442
ROJurnalul O
ficialalUniunii Europene
30.12.2011EU ARMS EXPORTS WORLDWIDE IN 2010
Key: (a) = number of licences issued, (b) = value of licences issued in Euros, (c) = value of arms exports in Euros (if available) (d) = total EU number of licence refusals (small discrepancies may appear between breakdowns and totals due to refusals concerning more than oneML item or refusals for items other than those appearing in the ML); (e) = criteria numbers on which refusals are based (the approximate number of times each criterion is invoked is indicated in brackets)
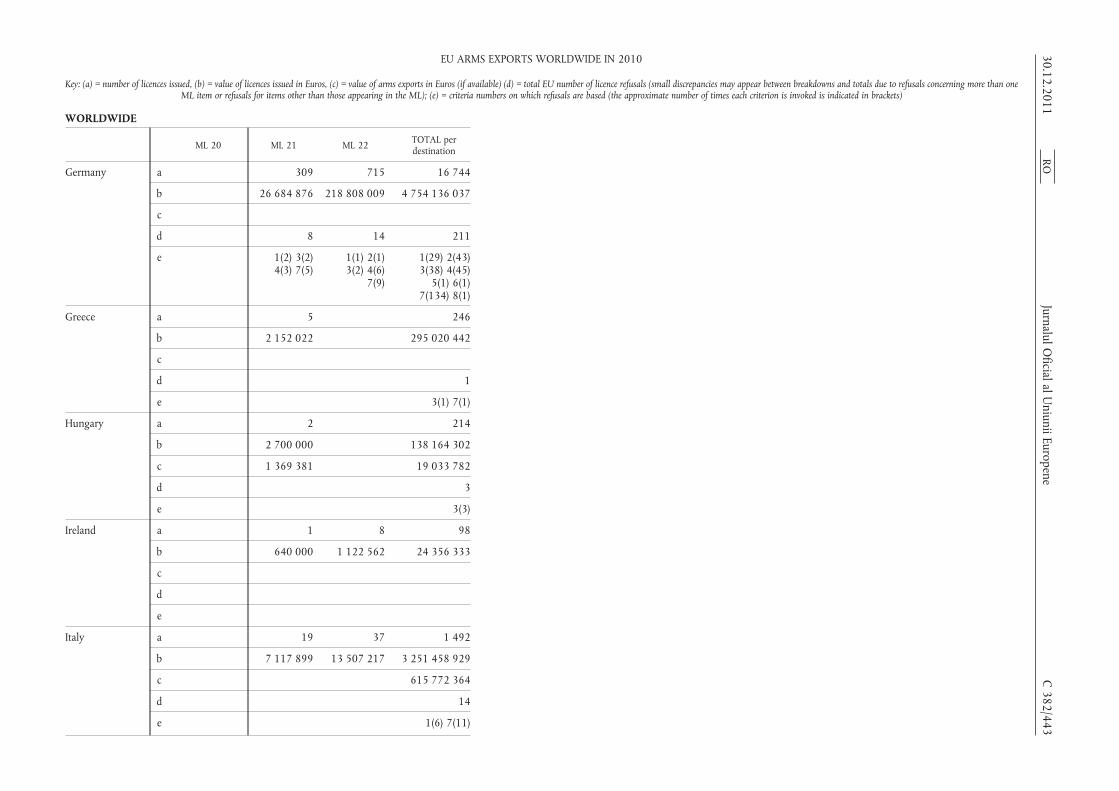
WORLDWIDE
ML 20 ML 21 ML 22 TOTAL perdestination
Germany a 309 715 16 744
b 26 684 876 218 808 009 4 754 136 037
c
d 8 14 211
e 1(2) 3(2)4(3) 7(5)
1(1) 2(1)3(2) 4(6)
7(9)
1(29) 2(43)3(38) 4(45)
5(1) 6(1)7(134) 8(1)
Greece a 5 246
b 2 152 022 295 020 442
c
d 1
e 3(1) 7(1)
Hungary a 2 214
b 2 700 000 138 164 302
c 1 369 381 19 033 782
d 3
e 3(3)
Ireland a 1 8 98
b 640 000 1 122 562 24 356 333
c
d
e
Italy a 19 37 1 492
b 7 117 899 13 507 217 3 251 458 929
c 615 772 364
d 14
e 1(6) 7(11)
30.12.2011RO
Jurnalul OficialalU
niunii EuropeneC
382/443EU ARMS EXPORTS WORLDWIDE IN 2010
Key: (a) = number of licences issued, (b) = value of licences issued in Euros, (c) = value of arms exports in Euros (if available) (d) = total EU number of licence refusals (small discrepancies may appear between breakdowns and totals due to refusals concerning more than oneML item or refusals for items other than those appearing in the ML); (e) = criteria numbers on which refusals are based (the approximate number of times each criterion is invoked is indicated in brackets)
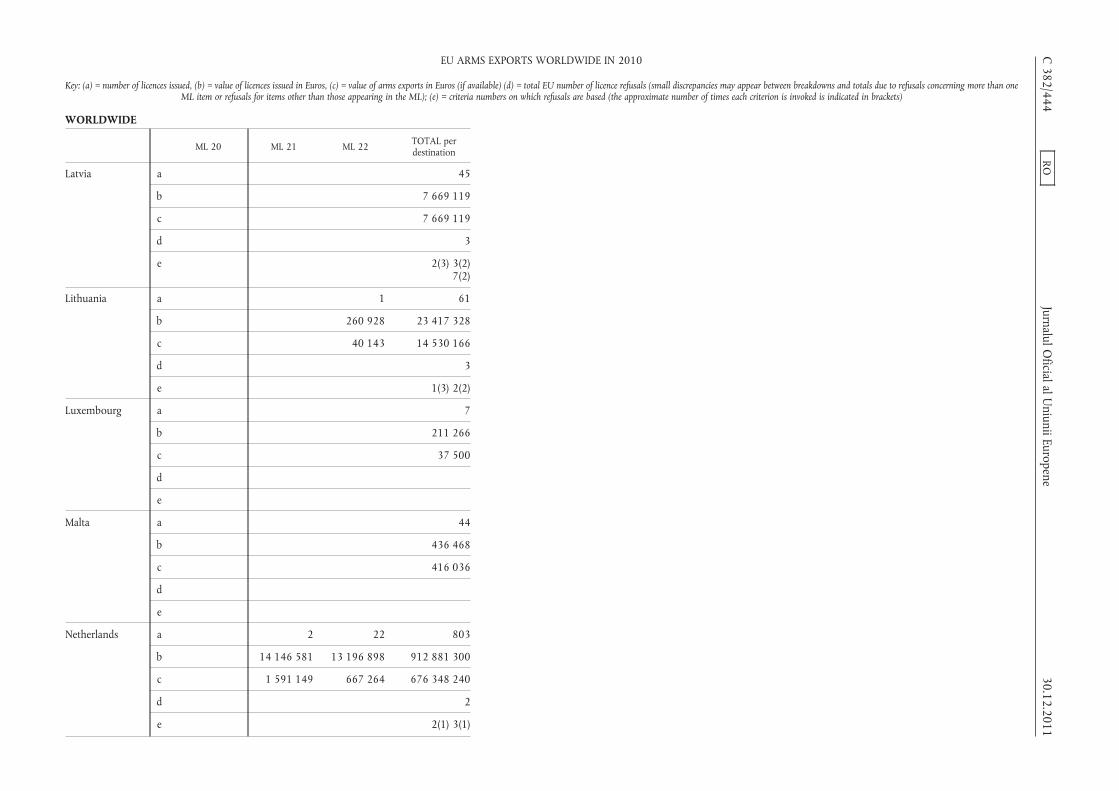
WORLDWIDE
ML 20 ML 21 ML 22 TOTAL perdestination
Latvia a 45
b 7 669 119
c 7 669 119
d 3
e 2(3) 3(2)7(2)
Lithuania a 1 61
b 260 928 23 417 328
c 40 143 14 530 166
d 3
e 1(3) 2(2)
Luxembourg a 7
b 211 266
c 37 500
d
e
Malta a 44
b 436 468
c 416 036
d
e
Netherlands a 2 22 803
b 14 146 581 13 196 898 912 881 300
c 1 591 149 667 264 676 348 240
d 2
e 2(1) 3(1)
C382/444
ROJurnalul O
ficialalUniunii Europene
30.12.2011EU ARMS EXPORTS WORLDWIDE IN 2010
Key: (a) = number of licences issued, (b) = value of licences issued in Euros, (c) = value of arms exports in Euros (if available) (d) = total EU number of licence refusals (small discrepancies may appear between breakdowns and totals due to refusals concerning more than oneML item or refusals for items other than those appearing in the ML); (e) = criteria numbers on which refusals are based (the approximate number of times each criterion is invoked is indicated in brackets)

WORLDWIDE
ML 20 ML 21 ML 22 TOTAL perdestination
Poland a 10 22 550
b 3 330 646 55 120 202 457 109 577
c
d 1
e 3(1) 7(1)8(1)
Portugal a 1 319
b 44 211 21 002 406
c 44 211 19 994 521
d
e
Romania a 1 9 408
b 357 583 1 496 812 151 900 223
c 202 397 76 966 122 871 810
d
e
Slovakia a 1 8 193
b 160 000 1 634 090 57 749 068
c 91 183 1 059 914 15 348 167
d
e
Slovenia a 42
b 176 864 10 912 926
c 176 864 5 792 545
d
e
30.12.2011RO
Jurnalul OficialalU
niunii EuropeneC
382/445EU ARMS EXPORTS WORLDWIDE IN 2010
Key: (a) = number of licences issued, (b) = value of licences issued in Euros, (c) = value of arms exports in Euros (if available) (d) = total EU number of licence refusals (small discrepancies may appear between breakdowns and totals due to refusals concerning more than oneML item or refusals for items other than those appearing in the ML); (e) = criteria numbers on which refusals are based (the approximate number of times each criterion is invoked is indicated in brackets)

WORLDWIDE
ML 20 ML 21 ML 22 TOTAL perdestination
Spain a 8 909
b 3 500 2 238 406 427
c 23 390 716 1 128 302 781
d
e
Sweden a 11 686
b 1 402 198 197
c 1 457 361 849
d 4
e 2(1) 3(1)7(4)
United Kingdom a 564 1 188 29 590
b 19 332 239 16 531 948 2 836 853 872
c
d 1 2 53
e 2(1) 3(1) 2(2) 1(9) 2(25)3(11) 5(3)6(1) 7(17)
TOTAL PER MLcategory
a 4 1 083 2 395 64 848
b 246 494 332 543 699 482 580 615 31 722 887 511
c 27 969 099 8 119 219 8 694 273 051
d 9 17 345
e 1(2) 2(1)3(3) 4(3)
7(5)
1(1) 2(3)3(1) 5(3)
7(16)
1(54) 2(102)3(74) 4(70)
5(9) 6(9)7(236) 8(4)
C382/446
ROJurnalul O
ficialalUniunii Europene
30.12.2011EU ARMS EXPORTS WORLDWIDE IN 2010
Key: (a) = number of licences issued, (b) = value of licences issued in Euros, (c) = value of arms exports in Euros (if available) (d) = total EU number of licence refusals (small discrepancies may appear between breakdowns and totals due to refusals concerning more than oneML item or refusals for items other than those appearing in the ML); (e) = criteria numbers on which refusals are based (the approximate number of times each criterion is invoked is indicated in brackets)

30.12.2011 RO Jurnalul Oficial al Uniunii Europene C 382/447
TABLE A.II
EXPORTS TO UNITED NATIONS-MANDATED OR OTHER INTERNATIONAL MISSIONS IN 2010
Destination country:
AFGHANISTAN
Exporting Member State United Nations-mandated or other international missions Description of goods
Austria United Nations Assistance Mission in Afghanistan (UNAMA - SUP - AMA- ISAF)
pistols and components ML1, land crafts ML6
SLOVAKIA ISAF - UNMACA (DAFA – Demining Agency for Afghanistan)
Spare parts and for Mine Clearance System BOZENA 4
Greece ISAF Pistols, Rifles, Ammunitions, Binocular and Night Vision Goggles
UK United Nations High Commissioner for Refugees
components for all-wheel drive vehicles with ballistic protection
UK UNITED NATIONS body armour, components for body armour
UK UNAMA components for all-wheel drive vehicles with ballistic protection
Germany Human Rights UNAMA/OHCHRKabul
cross country vehicle with special protection
Destination country:
AZERBAIJAN
Exporting Member State United Nations-mandated or other international missions Description of goods
SLOVAKIA UNDP - ANAMA Spare parts and service for Mine clearance Flail System BOZENA 4 and BOZENA 5
UK UNODC civil body armour
Destination country:
BANGLADESH
Exporting Member State United Nations-mandated or other international missions Description of goods
UK UNDP body armour, components for body armour, military helmets
Destination country:
BOSNIA AND HERZEGOVINA
Exporting Member State United Nations-mandated or other international missions Description of goods
Greece EUFOR- ALTHEA (RCC-4) Rifles, Ammunitions, Body Armour
Destination country:
BELGIUM
Exporting Member State United Nations-mandated or other international missions Description of goods
Greece NATO-SHAPE Ammunitions

C 382/448 RO Jurnalul Oficial al Uniunii Europene 30.12.2011
Destination country:
CAMBODIA
Exporting Member State United Nations-mandated or other international missions Description of goods
Germany United Nations – UNAKRTUN Assistance to the Khmer Rouge Trials
parts for submachine guns
Destination country:
CHAD
Exporting Member State United Nations-mandated or other international missions Description of goods
Finland UN Protective equipment
Destination country:
COLOMBIA
Exporting Member State United Nations-mandated or other international missions Description of goods
UK Fuerzas Militares de Colombia Ejercito Nacional
body armour, bomb suits, military helmets
Destination country:
CONGO (DEMOCRATIC REPUBLIC OF)
Exporting Member State United Nations-mandated or other international missions Description of goods
UK UN High Commissioner for Refugees
equipment employing cryptography
UK United Nations Mission in Democratic Republic of Congo
imaging cameras
Finland UN Protective equipment
Destination country:
COTE D’IVOIRE
Exporting Member State United Nations-mandated or other international missions Description of goods
Germany United Nations Operations in Cote d’Ivoire
ammunition for revolvers and pistols
Destination country:
CYPRUS
Exporting Member State United Nations-mandated or other international missions Description of goods
HUNGARY UN - UNFICYP 2002M M1-UP Desert protective vests, 9mm P9RC pistols, AK-63D submachine guns

30.12.2011 RO Jurnalul Oficial al Uniunii Europene C 382/449
Destination country:
DENMARK
Exporting Member State United Nations-mandated or other international missions Description of goods
UK SUPPLY DIVISION UNICEF PLADS
body armour, components for body armour, military helmets
Destination country:
DUBAI
Exporting Member State United Nations-mandated or other international missions Description of goods
UK United Nations World Food Programme
body armour, components for body armour, military helmets
Destination country:
ECUADOR
Exporting Member State United Nations-mandated or other international missions Description of goods
UK SECTRETARIA GENERAL DE LA OAE EN ECUADOR
body armour, bomb suits, military helmets
Destination country:
EGYPT
Exporting Member State United Nations-mandated or other international missions Description of goods
HUNGARY UN-SINAI UN military helmet, 9mm Parabellum ammunition
Destination country:
GUINEA
Exporting Member State United Nations-mandated or other international missions Description of goods
UK UNOPS body armour, components for body armour, military helmets
Destination country:
HAITI
Exporting Member State United Nations-mandated or other international missions Description of goods
Austria United Nations Stabilization Mission in Haiti (MINUSTAH)
ammunition ML3
Greece INTERNATIONAL HUMANITARIAN HELP(FORCES PROTECTION
Rifles, Pistols, Ammunitions
UK MINUSTAH components for all-wheel drive vehicles with ballistic protection
UK UNICEF body armour, components for body armour

C 382/450 RO Jurnalul Oficial al Uniunii Europene 30.12.2011
Destination country:
IRAQ
Exporting Member State United Nations-mandated or other international missions Description of goods
Austria UNAMI United Nations Mission for Iraq
pistols and components ML1
UK UNAMI - Baghdad radio controlled improvised explosive device jamming equipment
UK United Nations High Commissioner for Refugees (UNHCR)
components for radio controlled improvised explosive device jamming equipment, radio controlled improvised explosive device jamming equipment
UK United Nations Assistance Mission for Iraq (UNAMI)
test equipment for aircraft missile protection systems, decoy flares, technology for the use of decoy flares, components for all-wheel drive vehicles with ballistic protection
Germany United Nations Development Program UNDP
cross country vehicle with special protection
Destination country:
ISRAEL
Exporting Member State United Nations-mandated or other international missions Description of goods
UK UN Disengagement Observer Force
components for military communications equipment
Germany United Nations Relief and Works Agency (UNRWA)
automatic rifles, submachine guns, ammunition for submachine guns, ammunition for pistols and parts for submachine guns
Destination country:
ITALY
Exporting Member State United Nations-mandated or other international missions Description of goods
UK WORLD FOOD PROGRAM body armour, components for body armour, military helmets
UK United Nations Department of Field Support
anti-riot/ballistic shields
Destination country:
JORDAN
Exporting Member State United Nations-mandated or other international missions Description of goods
UK WORLD FOOD PROGRAM body armour, components for body armour, military helmets
Finland UN Protective equipment
Destination country:
KENYA
Exporting Member State United Nations-mandated or other international missions Description of goods
Austria United Nations Office at Nairobi
pistols and components ML1
UK UNSOA SUPPORT BASE cryptographic software, software for the use of cryptographic software
UK UNOPS bomb suits, explosive ordnance disposal equipment, military communications equipment, military helmets
UK UNOPS Mine Action Somalia components for military improvised explosive device disposal equipment, military improvised explosive device disposal equipment

30.12.2011 RO Jurnalul Oficial al Uniunii Europene C 382/451
Destination country:
KOSOVO
Exporting Member State United Nations-mandated or other international missions Description of goods
Finland International Civilian Office/EU Special Representative ICO
Protective equipment
Destination country:
KUWAIT
Exporting Member State United Nations-mandated or other international missions Description of goods
UK UNITED NATIONS ASSISTANCE MISSION FOR IRAQ
body armour, components for body armour
Destination country:
LEBANON
Exporting Member State United Nations-mandated or other international missions Description of goods
Austria UNIFIL United Nations Interim Force in Lebanon
pistols and components ML1
HUNGARY UNIFIL Protective vests with ceramic filling
UK United Nations Interim Force in Lebanon (UNIFIL)
radio controlled improvised explosive device jamming equipment; components for improvised explosive device jamming equipment; improvised explosive device jamming equipment, software for the use of improvised explosive device jamming equipment, technology for the use of improvised explosive device jamming equipment
UK United Nations Office of the Special Coordinator for Lebanon (UNSCOL)
radio controlled improvised explosive device jamming equipment
Germany Special Tribunal for Lebanon automatic rifles, submachine guns, weapon sights, ammunition for revolvers and pistols, parts for automatic rifles and parts for submachine guns
Germany United Nations Interim Force in Lebanon - UNIFIL
ammunition for rifles, ammunition for smooth-bore weapons and ammunition for revolvers and pistols
Germany UNITED NATION ESCWA submachine guns and parts for submachine guns
Destination country:
MOROCCO
Exporting Member State United Nations-mandated or other international missions Description of goods
UK MINURSO military helmets
Destination country:
NEPAL
Exporting Member State United Nations-mandated or other international missions Description of goods
UK United Nations Development Programme
body armour, components for body armour, military helmets

C 382/452 RO Jurnalul Oficial al Uniunii Europene 30.12.2011
Destination country:
NETHERLANDS
Exporting Member State United Nations-mandated or other international missions Description of goods
Czech Republic OPCW Technical assistance in training the BCHL
Czech Republic OPCW Technical assistance in training members of OPCW
Destination country:
OMAN
Exporting Member State United Nations-mandated or other international missions Description of goods
Portugal UN and EU anti-piracy mission of the coast of Somalia
Naval Spare Parts for the Portuguese Frigate (ML9)
Destination country:
PAKISTAN
Exporting Member State United Nations-mandated or other international missions Description of goods
UK UNICEF ISLAMABAD body armour, components for body armour
UK UNODC body armour, components for body armour, military helmets
Finland UN Protective equipment
Destination country:
ROMANIA
Exporting Member State United Nations-mandated or other international missions Description of goods
Czech Republic UN Department of Safety and Security
Pistol cartridges cal. 9x19
Destination country:
SOMALIA
Exporting Member State United Nations-mandated or other international missions Description of goods
Finland UN Protective equipment
Finland UN Protective equipment
Germany UN Mine Action Somalia UNMAS
mine sweeping equipment and parts therefore

30.12.2011 RO Jurnalul Oficial al Uniunii Europene C 382/453
Destination country:
SUDAN
Exporting Member State United Nations-mandated or other international missions Description of goods
SLOVAKIA UN - UNMAO Spare parts and service for Mine Clearance System BOZENA 4 – in compliance with attachment
Germany United Nations Mine Action Office UNMAO
parts for mine sweeping equipment
Germany United Nations Mine Action parts for mine sweeping equipment
Germany United Nations Mine Action Office UNMAO, UNOPS
parts for mine sweeping equipment
Germany United Nations Mine Action Office UNMIS
parts for mine sweeping equipment
Germany DDU UNAMID MOVCON UN container
Germany United Nations African Union Nations HybridMission in Darfur (UNAMID)
ammunition for revolvers and pistols and ammunition for rifles;
Destination country:
SRI LANKA
Exporting Member State United Nations-mandated or other international missions Description of goods
SLOVAKIA UNDP BOZENA 4 Mini Flail Mine Clearance System with associated accessories
Destination country:
SWITZERLAND
Exporting Member State United Nations-mandated or other international missions Description of goods
Germany United Nations OfficePalais des Nations
automatic rifles
Destination country:
TANZANIA
Exporting Member State United Nations-mandated or other international missions Description of goods
Austria UNICTR Chief of Procurement Officer (Security in Arusha)United Nations Int. Criminal TRIBUNAL for RWANDA)
components ML1ammunition ML3
Destination country:
TIMOR LESTE
Exporting Member State United Nations-mandated or other international missions Description of goods
Germany United Nations Integrated Mission
binoculars with laser range-finder

C 382/454 RO Jurnalul Oficial al Uniunii Europene 30.12.2011
Destination country:
UGANDA
Exporting Member State United Nations-mandated or other international missions Description of goods
Greece EUROPEAN UNION TRAINING MISSION
Rifles, Ammunitions, Helmets (Kevlar) and Uniforms designed for chemical protection
Destination country:
YEMEN
Exporting Member State United Nations-mandated or other international missions Description of goods
Finland UN Protective equipment

30.12.2011 RO Jurnalul Oficial al Uniunii Europene C 382/455
TABLE A.III
1. Brokering licences granted by Member States in 2010
AUSTRIA
DestinationNo. of
licences issued
Value of brokering licences issued
ML categories
Quantity of brokered items
Value of brokered items Country of origin
Canada 1 11,650.000.- 2 22 0 Russian Federation
Canada 1 1,417.860.- 1 + 3 13 0 Russian Federation
BULGARIA
DestinationNo. of
licences issued
Value of brokering licences issued
ML categories
Quantity of brokered items
Value of brokered items Country of origin
Algeria 2 7 767 412 EUR ML 4 14 3 918 178 EUR Ukraine
ML 6 265 3 849 234 EUR
Niger 1 126 000 EUR ML 4 3 000 126 000 EUR Montenegro
CZECH REPUBLIC
DestinationNo. of
licencesissued
Value of brokeringlicences issued
MLcategories
Quantity ofbrokered items
Value of brokereditems Country of origin
RussianFederation
2 202 417 EUR 10 Spare partsof airplane
L-39C;
43 122 EUR Czech Republic
46 161 EUR 7 Substance CS 0 EUR Slovakia
Azerbaijan 1 1 814 262 EUR 10 Partsof airplane
L-39C
855 895 EUR Czech Republic
Slovakia 4 2 643 EUR 10 Pilot helmetALPHA 200;
2 604 EUR United Kingdom
1 006 EUR 11 Part of Mi-17; 991 EUR United Kingdom
31 800 EUR 3 Cartridges cal.12,7 mm
30 798 EUR Norway
Poland 3 13 371 EUR 11 Spare parts oftank T-72;
13 053 EUR United Kingdom
509 065 EUR 6 Submachine-gun
AKM cal.7,62 mm
0 Slovakia
330 566 EUR 1 0 Romania
Bulgaria 1 154 844 EUR 10 Rotor blades 0 RussianFederation

DestinationNo. of
licencesissued
Value of brokeringlicences issued
MLcategories
Quantity ofbrokered items
Value of brokereditems Country of origin
C 382/456 RO Jurnalul Oficial al Uniunii Europene 30.12.2011
Sri Lanka 10 11 146 EUR 10 Spare parts 9 438 EUR RussianFederation
Thailand 2 89 848 EUR 10 Spare parts 6 846 EUR United Kingdom;Germany
Ethiopa 3 192 340 EUR
192 010 EUR
10
6
Spare parts;
Spare parts
187 146 EUR
0 EUR
RussianFederation;Slovakia
United States 1 13 426 EUR Spare parts 12 730 EUR Slovakia
Algeria 6 787 229 EUR 6;10 Spare parts 312 792 EUR RussianFederation;Ukraine
Egypt 3 332 872 EUR 11; 5 Spare parts; 305 704 EUR RussianFederation;
157 094 EUR Fire controldevice PUO 9
60 653 EUR Ukraine
Vietnam 2 472 731 EUR 10; 6 Spare parts; 0 Slovakia; Bulgaria
1 822 990 EUR Pontoonbridge
assembly PMP
1 963 367 EUR
Georgia 1 392 691 EUR 5 Laserrangefinders
341 462 EUR Switzerland
India 26 344 EUR 6 Spare parts 0 Ukraine
Bangladesh 2 81 508 EUR 10 Spare parts 54 321 EUR RussianFederation;Ukraine
Germany 1 3 812 EUR 1 Spare parts 3 812 EUR France
ESTONIA
DestinationNo. of
licencesissued
Value of brokeringlicences issued
MLcategories
Quantity ofbrokered items
Value of brokereditems Country of origin
France 2 21 690 ML10 110 21 690 Czech Republic
TheNetherlands
1 5 025 ML10 30 5 025 Czech Republic
GERMANY
DestinationNo. of
licencesissued
Value of brokeringlicences issued
MLcategories
Quantity ofbrokered items
Value of brokereditems Country of origin
Afghanistan 1 890 352 € ML 17 1 piece 890 352 € South Africa
Canada 2 890 352 € ML 2 various 0 € Norway
ML 17 1 piece 890 352 € South Africa
Canada 1 n.A. ML 3 32 000 pieces n.A. Canada, Norway
Chile 1 154 712 € ML 11 2 pieces 154 712 € Switzerland
Egypt 2 57 403 € ML 21 1 piece 1 500 € Switzerland

DestinationNo. of
licencesissued
Value of brokeringlicences issued
MLcategories
Quantity ofbrokered items
Value of brokereditems Country of origin
30.12.2011 RO Jurnalul Oficial al Uniunii Europene C 382/457
ML 8 300 kg 55 903 € Norway
India 1 14 000 € ML 14 8 pieces 14 000 € United States
India, SouthAfrica
1 n.A. ML 3 850 000pieces
n.A. India, SouthAfrica
ML 4 240 pieces
Israel 1 6 375 € ML 5 25 parts 6 375 € United States
Korea,Republic
6 2 937 940 € ML 13 1 piece 27 610 € Switzerland
ML 8 1 500 kg 207 000 € Norway
ML 8 2 300 kg 347 300 € Norway
ML 8 3 200 kg 441 600 € Norway
ML 8 250 kg 52 200 € Norway
ML 4 various 1 862 230 € Israel
Mexico 1 17 000 € ML 18 1 set 17 000 € United States
New Zealand 1 55 000 000 € ML 9 2 sets 55 000 000 € Canada
Norway 1 71 500 € ML 3 various 71 500 € Switzerland
Singapore 1 n.A. ML 3 68 000 pieces n.A. Switzerland
South Africa 3 38 720 € ML 6 16 pieces 19 360 € Israel
ML 6 2 pieces 1 360 € Israel
ML 6 2 sets 18 000 € Israel
Australia,Canada,Japan, NewZealand,Norway,Switzerland,USA
1 n.A. ML 3ML 4
various n.A. Canada, Norway,South Africa,Switzerland, USA
LITHUANIA
DestinationNo. of
licencesissued
Value of brokeringlicences issued,
EUROS
MLcategories
Quantity ofbrokered items
Value of brokereditems Country of origin
Algeria 1 55 000 ML10.a Pneumaticrubber tyres
for Mi-24helicopters(100 units)
United ArabEmirates
CzechRepublic
1 13 489 ML22 Training RussianFederation
Djibouti 1 160 037 ML10.d 2 units ofhelicopter
engines forrepairs
Azerbaijan
India 3 58 409 ML22 Training RussianFederation
Colombia 7 819 588 ML22 Training RussianFederation
Peru 1 29 721 ML22 Training RussianFederation

DestinationNo. of
licencesissued
Value of brokeringlicences issued,
EUROS
MLcategories
Quantity ofbrokered items
Value of brokereditems Country of origin
C 382/458 RO Jurnalul Oficial al Uniunii Europene 30.12.2011
United States 1 207 432 ML22 Training RussianFederation
Vietnam 1 173 953 ML10 2 units ofhelicopter
engines forrepairs
Azerbaijan
Vietnam 4 1 252 461 ML10 7 units ofhelicopter
engines forrepairs
Ukraine
Vietnam 2 94 500 ML22 Training RussianFederation
Total 22 2 864 590
POLAND
DestinationNo. of
licencesissued
Value of brokeringlicences issued
MLcategories
Quantity ofbrokered items
Value of brokereditems Country of origin
Egypt 6 29 218,00 USD ML2 29 218,00 USD Bulgaria
368 833,00 USD ML3 368 833,00 USD Bulgaria
8 361,00 EUR ML1 8 361,00 EUR Bulgaria
32 700,00 EUR ML3 32 700,00 EUR Bulgaria
50 500,00 EUR ML2 50 500,00 EUR Bulgaria
271 458,00 EUR ML3 271 458,00 EUR Bulgaria
Bulgaria 1 90 000,00 EUR ML5 90 000,00 EUR Slovakia
India 1 75 650,00 USD ML2 75 650,00 USD Ukraine
Iraq 2 5 568 070,00 USD ML6 5 568 070,00 USD Ukraine
3 124 390,00 USD ML6 3 124 390,00 USD Ukraine
PORTUGAL
DestinationNo. of
licencesissued
Value of brokeringlicences issued
MLcategories
Quantity ofbrokered items
Value of brokereditems Country of origin
Malaysia 1 5 300 ML10 1 5 300 USA
Indonesia 1 23 650 ML10 1 23 650 USA
Cape Verde 1 85 000 ML1;ML3
ML1: 40ML3: 15 000
85 000 USA

30.12.2011 RO Jurnalul Oficial al Uniunii Europene C 382/459
ROMANIA
DestinationNo. of
licencesissued
Value of brokeringlicences issued
MLcategories
Quantity ofbrokered items
Value of brokereditems Country of origin
Croatia 1 26 584 15 20 26 584 United States
Turkey 1 273 818 15 5 273 818 Germany
SLOVENIA
DestinationNo. of
licencesissued
Value of brokeringlicences issued
MLcategories
Quantity ofbrokered items
Value of brokereditems Country of origin
Egypt 1 492 785,00 ML6 148 pcs 145 864,00 Serbia
SWEDEN
DestinationNo. of
licencesissued
Value of brokeringlicences issued
MLcategories
Quantity ofbrokered items
Value of brokereditems Country of origin
Finland 1 316 780 € 10 USA
Finland 1 108 284 € 14 Czech Republic
France 2 552 850 € 5 United Kingdom
France 2 109 082 € 8, 14 Finland
Germany 2 9 568 564 € 5 United Kingdom
Republic ofKorea 1 297 689 € 5 United Kingdom
Spain 2 366 795 € 5 United Kingdom
USA 1 212 635 € 5 United Kingdom
2. Brokering licences refused by Member States in 2010
SLOVENIA
DestinationNo. of
licencesrefused
Value of brokeringlicences denied
MLcategories
Quantity ofbrokered items
Value of brokereditems Country of origin
Turkmenistan 1 34 800,00 ML3 120 000 pcs 34 800,00 Bulgaria

C 382/460 RO Jurnalul Oficial al Uniunii Europene 30.12.2011
TABLE B.I
TOTAL NUMBER OF CONSULTATIONS INITIATED AND TOTAL NUMBER OF CONSULTATIONS RECEIVED BY EACH MEMBER STATE IN 2010
Member State Number of consultations initiated Number of consultations received
Austria 14 4
Belgium 15 1
Bulgaria 0 2
Cyprus 0 0
Czech Rep. 14 0
Denmark 0 0
Estonia 3 0
Finland 0 2
France 8 13
Germany 10 61
Greece 0 0
Hungary 0 0
Ireland 0 0
Italy 16 4
Latvia 2 0
Lithuania 4 0
Luxembourg 0 0
Malta 0 0
Netherlands 1 7
Poland 2 0
Portugal 5 1
Romania 0 0
Slovakia 0 0
Slovenia 0 0
Spain 0 0
Sweden 0 6
United Kingdom 15 8
TOTALS 109 109
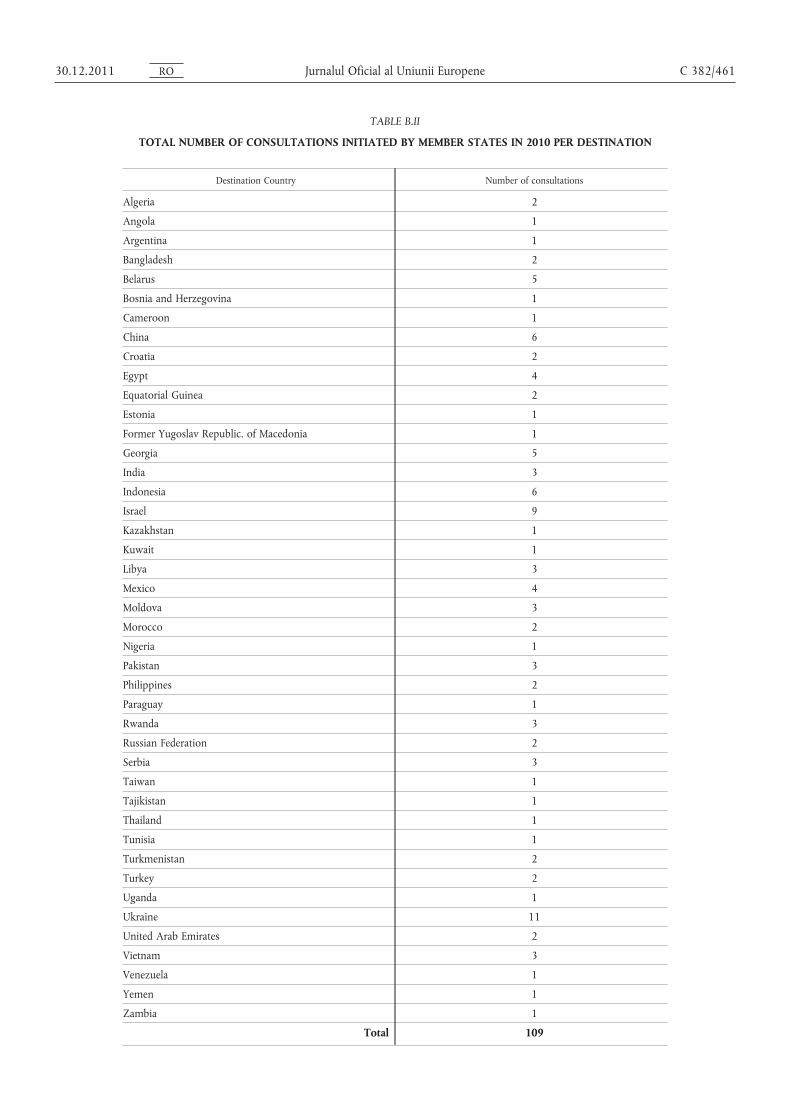
30.12.2011 RO Jurnalul Oficial al Uniunii Europene C 382/461
TABLE B.II
TOTAL NUMBER OF CONSULTATIONS INITIATED BY MEMBER STATES IN 2010 PER DESTINATION
Destination Country Number of consultations
Algeria 2
Angola 1
Argentina 1
Bangladesh 2
Belarus 5
Bosnia and Herzegovina 1
Cameroon 1
China 6
Croatia 2
Egypt 4
Equatorial Guinea 2
Estonia 1
Former Yugoslav Republic. of Macedonia 1
Georgia 5
India 3
Indonesia 6
Israel 9
Kazakhstan 1
Kuwait 1
Libya 3
Mexico 4
Moldova 3
Morocco 2
Nigeria 1
Pakistan 3
Philippines 2
Paraguay 1
Rwanda 3
Russian Federation 2
Serbia 3
Taiwan 1
Tajikistan 1
Thailand 1
Tunisia 1
Turkmenistan 2
Turkey 2
Uganda 1
Ukraine 11
United Arab Emirates 2
Vietnam 3
Venezuela 1
Yemen 1
Zambia 1
Total 109

C 382/462 RO Jurnalul Oficial al Uniunii Europene 30.12.2011
TABLE C
MEMBER STATES’ IMPLEMENTING LEGISLATION OR ADMINISTRATIVE RULES FOR COMMON POSITIONS 2003/468/CFSP AND 2008/944/CFSP
Member State
Council Common Position 2003/468/CFSP on the control of arms brokering (OJ L 156, 25.5.2003, p. 79)
Council Common Position 2008/944/CFSP defining common rules governing control of exports of military
technology and equipment (OJ L 335, 13.12.2008, p. 99)
National legislation reference No
Information concerning state of play
National legislation or administrative rules
reference No
Information concerning state of play
Austria Foreign Trade Act (AussHG, Federal Gazette I No 50/2005) and War Material Act (KMG Federal Gazette I no. 540/1977 as amended by Federal Gazette I No 50/2005)
Implementation completed
Foreign Trade Act (AussHG, Federal Gazette I No 50/2005) and War Material Act (KMG Federal Gazette I no. 540/1977 as amended by Federal Gazette I No 50/2005)
Implementation completed
Belgium Law of25 March 2003, article 15, (published in Moniteur belge of7.7.2003, modifying law of 5.8.1991
Partial implementation Law Law of26 March 2003 (published in Moniteur belge of 7.7.2003, modifying law of5.8.1991
under review
Bulgaria Latest amendments: Law on export control of arms and dual use items and technologies into force 5.2.2007
Regulation for the implementation of the Export Control Law (adopted by Decree 72/3.4.2007)
Implementation completed
Ministerial Decree -November 2009
Implementation completed
Cyprus A new basic law for the control of exports and imports has already been approved by the Parliament. Regulations, by which Common Position 2008/944/CFSP and Common Position 2003/468/CFSP will be implemented, have been approved by the Council of Ministers and have been sent to the Parliament for approval.
Czech Republic
Amendment to Act No 38/1994 on foreign trade in military material, amended by Act No 357/2004 to make clear reference to brokering activities and by act No 220/2009.
Implementation completed.
Amendment to Act No 38/1994 on foreign trade in military material amended by act No 220/2009 reflects certain provisions of the Common Position.
Consequent implementation within directive 2009/43/EC.
New National ML listing 22 items in conformity with the EU ML will be included.
Denmark Act No 555 of24 June 2005 on brokering, incorporated in Consolidated Weapons and Explosives Act No 704/2009
Implementation completed.
Consolidated Act No 704 of22 June 2009 on Weapons and Explosives
Implementation completed
(In Denmark national law will not have to be changed after the adoption of the Common Position. The criteria of the Common Position are taken into account as a minimum standard in the assessment of licence applications).

Member State
Council Common Position 2003/468/CFSP on thecontrol of arms brokering (OJ L 156, 25.5.2003, p. 79)
Council Common Position 2008/944/CFSP definingcommon rules governing control of exports of military
technology and equipment (OJ L 335, 13.12.2008, p. 99)
National legislationreference No
Information concerningstate of play
National legislation oradministrative rules
reference No
Information concerningstate of play
30.12.2011 RO Jurnalul Oficial al Uniunii Europene C 382/463
Estonia Strategic Goods Act RT I 2004, 2,7 amended by RT I 2004 53, 366
Implementation completed
Strategic Goods Act RT I 2004, 2,7 amended by RT I 2004 53, 366
Licensing assessments are made in line with the criteria of the Common Position. The new Strategic Goods Act will have relevant references to the Common Position.
Finland Decision of Council of State on General Guidelines for Export, Transit and Brokering of Defence Material (1000/2002)
Fully implements the Common Position on Brokering
The former EU CoC is already incorporated into the Finnish legislation as an annex to the National Guidelines (1000/2002).
Changes will be made as one part of the ongoing work on revising the legislation on export of defence equipment.
France Decree n° 95-589 (6th May 1995) as modified by Decree 2002-23
Law Amendment to fully implement Common Position in preparation
In France national law will not have to be changed after the adoption of the Common Position. The existing legal requirements in connection with the political principles adopted by the government make it possible to immediately apply the regulations laid down in the Common Position.
General directives approved by political authorities and specific directives in the event of specific situations, such as embargoes, conflict areas, or human rights situation.
France bases its export decisions on the criteria defined in the framework of international treaties, conventions, instruments or fora to which it subscribes (such as Common Position 2008/944/CFSP, criteria laid down by the United Nations, the OSCE, the European Council)
Germany Legislation on brokering of war weapons adopted in 1978.
Amendment to fully implement the Common Position on brokering (2003/468/GASP) is in force since the end of July 2006. This means that not only the brokering of war weapons, but of all items of the EU Common Military list is controlled.
Implementation completed
In Germany national law will not have to be changed after the adoption of the Common Position. The existing legal requirements in connection with the‘Political Principles Adopted by the Government of the Federal Republic of Germany for the Export of War Weapons and Other Military Equipment’ make it possible to immediately apply the regulations laid down in the Common Position..
Implementation completed
Greece Amendment of Law 2168/1993 to implement Common Position in preparation

Member State
Council Common Position 2003/468/CFSP on thecontrol of arms brokering (OJ L 156, 25.5.2003, p. 79)
Council Common Position 2008/944/CFSP definingcommon rules governing control of exports of military
technology and equipment (OJ L 335, 13.12.2008, p. 99)
National legislationreference No
Information concerningstate of play
National legislation oradministrative rules
reference No
Information concerningstate of play
C 382/464 RO Jurnalul Oficial al Uniunii Europene 30.12.2011
Hungary Gov. decree. 16/2004 on the licensing of the export, import, transfer and transit of Military equipment and technical assistance
Implementation completed
The Code of Conduct on arms export has been incorporated into Government Decree 16/2004 on arms exports since May 1, 2004.
Implementation is completed. Council Common Position 2008/944/CFSP is represented in Government Decree 16/2004 on arms exports and is effective since December 1, 2009.
Ireland Control of Exports Act 2008 (No 1 of 2008)
Consultations being initiated with Attorney General on eventual need for implementing legislation.
Italy New draft law for all the sector is in preparation and will include also the Common Position
New draft law for all the sector is in preparation and will include also the Common Position
Latvia Law on the Circulation of Strategic Goods (in force since19 July 2007)
Implementation completed
Law on the Circulation of Strategic Goods (in force since19 July 2007)
Implementation to be completed soon.
Regulation on implementation to be passed by the Government in due course.
Lithuania Law on the Control of Strategic Goods which came into effect on1 August 2004, amended 6 April 2006 (effective from1 July 2006)
Implementation completed
Law on the Control of Strategic Goods which came into effect on1 August 2004, amended 6 April 2006 (effective as of1 July 2006)
Pending amendment of the Law on the Control of Strategic Goods: references to EU Code of Conduct have to be replaced with references to Common Position.
Luxembourg Amendment to implement Common Position in preparation
Malta Subsidiary legislation 365.13
Military equipment export control regulations
Implementation completed
Legal Notice 168/2006.
Implementation completed
Netherlands Decree on Financial Involvement concerning Strategic Goods Order of 1996, as amended in 1999 and 2001;
1997 Arms and Ammunitions Act
Implementation completed
In the Netherlands national law will not have to be changed after the adoption of the Common Position. The legal basis for the application of the regulations laid down in the Common Position consists of several existing Acts, Decrees, Decisions and Regulations
Implementation completed

Member State
Council Common Position 2003/468/CFSP on thecontrol of arms brokering (OJ L 156, 25.5.2003, p. 79)
Council Common Position 2008/944/CFSP definingcommon rules governing control of exports of military
technology and equipment (OJ L 335, 13.12.2008, p. 99)
National legislationreference No
Information concerningstate of play
National legislation oradministrative rules
reference No
Information concerningstate of play
30.12.2011 RO Jurnalul Oficial al Uniunii Europene C 382/465
Poland (1) Law of 29/11/2000 on foreign trade in goods, technologies and services of strategic importance to the security of the state and to maintaining international peace and security (uniform text -Journal of Laws of 2004, No 229, item 2 315) (1)
Implementation completed
Framework provisions of the amendment of the Law of 29/11/2000 that covers trade in arms and in dual-use goods has been accepted by the Council of Ministers of Poland. The amendment is planned to be completed (adopted by the Parliament and then signed by the President) by the end of 2011. The aim of the amendment is that the Law duly reflects and complies with the provisions of Council Regulation (EC) No 428/2009 of5 May 2009 setting up a Community regime for the control of exports, transfer, brokering and transit of dual-use items and Directive 2009/43/EC of the European Parliament and of the Council of6 May 2009 simplifying terms and conditions of transfers of defence-related products within the Community.
Portugal Law no. 49/2009 of5 August 2009
Implementation completed
New Law under preparation. It will be in line with the Council Common Position 2008/944/CFSP and include provisions on intra-community transfers, in compliance with the Directive on intra-community transfers.
Romania Law no. 595/2004 and Order no. 59/2005
Implementation completed
Slovakia Law no. 179/1998 on trading in military material, as amended
Implementation completed
In preparation within the ongoing process of legislation revision together with Directive 2009/43/EC.
In current practice all export licence applications are assessed against the criteria of the Common Position.

Member State
Council Common Position 2003/468/CFSP on thecontrol of arms brokering (OJ L 156, 25.5.2003, p. 79)
Council Common Position 2008/944/CFSP definingcommon rules governing control of exports of military
technology and equipment (OJ L 335, 13.12.2008, p. 99)
National legislationreference No
Information concerningstate of play
National legislation oradministrative rules
reference No
Information concerningstate of play
C 382/466 RO Jurnalul Oficial al Uniunii Europene 30.12.2011
Slovenia Decree on permits and consents for trade and production of military weapons and equipment (Official Gazette 18/03, 31/05, 113/07). Brokers are bound to obtain trading permit.
Implementation completed
Article 77 of the Defence Act (Official Gazette 103/04) specifies that an export license may be refused on the basis of Slovenia’s international commitments and obligations.
Amendments to the legislation concerning Defence exports and inclusion of provisions on Intra-Community Transfers, in line with the Directive on Intra-Community Transfers, are in preparation.
Spain Royal Decree 844/11 of 17/06/2011. Adapted to Council Regulation (EC) No 428/2009, incl. brokering services.
Law 53/2007 of 28/12/2007
Implementation completed
Law 53/2007 of 28/12/2007
Royal Decree 844/11 will be in force in Dec. 2011, incorporating Common Position 2008/944/CFSP
Sweden Military equipment act 1992:1 300 as last amended by 2008:885.
Implementation completed
— Budget letter for the licensing authority, No UD2009/83 256/ PLAN
— the Ordinance with instructions for the licensing authority, No 2007:1 219.
Possible measures will be reviewed in connection with an analysis of the implementation requirements of Directive 2009/43/EC on Intra-Community Transfers.
United Kingdom
Trade in controlled goods order effective1 May 2004
Implementation completed
All export licence applications are required by statute to be assessed against the Consolidated EU and National Arms Export Licensing Criteria which reflects the Common Position.
The UK is working to bring the Consolidated EU and National Arms Export Licensing Criteria fully in line with the Common Position, this should be completed early 2011.
(1) Poland first adopted legislation covering brokering activities in the Act of 11 December 1997 on administrating of foreign trade in goods and services and transfers of special goods (Journal of Laws 1997, No 157, item 1026).

30.12.2011 RO Jurnalul Oficial al Uniunii Europene C 382/467
TABLE D
Beneficiary countries, venue and date Organizer Brief description of assistance/outreach
PROMOTION OF CONTROL OF ARMS EXPORTS AND THE PRINCIPLES AND CRITERIA OF COMMON POSITION 2008/944/CFSP AMONG THIRD COUNTRIES
North African countries (Algeria, Egypt, Libya, Morocco and Tunisia)Algeria, 23-24 March 2010
EU in implementation of Council Decision 2009/1 012/CFSP
Attended by all beneficiary countries
Host country: Algeria
Seminar divided into six sessions concerning the application of arms export control legislation, the EU Common Military List, putting the Common Position Criteria into practice, the end user verification for items in transit and transhipment, transparency and the UN process leading towards an Arms Trade Treaty.
Western Balkans countries (Albania, Bosnia and Herzegovina, Croatia, Serbia, Montenegro, FYROM)Bosnia and Herzegovina,15-16 June 2010
EU in implementation of Council Decision 2009/1 012/CFSP
Attended by all beneficiary countries
Host country: Bosnia and Herzegovina
Seminar divided into six sessions concerning the status of national law, licensing in practice, criteria of the EU Common Position 2008/944/CFSP, transparency and the state of the play of the Arms Trade Treaty. The seminar also included a workshop session, within case studies prepared beforehand by three beneficiary countries were discussed and analyzed
Eastern European and Caucasian partners of the Neighbourhood Policy(Armenia; Azerbaïdjan; Belarus; Georgia; Moldova and Ukraine)Ukraine, 17 – 18 November 2010
EU in implementation of Council Decision 2009/1 012/CFSP
Attended by Armenia, Belarus, Georgia and Moldova
Host country: Ukraine
Seminar divided into six sessions covering the following topics: the application of arms export controls, the EU Common Military List and how to enforce an effective export control system, the role of technical expertise in the licensing assessment and national approaches, transparency and, finally, a session on the Arms Trade Treaty – report on state of the play.. On the second day, an additional session was dedicated to two workshops: one workshop focussed on outreach to industry and the second on exporters’ internal compliance programs.
Western Balkans countries (Albania, Bosnia and Herzegovina, Croatia, Serbia, Montenegro, FYROM)Montenegro, 4-5 May 2011
EU in implementation of Council Decision 2009/1 012/CFSP
Attended by all beneficiary countries
Host country: Montenegro
Seminar divided into six sessions concerning the alignment with Common Position 2008/944/CFSP; controls on export/re-export, controls on transit, controls on brokering, transparency and, finally, the UN process for the negotiation of an Arms Trade Treaty. On the second day, three working groups discussed case studies that had been prepared beforehand by the three beneficiary countries.
CroatiaHungary, 6-9 June 2011
EU and Hungary in implementation of Council Decision 2009/1 012/CFSP
Host country: Hungary
Study visit of Croatian export control officers hosted by Hungary. The study visit addressed arms exports-related customs issues, brokering and transit controls, the Hungarian Licensing system, transposition of ICT Directive into Hungarian legislation reporting and transparency, exporters’ internal compliance program and the national implementation of international and EU sanctions and challenges of accession to the EU on the field of export controls. A meeting with the Hungarian Defence Industry Association also took place.
Former Yugoslav Republic of Macedonia and MontenegroPortugal, 10-14 October 2011
EU and Portugal in implementation of Council Decision 2009/1 012/CFSP
Host country: Portugal
In progress
Study visit of export control officers from Montenegro and the Former Yugoslav Republic of Macedonia hosted by Portugal. The study visit addressed issues like: the arms export control organisation in Portugal, the legal framework with focus on the transposition on the ICT Directive, practical aspect from day to day real case scenarios, arms export controls from the perspective of the Ministry of Foreign Affairs, Customs and companies.
Croatia, Former Yugoslav Republic of Macedonia and MontenegroPoland, 14-18 November 2011
EU and Poland in implementation of Council Decision 2009/1 012/CFSP
Host country: Poland

Beneficiary countries,venue and date Organizer Brief description of assistance/outreach
C 382/468 RO Jurnalul Oficial al Uniunii Europene 30.12.2011
Eastern European and Caucasian partners of the Neighbourhood Policy(Armenia; Azerbaïdjan; Belarus; Georgia; Moldova and Ukraine)Ukraine, 22 – 23 November 2011
EU in implementation of Council Decision 2009/1 012/CFSP
It is planned to divide the seminar into three main sessions with focus on Common Position 2008/944/CFSP, special cases of items/goods – re-export/transshipment, including transfer of technology, transit and brokering. On the second day, an additional session on case studies concerning brokering and transit/transhipment.
PROMOTION OF ARMS TRADE TREATY PROCESS
OSCE countriesAustria, 11-12 February 2010
EU in implementation of Council Decision 2009/42/CFSP
The first session of the seminar was devoted to a series of presentations and debates on the ATT and the related UN process.
The second part of the seminar included working group discussions on the basis of food-for-though questions related to problems posed to the region by the unregulated trade of conventional weapons and the impact an ATT might have on regional security. The working group discussions also addressed issues of scope and parameters of a possible ATT and next steps and main challenges in the ATT process at national, regional and international level.
WorldwideAustria, 12 February 2010
EU in implementation of Council Decision 2009/42/CFSP
Concluding seminar of the series foreseen by Council Decision 2009/42/CFSP in support of an ATT and implemented by the UN Institute for Disarmament Research (UNIDIR).
It provided the opportunity to take stock of the discussions held in the six regional seminars held so far and left room for additional presentations on the global arms trade and the main elements of the discussions on an Arms Trade Treaty.
Side-event in the margins of the ATT Preparatory CommitteeNew York, 15 July 2010
EU in implementation of Council Decision 2010/336/CFSP
The objective of the side-event was to present the rationale and main elements of Council Decision 2010/336/CFSP on ‘EU activities in support of the Arms Trade Treaty, in the framework of the European Security Strategy’ adopted by the Council of the European Union on 14 June 2010.
The side event enabled to raise awareness of future target groups of countries and to encourage their wide and active participation, as well as to seek input from UN Member States, civil society, researchers and non-governmental organizations (NGOs).
South and Central Asia countriesNepal, 10-12 November 2010
EU in implementation of Council Decision 2010/336/CFSP
The first part of the seminar concentrated on the Arms Trade Treaty (ATT) negotiations, with an overview of the process and the Treaty’s possible elements. It also provided opportunities for participants to share their national and regional views on the ATT and its different aspects, including transparency and assistance measures. The second half of the seminar discussed cooperation, assistance and capacity building to regulate trade in conventional weapons and addressed issues of the provision and enforcement of effective arms transfer control systems.
Northern, Western and Central Africa countriesMorocco, 2-4 February 2011
EU in implementation of Council Decision 2010/336/CFSP
The first part of the seminar concentrated on the ATT negotiations, with an overview of the process and the future treaty’s elements such as scope, parameters, cooperation and assistance and implementation. Opportunities were also provided for participants to share their national and regional views on the ATT and its different aspects. The second half of the seminar was more technical and practice-oriented, and discussed inter alia existing arms transfer control systems, challenges in their implementation and possibilities for further cooperation, assistance and capacity-building to ensure effective implementation of the future ATT.
Side-event in the margins of the ATT Preparatory CommitteeNew York, 1 March 2011
EU in implementation of Council Decision 2010/336/CFSP
The purpose of the event was to provide an update on ATT-related EU outreach activities mainly by sharing the results of the two first regional seminars funded by Council Decision 2010/336/CFSP with all relevant stakeholders gathered in New York for the PrepCom meeting.
The event also enabled to discuss substantive issues relating to the current ATT debates and process, especially the possible scope and parameters.

Beneficiary countries,venue and date Organizer Brief description of assistance/outreach
30.12.2011 RO Jurnalul Oficial al Uniunii Europene C 382/469
American and Caribbean countriesUruguay, 27-29 April 2011
EU in implementation of Council Decision 2010/336/CFSP
The first part of the seminar was devoted to a series of presentations and working group discussions on the ATT and the related UN process.
The second part of the seminar offered the opportunity for participants to present specific aspects of their national transfer controls system, focusing in particular on legal and administrative aspects, and on transparency and record keeping/reporting mechanisms. A case study on arms transfer controls was also proposed by an EU expert for analysis by participants.
The second part of the seminar included working groups discussions among participants on the basis of food-for-though questions related to specific aspects of national transfer control systems, challenges and assistance needs.
East Asia and Pacific countriesIndonesia, 6-8 June 2011
EU in implementation of Council Decision 2010/336/CFSP
The first part concentrated on the ATT negotiations, with an overview of the process and discussions on the Treaty’s possible elements. This first part was also the opportunity to share national and regional views on the ATT and its different aspects, including transparency and assistance measures.
The second half of the seminar included presentations of national and regional systems to control the trade in conventional weapons and discussed issues related to establishment and enforcement of licensing regimes.
Side-event in the margins of the ATT Preparatory CommitteeNew York, 13 July 2011
EU in implementation of Council Decision 2010/336/CFSP
The purpose of the event was to provide an update on ATT-related EU outreach activities mainly by sharing the results of the third and fourth regional seminars funded by Council Decision 2010/336/CFSP with relevant stakeholders gathered in New York for the PrepCom meeting.
The event also enabled to discuss substantive issues relating to the current ATT debates and process, especially the possible scope and parameters.
Side-event in the margins of the UN General Assembly First CommitteeNew York, 17 October 2011
EU in implementation of Council Decision 2010/336/CFSP
The purpose of the event was to provide an update on ATT-related EU outreach activities mainly by sharing with relevant stakeholders, gathered in New York for the UN General Assembly First Committee, the findings of recent research papers on themes related to the Arms Trade Treaty, financed by Council Decision 2010/336/CFSP.

C 382/470 RO Jurnalul Oficial al Uniunii Europene 30.12.2011
TABLE E
INTERNET ADDRESSES OF MEMBER STATES’ NATIONAL WEBSITES PROVIDING NATIONAL REPORTS ON ARMS EXPORTS
Austria http://www.bmeia.gv.at
Belgium (Flanders) www.vlaanderen.be/csg
(Walloon Region and Brussels capital under construction)
Bulgaria http://www.mee.government.bg/ind/lic/arms.html
Czech Republic: http://www.mzv.cz/wwwo/mzv/default.asp?ido=15135&idj=2&amb =1&ikony=True&trid=1&prsl=True&pocc1=8
(www.mzv.cz/kontrolaexportu)
Denmark ‘Udførsel af vaben og produkter med dobbelt anvendelse fra Danmark’
http://www.um.dk/da/menu/Udenrigspolitik/FredSikkerhedOgInternationalRetsorden/ NedrustningIkkespredningOgEksportkontrol/Eksportkontrol/Udfoerselsrapporter/
Estonia http://www.vm.ee/eng/kat_153
Finland http://www.defmin.fi/index.phtml?l=en&s=2
France http://www.defense.gouv.fr/defense/enjeux_defense/defense_au_parlement/ rapports_dactivite/rapport_au_parlement_sur_les_exportations_darmement_2006
http://www.defense.gouv.fr/das/node_97861/transferts_sensibles1
http://www.diplomatie.gouv.fr/fr/actions-france_830/desarmement-maitrise-armements-controle-exportations_4852/controle-exportations-instrument-prevention_4867/index.html
Germany http://www.bmwi.de/English/Redaktion/Pdf/2009-military-equipment-export-report,property=pdf,bereich=bmwi,sprache=en,rwb=true.pdf and:
http://www.bafa.de/bafa/en/export_control/index.html (general information on the German export control system).
Hungary http://mkeh.gov.hu/haditechnika/haditechnika_kulkereskedelem/6a_Jelentesek
Ireland http://www.djei.ie/trade/export/military.htm
Italy http://www.camera.it
Netherlands www.rijksoverheid.nl/exportcontrole (site in Dutch language, including link to English site)
http://english.minlnv.nl/portal/page?_pageid=116,4089799&_dad=portal&_schema=PORTAL (English site; temporary)
Poland http://dke.mg.gov.pl
Portugal http://www.mdn.gov.pt/mdn/pt/mdn/organograma/dgaed/ciaarmamento/ DGAED_Comercio_Industria_Armamento_relatorios_anuais.htm
Romania www.ancex.ro, www.export-control.ro
Slovakia www.economy.gov.sk
Slovenia http://www.mors.si/index.php?id=5&L=1in
Spain (Versión en español)
http://www.comercio.es/comercio/bienvenido/Comercio+Exterior/Informacion+sectorial/ Material+de+Defensa+y+de+Doble+Uso/pagPublicaciones.htm
(English version)
http://www.comercio.es/comercio/bienvenido/Comercio+Exterior/Informacion+sectorial/ Material+de+Defensa+y+de+Doble+Uso/pagPublicacionesen_.htm
Sweden http://www.sweden.gov.se/sb/d/574/a/128176
United Kingdom http://www.fco.gov.uk/en/publications-and-documents/publications1/annual-reports/export-controls1


RO