Embed Size (px)
Citation preview

Alternative Energy Sector 2014 Outlook
Yin Lei
December 2013

文件名称 日期
Chapter 1 Solar sector review and outlook 5
Chapter 2 Wind sector review and outlook 14
Chapter 3 Valuation and stock picks 20
2

文件名称 日期
R: 235 G: 213 B: 235
R: 200 G: 140 B: 200
R: 154 G: 170 B: 182
R: 130 G: 62 B: 130
R: 191 G: 191 B: 191
R: 127 G: 127 B: 127
R: 234 G: 236 B: 235
3
Wind power upstream industries: earnings recovery and valuation expansion
Wind power downstream industries: grid curtailment further improves; wait for
incentive policies
Solar upstream industries: recovering total demand; stable price; cost and new
techniques
Solar downstream industries: golden period for solar farm development; new business
model
Investment suggestions: we prefer solar downstream and wind power upstream
industries
Stock picks: Goldwind (2208 HK), Goldpoly (686 HK) and Guodian T&E (1296 HK)
Key points

文件名称 日期
R: 235 G: 213 B: 235
R: 200 G: 140 B: 200
R: 154 G: 170 B: 182
R: 130 G: 62 B: 130
R: 191 G: 191 B: 191
R: 127 G: 127 B: 127
R: 234 G: 236 B: 235
4
Company Code Mkt cap Price EPS PE PB ROE %
Rating 2012 2013E 2014E 2012 2013E 2014E 2012 2013E 2014E 2012 2013E 2014E
Goldwind 2208
HK 28288 7.58 0.06 0.15 0.32 126.33 50.87 23.69 1.58 1.55 1.46 1.25 3.05 6.18 Buy
CHS 658 HK 5478 3.89 0.19 0.09 0.30 16.81 35.50 10.53 0.56 0.58 0.56 4.14 3.54 5.43 NR
Longyuan 916 HK 79965 9.97 0.38 0.38 0.49 20.65 20.71 15.98 2.02 1.90 1.73 9.94 9.56 11.15 Neutral
Datang 1798
HK 10983 1.53 0.02 0.05 0.08 102.00 28.87 18.21 1.26 1.23 1.16 1.24 4.27 6.36 Neutral
Huaneng 958 HK 27199 3.38 0.07 0.14 0.18 36.68 18.61 13.83 1.80 1.63 1.47 5.09 9.16 11.08 NR
GCL-Poly 3800
HK 39325 2.54 -0.07 -0.06 0.09 N/A N/A 29.20 1.98 2.53 2.34 -3.77 -5.74 6.72 Buy
Comtec 712 HK 2077 1.61 0.05 0.04 0.10 25.54 29.19 12.14 0.88 0.94 0.87 -3.61 3.53 7.23 Buy
Singyes 750 HK 5964 8.85 0.59 0.79 0.94 11.46 8.58 7.21 2.27 1.85 1.48 21.32 22.93 22.69 Buy
Hdfx 816 HK 20276 2.68 0.17 0.20 0.23 12.44 10.61 8.93 1.49 1.30 1.14 13.42 13.28 13.94 Buy
Jingneng 579 HK 23189 3.65 0.14 0.20 0.29 20.10 13.93 9.57 N/A 1.68 1.46 N/A 12.67 16.19 Buy
Figure: Company earnings forecast
Source: Bloomberg, CMS(HK) Notes: closing prices as of Nov. 29

文件名称 日期 Chapter 1
Solar sector review and outlook
5

文件名称 日期
R: 235 G: 213 B: 235
R: 200 G: 140 B: 200
R: 154 G: 170 B: 182
R: 130 G: 62 B: 130
R: 191 G: 191 B: 191
R: 127 G: 127 B: 127
R: 234 G: 236 B: 235
Solar sector review and outlook
6
Solar industry research framework - factor analysis
Solar sector 2013 review
Solar sector 2014 outlook
1
2
3

文件名称 日期
R: 235 G: 213 B: 235
R: 200 G: 140 B: 200
R: 154 G: 170 B: 182
R: 130 G: 62 B: 130
R: 191 G: 191 B: 191
R: 127 G: 127 B: 127
R: 234 G: 236 B: 235
7
Solar value chain: poly-silicon/mono-crystal silicon-wafer-cell-module-EPC-operation
Poly-silicon: price; cost; poly-silicon import; anti-dumping; GCL(3800.HK), DQ(DQ US EQUITY),
TBEA(600089.CH)
Mono wafer: high conversion efficiency; the US, Japan and China; Comtec(712.HK), Longi(601012.CH),
Zhonghuan(002129.CH)
Cell & module: gross margin; debt ratio; price & cost; overseas demand; US listed companies
EPC/Operating: EPC ASP; EPC gross margin; IRR; Goldpoly(686.HK), Zhongli(002309.CH), Huabei
Expressway(000916.CH), GCL(3800.HK), Guodian T&E(1296.HK), Singyes(750.HK)
Fundamentals
Policy: newly added installation plan; FIT policy change
Earnings: earnings turning point of the whole industry has appeared
Demand: domestic market emerges; weakened EU market; strong demand from the US & Japan
Generation cost: grid parity in the near future; new techniques and high conversion efficiency
Stock price factors
Policy change, price, new orders, earnings trend, event driven
Unique opinions
Industry recovery, not short term rebound; closer to the grid parity
Steady industry recovery; overcapacity may not be a great concern
Solar industry research framework - factor analysis

文件名称 日期
R: 235 G: 213 B: 235
R: 200 G: 140 B: 200
R: 154 G: 170 B: 182
R: 130 G: 62 B: 130
R: 191 G: 191 B: 191
R: 127 G: 127 B: 127
R: 234 G: 236 B: 235
8
2013 in review
Solar trade war between China & the EU
Better than expected EU anti-dumping case
Price guarantee agreement: a minimum import price for Chinese solar panels of €0.56 per Watt has been
set with no more than 7GW of product entering the EU market from China annually
The anti-subsidy investigation would continue
Finally, import price of Chinese solar panels has actually increased around 20%; Chinese panel makers only
lose 30% of the original market share in the EU
Disappointing poly-silicon anti-dumping in China
In July, China’s Ministry of Commerce(MOFCOM) imposed anti-dumping import tariff of to 53.7%-57% on
solar-grade poly-silicon from the US and of 2.4%-48.7% from South Korea but did not impose anti-dumping
tariff on solar-grade poly-silicon from the EU temporarily.
In September, China’s Ministry of Commerce imposed preliminary anti-subsidy duties on some solar-grade
poly-silicon imports from the U.S. Beginning on September 20, importers of poly-silicon from Hemlock
Semiconductor Corp and AE Poly-silicon Corp will have to pay the duties.
The poly imports to China in 2013Q3 was 19,723 MT, representing a 10.03% increase from 17,925MT in Q2.
The unit price was slightly higher but is likely to stay below the manufacturing cost of foreign producers. The
poly imports from US and South Korea in September were mainly in the form of processing trade and
imports through tax-free zones, leading to lower-than-expected ASP increase of poly-silicon.
China's Ministry of Commerce announced on October 31, 2013 that it will extend its anti-dumping and anti-
subsidy investigations of solar-grade poly-silicon imports from the EU for another six months.

文件名称 日期
R: 235 G: 213 B: 235
R: 200 G: 140 B: 200
R: 154 G: 170 B: 182
R: 130 G: 62 B: 130
R: 191 G: 191 B: 191
R: 127 G: 127 B: 127
R: 234 G: 236 B: 235
9
2013 in Review
Figure: Monthly poly import in China
Disappointing poly-silicon anti-dumping in China
Since August, poly-silicon import has remained high and import price has remained
low
Stock price of GCL-Poly fluctuated with the price of poly-silicon
Figure: GCL stock price & poly price
Source: Company data, Wind Source: PVinsights
18.5
17.7
19.4
18.0 18.2
18.8
20.0
18.8
19.6
18.3
16.5
17.0
17.5
18.0
18.5
19.0
19.5
20.0
20.5
0
1000
2000
3000
4000
5000
6000
7000
8000
9000
2013/0
1
2013/0
2
2013/0
3
2013/0
4
2013/0
5
2013/0
6
2013/0
7
2013/0
8
2013/0
9
2013/1
0
Poly import(MT) ASP($/w)
10.0 11.0 12.0 13.0 14.0 15.0 16.0 17.0 18.0 19.0 20.0
0.0
0.5
1.0
1.5
2.0
2.5
3.0
20
13-0
1-0
2
20
13-0
1-2
3
20
13-0
2-1
3
20
13-0
3-0
6
20
13-0
3-2
7
20
13-0
4-1
7
20
13-0
5-0
8
20
13-0
5-2
9
20
13-0
6-1
9
20
13-0
7-1
0
20
13-0
7-3
1
20
13-0
8-2
1
20
13-0
9-1
1
20
13-1
0-0
2
20
13-1
0-2
3
20
13-1
1-1
3
GCL-Poly stock price(HK$) Poly price(US$/w)

文件名称 日期
R: 235 G: 213 B: 235
R: 200 G: 140 B: 200
R: 154 G: 170 B: 182
R: 130 G: 62 B: 130
R: 191 G: 191 B: 191
R: 127 G: 127 B: 127
R: 234 G: 236 B: 235
10
2013 in Review
Solar policy review and outlook
Existing policy March 1st: State Grid-Comments on grid connection of distributive generation
May: Ministry of Finance-Notice of auditing of Golden Sun subsidy
June 16th: NEA-Drafts on demonstration area of solar distributive generation
July 15th: the State Council-Opinions on promoting healthy development of solar industry
July 18th: NDRC-Interim measures of management of solar generation
July 24th: Ministry of Finance-New FIT policy of solar distributive generation
August 9th: NEA-Notice about demonstration area construction of solar distributive
generation
August 26th: NDRC-Notice about using price tools to promote healthy development of the
solar industry
August 30th: NDRC-Notice about adjustment of electricity price surcharge of renewable
energy
September: NEA-Interim measures of solar project management
September: The Ministry of Industry and Information Technology-Standards of solar
manufacturing industry
September: NEA&NDB-Opinions on supportive financial services of solar distributive
generation
November: NEA-Interim measures of solar distributive generation
December: NEA-Interim measures of operation and supervision of solar generation
Upcoming policies Renewable Portfolio Standard (under review)
The Ministry of Industry and Information Technology-Guidance on M&A of the solar
industry(under review)

文件名称 日期
R: 235 G: 213 B: 235
R: 200 G: 140 B: 200
R: 154 G: 170 B: 182
R: 130 G: 62 B: 130
R: 191 G: 191 B: 191
R: 127 G: 127 B: 127
R: 234 G: 236 B: 235
11
2013 in Review
Figure: Quarterly gross margin of US listed solar
stocks
In 1H2013 earnings turning point of the industry was confirmed
In Q3, profit margins continued to improve.
Main reasons: increased cell & module prices; some companies extend the business
to downstream solar farms.
Figure: Quarterly net profit margin of US listed
solar stocks
-200%
-150%
-100%
-50%
0%
50%
100%
3Q
2010
4Q
2010
1Q
2011
2Q
2011
3Q
2011
4Q
2011
1Q
2012
2Q
2012
3Q
2012
4Q
2012
1Q
2013
2Q
2013
3Q
2013
Trina Yingli LDK JA SolarHanwha Canadian Solar ReneSola JinkoCSUN DQ
-1400%
-1200%
-1000%
-800%
-600%
-400%
-200%
0%
200%
3Q
2010
4Q
2010
1Q
2011
2Q
2011
3Q
2011
4Q
2011
1Q
2012
2Q
2012
3Q
2012
4Q
2012
1Q
2013
2Q
2013
3Q
2013
Trina Yingli LDK JA SolarHanwha Canadian Solar ReneSola JinkoCSUN DQ
Source: Bloomberg Source: Bloomberg

文件名称 日期
R: 235 G: 213 B: 235
R: 200 G: 140 B: 200
R: 154 G: 170 B: 182
R: 130 G: 62 B: 130
R: 191 G: 191 B: 191
R: 127 G: 127 B: 127
R: 234 G: 236 B: 235
12
Solar Industry 2014 Outlook
Macro View
Government continues to strongly support the whole industry
Market performances may differentiate after announcement of the annual results
Marginal utility of incentive policies for stock prices may decrease
Meso View
Distributive generation vs concentrated generation: Distributive generation is the future trend. In the short
term, however, concentrated projects have higher IRRs.
EPC only vs new business model: Gross margin of solar EPC has downside risks. Solar projects with
favorable grid connection are scarce resources. Financing may be a problem for private companies.
Opportunities for solar manufacturing: new techniques to improve the conversion efficiency and decrease
the cost; extension to solar farm business; M&A
Micro View
Goldpoly(686.HK): Brand new business model may be recognized by the market.
Guodian T&E(1296.HK): provides solar EPC for Goldpoly
GCL-Poly(3800.HK): captive power plant in Q1, FBR techniques in Q4, and solar farm business
Comtec(712.HK): The market may expect a turning point of profit margins; enlarged customer base
Singyes Solar(750.HK): EPC gross margin and new EPC orders

文件名称 日期
R: 235 G: 213 B: 235
R: 200 G: 140 B: 200
R: 154 G: 170 B: 182
R: 130 G: 62 B: 130
R: 191 G: 191 B: 191
R: 127 G: 127 B: 127
R: 234 G: 236 B: 235
13
Solar Industry 2014 Outlook
Figure: 2013-2014 Global Solar Installation Forecast
According to IHS’s report, global new installation may reach 40-45GW in 2014 with an
increase of 15% YoY.
According to NEA’s guidance, China will increase 8 GW solar distributive generation
and 4GW concentrated projects.
According to Opinions on promoting healthy development of the solar industry issued
by the State Council, at least 10 GW solar projects will be installed each year between
2013 and 2015.
Figure: 2013-2015 China Solar Installation Forecast
Source: CMS(HK) estimates
0.0
2.0
4.0
6.0
8.0
10.0
12.0
14.0
16.0
2008 2009 2010 2011 2012 2013E 2014E 2015E
New installation(GW) Distributive generation(GW)

文件名称 日期 Chapter 2
Wind sector review and outlook
14

文件名称 日期
R: 235 G: 213 B: 235
R: 200 G: 140 B: 200
R: 154 G: 170 B: 182
R: 130 G: 62 B: 130
R: 191 G: 191 B: 191
R: 127 G: 127 B: 127
R: 234 G: 236 B: 235
Wind sector review and outlook
15
Wind sector research framework- factor analysis
Wind sector 2013 review
Wind sector 2014 outlook
1
2
3

文件名称 日期
R: 235 G: 213 B: 235
R: 200 G: 140 B: 200
R: 154 G: 170 B: 182
R: 130 G: 62 B: 130
R: 191 G: 191 B: 191
R: 127 G: 127 B: 127
R: 234 G: 236 B: 235
16
Wind sector value chain: components - wind turbine - wind farm operation
Components: gearbox, electronic control system, generator, blade, tower and etc
Wind turbine: direct drive and double fed; Goldwind(2208.HK)
Wind farm operation: power generation groups such as Longyuan(under Guodian Group)
Fundamental factors
Components & Wind turbine: gross margin, price, demand
Wind operating: utilization hour, grid curtailment, wind turbine price, debt ratio and policy
Stock price factors
Policy expectation, new capacity, grid curtailment, industry consolidation
Unique views
Optimistic views on earnings recovery and valuation expansion
Optimistic views on grid curtailment
Incentive policies deserve attention
Wind sector research framework - factor analysis

文件名称 日期
R: 235 G: 213 B: 235
R: 200 G: 140 B: 200
R: 154 G: 170 B: 182
R: 130 G: 62 B: 130
R: 191 G: 191 B: 191
R: 127 G: 127 B: 127
R: 234 G: 236 B: 235
17
2013 in review
Figure: Quarterly open tender of wind turbine/GW
Wind turbine tender totaled12.8GW in the first three quarters of 2013 and is expected to reach
15GW in 2013 (+80% YoY). NEA has approved 90GW projects so far (60% of which have not
started bidding or are not under construction)
Wind turbine bidding prices remain stable and industry leaders enjoy price premium. Wind turbine
gross margins improve significantly. In the short term, however, increasing transport cost as more
projects are located in southern provinces may deserve attention.
Figure: Wind turbine price trend and Goldwind’s profit
margins
Source: Company data, CMS(HK) estimates
8.4
3.9
3.0
5.5
2.2 2.2
1.4
2.5
3.8
5.0
4.0
0.0
1.0
2.0
3.0
4.0
5.0
6.0
7.0
8.0
9.0
1Q11 2Q11 3Q11 4Q11 1Q12 2Q12 3Q12 4Q12 1Q13 2Q13 3Q13
Source: Company data, CMS(HK)
-5.0%
0.0%
5.0%
10.0%
15.0%
20.0%
25.0%
3,400
3,500
3,600
3,700
3,800
3,900
4,000
4Q
10
1Q
11
2Q
11
3Q
11
4Q
11
1Q
12
2Q
12
3Q
12
4Q
12
1Q
13
2Q
13
3Q
13
Wind turbine price(yuan/kw)
Gross margins of Goldwind
Net profit margins of Goldwind

文件名称 日期
R: 235 G: 213 B: 235
R: 200 G: 140 B: 200
R: 154 G: 170 B: 182
R: 130 G: 62 B: 130
R: 191 G: 191 B: 191
R: 127 G: 127 B: 127
R: 234 G: 236 B: 235
18
2013 in Review
Figure: Wind turbine market share in 1H2013
Wind turbine market share: In 1H, market concentration ratio increased (88% for top
10 players). Market shares of Goldwind and Mingyang increased, while market shares
of Sinovel and Dongfang Electric decreased.
Accelerated UHV line construction: Two lines are finished in 2013 (one is Hami to
Zhengzhou South with 6GW transmission capacity, which has not started bidding).
Three lines are expected to be finished in 2014. Planned transmission capacity may
reach 137GW as of the end of 2015.
Figure: Key planned transmission lines
Source: Company data Source: Company data, CMS(HK)
Goldwind, 23.30%
United Power, 14.60%
Mingyang, 10.20%
XEMC, 9.30%
Shanghai Electric, 8.50%
Sinovel, 7.10%
Haizhuang, 5.70%
Envision, 4.50%
Gamesa, 2.50%
Dongfang Electric, 2.40%
Others, 11.90%

文件名称 日期
R: 235 G: 213 B: 235
R: 200 G: 140 B: 200
R: 154 G: 170 B: 182
R: 130 G: 62 B: 130
R: 191 G: 191 B: 191
R: 127 G: 127 B: 127
R: 234 G: 236 B: 235
19
Wind industry 2014 outlook
Macro view
Government supports the development of renewable energy
Meso view
Industry recovering trend. We prefer wind turbine & components stocks.
Incentive policies: Opinions on promoting healthy development of the wind power industry, Renewable
Portfolio Standard
Micro view
Goldwind(2208.HK): industry recovery, earnings recovery, more concentrated market
Figure: 2013-2015 new installation forecast Figure: New capacity plans for leading wind operators
Source: CWEA, CMS(HK) Source: Company data, CMS(HK) estimates
0
500
1000
1500
2000
2500
Longyuan Huaneng Renewables
Datang Renewable
Power
2011 2012 2013E 2014E
3.3 6.2
13.8
18.9 17.6
13.0 15.0
18.0 20.0
0
20
40
60
80
100
120
140
0
5
10
15
20
25
New installation/GW Accumulated installation/GW

文件名称 日期 Chapter 3
Valuation and stock picks
20

文件名称 日期
R: 235 G: 213 B: 235
R: 200 G: 140 B: 200
R: 154 G: 170 B: 182
R: 130 G: 62 B: 130
R: 191 G: 191 B: 191
R: 127 G: 127 B: 127
R: 234 G: 236 B: 235
Valuation and stock picks
21
Indices and sector performance
Sector valuation
Stock picks
1
2
3
Valuation and ratings of HK listed stocks 4

文件名称 日期
R: 235 G: 213 B: 235
R: 200 G: 140 B: 200
R: 154 G: 170 B: 182
R: 130 G: 62 B: 130
R: 191 G: 191 B: 191
R: 127 G: 127 B: 127
R: 234 G: 236 B: 235
HK solar stocks lag behind HK wind stocks
22
Figure: Wind Renewable Energy Index Figure: S&P Global Clean Energy Index
Source: Wind, CMS(HK) Source: Bloomberg, CMS(HK)
Figure: Stock performance of solar sector Figure: Stock performance of the wind sector
Source: Bloomberg, CMS(HK) Source: Bloomberg, CMS(HK)
-100%
-50%
0%
50%
100%
150%
200%
250%
300%
350%
S&P Global Clean Energy Index
-50%
-40%
-30%
-20%
-10%
0%
10%
20%
30%
40%
50%
Wind Renewable Energy Index
-100%
-50%
0%
50%
100%
150%
2010-01-01 2011-01-01 2012-01-01 2013-01-01
HK solar sector HSI Index
-40%
-20%
0%
20%
40%
60%
80%
100%
HSI Index HK Wind Sector
文件名称 日期
R: 235 G: 213 B: 235
R: 200 G: 140 B: 200
R: 154 G: 170 B: 182
R: 130 G: 62 B: 130
R: 191 G: 191 B: 191
R: 127 G: 127 B: 127
R: 234 G: 236 B: 235
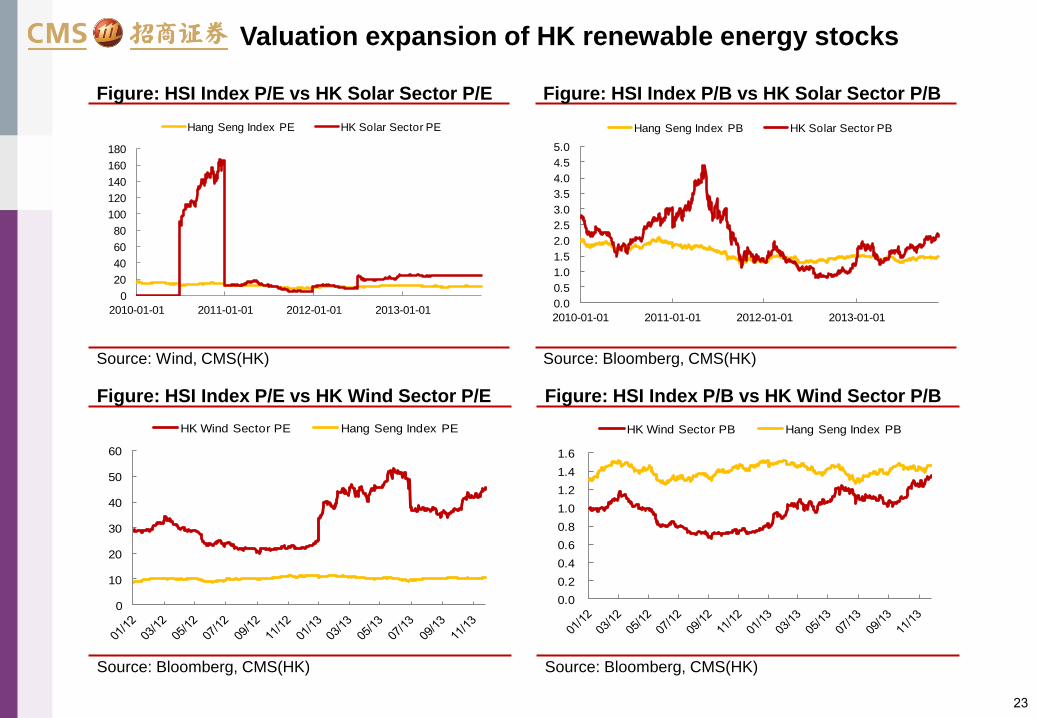
Valuation expansion of HK renewable energy stocks
23
Figure: HSI Index P/E vs HK Solar Sector P/E Figure: HSI Index P/B vs HK Solar Sector P/B
Source: Wind, CMS(HK) Source: Bloomberg, CMS(HK)
Figure: HSI Index P/E vs HK Wind Sector P/E Figure: HSI Index P/B vs HK Wind Sector P/B
Source: Bloomberg, CMS(HK) Source: Bloomberg, CMS(HK)
0
20
40
60
80
100
120
140
160
180
2010-01-01 2011-01-01 2012-01-01 2013-01-01
Hang Seng Index PE HK Solar Sector PE
0.0
0.5
1.0
1.5
2.0
2.5
3.0
3.5
4.0
4.5
5.0
2010-01-01 2011-01-01 2012-01-01 2013-01-01
Hang Seng Index PB HK Solar Sector PB
0
10
20
30
40
50
60
HK Wind Sector PE Hang Seng Index PE
0.0
0.2
0.4
0.6
0.8
1.0
1.2
1.4
1.6
HK Wind Sector PB Hang Seng Index PB

文件名称 日期
R: 235 G: 213 B: 235
R: 200 G: 140 B: 200
R: 154 G: 170 B: 182
R: 130 G: 62 B: 130
R: 191 G: 191 B: 191
R: 127 G: 127 B: 127
R: 234 G: 236 B: 235
Our sock picks
24
Goldwind (2208.HK, HK$7.58, Buy, TP HK$10.04): Strong leading position
Industry recovery: New installation may resume positive growth in 2013
Strong leading position: In 1H2013, domestic market share of Goldwind reached of 23%.
Improving condition for grid curtailment: Accelerated UHV line construction; increased new
capacity plans for wind farm operators
Robust price: Recovering gross margin. Goldwind still enjoys around 7% price premium.
Figure: 2013-2015 revenue forecast and YoY growth Figure: 2013-2015 net profit forecast and YoY growth
Source: Company data, CMS(HK) Source: Company data, CMS(HK)
12810 11273
12865
16142
19042
-27%
-12%
14%
25%
18%
-30%
-20%
-10%
0%
10%
20%
30%
0
2,000
4,000
6,000
8,000
10,000
12,000
14,000
16,000
18,000
20,000
2011
2012
2013
E
2014
E
2015
E
Revenue yoy%
mil RMB
607
153
415
858
1210
-74% -75%
171%
107%
41%
-100%
-50%
0%
50%
100%
150%
200%
0
200
400
600
800
1000
1200
1400
2011
2012
2013
E
2014
E
2015
E
Net profit yoy%
mil RMB

文件名称 日期
R: 235 G: 213 B: 235
R: 200 G: 140 B: 200
R: 154 G: 170 B: 182
R: 130 G: 62 B: 130
R: 191 G: 191 B: 191
R: 127 G: 127 B: 127
R: 234 G: 236 B: 235
Our stock picks
25
Goldpoly (686.HK, HK$1.75, Not Rated): innovative business model
Strong shareholder background: China Merchants New Energy Group is the single largest shareholder of the
company. China Merchants New Energy Group, a subsidiary of China Merchants Group, is engaged in investment,
development and operation of solar power plants. Goldpoly has been granted exclusive rights of developing solar
resources of China Merchants Group.
Abundant strategic co-operation resources: Goldpoly has established ‘PGO’ with peers. In this organization,
GD solar, GCL, Singyes Solar, etc. take charge of development and construction of solar farms, CDB and China
Merchants Group provide financial support, and Goldpoly takes charge of investment, acquisition and operation of
solar farms.
Special capacity expansion model: Goldpoly only acquires grid-connected solar power plants. Required IRRs
(unleveraged) of target projects are around 9%. Project sellers must guarantee the solar power generating capacity
(within a period of 8 to 10 years).
Figure:2009-2012 revenue and YoY growth Figure: 2009-2012 net profit and YoY growth
Source: Company data, CMS(HK) Source: Company data, CMS(HK)
98
250
843
225
154%
238%
-73%-100%
-50%
0%
50%
100%
150%
200%
250%
300%
0
100
200
300
400
500
600
700
800
900
2009
1010
2011
2012
Revenue yoy%
mil RMB
-24 -15
-1149
-815
0%
20%
40%
60%
80%
100%
120%
-1400
-1200
-1000
-800
-600
-400
-200
0
2009
1010
2011
2012
Net profit yoy%
mil RMB

文件名称 日期
R: 235 G: 213 B: 235
R: 200 G: 140 B: 200
R: 154 G: 170 B: 182
R: 130 G: 62 B: 130
R: 191 G: 191 B: 191
R: 127 G: 127 B: 127
R: 234 G: 236 B: 235
Our stock picks
26
Guodian T&E (1296.HK, HK$2.05, Not Rated): solar and wind turbine businesses deserve attention Bright prospect of solar EPC business: GD Solar under the company is the largest company providing solar
EPC services in China. 600MW is the breakeven point for the company’s solar business due to the heavy
investment in previous years. 500MW EPC means significant loss reduction in the second half of the year.
Recovering wind turbine business: The subsidiary Guodian United Power is the second largest wind turbine
manufacturer in China, next only to Xinjiang Goldwind. The environment for wind turbine is favorable in China, with
considerable demand, rising price and low costs. The trend of growing share of high-power generating units will
help to improve gross margin. Demand for Guodian United Power Technology’s products mainly comes from
Longyuan Power, the largest wind power operator in China. Despite slow recognition of sales, we believe the
company will enjoy evident improvement in wind turbine sales between 2014 and 2015.
Environmental protection and energy saving business: Pay attention to potential earnings drivers including green power station EPC, water treatment, and the denitration concession business.
Figure: 2008-2012 revenue and YoY growth Figure: 2008-2012 net profit and YoY growth
Source: Company data, CMS(HK) Source: Company data, CMS(HK)
3969 5355
11009
18759
21853
35%
106%
70%
16%
0%
20%
40%
60%
80%
100%
120%
0
5000
10000
15000
20000
25000
2008
2009
2010
2011
2012
Revenue yoy%
mil RMB
91 96
350
841
693
5%
267%
140%
-18%
-50%
0%
50%
100%
150%
200%
250%
300%
0
100
200
300
400
500
600
700
800
900
2008
2009
2010
2011
2012
Net profit yoy%
mil RMB

文件名称 日期
DISCLAIMER
This document is prepared by China Merchants Securities (HK) Co., Limited (“CMS HK”). CMS HK is a licensed corporation to carry on Type 1 (dealing in securities), Type 2 (dealing in futures),
Type 4 (advising on securities), Type 6 (advising on corporate finance) and Type 9 (asset management) regulated activities under the Securities and Futures Ordinance (Chapter 571). This
document is for information purpose only. Neither the information nor opinion expressed shall be construed, expressly or impliedly, as an advice, offer or solicitation of an offer, invitation,
advertisement, inducement, recommendation or representation of any kind or form whatsoever to buy or sell any security, financial instrument or any investment or other specific product.
The securities, instruments or strategies discussed in this document may not be suitable for all investors, and certain investors may not be eligible to participate in some or all of them.
Certain services and products are subject to legal restrictions and cannot be offered worldwide on an unrestricted basis and/or may not be eligible for sale to all investors.
The information and opinions, and associated estimates and forecasts, contained herein have been obtained from or are based on sources believed to be reliable. CMS HK, its holding or
affiliated companies, or any of its or their directors, officers or employees (“CMS Group”) do not represent or warrant, expressly or impliedly, that it is accurate, correct or complete and it
should not be relied upon. CMS Group will not accept any responsibility or liability whatsoever for any use of or reliance upon this document or any of the content thereof. The contents and
information in this document are only current as of the date of their publication and will be subject to change without prior notice. Past performance is not indicative of future performance.
Estimates of future performance are based on assumptions that may not be realized. The analysis contained herein is based on numerous assumptions. Different assumptions could result in
materially different results. Opinions expressed herein may differ or be contrary to those expressed by other business divisions or other members of CMS Group as a result of using different
assumptions and/or criteria.
This document has been prepared without regard to the individual financial circumstances and investment objectives of the persons who receive it. Use of any information herein shall be at
the sole discretion and risk of the user. Investors are advised to independently evaluate particular investments and strategies, take financial and/or tax advice as to the implications (including
tax) of investing in any of the securities or products mentioned in this document, and make their own investment decisions without relying on this publication.
CMS Group may have a long or short position, make markets, act as principal or agent, or engage in transactions in securities of companies referred to in this document and may also perform
or seek to perform investment banking services or provide advisory or other services for those companies. This document is for the use of intended recipients only and this document may not
be reproduced, distributed or published in whole or in part for any purpose without the prior consent of CMS Group. CMS Group will not be liable for any claims or lawsuits from any third
parties arising from the use or distribution of this document. This document is for distribution only under such circumstances as may be permitted by applicable law. This document is not
directed at you if CMS Group is prohibited or restricted by any legislation or regulation in any jurisdiction from making it available to you. In particular, this document is only made available to
certain US persons to whom CMS Group is permitted to make available according to US securities laws, but cannot otherwise be made available, distributed or transmitted, whether directly or
indirectly, into the US or to any US person. This document also cannot be distributed or transmitted, whether directly or indirectly, into Japan and Canada and not to the general public in the
People’s Republic of China (for the purpose of this document, excluding Hong Kong, Macau and Taiwan).
27

文件名称 日期
Thank you!
28