Embed Size (px)
Citation preview
AMI Beyond Meter ReadingModerators: Gale Horst EPRI / Debbie Haught DOESpeakers: Dave Herlong – Florida Power & Light
Ruth Kiselewich – Baltimore Gas and Electric Co.Jayme Holland – Central MaineSara Kaplan – Iowa Association of Municipal UtilitiesJoe Schatz – Southern Company
The Smart Grid Experience: Applying Results, Reaching BeyondTuesday 28-October-2014 3:30pm
2© 2014 Electric Power Research Institute, Inc. All rights reserved. EPRI / DOE The Smart Grid Experience: Applying Results, Reaching Beyond
Session: AMI Beyond Meter Reading
Applying Results:
Successes
Surprises
Reaching Beyond
October 27-29, 2014Charlotte, NC
Leveraging AMI data in Operations
Dave Herlong, Smart Grid Operations Manager, Power Delivery

4© 2014 Electric Power Research Institute, Inc. All rights reserved. EPRI / DOE The Smart Grid Experience: Applying Results, Reaching Beyond
Dave HerlongSmart Grid Operations Manager, FPL
• Dave Herlong is manager of smart grid operations at Florida Power & Light Company and is responsible for making useful operation of smart grid data and devices in FPL’s Power Delivery organization.
• Previously, he served as manager of distribution operations and was responsible for the overall engineering, maintenance, restoration and safe operation of the distribution network.
• Mr. Herlong earned his BS in Industrial & Systems Engineering from the University of Florida and is a graduate of the United States Marine Corps Officer Candidate School, former United Way loaned executive and certified Six Sigma black belt.
Pages 38-39
5© 2014 Electric Power Research Institute, Inc. All rights reserved. EPRI / DOE The Smart Grid Experience: Applying Results, Reaching Beyond
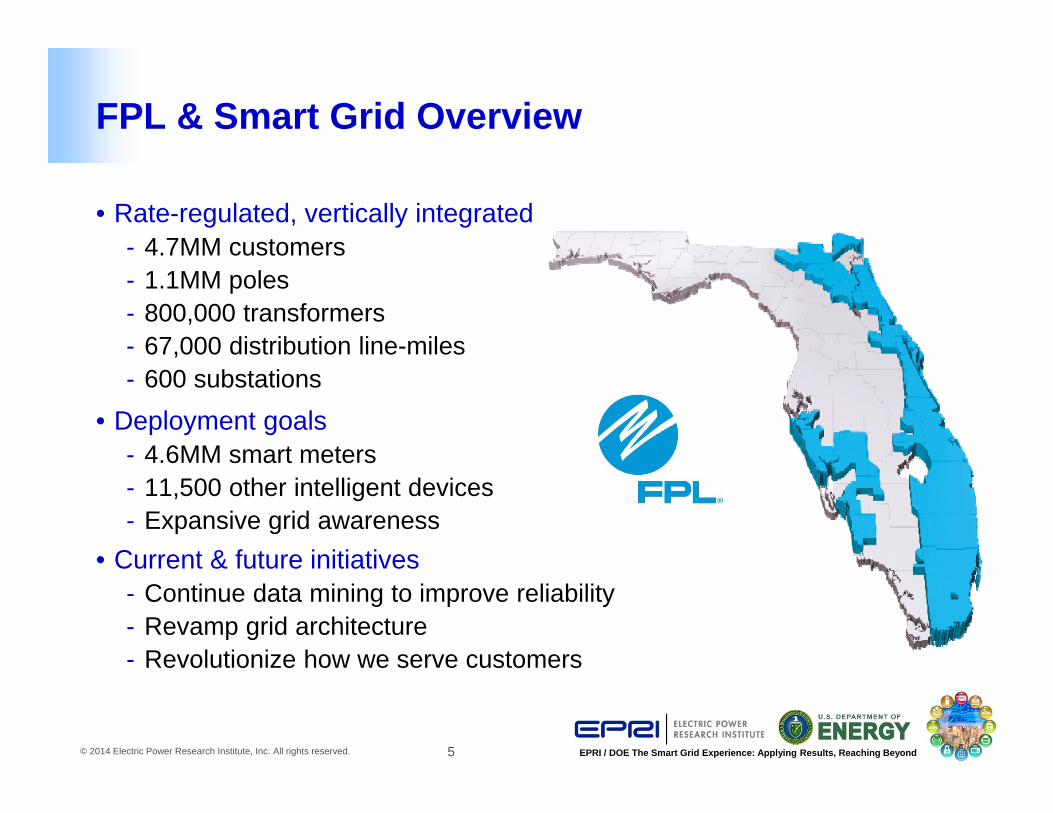
FPL & Smart Grid Overview
• Rate-regulated, vertically integrated- 4.7MM customers - 1.1MM poles - 800,000 transformers- 67,000 distribution line-miles- 600 substations
• Deployment goals - 4.6MM smart meters- 11,500 other intelligent devices- Expansive grid awareness
• Current & future initiatives - Continue data mining to improve reliability- Revamp grid architecture- Revolutionize how we serve customers

6© 2014 Electric Power Research Institute, Inc. All rights reserved. EPRI / DOE The Smart Grid Experience: Applying Results, Reaching Beyond
A Paradigm Change in Grid Awareness
PowerGeneration
Transmission& Substation Distribution
Smart Meters
Distribution AutomationDigital Monitoring Yesterday
Digital Monitoring Today
7© 2014 Electric Power Research Institute, Inc. All rights reserved. EPRI / DOE The Smart Grid Experience: Applying Results, Reaching Beyond
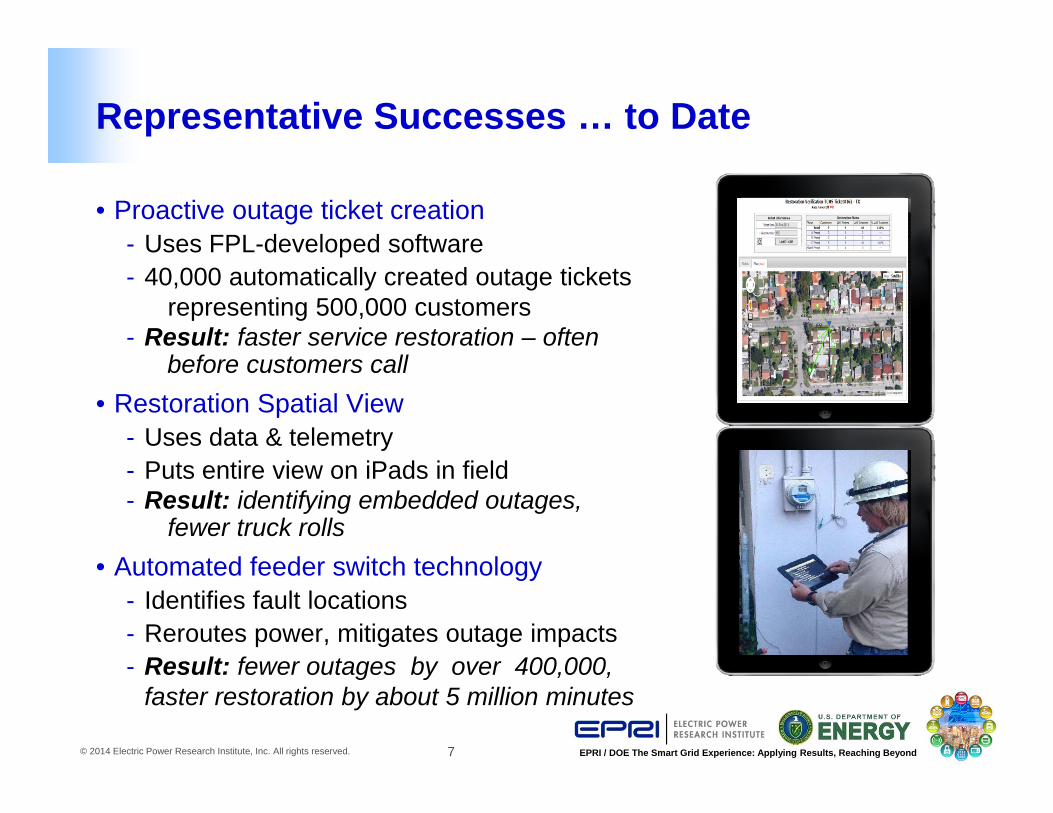
Representative Successes … to Date
• Proactive outage ticket creation- Uses FPL-developed software - 40,000 automatically created outage tickets
representing 500,000 customers- Result: faster service restoration – often
before customers call• Restoration Spatial View
- Uses data & telemetry - Puts entire view on iPads in field- Result: identifying embedded outages,
fewer truck rolls• Automated feeder switch technology
- Identifies fault locations- Reroutes power, mitigates outage impacts- Result: fewer outages by over 400,000,
faster restoration by about 5 million minutes
8© 2014 Electric Power Research Institute, Inc. All rights reserved. EPRI / DOE The Smart Grid Experience: Applying Results, Reaching Beyond
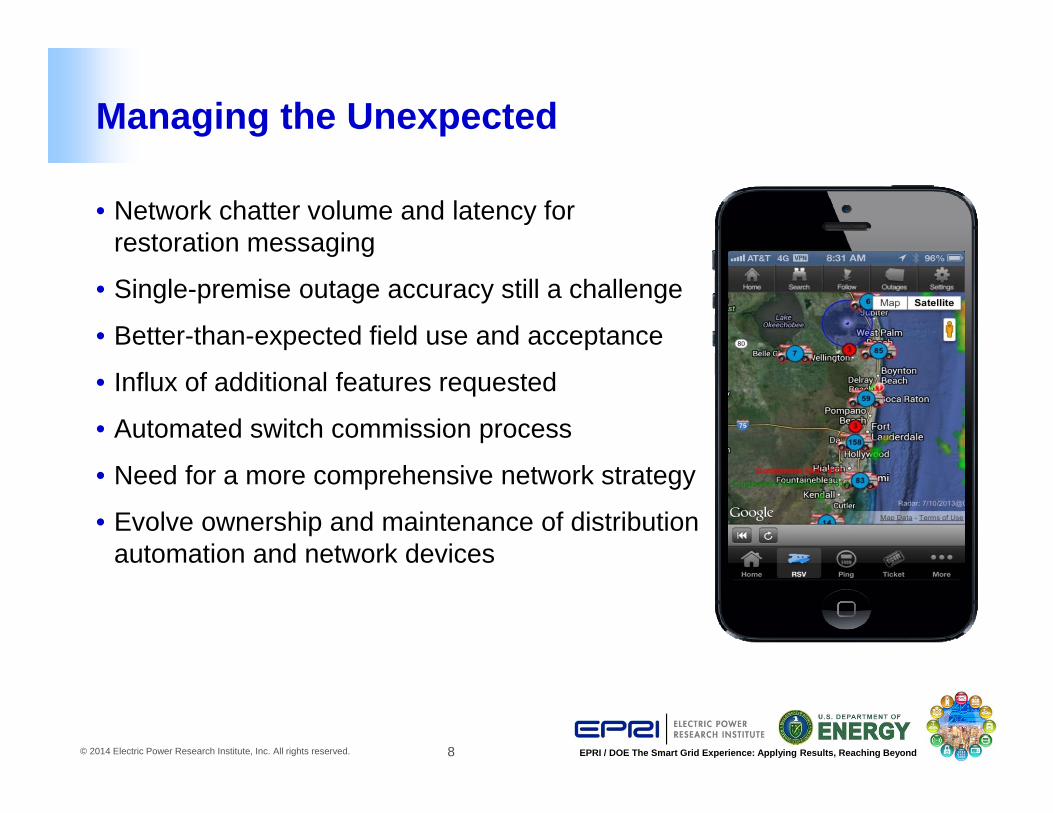
Managing the Unexpected
• Network chatter volume and latency for restoration messaging
• Single-premise outage accuracy still a challenge
• Better-than-expected field use and acceptance
• Influx of additional features requested
• Automated switch commission process
• Need for a more comprehensive network strategy
• Evolve ownership and maintenance of distribution automation and network devices

9© 2014 Electric Power Research Institute, Inc. All rights reserved. EPRI / DOE The Smart Grid Experience: Applying Results, Reaching Beyond
Grid & Customer Analytics Driving Our Future
Expand the scale and scope of FPL’s growing digital footprint:• Add more automated, self-healing technologies to mitigate outages • Expand digital connections for all feeders and substations• Target more smart sensors for real-time, predictive diagnostics• Drive more business solutions leveraging data mining / applied analytics
Feeders
Laterals
Transformers
Secondary
Service
Feeders
Laterals
Transformers
Secondary
Service
- Interruption volume
- Restoration cost
- Restoration Expense
- Customer volume
- Investment Cost
- Investment in prevention

10© 2014 Electric Power Research Institute, Inc. All rights reserved. EPRI / DOE The Smart Grid Experience: Applying Results, Reaching Beyond
Questions / Discussion
Dave Herlong
561.904.3752

BGE’s Dynamic Pricing & Behavioral Programs
Ruth Kiselewich, Director, Demand Side Management Programs
October 27-29, 2014Charlotte, NC
12© 2014 Electric Power Research Institute, Inc. All rights reserved. EPRI / DOE The Smart Grid Experience: Applying Results, Reaching Beyond
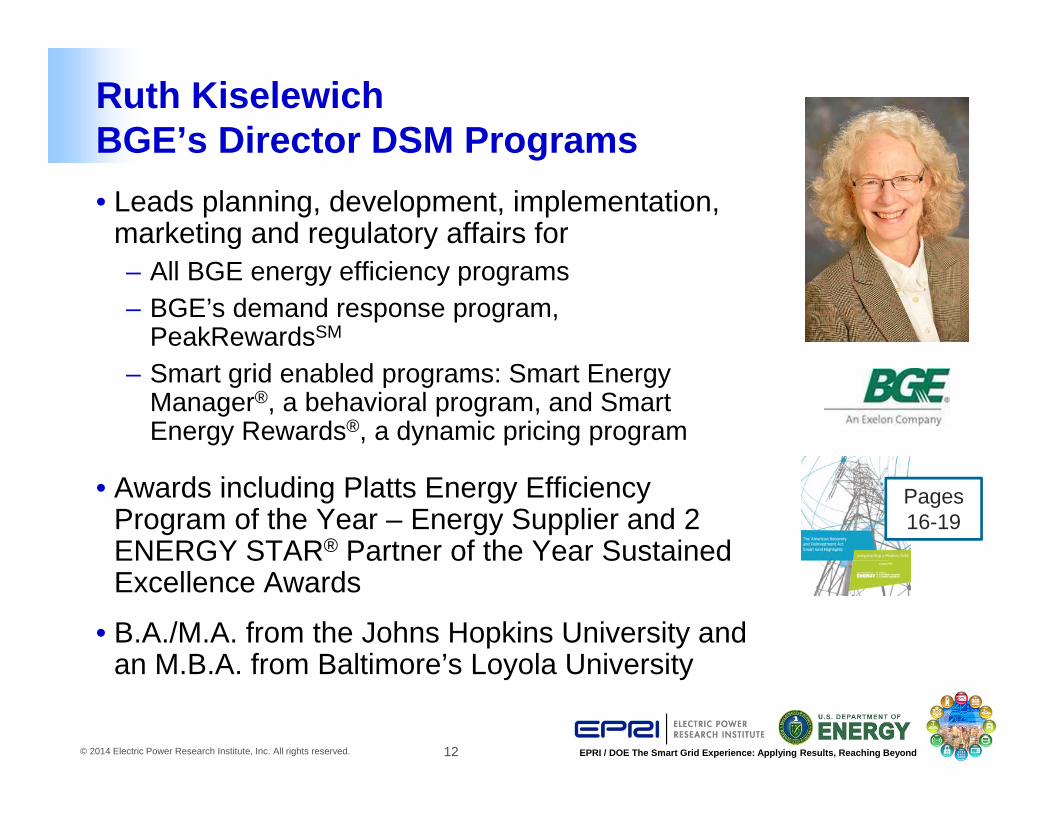
Ruth KiselewichBGE’s Director DSM Programs• Leads planning, development, implementation,
marketing and regulatory affairs for– All BGE energy efficiency programs– BGE’s demand response program,
PeakRewardsSM
– Smart grid enabled programs: Smart Energy Manager®, a behavioral program, and Smart Energy Rewards®, a dynamic pricing program
• Awards including Platts Energy Efficiency Program of the Year – Energy Supplier and 2 ENERGY STAR® Partner of the Year Sustained Excellence Awards
• B.A./M.A. from the Johns Hopkins University and an M.B.A. from Baltimore’s Loyola University
Pages 16-19
13© 2014 Electric Power Research Institute, Inc. All rights reserved. EPRI / DOE The Smart Grid Experience: Applying Results, Reaching Beyond
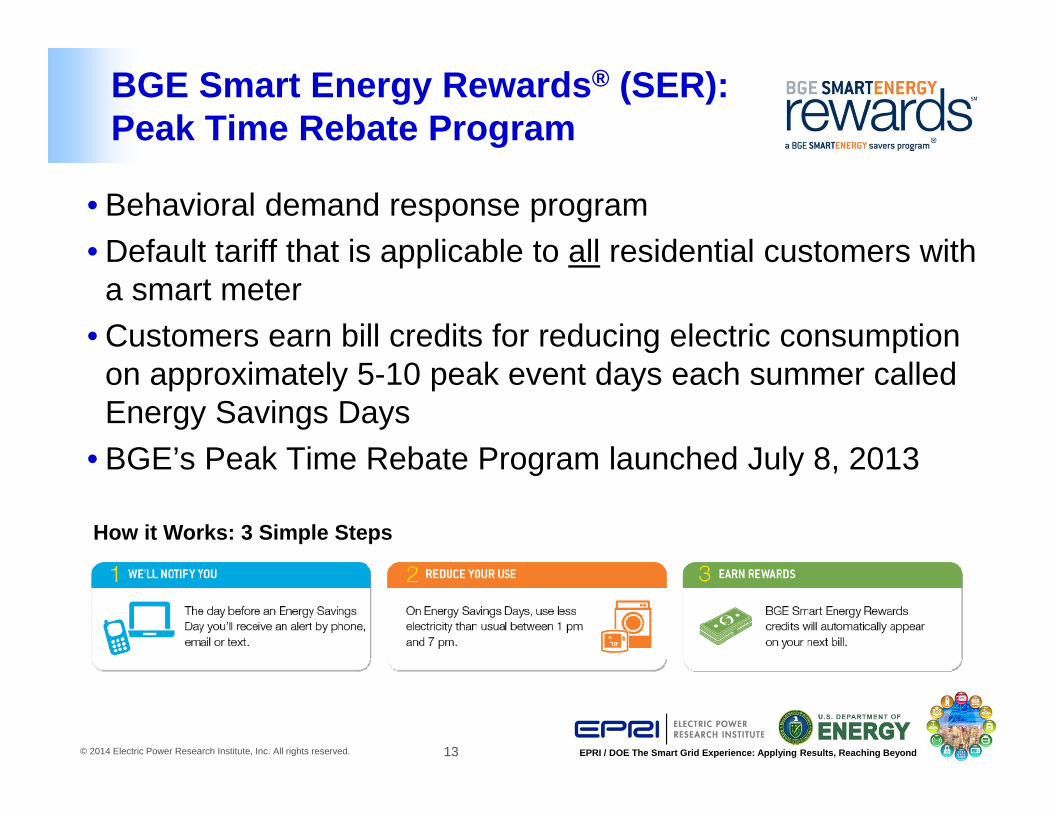
BGE Smart Energy Rewards® (SER): Peak Time Rebate Program
• Behavioral demand response program• Default tariff that is applicable to all residential customers with
a smart meter• Customers earn bill credits for reducing electric consumption
on approximately 5-10 peak event days each summer called Energy Savings Days
• BGE’s Peak Time Rebate Program launched July 8, 2013
How it Works: 3 Simple Steps
14© 2014 Electric Power Research Institute, Inc. All rights reserved. EPRI / DOE The Smart Grid Experience: Applying Results, Reaching Beyond
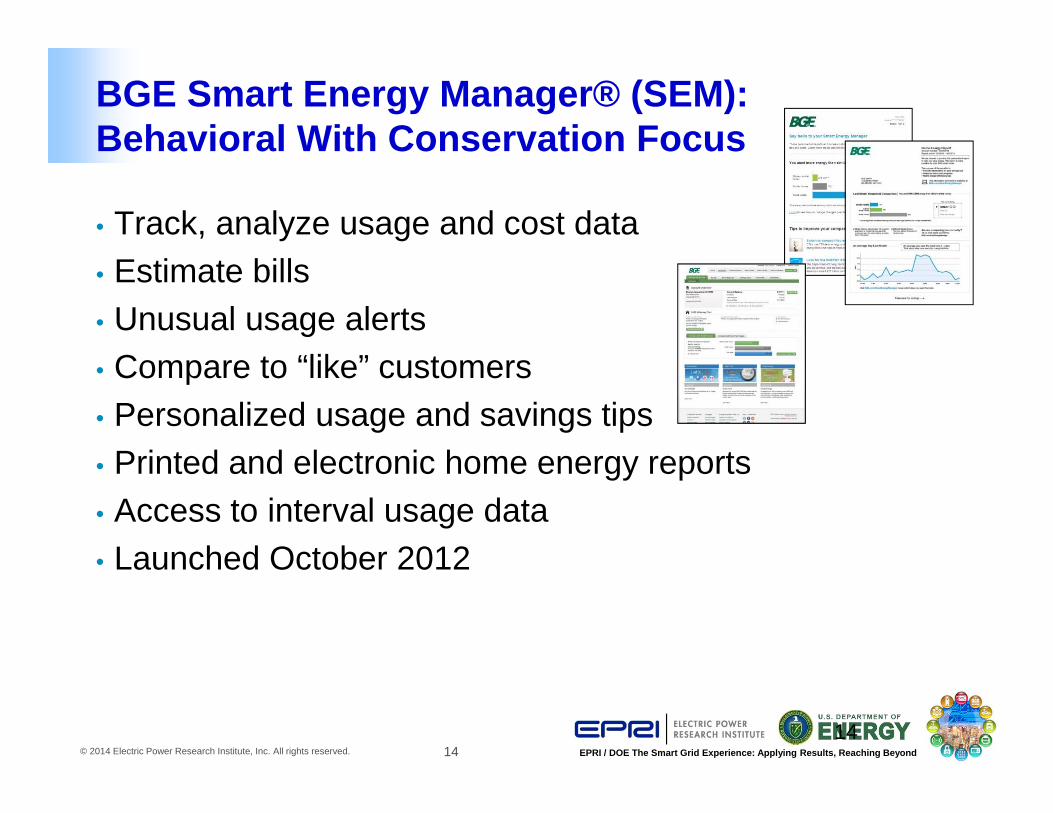
BGE Smart Energy Manager® (SEM): Behavioral With Conservation Focus
• Track, analyze usage and cost data• Estimate bills• Unusual usage alerts• Compare to “like” customers• Personalized usage and savings tips• Printed and electronic home energy reports• Access to interval usage data• Launched October 2012
14
15© 2014 Electric Power Research Institute, Inc. All rights reserved. EPRI / DOE The Smart Grid Experience: Applying Results, Reaching Beyond
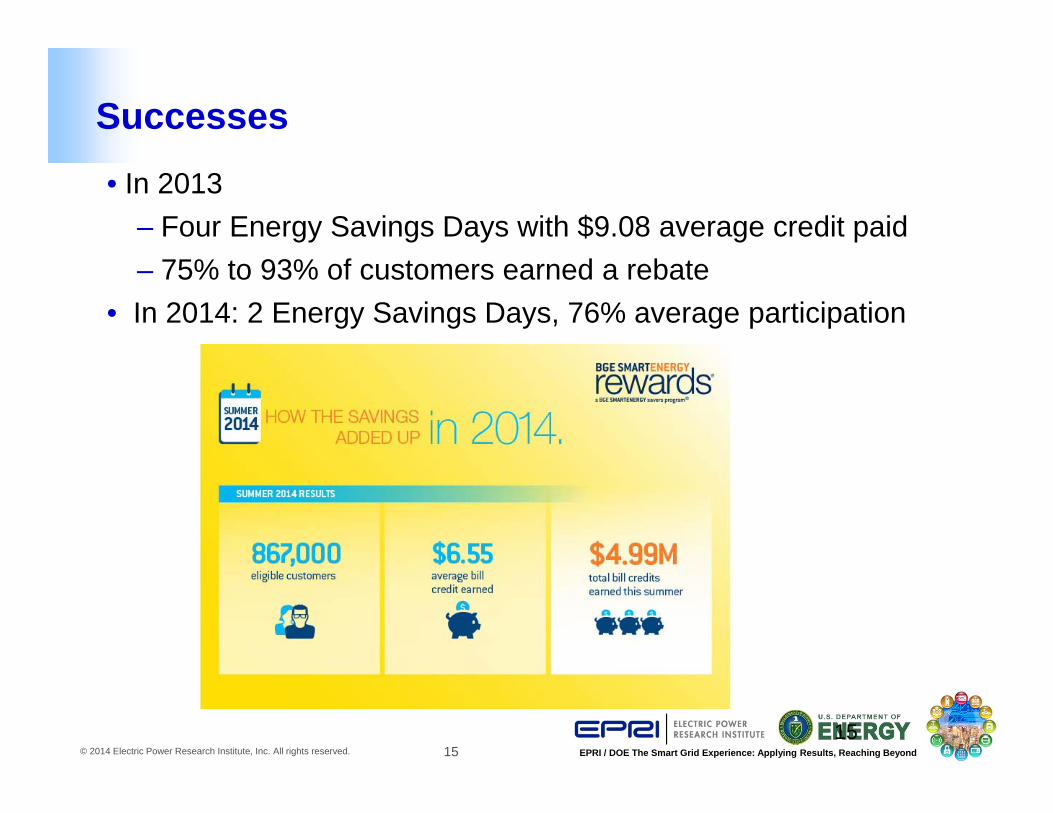
Successes• In 2013
– Four Energy Savings Days with $9.08 average credit paid– 75% to 93% of customers earned a rebate
• In 2014: 2 Energy Savings Days, 76% average participation
15
16© 2014 Electric Power Research Institute, Inc. All rights reserved. EPRI / DOE The Smart Grid Experience: Applying Results, Reaching Beyond
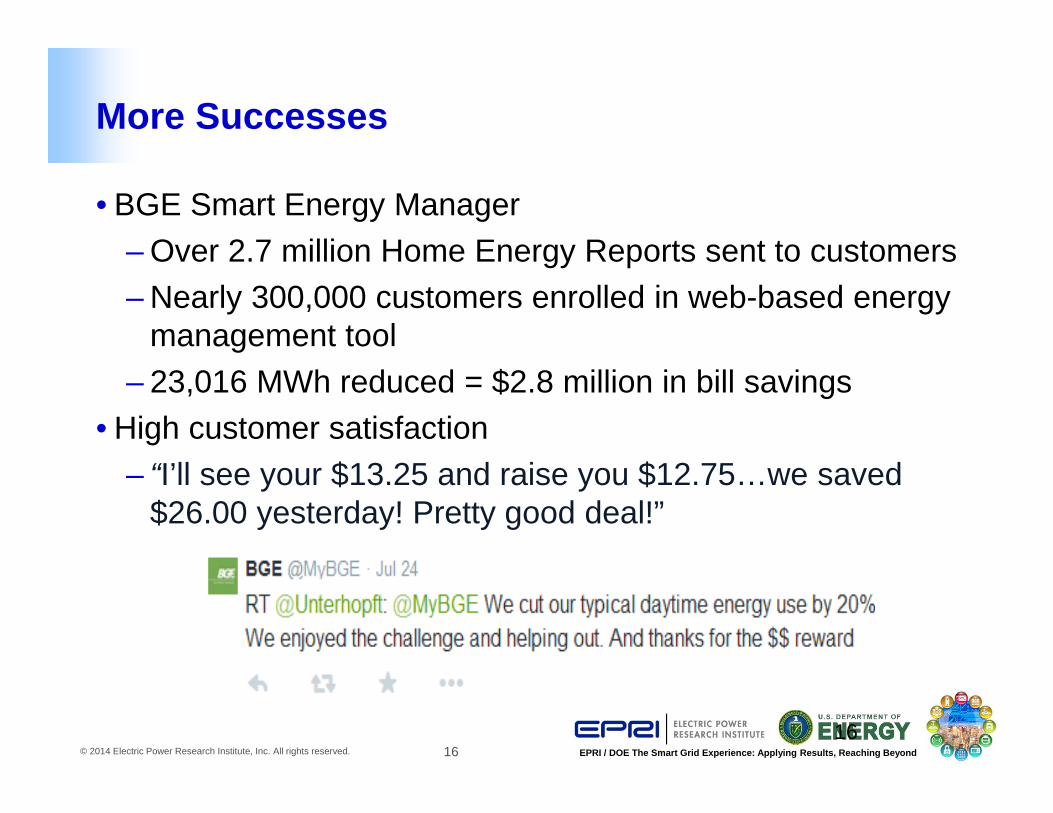
More Successes
• BGE Smart Energy Manager– Over 2.7 million Home Energy Reports sent to customers– Nearly 300,000 customers enrolled in web-based energy
management tool– 23,016 MWh reduced = $2.8 million in bill savings
• High customer satisfaction– “I’ll see your $13.25 and raise you $12.75…we saved
$26.00 yesterday! Pretty good deal!”
16

17© 2014 Electric Power Research Institute, Inc. All rights reserved. EPRI / DOE The Smart Grid Experience: Applying Results, Reaching Beyond
Surprises
17
Surprise 1:
Benefit of outbound calls to obtain contact preferences
Surprise 3:Slower implementation impacted mass communications
Surprise 4:
Weather
Surprise 2:
Having to deal with smart meter opt outs
18© 2014 Electric Power Research Institute, Inc. All rights reserved. EPRI / DOE The Smart Grid Experience: Applying Results, Reaching Beyond
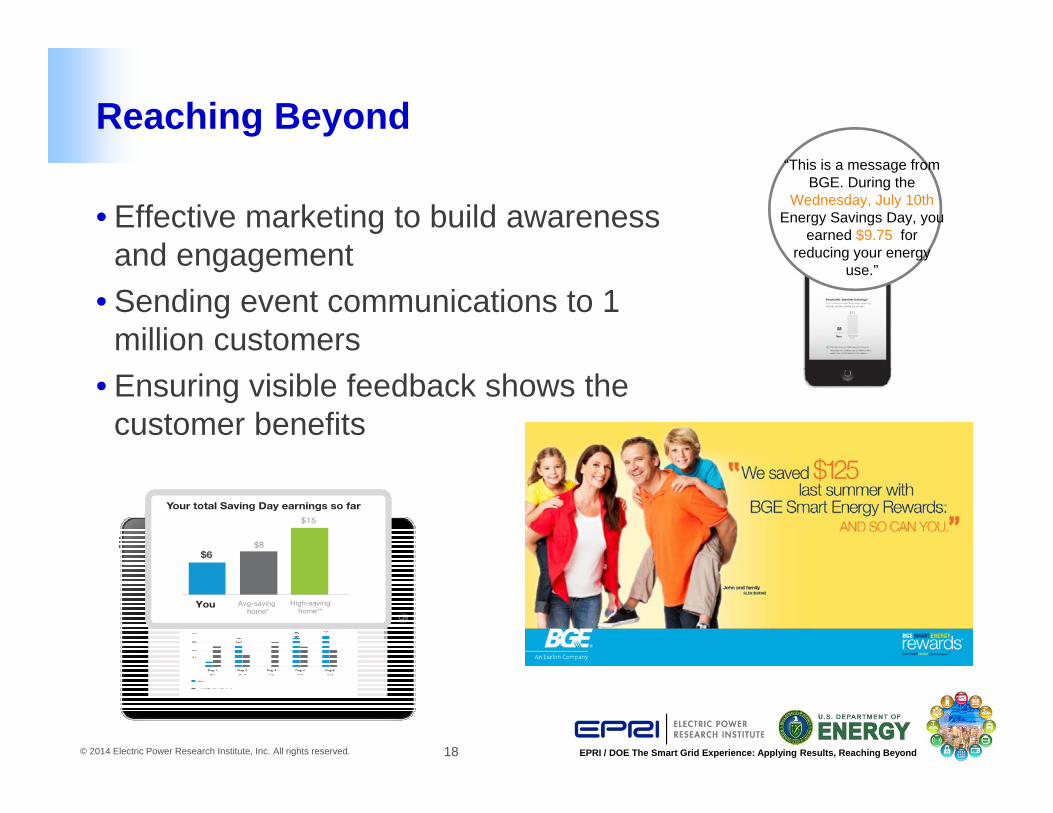
Reaching Beyond
• Effective marketing to build awareness and engagement
• Sending event communications to 1 million customers
• Ensuring visible feedback shows the customer benefits
“This is a message from BGE. During the
Wednesday, July 10th Energy Savings Day, you
earned $9.75 for reducing your energy
use.”
19© 2014 Electric Power Research Institute, Inc. All rights reserved. EPRI / DOE The Smart Grid Experience: Applying Results, Reaching Beyond
Questions / Discussion
Optimization of assets, policy and process to achieve operational efficiencies, improve
reliability and customer benefit
October 27-29, 2014Charlotte, NC
Jayme Holland, Manager of Projects and ProgramsCentral Maine Power
21© 2014 Electric Power Research Institute, Inc. All rights reserved. EPRI / DOE The Smart Grid Experience: Applying Results, Reaching Beyond
• Manager of Projects and Programs – AMI enabled programs
• With Central Maine Power/Iberdrola USA since January 2013
• Implemented
– Energy Manager
– Green Button
– Online Price Comparison tool
• Projects in progress:
– Energy Manager for Business
– Net Energy Billing
– AMI Optimization Group Coordinator
BIO – Jayme Holland
Pages 25-26
22© 2014 Electric Power Research Institute, Inc. All rights reserved. EPRI / DOE The Smart Grid Experience: Applying Results, Reaching Beyond
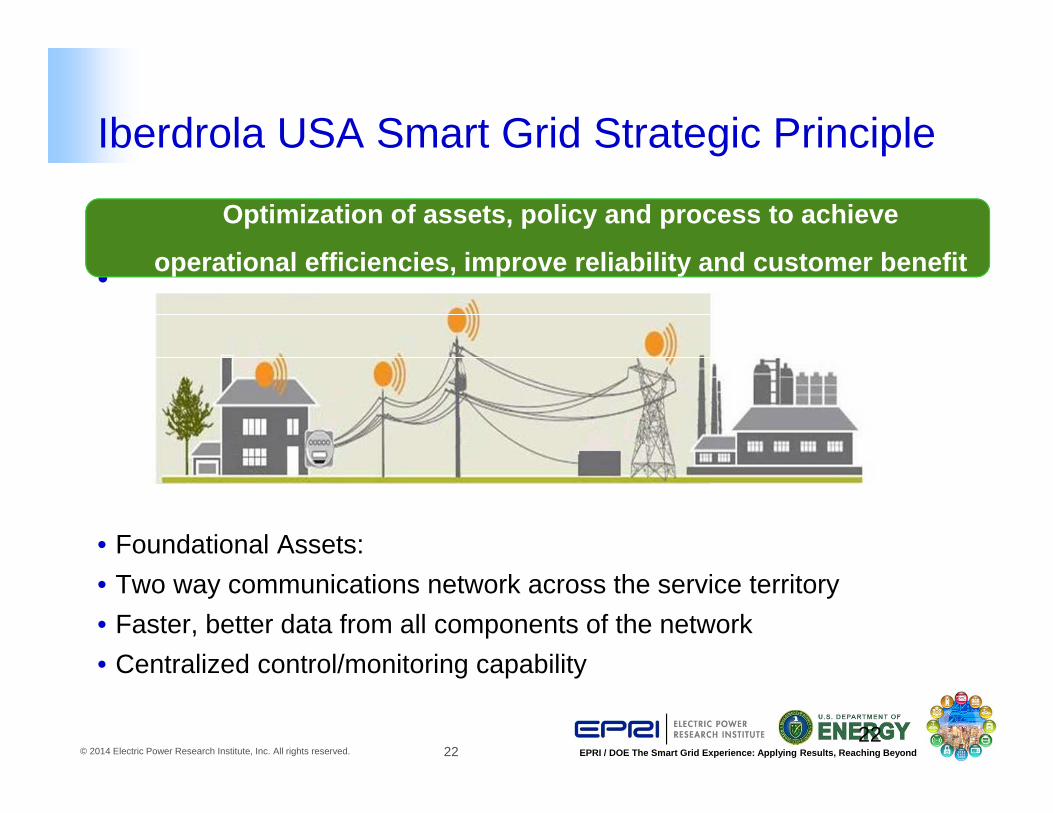
Iberdrola USA Smart Grid Strategic Principle
•
• Foundational Assets: • Two way communications network across the service territory• Faster, better data from all components of the network• Centralized control/monitoring capability
Optimization of assets, policy and process to achieve
operational efficiencies, improve reliability and customer benefit
22

23© 2014 Electric Power Research Institute, Inc. All rights reserved. EPRI / DOE The Smart Grid Experience: Applying Results, Reaching Beyond
Project Objectives and Features
System Development Phases FunctionalityPhase 1 Meter to Bill Capable
- Ability to batch meter install service orders- Ability to bill from automated meter reads
Phase 2Customer Service Enhancements
- Meter Asset Management Upgrade- Implement Customer Service rep web portal- Settlement Upgrade- Ability to support automated disconnect/reconnect- Ability to support on-demand reads, pings, and
tenant changes from AMI read dataPhase 3Demand Response Enhancements
- Information Research Study- Deploy full new outage management- Settlement on 100% of customer usage- Implement enhanced customer web portal- Support dynamic rates

24© 2014 Electric Power Research Institute, Inc. All rights reserved. EPRI / DOE The Smart Grid Experience: Applying Results, Reaching Beyond
Project Objectives and Features
•Installed more than 600k meters to CMP’s residential, commercial and industrial customers
•Deployed more than 6k network devices to provide 100% network coverage across CMP’s service area The AMI system provides a wireless communications network that covers CMP’s entire service territory to reach more than 600k customer endpoints and provide a platform for CMP’s Smart Grid initiatives
•Upgraded or installed more than 10 new IT systems to support increased data volumes and new functionality
•Initiated a consumer research study to evaluate response to a variety of AMI-enabled programs and devices
•Support future Smart Grid initiatives including power quality monitoring and distribution automation
24
25© 2014 Electric Power Research Institute, Inc. All rights reserved. EPRI / DOE The Smart Grid Experience: Applying Results, Reaching Beyond 25
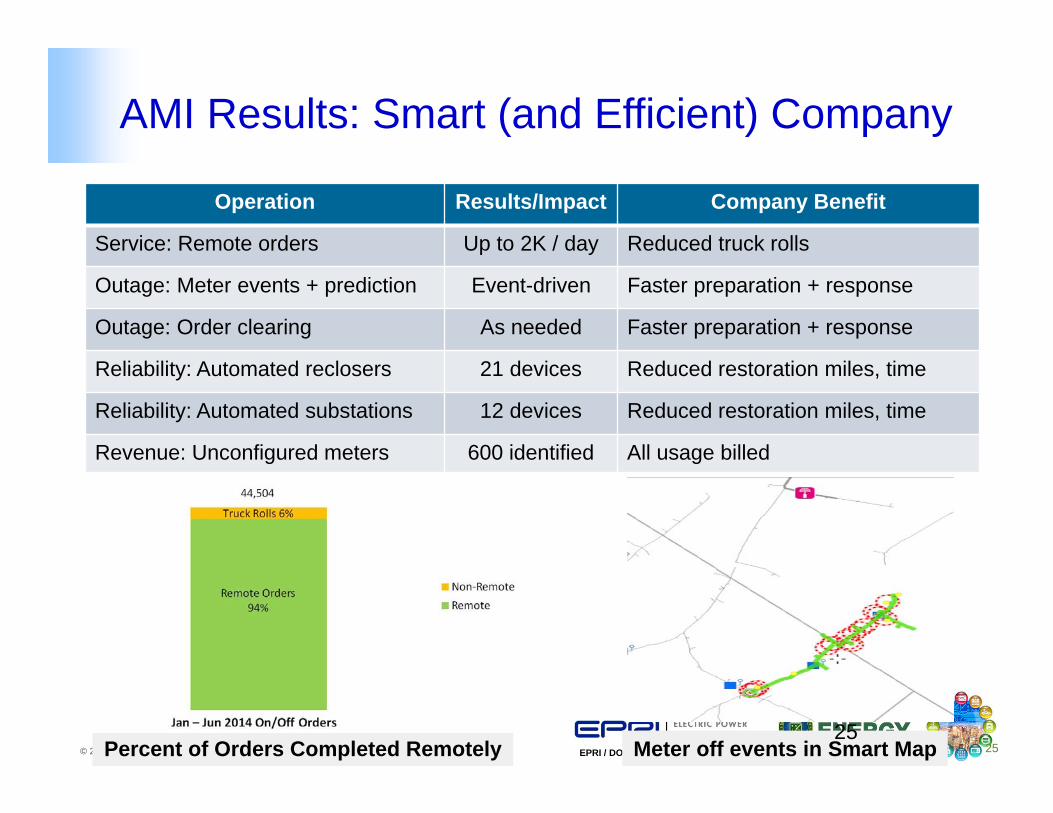
AMI Results: Smart (and Efficient) Company
Meter off events in Smart Map
Operation Results/Impact Company Benefit
Service: Remote orders Up to 2K / day Reduced truck rolls
Outage: Meter events + prediction Event-driven Faster preparation + response
Outage: Order clearing As needed Faster preparation + response
Reliability: Automated reclosers 21 devices Reduced restoration miles, time
Reliability: Automated substations 12 devices Reduced restoration miles, time
Revenue: Unconfigured meters 600 identified All usage billed
Percent of Orders Completed Remotely25
26© 2014 Electric Power Research Institute, Inc. All rights reserved. EPRI / DOE The Smart Grid Experience: Applying Results, Reaching Beyond 26
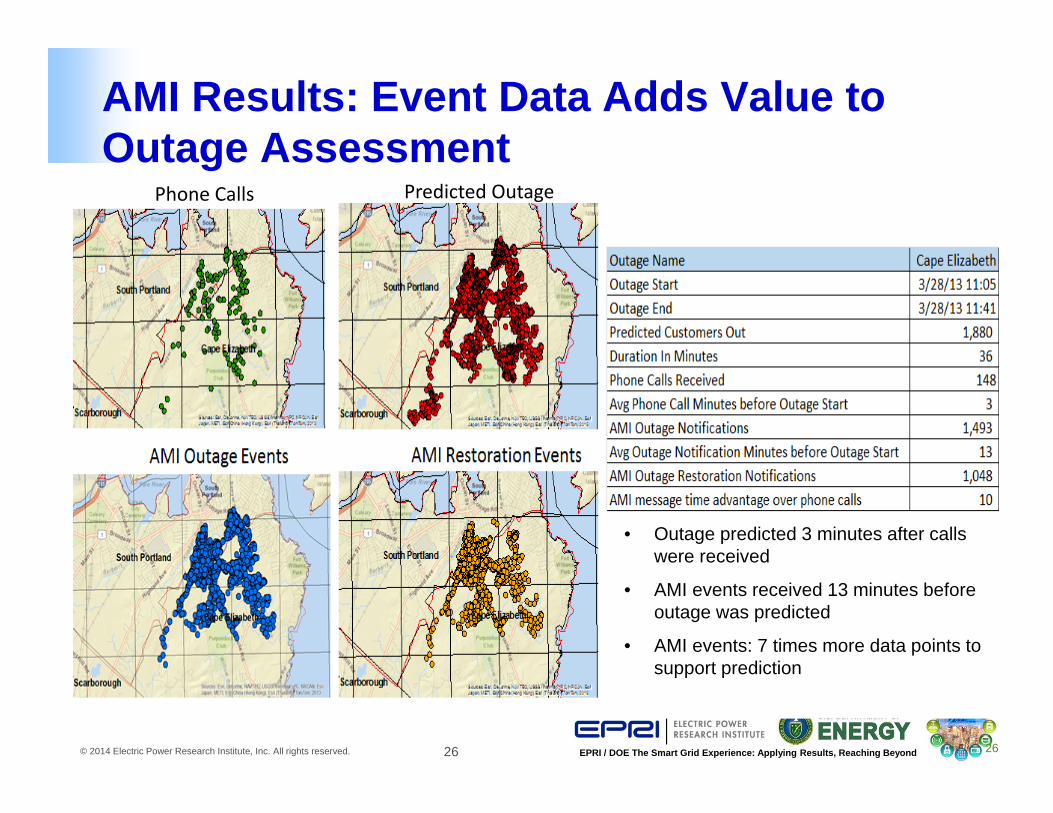
Phone Calls Predicted Outage
AMI Results: Event Data Adds Value to Outage Assessment
• Outage predicted 3 minutes after calls were received
• AMI events received 13 minutes before outage was predicted
• AMI events: 7 times more data points to support prediction
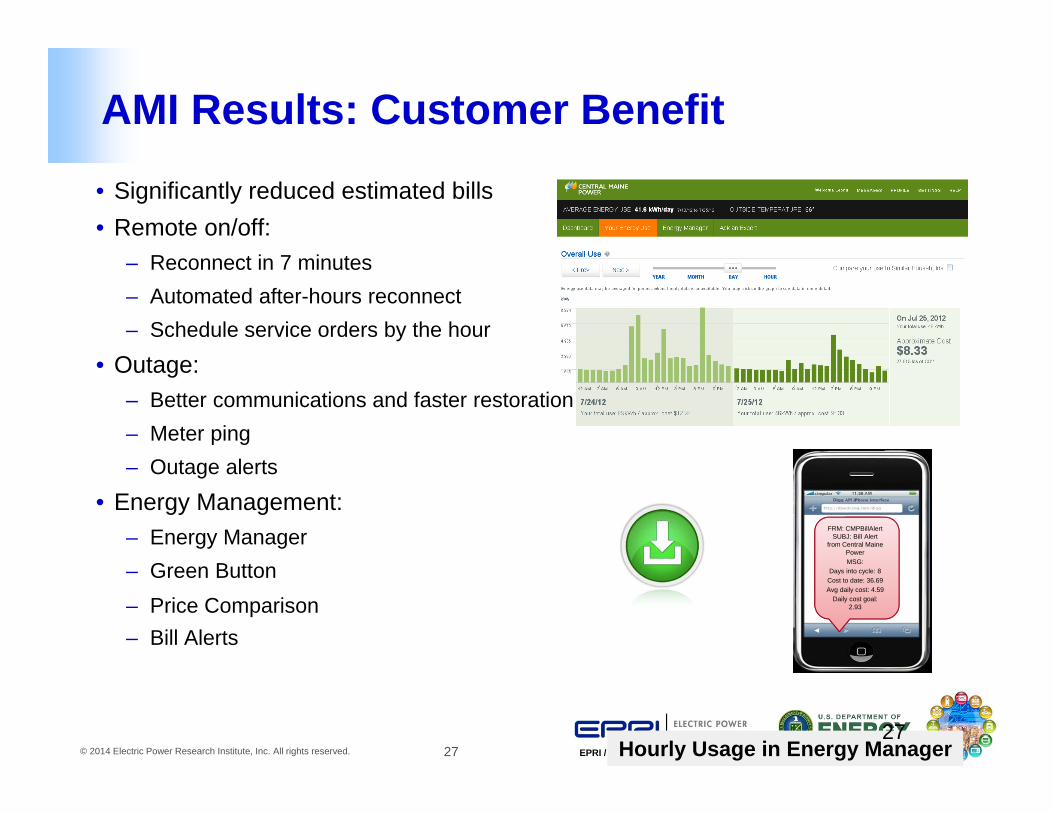
27© 2014 Electric Power Research Institute, Inc. All rights reserved. EPRI / DOE The Smart Grid Experience: Applying Results, Reaching BeyondHourly Usage in Energy Manager
AMI Results: Customer Benefit
• Significantly reduced estimated bills• Remote on/off:
– Reconnect in 7 minutes– Automated after-hours reconnect – Schedule service orders by the hour
• Outage: – Better communications and faster restoration– Meter ping – Outage alerts
• Energy Management: – Energy Manager– Green Button– Price Comparison – Bill Alerts
27
FRM: CMPBillAlertSUBJ: Bill Alert
from Central Maine PowerMSG:
Days into cycle: 8Cost to date: 36.69Avg daily cost: 4.59
Daily cost goal: 2.93
28© 2014 Electric Power Research Institute, Inc. All rights reserved. EPRI / DOE The Smart Grid Experience: Applying Results, Reaching Beyond
Reaching Beyond – Lessons Learned
• Continue leveraging investment
• Using lessons learned in Maine and applying that knowledge in other Iberdrola USA companies
– Take a more global view of the network and consider optimizing the best collection of outage information up front
– Make customer benefits available earlier through a portal that provides information even before hourly reads are available
29© 2014 Electric Power Research Institute, Inc. All rights reserved. EPRI / DOE The Smart Grid Experience: Applying Results, Reaching Beyond 29
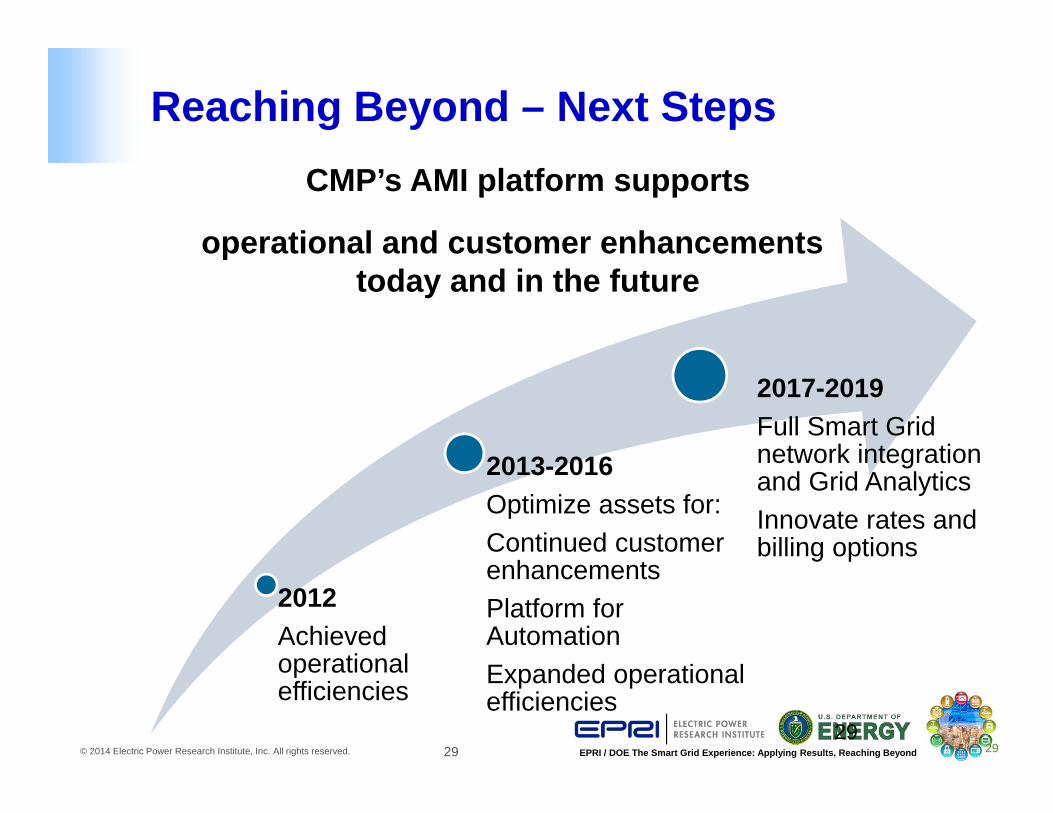
2012Achieved operational efficiencies
2013-2016Optimize assets for:Continued customer enhancementsPlatform for AutomationExpanded operational efficiencies
2017-2019Full Smart Grid network integration and Grid AnalyticsInnovate rates and billing options
Reaching Beyond – Next StepsCMP’s AMI platform supports
operational and customer enhancements today and in the future
29
30© 2014 Electric Power Research Institute, Inc. All rights reserved. EPRI / DOE The Smart Grid Experience: Applying Results, Reaching Beyond 30
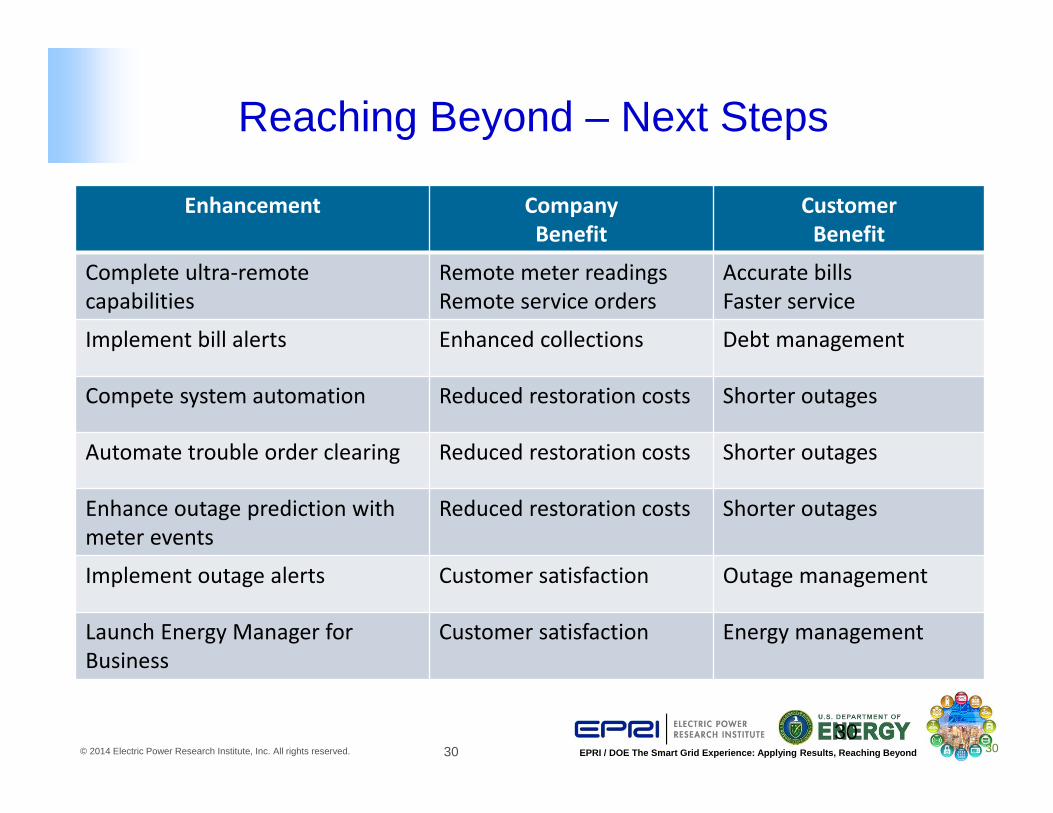
Reaching Beyond – Next Steps
Enhancement CompanyBenefit
CustomerBenefit
Complete ultra‐remotecapabilities
Remote meter readingsRemote service orders
Accurate billsFaster service
Implement bill alerts Enhanced collections Debt management
Compete system automation Reduced restoration costs Shorter outages
Automate trouble order clearing Reduced restoration costs Shorter outages
Enhance outage prediction with meter events
Reduced restoration costs Shorter outages
Implement outage alerts Customer satisfaction Outage management
Launch Energy Manager for Business
Customer satisfaction Energy management
30

31© 2014 Electric Power Research Institute, Inc. All rights reserved. EPRI / DOE The Smart Grid Experience: Applying Results, Reaching Beyond
Questions / Discussion
October 27-29, 2014Charlotte, NC
Buying Power with Small Players: A Joint Action Model for Smart Grid Technologies
Sara R. Kaplan, PEIowa Association of Municipal Utilities
33© 2014 Electric Power Research Institute, Inc. All rights reserved. EPRI / DOE The Smart Grid Experience: Applying Results, Reaching Beyond
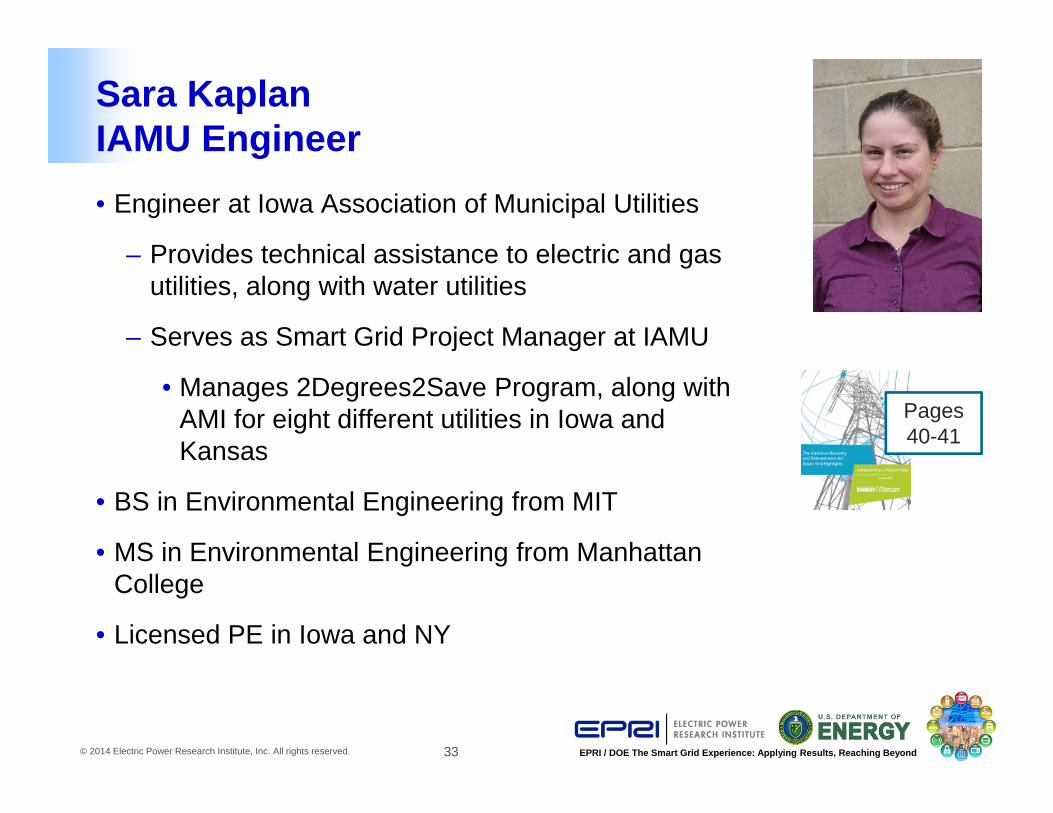
Sara KaplanIAMU Engineer• Engineer at Iowa Association of Municipal Utilities
– Provides technical assistance to electric and gas utilities, along with water utilities
– Serves as Smart Grid Project Manager at IAMU
• Manages 2Degrees2Save Program, along with AMI for eight different utilities in Iowa and Kansas
• BS in Environmental Engineering from MIT
• MS in Environmental Engineering from Manhattan College
• Licensed PE in Iowa and NY
Pages 40-41
34© 2014 Electric Power Research Institute, Inc. All rights reserved. EPRI / DOE The Smart Grid Experience: Applying Results, Reaching Beyond
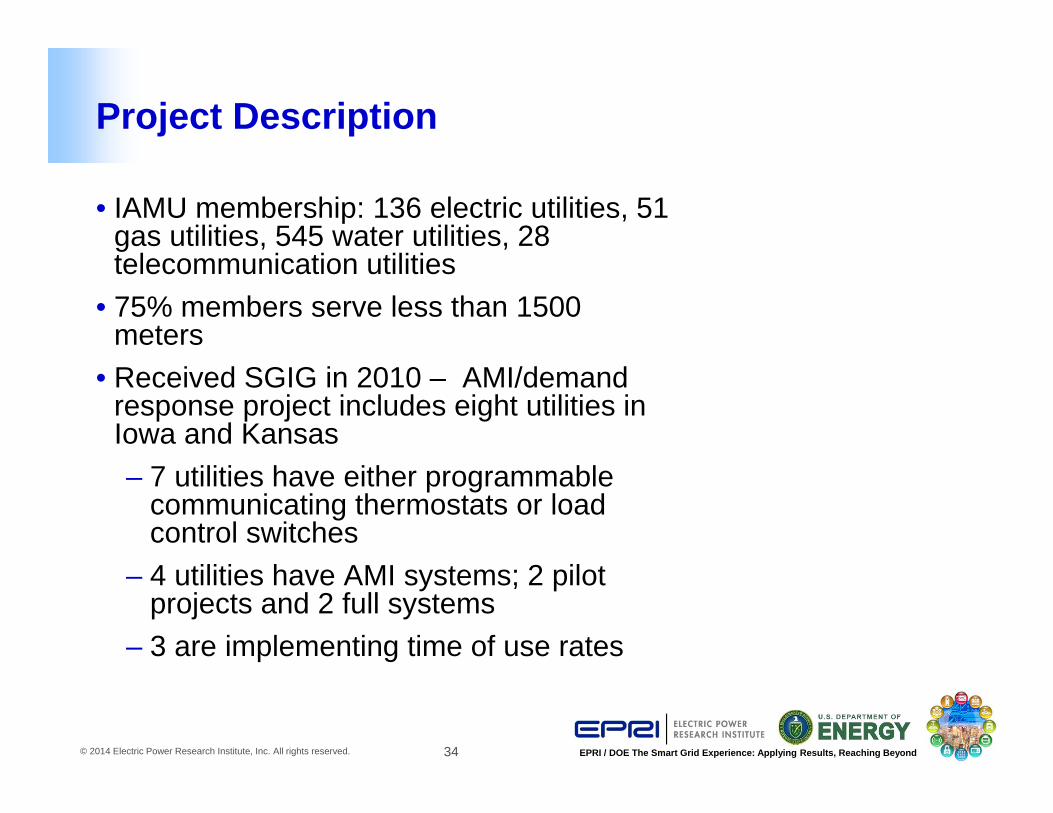
Project Description
• IAMU membership: 136 electric utilities, 51 gas utilities, 545 water utilities, 28 telecommunication utilities
• 75% members serve less than 1500 meters
• Received SGIG in 2010 – AMI/demand response project includes eight utilities in Iowa and Kansas– 7 utilities have either programmable
communicating thermostats or load control switches
– 4 utilities have AMI systems; 2 pilot projects and 2 full systems
– 3 are implementing time of use rates
35© 2014 Electric Power Research Institute, Inc. All rights reserved. EPRI / DOE The Smart Grid Experience: Applying Results, Reaching Beyond
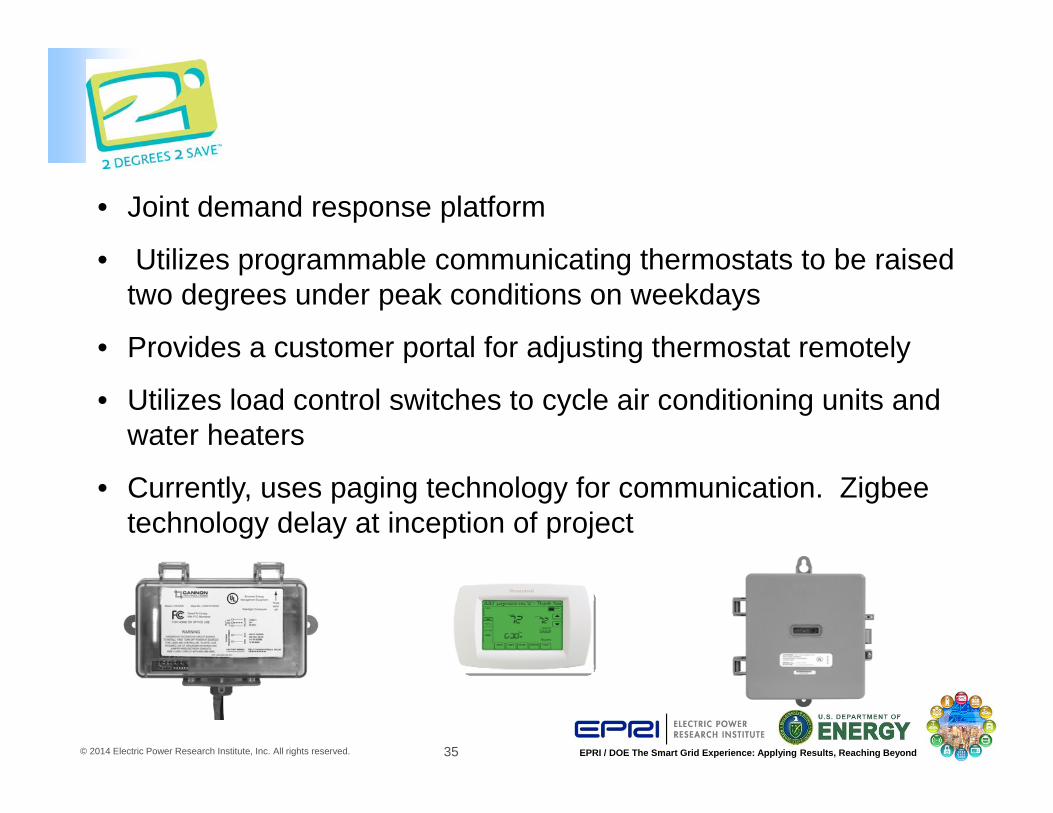
• Joint demand response platform
• Utilizes programmable communicating thermostats to be raised two degrees under peak conditions on weekdays
• Provides a customer portal for adjusting thermostat remotely
• Utilizes load control switches to cycle air conditioning units and water heaters
• Currently, uses paging technology for communication. Zigbeetechnology delay at inception of project
36© 2014 Electric Power Research Institute, Inc. All rights reserved. EPRI / DOE The Smart Grid Experience: Applying Results, Reaching Beyond
Surprises Related to the Project
• Initial project focused on demand response aspects of project.– Many power suppliers were hostile to demand
response programs by utility• Less “Big Brother” attitude than anticipated• Early success with AMI, and challenges with demand
response equipment led to expansion of project.• AMI integration, especially between water and electric
meters took longer than anticipated• DOE was extremely supportive and willing to work with us
to ensure successful outcomes
37© 2014 Electric Power Research Institute, Inc. All rights reserved. EPRI / DOE The Smart Grid Experience: Applying Results, Reaching Beyond
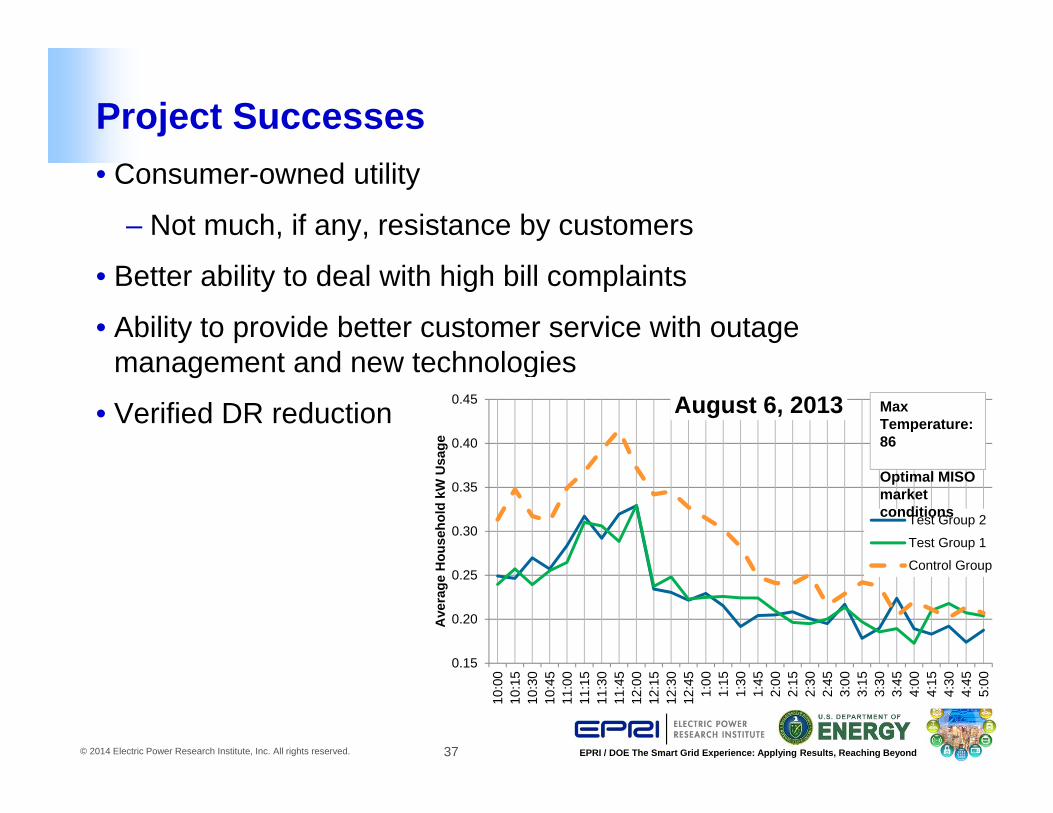
Project Successes• Consumer-owned utility
– Not much, if any, resistance by customers
• Better ability to deal with high bill complaints
• Ability to provide better customer service with outage management and new technologies
• Verified DR reduction
0.15
0.20
0.25
0.30
0.35
0.40
0.45
10:0
010
:15
10:3
010
:45
11:0
011
:15
11:3
011
:45
12:0
012
:15
12:3
012
:45
1:00
1:15
1:30
1:45
2:00
2:15
2:30
2:45
3:00
3:15
3:30
3:45
4:00
4:15
4:30
4:45
5:00
Ave
rage
Hou
seho
ld k
W U
sage
August 6, 2013
Test Group 2
Test Group 1
Control Group
MaxTemperature: 86
Optimal MISO market conditions
38© 2014 Electric Power Research Institute, Inc. All rights reserved. EPRI / DOE The Smart Grid Experience: Applying Results, Reaching Beyond
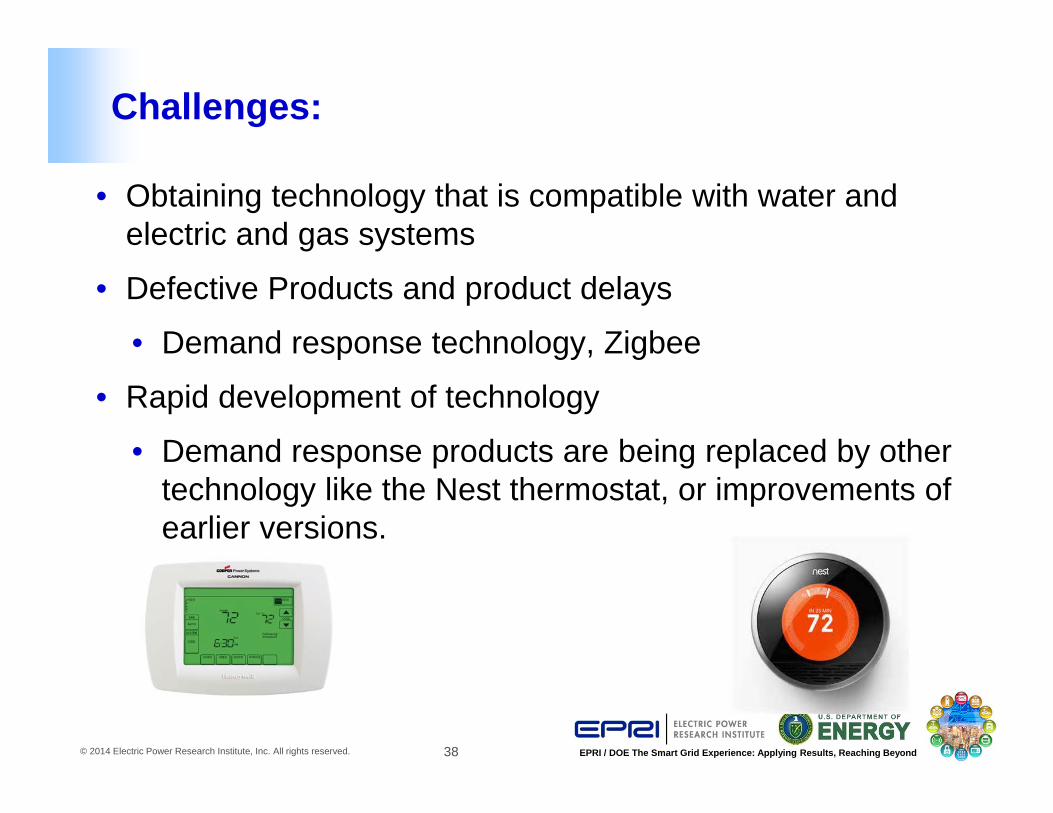
Challenges:
• Obtaining technology that is compatible with water and electric and gas systems
• Defective Products and product delays
• Demand response technology, Zigbee
• Rapid development of technology
• Demand response products are being replaced by other technology like the Nest thermostat, or improvements of earlier versions.
39© 2014 Electric Power Research Institute, Inc. All rights reserved. EPRI / DOE The Smart Grid Experience: Applying Results, Reaching Beyond
Reaching Beyond
• Utilities plan to offer new services to customers, including time of use rates, customer web portal, and other options for demand response.
• Utilities may expand demand response as a means to hedge market conditions, and may bid into market.
• Joint Action allows smaller utilities to participate in grid modernization technologies with cost effective prices
• AMI/demand response projects may present your utility with an opportunity for customer education and customer access.
• Work with your neighborhood associations!

40© 2014 Electric Power Research Institute, Inc. All rights reserved. EPRI / DOE The Smart Grid Experience: Applying Results, Reaching Beyond
Questions / Discussion
515-289-5212
October 27-29, 2014Charlotte, NC
Capacitor Bank Monitoring Using AMI Infrastructure
Joe Schatz, Manager of Transmission and Distribution ResearchSouthern Company
42© 2014 Electric Power Research Institute, Inc. All rights reserved. EPRI / DOE The Smart Grid Experience: Applying Results, Reaching Beyond
Joe Schatz:Southern Company
• Manager of Transmission and Distribution Research
– Includes activities in:
• Power Flow Control
• Visualization
• Analytics
• Unmanned Aircraft Systems
• MSEE and BEE from Auburn University.
Joe Schatz
Pages 65-67
Pages 86-97
43© 2014 Electric Power Research Institute, Inc. All rights reserved. EPRI / DOE The Smart Grid Experience: Applying Results, Reaching Beyond
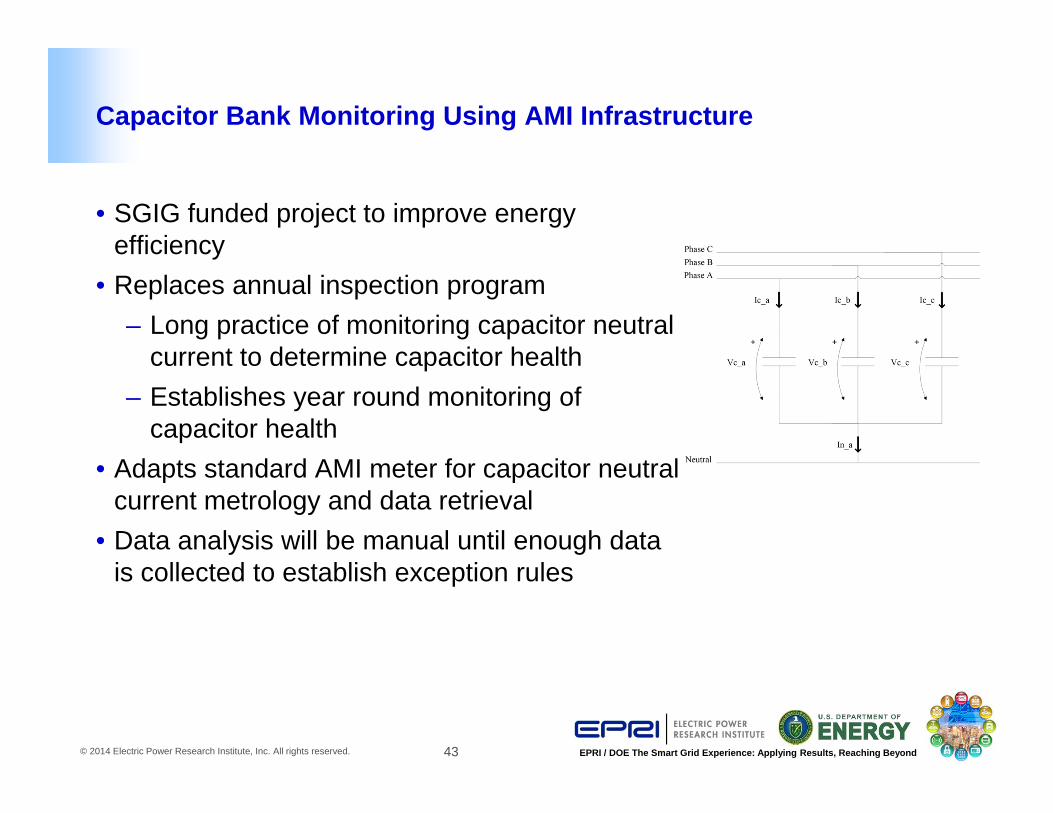
Capacitor Bank Monitoring Using AMI Infrastructure
• SGIG funded project to improve energy efficiency
• Replaces annual inspection program– Long practice of monitoring capacitor neutral
current to determine capacitor health– Establishes year round monitoring of
capacitor health• Adapts standard AMI meter for capacitor neutral
current metrology and data retrieval• Data analysis will be manual until enough data
is collected to establish exception rules
44© 2014 Electric Power Research Institute, Inc. All rights reserved. EPRI / DOE The Smart Grid Experience: Applying Results, Reaching Beyond
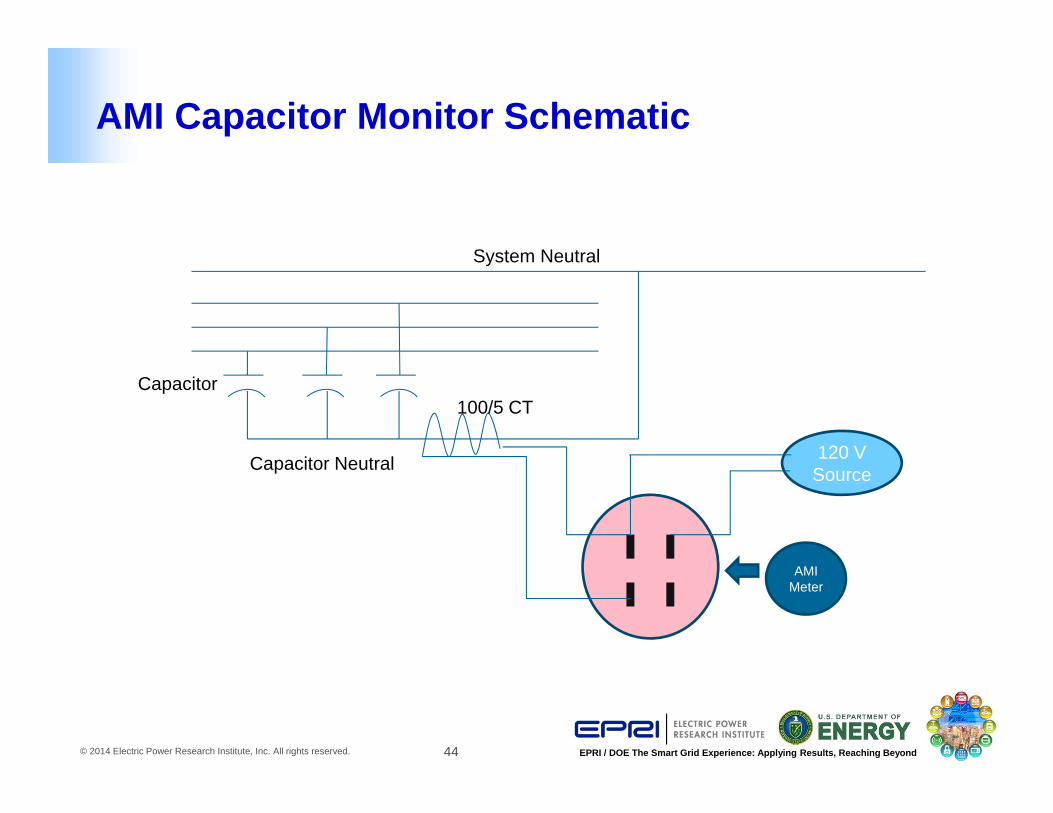
AMI Capacitor Monitor Schematic
120 V Source
System Neutral
Capacitor Neutral
100/5 CTCapacitor
AMI Meter
45© 2014 Electric Power Research Institute, Inc. All rights reserved. EPRI / DOE The Smart Grid Experience: Applying Results, Reaching Beyond
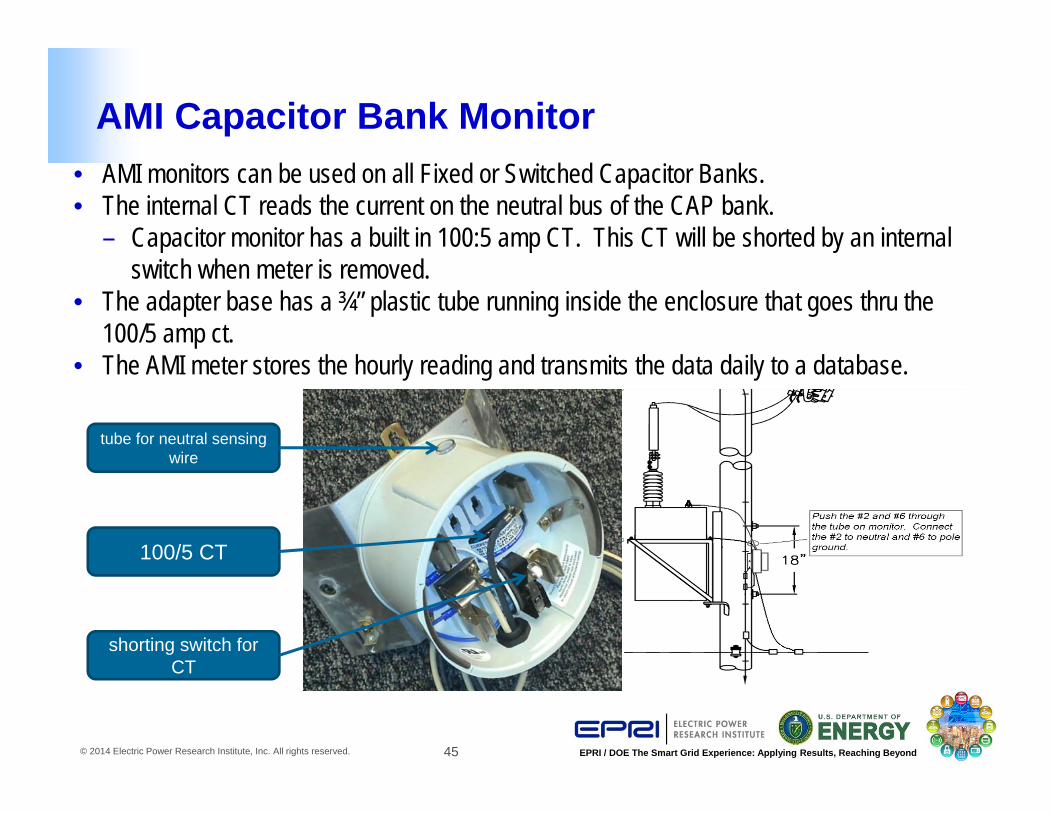
AMI Capacitor Bank Monitor• AMI monitors can be used on all Fixed or Switched Capacitor Banks.• The internal CT reads the current on the neutral bus of the CAP bank.
– Capacitor monitor has a built in 100:5 amp CT. This CT will be shorted by an internal switch when meter is removed.
• The adapter base has a ¾” plastic tube running inside the enclosure that goes thru the 100/5 amp ct.
• The AMI meter stores the hourly reading and transmits the data daily to a database.
100/5 CT
tube for neutral sensing wire
shorting switch for CT

46© 2014 Electric Power Research Institute, Inc. All rights reserved. EPRI / DOE The Smart Grid Experience: Applying Results, Reaching Beyond
AMI Capacitor Monitor• Monitors installed:
GPC 6,000 & APC about 3000 • Monitor info entered into the
MDMS after installation• Initial assessment found that
approximately 15% of capacitor banks had issues within the first year of install
• Finding problems not noticed with a visual inspection– Oil switches– Fuse melted and primary
switch didn’t open– Improper fuse sizes

47© 2014 Electric Power Research Institute, Inc. All rights reserved. EPRI / DOE The Smart Grid Experience: Applying Results, Reaching Beyond
Daily Report Examples
HQ SUBSTATION CIRCUIT SwNum MeterID FLDADDRESS Amps Amps kVar Type
DUBLIN DEXTER N3332 112 5792454 215 MT‐CARMEL RD UNIT G‐CAP 190 31.7 600 Fixed
SAVANNAH GRANGE ROAD 1303603 VWB11 5792570 880 DORSET RD UNIT G‐CAP 120 20.0 600 Switched
AUGUSTA ALEXANDER DRIVE N3182 25702 5791794 2720 MAYO RD UNIT G‐CAP 330 55.0 1200 Switched
AUGUSTA BERCKMAN ROAD N0362 19018 5793441 2675 OAKLAND DR UNIT G‐CAP 210 35.0 1200 Switched
AUGUSTA BERCKMAN ROAD N0362 750807 5793457 322 BERCKMAN RD UNIT G‐CAP 410 68.3 1200 Switched
AUGUSTA BEAVER DRIVE N4472 750806 5795237 3040 BRANSFORD RD UNIT G‐CAP 130 21.7 1200 Switched
ATLANTA GRADY Q1668 108235 5789473 510 BOULEVARD SE UNIT G‐CAP 240 40.0 1200 Switched
ATLANTA NORTHSIDE DRIVE K1422 92310 5789801 1391 HOWELL‐MILL RD NW UNIT G‐CAP 240 40.0 1200 Fixed
ATLANTA VIRGINIA AVENUE V6722 1200 5789819 553 COURTLAND ST NE UNIT G‐CAP 160 26.7 1200 Switched
ATLANTA DAVIS STREET A0652 111566 5789855 460 LUCKIE ST NW UNIT G‐CAP 230 38.3 1200 Fixed
meterid repid cap_bank feeder division district substation opv kvar Last Sample Time KVA Threshold KVA Actual Status
5827254 47546997 CE0162 20082 Eastern Talladega Talladega CS 4 150 1/4/2012 1:59 0.063 0.14 Over Threshold
5199426 45702008 C34 34906 Western Tuscaloosa Cedar Cove DS 12.47 600 6/3/2011 9:13 0.083 0 Dead/Disconnected Meter
5826311 47050351 HAA544 29716 Southeast Valley Langdale 12.47 600 1/4/2012 1:59 0.083 0.19 Over Threshold
5826478 47590966 C124 34616 Western Haleyville Weston 12.47 900 9/13/2011 8:30 0.125 0 Dead/Disconnected Meter
5826451 47577993 HAA158 32706 Southern Montgomery Hope Hull 13.2 150 1/1/1900 0:00 0.02 0 Dead/Disconnected Meter
5826742 47715249 HAA174 32706 Southern Central Hope Hull 12.47 900 1/4/2012 2:59 0.125 0.128 Over Threshold
5826767 47716135 CB0043 448224 Birmingham Metro Central EIGHTEENTH ST 13.2 900 12/9/2011 10:17 0.079 0 Dead/Disconnected Meter
5826759 47715028 C16 23908 Western South Demopolis 12.47 150 1/1/1900 0:00 0.021 0 Dead/Disconnected Meter
5826285 47050381 CSE177 29146 Southeast Ozark West Ozark 12.47 300 1/4/2012 3:00 0.042 0.098 Over Threshold
15 Amp Threshold
48© 2014 Electric Power Research Institute, Inc. All rights reserved. EPRI / DOE The Smart Grid Experience: Applying Results, Reaching Beyond
Lessons Learned
• Changed from using neutral current alarm to actual amp or KVA reading
• Readings reset after daily data is sent• Reading varies based on:
– Line voltage at the capacitor bank– Manufacturing KVAR tolerance of capacitor
• Use meter data to help determine threshold accuracy– Dynamic threshold based on local voltage– Neutral current reading
49© 2014 Electric Power Research Institute, Inc. All rights reserved. EPRI / DOE The Smart Grid Experience: Applying Results, Reaching Beyond
Questions / Discussion
50© 2014 Electric Power Research Institute, Inc. All rights reserved. EPRI / DOE The Smart Grid Experience: Applying Results, Reaching Beyond
Together…Shaping the Future of Electricity