Embed Size (px)
Citation preview
Page 1
Microchip Technology IncorporatedMicrochip Technology Incorporated
An Introduction to the MPLAB®
Integrated Development Environment
This seminar is an introduction to the MPLAB Integrated Development Environment. My name is Darrel Johansen and I’m a manager for the Development Systems Group here at Microchip Technology.
Page 2
2An Introduction to MPLAB IDE
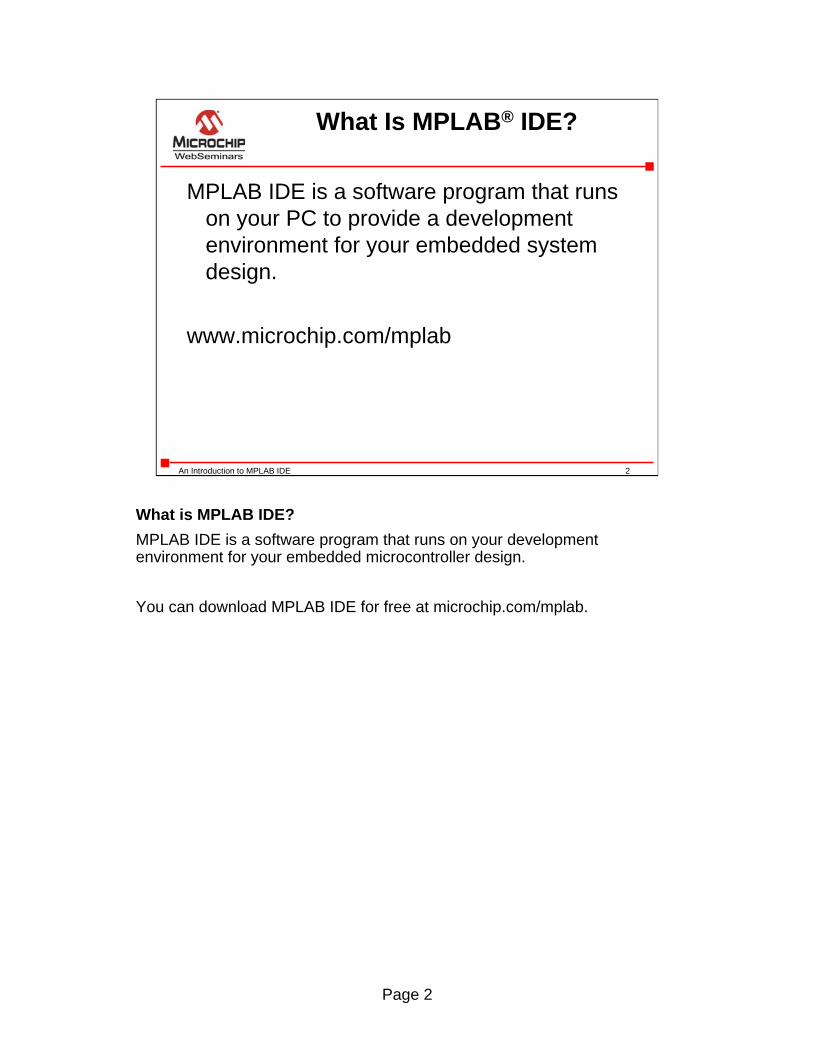
What Is MPLAB® IDE?
MPLAB IDE is a software program that runs on your PC to provide a development environment for your embedded system design.
www.microchip.com/mplab
What is MPLAB IDE?MPLAB IDE is a software program that runs on your development environment for your embedded microcontroller design.
You can download MPLAB IDE for free at microchip.com/mplab.
Page 3
3An Introduction to MPLAB IDE
Design Cycle
1. High Level Design2. Software Coding3. Generate Executable4. Test5. “Burn” into Device
The design cycle for developing an embedded controller application is:1) Do the high level design – From the features and performance desired, decide which PICmicro or dsPIC device you need, then design the associated hardware circuitry.2) Knowing which peripherals and pins control your hardware, write the software. Use either assembly language, which is directly translatable into machine code, or using a compiler that allows a more natural language for creating programs. With these Language Tools you can write and edit code that is more or less understandable, with constructs that help you organize your code.3) Compile or assemble the software using a Language Tool to convert your code into machine code for the PICmicro device. This machine code will eventually becomes firmware, the code programmed into the microcontroller.4) Test your code. Usually a complex program does not work exactly the way you might have imagined, and “bugs” need to be removed from your design to get it to act properly.5) “Burn” your code into a microcontroller and verify that it executes correctly in your finished application.
This seminar will show you how MPLAB can do steps 1 through 4.
Step 5 will require some hardware and will be covered in another seminar.
Page 4
4An Introduction to MPLAB IDE
First Project
Create Project
Build Project
Test Code with Simulator
This exercise will show you how to put together a project framework, how to build an application, andhow to test it with the simulator to verify that it works as expected.
Page 5
5An Introduction to MPLAB IDE
MPLAB Desktop
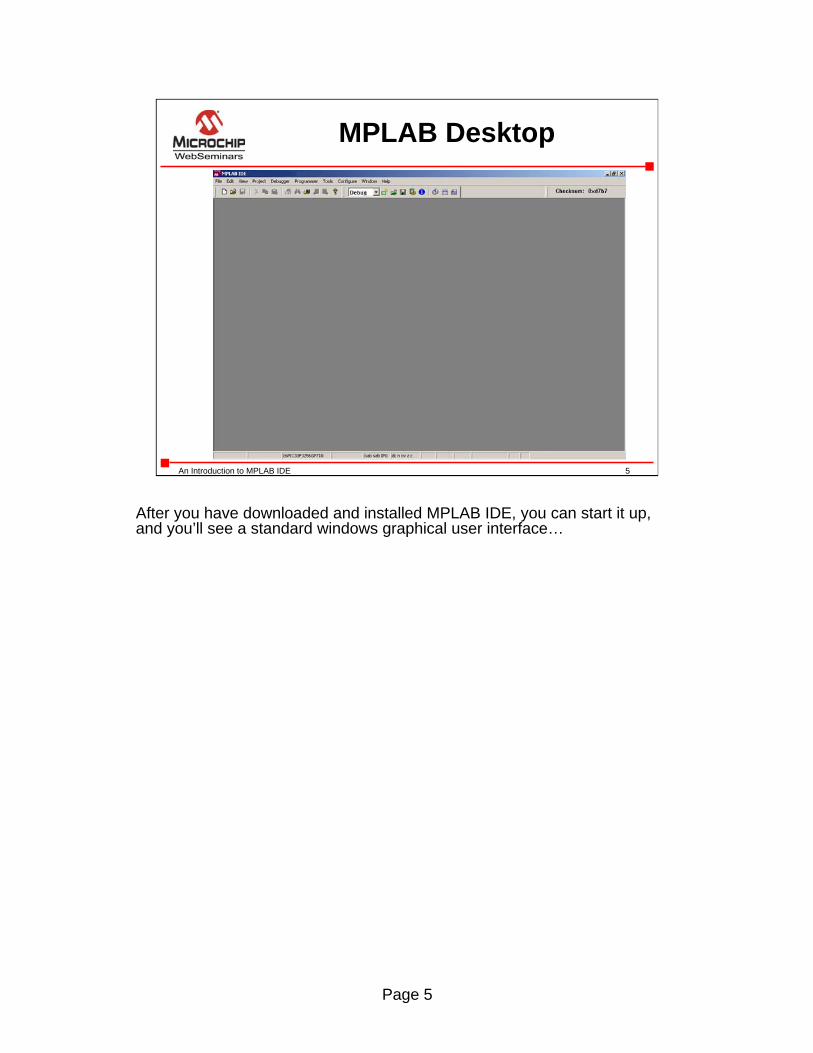
After you have downloaded and installed MPLAB IDE, you can start it up, and you’ll see a standard windows graphical user interface…
Page 6
6An Introduction to MPLAB IDE
MPLAB Desktop
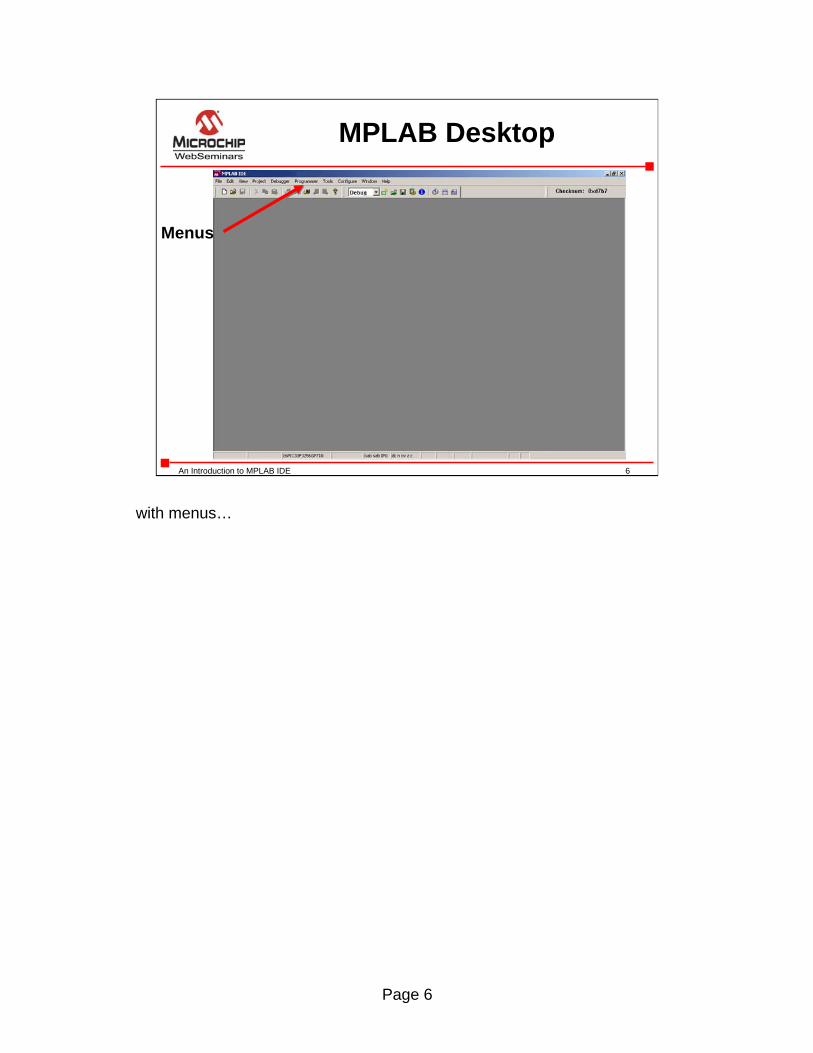
Menus
with menus…

Page 7
7An Introduction to MPLAB IDE
MPLAB Desktop
Toolbar
toolbar icons…
Page 8
8An Introduction to MPLAB IDE
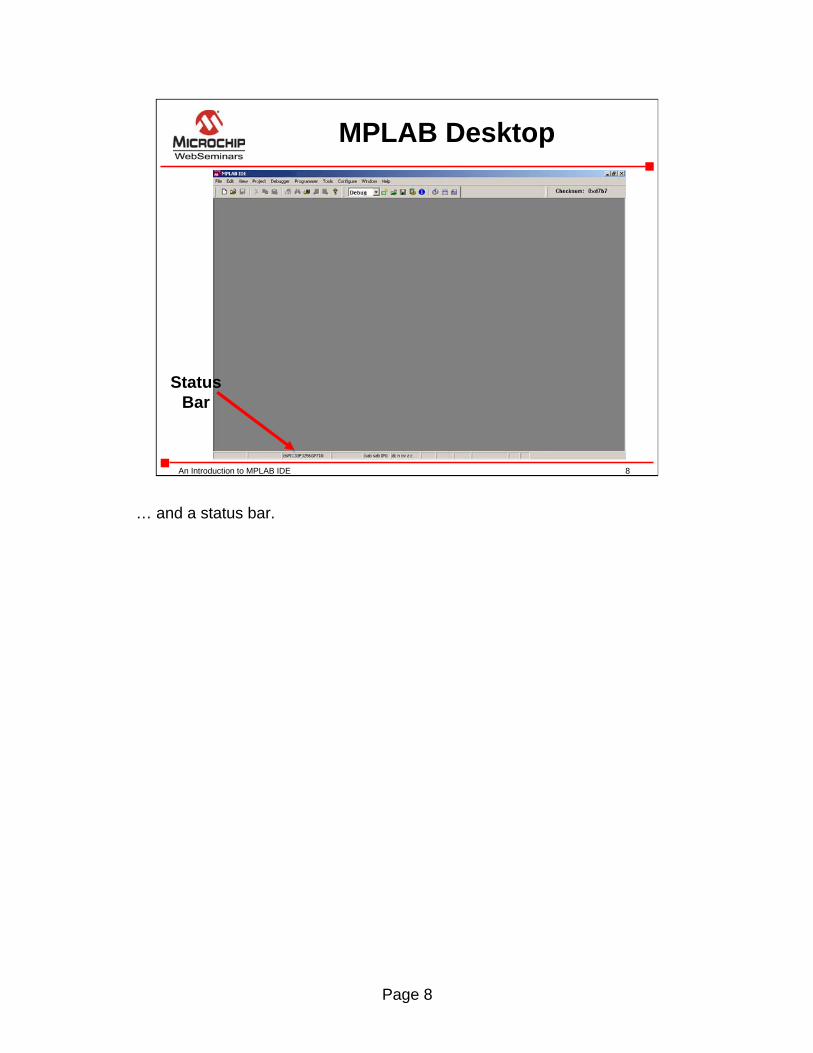
MPLAB Desktop
StatusBar
… and a status bar.

Page 9
9An Introduction to MPLAB IDE
MPLAB Desktop
To get started, we’ll use the Project Wizard, which is selected from the Project menu.
Many of our development boards and starter kits come with finished projects that you can load and examine.
The Project Wizard makes it very easy to set up a new project.
Page 10
10An Introduction to MPLAB IDE
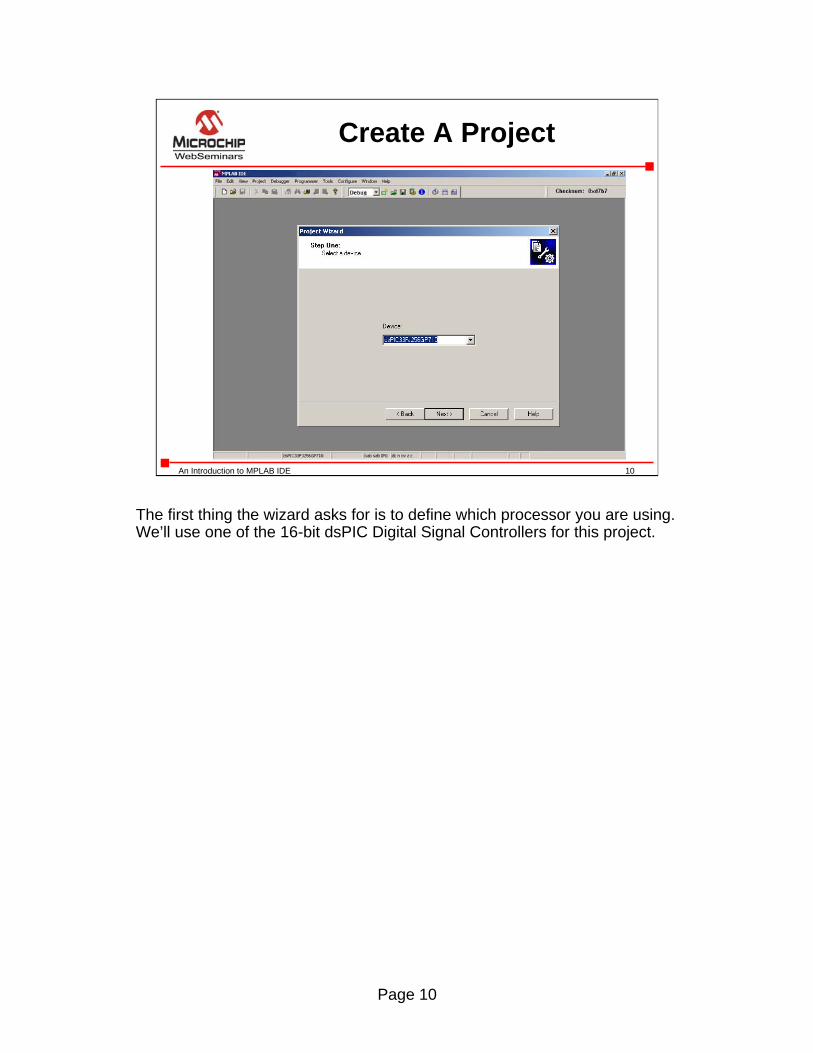
Create A Project
The first thing the wizard asks for is to define which processor you are using. We’ll use one of the 16-bit dsPIC Digital Signal Controllers for this project.
Page 11
11An Introduction to MPLAB IDE
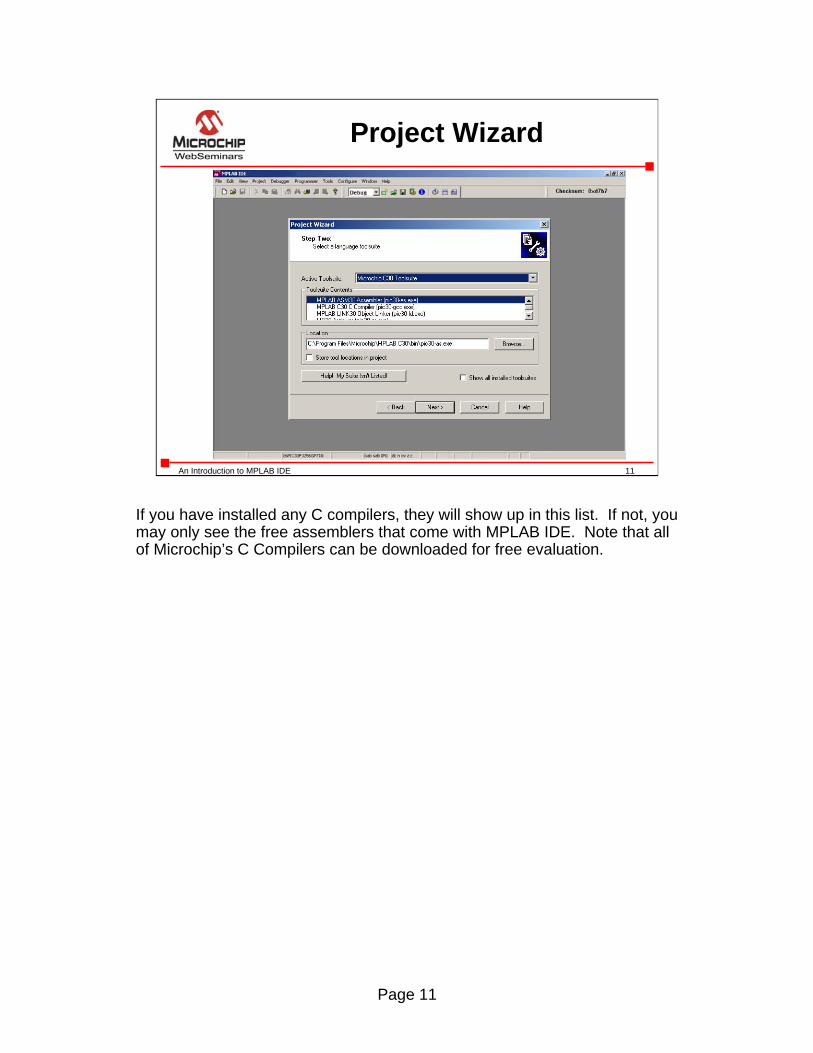
Project Wizard
If you have installed any C compilers, they will show up in this list. If not, you may only see the free assemblers that come with MPLAB IDE. Note that all of Microchip’s C Compilers can be downloaded for free evaluation.
Page 12
12An Introduction to MPLAB IDE
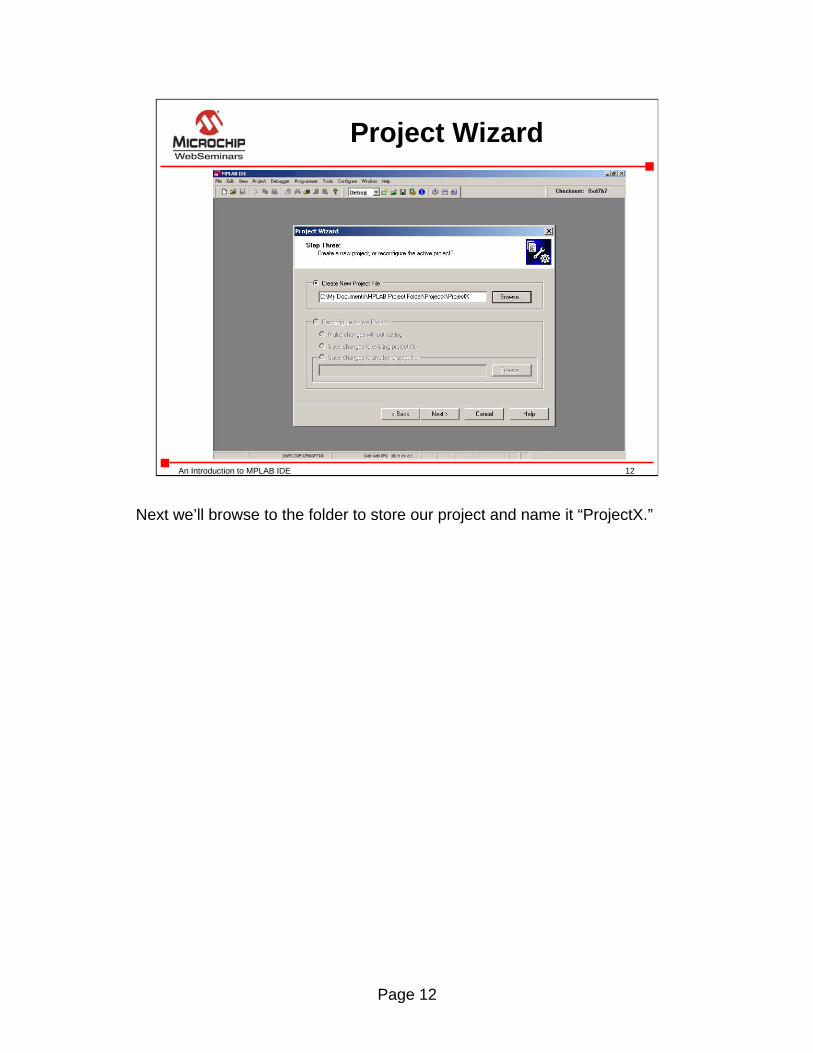
Project Wizard
Next we’ll browse to the folder to store our project and name it “ProjectX.”
Page 13
13An Introduction to MPLAB IDE
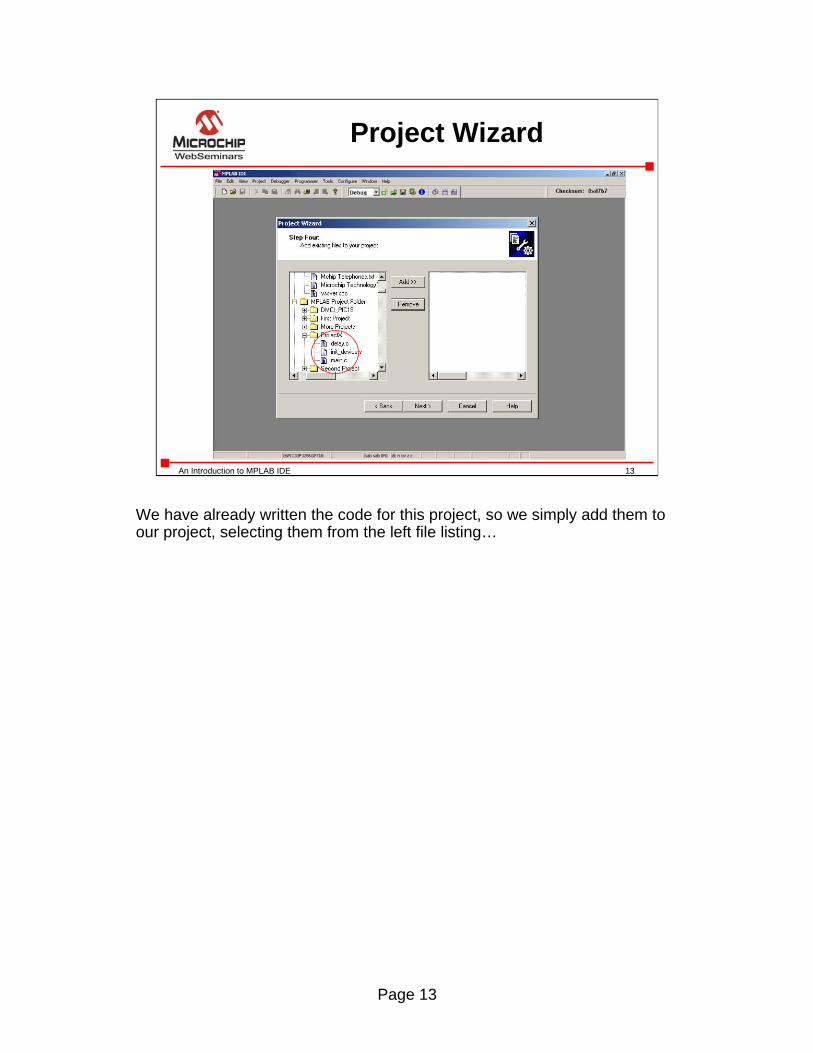
Project Wizard
We have already written the code for this project, so we simply add them to our project, selecting them from the left file listing…

Page 14
14An Introduction to MPLAB IDE
Project Wizard
…and pressing the “Add>>” button…
Page 15
15An Introduction to MPLAB IDE
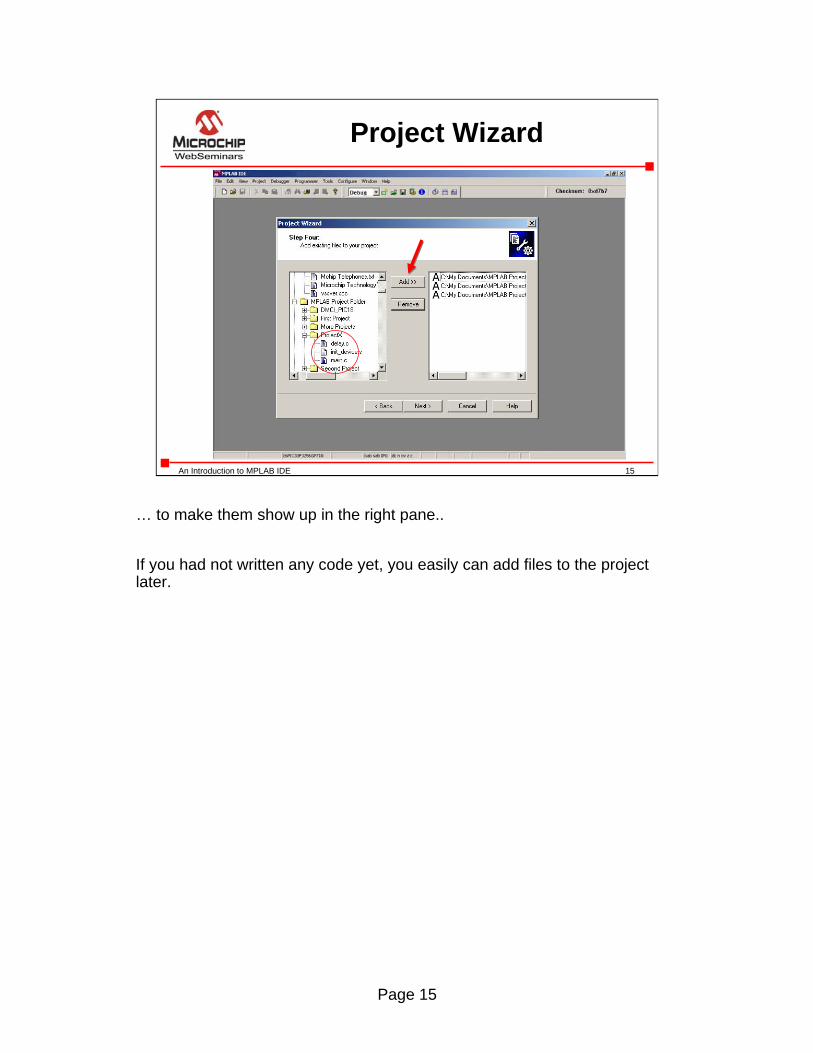
Project Wizard
… to make them show up in the right pane..
If you had not written any code yet, you easily can add files to the project later.
Page 16
16An Introduction to MPLAB IDE
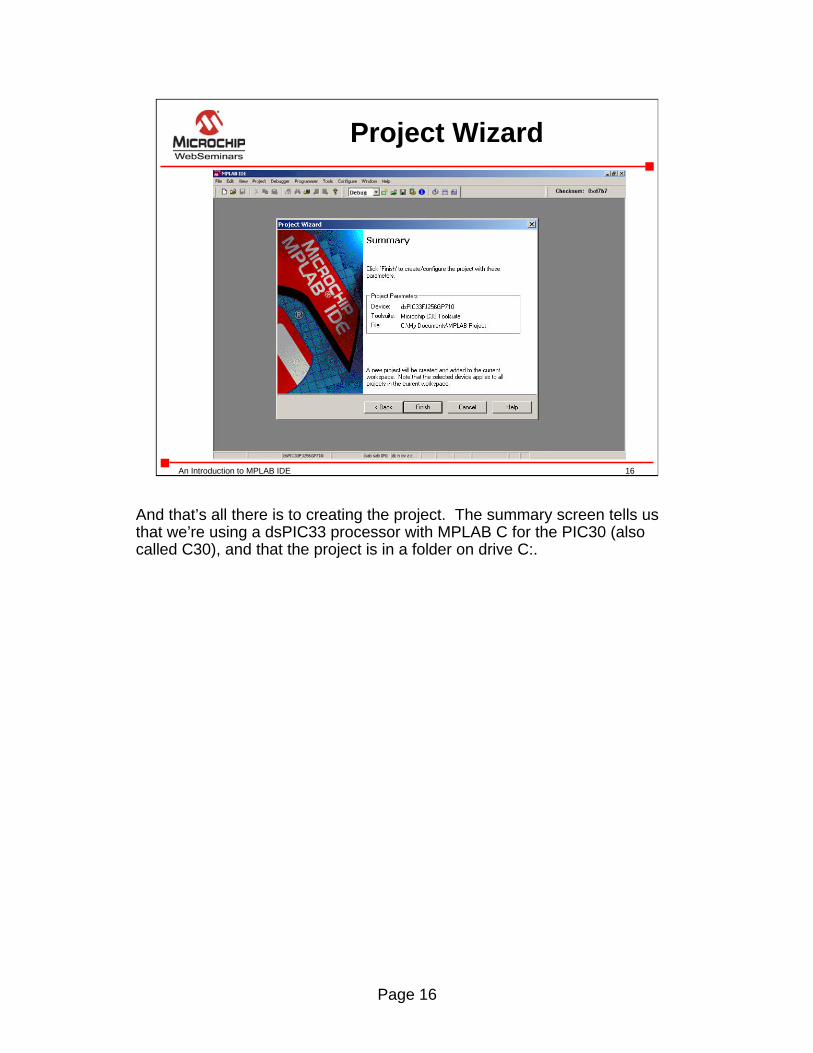
Project Wizard
And that’s all there is to creating the project. The summary screen tells us that we’re using a dsPIC33 processor with MPLAB C for the PIC30 (also called C30), and that the project is in a folder on drive C:.
Page 17
17An Introduction to MPLAB IDE
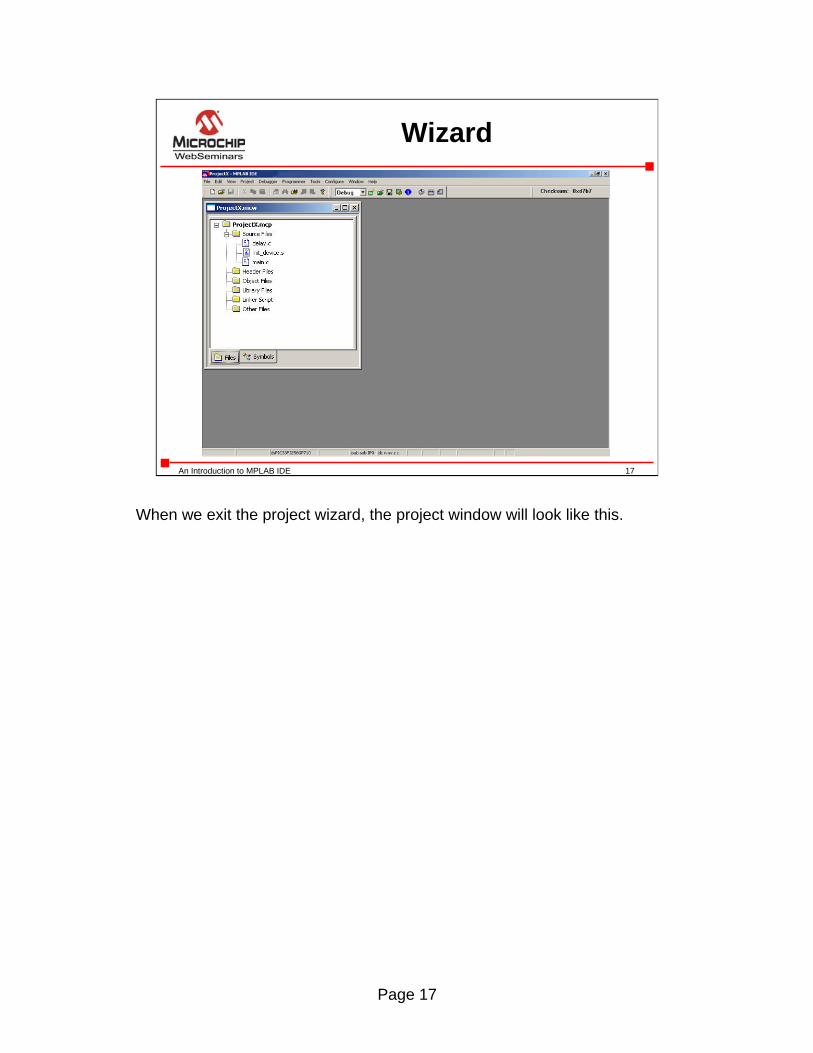
Wizard
When we exit the project wizard, the project window will look like this.

Page 18
18An Introduction to MPLAB IDE
Wizard
If the project window is not shown, pull down the View menu and select the project window.
Page 19
19An Introduction to MPLAB IDE
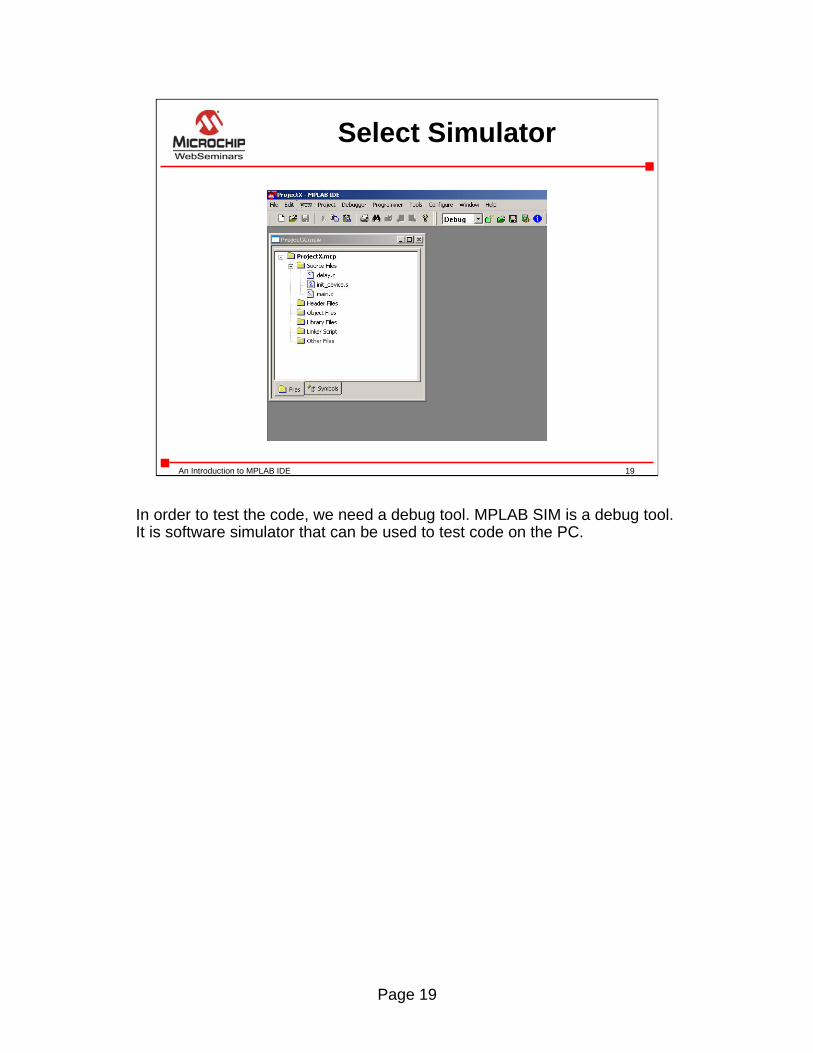
Select Simulator
In order to test the code, we need a debug tool. MPLAB SIM is a debug tool. It is software simulator that can be used to test code on the PC.
Page 20
20An Introduction to MPLAB IDE
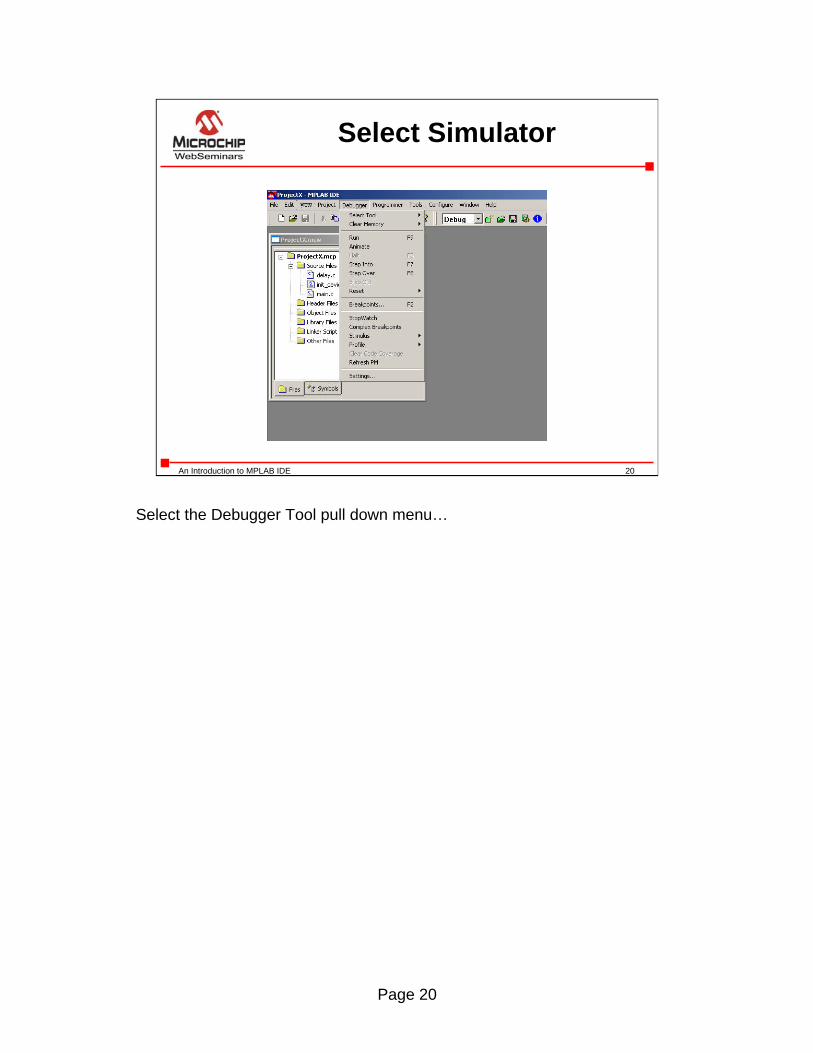
Select Simulator
Select the Debugger Tool pull down menu…
Page 21
21An Introduction to MPLAB IDE
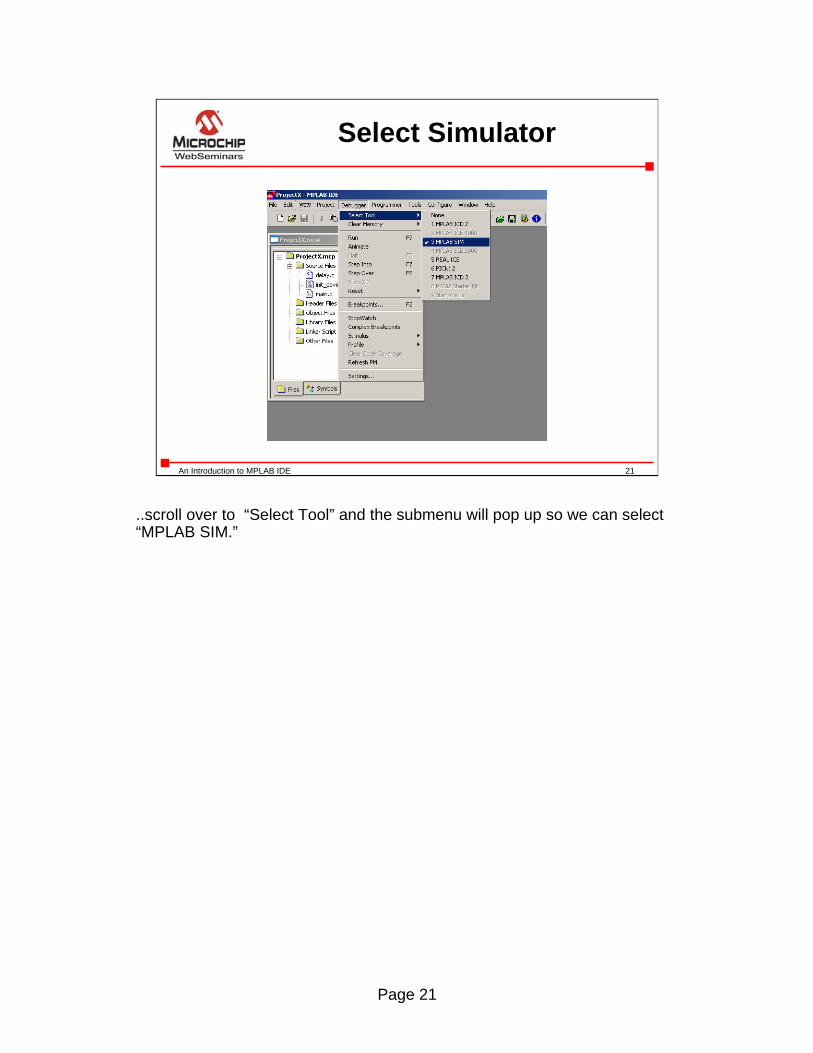
Select Simulator
..scroll over to “Select Tool” and the submenu will pop up so we can select “MPLAB SIM.”
Page 22
22An Introduction to MPLAB IDE
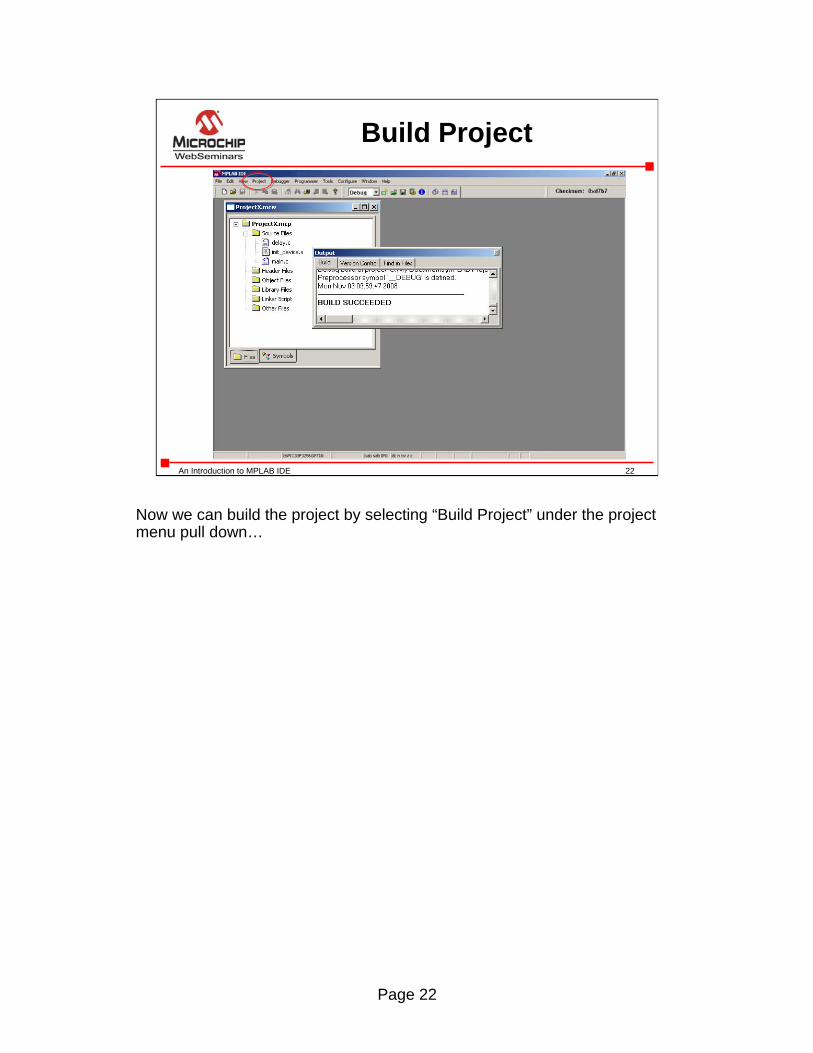
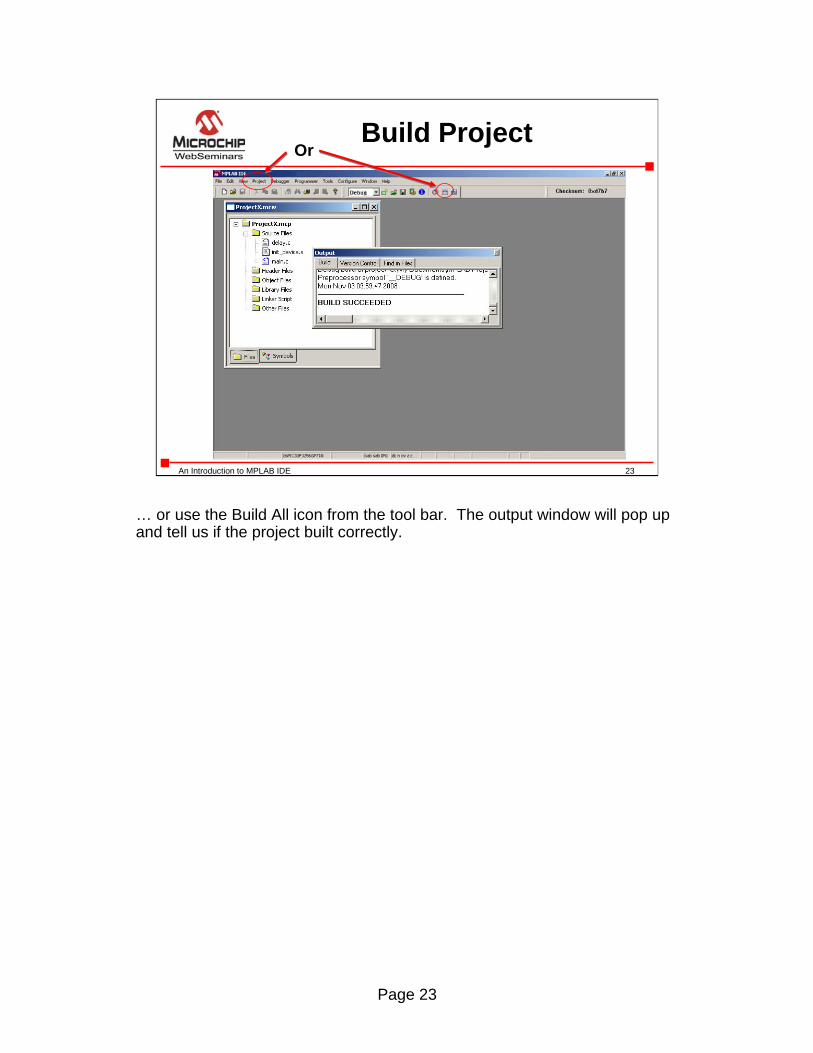
Build Project
Now we can build the project by selecting “Build Project” under the project menu pull down…
Page 23
23An Introduction to MPLAB IDE
Build ProjectOr
… or use the Build All icon from the tool bar. The output window will pop up and tell us if the project built correctly.
Page 24
24An Introduction to MPLAB IDE
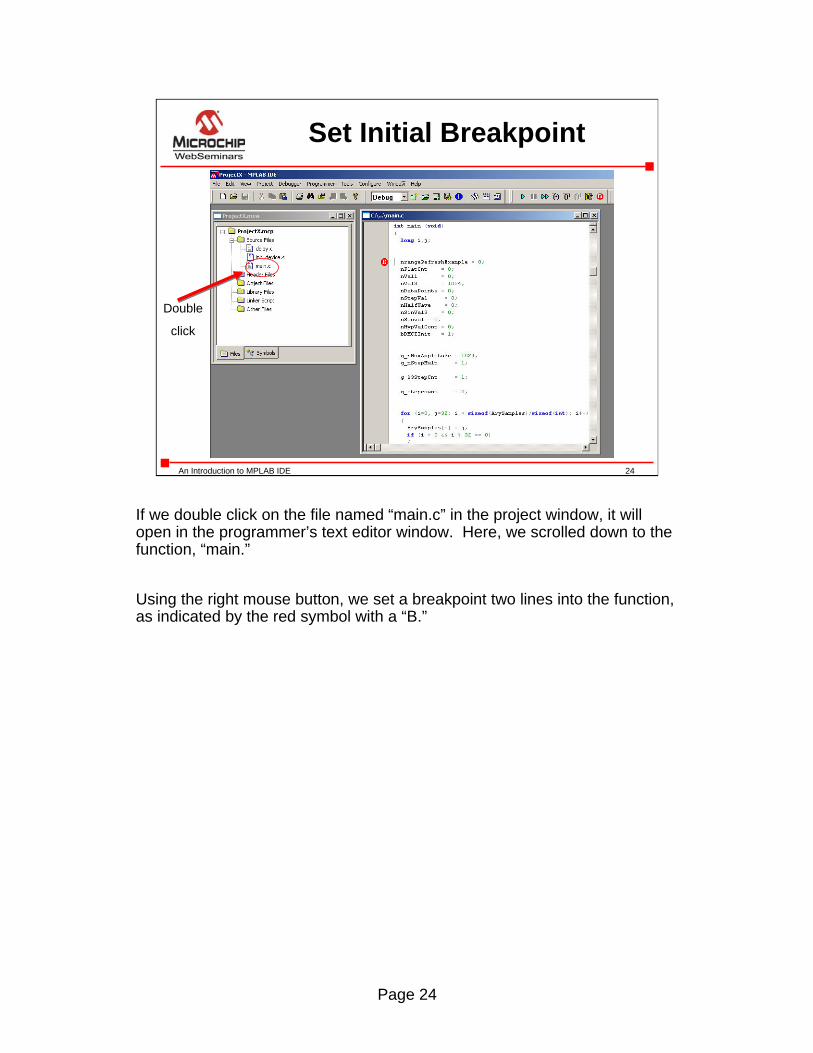
Set Initial Breakpoint
Double
click
If we double click on the file named “main.c” in the project window, it will open in the programmer’s text editor window. Here, we scrolled down to the function, “main.”
Using the right mouse button, we set a breakpoint two lines into the function, as indicated by the red symbol with a “B.”
Page 25
25An Introduction to MPLAB IDE
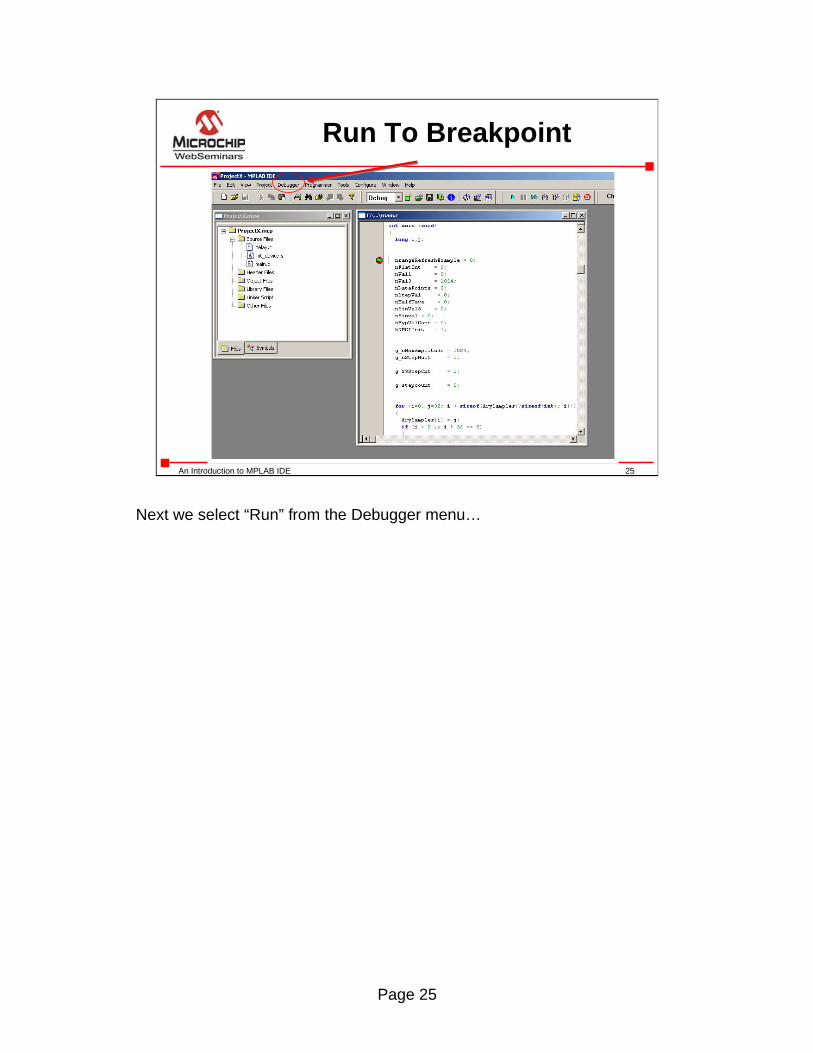
Run To Breakpoint
Next we select “Run” from the Debugger menu…

Page 26
26An Introduction to MPLAB IDE
Run To BreakpointOr
… or the green arrow on the tool bar.
Page 27
27An Introduction to MPLAB IDE
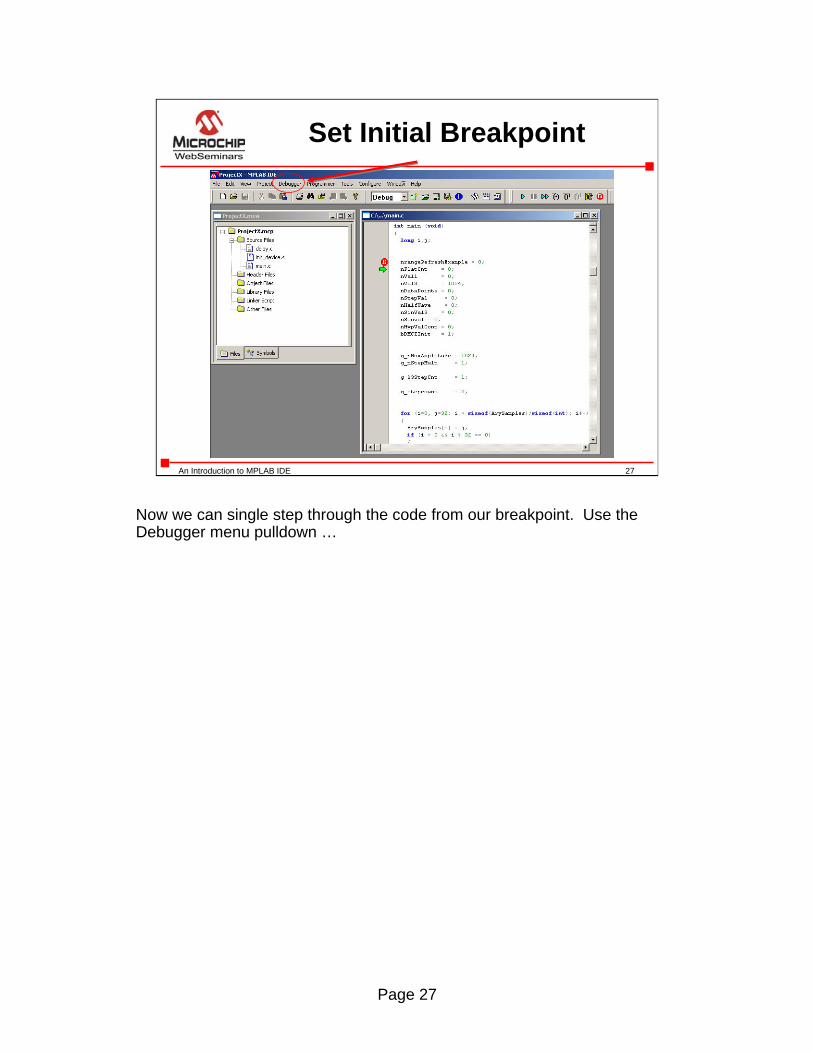
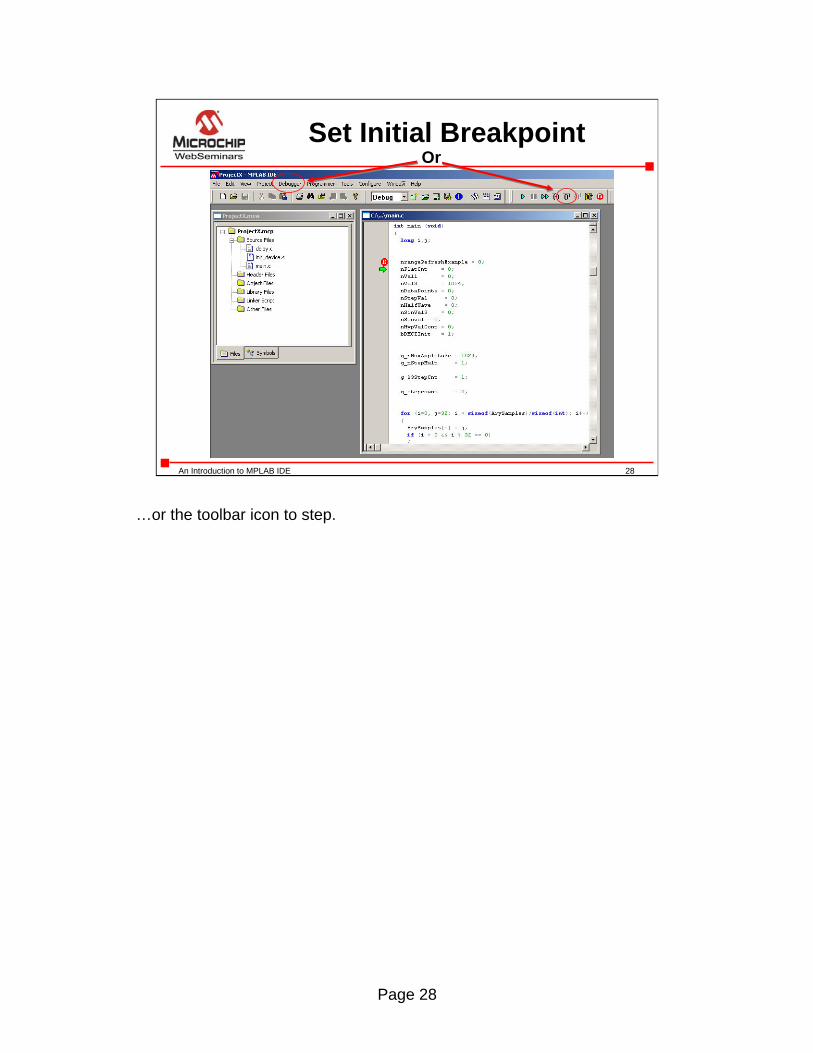
Set Initial Breakpoint
Now we can single step through the code from our breakpoint. Use the Debugger menu pulldown …
Page 28
28An Introduction to MPLAB IDE
Set Initial BreakpointOr
…or the toolbar icon to step.
Page 29
29An Introduction to MPLAB IDE
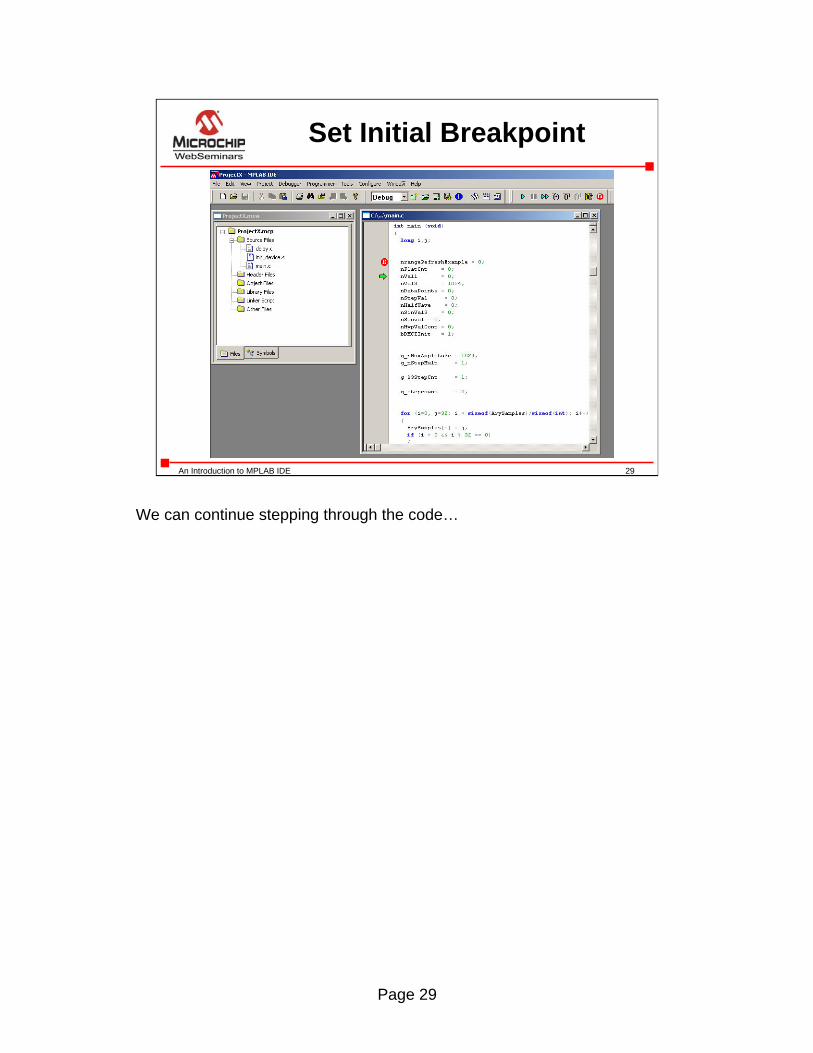
Set Initial Breakpoint
We can continue stepping through the code…

Page 30
30An Introduction to MPLAB IDE
Set Initial Breakpoint
Page 31
31An Introduction to MPLAB IDE
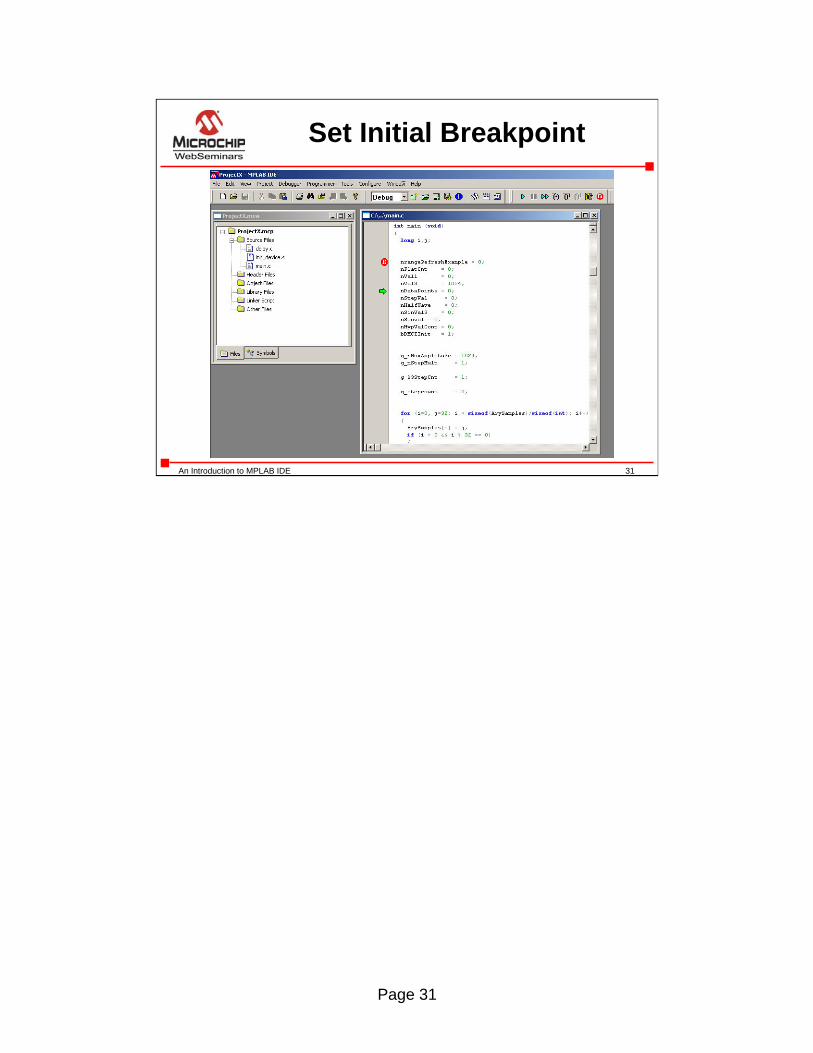
Set Initial Breakpoint
Page 32
32An Introduction to MPLAB IDE
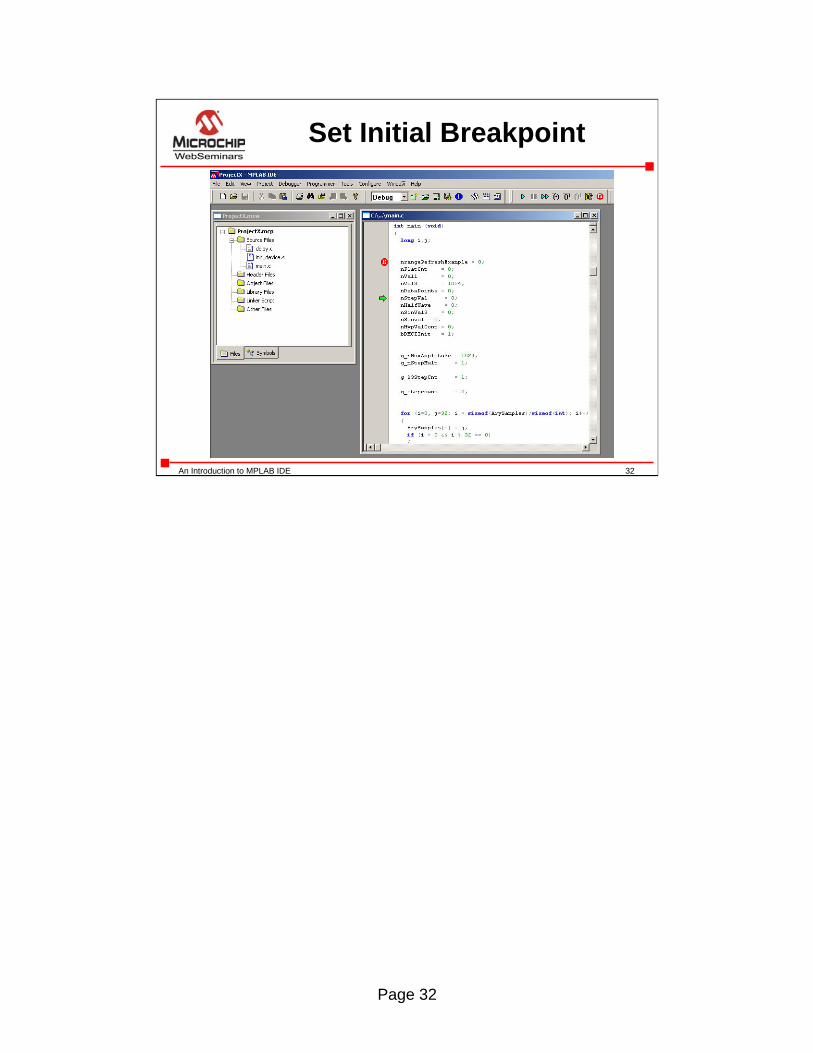
Set Initial Breakpoint
Page 33
33An Introduction to MPLAB IDE
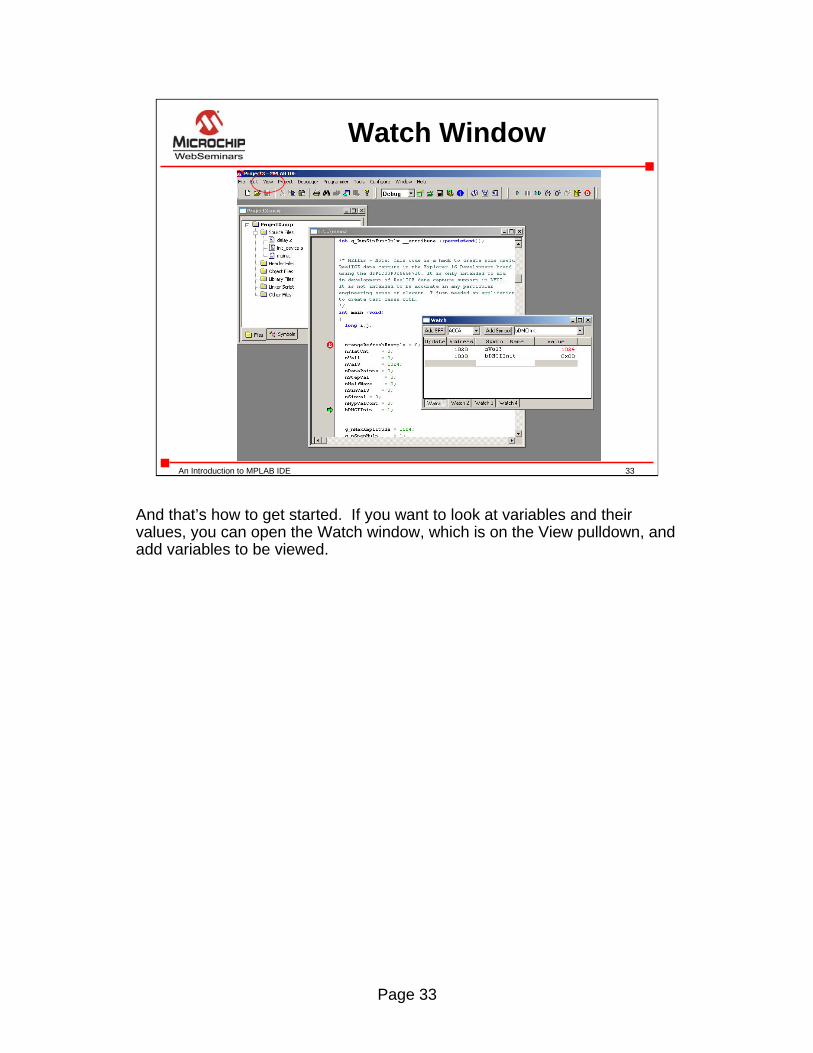
Watch Window
And that’s how to get started. If you want to look at variables and their values, you can open the Watch window, which is on the View pulldown, and add variables to be viewed.
Page 34
34An Introduction to MPLAB IDE
Summary: The Next Step
Other main debugging features:Step-Into/Step-Over
Once you are familiar with these basic steps, you are ready to go on to explore the power of the MPLAB tool.
You might wish to explore the difference between Step-Into and Step-Over.
Page 35
35An Introduction to MPLAB IDE
Summary: The Next Step
Other main debugging features:Step-Into/Step-OverTrace
As an alternative to breakpoints, you can choose to trace your code with a record of instruction execution
Page 36
36An Introduction to MPLAB IDE
Summary: The Next Step
Other main debugging features:Step-Into/Step-OverTraceChange variable in Watch window
You can change variable values in the Watch window to see the effects on your application
Page 37
37An Introduction to MPLAB IDE
Summary: The Next Step
Other main debugging features:Step-Into/Step-OverTraceChange variable in Watch windowComplex breakpoints
And you can set complex breakpoints on particular variable values or sequences of events.
Page 38
38An Introduction to MPLAB IDE
Summary: The Next Step
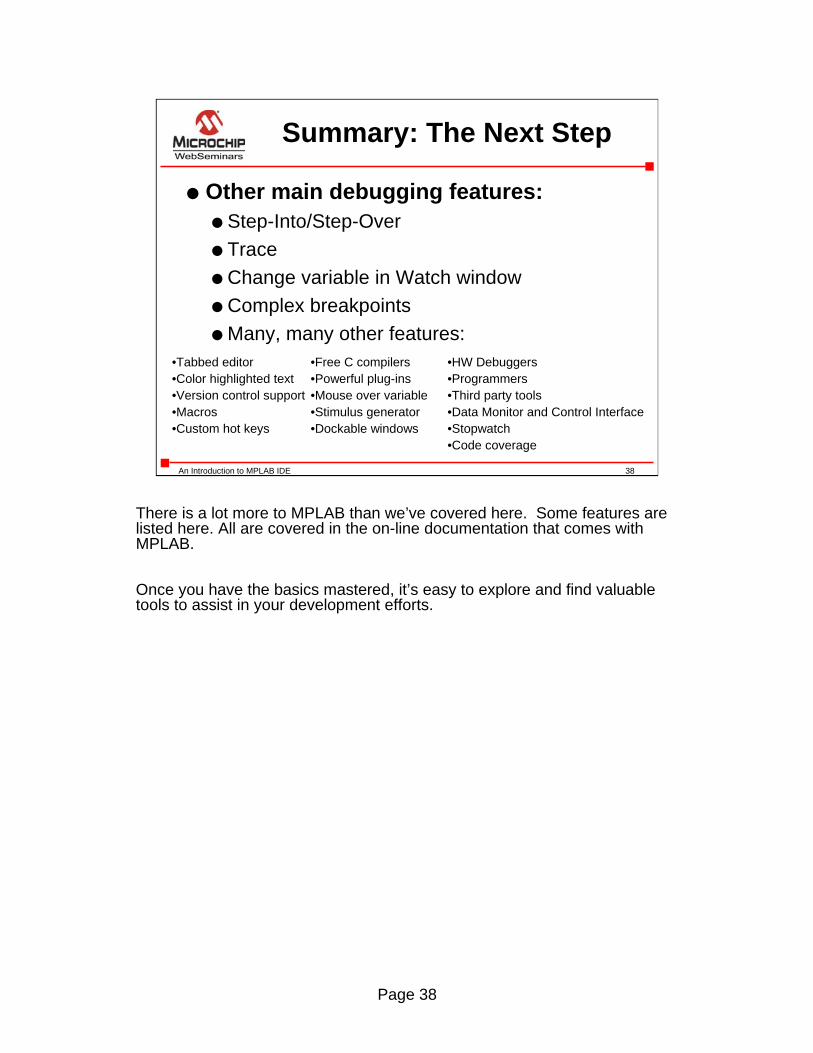
Other main debugging features:Step-Into/Step-OverTraceChange variable in Watch windowComplex breakpointsMany, many other features:
•Tabbed editor•Color highlighted text•Version control support•Macros•Custom hot keys
•Free C compilers•Powerful plug-ins•Mouse over variable•Stimulus generator•Dockable windows
•HW Debuggers•Programmers•Third party tools•Data Monitor and Control Interface•Stopwatch•Code coverage
There is a lot more to MPLAB than we’ve covered here. Some features are listed here. All are covered in the on-line documentation that comes with MPLAB.
Once you have the basics mastered, it’s easy to explore and find valuable tools to assist in your development efforts.
Page 39
39An Introduction to MPLAB IDE
Download MPLAB and Try It!
WWW.MICROCHIP.COM/MPLABWWW.MICROCHIP.COM/MPLAB
If you haven’t already done it, now is the time to get started with MPLAB IDE.
For an overview of more of Microchip’s development tools, you might wish to view the web seminar titled “An Introduction to Microchip’s Development Tools.”
To get MPLAB for free, simply go to our web site at microchip.com/mplab.
This is the end of our presentation.
Thank you for your time.