Embed Size (px)
Citation preview
Analyse par FOTO-couplage du potentiel des donnés radar bande P pour estimer les biomasses forestières en mangroves.
Etat d’avancement Janvier 2011.
Christophe Proisy, Nicolas Barbier, Pierre Couteron
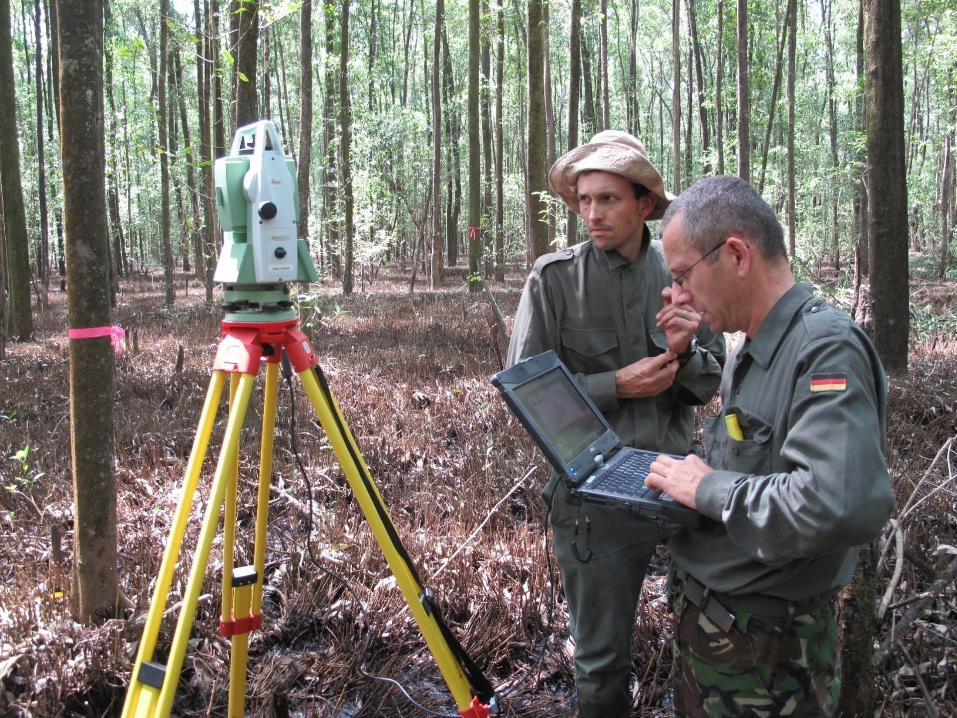
Terrain+ Modèle forestier
Grain de canopée FOTO
RadarLidar
bande P
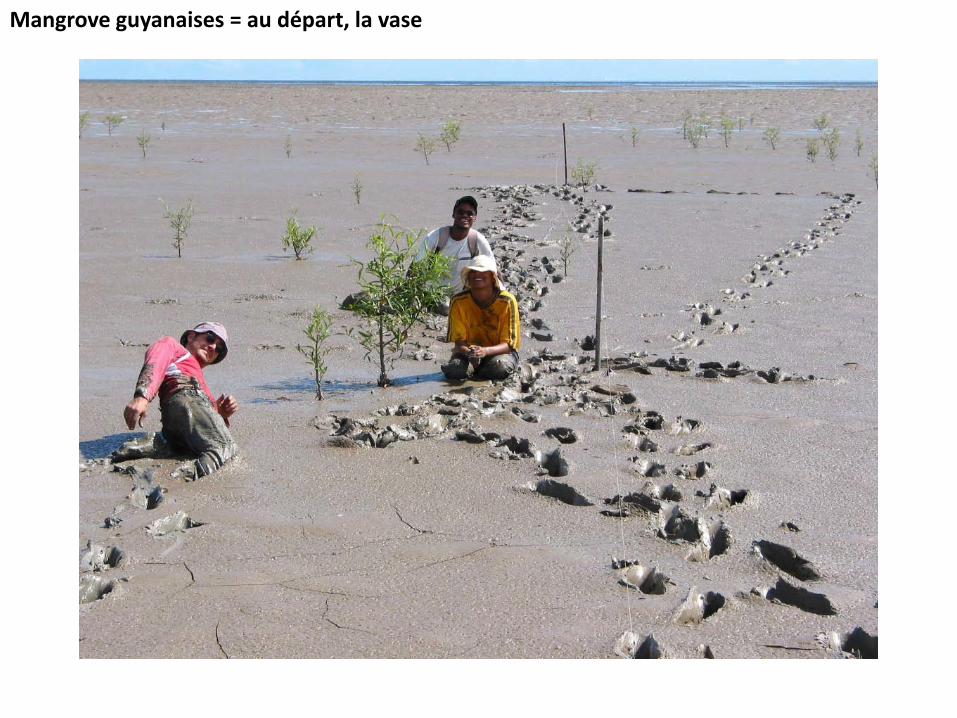
Mangrove guyanaises = au départ, la vase
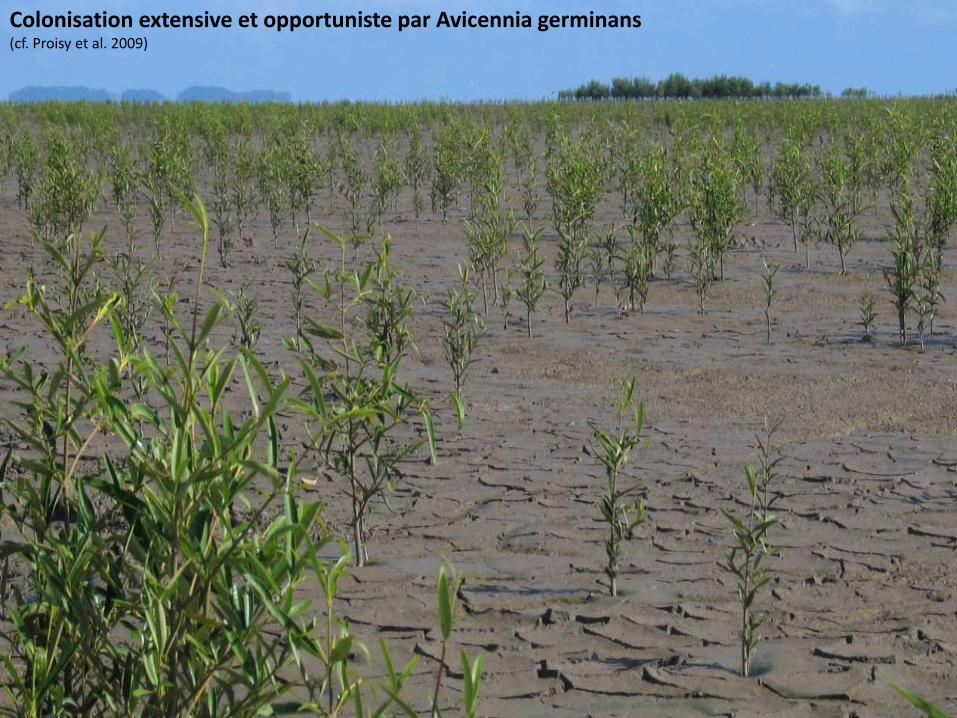
Colonisation extensive et opportuniste par Avicennia germinans(cf. Proisy et al. 2009)
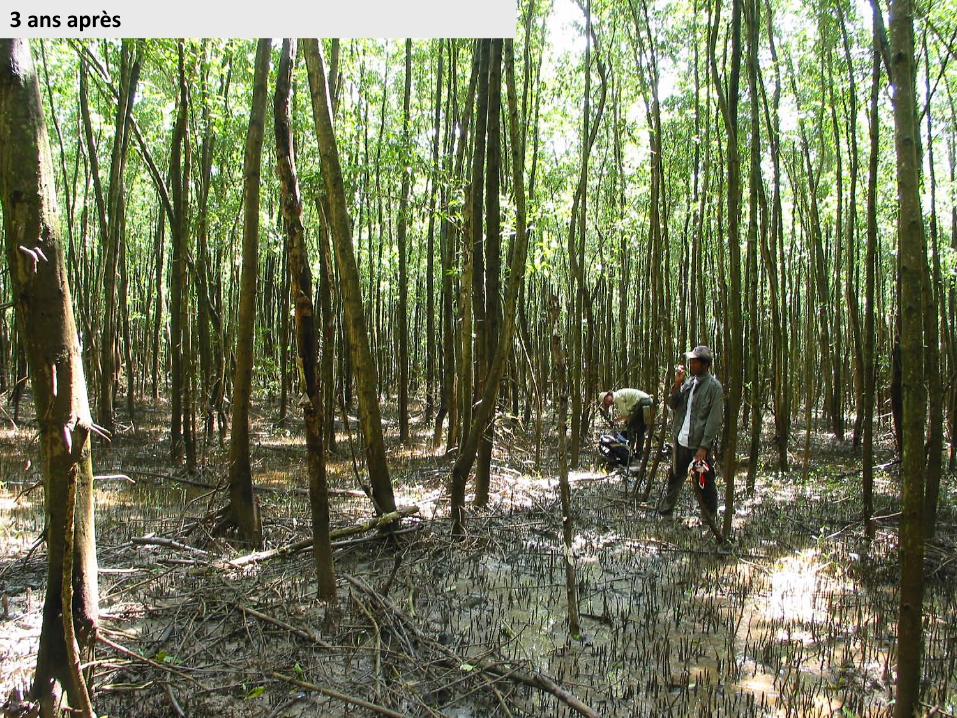
3 ans après
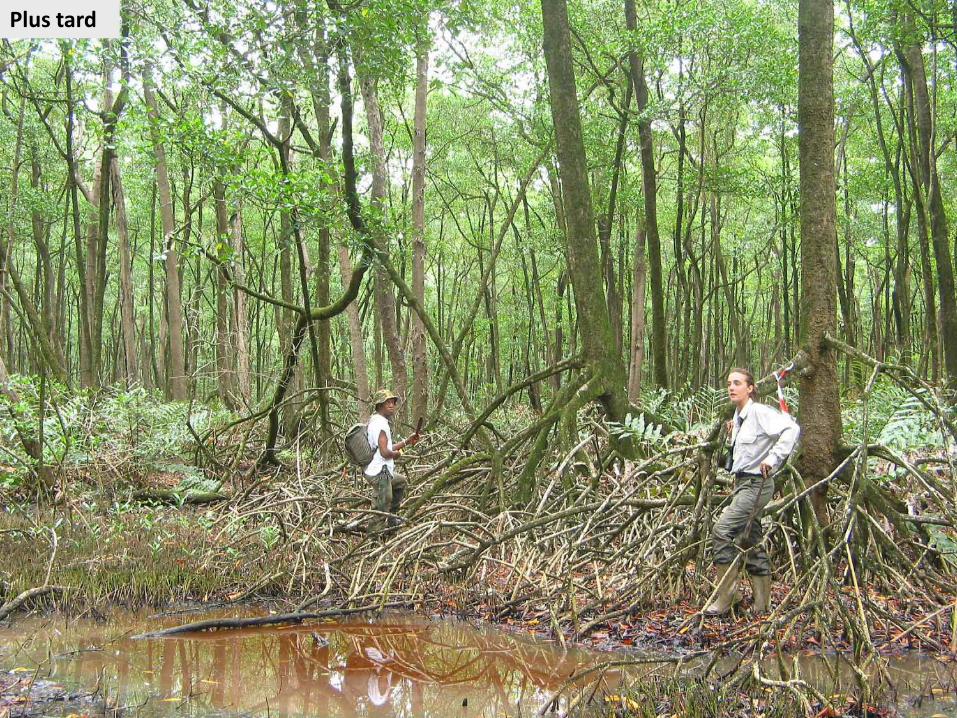
Plus tard
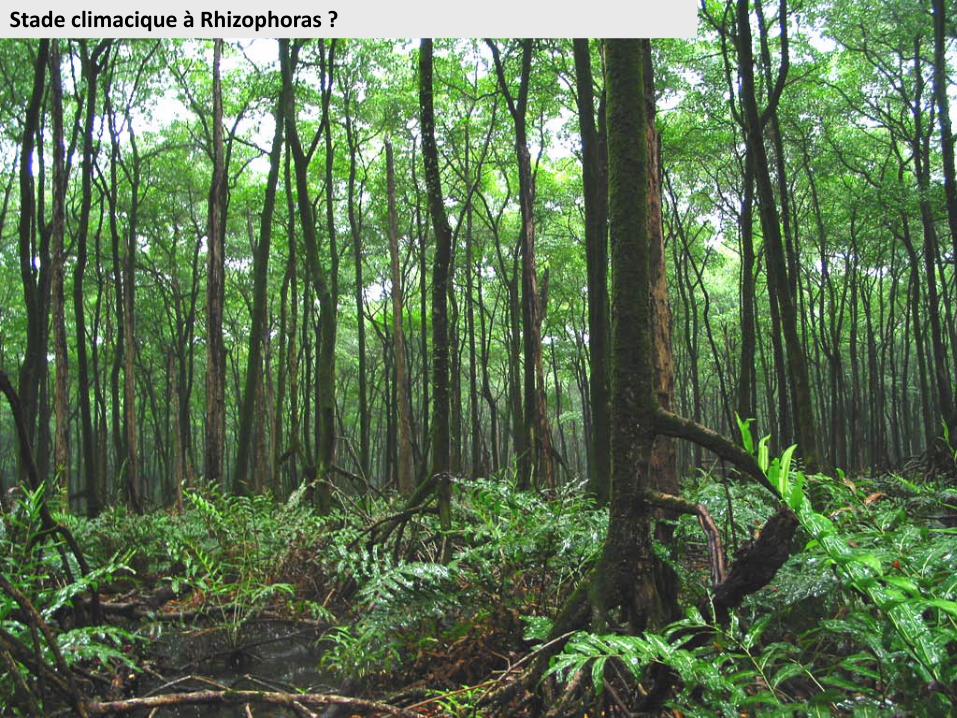
Stade climacique à Rhizophoras ?
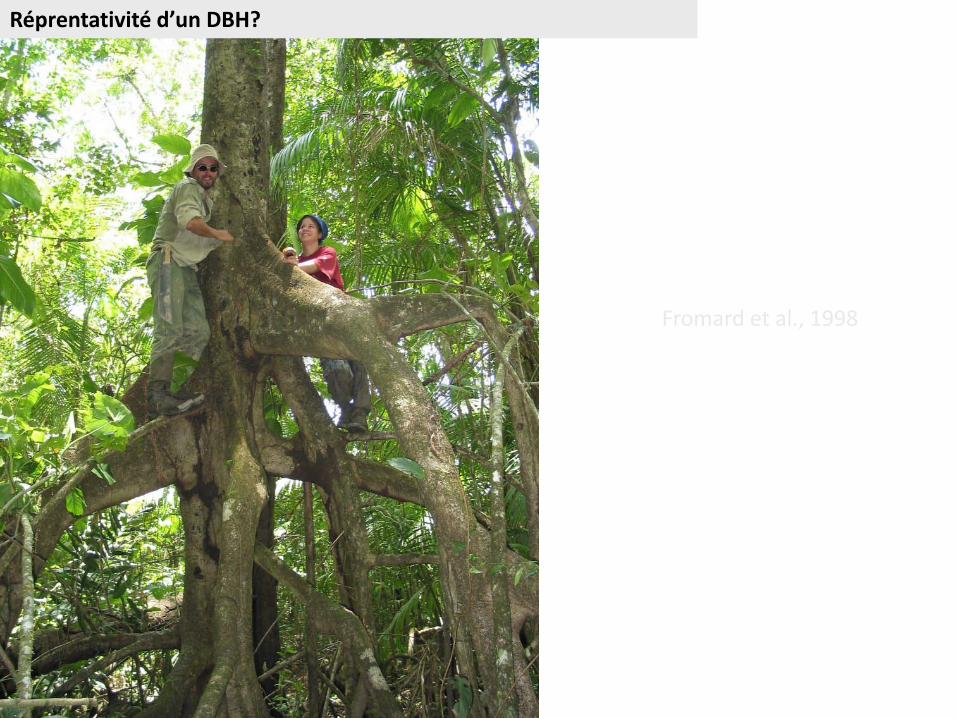
Réprentativité d’un DBH?
Fromard et al., 1998
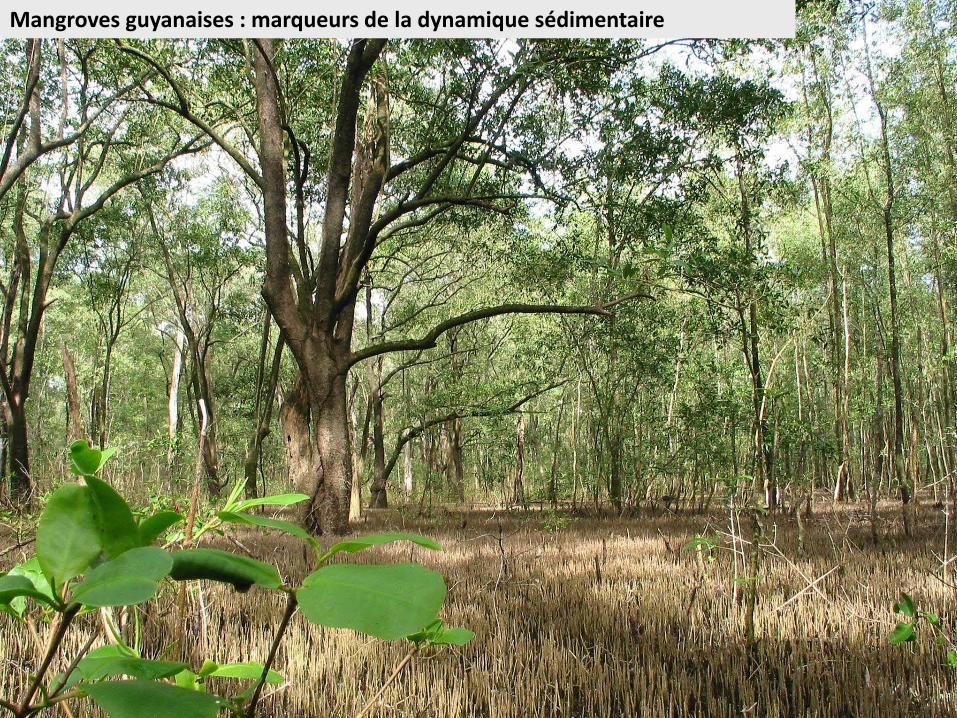
Mangroves guyanaises : marqueurs de la dynamique sédimentaire

Erosion
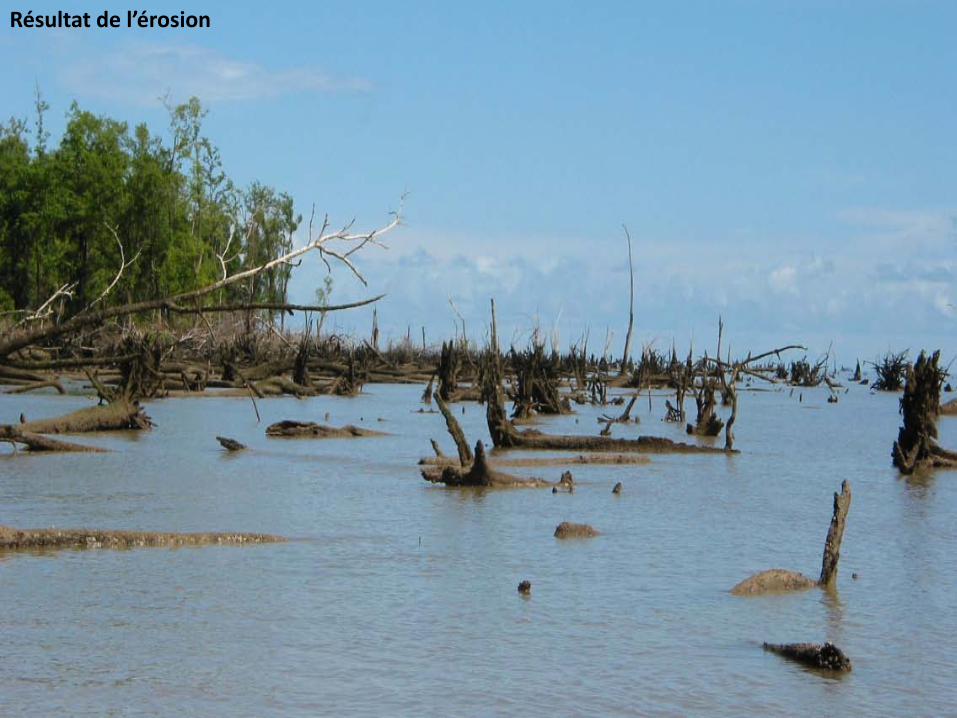
Résultat de l’érosion
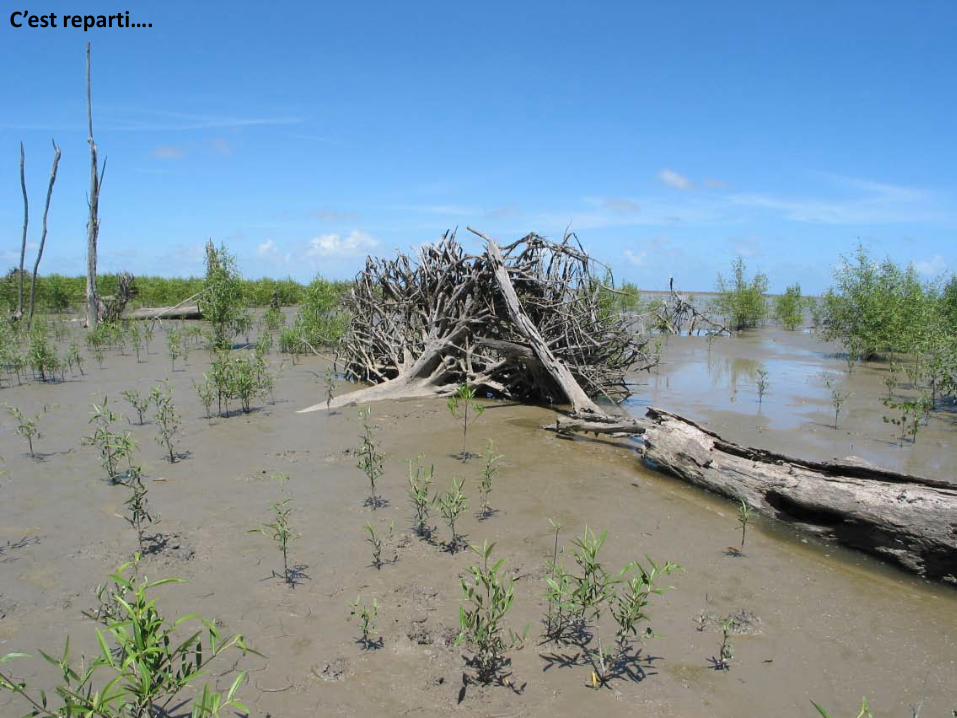
C’est reparti….
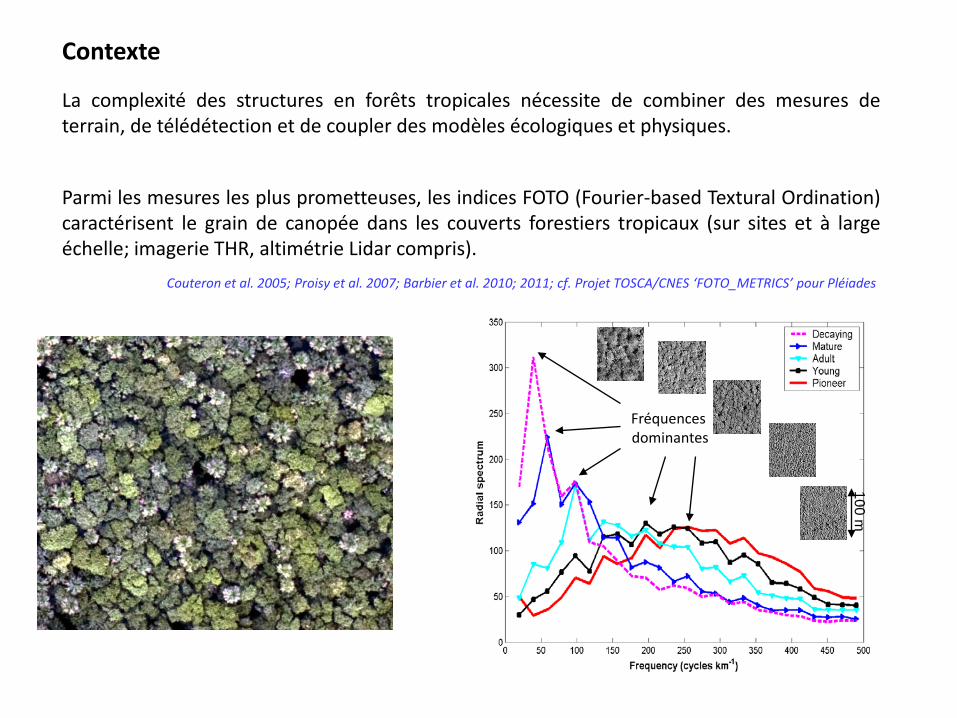
Contexte
La complexité des structures en forêts tropicales nécessite de combiner des mesures deterrain, de télédétection et de coupler des modèles écologiques et physiques.
Parmi les mesures les plus prometteuses, les indices FOTO (Fourier-based Textural Ordination)caractérisent le grain de canopée dans les couverts forestiers tropicaux (sur sites et à largeéchelle; imagerie THR, altimétrie Lidar compris).
Couteron et al. 2005; Proisy et al. 2007; Barbier et al. 2010; 2011; cf. Projet TOSCA/CNES ‘FOTO_METRICS’ pour Pléiades
100 m
Fréquences dominantes
Field derived Biomass (tDM/ha)
FOTO
-der
ived
Bio
mas
s (tD
M/h
a)
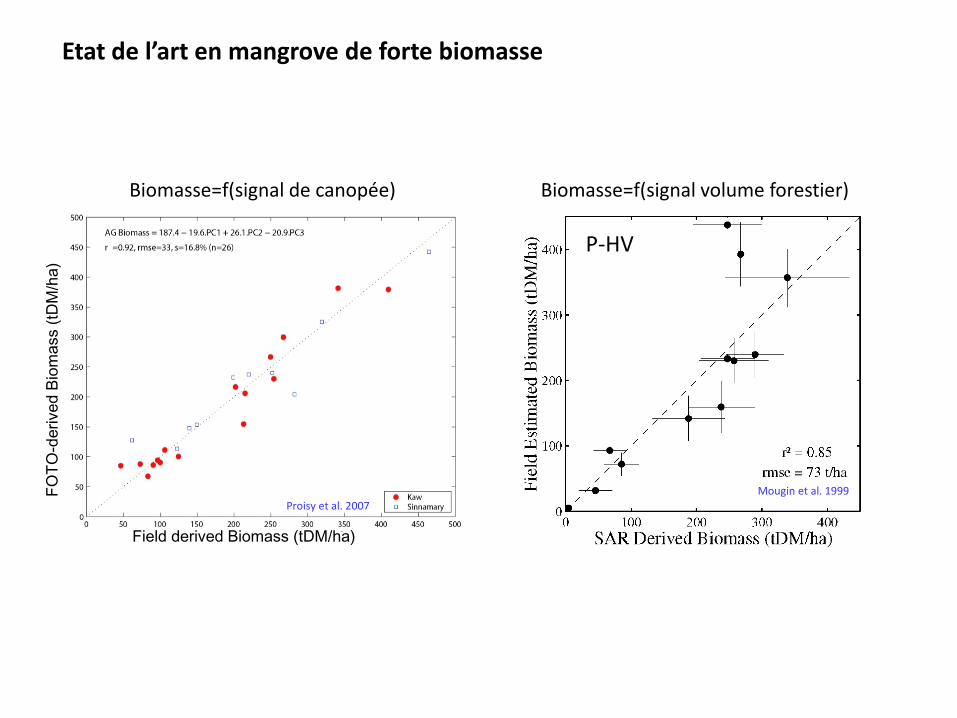
Proisy et al. 2007Mougin et al. 1999
Biomasse=f(signal de canopée) Biomasse=f(signal volume forestier)
P-HV
Etat de l’art en mangrove de forte biomasse
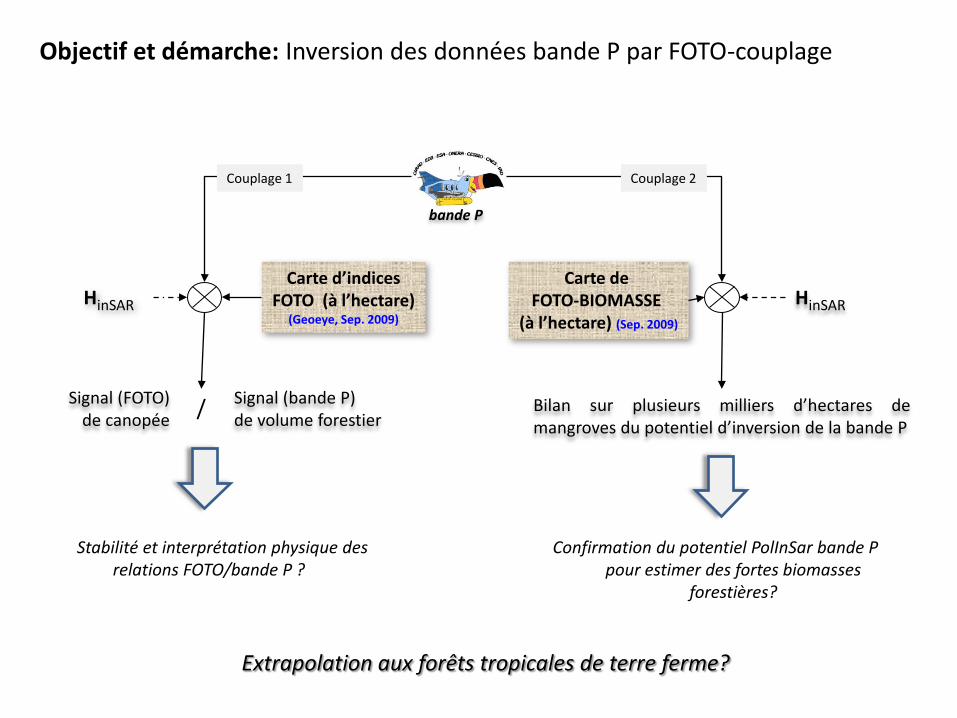
Objectif et démarche: Inversion des données bande P par FOTO-couplage
Extrapolation aux forêts tropicales de terre ferme?
bande P
Carte d’indicesFOTO (à l’hectare)
(Geoeye, Sep. 2009)
HinSAR
Signal (bande P)de volume forestier
Signal (FOTO)de canopée /
Stabilité et interprétation physique des relations FOTO/bande P ?
Couplage 1
HinSAR
Carte de FOTO-BIOMASSE
(à l’hectare) (Sep. 2009)
Bilan sur plusieurs milliers d’hectares demangroves du potentiel d’inversion de la bande P
Confirmation du potentiel PolInSar bande P pour estimer des fortes biomasses
forestières?
Couplage 2
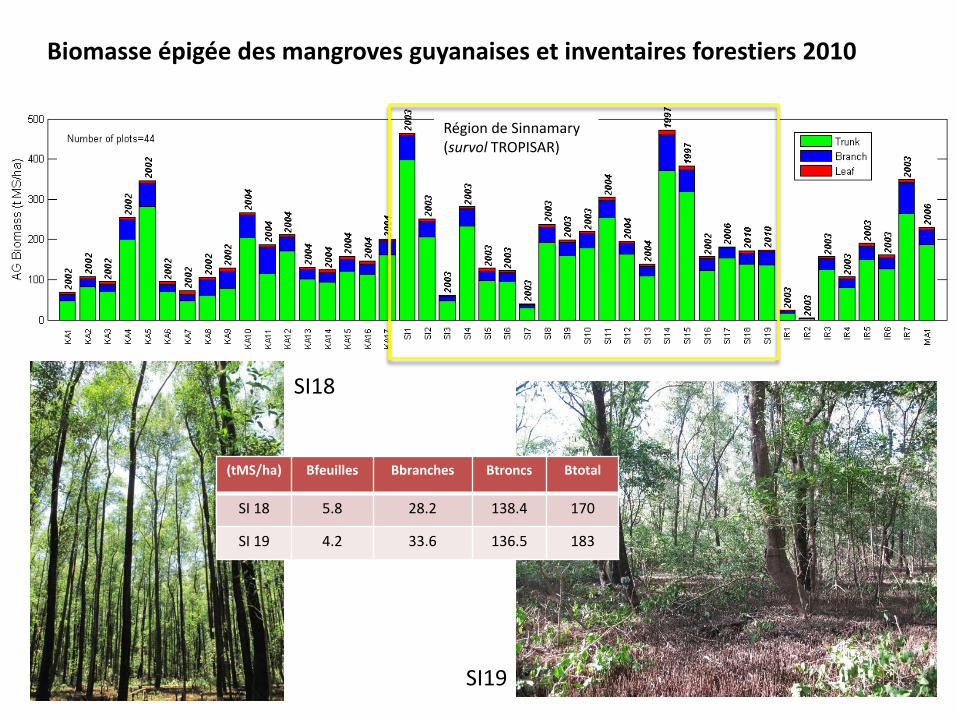
Biomasse épigée des mangroves guyanaises et inventaires forestiers 2010
Région de Sinnamary (survol TROPISAR)
SI18
SI19
(tMS/ha) Bfeuilles Bbranches Btroncs Btotal
SI 18 5.8 28.2 138.4 170
SI 19 4.2 33.6 136.5 183
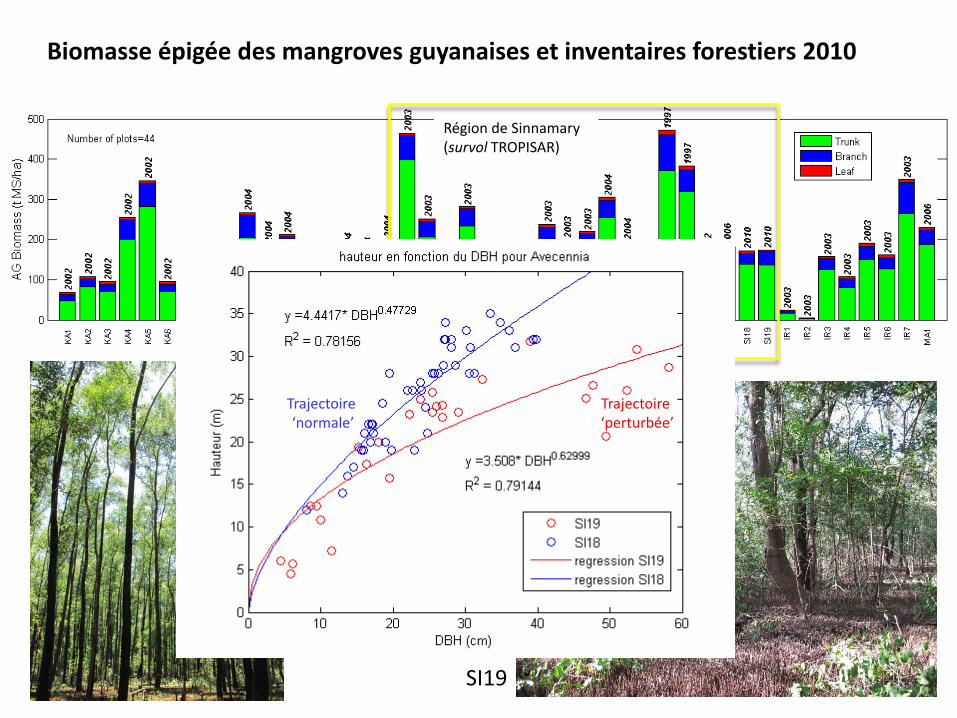
Biomasse épigée des mangroves guyanaises et inventaires forestiers 2010
Région de Sinnamary (survol TROPISAR)
SI18
SI19
(tMS/ha) Bfeuilles Bbranches Btroncs Btotal
SI 18 5.8 28.2 138.4 170
SI 19 4.2 33.6 136.5 183
Trajectoire ‘normale’
Trajectoire ‘perturbée’
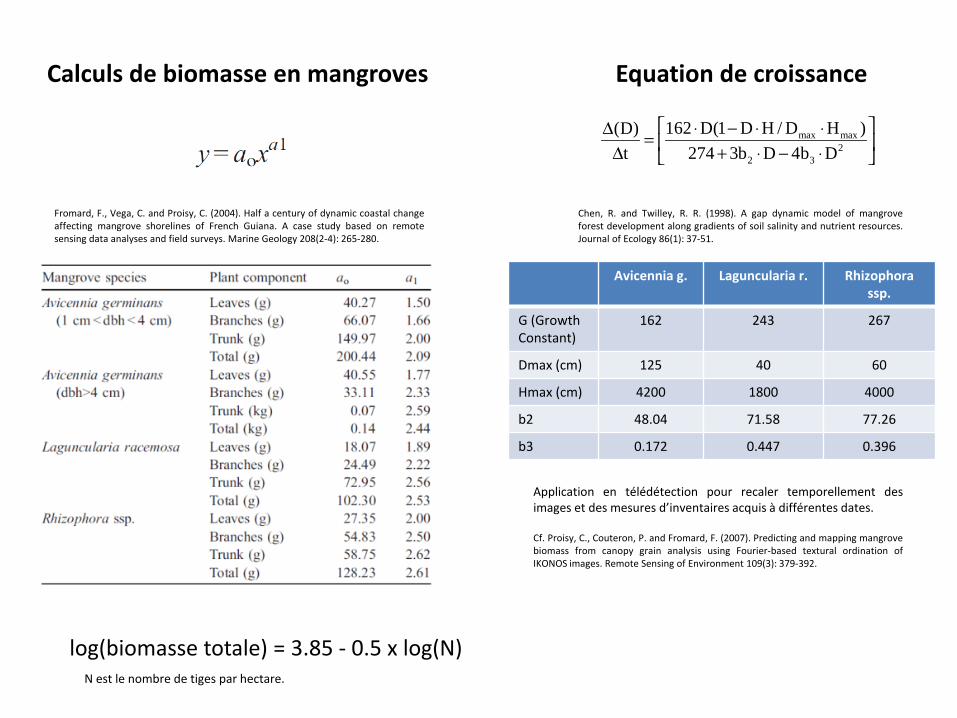
Calculs de biomasse en mangroves
Fromard, F., Vega, C. and Proisy, C. (2004). Half a century of dynamic coastal changeaffecting mangrove shorelines of French Guiana. A case study based on remotesensing data analyses and field surveys. Marine Geology 208(2-4): 265-280.
Equation de croissance
max max2
2 3
162 D(1 D H / D H )(D)t 274 3b D 4b D
⋅ − ⋅ ⋅∆ = ∆ + ⋅ − ⋅
Chen, R. and Twilley, R. R. (1998). A gap dynamic model of mangroveforest development along gradients of soil salinity and nutrient resources.Journal of Ecology 86(1): 37-51.
Avicennia g. Laguncularia r. Rhizophora ssp.
G (GrowthConstant)
162 243 267
Dmax (cm) 125 40 60
Hmax (cm) 4200 1800 4000
b2 48.04 71.58 77.26
b3 0.172 0.447 0.396
Application en télédétection pour recaler temporellement desimages et des mesures d’inventaires acquis à différentes dates.
Cf. Proisy, C., Couteron, P. and Fromard, F. (2007). Predicting and mapping mangrovebiomass from canopy grain analysis using Fourier-based textural ordination ofIKONOS images. Remote Sensing of Environment 109(3): 379-392.
log(biomasse totale) = 3.85 - 0.5 x log(N)N est le nombre de tiges par hectare.

Relations allométriques… extension aux forts diamètres, relations DBH/houppier
© projet FOTO_METRICS/CNES
Volume de tronc et branches primaires + houppier (h compris)
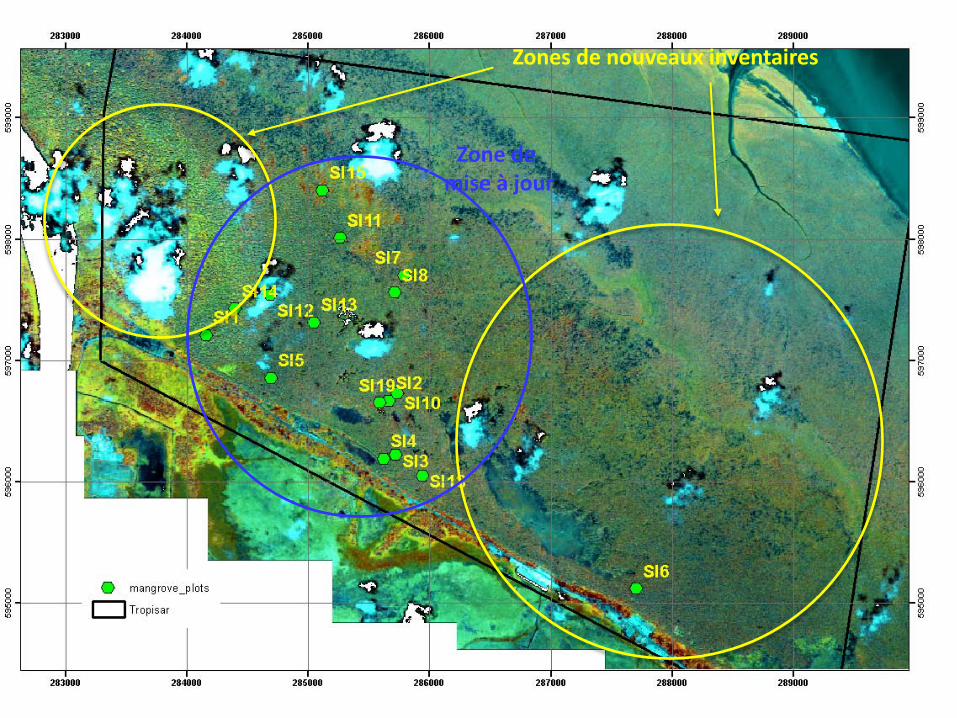
Zones de nouveaux inventaires
Zone de mise à jour
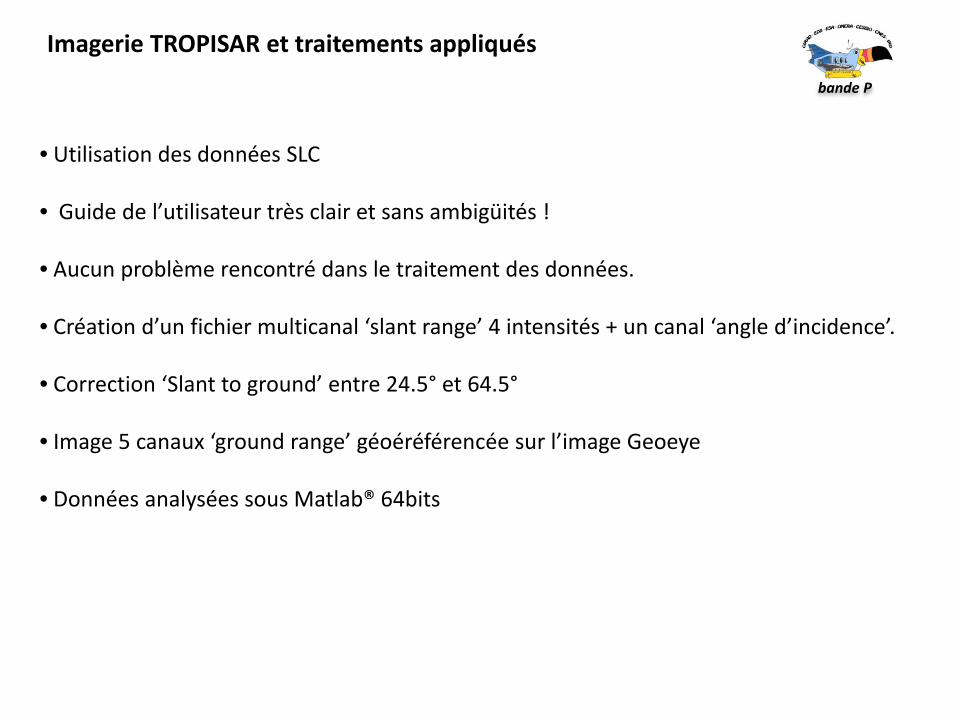
Imagerie TROPISAR et traitements appliqués
• Utilisation des données SLC
• Guide de l’utilisateur très clair et sans ambigüités !
• Aucun problème rencontré dans le traitement des données.
• Création d’un fichier multicanal ‘slant range’ 4 intensités + un canal ‘angle d’incidence’.
• Correction ‘Slant to ground’ entre 24.5° et 64.5°
• Image 5 canaux ‘ground range’ géoéréférencée sur l’image Geoeye
• Données analysées sous Matlab® 64bits
bande P
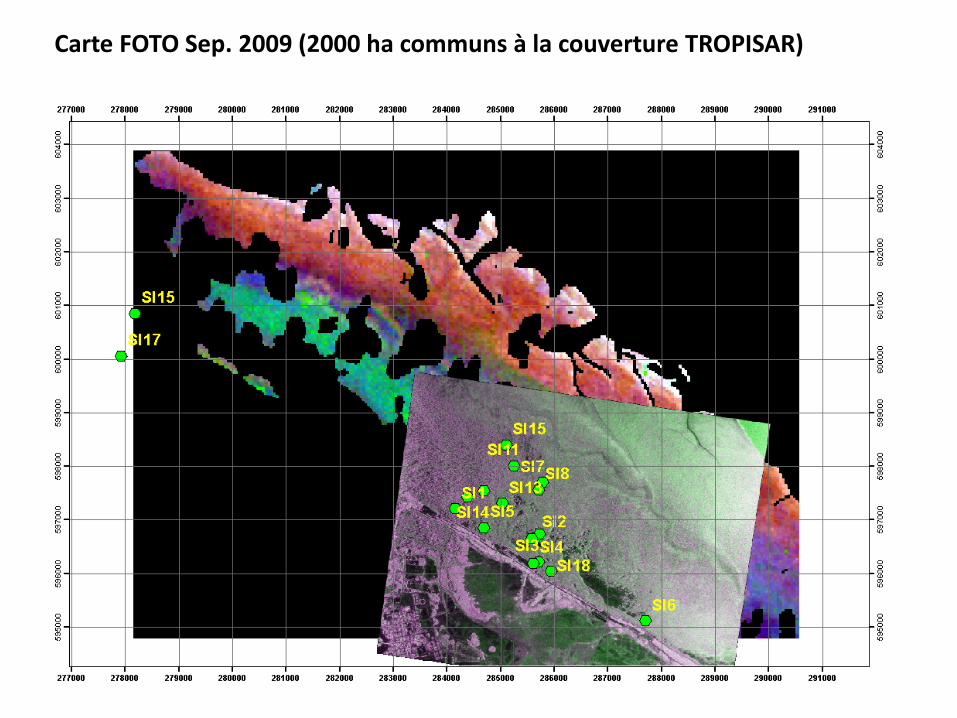
Carte FOTO Sep. 2009 (2000 ha communs à la couverture TROPISAR)
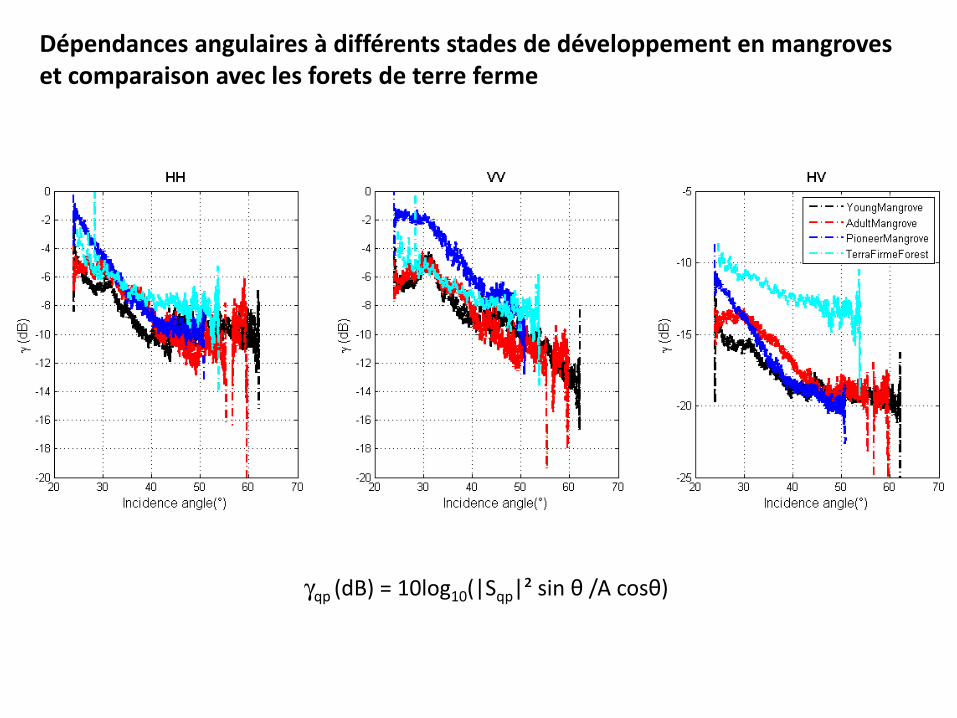
Dépendances angulaires à différents stades de développement en mangroveset comparaison avec les forets de terre ferme
γqp (dB) = 10log10(|Sqp|² sin θ /A cosθ)
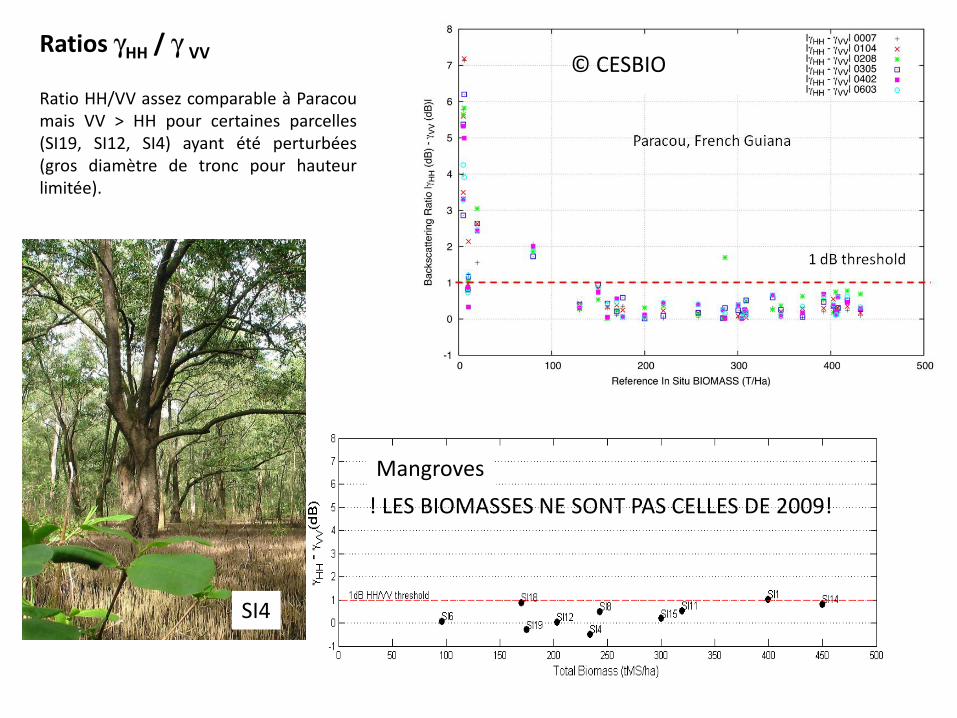
© CESBIORatios γHH / γ VV
Mangroves
! LES BIOMASSES NE SONT PAS CELLES DE 2009!
Ratio HH/VV assez comparable à Paracoumais VV > HH pour certaines parcelles(SI19, SI12, SI4) ayant été perturbées(gros diamètre de tronc pour hauteurlimitée).
SI4
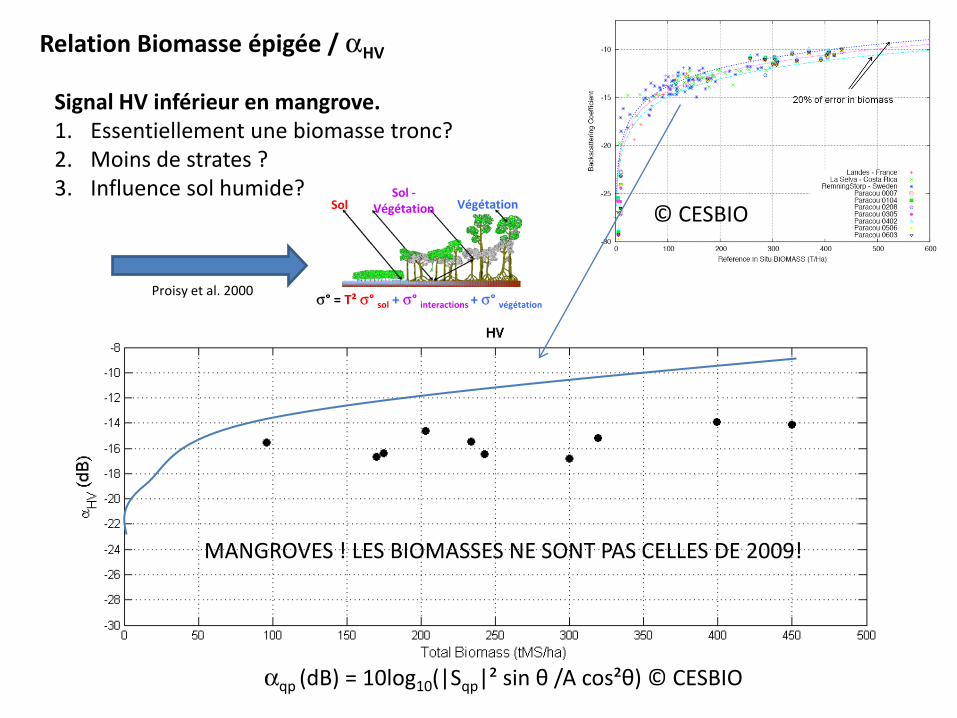
αqp (dB) = 10log10(|Sqp|² sin θ /A cos²θ) © CESBIO
MANGROVES ! LES BIOMASSES NE SONT PAS CELLES DE 2009!
Relation Biomasse épigée / αHV
© CESBIO
Signal HV inférieur en mangrove.1. Essentiellement une biomasse tronc?2. Moins de strates ?3. Influence sol humide?
SolSol -
Végétation Végétation
σ° = T² σ° sol + σ° interactions + σ° végétationProisy et al. 2000
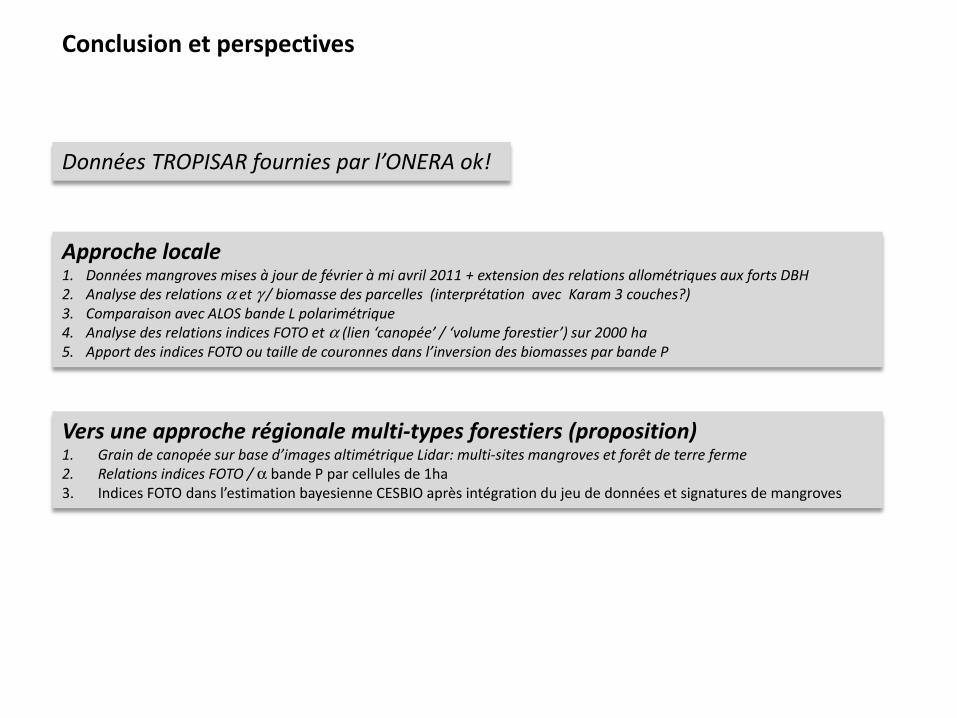
Conclusion et perspectives
Approche locale1. Données mangroves mises à jour de février à mi avril 2011 + extension des relations allométriques aux forts DBH2. Analyse des relations α et γ / biomasse des parcelles (interprétation avec Karam 3 couches?)3. Comparaison avec ALOS bande L polarimétrique4. Analyse des relations indices FOTO et α (lien ‘canopée’ / ‘volume forestier’) sur 2000 ha5. Apport des indices FOTO ou taille de couronnes dans l’inversion des biomasses par bande P
Vers une approche régionale multi-types forestiers (proposition)1. Grain de canopée sur base d’images altimétrique Lidar: multi-sites mangroves et forêt de terre ferme2. Relations indices FOTO / α bande P par cellules de 1ha3. Indices FOTO dans l’estimation bayesienne CESBIO après intégration du jeu de données et signatures de mangroves
Données TROPISAR fournies par l’ONERA ok!
Références
• Barbier, N., C. Proisy, C. Véga, D. Sabatier and P. Couteron (2011). Bidirectional texture function of high resolution optical images of tropical forest: An approach using LiDAR hillshade simulations. Remote Sensing of Environment 115(1): 167-179.
• Barbier, N., P. Couteron, C. Proisy, Y. Malhi and J.-P. Gastellu-Etchegorry (2010). The variation of apparent crown size and canopy heterogeneity across lowland Amazonian forests. Global Ecology and Biogeography 19(1): 72-84.
• Couteron, P., R. Pélissier, E. Nicolini and D. Paget (2005). Predicting tropical forest stand structure parameters from Fourier transform of very high-resolution remotely sensed canopy figures. Journal of Applied Ecology 42: 1121-1128.
• Fromard, F., Vega, C. and Proisy, C. (2004). Half a century of dynamic coastal change affecting mangrove shorelines of French Guiana. A case study based on remote sensing data analyses and field surveys. Marine Geology 208(2-4): 265-280.
• Mougin, E., C. Proisy, G. Marty, F. Fromard, H. Puig, J. L. Betoulle and J. P. Rudant (1999). Multifrequency and multipolarization radar backscattering from mangrove forests. IEEE Transactions on Geoscience and Remote Sensing 37(1): 94-102.
• Proisy, C., E. Mougin, F. Fromard and M. A. Karam (2000). Interpretation of polarimetric radar signatures of mangrove forests. Remote Sensing of Environment 71(1): 56-66.
• Proisy, C., E. Mougin, F. Fromard, V. Trichon and M. A. Karam (2002). On the influence of canopy structure on the polarimetricradar response from mangrove forest. International Journal of Remote Sensing 23(20): 4197-4210.
• Proisy, C., P. Couteron and F. Fromard (2007). Predicting and mapping mangrove biomass from canopy grain analysis using Fourier-based textural ordination of IKONOS images. Remote Sensing of Environment 109(3): 379-392.
• Proisy, C., Gratiot, N., Anthony, E. J., Gardel, A., Fromard, F. and Heuret, P. (2009). Mud bank colonization by opportunisticmangroves: A case study from French Guiana using lidar data. Continental Shelf ResearchOn the dynamics of mud deposits in coastal areas 29(3): 632-641.