Embed Size (px)
Citation preview
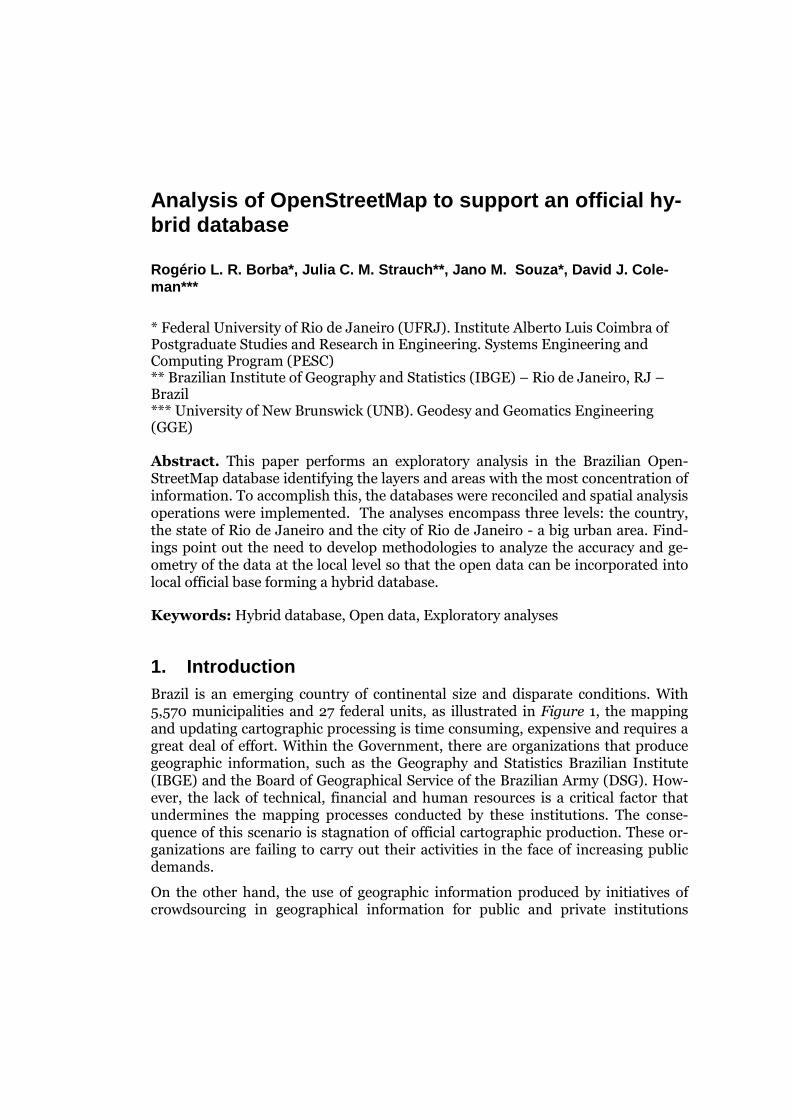
Analysis of OpenStreetMap to support an official hy -brid database
Rogério L. R. Borba*, Julia C. M. Strauch**, Jano M . Souza*, David J. Cole-man***
* Federal University of Rio de Janeiro (UFRJ). Institute Alberto Luis Coimbra of Postgraduate Studies and Research in Engineering. Systems Engineering and Computing Program (PESC) ** Brazilian Institute of Geography and Statistics (IBGE) – Rio de Janeiro, RJ – Brazil *** University of New Brunswick (UNB). Geodesy and Geomatics Engineering (GGE) Abstract. This paper performs an exploratory analysis in the Brazilian Open-StreetMap database identifying the layers and areas with the most concentration of information. To accomplish this, the databases were reconciled and spatial analysis operations were implemented. The analyses encompass three levels: the country, the state of Rio de Janeiro and the city of Rio de Janeiro - a big urban area. Find-ings point out the need to develop methodologies to analyze the accuracy and ge-ometry of the data at the local level so that the open data can be incorporated into local official base forming a hybrid database.
Keywords: Hybrid database, Open data, Exploratory analyses
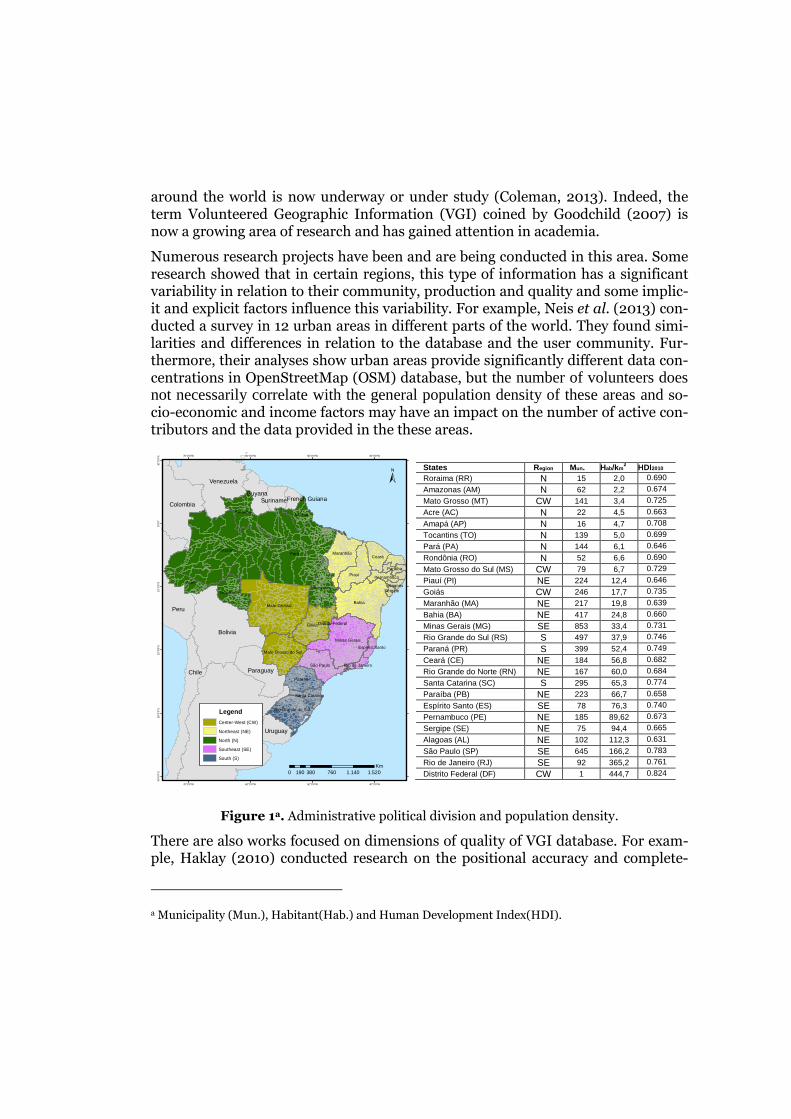
1. Introduction Brazil is an emerging country of continental size and disparate conditions. With 5,570 municipalities and 27 federal units, as illustrated in Figure 1, the mapping and updating cartographic processing is time consuming, expensive and requires a great deal of effort. Within the Government, there are organizations that produce geographic information, such as the Geography and Statistics Brazilian Institute (IBGE) and the Board of Geographical Service of the Brazilian Army (DSG). How-ever, the lack of technical, financial and human resources is a critical factor that undermines the mapping processes conducted by these institutions. The conse-quence of this scenario is stagnation of official cartographic production. These or-ganizations are failing to carry out their activities in the face of increasing public demands.
On the other hand, the use of geographic information produced by initiatives of crowdsourcing in geographical information for public and private institutions
around the world is now underway or under study (Coleman, 2013). Indeed, the term Volunteered Geographic Information (VGI) coined by Goodchild (2007) is now a growing area of research and has gained attention in academia.
Numerous research projects have been and are being conducted in this area. Some research showed that in certain regions, this type of information has a significant variability in relation to their community, production and quality and some implic-it and explicit factors influence this variability. For example, Neis et al. (2013) con-ducted a survey in 12 urban areas in different parts of the world. They found simi-larities and differences in relation to the database and the user community. Fur-thermore, their analyses show urban areas provide significantly different data con-centrations in OpenStreetMap (OSM) database, but the number of volunteers does not necessarily correlate with the general population density of these areas and so-cio-economic and income factors may have an impact on the number of active con-tributors and the data provided in the these areas.
States Region Mun. Hab/km
2 HDI2010 Roraima (RR) N 15 2,0 0.690
Amazonas (AM) N 62 2,2 0.674
Mato Grosso (MT) CW 141 3,4 0.725
Acre (AC) N 22 4,5 0.663
Amapá (AP) N 16 4,7 0.708
Tocantins (TO) N 139 5,0 0.699
Pará (PA) N 144 6,1 0.646
Rondônia (RO) N 52 6,6 0.690
Mato Grosso do Sul (MS) CW 79 6,7 0.729
Piauí (PI) NE 224 12,4 0.646
Goiás CW 246 17,7 0.735
Maranhão (MA) NE 217 19,8 0.639
Bahia (BA) NE 417 24,8 0.660
Minas Gerais (MG) SE 853 33,4 0.731
Rio Grande do Sul (RS) S 497 37,9 0.746
Paraná (PR) S 399 52,4 0.749
Ceará (CE) NE 184 56,8 0.682
Rio Grande do Norte (RN) NE 167 60,0 0.684
Santa Catarina (SC) S 295 65,3 0.774
Paraíba (PB) NE 223 66,7 0.658
Espírito Santo (ES) SE 78 76,3 0.740
Pernambuco (PE) NE 185 89,62 0.673
Sergipe (SE) NE 75 94,4 0.665
Alagoas (AL) NE 102 112,3 0.631
São Paulo (SP) SE 645 166,2 0.783
Rio de Janeiro (RJ) SE 92 365,2 0.761
Distrito Federal (DF) CW 1 444,7 0.824
Figure 1a. Administrative political division and population density.
There are also works focused on dimensions of quality of VGI database. For exam-ple, Haklay (2010) conducted research on the positional accuracy and complete-
a Municipality (Mun.), Habitant(Hab.) and Human Development Index(HDI).
Argentina
Bolivia
Peru
Chile
Venezuela
Colombia
Paraguay
Uruguay
GuyanaSurinameFrench Guiana
ParáAmazonas
BahiaMato Grosso
Goiás
Piauí
Minas Gerais
Acre
Maranhão
Paraná
Tocantins
Roraima
São Paulo
Rôndonia
Ceará
Amapá
Mato Grosso do Sul
Rio Grande do Sul
Pernambuco
Paraíba
Santa Catarina
Alagoas
Espírito Santo
Rio de Janeiro
Sergipe
Distrito Federal
40°0'0"W
40°0'0"W
50°0'0"W
50°0'0"W
60°0'0"W
60°0'0"W
70°0'0"W
70°0'0"W
10°0
'0"N
0°0'
0"
10°0
'0"S
20°0
'0"S
30°0
'0"S
40°0
'0"S
±
0 380 760 1.140 1.520190Km
Legend
Center-West (CW)
Northeast (NE)
North (N)
Southeast (SE)
South (S)
ness of the roads in OSM, and compared with the official database of England. He concluded that OSM data offer reasonable accuracy and did some considerations and suggestions for future developments and research directions. Girres and Touya (2010) investigated the dimensions of the quality of the Open Street Map database in France and suggested mechanisms of automatic quality assurance in the process of match open data for mapping. Cooper and Coetzee (2012) evaluated two volun-teered databases in South Africa and analyzed the dimensions of information quality of these bases. They highlighted that differences between developed and developing countries should be take into account when considering volunteered contributions. Goodchild and Li (2012) stated that VGI suffers from a general lack of quality assurance. They discussed issues involved in determining the quality of volunteered geospatial data and described three approaches to support quality as-surance.
Some researchers investigated the use of volunteered database into official or commercial databases. For example, GeoConnections (2012) and Saunders et al. (2012) summarize early technical advice and raise important legal and data licens-ing considerations in this regard for organizations considering such integration. Coleman (2013) raises some questions regarding VGI and suggests that, while this mapping initiative is not a solution to all kinds of problems of creating and updat-ing official or commercial geographic database, it is an important resource that should be taken into consideration. Haklay et al. (2013) and Lauriault et al. (2014) provide recent examples of research into the acceptance of VGI into public sector programs.
In Brazil, institutions such as IBGE produce geospatial information for different types of products and applications. Thus require different quality levels in terms of, for example, positional accuracy and completeness. Therefore, the use of a hybrid database derived from open and official databases depends on a variety of factors such as the purpose and context in which this hybrid base is used.
Some OSM layers are already being used as one of the options in a visualization tool of NSDI in Brazil. However, program managers in Brazil still lack a study re-garding the integration and/or use of the OSM database with official databases. In this sense, this work examines how, in a Brazilian context, this open database could be incorporated into official databases, thus creating a hybrid database taking into account selection criteria and quality-based filters. In this way, a study about OSM Brazilian database could be answering the following questions:
(1) In which regions do these open solutions provide more information? Which regions offer less information? What is the relationship with the user com-munity?
(2) What is the quality of that open database? Is it possible to generate a hybrid base from a combination of bases to official?
(3) What requirements must be fulfilled in order to accept the whole or only part of this database? Or discard it?
(4) Following the directives of open government and open data, what could be done to create a symbiotic relationship between open and official mapping?
The first question will be answered by this paper, seeking the region where there are greatest concentrations of OSM Brazilian data through an exploratory analysis. First, the OpenStreetMap data model is revisited in Section 2. Section 3 describes an analysis of OSM data and Section 4 contains the summary and concluding re-marks.
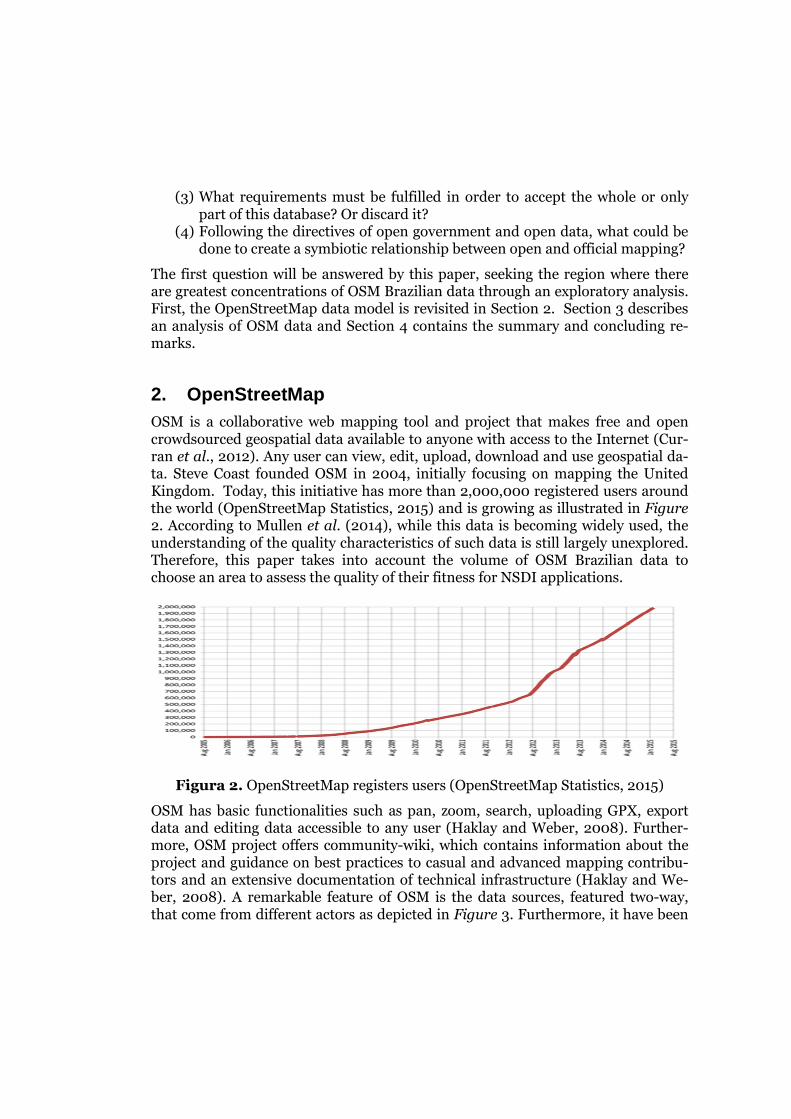
2. OpenStreetMap OSM is a collaborative web mapping tool and project that makes free and open crowdsourced geospatial data available to anyone with access to the Internet (Cur-ran et al., 2012). Any user can view, edit, upload, download and use geospatial da-ta. Steve Coast founded OSM in 2004, initially focusing on mapping the United Kingdom. Today, this initiative has more than 2,000,000 registered users around the world (OpenStreetMap Statistics, 2015) and is growing as illustrated in Figure 2. According to Mullen et al. (2014), while this data is becoming widely used, the understanding of the quality characteristics of such data is still largely unexplored. Therefore, this paper takes into account the volume of OSM Brazilian data to choose an area to assess the quality of their fitness for NSDI applications.
Figura 2. OpenStreetMap registers users (OpenStreetMap Statistics, 2015)
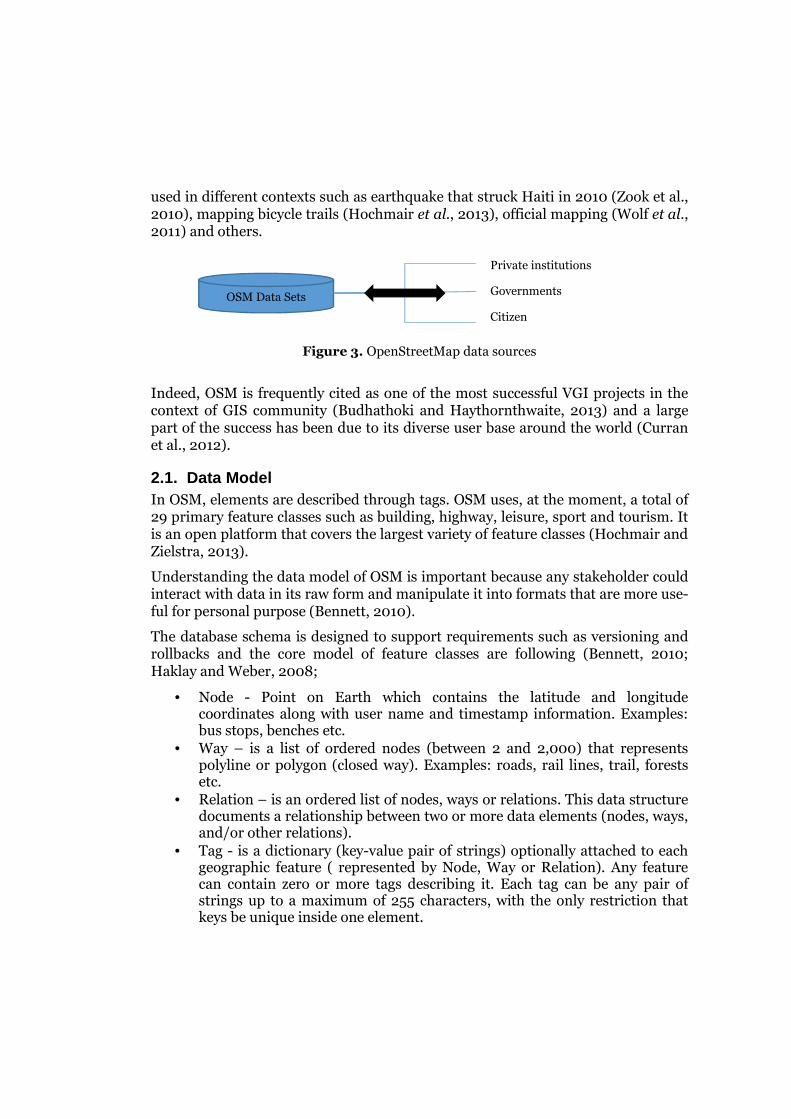
OSM has basic functionalities such as pan, zoom, search, uploading GPX, export data and editing data accessible to any user (Haklay and Weber, 2008). Further-more, OSM project offers community-wiki, which contains information about the project and guidance on best practices to casual and advanced mapping contribu-tors and an extensive documentation of technical infrastructure (Haklay and We-ber, 2008). A remarkable feature of OSM is the data sources, featured two-way, that come from different actors as depicted in Figure 3. Furthermore, it have been
used in different contexts such as earthquake that struck Haiti in 2010 (Zook et al., 2010), mapping bicycle trails (Hochmair et al., 2013), official mapping (Wolf et al., 2011) and others.
Figure 3. OpenStreetMap data sources
Indeed, OSM is frequently cited as one of the most successful VGI projects in the context of GIS community (Budhathoki and Haythornthwaite, 2013) and a large part of the success has been due to its diverse user base around the world (Curran et al., 2012).
2.1. Data Model In OSM, elements are described through tags. OSM uses, at the moment, a total of 29 primary feature classes such as building, highway, leisure, sport and tourism. It is an open platform that covers the largest variety of feature classes (Hochmair and Zielstra, 2013).
Understanding the data model of OSM is important because any stakeholder could interact with data in its raw form and manipulate it into formats that are more use-ful for personal purpose (Bennett, 2010).
The database schema is designed to support requirements such as versioning and rollbacks and the core model of feature classes are following (Bennett, 2010; Haklay and Weber, 2008;
• Node - Point on Earth which contains the latitude and longitude coordinates along with user name and timestamp information. Examples: bus stops, benches etc.
• Way – is a list of ordered nodes (between 2 and 2,000) that represents polyline or polygon (closed way). Examples: roads, rail lines, trail, forests etc.
• Relation – is an ordered list of nodes, ways or relations. This data structure documents a relationship between two or more data elements (nodes, ways, and/or other relations).
• Tag - is a dictionary (key-value pair of strings) optionally attached to each geographic feature ( represented by Node, Way or Relation). Any feature can contain zero or more tags describing it. Each tag can be any pair of strings up to a maximum of 255 characters, with the only restriction that keys be unique inside one element.
OSM Data Sets
Private institutions
Governments
Citizen
It is noteworthy that a "polygon" is not explicitly defined in the database schema. Polygon is defined implicitly by restriction (the first node of a way is the same as the last one) and explicit tagging conventions (using the tag area=yes) (Haklay and Weber, 2008).
2.1.1. Others Characteristics OSM data files are usually distributed in an XML format representing the three types concepts (node, way, and relation) using a simple schema, usually in compressed format as gizp and bz2 (Bennett, 2010). Other formats are PBF, O5m and JSON. The Horizontal Datum used by Open Street Map is WGS-84 (“OpenStreetMap Wiki-WGS84,” n.d.) and the coordinate system is latitude and longitude geographic.
OSM uses two types of licenses: Open Data Commons Open Database License and Commons Attribution-ShareAlike 2.0 license (“OpenStreetMap copyright and license,” n.d.). Anyone is free to copy, distribute, transmit and adapt the OSM data.
In Brazil, data from Public Institutions, even though open, have a distinct type of license and this issue needs to be addressed to create a hybrid database.
3. OpenStreetMap Brazilian database To accomplish the exploratory analysis, relevant OSM data were acquired on Janu-ary 30th, 2015 from the site http://download.geofabrik.de/south-america/brazil-latest.osm.pbf.
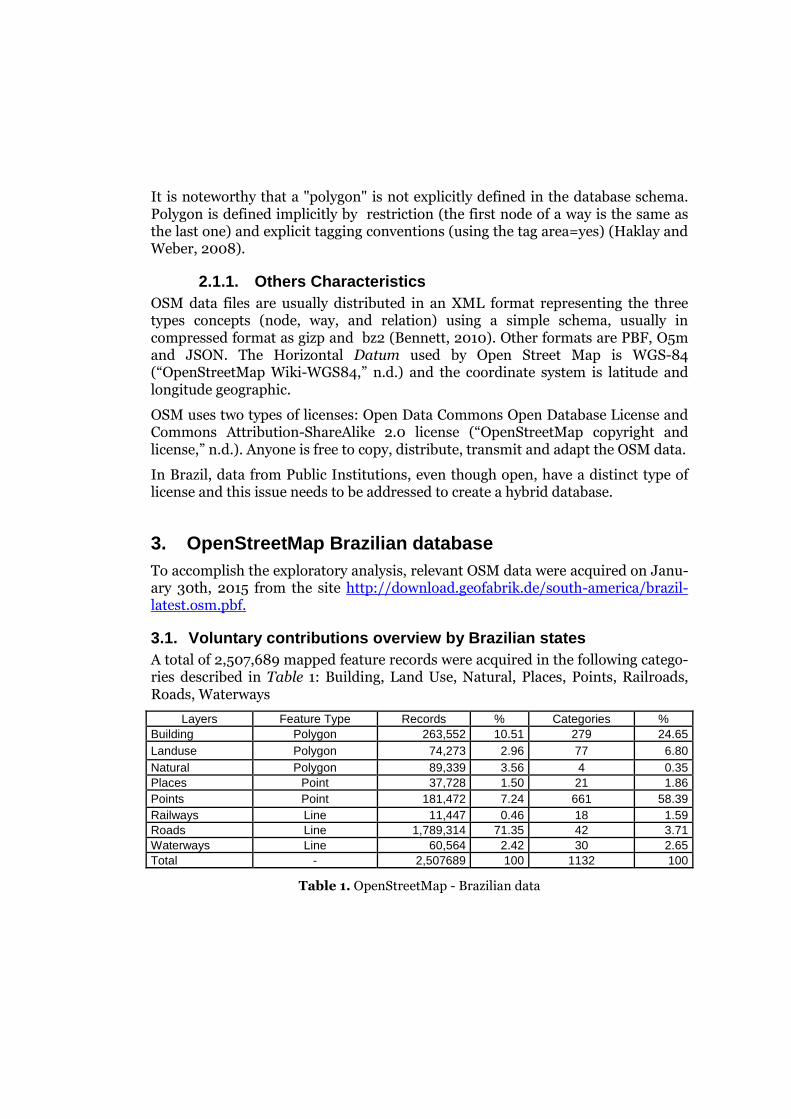
3.1. Voluntary contributions overview by Brazilian states A total of 2,507,689 mapped feature records were acquired in the following catego-ries described in Table 1: Building, Land Use, Natural, Places, Points, Railroads, Roads, Waterways
Layers Feature Type Records % Categories % Building Polygon 263,552 10.51 279 24.65 Landuse Polygon 74,273 2.96 77 6.80 Natural Polygon 89,339 3.56 4 0.35 Places Point 37,728 1.50 21 1.86 Points Point 181,472 7.24 661 58.39 Railways Line 11,447 0.46 18 1.59 Roads Line 1,789,314 71.35 42 3.71 Waterways Line 60,564 2.42 30 2.65 Total - 2,507689 100 1132 100
Table 1. OpenStreetMap - Brazilian data
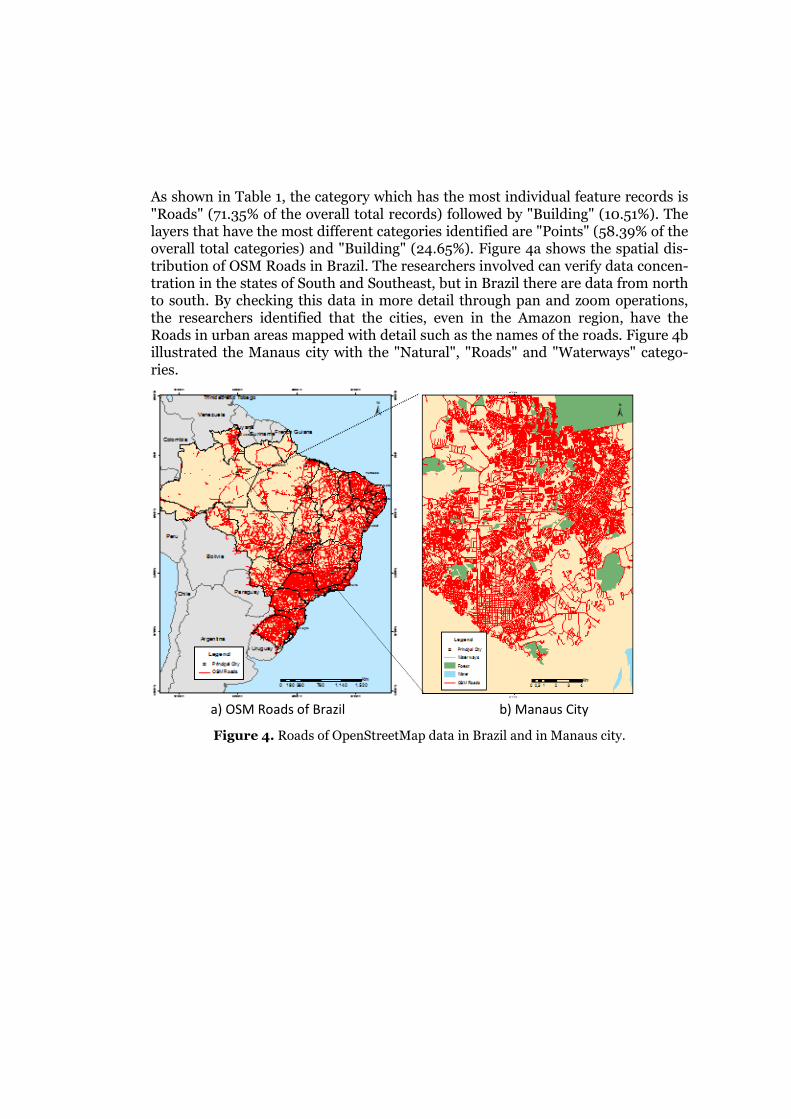
As shown in Table 1, the category which has the most individual feature records is "Roads" (71.35% of the overall total records) followed by "Building" (10.51%). The layers that have the most different categories identified are "Points" (58.39% of the overall total categories) and "Building" (24.65%). Figure 4a shows the spatial dis-tribution of OSM Roads in Brazil. The researchers involved can verify data concen-tration in the states of South and Southeast, but in Brazil there are data from north to south. By checking this data in more detail through pan and zoom operations, the researchers identified that the cities, even in the Amazon region, have the Roads in urban areas mapped with detail such as the names of the roads. Figure 4b illustrated the Manaus city with the "Natural", "Roads" and "Waterways" catego-ries.
a) OSM Roads of Brazil
b) Manaus City
Figure 4. Roads of OpenStreetMap data in Brazil and in Manaus city.
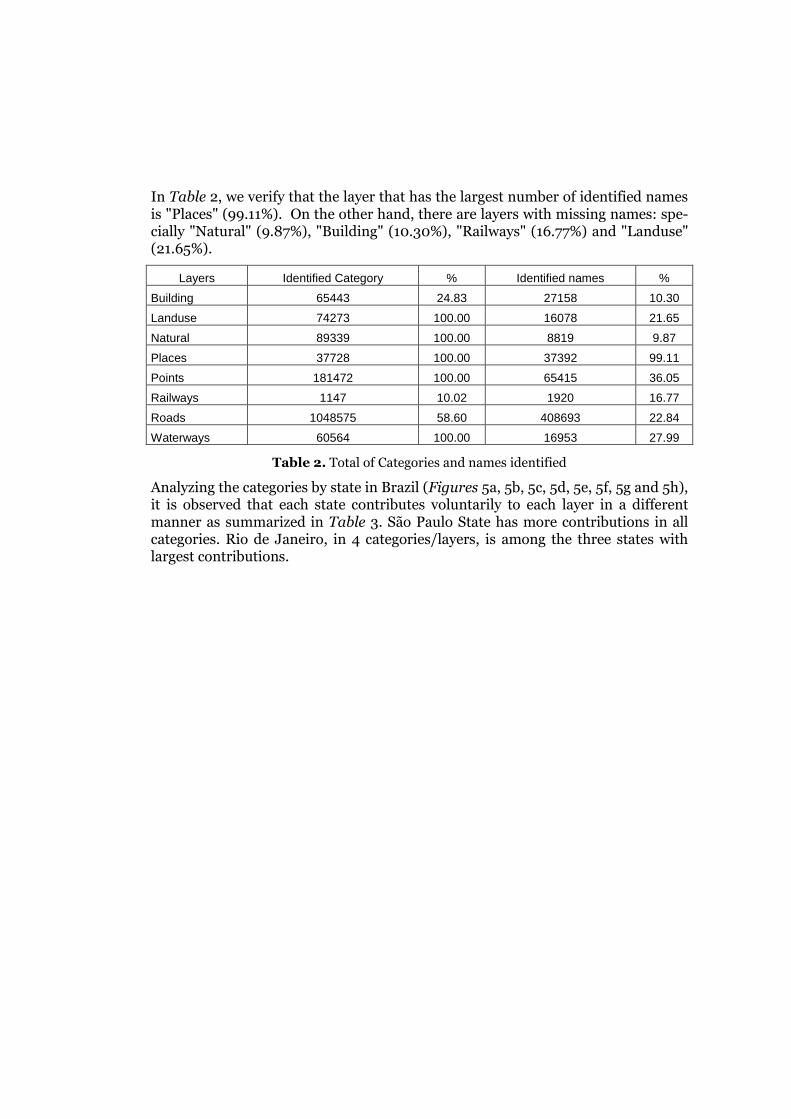
In Table 2, we verify that the layer that has the largest number of identified names is "Places" (99.11%). On the other hand, there are layers with missing names: spe-cially "Natural" (9.87%), "Building" (10.30%), "Railways" (16.77%) and "Landuse" (21.65%).
Layers Identified Category % Identified names %
Building 65443 24.83 27158 10.30
Landuse 74273 100.00 16078 21.65
Natural 89339 100.00 8819 9.87
Places 37728 100.00 37392 99.11
Points 181472 100.00 65415 36.05
Railways 1147 10.02 1920 16.77
Roads 1048575 58.60 408693 22.84
Waterways 60564 100.00 16953 27.99
Table 2. Total of Categories and names identified
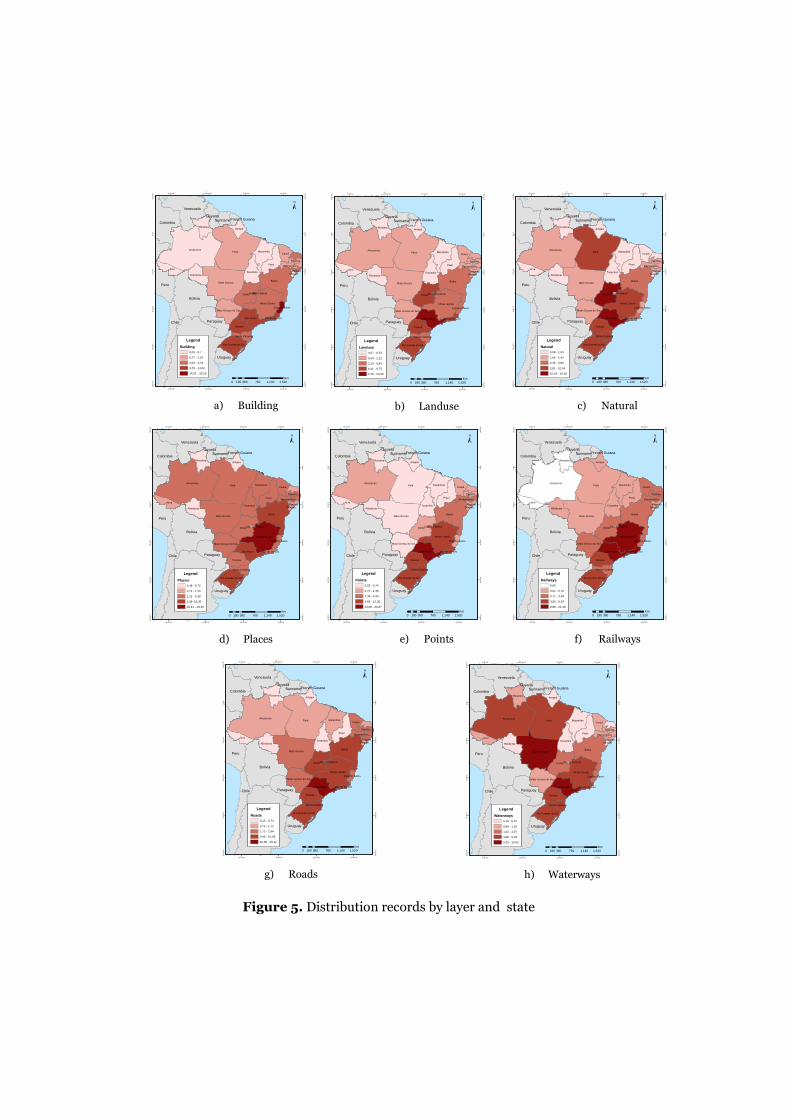
Analyzing the categories by state in Brazil (Figures 5a, 5b, 5c, 5d, 5e, 5f, 5g and 5h), it is observed that each state contributes voluntarily to each layer in a different manner as summarized in Table 3. São Paulo State has more contributions in all categories. Rio de Janeiro, in 4 categories/layers, is among the three states with largest contributions.
a) Building b) Landuse c) Natural
d) Places e) Points f) Railways
g) Roads h) Waterways
Figure 5. Distribution records by layer and state
Argentina
Bolivia
Peru
Chile
Venezuela
Colombia
Paraguay
Uruguay
GuyanaSurinameFrench Guiana
ParáAmazonas
BahiaMato Grosso
Goiás
Piauí
Minas Gerais
Acre
Maranhão
Paraná
Tocantins
Roraima
São Paulo
Rôndonia
Ceará
Amapá
Mato Grosso do Sul
Rio Grande do Sul
Pernambuco
Paraíba
Santa Catarina
Alagoas
Espírito Santo
Rio de Janeiro
Sergipe
Distrito Federal
40°0'0"W
40°0'0"W
50°0'0"W
50°0'0"W
60°0'0"W
60°0'0"W
70°0'0"W
70°0'0"W
10°0
'0"N
10°0
'0"N
0°0'
0"
0°0'
0"
10°
0'0
"S
10°
0'0
"S
20°0
'0"S
20°0
'0"S
30°0
'0"S
30°0
'0"S
40°0
'0"S
40°0
'0"S
±
0 380 760 1.140 1.520190Km
Legend
Landuse0,07 - 0,53
0,54 - 2,12
2,13 - 6,40
6,41 - 9,75
9,76 - 24,00
Argentina
Bolivia
Peru
Chile
Venezuela
Colombia
Paraguay
Uruguay
GuyanaSurinameFrench Guiana
ParáAmazonas
BahiaMato Grosso
Goiás
Piauí
Minas Gerais
Acre
Maranhão
Paraná
Tocantins
Roraima
São Paulo
Rôndonia
Ceará
Amapá
Mato Grosso do Sul
Rio Grande do Sul
Pernambuco
Paraíba
Santa Catarina
Alagoas
Espírito Santo
Rio de Janeiro
Sergipe
Distrito Federal
40°0'0"W
40°0'0"W
50°0'0"W
50°0'0"W
60°0'0"W
60°0'0"W
70°0'0"W
70°0'0"W
10°0
'0"N
10°0
'0"N
0°0
'0"
0°0
'0"
10°0
'0"S
10°0
'0"S
20°0
'0"S
20°0
'0"S
30°0
'0"S
30°0
'0"S
40°0
'0"S
40°0
'0"S
±
0 380 760 1.140 1.520190Km
Legend
Natural0,08 - 1,05
1,06 - 2,42
2,43 - 3,80
3,81 - 10,54
10,54 - 19,18
Argentina
Bolivia
Peru
Chile
Venezuela
Colombia
Paraguay
Uruguay
GuyanaSurinameFrench Guiana
ParáAmazonas
BahiaMato Grosso
Goiás
Piauí
Minas Gerais
Acre
Maranhão
Paraná
Tocantins
Roraima
São Paulo
Rôndonia
Ceará
Amapá
Mato Grosso do Sul
Rio Grande do Sul
Pernambuco
Paraíba
Santa Catarina
Alagoas
Espírito Santo
Rio de Janeiro
Sergipe
Distrito Federal
40°0'0"W
40°0'0"W
50°0'0"W
50°0'0"W
60°0'0"W
60°0'0"W
70°0'0"W
70°0'0"W
10°0
'0"N
10°0
'0"N
0°0'
0"
0°0'
0"
10°
0'0
"S
10°
0'0
"S
20°0
'0"S
20°0
'0"S
30°0
'0"S
30°0
'0"S
40°0
'0"S
40°0
'0"S
±
0 380 760 1.140 1.520190Km
Legend
Places0,48 - 0,72
0,73 - 1,20
1,21 - 4,38
4,39- 10,20
10,21 - 18,40
Argentina
Bolivia
Peru
Chile
Venezuela
Colombia
Paraguay
Uruguay
GuyanaSurinameFrench Guiana
ParáAmazonas
BahiaMato Grosso
Goiás
Piauí
Minas Gerais
Acre
Maranhão
Paraná
Tocantins
Roraima
São Paulo
Rôndonia
Ceará
Amapá
Mato Grosso do Sul
Rio Grande do Sul
Pernambuco
Paraíba
Santa Catarina
Alagoas
Espírito Santo
Rio de Janeiro
Sergipe
Distrito Federal
40°0'0"W
40°0'0"W
50°0'0"W
50°0'0"W
60°0'0"W
60°0'0"W
70°0'0"W
70°0'0"W
10°0
'0"N
10°0
'0"N
0°0
'0"
0°0
'0"
10°0
'0"S
10°0
'0"S
20°0
'0"S
20°0
'0"S
30°0
'0"S
30°0
'0"S
40°0
'0"S
40°0
'0"S
±
0 380 760 1.140 1.520190Km
Legend
Points0,02 - 0,74
0,75 - 2,38
2,39 - 4,64
4,65 - 12,06
12,06 - 26,87
Argentina
Bolivia
Peru
Chile
Venezuela
Colombia
Paraguay
Uruguay
GuyanaSurinameFrench Guiana
ParáAmazonas
BahiaMato Grosso
Goiás
Piauí
Minas Gerais
Acre
Maranhão
Paraná
Tocantins
Roraima
São Paulo
Rôndonia
Ceará
Amapá
Mato Grosso do Sul
Rio Grande do Sul
Pernambuco
Paraíba
Santa Catarina
Alagoas
Espírito Santo
Rio de Janeiro
Sergipe
Distrito Federal
40°0'0"W
40°0'0"W
50°0'0"W
50°0'0"W
60°0'0"W
60°0'0"W
70°0'0"W
70°0'0"W
10°0
'0"N
10°0
'0"N
0°0
'0"
0°0
'0"
10°0
'0"S
10°0
'0"S
20°0
'0"S
20°0
'0"S
30°0
'0"S
30°0
'0"S
40°0
'0"S
40°0
'0"S
±
0 380 760 1.140 1.520190Km
Legend
Railways0,00
0,01 - 0,70
0,71 - 3,49
3,50 - 8,87
8,88 - 22,18
Argentina
Bolivia
Peru
Chile
Venezuela
Colombia
Paraguay
Uruguay
GuyanaSurinameFrench Guiana
ParáAmazonas
BahiaMato Grosso
Goiás
Piauí
Minas Gerais
Acre
Maranhão
Paraná
Tocantins
Roraima
São Paulo
Rôndonia
Ceará
Amapá
Mato Grosso do Sul
Rio Grande do Sul
Pernambuco
Paraíba
Santa Catarina
Alagoas
Espírito Santo
Rio de Janeiro
Sergipe
Distrito Federal
40°0'0"W
40°0'0"W
50°0'0"W
50°0'0"W
60°0'0"W
60°0'0"W
70°0'0"W
70°0'0"W
10°0
'0"N
10°0
'0"N
0°0'
0"
0°0'
0"
10°
0'0
"S
10°
0'0
"S
20°0
'0"S
20°0
'0"S
30°0
'0"S
30°0
'0"S
40°0
'0"S
40°0
'0"S
±
0 380 760 1.140 1.520190Km
Legend
Roads0,13 - 0,74
0,75 - 1,71
1,72 - 2,94
2,95 - 10,59
10,59 - 25,11
Argentina
Bolivia
Peru
Chile
Venezuela
Colombia
Paraguay
Uruguay
GuyanaSurinameFrench Guiana
ParáAmazonas
BahiaMato Grosso
Goiás
Piauí
Minas Gerais
Acre
Maranhão
Paraná
Tocantins
Roraima
São Paulo
Rôndonia
Ceará
Amapá
Mato Grosso do Sul
Rio Grande do Sul
Pernambuco
Paraíba
Santa Catarina
Alagoas
Espírito Santo
Rio de Janeiro
Sergipe
Distrito Federal
40°0'0"W
40°0'0"W
50°0'0"W
50°0'0"W
60°0'0"W
60°0'0"W
70°0'0"W
70°0'0"W
10°0
'0"N
10°0
'0"N
0°0'
0"
0°0'
0"
10°
0'0
"S
10°
0'0
"S
20°0
'0"S
20°0
'0"S
30°0
'0"S
30°0
'0"S
40°0
'0"S
40°0
'0"S
±
0 380 760 1.140 1.520190Km
Legend
Building0,03 - 0,7
0,77 - 2,02
2,03 - 3,78
3,79 - 14,00
14,01 - 30,16
Argentina
Bolivia
Peru
Chile
Venezuela
Colombia
Paraguay
Uruguay
GuyanaSurinameFrench Guiana
ParáAmazonas
BahiaMato Grosso
Goiás
Piauí
Minas Gerais
Acre
Maranhão
Paraná
Tocantins
Roraima
São Paulo
Rôndonia
Ceará
Amapá
Mato Grosso do Sul
Rio Grande do Sul
Pernambuco
Paraíba
Santa Catarina
Alagoas
Espírito Santo
Rio de Janeiro
Sergipe
Distrito Federal
40°0'0"W
40°0'0"W
50°0'0"W
50°0'0"W
60°0'0"W
60°0'0"W
70°0'0"W
70°0'0"W
10°0
'0"N
10°0
'0"N
0°0'
0"
0°0'
0"
10°
0'0
"S
10°
0'0
"S
20°0
'0"S
20°0
'0"S
30°0
'0"S
30°0
'0"S
40°0
'0"S
40°0
'0"S
±
0 380 760 1.140 1.520190Km
Legend
Waterways0,16 - 0,67
0,68 - 1,62
1,63 - 3,67
3,68 - 9,23
9,24 - 19,05
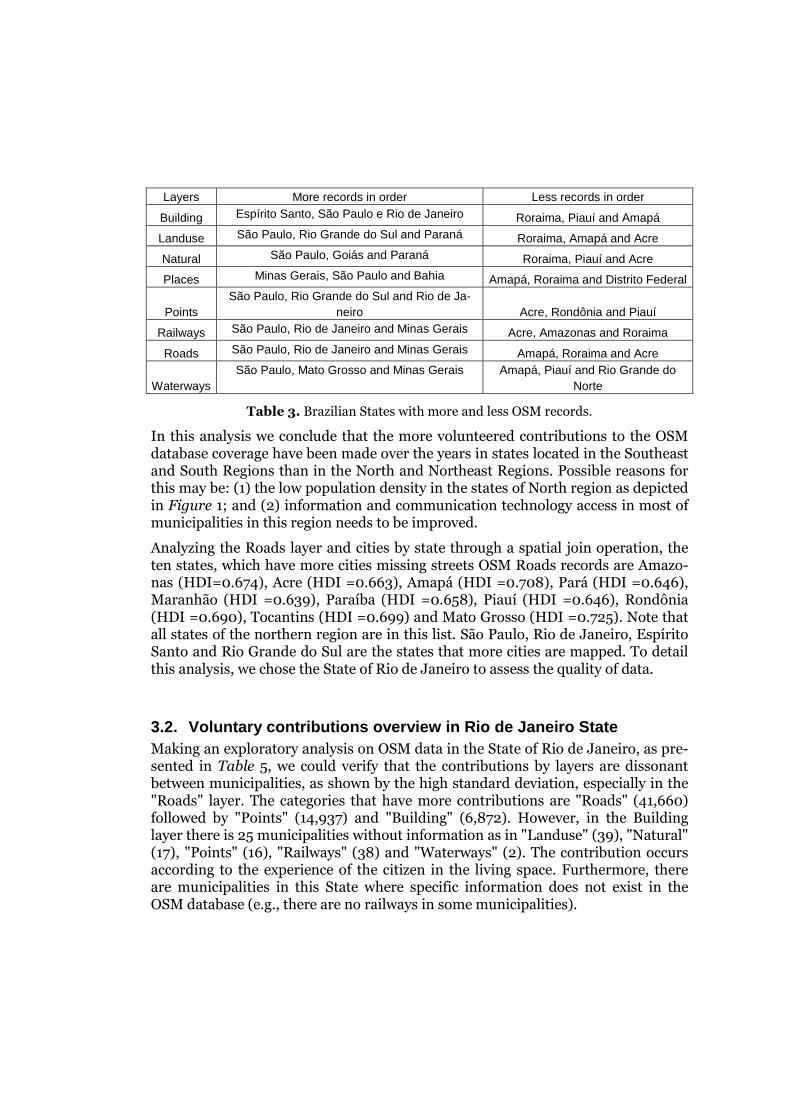
Layers More records in order Less records in order
Building Espírito Santo, São Paulo e Rio de Janeiro Roraima, Piauí and Amapá
Landuse São Paulo, Rio Grande do Sul and Paraná Roraima, Amapá and Acre
Natural São Paulo, Goiás and Paraná Roraima, Piauí and Acre
Places Minas Gerais, São Paulo and Bahia Amapá, Roraima and Distrito Federal
Points São Paulo, Rio Grande do Sul and Rio de Ja-
neiro Acre, Rondônia and Piauí
Railways São Paulo, Rio de Janeiro and Minas Gerais Acre, Amazonas and Roraima
Roads São Paulo, Rio de Janeiro and Minas Gerais Amapá, Roraima and Acre
Waterways São Paulo, Mato Grosso and Minas Gerais Amapá, Piauí and Rio Grande do
Norte
Table 3. Brazilian States with more and less OSM records.
In this analysis we conclude that the more volunteered contributions to the OSM database coverage have been made over the years in states located in the Southeast and South Regions than in the North and Northeast Regions. Possible reasons for this may be: (1) the low population density in the states of North region as depicted in Figure 1; and (2) information and communication technology access in most of municipalities in this region needs to be improved.
Analyzing the Roads layer and cities by state through a spatial join operation, the ten states, which have more cities missing streets OSM Roads records are Amazo-nas (HDI=0.674), Acre (HDI =0.663), Amapá (HDI =0.708), Pará (HDI =0.646), Maranhão (HDI =0.639), Paraíba (HDI =0.658), Piauí (HDI =0.646), Rondônia (HDI =0.690), Tocantins (HDI =0.699) and Mato Grosso (HDI =0.725). Note that all states of the northern region are in this list. São Paulo, Rio de Janeiro, Espírito Santo and Rio Grande do Sul are the states that more cities are mapped. To detail this analysis, we chose the State of Rio de Janeiro to assess the quality of data.
3.2. Voluntary contributions overview in Rio de Jan eiro State Making an exploratory analysis on OSM data in the State of Rio de Janeiro, as pre-sented in Table 5, we could verify that the contributions by layers are dissonant between municipalities, as shown by the high standard deviation, especially in the "Roads" layer. The categories that have more contributions are "Roads" (41,660) followed by "Points" (14,937) and "Building" (6,872). However, in the Building layer there is 25 municipalities without information as in "Landuse" (39), "Natural" (17), "Points" (16), "Railways" (38) and "Waterways" (2). The contribution occurs according to the experience of the citizen in the living space. Furthermore, there are municipalities in this State where specific information does not exist in the OSM database (e.g., there are no railways in some municipalities).
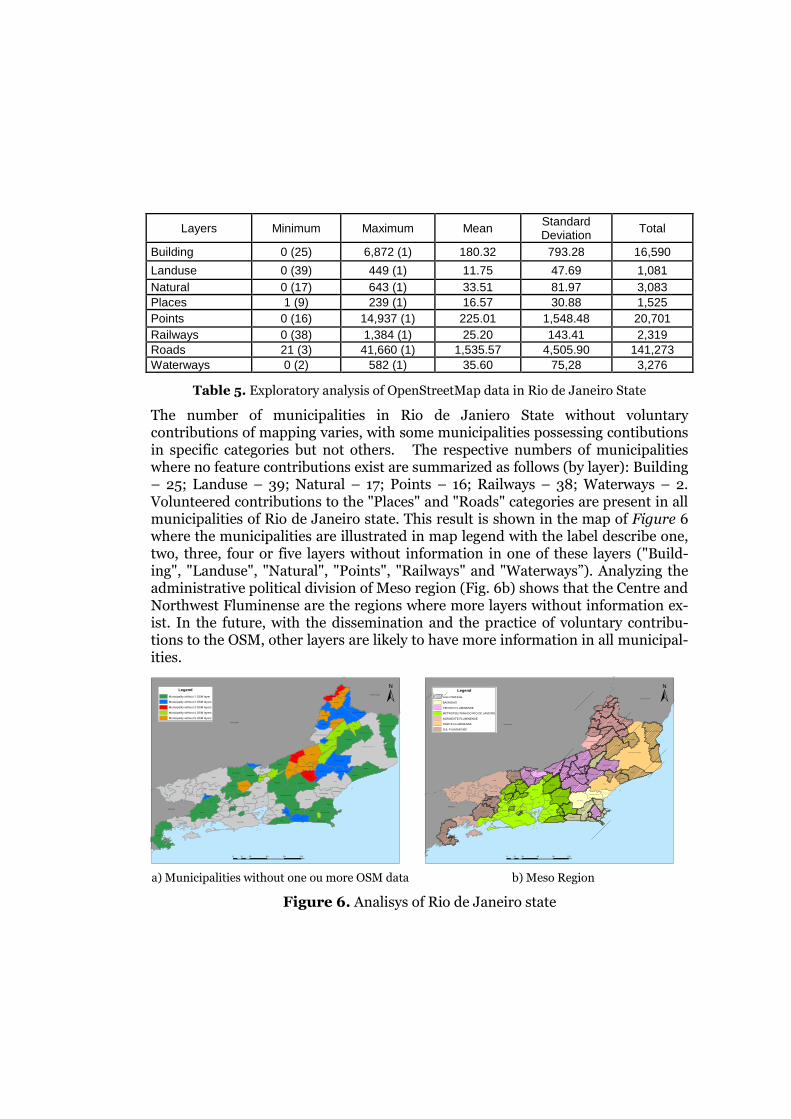
Layers Minimum Maximum Mean Standard Deviation Total
Building 0 (25) 6,872 (1) 180.32 793.28 16,590
Landuse 0 (39) 449 (1) 11.75 47.69 1,081 Natural 0 (17) 643 (1) 33.51 81.97 3,083 Places 1 (9) 239 (1) 16.57 30.88 1,525 Points 0 (16) 14,937 (1) 225.01 1,548.48 20,701 Railways 0 (38) 1,384 (1) 25.20 143.41 2,319 Roads 21 (3) 41,660 (1) 1,535.57 4,505.90 141,273 Waterways 0 (2) 582 (1) 35.60 75,28 3,276
Table 5. Exploratory analysis of OpenStreetMap data in Rio de Janeiro State
The number of municipalities in Rio de Janiero State without voluntary contributions of mapping varies, with some municipalities possessing contibutions in specific categories but not others. The respective numbers of municipalities where no feature contributions exist are summarized as follows (by layer): Building – 25; Landuse – 39; Natural – 17; Points – 16; Railways – 38; Waterways – 2. Volunteered contributions to the "Places" and "Roads" categories are present in all municipalities of Rio de Janeiro state. This result is shown in the map of Figure 6 where the municipalities are illustrated in map legend with the label describe one, two, three, four or five layers without information in one of these layers ("Build-ing", "Landuse", "Natural", "Points", "Railways" and "Waterways”). Analyzing the administrative political division of Meso region (Fig. 6b) shows that the Centre and Northwest Fluminense are the regions where more layers without information ex-ist. In the future, with the dissemination and the practice of voluntary contribu-tions to the OSM, other layers are likely to have more information in all municipal-ities.
a) Municipalities without one ou more OSM data b) Meso Region
Figure 6. Analisys of Rio de Janeiro state
MINAS GERAIS
ESPIRITO SANTO
SAO PAULO
MACAÉ
CAMPOS DOS GOYTACAZES
VALENÇA
PARATY
RESENDE
ITAPERUNA
PIRAÍ
SÃO FIDÉLIS
RIO CLARO
RIO DE JANEIRO
SILVA JARDIM
QUISSAMÃ
MAGÉ
PETRÓPOLIS
CANTAGAL O
CAMBUCI
NOVA FRIBURGO
ARARUAMA
TERESÓPOLIS
SAPUCAIA
ITABORAÍ
MARICÁ
ITALVA
VASSOURAS
CARMO
ITAOCARA
QUATIS
RIO BONITO
NOVA IGUAÇU
BARRA MANSA
CABO FRIO
CACHOEIRAS DE MACACU
ANGRA DOS REIS
BARRA DO PIRAÍ
PARAÍBA DO SUL
SÃO FRANCISCO DE ITABAPOANA
ITAGUAÍ
SANTA MARIA MADALENA
NATIVIDADE
SUMIDOURO
ITATIAIA
BOM JARDIM
TRÊS RIOS
GUAPIMIRIM
RIO DAS FLORES
MIRACEMA
SAQUAREMA
TRAJANO DE MORAES
DUAS BARRAS
CARDOSO MOREIRA
DUQUE DE CAXIAS
CAR APEBUS
CASIMIRO DE ABREU
SANTO ANTÔNIO DE PÁDUA
SEROPÉDICA
SÃO JOÃO DA BARRA
BOM JESUS DO ITABAPOANA
PORCIÚNCULA
MANGARATIBA
TANGUÁ
PATY DO ALFERES
VARRE-SAI
MIGUEL PEREIRA
AREAL
SÃO GONÇALO
NITERÓI
PARACAMBI
LAJE DO MU RIAÉ
SÃO PEDRO DA ALDEIA
CONCEIÇÃO DE MACABU
SÃO JOSÉ DE UBÁ
RIO DAS OSTRAS
JAPERI
MEND ESVOLTA REDONDA
APERIBÉ
CORDEIRO
MACUCO
ARRAIAL D O CABO
PINHEIRAL
QUEIMADOS
±
0 30 60 90 12015km
Legend
Municipality without 1 OSM layer
Municipality without 2 OSM layers
Municipality without 3 OSM layers
Municipality without 4 OSM layers
Municipality without 5 OSM layers
MINAS GERAIS
ESPIRITO SANTO
SAO PAULO
MACAÉ
CAMPOS DOS GOYTACAZES
VALENÇA
PARATY
RESENDE
ITAPERUNA
PIRAÍ
SÃO FIDÉL IS
RIO CL ARO
RIO DE JANEIRO
SILVA JARDIM
QUISSAMÃ
MAGÉ
PETRÓPOLIS
CANTAGALO
CAMBUCI
NOVA FRIBURGO
ARARUAMA
TERESÓPOLIS
SAPUCAIA
ITABORAÍ
MARICÁ
ITALVA
VASSOURAS
CARMO
ITAOCARA
QUATIS
RIO BONITO
NOVA IGUAÇU
BARRA MANSA
CABO FRIO
CACHOEIRAS DE MACACU
ANGRA DOS REIS
BARRA DO PIRAÍ
PARAÍBA DO SUL
SÃO FRANCISCO DE ITABAPOANA
ITAGUAÍ
SANTA MARIA MADALENA
NATIVIDADE
SUMIDOURO
ITATIAIA
BOM JARDIM
TRÊS RIOS
GUAPIMIRIM
RIO DAS FLORES
MIRACEMA
SAQUAREMA
TRAJANO DE MORAES
DUAS BARRAS
CARDOSO MOREIRA
DUQUE DE CAXIAS
CARAPEBUS
CASIMIRO DE ABREU
SANTO ANTÔNIO DE PÁDUA
SEROPÉDICA
BOM JESUS DO ITABAPOANA
PORCIÚNCULA
MANGARATIBA
TANGUÁ
PATY DO ALFERES
VARRE-SAI
MIGUEL PEREIRA
AREAL
SÃO GONÇALO
NITER ÓI
PARACAMBI
LAJE D O MURIAÉ
CONCEIÇÃO DE MACABU
SÃO JOSÉ DE UBÁ
RIO DAS OSTRAS
JAPERI
MENDES
APERIBÉ
CORDEIRO
MACUCO
ARRAIAL DO CABO
PINHEIRAL
QUEIMADOS
±
0 30 60 90 12015km
Legend
Less OSM data
BAIXADAS
CENTRO FLUMINENSE
METROPOLITANA DO RIO DE JANEIRO
NOROESTE FLUMINENSE
NORTE FLUMINENSE
SUL FLUMINENSE
The Rio de Janeiro city is an outlier in contributions in all layers as shown in Table 6, which are described by the municipalities that have more contributions.
Layers More records in order
Building Rio de Janeiro (6,872), Angra dos Reis (2,584) e Niterói (2,111))
Landuse Rio de Janeiro (449), Cabo Frio (84) e Araruama (56)
Natural Rio de Janeiro (643), São Gonçalo (363) e Niterói (261)
Places Rio de Janeiro (239), Campos de Goitacazes (123) e Resende (82)
Points Rio de Janeiro(14,937)), Niterói (1,116) e São Gonçalo (401)
Railways Rio de Janeiro (1,384), Duque de Caxias (76) e Quatis (57)
Roads Rio de Janeiro(41,660), Nova Iguaçu (8,384) e São Gonçalo (7,358)
Waterways Rio de Janeiro (582), Porto Real (336) e Angra dos Reis (191)
Table 6. Municipalities with more records.
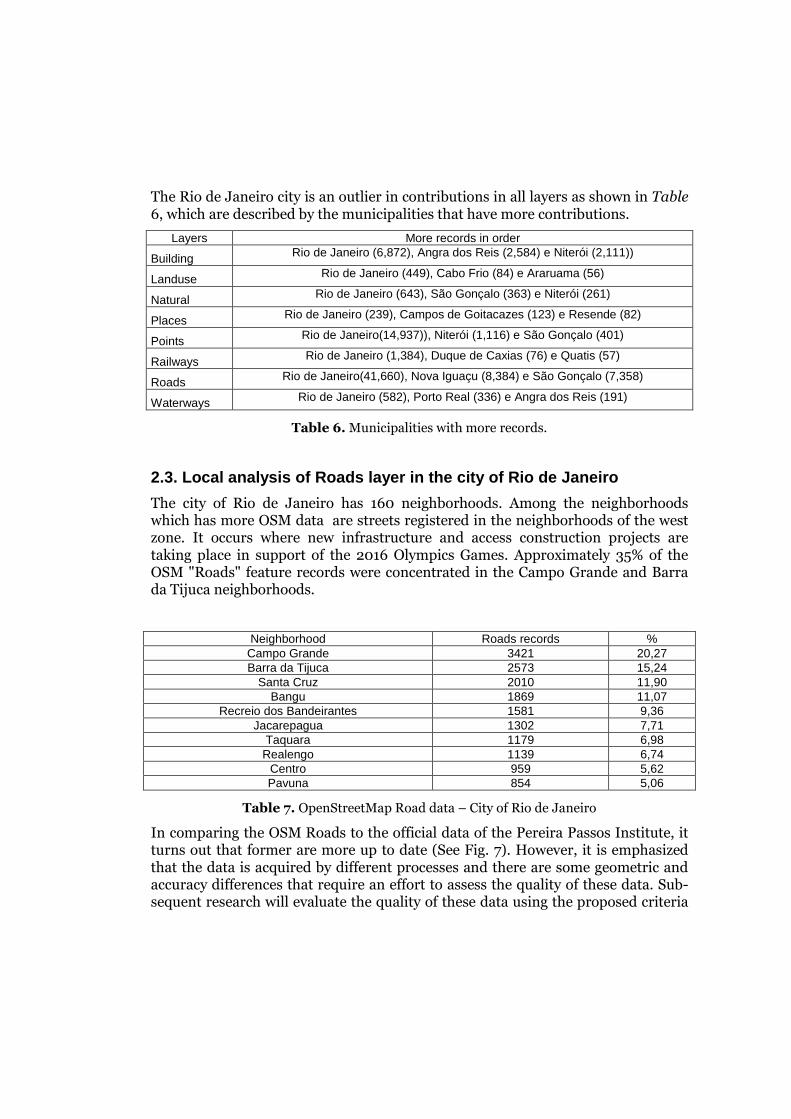
2.3. Local analysis of Roads layer in the city of R io de Janeiro
The city of Rio de Janeiro has 160 neighborhoods. Among the neighborhoods which has more OSM data are streets registered in the neighborhoods of the west zone. It occurs where new infrastructure and access construction projects are taking place in support of the 2016 Olympics Games. Approximately 35% of the OSM "Roads" feature records were concentrated in the Campo Grande and Barra da Tijuca neighborhoods.
Neighborhood Roads records % Campo Grande 3421 20,27 Barra da Tijuca 2573 15,24
Santa Cruz 2010 11,90 Bangu 1869 11,07
Recreio dos Bandeirantes 1581 9,36 Jacarepagua 1302 7,71
Taquara 1179 6,98 Realengo 1139 6,74
Centro 959 5,62 Pavuna 854 5,06
Table 7. OpenStreetMap Road data – City of Rio de Janeiro
In comparing the OSM Roads to the official data of the Pereira Passos Institute, it turns out that former are more up to date (See Fig. 7). However, it is emphasized that the data is acquired by different processes and there are some geometric and accuracy differences that require an effort to assess the quality of these data. Sub-sequent research will evaluate the quality of these data using the proposed criteria
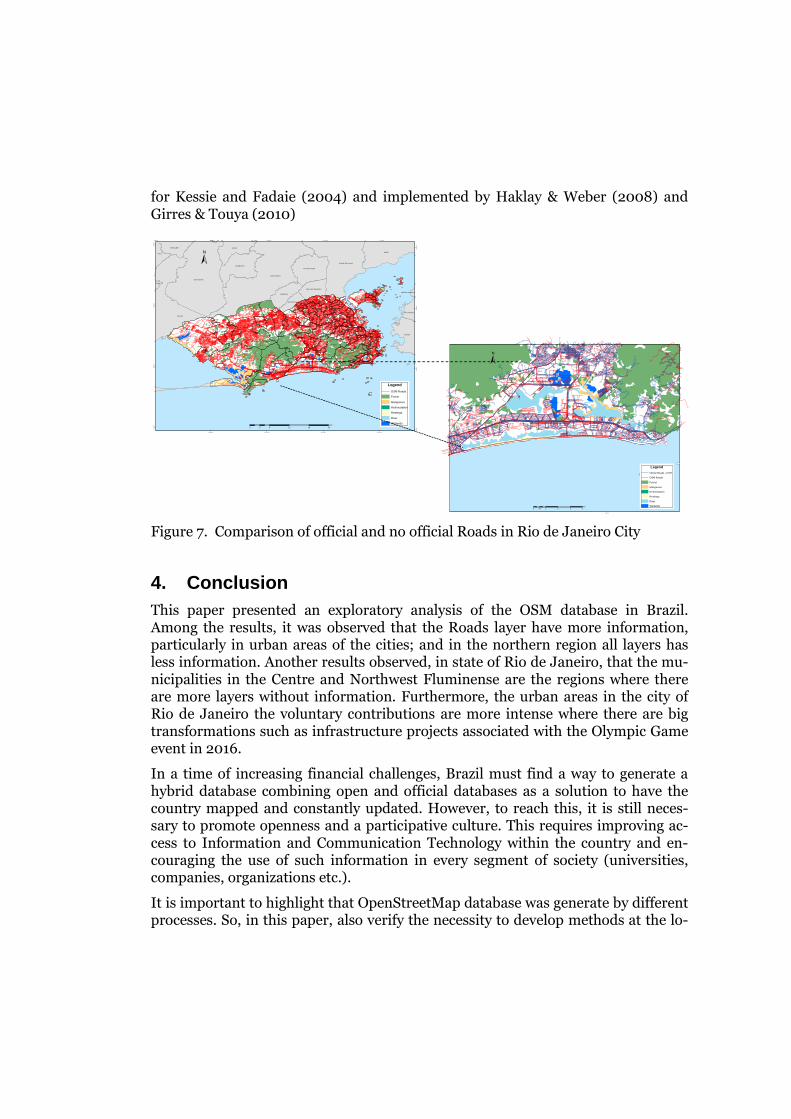
for Kessie and Fadaie (2004) and implemented by Haklay & Weber (2008) and Girres & Touya (2010)
Figure 7. Comparison of official and no official Roads in Rio de Janeiro City
4. Conclusion This paper presented an exploratory analysis of the OSM database in Brazil. Among the results, it was observed that the Roads layer have more information, particularly in urban areas of the cities; and in the northern region all layers has less information. Another results observed, in state of Rio de Janeiro, that the mu-nicipalities in the Centre and Northwest Fluminense are the regions where there are more layers without information. Furthermore, the urban areas in the city of Rio de Janeiro the voluntary contributions are more intense where there are big transformations such as infrastructure projects associated with the Olympic Game event in 2016.
In a time of increasing financial challenges, Brazil must find a way to generate a hybrid database combining open and official databases as a solution to have the country mapped and constantly updated. However, to reach this, it is still neces-sary to promote openness and a participative culture. This requires improving ac-cess to Information and Communication Technology within the country and en-couraging the use of such information in every segment of society (universities, companies, organizations etc.).
It is important to highlight that OpenStreetMap database was generate by different processes. So, in this paper, also verify the necessity to develop methods at the lo-
NOVA IGUAÇU
ITAGUAÍ
SEROPÉDICA
MAGÉ
DUQUE DE CAXIAS
NITERÓI
JAPERI
QUEIMADOS
BELFORD ROXO
MESQUITA
PIRAÍ
PARACAMBI
NILÓPOLIS
SÃO JOÃO DE MERITI
SÃO GONÇALO
PIRAÍ
SÃO GONÇALO
Guaratiba
Santa Cruz
Campo Grande
Bangu
Jacarepagua
Barra da Tijuca
Paciencia
Realengo
Galeao
Vargem GrandeAlto da Boa Vis ta
Iraja
Tijuca
Taquara
Cosmos
Sepetiba
Itanhanga
Recreio dos Bandeirantes
Grumari
Pavuna
Caju
Vila Militar
Anil
Inhoaiba
Camorim
Centro
Penha
Mare
Grajau
Lagoa
Vargem Pequena
Tanque
Santissimo
Olaria
Praca Seca
Deodoro
Botafogo Urca
Jardim Sulacap
Sao Conrado
Anchieta
Joa
Meier
Inhauma
Ramos
Taua
Copacabana
Vila Isabel
Leblon
Acari
Ipanema
43°10'0"W
43°10'0"W
43°20'0"W
43°20'0"W
43°30'0"W
43°30'0"W
43°40'0"W
43°40'0"W43°50'0"W
22°4
0'0
"S
22°4
0'0
"S
22°5
0'0"
S
22°5
0'0
"S
23°0
'0"S
23°
0'0
"S
23°
10'0
"S
23°1
0'0
"S
Legend
OSM Roads
Forest
Mangurove
Reforestation
Restinga
River
Wetlands
±
0 6 12 18 243Km
43°20'0"W
43° 20'0"W
23°0
'0"S
23°0
'0"S
Legend
Oficial Roads of IPP
OSM Roads
Forest
Mangurove
Reforestation
Restinga
River
Wetlands
±
0 1 2 3 40.5Km
cal level to analyze data quality with regard to accuracy and geometry so that open data produced voluntarily can be incorporated to generate an official hybrid data-base. As future work, a methodology will be developed to assess the OSM Roads layer of the city of Rio de Janeiro.
References Bennett, J., 2010. OpenStreetMap. Packt Publishing Ltd.
Budhathoki, N.R., Haythornthwaite, C., 2013. Motivation for Open Collaboration Crowd and Community Models and the Case of OpenStreetMap. American Behavioral Scientist 57, 548–575.
Coleman, D.J., 2013. Potential Contributions and Challenges of VGI for Conventional Topographic Base-Mapping Programs, in: Crowdsourcing Geographic Knowledge. Springer, pp. 245–263.
Cooper, A.K., Coetzee, S., Kourie, D.G., 2012. Assessing the quality of repositories of volun-teered geographical information.
Curran, K., Crumlish, J., Fisher, G., 2012. OpenStreetMap. International Journal of Inter-active Communication Systems and Technologies (IJICST) 2, 69–78.
GeoConnections, 2012. Volunteered Geographic Information (VGI) Primer, Canadian Geo-spatial Data Infrastructure Information Product 21e, Science and Technology Policy Re-search and Analysis Resource team, report by Hickling Arthurs Low (HAL), Ottawa: Nat-ural Resources Canada. Available at http://ftp2.cits.rncan.gc.ca/pub/geott/ess_pubs/291/291948/cgdi_ip_21e.pdf
Girres, J.-F., Touya, G., 2010. Quality assessment of the French OpenStreetMap dataset. Transactions in GIS 14, 435–459.
Goodchild, M.F., 2007. Citizens as sensors: the world of volunteered geography. GeoJour-nal, 69:211–221.
Goodchild, M.F., Li, L., 2012. Assuring the quality of volunteered geographic information. Spatial statistics 1, 110–120.
Haklay, M., 2010. How good is volunteered geographical information? A comparative study of OpenStreetMap and Ordnance Survey datasets. Environment and planning. B, Plan-ning & design 37, 682.
Haklay, M., Weber, P., 2008. Openstreetmap: User-generated street maps. Pervasive Com-puting, IEEE 7, 12–18.
Haklay, M., Antoniou, V.; Basiouka, S. Soden, R. and Mooney, P., 2014. ‘Crowdsourced Geographic Information Use in Government’. Global Facility for Disaster Reduction and Recovery (GFDRR), World Bank: London, UK. Available at http://discovery.ucl.ac.uk/1433169/.
Hochmair, H., Zielstra, D., 2013. Development and completeness of points of interest in free and proprietary data sets: A Florida case study.
Hochmair, H.H., Zielstra, D., Neis, P., 2013. Assessing the completeness of bicycle trails and designated lane features in OpenStreetMap for the United States and Europe, in: Proceedings of the Transportation Research Board 92nd Annual Meeting, Washington, DC, USA. pp. 13–17.
Lauriault, Tracey P., Mooney, Peter, 2014. Crowdsourcing: A Geographic Approach to Public Engagement, The Programmable City Working Paper 6. In: Internet Politics and Policy Conference, 2014, Oxford Internet Institute.
Mullen, W.F., Jackson, S.P., Croitoru, A., Crooks, A., Stefanidis, A., Agouris, P., 2014. As-sessing the impact of demographic characteristics on spatial error in volunteered geo-graphic information features. GeoJournal 1–19.
Neis, P., Zielstra, D., Zipf, A., 2013. Comparison of Volunteered Geographic Information Data Contributions and Community Development for Selected World Regions. Future In-ternet 5, 282–300.
OpenStreetMap copyright and license [WWW Document], n.d. URL http://www.openstreetmap.org/copyright/en (accessed 4.9.15).
OpenStreetMap Statistics [WWW Document], 2015. URL http://www.openstreetmap.org/stats/data_stats.html (accessed 4.8.15).
OpenStreetMap Wiki [WWW Document], n.d. URL http://wiki.openstreetmap.org/wiki/Elements (accessed 4.9.15).
OpenStreetMap Wiki-WGS84 [WWW Document], .d. URL http://wiki.openstreetmap.org/wiki/Converting_to_WGS84 (accessed 4.9.15).
Saunders, A., Scassa, T., Lauriault, T. P. 2012. Legal Issues in Maps Built on Third Party Base Layers. Geomatica, 66(4), pp. 279–290.
Schulze, T., Seedorf, S., Geiger, D., Kaufmann, N., Schader, M., 2011. Exploring task prop-erties in crowdsourcing–an empirical study on mechanical turk.
Wolf, E.B., Matthews, K.M., Poore, B.S., 2011. OpenStreetMap collaborative prototype, phase one. Open-File Report. US Geological Survey, Reston, VA: US Department of the Interior, US Geological Survey.
Zook, M., Graham, M., Shelton, T., Gorman, S., 2010. Volunteered geographic information and crowdsourcing disaster relief: a case study of the Haitian earthquake. World Medical & Health Policy 2, 7–33.