Embed Size (px)
Citation preview

Analysis of spurious bulk waves in ball surface wave device
Satoru Ishikawa a, Hideo Cho a, Yusuke Tsukahara b, Noritaka Nakaso b,Kazushi Yamanaka a,*
a Department of Materials Processing, Tohoku University, Aoba 02 Aramaki Aoba-ku, Sendai 980-8579, Japanb Toppan Printing Co. Ltd., Takanodai-Minimani 4-2-3, Sugito-machi, Kitakatsushika-gun, Saitama 345-8508, Japan
Received 20 March 2002; accepted 25 June 2002
Abstract
We analyzed the acoustic waves propagating in a sphere to establish a useful guideline for the design of NDE apparatus and ball
surface acoustic wave (SAW) device exploiting the diffraction-free propagation of SAW on a sphere. First, we calculated the laser-
generated acoustic displacements both under ablation condition and under thermoelastic condition and verified experimentally the
validity of the calculation. Next, the acoustic waves excited by out-of-plane stress and those excited by in-plane stress were com-
pared. The results showed that when the out-of-plane stress was applied, the relative amplitudes of the bulk waves to that of the
SAW were larger and the number of bulk waves was larger than that when the in-plane stress was applied, while the SAW had
similar waveforms in each case. The ratio of the relative amplitude of the bulk waves for the out-of-plane stress and the in-plane
stress was 3.1:1 at /1 ¼ 90� and 1.67:1 at /1 ¼ 0�. The large amplitude for the out-of-plane stress can be explained by wide di-rectivities of bulk waves. Consequently, we found that it is necessary for ball SAW device to select a piezoelectric material and form
of interdigital transducer so that the in-plane stress becomes dominant.
� 2002 Elsevier Science B.V. All rights reserved.
PACS: 43.28.J; 43.38.Rh
Keywords: Ball surface acoustic wave device; Sphere; Spurious bulk waves; NDE
1. Introduction
We have found that the surface acoustic waves
(SAWs) on a sphere excited by a sequence of line sources
make a surprisingly large number of round-trips,avoiding the scattering at the supports of the sphere [1].
From analysis of this phenomenon, we found that the
SAWs have unique divergent, collimating and focussing
beam shapes specified by aperture angle of the source
and the wavenumber parameter m (¼ ka k: wavenumber
of SAWs, a: radius of a sphere) [2,3]. For appropriate
aperture angles, the SAWs show diffraction-free propa-
gation confined within a narrow path due to balance ofthe diffraction and focussing effects. Following these
findings, we proposed to apply this unique feature of
SAWs on a sphere to high-precision nondestructive
evaluation of bearing balls [1,2], ball SAW devices with
interdigital transducer (IDT) on a ball [4,5] and ball
acoustooptic devices [6]. Especially, ball SAW device
is expected as a highly efficient SAW device, becausethe SAW can propagate quite a long distance due
to the multiple round-trips, and therefore we can mea-
sure the velocity with extremely high precision. In con-
trast, there is a limitation to long distance propagation
in the conventional SAW devices due to diffraction loss.
However, the multiple reflections of bulk waves have
also been observed. When acoustic waves were gener-
ated by a laser beam under thermoelastic condition, therelative amplitudes of the bulk waves to that of the SAW
were small [3,6]. But when acoustic waves were gener-
ated by a line piezoelectric transducer [4] or by IDT [5],
the relative amplitudes of the bulk waves were com-
paratively large. We thought the bulk waves with large
amplitude come from the difference of applied stress
components because there is a significant out-of-plane
Ultrasonics 41 (2003) 1–8
www.elsevier.com/locate/ultras
*Corresponding author. Tel.: +81-22-217-7357; fax: +81-22-217-
4298.
E-mail address: [email protected] (K. Yamanaka).
0041-624X/02/$ - see front matter � 2002 Elsevier Science B.V. All rights reserved.PII: S0041-624X(02 )00395-5

stress in the measurement using piezoelectric transducers
while the in-plane stress is dominant in the laser beam
under thermoelastic condition. As the bulk waves with
large amplitude become the origin of spurious response
degrading the accuracy, analysis of the SAW and thebulk waves in a sphere is necessary for ball SAW de-
vices.
As a method of analyzing IDT in SAW devices, there
are exact analyses that take into account the electric field
distribution produced in a crystal substrate. But for more
practical use, the method of assuming perpendicular
electric field (crossed-field model) or parallel electric field
(in-line field model) is used [7]. In this case, it is expectedthat the perpendicular electric field mainly produce the
out-of-plane stress and the parallel electric field mainly
produce the in-plane stress. But, to our knowledge, there
is no report that evaluated contribution of the out-
of-plane and in-plane stresses independently.
In this study, a theoretical and experimental analysis
of the acoustic wave propagation in a sphere are per-
formed through investigating the contribution of the in-plane stress and the out-of-plane stress to the relative
amplitude of bulk waves in order to establish a useful
guideline for the design of ball SAW device, especially a
method of suppressing spurious bulk waves. First, to
verify the validity of the theoretical calculation, the ra-
dial displacement of laser-generated acoustic waves both
under ablation and thermoelastic conditions are calcu-
lated and are compared with experimental results. Next,the difference between the acoustic waves excited by the
in-plane and the out-of-plane stresses are investigated.
2. Analysis methods and experimental setup
2.1. Spheroidal deformation on a homogeneous elastic
sphere
As shown in Fig. 1, applied stresses with axial sym-
metry with respect to the polar axis
Trr ¼ RðhÞ ¼ R0ðcos hÞf ðtÞTrh ¼ HðhÞ ¼ H0ðcos hÞf ðtÞTru ¼ 0
9=; ð1Þ
are assumed on the surface r ¼ a of a homogeneouselastic sphere. Here, R0ðcos hÞ and H0ðcos hÞ are spatialdistributions of the stress and f ðtÞ is a time function ofthe stress. In this report, the spatial distribution of the
applied stress was considered as the circle centering on a
point P as shown in the Fig. 1(b). Defining the aperture
angle of the circular source as h0 the spatial distributionsare given by
R0ðcos hÞ ¼ 1 h6 h0;0 h > h0;
�ð2aÞ
H0ðcos hÞ ¼ 1 h6 h0;0 h > h0:
�ð2bÞ
Then the radial displacement at an observation point Q
(a; h;u) is expressed as following [8–10]:
uðtÞ ¼Z 1
�1
Xl
P 0l ðcos hÞU1l bDD0l þ U2lbFF 0l
Ef �ðxÞeixt dx;
ð3Þ
bDD0l ¼ K0lR 1�1 R
0ðcos hÞP 0l ðcos hÞð� sin hÞdh
bFF 0l ¼ � K0llðlþ 1Þ
Z 1
�1
1
sin hd
dhsin hH0ðcos hÞ
� �P 0l ðcos hÞð� sin hÞdh:
9>>>>=>>>>;
ð4ÞHere, x is a angular frequency, U1l and U2l are functionsthat provide radial displacement (Appendix A), P 0l is theassociated Legendre function, f �ðxÞ is the Fouriertransform of f (t), E is a function of stress component on
the surface (Appendix A) and K0l is a function of l [8,9].As the denominator E in Eq. (3) is the stress com-
ponent on the surface, E ¼ 0 gives the characteristicequation of the spheroidal oscillation. Thus if we put
roots of the equation as nxl (n: radial mode number, l:
colatitudinal mode number), we can reduce Eq. (3) tothe sum of contributions of spheroidal oscillations as
followed by Cauchy’s residue theorem.
uðtÞ ¼ i2
Xl;n
P 0l ðcos hÞU1ldE=dx
bDD0l��
þ U2ldE=dx
bFF 0l�
� f �ðxÞ expðixtÞ�
x¼nxl
: ð5Þ
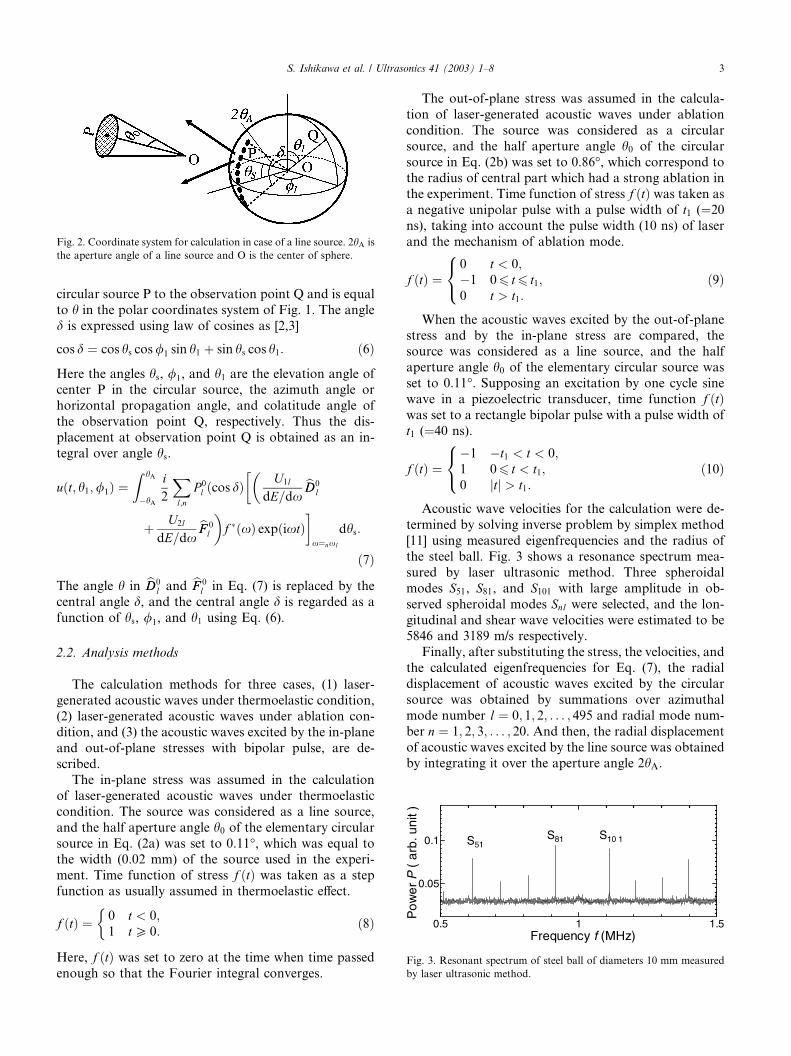
Integrating acoustic field by the circular source cen-
tering on the point P over the aperture angle 2hA of aline source as shown in Fig. 2 (Strictly speaking, the
stress is stripe in shape. But it will be called a line
source.), the radial displacement excited by the line
source is obtained. In the coordinates system of Fig. 2, dis the central angle of the arc connecting the center of
Fig. 1. (a) Polar coordinate system and (b) the circular distribution of
stress.
2 S. Ishikawa et al. / Ultrasonics 41 (2003) 1–8
circular source P to the observation point Q and is equal
to h in the polar coordinates system of Fig. 1. The angled is expressed using law of cosines as [2,3]
cos d ¼ cos hs cos/1 sin h1 þ sin hs cos h1: ð6Þ
Here the angles hs, /1, and h1 are the elevation angle ofcenter P in the circular source, the azimuth angle or
horizontal propagation angle, and colatitude angle of
the observation point Q, respectively. Thus the dis-
placement at observation point Q is obtained as an in-
tegral over angle hs.
uðt; h1;/1Þ ¼Z hA
�hA
i2
Xl;n
P 0l ðcos dÞU1ldE=dx
bDD0l��
þ U2ldE=dx
bFF 0l�f �ðxÞ expðixtÞ
�x¼nxl
dhs:
ð7Þ
The angle h in bDD0l and bFF 0l in Eq. (7) is replaced by thecentral angle d, and the central angle d is regarded as afunction of hs, /1, and h1 using Eq. (6).
2.2. Analysis methods
The calculation methods for three cases, (1) laser-
generated acoustic waves under thermoelastic condition,
(2) laser-generated acoustic waves under ablation con-dition, and (3) the acoustic waves excited by the in-plane
and out-of-plane stresses with bipolar pulse, are de-
scribed.
The in-plane stress was assumed in the calculation
of laser-generated acoustic waves under thermoelastic
condition. The source was considered as a line source,
and the half aperture angle h0 of the elementary circularsource in Eq. (2a) was set to 0.11�, which was equal tothe width (0.02 mm) of the source used in the experi-
ment. Time function of stress f ðtÞ was taken as a stepfunction as usually assumed in thermoelastic effect.
f ðtÞ ¼ 0 t < 0;1 tP 0:
�ð8Þ
Here, f ðtÞ was set to zero at the time when time passedenough so that the Fourier integral converges.
The out-of-plane stress was assumed in the calcula-
tion of laser-generated acoustic waves under ablation
condition. The source was considered as a circular
source, and the half aperture angle h0 of the circularsource in Eq. (2b) was set to 0.86�, which correspond tothe radius of central part which had a strong ablation in
the experiment. Time function of stress f ðtÞ was taken asa negative unipolar pulse with a pulse width of t1 (¼20ns), taking into account the pulse width (10 ns) of laser
and the mechanism of ablation mode.
f ðtÞ ¼0 t < 0;�1 06 t6 t1;0 t > t1:
8<: ð9Þ
When the acoustic waves excited by the out-of-plane
stress and by the in-plane stress are compared, thesource was considered as a line source, and the half
aperture angle h0 of the elementary circular source wasset to 0.11�. Supposing an excitation by one cycle sinewave in a piezoelectric transducer, time function f ðtÞwas set to a rectangle bipolar pulse with a pulse width of
t1 (¼40 ns).
f ðtÞ ¼�1 �t1 < t < 0;1 06 t < t1;0 jtj > t1:
8<: ð10Þ
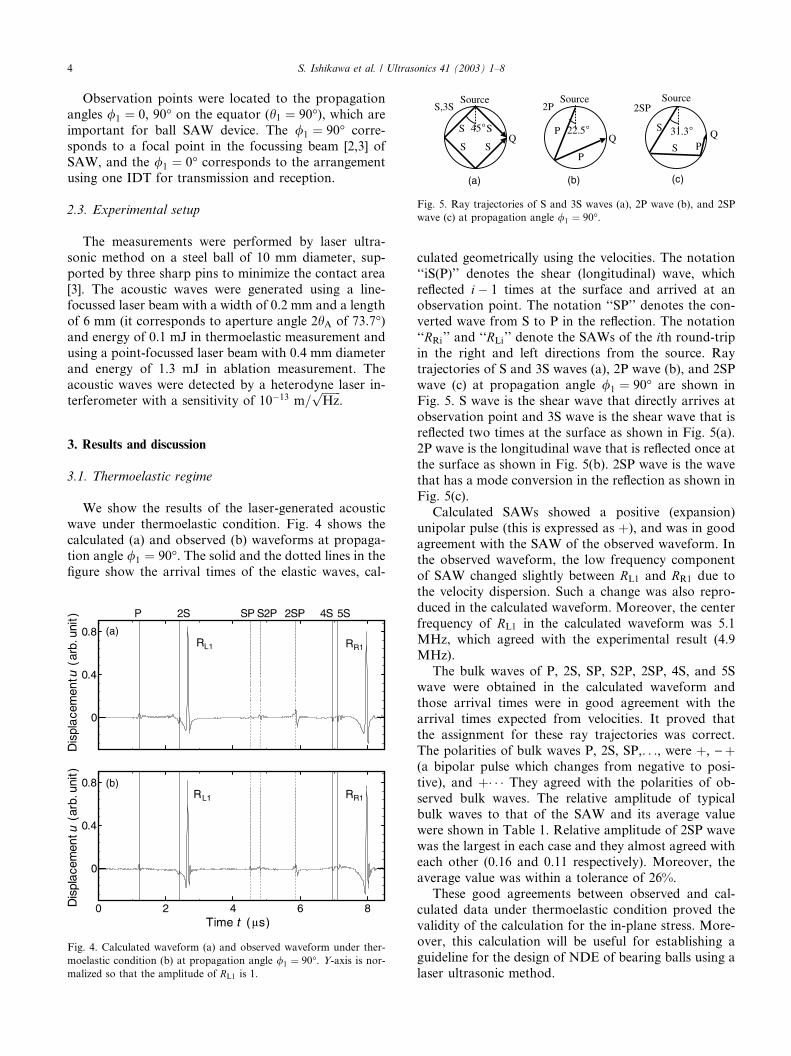
Acoustic wave velocities for the calculation were de-
termined by solving inverse problem by simplex method
[11] using measured eigenfrequencies and the radius of
the steel ball. Fig. 3 shows a resonance spectrum mea-
sured by laser ultrasonic method. Three spheroidal
modes S51, S81, and S101 with large amplitude in ob-served spheroidal modes Snl were selected, and the lon-gitudinal and shear wave velocities were estimated to be5846 and 3189 m/s respectively.
Finally, after substituting the stress, the velocities, and
the calculated eigenfrequencies for Eq. (7), the radial
displacement of acoustic waves excited by the circular
source was obtained by summations over azimuthal
mode number l ¼ 0; 1; 2; . . . ; 495 and radial mode num-ber n ¼ 1; 2; 3; . . . ; 20. And then, the radial displacementof acoustic waves excited by the line source was obtainedby integrating it over the aperture angle 2hA.
Fig. 2. Coordinate system for calculation in case of a line source. 2hA isthe aperture angle of a line source and O is the center of sphere.
Fig. 3. Resonant spectrum of steel ball of diameters 10 mm measured
by laser ultrasonic method.
S. Ishikawa et al. / Ultrasonics 41 (2003) 1–8 3
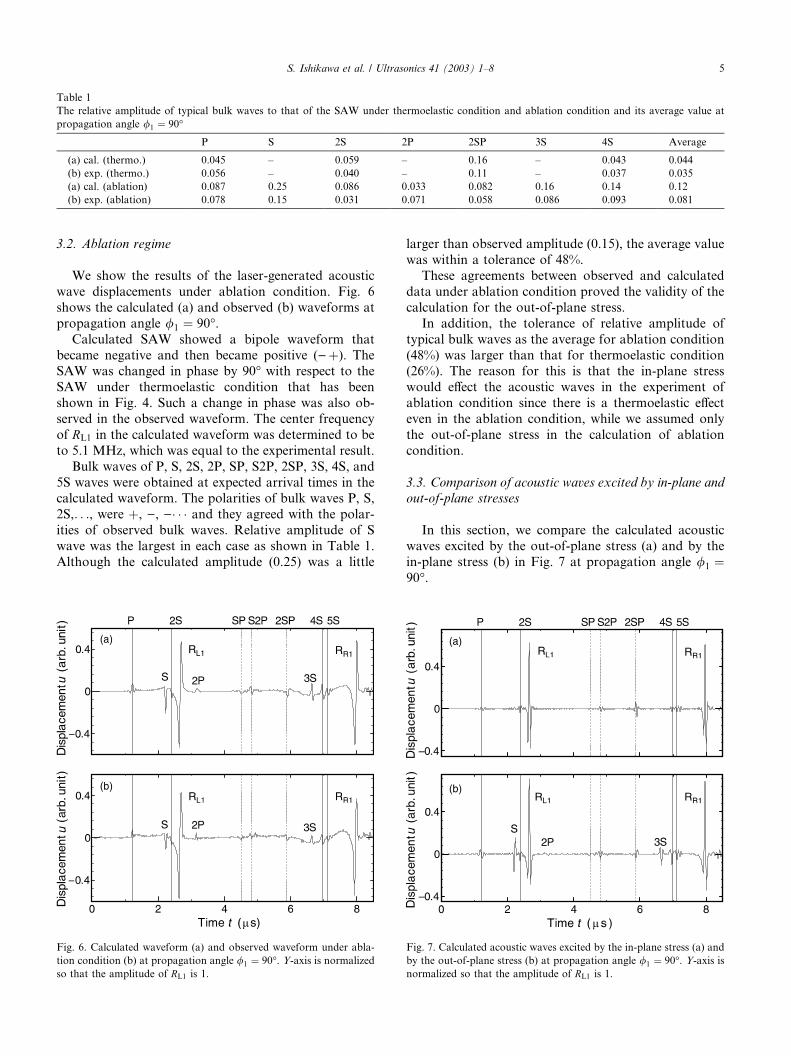
Observation points were located to the propagation
angles /1 ¼ 0, 90� on the equator (h1 ¼ 90�), which areimportant for ball SAW device. The /1 ¼ 90� corre-sponds to a focal point in the focussing beam [2,3] of
SAW, and the /1 ¼ 0� corresponds to the arrangementusing one IDT for transmission and reception.
2.3. Experimental setup
The measurements were performed by laser ultra-
sonic method on a steel ball of 10 mm diameter, sup-
ported by three sharp pins to minimize the contact area
[3]. The acoustic waves were generated using a line-focussed laser beam with a width of 0.2 mm and a length
of 6 mm (it corresponds to aperture angle 2hA of 73.7�)and energy of 0.1 mJ in thermoelastic measurement and
using a point-focussed laser beam with 0.4 mm diameter
and energy of 1.3 mJ in ablation measurement. The
acoustic waves were detected by a heterodyne laser in-
terferometer with a sensitivity of 10�13 m=ffiffiffiffiffiffiffiHz
p.
3. Results and discussion
3.1. Thermoelastic regime
We show the results of the laser-generated acoustic
wave under thermoelastic condition. Fig. 4 shows the
calculated (a) and observed (b) waveforms at propaga-tion angle /1 ¼ 90�. The solid and the dotted lines in thefigure show the arrival times of the elastic waves, cal-
culated geometrically using the velocities. The notation
‘‘iS(P)’’ denotes the shear (longitudinal) wave, which
reflected i� 1 times at the surface and arrived at anobservation point. The notation ‘‘SP’’ denotes the con-
verted wave from S to P in the reflection. The notation
‘‘RRi’’ and ‘‘RLi’’ denote the SAWs of the ith round-tripin the right and left directions from the source. Ray
trajectories of S and 3S waves (a), 2P wave (b), and 2SP
wave (c) at propagation angle /1 ¼ 90� are shown inFig. 5. S wave is the shear wave that directly arrives at
observation point and 3S wave is the shear wave that isreflected two times at the surface as shown in Fig. 5(a).
2P wave is the longitudinal wave that is reflected once at
the surface as shown in Fig. 5(b). 2SP wave is the wave
that has a mode conversion in the reflection as shown in
Fig. 5(c).
Calculated SAWs showed a positive (expansion)
unipolar pulse (this is expressed as þ), and was in goodagreement with the SAW of the observed waveform. Inthe observed waveform, the low frequency component
of SAW changed slightly between RL1 and RR1 due tothe velocity dispersion. Such a change was also repro-
duced in the calculated waveform. Moreover, the center
frequency of RL1 in the calculated waveform was 5.1
MHz, which agreed with the experimental result (4.9
MHz).
The bulk waves of P, 2S, SP, S2P, 2SP, 4S, and 5Swave were obtained in the calculated waveform and
those arrival times were in good agreement with the
arrival times expected from velocities. It proved that
the assignment for these ray trajectories was correct.
The polarities of bulk waves P, 2S, SP,. . ., were þ, )þ(a bipolar pulse which changes from negative to posi-
tive), and þ� � � They agreed with the polarities of ob-served bulk waves. The relative amplitude of typicalbulk waves to that of the SAW and its average value
were shown in Table 1. Relative amplitude of 2SP wave
was the largest in each case and they almost agreed with
each other (0.16 and 0.11 respectively). Moreover, the
average value was within a tolerance of 26%.
These good agreements between observed and cal-
culated data under thermoelastic condition proved the
validity of the calculation for the in-plane stress. More-over, this calculation will be useful for establishing a
guideline for the design of NDE of bearing balls using a
laser ultrasonic method.
Fig. 4. Calculated waveform (a) and observed waveform under ther-
moelastic condition (b) at propagation angle /1 ¼ 90�. Y-axis is nor-malized so that the amplitude of RL1 is 1.
Fig. 5. Ray trajectories of S and 3S waves (a), 2P wave (b), and 2SP
wave (c) at propagation angle /1 ¼ 90�.
4 S. Ishikawa et al. / Ultrasonics 41 (2003) 1–8
3.2. Ablation regime
We show the results of the laser-generated acoustic
wave displacements under ablation condition. Fig. 6
shows the calculated (a) and observed (b) waveforms at
propagation angle /1 ¼ 90�.Calculated SAW showed a bipole waveform that
became negative and then became positive ()þ). TheSAW was changed in phase by 90� with respect to theSAW under thermoelastic condition that has been
shown in Fig. 4. Such a change in phase was also ob-
served in the observed waveform. The center frequency
of RL1 in the calculated waveform was determined to beto 5.1 MHz, which was equal to the experimental result.
Bulk waves of P, S, 2S, 2P, SP, S2P, 2SP, 3S, 4S, and
5S waves were obtained at expected arrival times in thecalculated waveform. The polarities of bulk waves P, S,
2S,. . ., were þ, ), )� � � and they agreed with the polar-ities of observed bulk waves. Relative amplitude of S
wave was the largest in each case as shown in Table 1.
Although the calculated amplitude (0.25) was a little
larger than observed amplitude (0.15), the average value
was within a tolerance of 48%.
These agreements between observed and calculated
data under ablation condition proved the validity of the
calculation for the out-of-plane stress.
In addition, the tolerance of relative amplitude of
typical bulk waves as the average for ablation condition
(48%) was larger than that for thermoelastic condition(26%). The reason for this is that the in-plane stress
would effect the acoustic waves in the experiment of
ablation condition since there is a thermoelastic effect
even in the ablation condition, while we assumed only
the out-of-plane stress in the calculation of ablation
condition.
3.3. Comparison of acoustic waves excited by in-plane and
out-of-plane stresses
In this section, we compare the calculated acoustic
waves excited by the out-of-plane stress (a) and by the
in-plane stress (b) in Fig. 7 at propagation angle /1 ¼90�.
Table 1
The relative amplitude of typical bulk waves to that of the SAW under thermoelastic condition and ablation condition and its average value at
propagation angle /1 ¼ 90�P S 2S 2P 2SP 3S 4S Average
(a) cal. (thermo.) 0.045 – 0.059 – 0.16 – 0.043 0.044
(b) exp. (thermo.) 0.056 – 0.040 – 0.11 – 0.037 0.035
(a) cal. (ablation) 0.087 0.25 0.086 0.033 0.082 0.16 0.14 0.12
(b) exp. (ablation) 0.078 0.15 0.031 0.071 0.058 0.086 0.093 0.081
Fig. 6. Calculated waveform (a) and observed waveform under abla-
tion condition (b) at propagation angle /1 ¼ 90�. Y-axis is normalizedso that the amplitude of RL1 is 1.
Fig. 7. Calculated acoustic waves excited by the in-plane stress (a) and
by the out-of-plane stress (b) at propagation angle /1 ¼ 90�. Y-axis isnormalized so that the amplitude of RL1 is 1.
S. Ishikawa et al. / Ultrasonics 41 (2003) 1–8 5
While the SAW showed similar waveforms in each
case, bulk waves differed from each other. First, a larger
number of bulk waves were obtained for the out-of-
plane stress (b) than that for the in-plane stress (a). That
is, although S, 2P, and 3S wave were observed in (b),
they were not observed in (a). Secondly, The relative
amplitude of typical bulk waves to that of the SAW was
larger for the out-of-plane stress (b) than that for the in-plane stress (a) as shown in Table 2 except for 2SP wave.
That is, the relative amplitudes of P, 2S, and 4S wave
were 0.085, 0.087, and 0.14 for (b) and 0.037, 0.063,
0.046 for (a). The ratio of (b) to (a) as the average was
3.1.
Fig. 8 shows the calculated waveforms at propagation
angle /1 ¼ 0�. The relative amplitude of typical bulkwaves to that of the SAW was larger wave for the out-of-plane stress (b) than that for the in-plane stress (a) as
shown in Table 3 except for 3S. That is, the relative
amplitudes of 5S, 6S, and 7S waves were 0.11, 0.10, and
0.12 for (b) and 0.042, 0.047, and 0.10 for (a). The ratio
of (b) to (a) as the average was 1.67. The unassigned
bulk waves (B) were also larger in (b). As a result of
calculating the absolute value of the amplitude of the
bulk waves over the time range shown in Fig. 8, the
value for the out-of-plane stress was three times larger.
Next, we compare the waveforms after 14 ls passedfrom the excitation. As shown in Fig. 9(b), for the out-
of-plane stress, the bulk wave showed continuous
waveform over all time ranges. On the contrary, (a) for
the in-plane stress, the bulk wave showed sparse wave-
form. Moreover, the bulk waves for the out-of-planestress were larger in the relative amplitude as before.
Consequently, when the in-plane stress excited the
acoustic waves on a sphere, the bulk waves were more
suppressed than that in the case of the out-of-plane
stress. Moreover, when the out-of-plane stress excited
the acoustic waves on a sphere, the bulk waves after a
time showed continuous waveform over all time ranges,
which become a disturbance in the measurement be-
Fig. 8. Calculated acoustic waves excited by the in-plane stress (a) and
by the out-of-plane stress (b) at propagation angle /1 ¼ 0�. Y-axis isnormalized so that the amplitude of RL1, RR1 is 1.
Fig. 9. Calculated acoustic waves excited by the in-plane stress (a) and
by the out-of-plane stress (b) at propagation angle /1 ¼ 0�. Y-axis isnormalized so that the amplitude of RL1, RR1 is 1.
Table 2
The relative amplitude of typical bulk waves to that of the SAW for the in-plane stress and out-of-plane stresse and its average value at propagation
angle /1 ¼ 90�P S 2S 2P 2SP 3S 4S Average
(a) In-plane 0.037 – 0.063 – 0.15 – 0.046 0.042
(b) Out-of-plane 0.085 0.33 0.087 0.022 0.082 0.17 0.14 0.13
Table 3
The relative amplitude of typical bulk waves to that of the SAW for the
in-plane stress and out-of-plane stresse and its average value at prop-
agation angle /1 ¼ 0�3S 4S 5S 6S 7S Average
(a) In-plane 0.24 – 0.042 0.047 0.10 0.086
(b) Out-of-plane 0.20 0.19 0.11 0.10 0.12 0.144
6 S. Ishikawa et al. / Ultrasonics 41 (2003) 1–8
cause they would overlap the SAW. Therefore, it is
necessary for the ball SAW device to select a formation
of IDT and a piezo-electric material so that the in-plane
stress becomes dominant.
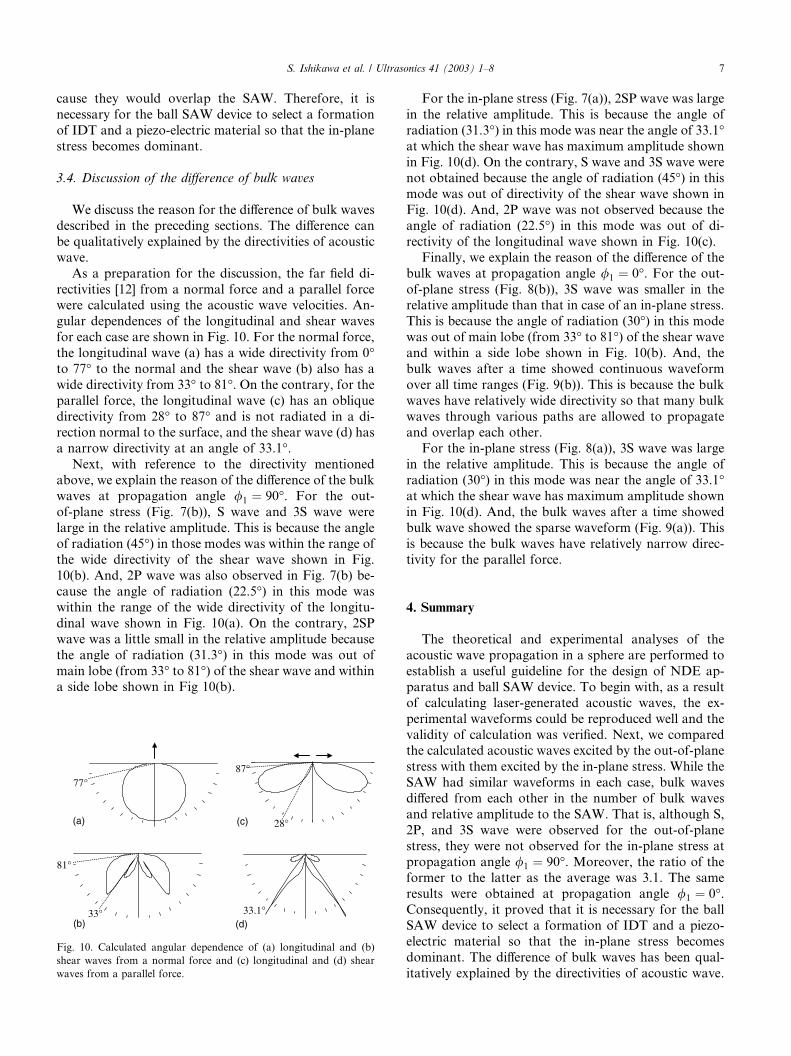
3.4. Discussion of the difference of bulk waves
We discuss the reason for the difference of bulk waves
described in the preceding sections. The difference can
be qualitatively explained by the directivities of acoustic
wave.
As a preparation for the discussion, the far field di-
rectivities [12] from a normal force and a parallel forcewere calculated using the acoustic wave velocities. An-
gular dependences of the longitudinal and shear waves
for each case are shown in Fig. 10. For the normal force,
the longitudinal wave (a) has a wide directivity from 0�to 77� to the normal and the shear wave (b) also has awide directivity from 33� to 81�. On the contrary, for theparallel force, the longitudinal wave (c) has an oblique
directivity from 28� to 87� and is not radiated in a di-rection normal to the surface, and the shear wave (d) has
a narrow directivity at an angle of 33.1�.Next, with reference to the directivity mentioned
above, we explain the reason of the difference of the bulk
waves at propagation angle /1 ¼ 90�. For the out-of-plane stress (Fig. 7(b)), S wave and 3S wave were
large in the relative amplitude. This is because the angle
of radiation (45�) in those modes was within the range ofthe wide directivity of the shear wave shown in Fig.
10(b). And, 2P wave was also observed in Fig. 7(b) be-
cause the angle of radiation (22.5�) in this mode waswithin the range of the wide directivity of the longitu-
dinal wave shown in Fig. 10(a). On the contrary, 2SP
wave was a little small in the relative amplitude because
the angle of radiation (31.3�) in this mode was out ofmain lobe (from 33� to 81�) of the shear wave and withina side lobe shown in Fig 10(b).
For the in-plane stress (Fig. 7(a)), 2SP wave was large
in the relative amplitude. This is because the angle of
radiation (31.3�) in this mode was near the angle of 33.1�at which the shear wave has maximum amplitude shown
in Fig. 10(d). On the contrary, S wave and 3S wave werenot obtained because the angle of radiation (45�) in thismode was out of directivity of the shear wave shown in
Fig. 10(d). And, 2P wave was not observed because the
angle of radiation (22.5�) in this mode was out of di-rectivity of the longitudinal wave shown in Fig. 10(c).
Finally, we explain the reason of the difference of the
bulk waves at propagation angle /1 ¼ 0�. For the out-of-plane stress (Fig. 8(b)), 3S wave was smaller in therelative amplitude than that in case of an in-plane stress.
This is because the angle of radiation (30�) in this modewas out of main lobe (from 33� to 81�) of the shear waveand within a side lobe shown in Fig. 10(b). And, the
bulk waves after a time showed continuous waveform
over all time ranges (Fig. 9(b)). This is because the bulk
waves have relatively wide directivity so that many bulk
waves through various paths are allowed to propagateand overlap each other.
For the in-plane stress (Fig. 8(a)), 3S wave was large
in the relative amplitude. This is because the angle of
radiation (30�) in this mode was near the angle of 33.1�at which the shear wave has maximum amplitude shown
in Fig. 10(d). And, the bulk waves after a time showed
bulk wave showed the sparse waveform (Fig. 9(a)). This
is because the bulk waves have relatively narrow direc-tivity for the parallel force.
4. Summary
The theoretical and experimental analyses of the
acoustic wave propagation in a sphere are performed to
establish a useful guideline for the design of NDE ap-
paratus and ball SAW device. To begin with, as a result
of calculating laser-generated acoustic waves, the ex-
perimental waveforms could be reproduced well and the
validity of calculation was verified. Next, we comparedthe calculated acoustic waves excited by the out-of-plane
stress with them excited by the in-plane stress. While the
SAW had similar waveforms in each case, bulk waves
differed from each other in the number of bulk waves
and relative amplitude to the SAW. That is, although S,
2P, and 3S wave were observed for the out-of-plane
stress, they were not observed for the in-plane stress at
propagation angle /1 ¼ 90�. Moreover, the ratio of theformer to the latter as the average was 3.1. The same
results were obtained at propagation angle /1 ¼ 0�.Consequently, it proved that it is necessary for the ball
SAW device to select a formation of IDT and a piezo-
electric material so that the in-plane stress becomes
dominant. The difference of bulk waves has been qual-
itatively explained by the directivities of acoustic wave.
Fig. 10. Calculated angular dependence of (a) longitudinal and (b)
shear waves from a normal force and (c) longitudinal and (d) shear
waves from a parallel force.
S. Ishikawa et al. / Ultrasonics 41 (2003) 1–8 7

In the future, we will make ball SAW devices with less
spurious bulk waves based on these results.
Appendix A
Notations: r: radial component in spherical polar
coordinates, vp: velocity of P wave, vs: velocity of Swave, k, l: Lam�ee’s constants, h ð¼ x=vpÞ: wavenumberfor P wave, k ð¼ x=vsÞ: wavenumber for S wave, x:angular frequency, Jl: spherical Bessel function of 1stkind, flðhrÞ ¼ Jlþ1=2=
ffiffiffiffiffihr
p, glðkrÞ ¼ Jlþ1=2=
ffiffiffiffiffikr
p.
Function of stress component on the surface: E
E ¼ E1 ¼E3 E5E4 E6
�������� ðA:1Þ
where,
E3 ¼ �kh2fl þ 2ld2fldr2
;
E4 ¼ 2ld
drflr
� �;
E5 ¼ 2llðlþ 1Þd
drglr
� �;
E6 ¼ l 2d
dr1
rdðrglÞdr
� �þ k2gl
� �:
9>>>>>>>>>>>=>>>>>>>>>>>;
ðA:2Þ
Functions that provide radial displacement: U1l, U2l
U1lðrÞ ¼dfldr
E6 � lðlþ 1Þ glrE4; ðA:3Þ
U2lðrÞ ¼ � dfldr
E5 þ lðlþ 1Þ glrE3: ðA:4Þ
Correction: Since errors were found out in Refs. [8,9],we will correct their errors.
1. Eq. (2.12) in Ref. [8].Before correction:
Cmn ¼
�� bEEm
n ld
drfnr
� �þ bFF m
n
�� kh2fn þ 2l
d2fndr2
���E1
ðA:5Þ
After correction:
Cmn ¼
�� bEEm
n 2ld
drfnr
� �þ bFF m
n
�� kh2fn þ 2l
d2fndr2
���E1
ðA:6Þ2. Eq. (A.1.3) in Ref. [9].
Before correction:
bCCmn ¼ 2nþ 1
2nðnþ 1Þðn� mÞ!ðnþ mÞ!
Z 1
�1
1
sin hd
dhsin hV mðcos hÞf g
�
þ mW m0 ðcos hÞ�Pmn ðcos hÞð� sin hÞdh ðA:7Þ
After correction:
bCCmn ¼ � 2nþ 1
2nðnþ 1Þðn� mÞ!ðnþ mÞ!
�Z 1
�1
1
sin hd
dhsin hV mðcos hÞf g
�þ mW m0 ðcos hÞ
�� Pm
n ðcos hÞð� sin hÞdh ðA:8Þ
References
[1] K. Yamanaka, H. Cho, Y. Tsukahara, Appl. Phys Lett. 76 (2000)
2797.
[2] K. Yamanaka, H. Cho, Y. Tsukahara: Tech. Rep. IEICE,
US2000-14, 2000, p. 49.
[3] S. Ishikakwa, H. Cho, K. Yamanaka, N. Nakaso, Y. Tsukahara,
Jpn. J. Appl. Phys. 40 (2001) 3623.
[4] Y. Tsukahara, N. Nakaso, H. Cho, K. Yamanaka: Tech. Rep.
IEICE. US2000-55, 2000, p. 31.
[5] Y. Tsukahara, N. Nakaso, H. Cho, K. Yamanaka, Appl. Phys.
Lett. 77 (2000) 2926.
[6] S. Ishikakwa, H. Cho, K. Yamanaka, N. Nakaso, Y. Tsukahara:
Tech. Rep. IEICE. US2001-46, 2001, p. 35.
[7] W.R. Smith, H.M. Gerard, J.H. Collins, T.M. Reeder, H.J. Shaw,
IEEE Trans. Microwave Theory & Tech. MTT-17 11 (1969) 856.
[8] Y. Sato, T. Usami, Geophys. Mag. 31 (1962) 49.
[9] Y. Sato, Bull. Earthq. Res. Inst. 27, 1–9.
[10] E.R. Lapwood, T. Usami, in: Free Oscillations of the Earth,
Cambridge University Press, 1981, pp. 169–170.
[11] W.H. Press, S.A. Teukolsky, W.T. Vetterling, B.P. Flannery, in:
Numerical recipes in FORTRAN 77, Cambridge University Press,
1986, p. 402.
[12] C.B. Scruby, L.E. Drain, in: Laser Ultrasonics Techniques and
Applications, Adam Hilger, Bristol Philadelphia and New York,
1990, pp. 228–273.
8 S. Ishikawa et al. / Ultrasonics 41 (2003) 1–8