Embed Size (px)
Citation preview
Journal of Ceramic Processing Research. Vol. 14, No. 5, pp. 627~631 (2013)
627
J O U R N A L O F
CeramicProcessing Research
Analysis of the phase transformation of aluminum formate Al(O2CH)3 to
α-alumina by Raman and infrared spectroscopy
Simón Yobanny Reyes-Lópeza,*, Rosa Saucedo Acuñaa, Rigoberto López-Juárezb and Juan Serrato Rodríguezc
aDepartamento. de Ciencias Químico Biológicas, Instituto de Ciencias Biomédicas, Universidad Autónoma de Ciudad Juárez.
Anillo Envolvente del PRONAF y Estocolmo s/n, C.P. 32300,Cd. Juárez Chih, MéxicobInstituto de Investigaciones en Materiales, Universidad Nacional Autónoma de México, Ciudad Universitaria, A.P. 70-360,
C.P. 04510, México D.F, MéxicocInstituto de Investigaciones Metalúrgicas, Universidad Michoacana de San Nicolás de Hidalgo, Santiago Tapia 403, C.P.
58000, Morelia, Mich, México
A new simplified route to prepare crystalline α-alumina powders is proposed from the decomposition of aluminum formateAl(O2CH)3 precursor following a process of gelation of Al(O2CH)3 in an aqueous medium. Heat treated powders werecharacterized by XRD, Raman and infrared spectroscopy showing the presence of η-Al2O3 at 1000 oC and the transformationto α-Al2O3 at 1100 oC, where SEM images of α-Al2O3 reveled an size of 1-2 μm by the aggregated particles, and TEM imagesconfirm a particles size of 200-300 nm. By other hand BET study showed that the specific surface area of η-Al2O3 and the α-Al2O3 obtained is higher than the specific surface area reported for these materials (until 118 m2/g), ratify that this new routeprocess at low temperature promote to obtain the powers with an excellent superficial area.
Key words: α-alumina, Aluminum formate, Raman, Infrared spectroscopy.
Introduction
The more important polymorphs of alumina are γ-
AlOOH, η-Al2O3 and α-Al2O3, which γ-Al2O3 and α-
Al2O3 are commonly used as adsorbents, catalysts and
catalyst supports. The main difference between the
phases can be explained by the distribution of oxygen
sublattice into the interstitial sites. The α-Al2O3 is
particularly stable thanks to the selective position of
oxygen sublattice in octahedral sites instead of being in
both tetrahedral and octahedral sites as in the case of
the metastable phases [1-3].
Conventional processes for synthesizing α-Al2O3
involve different inconvenient: mechanical milling
requires extensive milling time where is easy introduces
impurities [4], vapor phase reaction demands high
temperature up to 1200 oC [5], spray drying and spray
pyrolysis, and precipitation methods are complicated
and need long time of reaction [6-9], hydrothermal and
combustion methods needs high temperatures and
pressures, while combustion method obtains hard
aggregated powder [10, 11]. For these reasons, actually
the efforts are being made to develop new processing
routes to produce high quality alumina as sol-gel based
on molecular precursors and polymer precursor methods.
The disadvantage of this sol-gel method is that the
metal alkoxide raw material is expensive and the
gelation period is so long [12], while in the case of
chemical synthesis, the process is particularly simple,
safe and rapid, where the main advantages are energy
and time savings. This quick, straightforward process
can be used to synthesize oxide ceramic powders
showing high purity and crystallinity in a broad range
of particle size [7]. The present study describes a
simple and innovative approach for the synthesis of
crystalline α-alumina powders involving the use of the
metal organic precursor aluminum formate Al(O2CH)3
the advantage of this organometallic precursor is that
its gelation property permit to obtain fragile ag-
glomerates and its presence reduces the temperature
of α-alumina formation [7]. Decomposition of the
aluminum formate precursor, phase transformations
and morphology of the synthesized alumina powders
obtained were analyzed by the several methods of
XRD, MET, SEM, Raman and IR spectroscopy
techniques to show clearly the alumina phase transitions.
Material and Methods
Aluminum formate Al(O2CH)3 was synthesized by
chemical synthesis described by Reyes et. al, involving
a mixture of aluminum with formic acid using mercuric
chloride as catalyst to obtain the aluminum formate
solution which was spray dried to produce fine
granulated metal-organic precursor [7]. The route for
*Corresponding author: Tel : + 52(656)688-2100 Ext. 1989Fax: +52(656)688-1864E-mail: [email protected]; [email protected]
628 Simón Yobanny Reyes-López, Rosa Saucedo Acuña, Rigoberto López-Juárez and Juan Serrato Rodríguez
the synthesis of crystalline α-alumina involves the
dissolution of the precursor aluminum formate in water
using a magnetic stirrer. After it, the final solution was
keeping stirred until it was heated to obtain a white gel.
This gel was transferred to a closed platinum crucible
to put in a furnace up to 1100 oC at rate of 5 Kminute−1,
obtaining a blackish voluminous fluffy solid product.
Finally, this product was calcined at 900 oC for 2 hrs to
form a white powder.
To the follow the phase transformation of the pre-
cursor, 10 mg of sample was run on a thermal analysis
instrument (Q600, DSC/TGA, TA Instruments), the
heating rate was 10 Kminute−1 up to 1400 oC, with a
nitrogen gas flow of 100 cm3/min. Precursor and the
powders obtained were analyzed using an attenuated
total reflection (ATR) technique fitted with a Fourier
transform (The TENSOR™ 27 series FT-IR spec-
trometer, ZnSe crystal, Bruker Optics Inc.), and a
Raman Spectra (LabRam, Horiba) with an emission
line of 633 nm from He-Ne laser.
The specific surface area of calcined samples was
determined by nitrogen sorption according to single
point BET method using a Quantacrome apparatus.
Microstructure of the calcined powders was studied by
transmission electron microscopy (TEM, Phillips
TECNAI F20 super Twin, at 200 kV) and SEM (Jeol
JSM-6400 SEM, at 15 kV coupled with EDS detector
Bruker AXS Inc. XFlash 4010).
Results and Discussion
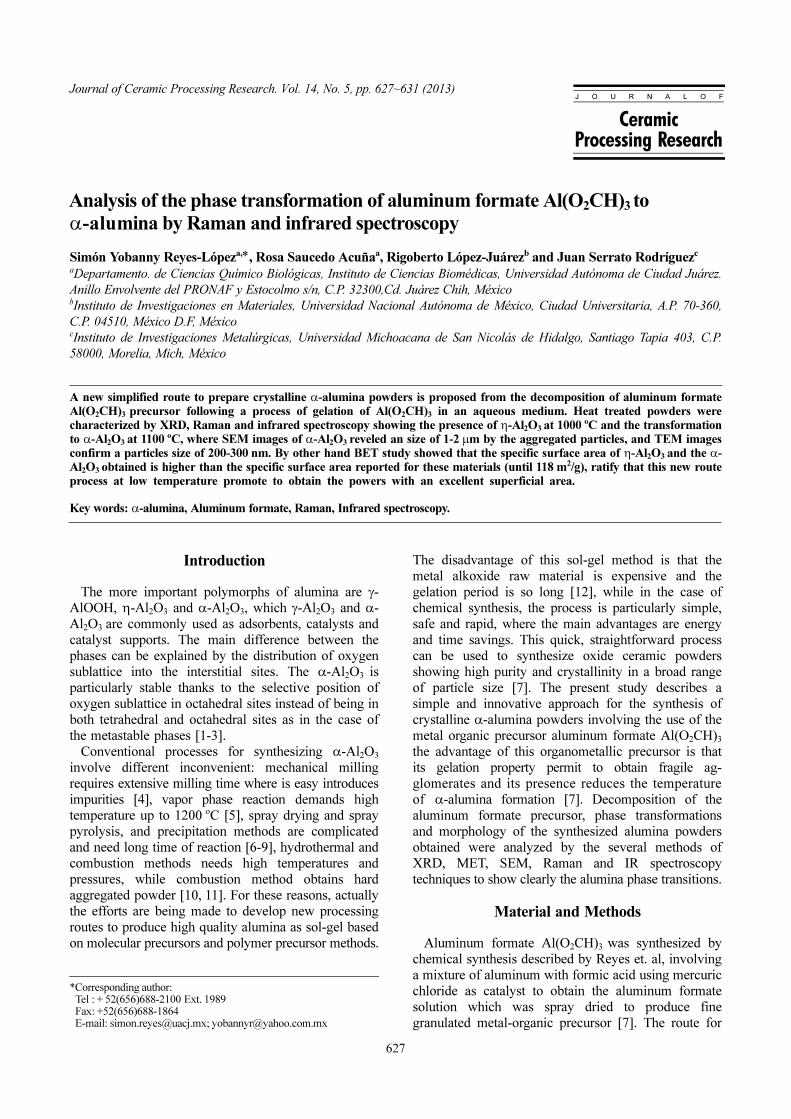
Thermal behavior of the gel conforming by aluminum
formate and water is shown in Fig. 1, where the TGA
line corresponding to the gel decomposition exhibit a
total ceramic yield of 31.20 % w, where this result
corresponds to the total of Al2O3 formed, with the
transformation process to α-alumina. The rest 67.80%w
correspond to the water and carbon dioxide losted. The
DTA line in Fig. 1 corresponding to the gel decom-
position shows a similar curve to the decomposition of
the precursor alone reported by Reyes et al [7]. This
DTA line reveals too the presence of three endotherm
peaks (68, 236 and 333 oC), corresponding to evaporation
of absorbed water and the removal of organics according
with the reactions (1), (2) and (3) respectively. At
942 oC the line exhibits an exothermic peak cor-
responding to the crystallization process of η-alumina,
other endothermic peak at 1080 oC refers the formation
of α-alumina, and finally the exothermic signal at
1261 oC is related with the crystallization of α-alumina.
Al2(O2CH)3−−−−−−→Al(OH)(O2CH)2 + CO (1)
2Al(OH)(O2CH)2−−−−−−→Al2O(O2CH)4 + H2O (2)
Al2O(O2CH)4−−−−−−→Al2O3 + 4CO + 2H2O (3)
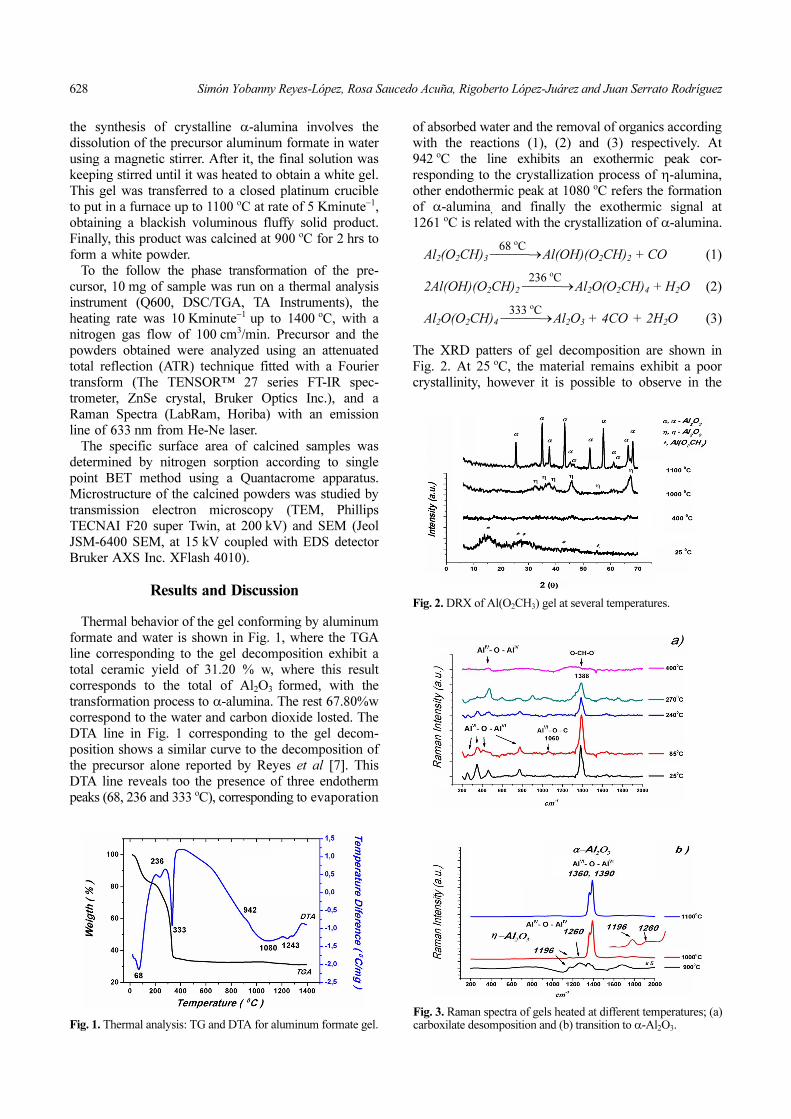
The XRD patters of gel decomposition are shown in
Fig. 2. At 25 oC, the material remains exhibit a poor
crystallinity, however it is possible to observe in the
68oC
236oCFig. 1. Thermal analysis: TG and DTA for aluminum formate gel.
Fig. 2. DRX of Al(O2CH3) gel at several temperatures.
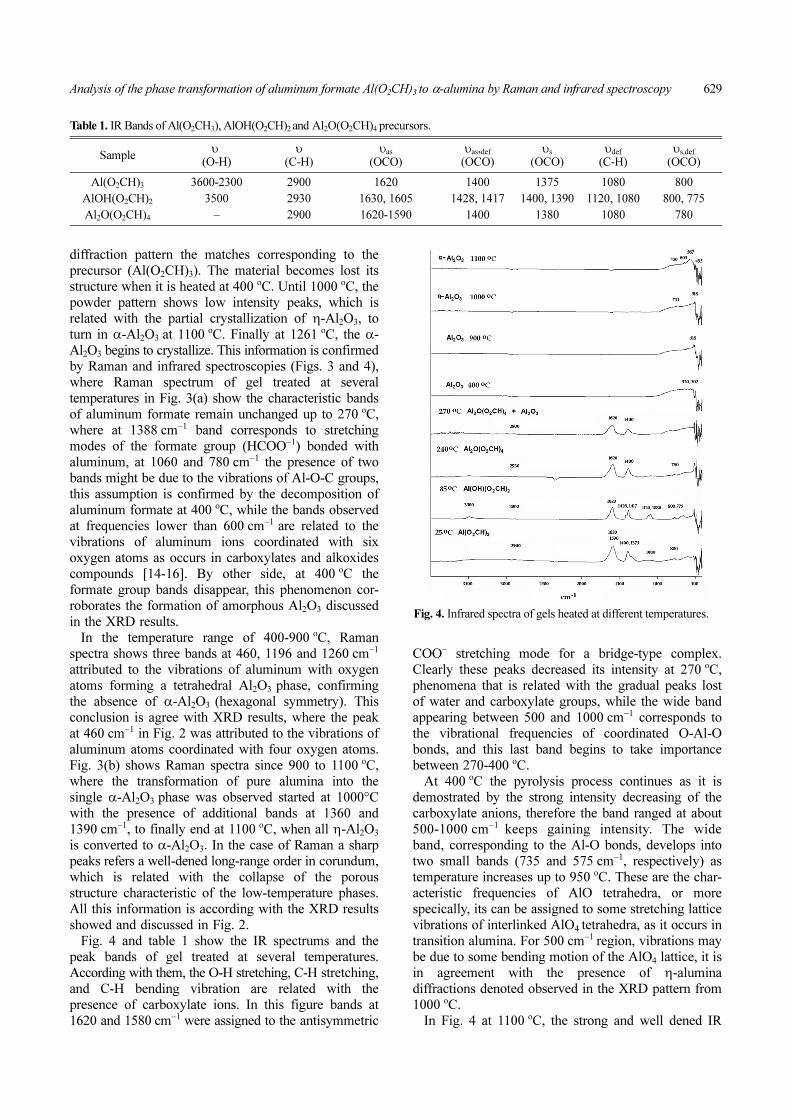
Fig. 3. Raman spectra of gels heated at different temperatures; (a)carboxilate desomposition and (b) transition to α-Al2O3.
68 oC
236 oC
333 oC
Analysis of the phase transformation of aluminum formate Al(O2CH)3 to α-alumina by Raman and infrared spectroscopy 629
diffraction pattern the matches corresponding to the
precursor (Al(O2CH)3). The material becomes lost its
structure when it is heated at 400 oC. Until 1000 oC, the
powder pattern shows low intensity peaks, which is
related with the partial crystallization of η-Al2O3, to
turn in α-Al2O3 at 1100 oC. Finally at 1261 oC, the α-
Al2O3 begins to crystallize. This information is confirmed
by Raman and infrared spectroscopies (Figs. 3 and 4),
where Raman spectrum of gel treated at several
temperatures in Fig. 3(a) show the characteristic bands
of aluminum formate remain unchanged up to 270 oC,
where at 1388 cm−1 band corresponds to stretching
modes of the formate group (HCOO−1) bonded with
aluminum, at 1060 and 780 cm−1 the presence of two
bands might be due to the vibrations of Al-O-C groups,
this assumption is confirmed by the decomposition of
aluminum formate at 400 oC, while the bands observed
at frequencies lower than 600 cm−1 are related to the
vibrations of aluminum ions coordinated with six
oxygen atoms as occurs in carboxylates and alkoxides
compounds [14-16]. By other side, at 400 oC the
formate group bands disappear, this phenomenon cor-
roborates the formation of amorphous Al2O3 discussed
in the XRD results.
In the temperature range of 400-900 oC, Raman
spectra shows three bands at 460, 1196 and 1260 cm−1
attributed to the vibrations of aluminum with oxygen
atoms forming a tetrahedral Al2O3 phase, confirming
the absence of α-Al2O3 (hexagonal symmetry). This
conclusion is agree with XRD results, where the peak
at 460 cm−1 in Fig. 2 was attributed to the vibrations of
aluminum atoms coordinated with four oxygen atoms.
Fig. 3(b) shows Raman spectra since 900 to 1100 oC,
where the transformation of pure alumina into the
single α-Al2O3 phase was observed started at 1000°C
with the presence of additional bands at 1360 and
1390 cm−1, to finally end at 1100 oC, when all η-Al2O3
is converted to α-Al2O3. In the case of Raman a sharp
peaks refers a well-dened long-range order in corundum,
which is related with the collapse of the porous
structure characteristic of the low-temperature phases.
All this information is according with the XRD results
showed and discussed in Fig. 2.
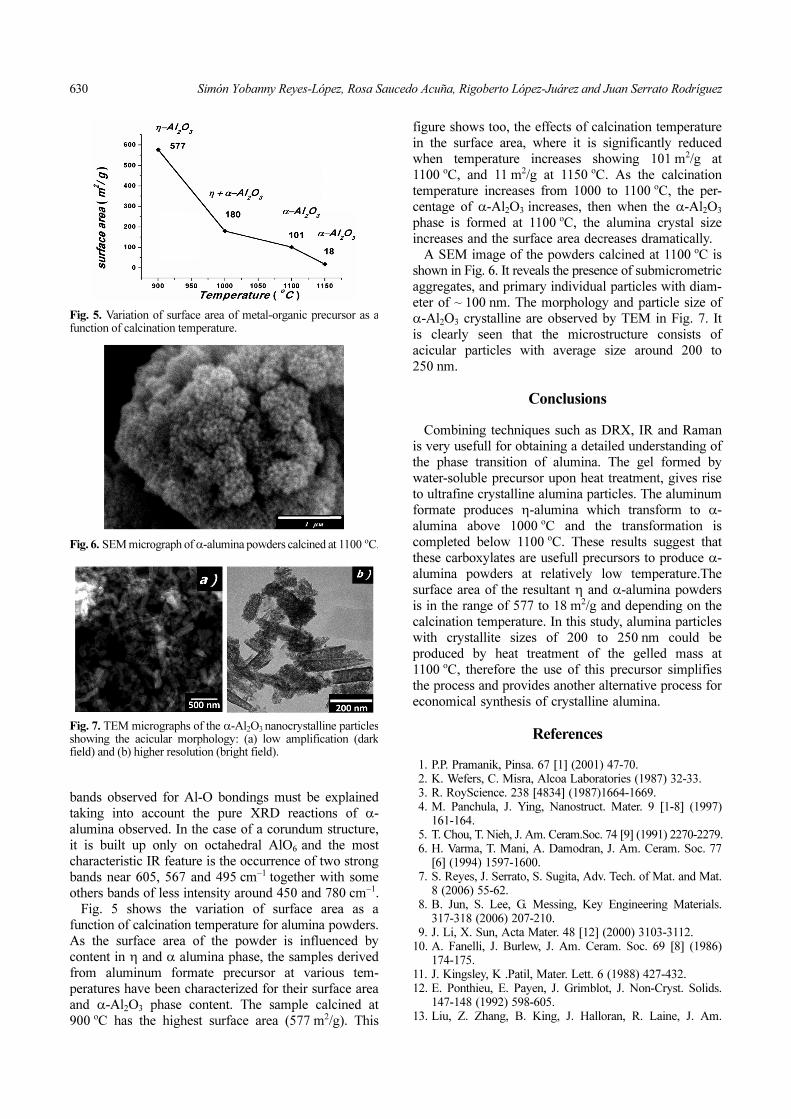
Fig. 4 and table 1 show the IR spectrums and the
peak bands of gel treated at several temperatures.
According with them, the O-H stretching, C-H stretching,
and C-H bending vibration are related with the
presence of carboxylate ions. In this figure bands at
1620 and 1580 cm−1 were assigned to the antisymmetric
COO− stretching mode for a bridge-type complex.
Clearly these peaks decreased its intensity at 270 oC,
phenomena that is related with the gradual peaks lost
of water and carboxylate groups, while the wide band
appearing between 500 and 1000 cm−1 corresponds to
the vibrational frequencies of coordinated O-Al-O
bonds, and this last band begins to take importance
between 270-400 oC.
At 400 oC the pyrolysis process continues as it is
demostrated by the strong intensity decreasing of the
carboxylate anions, therefore the band ranged at about
500-1000 cm−1 keeps gaining intensity. The wide
band, corresponding to the Al-O bonds, develops into
two small bands (735 and 575 cm−1, respectively) as
temperature increases up to 950 oC. These are the char-
acteristic frequencies of AlO tetrahedra, or more
specically, its can be assigned to some stretching lattice
vibrations of interlinked AlO4 tetrahedra, as it occurs in
transition alumina. For 500 cm−1 region, vibrations may
be due to some bending motion of the AlO4 lattice, it is
in agreement with the presence of η-alumina
diffractions denoted observed in the XRD pattern from
1000 oC.
In Fig. 4 at 1100 oC, the strong and well dened IR
Fig. 4. Infrared spectra of gels heated at different temperatures.
Table 1. IR Bands of Al(O2CH3), AlOH(O2CH)2 and Al2O(O2CH)4 precursors.
Sampleυ
(Ο-Η)υ
(C-H)υas
(OCO)υas,def
(OCO)υs
(OCO)υdef
(C-H)υs,def
(OCO)
Al(O2CH)3 3600-2300 2900 1620 1400 1375 1080 800
AlOH(O2CH)2 3500 2930 1630, 1605 1428, 1417 1400, 1390 1120, 1080 800, 775
Al2O(O2CH)4 − 2900 1620-1590 1400 1380 1080 780
630 Simón Yobanny Reyes-López, Rosa Saucedo Acuña, Rigoberto López-Juárez and Juan Serrato Rodríguez
bands observed for Al-O bondings must be explained
taking into account the pure XRD reactions of α-
alumina observed. In the case of a corundum structure,
it is built up only on octahedral AlO6 and the most
characteristic IR feature is the occurrence of two strong
bands near 605, 567 and 495 cm−1 together with some
others bands of less intensity around 450 and 780 cm−1.
Fig. 5 shows the variation of surface area as a
function of calcination temperature for alumina powders.
As the surface area of the powder is influenced by
content in η and α alumina phase, the samples derived
from aluminum formate precursor at various tem-
peratures have been characterized for their surface area
and α-Al2O3 phase content. The sample calcined at
900 oC has the highest surface area (577 m2/g). This
figure shows too, the effects of calcination temperature
in the surface area, where it is significantly reduced
when temperature increases showing 101 m2/g at
1100 oC, and 11 m2/g at 1150 oC. As the calcination
temperature increases from 1000 to 1100 oC, the per-
centage of α-Al2O3 increases, then when the α-Al2O3
phase is formed at 1100 oC, the alumina crystal size
increases and the surface area decreases dramatically.
A SEM image of the powders calcined at 1100 oC is
shown in Fig. 6. It reveals the presence of submicrometric
aggregates, and primary individual particles with diam-
eter of ~ 100 nm. The morphology and particle size of
α-Al2O3 crystalline are observed by TEM in Fig. 7. It
is clearly seen that the microstructure consists of
acicular particles with average size around 200 to
250 nm.
Conclusions
Combining techniques such as DRX, IR and Raman
is very usefull for obtaining a detailed understanding of
the phase transition of alumina. The gel formed by
water-soluble precursor upon heat treatment, gives rise
to ultrafine crystalline alumina particles. The aluminum
formate produces η-alumina which transform to α-
alumina above 1000 oC and the transformation is
completed below 1100 oC. These results suggest that
these carboxylates are usefull precursors to produce α-
alumina powders at relatively low temperature.The
surface area of the resultant η and α-alumina powders
is in the range of 577 to 18 m2/g and depending on the
calcination temperature. In this study, alumina particles
with crystallite sizes of 200 to 250 nm could be
produced by heat treatment of the gelled mass at
1100 oC, therefore the use of this precursor simplifies
the process and provides another alternative process for
economical synthesis of crystalline alumina.
References
1. P.P. Pramanik, Pinsa. 67 [1] (2001) 47-70.2. K. Wefers, C. Misra, Alcoa Laboratories (1987) 32-33.3. R. RoyScience. 238 [4834] (1987)1664-1669.4. M. Panchula, J. Ying, Nanostruct. Mater. 9 [1-8] (1997)
161-164.5. T. Chou, T. Nieh, J. Am. Ceram.Soc. 74 [9] (1991) 2270-2279.6. H. Varma, T. Mani, A. Damodran, J. Am. Ceram. Soc. 77
[6] (1994) 1597-1600.7. S. Reyes, J. Serrato, S. Sugita, Adv. Tech. of Mat. and Mat.
8 (2006) 55-62.8. B. Jun, S. Lee, G. Messing, Key Engineering Materials.
317-318 (2006) 207-210.9. J. Li, X. Sun, Acta Mater. 48 [12] (2000) 3103-3112.
10. A. Fanelli, J. Burlew, J. Am. Ceram. Soc. 69 [8] (1986)174-175.
11. J. Kingsley, K .Patil, Mater. Lett. 6 (1988) 427-432.12. E. Ponthieu, E. Payen, J. Grimblot, J. Non-Cryst. Solids.
147-148 (1992) 598-605.13. Liu, Z. Zhang, B. King, J. Halloran, R. Laine, J. Am.
Fig. 5. Variation of surface area of metal-organic precursor as afunction of calcination temperature.
Fig. 6. SEM micrograph of α-alumina powders calcined at 1100 oC.
Fig. 7. TEM micrographs of the α-Al2O3 nanocrystalline particlesshowing the acicular morphology: (a) low amplification (darkfield) and (b) higher resolution (bright field).

Analysis of the phase transformation of aluminum formate Al(O2CH)3 to α-alumina by Raman and infrared spectroscopy 631
Ceram. Soc. 79 (1996) 385-394.14. T. Assih, A. Ayral, M. Abenoza, J. Phalippou, Journal f
Materials Science. 23 (1988) 3326-3331.15. F. Touati, N. Gharbi, P. Colomban, Journal of Materials
Science. 35 (2000) 1565-1570.16. F. Mirjalili, L. Chuah and H. Mohamad, Journal of Ceramic
Processing Research. 12 [6] (2011) 738-741.