Embed Size (px)
Citation preview
1
2
Analyst Conference Meeting
Financial Reports
FY 2015
Avgol Industries 1953 Ltd.
Confidential, March 17th
2016

3
Analyst Conference I Capital Markets Analysts Conference
:משפטיתהבהרה
הצגתבמהלךשיימסראחרמידעוכלבמצגתהכלולהמידע."(החברה"–להלן)מ"בע1953תעשיותאבגולחברתי"עהוכנהזומצגת
לשיקולתחליףמהווהלאוכן,דעתחוותאוהמלצהמהווהואינו,השקעההחלטתלקבלתבסיסמהווהאינו"(המידע"–להלן)המצגת
.לעדכנםאו/והנתוניםאתלתתלהמשיךחייבתאינהוהחברההנתוניםבהצגתהנוחותלצורךניתןהמידע.פוטנציאלימשקיעשלדעת
ושלהחברהפעילותשלמלאהתמונהלקבלמנתועל,בלבדתמציתהינוהחברהשלהפעילותלניתוחהקשורבכלבמצגתהאמור
.ולבורסהע"לנילרשותהחברהשלהמלאיםבדיווחיםלעייןיש,החברהמתמודדתעימםהסיכונים
העלוליםכלשהםהפסדיםאו/ולנזקיםבאחריותתישאלאוהיא,זובמצגתהנכללהמידעלדיוקאולשלמותאחראיתאינההחברה
.גובר,רשמייםבפרסומיםאו/והחברהבספריהאמור,מקרהבכל.זהבמידעמהשימושכתוצאהלהיגרם
אולאירועיםהמתייחסיםואומדניםהערכות,מטרות,תחזיותשל,ערךניירותבחוקכהגדרתו,עתידפניצופהמידעכוללתהמצגת
.החברהשלהסובייקטיביתהערכתהעלרקמבוססוהוא,החברהבשליטתואינהודאיתאינההתממשותםאשר,עתידייםענייניםבשליטתמצוייםאינםוהםמראשלהעריכםניתןלאאשרמגורמיםתושפעעתידפניהצופההמידעשלהתממשותואיאו/והתממשותו
שלבפועלתוצאותיהכיוודאותכלשאיןהרי,סבירותהינן,במצגתכמוצג,שציפיותיהמאמינהשהחברהאףעלולפיכךהחברה
.עתידפניצופהבמידעשהוצגומאלושונותלהיותעשויותוהןאלהלציפיותבהתאםתהיינהבעתידהחברה
This presentation is based on the Company financial reports.
There is no data in this presentation that isn’t presented in the public financial reports.
If there is any discrepancy between this presentation and the data in the financial report that
was issued to the Israeli SEC and the TASE, the valid data is the one which appears in the
formal reports.
This presentation is provided for information and as a matter of record only. It does not
constitute an offer to sell or a solicitation of an offer to buy or sell securities or other financial
instruments in any jurisdiction or any advice or recommendation with respect to such
securities or other financial instruments of the company.

4
Analyst Conference I Contents
4. Financial highlights
6. Balance Sheet
2. The Hygiene Market
3. Key highlights
5. Cash Flow
1. Company Overview
7. Our Strengths

5
Analyst Conference I Presentation Team
CEO
Mr. David Meldram
Deputy CEO & CFO
Mr. Shachar RachimChief Operating
Officer
Mr. David Hodgetts
VP Finance
Mr. Lior Giladi

6
Avgol
A Leading Global Manufacturer Focused On Spunmelt Nonwoven Fabrics, Primarily for The Hygiene Industry
Analyst Conference I Avgol

7
HFH BV 51%
Avgol Industries (1953) Ltd.
LeumiPartners
20%
Public29%
Analyst Conference I Shareholders Structure

8
1953 Company founded (producing industrial gases)
1988 Began production of Spunbond Nonwovens in Israel
2001 Acquired USA (North Carolina) Mocksville plant
2004 Bought a 50% interest in a local Nonwovens manufacturing plant in China
(gradually increasing our stake to 97% as of today)
2007 Listed on the Israeli Stock Exchange (Tel – Aviv 100)
2008 Started greenfield production plant in Russia, Tula region.
2012 Acquired land in Nagpur India.
2012 Ethemba Capital acquired a controlling stake from IPE and the founders May
2015 Russia second line (R4) began commissioning in May 2015.
2015-2016 Line 5 (R4) project in USA plan to begin commissioning in Q4-16.
2016- 2017 New plant in Dimona (Israel) with new line (R4) in H1-17
We have grown our business through Investments and Acquisitions
Analyst Conference I Milestones in Avgol’s Growth

9
Analyst Conference I An Extremely Focused Strategy
Primarily targeting the Hygiene market, covering the Baby, Femcare and
the fast growing Adult Incontinence market
A single technology – Spunmelt
One main raw material, PP, with increasing addition of PE in Soft solutions
A single Line Equipment vendor – Reicofil
A Pioneering company, with a strategy of Global Presence,
Cost Leadership and Technology Superiority
Deployed globally, both in developed and undeveloped markets
The benefit to our global customers - we develop once, deploy in multiple locations simultaneously and uniformly

10
Analyst Conference I The Hygiene Market - The Players
Around 50 manufacturers in the market with 173 lines
Graph below presents the available footprint in K Metric Ton of the Top 15
players:
* in Q3-2015 PGI was acquired by Berry plastics )“BERY”( .
** Avgol - not including new lines that will be added from 2015 and on
Source: Price Hana 2014

11
Analyst Conference I The Hygiene Market - NW Manufacturers
Presence
-
100
200
300
400
500
600
Africa Asia -Pacific
China MiddeEast
Northamerica
SouthAmerica
SouthernAsia
West, East& Central
Europe
Other PGI Fitesa Avgol Toray Fibertex Gulsan
Pegas Mitsui Asahi-Kasei CHTC Jiahua SAAF Global NW
Source: Price Hana 2014
In K Metric Ton

12
Analyst Conference I Market Opportunities
11,951 11,006
7,522
23,782
16,414
11,376
8,384
28,836
Asia-Pacific North America South and CentralAmerica
EMEA
Baby Care Market (MSQM)
2015 2019
9,394
4,823
2,052
9,958
13,327
5,763
2,908
12,341
Asia-Pacific North America South and CentralAmerica
EMEA
Adult Incontinence-Fem Care Market (MSQM )
2015 2019
Highlights:
Growth market driven by 2 factors:
1. The expected economic developments of the
undeveloped markets and the increase in GDP
per capita especially in: South – America, Africa
and Asia-Pacific (countries like China and India).
2. The expectation of longer life for the world
population, that will affect positively the Adult
incontinence market.
Its important to note that this market research was
published before the permission for the second child
in China.
RegionHygiene Market
2015 - MSQM
Hygiene Market
2019 - MSQM
Avg Yearly
Growth
Asia-Pacific 21,345 29,741 9.8%
North America 15,829 17,140 2.1%
South and Central America 9,574 11,292 4.5%
EMEA 33,740 41,177 5.5%
Total Hygiene market 80,488 99,349 5.9%
Source: Price Hana 2014

13
Analyst Conference I Our Mission
To Be the Hygiene Market’s Preferred Supplier
High Quality Focus
Uncompromising Reliability
High level of Flexibility
Competitiveness
Today
Identify & Develop the Next Generations
of Solutions & Products that will allow
our customers to lead their markets
Tomorrow
14
Value Engineered Fabrics
Lowest gauge basis weight, lightweight fabrics with maximum performance
Focused on Softness
A leading portfolio of soft fabric solutions for the hygiene market
Cost Effective Converting
Lowest weight fabrics to maximize converting performance
Enhanced Fabric Performance
A wide variety of treatment options for superior product performance
Fluid Management Design
Customized product configurations and treatment packages to meet specific customer needs
Analyst Conference I Avgol’s Advantages

15
The global baby diaper market is today worth an estimated $53 Billion* growing at CAGR of 5.5%
to 2022 with emerging regional consumer trends driving baby diaper innovation.
* According to P&S Market Research
Analyst Conference I Baby Care Market
Why is the baby diaper market booming?
A growing global population despite birthrates dropping and the rise of the middle class in developing
countries is fueling baby product sales
Parents want the very best for their children and there is increased awareness of the need for personal
hygiene
An increasing number of working women who are more likely to use disposable diapers
Delayed toilet training of children in developed countries is growing online purchase of baby diapers – in
1957, approximately 92% of children were toilet trained by 18 months of age, compared to 2015 in which
only 65% of children were reported to be toilet trained by the age of 36 months
On an average, a baby undergoes diaper change 5 or more times a day

16
Analyst Conference I Adult Incontinence Market
Today, the adult incontinence products market is estimated at $7 billion with a projected growth
rate of 7-9% per annum to 2020.
* According to P&S Market Research
Why is the adult incontinence products market growing?
Rapid expansion owing to the aging population, economic affluence and improvement of
healthcare systems
Consumers today expect to maintain an active lifestyle, despite bladder and bowel concerns
Women currently comprise about 86% of the market, but men are rapidly becoming a more
important demographic
Consumers are becoming more comfortable with talking about the topic and therefore seeking out
new product solutions
Rise of key brands in the adult incontinence area promoting via television and editorial – including
light incontinence products, male products and new odour control solutions

17
Analyst Conference I Global Footprint
80%100%100%
Global company with 14 production lines, located in 4 sites.
Employs ~700 employees around the world.
* New line in Russia began producing commercially in May 2015.
** New 5TH line in USA will add 18,000MT as from Q4-2016
*** New line in Israel (Dimona) will add 18,000MT as from H1-2017
ChinaMarket: Local & Asia
Capacity 39,000 ton
3 Lines
RussiaMarket: East Europe
Capacity 28,000 ton
2 Lines*IsraelMarket: EMEA
Capacity 28,000 ton
5 Lines
Dimona***
Capacity: 18,000 ton
1 Line
USAMarket: North America
Capacity 60,000 ton
4 Lines **

18
Analyst Conference I Global Capacity Footprint – Thousands Metric Ton
28 33 33 33 33 33 33 31 31 31 28 28 28 28
15
3045 45 45 45 45 45 45
60 60 60 6078
9 9 9 924 24
39 39 39 39
39
10 10
11 11
11 11 1129
29
2003 2004 2005 2006 2007 2008 2009 2010 2011 2012 2013 2014 2015 2016
EU-IL NA-US APAC-CH E.EU-RU
Line 2 in Israel is inactive since 2012 and is fully depreciated
Russia 2nd line adds 18,000MT from Q2-2015
USA 5TH line adds 18,000MT from Q4-2016
New line in Israel (Dimona) will add 18,000MT as from H1-2017

Analyst Conference – North America new production line
Floor laid
Pits completed
Contractors on site
Plan ontime
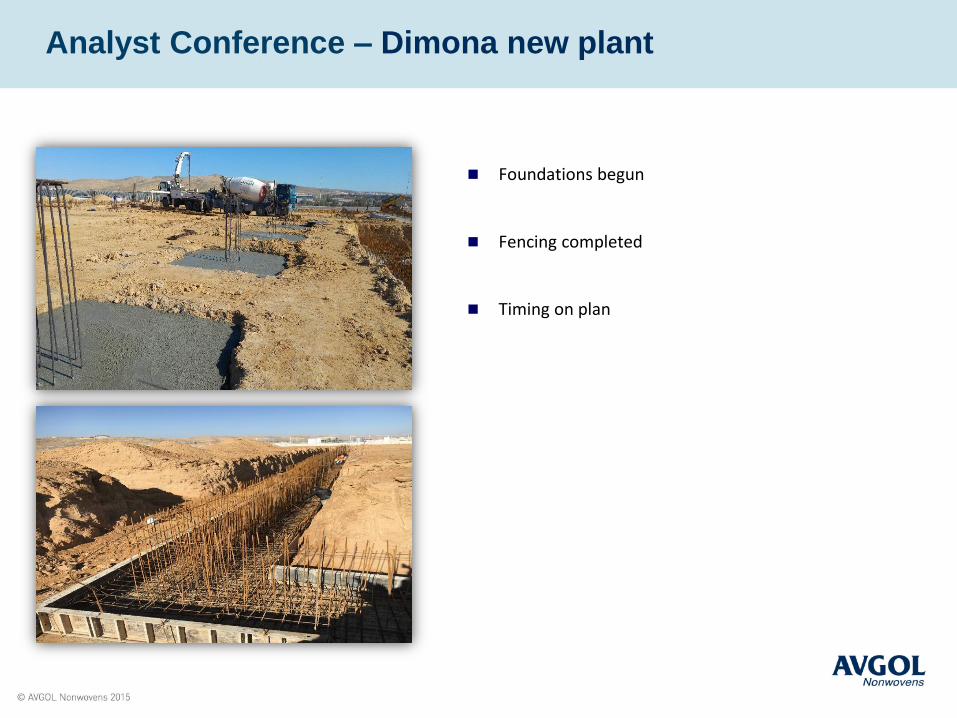
Analyst Conference – Dimona new plant
Foundations begun
Fencing completed
Timing on plan

21
Analyst Conference I Key Highlights
Financials 2015 Volumes sold in 2015 increased by 5.7% compared to 2014.
Revenue in 2015 reached $341 million, a decrease of 7.7% compared to revenue of $369
million in 2014.Although the volume sold in 2015 was 5.7% higher than in 2014, the
revenue decreased mainly due to the raw material price adjustment mechanism for
customers which reflects changes in the raw material prices which were lower during the
year. Starting in the fourth quarter of 2014 and continuing in 2015, the average resin price
decreased and therefore the sales price in the fourth quarter decreased, which caused the
revenue to decrease.
Gross Profit was $76.7 million in 2015 (22.5% of the total revenue), an increase of 23.1%
compared to the gross profit of $62.3 in 2014 (16.9% of the total revenue). The increase
in gross profit was largely driven by the higher volumes sold and produced, 5.7% and
7.3% respectively, and efficient cost control.
Operating Profit reached $48.5 million in 2015, an increase of 41% compared to $34.5
million in 2014.

22
Analyst Conference I Key Highlights
Financials 2015 EBITDA for 2015 increased to $67.8 million (19.9% of revenue) compared to $53.4 million
(14.5% of revenue) in 2014. The increase in EBITDA was largely driven by the increase in
volumes sold and produced, 5.7% and 7.3% respectively and operational efficiency
improvements plus a raw material price benefit. Excluding the lag in the raw material price
adjustment between the years, underlying EBITDA improved by approximately $11.6
Net Financing Expenses in 2015 totaled approximately $11.4 million, compared to $7.6
million in 2014. The increase is mainly attributed to exchange rate gains in 2014 linked to
the unhedged hedged portion of Bonds C
Cash Flow from operations showed a significant improvement reaching $42.4 million,
compared to $15.7 million in 2014. The increase in cash flow from operations is mainly
attributed to an increase in EBITDA together with a decrease in working capital which
declined, mainly due to the lower RM prices in 2015 compared to 2014.
Net income in 2015 reached $27 million, an increase of 37% compared to the net income
in 2014.

23
Analyst Conference I Sales (M$)
7090
105123
164
229 237254
211
278
330315
343369
341
2001 2002 2003 2004 2005 2006 2007 2008 2009 2010 2011 2012 2013 2014 2015
Our Revenue is driven by volume sold but also affected by changes of the
selling prices flowing from the changes in raw material prices

24
Analyst Conference I Multi Yearly Overview
% Profit Development 2007 - 2015
22.4%
18.4%
23.2%21.7%
20.9%20.0%
16.5% 16.9%
22.5%
18.5%
14.6%
20.0%18.8%
17.9% 18.1%
16.0%14.5%
19.9%
14.3%
10.2%
13.8%12.8% 12.5%
11.5%
9.5% 9.4%
14.2%
7.7%
3.9%
7.4% 7.6% 7.5% 7.0%4.6%
5.4%
7.9%
200 2008 2009 2010 2011 2012 2013 201 2015
% Gross % EBITDA % EBIT % Net
2015 EBITDA/Sales is 19.9%, 5.4% higher than 2014 EBITDA (14.5%), driven mainly due to:
More volume sold and produced
Ongoing efficiency improvements Vs the previous period
Raw material price benefits
Lag in the adjustment of selling prices

25
Analyst Conference I Financials Highlights
Q4 2015 % Q4 2014 2015 % 2014
89.7 -6.8% 96.3 340.8 -7.7% 369.3
21.2 19.6% 17.7 76.7 23.1% 62.3
23.6% 18.4% 22.5% 16.9%
14.0 31.8% 10.6 48.4 40.1% 34.5
15.6% 11.1% 14.2% 9.3%
8.7 36.7% 6.3 27.0 35.4% 20.0
9.7% 6.6% 7.9% 5.4%
18.8 21.5% 15.5 67.8 26.9% 53.4
21.0% 16.1% 19.9% 14.5%
Net Profit
EBITDA
Q4 YearlyUSD Million
Gross Profit
EBIT
Revenue, net
2015 Highlights:
Avgol's nameplate production capacity in 2015 was 157,000 tons
Record EBITDA of $67.8 million for the year, an increase of 27% compared to 2014 EBITDA
Cash Flow from operations showed a significant improvement reaching $42.4 million, compared to $15.7
million in 2014

26
Analyst Conference I Financials Highlights
31-12-15 31-12-14
Total Assets 401.0 -10.0% 445.3
Net Debt 182.0 2.2% 178.1
% Net Debt/ Total Assets 45.4% 40.0%
Net Debt/EBITDA 2.68 3.33
Net Debt to EBITDA improved from 3.33 at Dec 31, 2014 to 2.68 at Dec 31, 2015
Distributed Dividend of $12 million related to 2015 profits compared to $11 million related to 2014
profits
Shareholders Equity as of December 31, 2015 totaled $108.3 million, compared to $112.9 million as
of December 31, 2014. The decrease in equity is mainly attributed to the dividend distribution of $11
million, buy-backs of shares of $4.9 million, and changes in a capital reserve in respect of
translation differences related to financial statements of subsidiaries whose functional currency is
other than the dollar of $19 million. These translation differences, which resulted from
implementation of accounting standards, do not have an impact on our Profit and Loss and Cash
Flows.
The decrease of our Shareholders Equity was partially offset by the 2015 net income of $27 million.

27
Analyst Conference I Investments & Net Debt
Net Debt/ EBITDA improved from 3.33 in 2014 to 2.68 in
2015 and expected to increase during 2016 due to the
investments in Dimona and MV5
0.00
0.50
1.00
1.50
2.00
2.50
3.00
3.50
0
20
40
60
80
100
120
140
160
180
200
2011 2012 2013 2014 2015
Net Debt Net debt/EBITDA

28
Analyst Conference I Cash Flow
2015 2014 2013
USD thousands USD thousands USD thousands
Cash flows – operating activities
Net cash provided by operating activities 42,393 15,675 34,184
Net cash used for investing activities -30,407 -28,702 -29,611
Net cash, provided by (used for) financing activities -40,892 42,930 -10,995
Increase (decrease) in cash and cash equivalents -28,905 29,903 -6,422
Balance of cash and cash equivalents at the end of the year 47,004 77,333 48,051
Significant improvement reaching $42.4 million, compared to $15.7
million in 2014. The increase in cash flow from operations is mainly
attributed to an increase in EBITDA together with a decrease in working
capital which declined, mainly due to the lower RM prices in 2015
compared to 2014
29
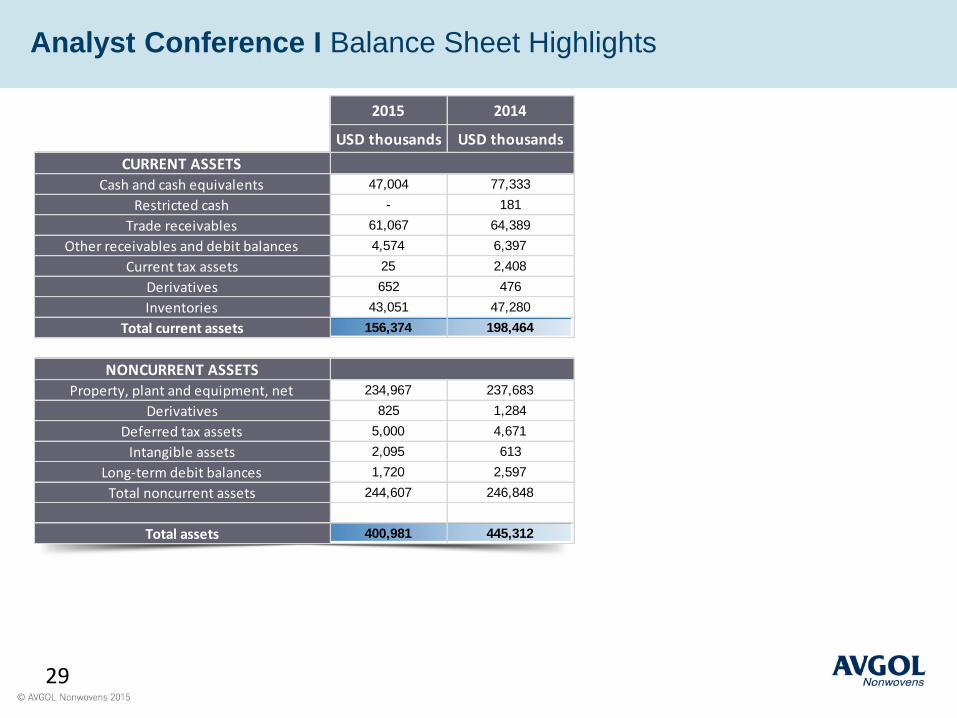
Analyst Conference I Balance Sheet Highlights
2015 2014
USD thousands USD thousands
CURRENT ASSETSCash and cash equivalents 47,004 77,333
Restricted cash - 181
Trade receivables 61,067 64,389
Other receivables and debit balances 4,574 6,397
Current tax assets 25 2,408
Derivatives 652 476
Inventories 43,051 47,280
Total current assets 156,374 198,464
NONCURRENT ASSETSProperty, plant and equipment, net 234,967 237,683
Derivatives 825 1,284
Deferred tax assets 5,000 4,671
Intangible assets 2,095 613
Long-term debit balances 1,720 2,597
Total noncurrent assets 244,607 246,848
Total assets 400,981 445,312

30
2015 2014
USD thousands USD thousands
CURRENT LIABILITIESShort-term credit from banking corporations 3,525 4,508
Liabilities in respect of derivatives 337 355
Current maturities of long-term bonds 24,184 24,435
Trade payables 24,683 35,916
Current tax liabilities 3,865 7,711
Other payables and credit balances 11,450 9030
Total current liabilities 68,045 81,955
NONCURRENT LIABILITIESLong-term loans from banking corporations 25,609 23,919
Bonds 176,052 200,843
Liabilities in respect of derivatives 755 2,990
Employee benefit liabilities 83 71
Deferred tax liabilities 22,074 22,621
Total noncurrent liabilities 224,573 250,444
EQUITY Equity attributable to shareholders of the parent company 106,413 111,185
Noncontrolling interests 1950.176154 1728
Total equity 108,364 112,913
Total liabilities and equity 400,981 445,312
As on December 31
Analyst Conference I Balance Sheet Highlights

31
Courage and
Pioneering Spirit
Analyst Conference I Our Strengths
Able to
“Genetically Reproduce”
Our Model, Products and Service
Globally, Even in Tough Geographies
Global Presence Customer Focus
Technology Mastery
& Innovation

32
Any Questions?

33