Embed Size (px)
Citation preview
8/7/2019 ANATARAGNI 2010 - W.I.N - i.b
http://slidepdf.com/reader/full/anataragni-2010-win-ib 1/57
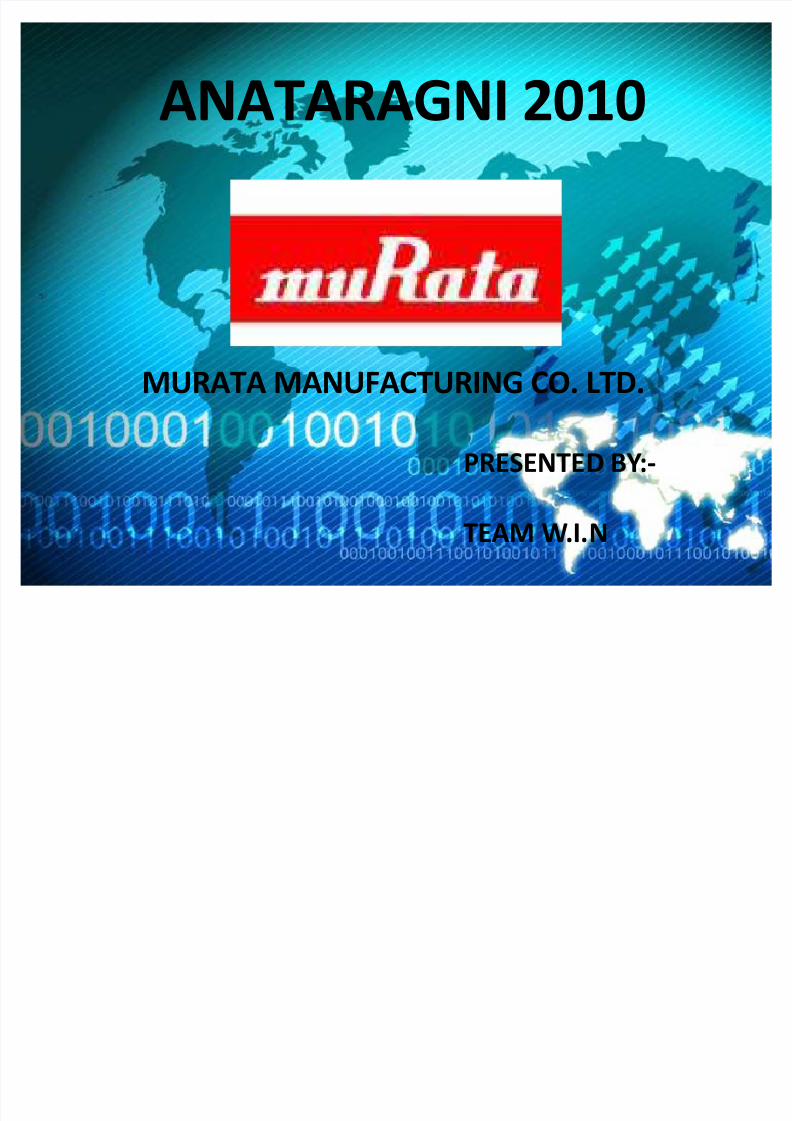
ANATARAGNI 2010
MURATA MANUFACTURING CO. LTD.
PRESENTED BY:-
TEAM W.I.N

8/7/2019 ANATARAGNI 2010 - W.I.N - i.b
http://slidepdf.com/reader/full/anataragni-2010-win-ib 2/57
BUSINESS OUTLINE
8/7/2019 ANATARAGNI 2010 - W.I.N - i.b
http://slidepdf.com/reader/full/anataragni-2010-win-ib 3/57
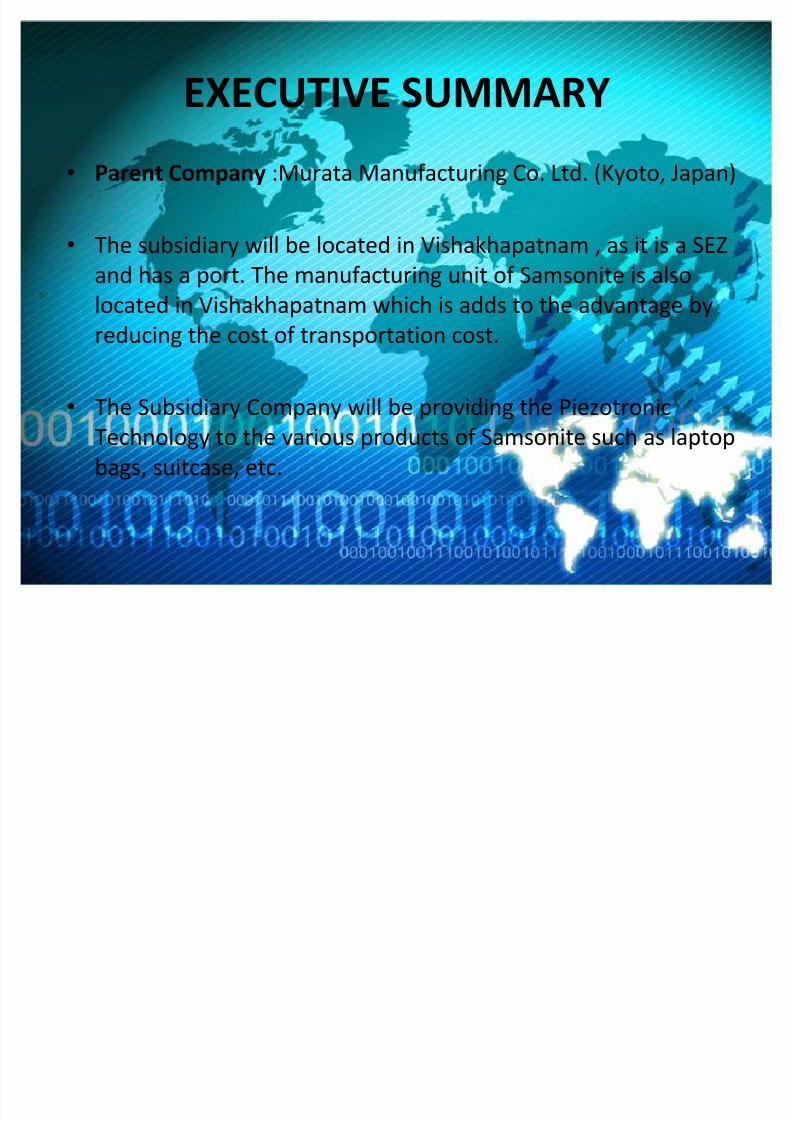
EXECUTIVE SUMMARY
� Parent Company :Murata Manufacturing Co. Ltd. (Kyoto, Japan)
� The subsidiary will be located in Vishakhapatnam , as it is a SEZ
and has a port. The manufacturing unit of Samsonite is alsolocated in Vishakhapatnam which is adds to the advantage by
reducing the cost of transportation cost.
�
The Subsidiary Company will be providing the PiezotronicTechnology to the various products of Samsonite such as laptop
bags, suitcase, etc.

8/7/2019 ANATARAGNI 2010 - W.I.N - i.b
http://slidepdf.com/reader/full/anataragni-2010-win-ib 4/57
PARENT COMPANY PROFILE
� Murata Manufacturing Co., Ltd. is a Japanese manufacturer of
electronic components, based in Nagaokakyo, Kyoto.
� Started as personal venture in October, 1944 in by Mr. Akira
Murata.� Leading company primarily involved in the manufacturing of
ceramic passive electronic components, primarily capacitors, and
it has an overwhelming share worldwide in ceramic filters, high
frequency parts, and sensors.
� The company manufactures semi-finished products for various
electronic components and supplies them to its manufacturing
subsidiaries in Japan and abroad.
8/7/2019 ANATARAGNI 2010 - W.I.N - i.b
http://slidepdf.com/reader/full/anataragni-2010-win-ib 5/57
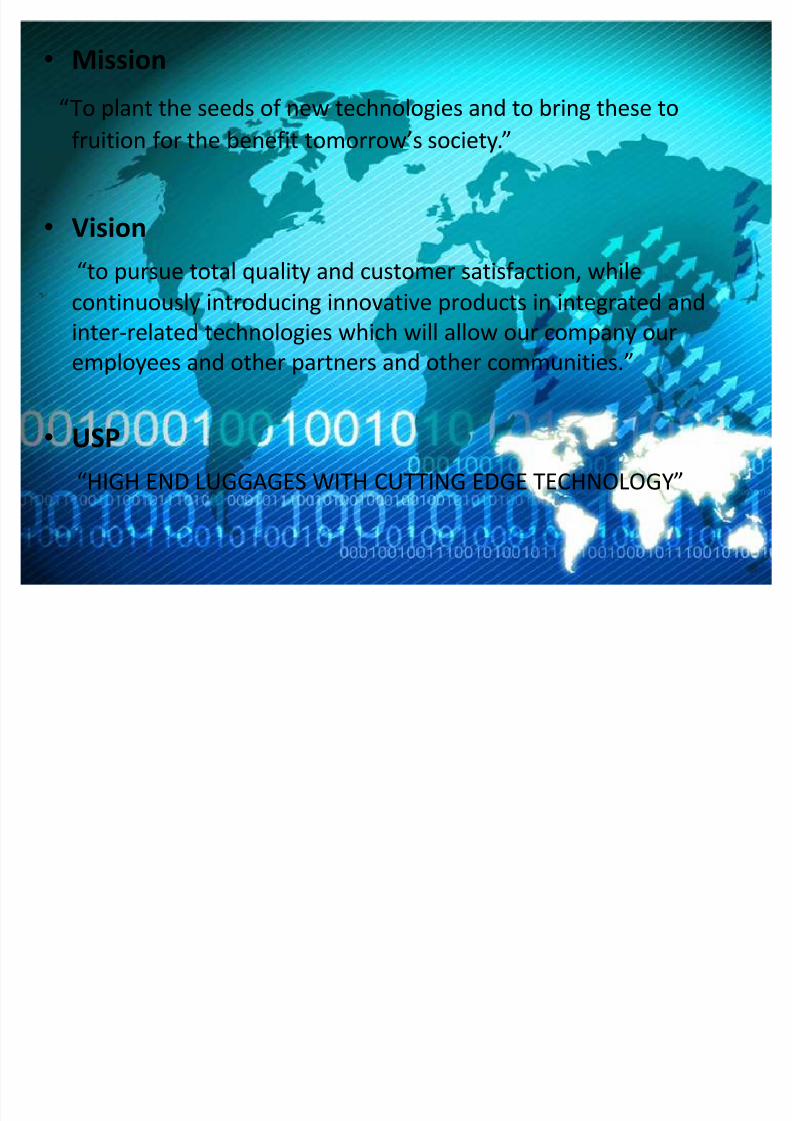
� Mission
To plant the seeds of new technologies and to bring these to
fruition for the benefit tomorrows society.
� Vision
to pursue total quality and customer satisfaction, whilecontinuously introducing innovative products in integrated and
inter-related technologies which will allow our company our
employees and other partners and other communities.
� USP
HIGH END LUGGAGES WITH CUTTING EDGE TECHNOLOGY
8/7/2019 ANATARAGNI 2010 - W.I.N - i.b
http://slidepdf.com/reader/full/anataragni-2010-win-ib 6/57
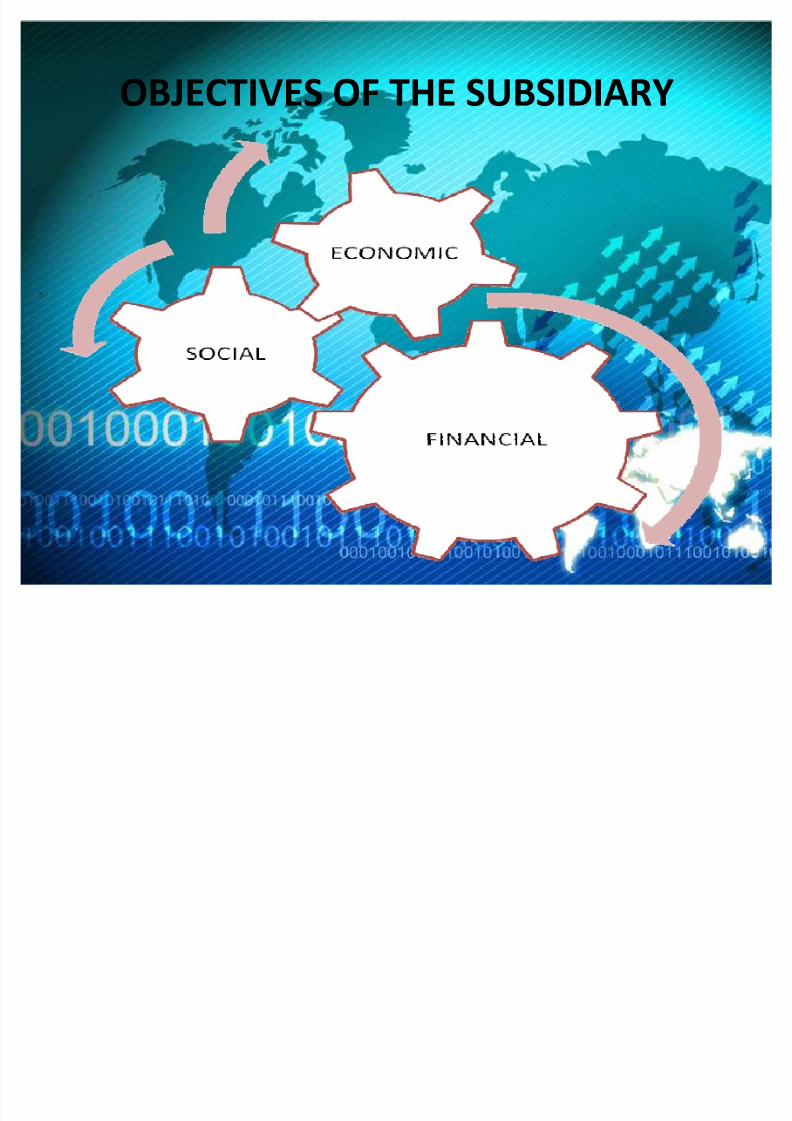
OBJECTIVES OF THE SUBSIDIARY
8/7/2019 ANATARAGNI 2010 - W.I.N - i.b
http://slidepdf.com/reader/full/anataragni-2010-win-ib 7/57
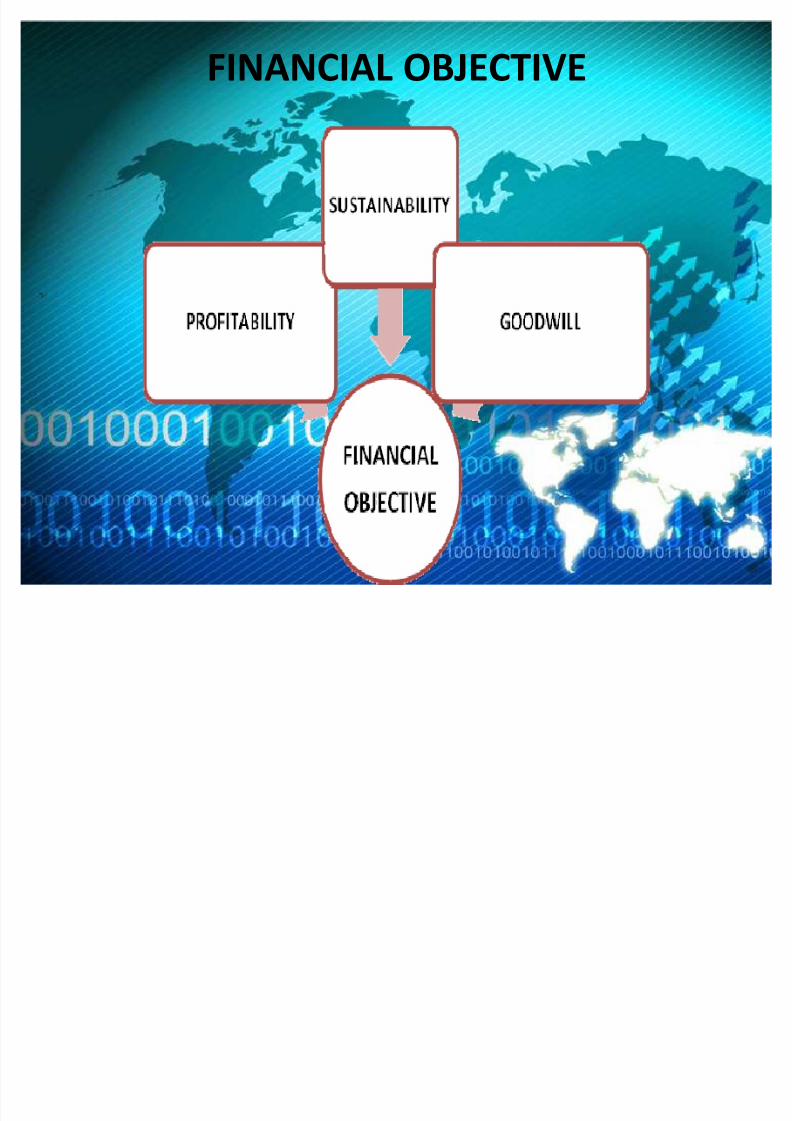
FINANCIAL OBJECTIVE
8/7/2019 ANATARAGNI 2010 - W.I.N - i.b
http://slidepdf.com/reader/full/anataragni-2010-win-ib 8/57
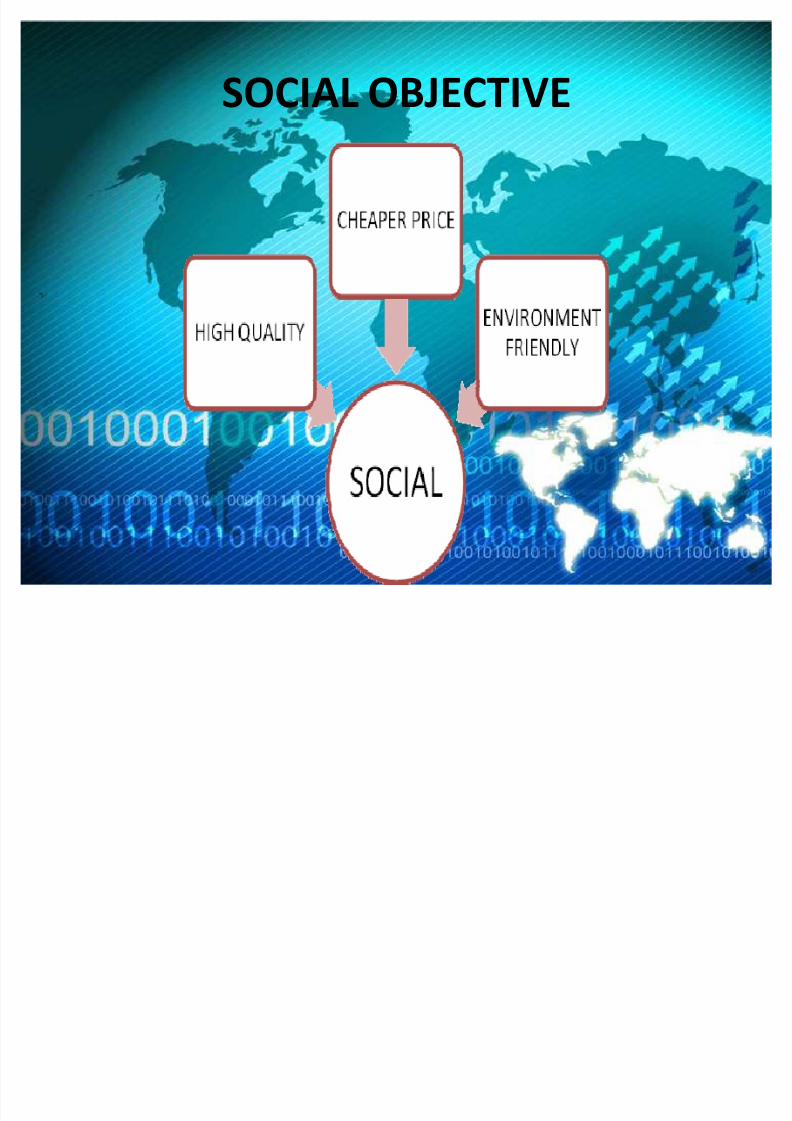
SOCIAL OBJECTIVE
8/7/2019 ANATARAGNI 2010 - W.I.N - i.b
http://slidepdf.com/reader/full/anataragni-2010-win-ib 9/57
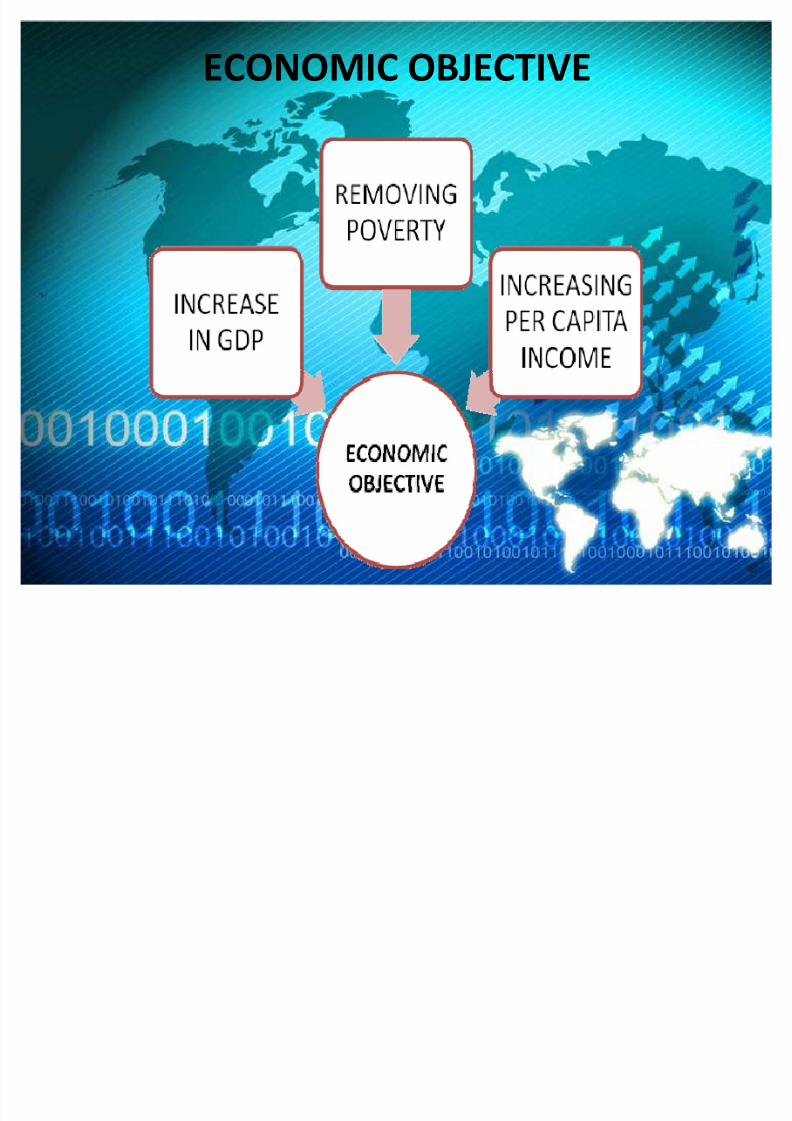
ECONOMIC OBJECTIVE

8/7/2019 ANATARAGNI 2010 - W.I.N - i.b
http://slidepdf.com/reader/full/anataragni-2010-win-ib 10/57
CURRENT MARKET SCENARIO
� The global luggage market is growing with increasing
population, changing travel trends and spending habits.
� The market is taking a turn towards brands and fashion
products.
� A factor that has a substantial influence on the luggagemarket is changing preferences of consumers.
� since this type of technology has not been introduced in
India before, Murata will have an edge over the other
luggage and back-pack companies especially after the tie
up with Samsonite.
8/7/2019 ANATARAGNI 2010 - W.I.N - i.b
http://slidepdf.com/reader/full/anataragni-2010-win-ib 11/57
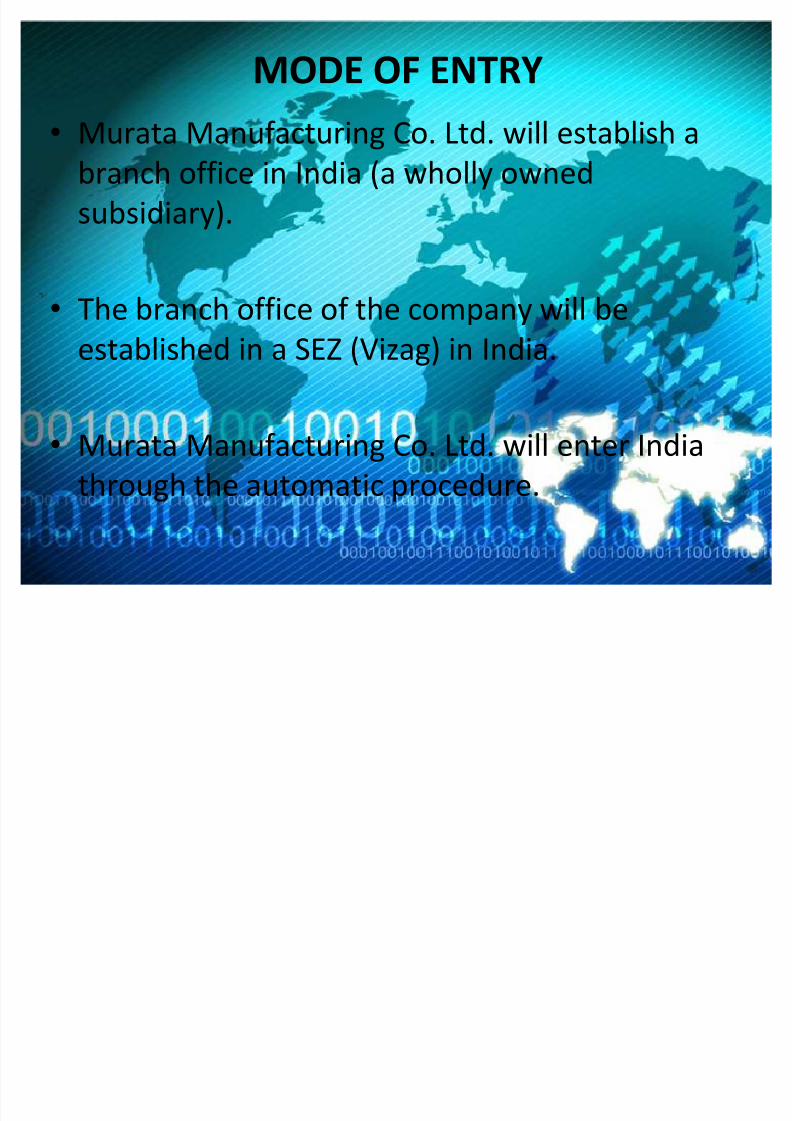
MODE OF ENTRY
�Murata Manufacturing Co. Ltd. will establish abranch office in India (a wholly owned
subsidiary).
� The branch office of the company will be
established in a SEZ (Vizag) in India.
� Murata Manufacturing Co. Ltd. will enter India
through the automatic procedure.

8/7/2019 ANATARAGNI 2010 - W.I.N - i.b
http://slidepdf.com/reader/full/anataragni-2010-win-ib 12/57
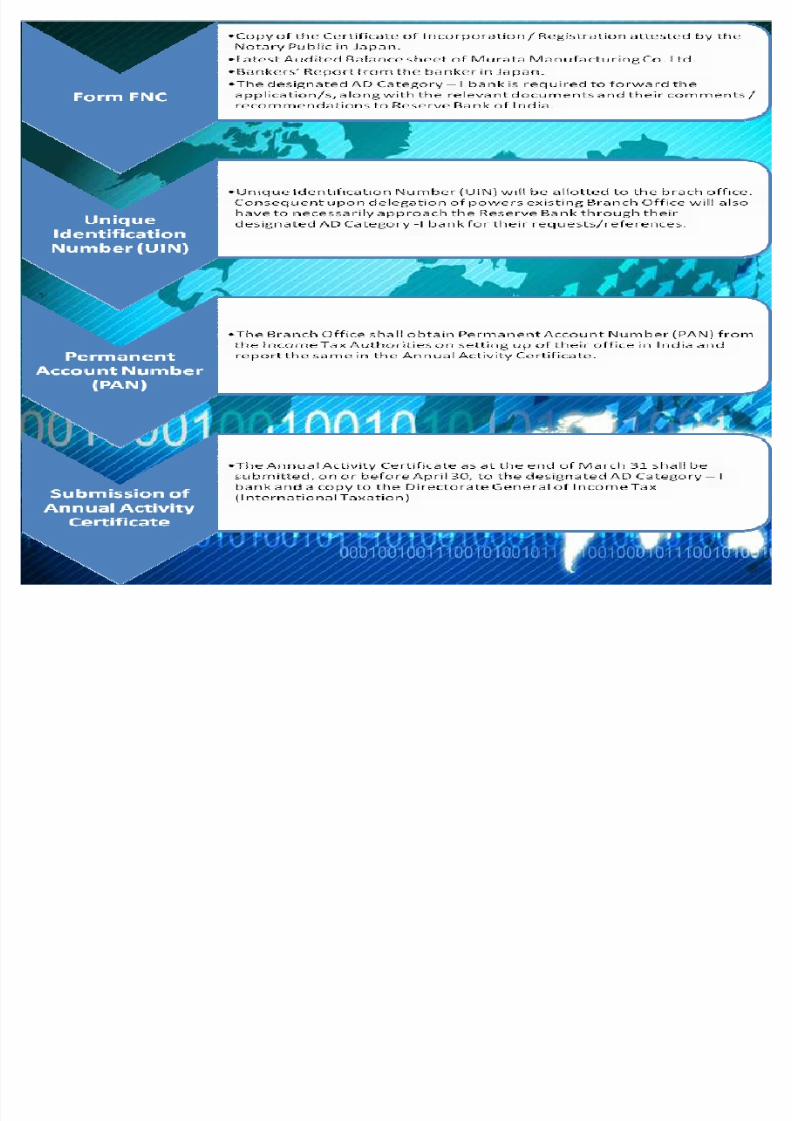
PROCEDURE OF THE MODE OF ENTRY
8/7/2019 ANATARAGNI 2010 - W.I.N - i.b
http://slidepdf.com/reader/full/anataragni-2010-win-ib 13/57

8/7/2019 ANATARAGNI 2010 - W.I.N - i.b
http://slidepdf.com/reader/full/anataragni-2010-win-ib 14/57
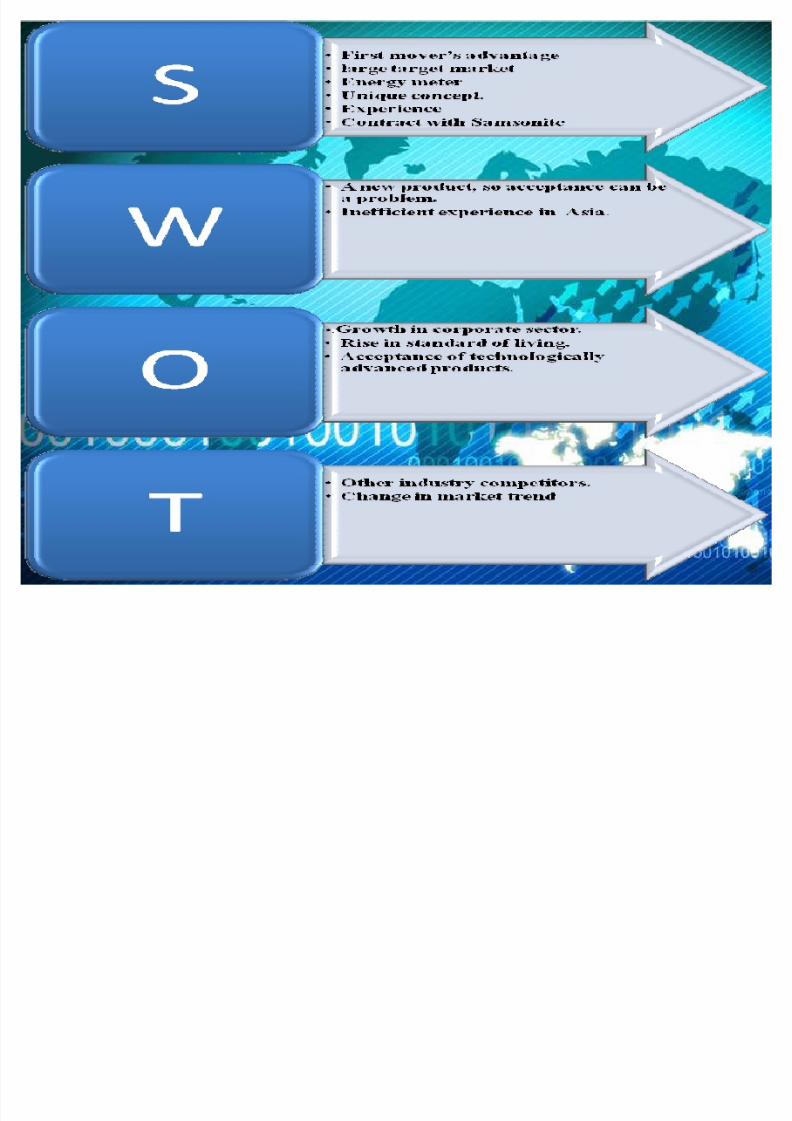
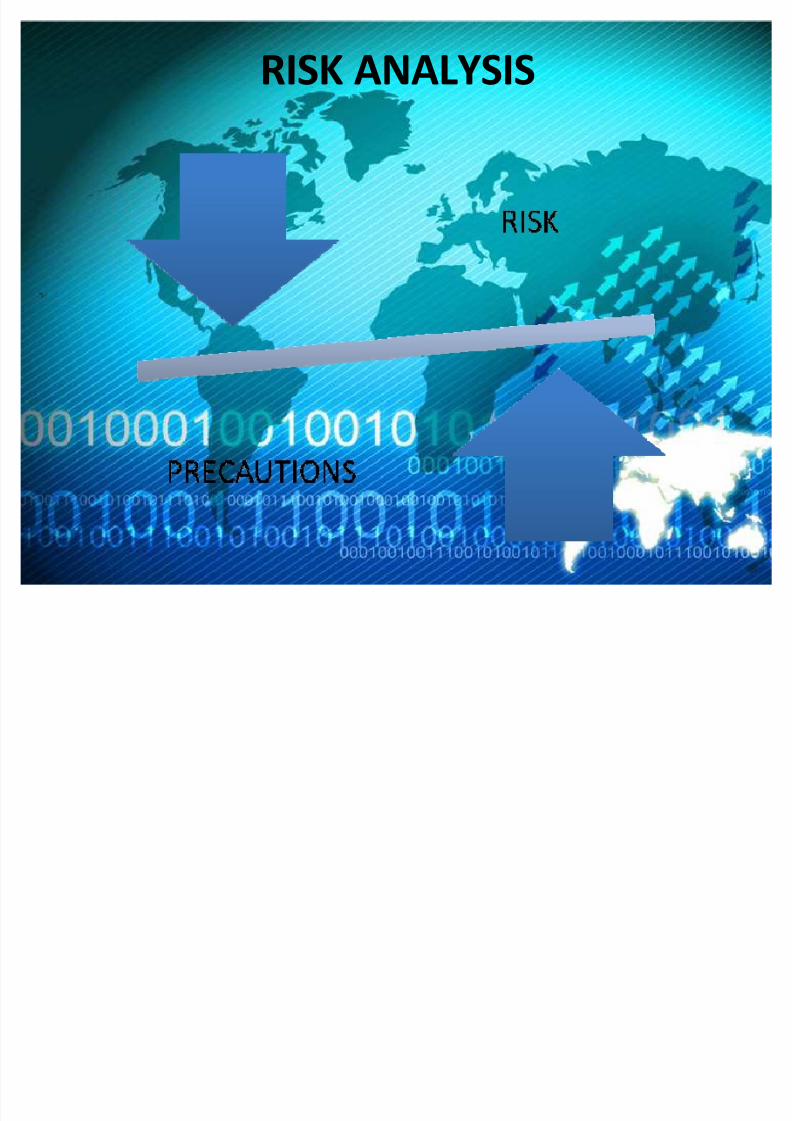
RISK ANALYSIS
8/7/2019 ANATARAGNI 2010 - W.I.N - i.b
http://slidepdf.com/reader/full/anataragni-2010-win-ib 15/57
8/7/2019 ANATARAGNI 2010 - W.I.N - i.b
http://slidepdf.com/reader/full/anataragni-2010-win-ib 16/57
RISK ANALYSIS
8/7/2019 ANATARAGNI 2010 - W.I.N - i.b
http://slidepdf.com/reader/full/anataragni-2010-win-ib 17/57
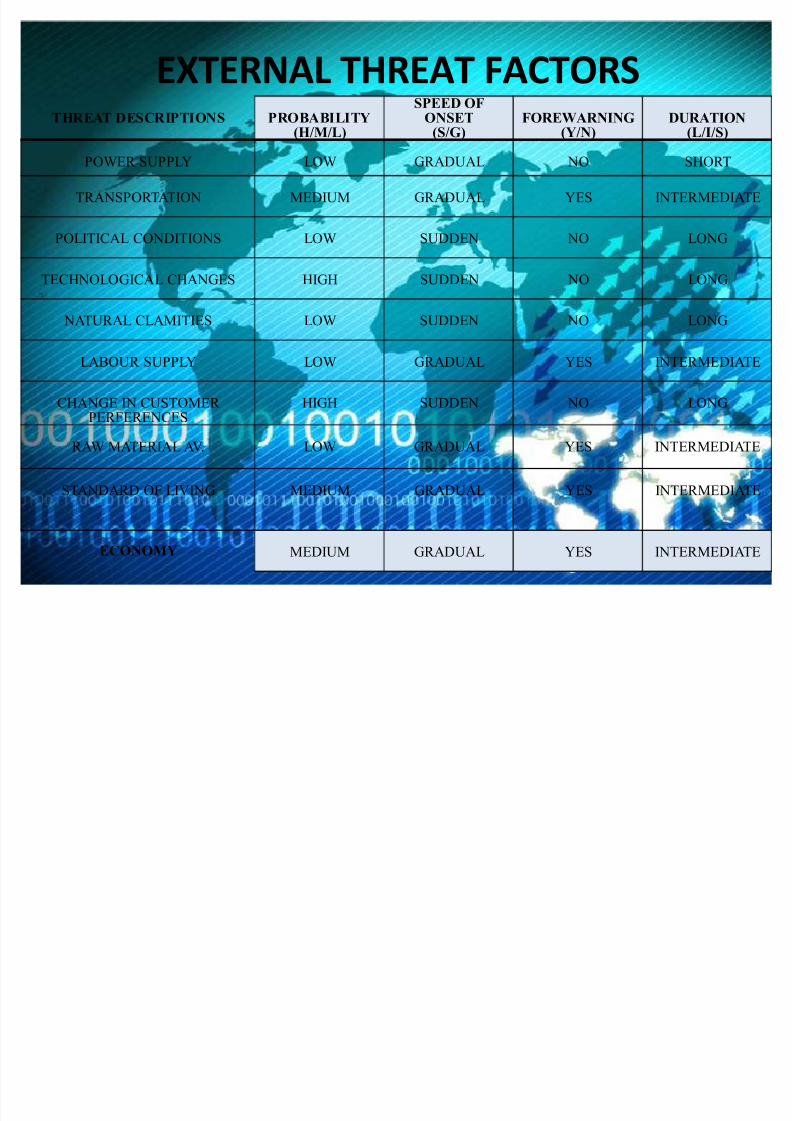
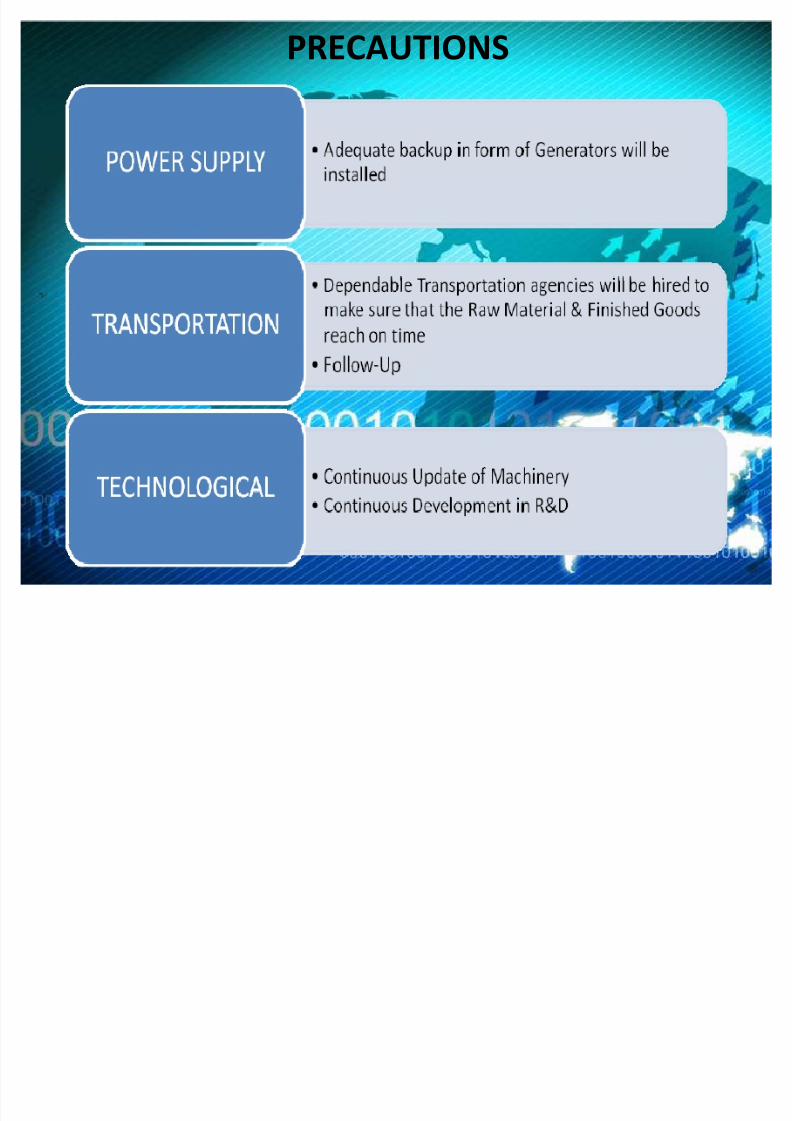
EXTERNAL THREAT FACTORSTHREAT DESCRIPTIONS PROBABILITY
(H/M/L)
SPEED OFONSET
(S/G)FOREWARNING
(Y/N)DURATION
(L/I/S)
POWER SUPPLY LOW GRADUAL NO SHORT
TRANSPORTATION MEDIUM GRADUAL YES INTERMEDIATE
POLITICAL CONDITIONS LOW SUDDEN NO LONG
TECHNOLOGICAL CHANGES HIGH SUDDEN NO LONG
NATURAL CLAMITIES LOW SUDDEN NO LONG
LABOUR SUPPLY LOW GRADUAL YES INTERMEDIATE
CHANGE IN CUSTOMER
PERFERENCES
HIGH SUDDEN NO LONG
RAW MATERIAL AV. LOW GRADUAL YES INTERMEDIATE
STANDARD OF LIVING MEDIUM GRADUAL YES INTERMEDIATE
ECONOMY MEDIUM GRADUAL YES INTERMEDIATE
8/7/2019 ANATARAGNI 2010 - W.I.N - i.b
http://slidepdf.com/reader/full/anataragni-2010-win-ib 18/57
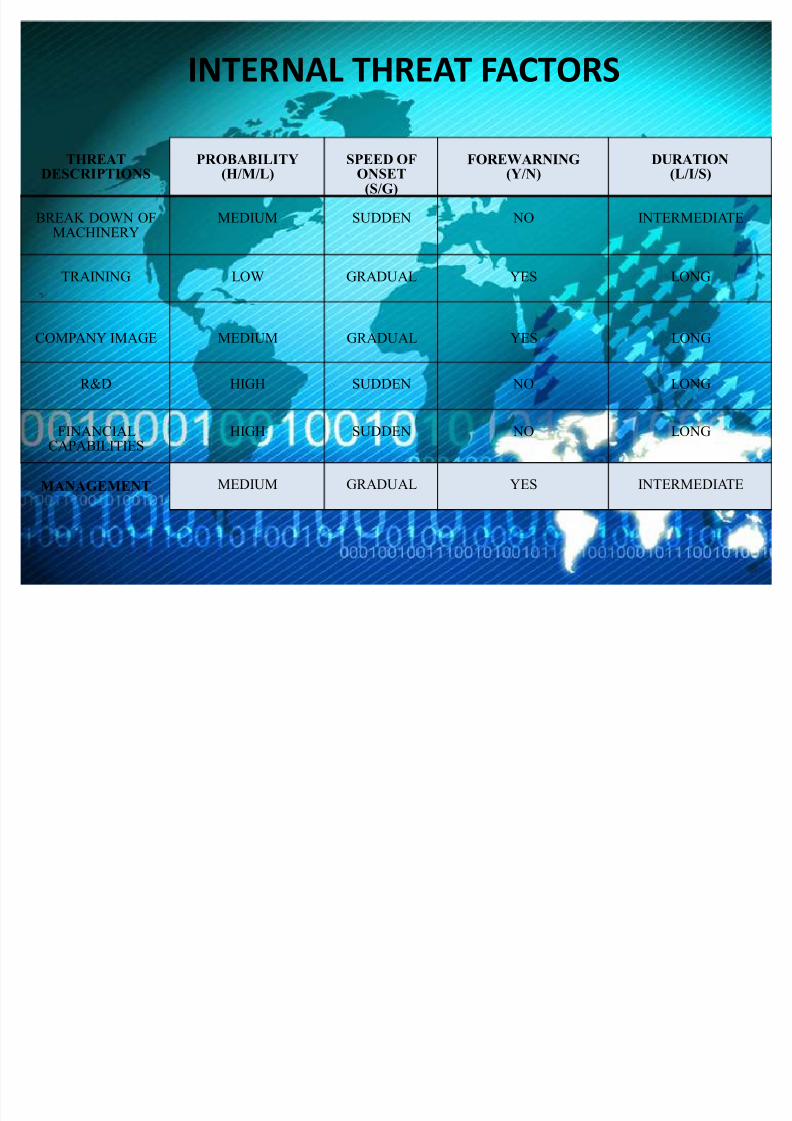
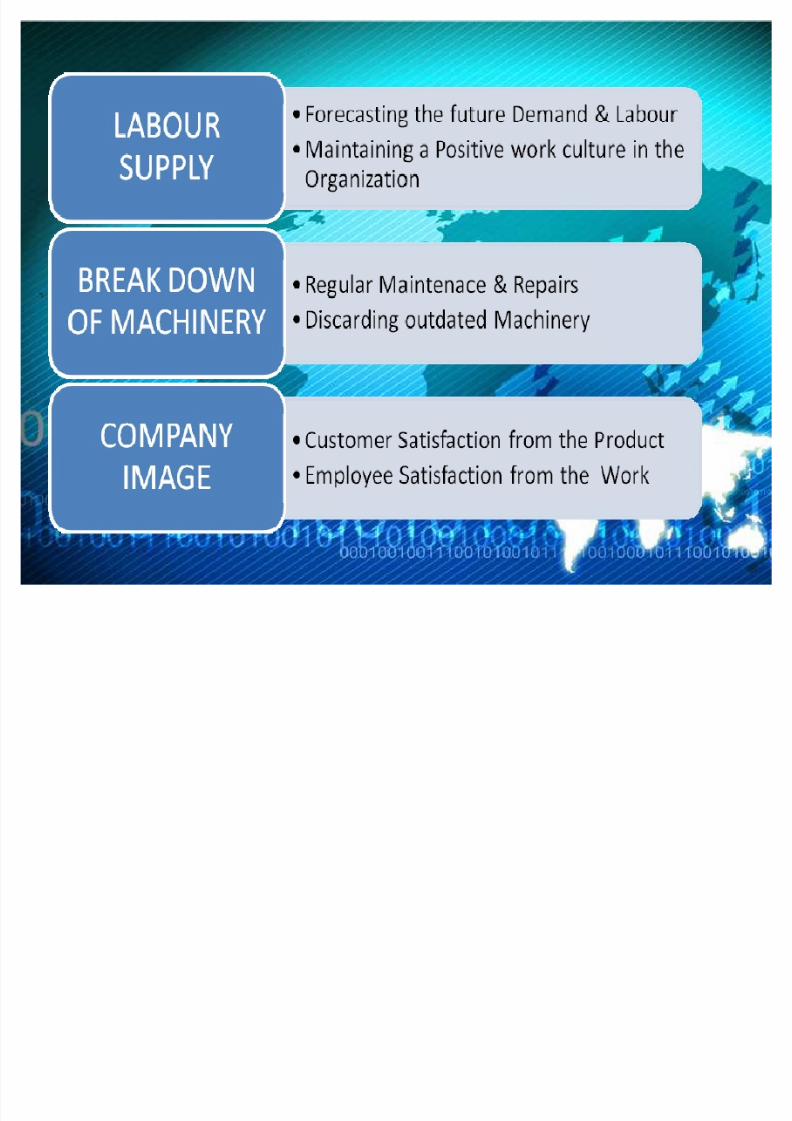
INTERNAL THREAT FACTORS
THREATDESCRIPTIONS
PROBABILITY(H/M/L)
SPEED OFONSET
(S/G)
FOREWARNING(Y/N)
DURATION(L/I/S)
BREAK DOWN OFMACHINERY
MEDIUM SUDDEN NO INTERMEDIATE
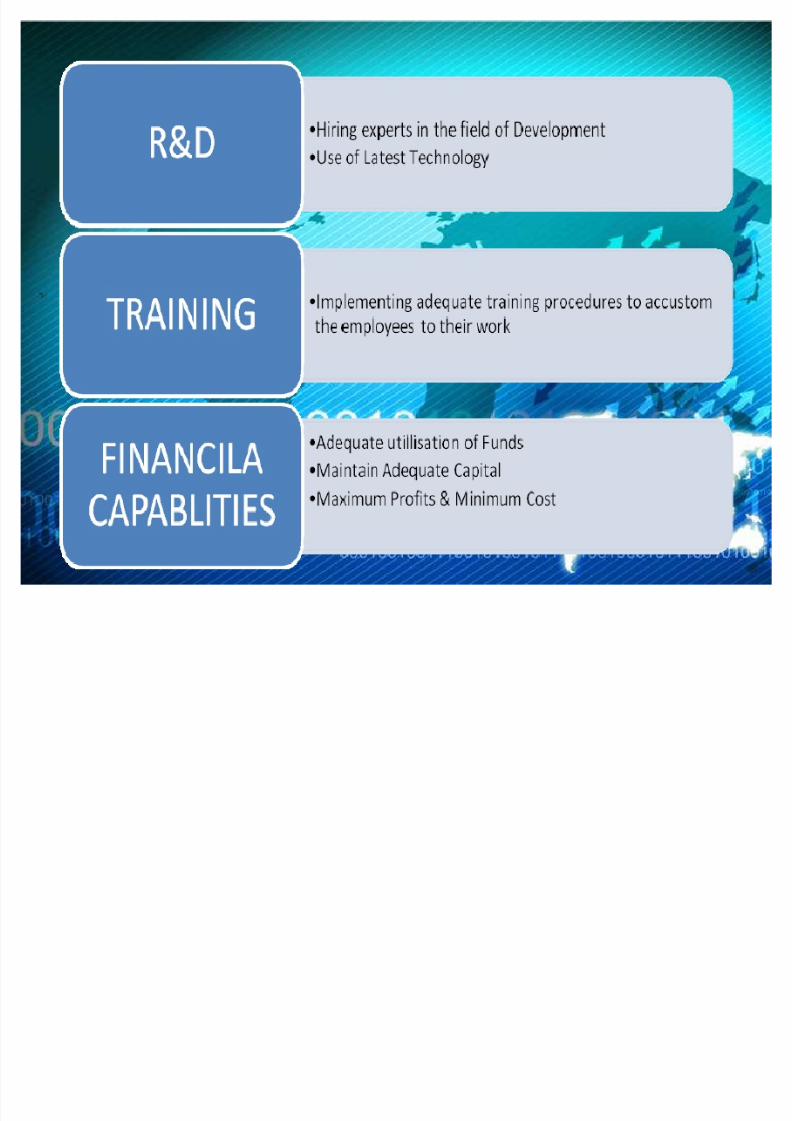
TRAINING LOW GRADUAL YES LONG
COMPANY IMAGE MEDIUM GRADUAL YES LONG
R&D HIGH SUDDEN NO LONG
FINANCIALCAPABILITIES
HIGH SUDDEN NO LONG
MANAGEMENT MEDIUM GRADUAL YES INTERMEDIATE
8/7/2019 ANATARAGNI 2010 - W.I.N - i.b
http://slidepdf.com/reader/full/anataragni-2010-win-ib 19/57
PRECAUTIONS
8/7/2019 ANATARAGNI 2010 - W.I.N - i.b
http://slidepdf.com/reader/full/anataragni-2010-win-ib 20/57
8/7/2019 ANATARAGNI 2010 - W.I.N - i.b
http://slidepdf.com/reader/full/anataragni-2010-win-ib 21/57

8/7/2019 ANATARAGNI 2010 - W.I.N - i.b
http://slidepdf.com/reader/full/anataragni-2010-win-ib 22/57
MARKETING

8/7/2019 ANATARAGNI 2010 - W.I.N - i.b
http://slidepdf.com/reader/full/anataragni-2010-win-ib 23/57
Segmentation
� Demographic segmentation:
For SYNERGY the main customers is going to be above 16 years
basically who want to electronics in their bags. The income levels
should be matching to upper middle class and higher class.
� Psycho graphic Segmentation:
We are looking for civilized Indian customers who are fond of
different types of travel bags.
� Geographical segmentation:
The prevalent atmosphere and lifestyle of India will determine the
success of the service to a large extent.

8/7/2019 ANATARAGNI 2010 - W.I.N - i.b
http://slidepdf.com/reader/full/anataragni-2010-win-ib 24/57
TARGETING
Upper-middle and High income groups: We are targeting this range of income groups as we are launching this service for those who are very
fond of travelling and using different types of bags.
Youth and higher age groups: We are targeting this particular segment
of age groups as we believe that it is mostly the youth or the working
class who want to travel to different places and need varieties in travel
bags.
Travelers: Due to its mini-form factor, Synergy is highly convenient tocarry along during journeys or trips. This is why it will be targeted at
travelers as well.
8/7/2019 ANATARAGNI 2010 - W.I.N - i.b
http://slidepdf.com/reader/full/anataragni-2010-win-ib 25/57
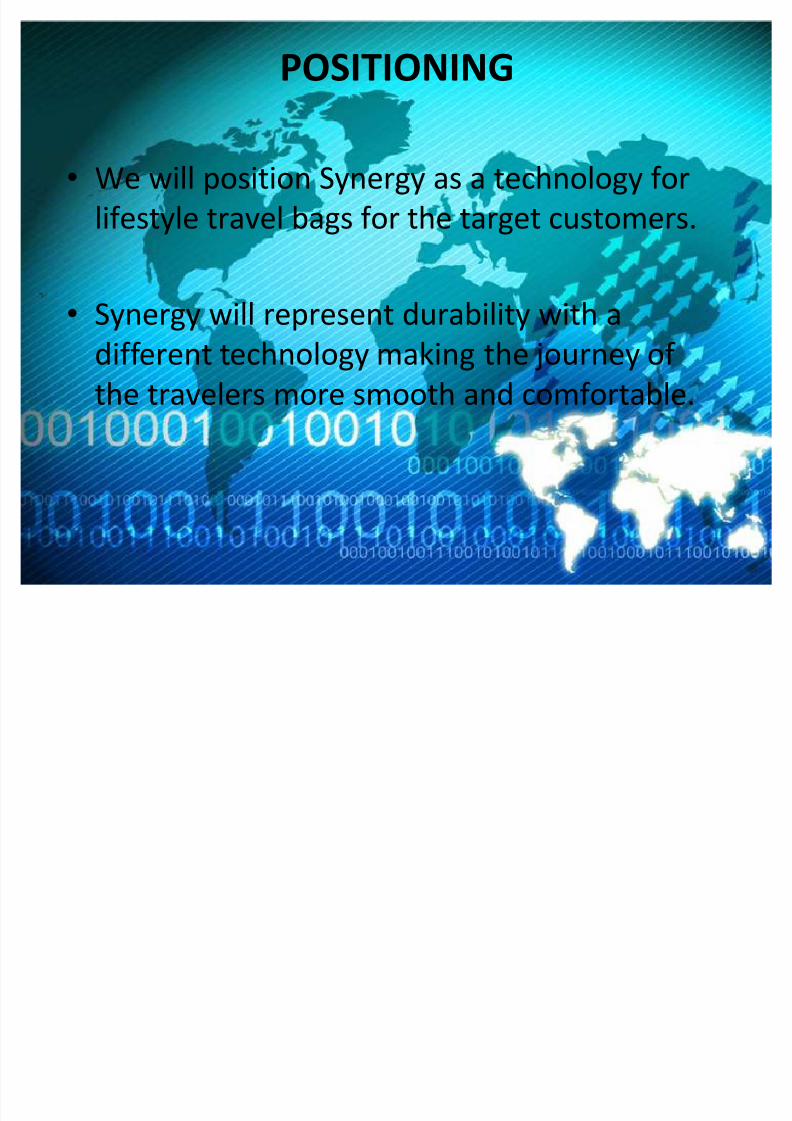
POSITIONING
� We will position Synergy as a technology for
lifestyle travel bags for the target customers.
� Synergy will represent durability with a
different technology making the journey of
the travelers more smooth and comfortable.
8/7/2019 ANATARAGNI 2010 - W.I.N - i.b
http://slidepdf.com/reader/full/anataragni-2010-win-ib 26/57
8/7/2019 ANATARAGNI 2010 - W.I.N - i.b
http://slidepdf.com/reader/full/anataragni-2010-win-ib 27/57
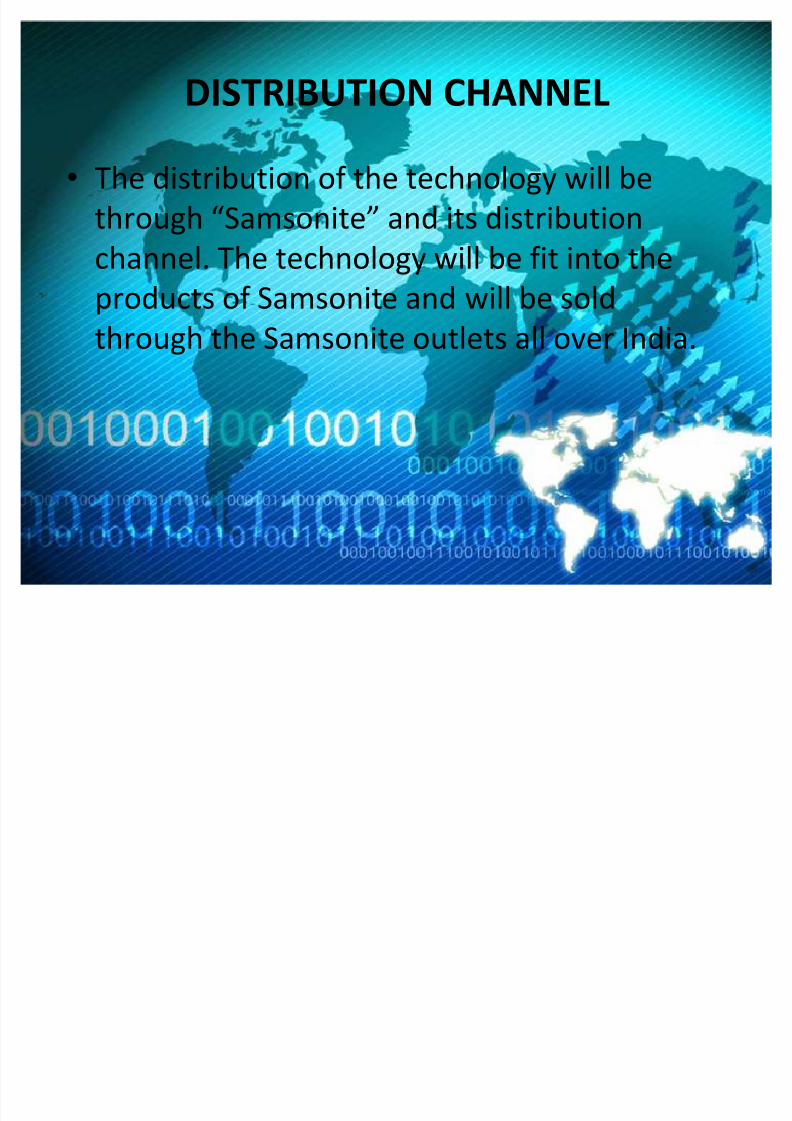
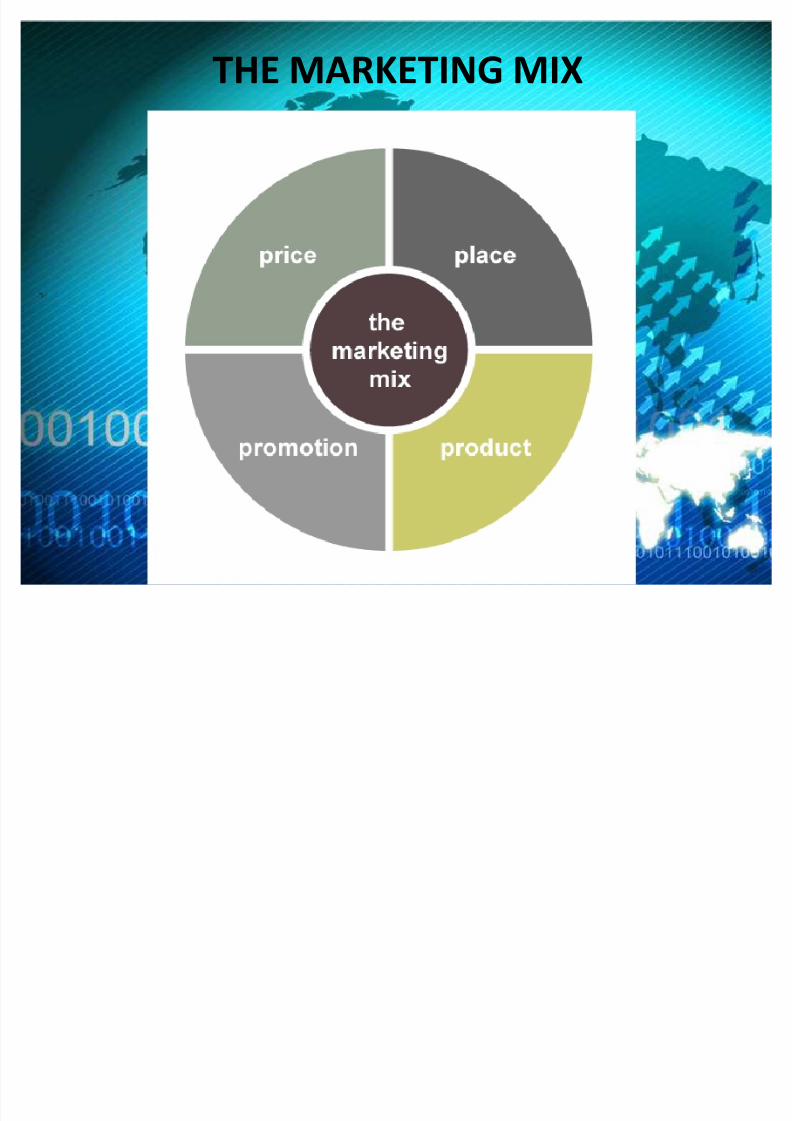
THE MARKETING MIX
8/7/2019 ANATARAGNI 2010 - W.I.N - i.b
http://slidepdf.com/reader/full/anataragni-2010-win-ib 28/57
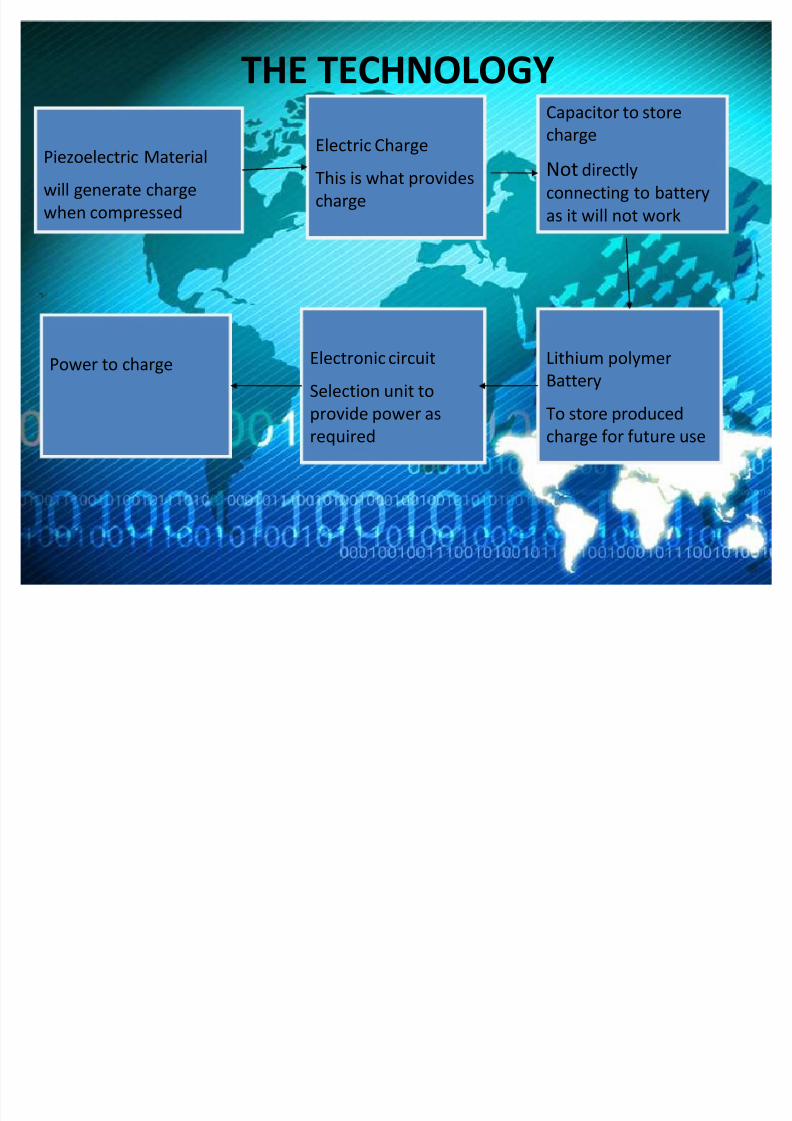
THE TECHNOLOGY
Piezoelectric Material
will generate charge
when compressed
Electric Charge
This is what provides
charge
Lithium polymer
Battery
To store producedcharge for future use
Capacitor to store
chargeNot directly
connecting to battery
as it will not work
Electronic circuit
Selection unit to
provide power asrequired
Power to charge

8/7/2019 ANATARAGNI 2010 - W.I.N - i.b
http://slidepdf.com/reader/full/anataragni-2010-win-ib 29/57
HUMAN RESOURCE
8/7/2019 ANATARAGNI 2010 - W.I.N - i.b
http://slidepdf.com/reader/full/anataragni-2010-win-ib 30/57
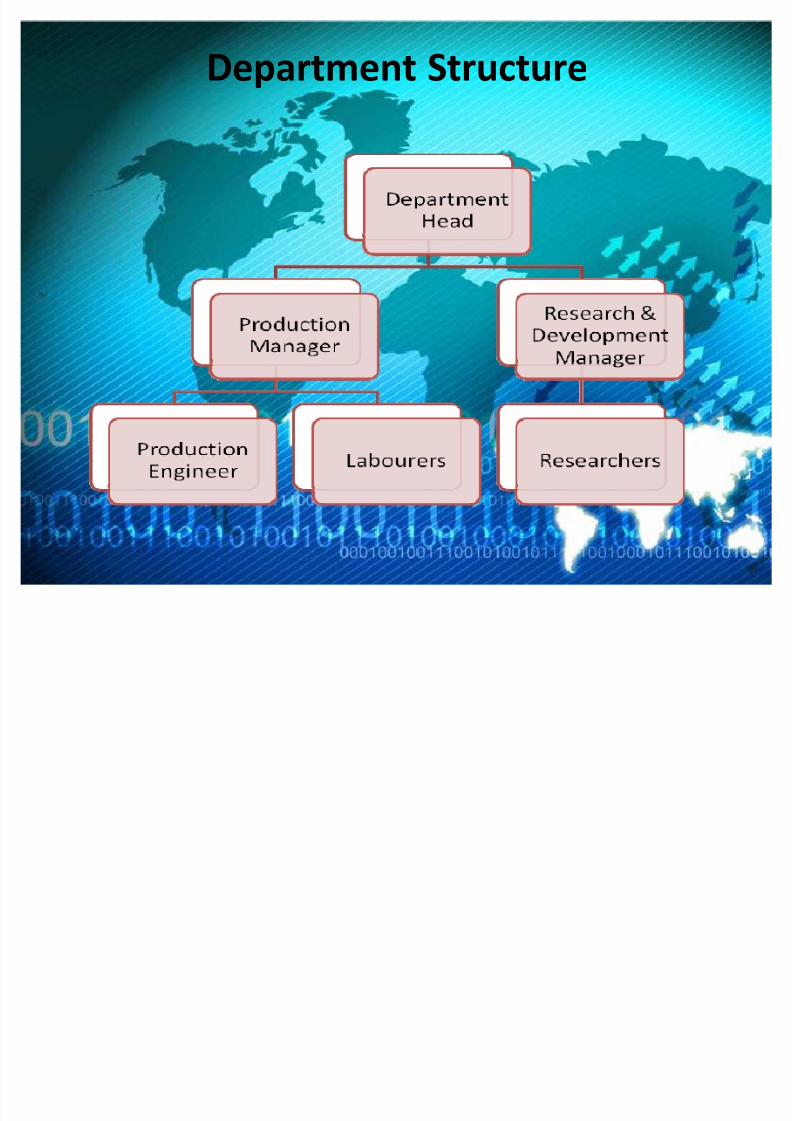
Department Structure
8/7/2019 ANATARAGNI 2010 - W.I.N - i.b
http://slidepdf.com/reader/full/anataragni-2010-win-ib 31/57
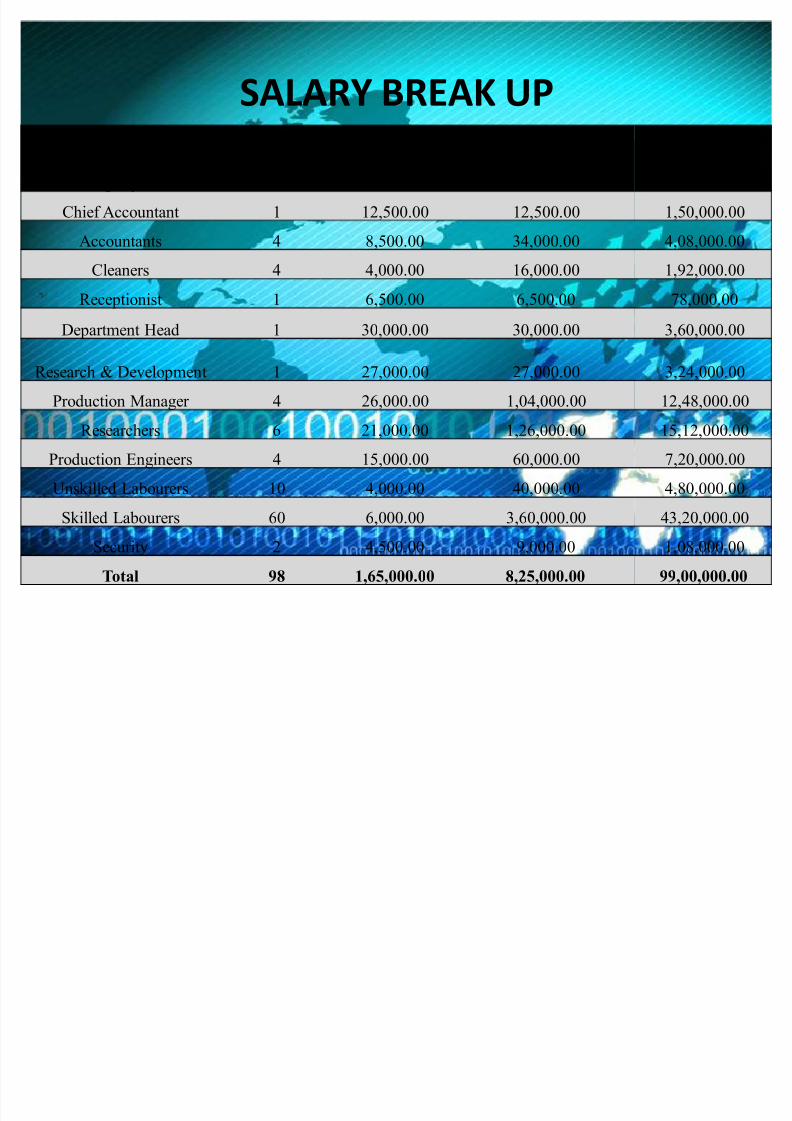
SALARY BREAK UP
Employees
No. of
Persons
Salary Per
Head
Total Salary Per
Month
Salary Per
Annum
Chief Accountant 1 12,500.00 12,500.00 1,50,000.00
Accountants 4 8,500.00 34,000.00 4,08,000.00
Cleaners 4 4,000.00 16,000.00 1,92,000.00
Receptionist 1 6,500.00 6,500.00 78,000.00
Department Head 1 30,000.00 30,000.00 3,60,000.00
Research & Development 1 27,000.00 27,000.00 3,24,000.00
Production Manager 4 26,000.00 1,04,000.00 12,48,000.00
Researchers 6 21,000.00 1,26,000.00 15,12,000.00
Production Engineers 4 15,000.00 60,000.00 7,20,000.00
Unskilled Labourers 10 4,000.00 40,000.00 4,80,000.00
Skilled Labourers 60 6,000.00 3,60,000.00 43,20,000.00
Security 2 4,500.00 9,000.00 1,08,000.00
Total 98 1,65,000.00 8,25,000.00 99,00,000.00
8/7/2019 ANATARAGNI 2010 - W.I.N - i.b
http://slidepdf.com/reader/full/anataragni-2010-win-ib 32/57
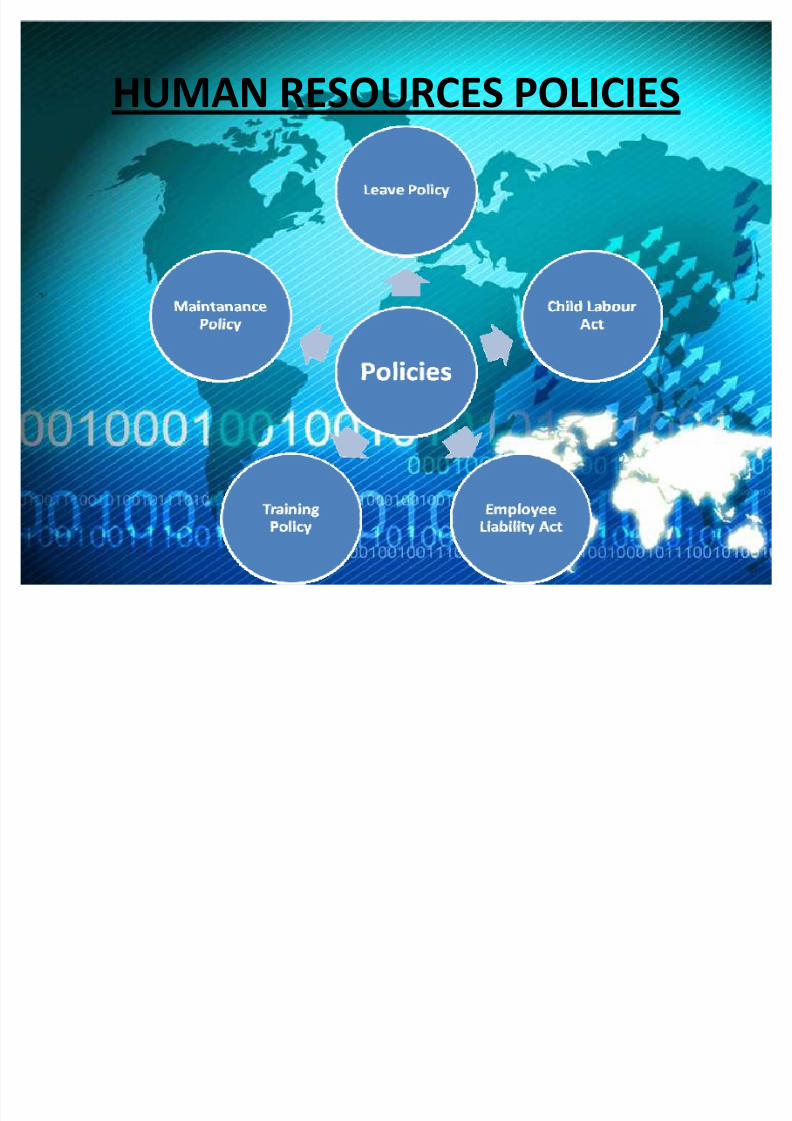
HUMAN RESOURCES POLICIES

8/7/2019 ANATARAGNI 2010 - W.I.N - i.b
http://slidepdf.com/reader/full/anataragni-2010-win-ib 33/57
CORPORATE SOCIAL RESPONSIBILITY
� Creation of energy
� Re-chargeable Battery
�
Rain Water Harvesting� Modern business suitability
� Health

8/7/2019 ANATARAGNI 2010 - W.I.N - i.b
http://slidepdf.com/reader/full/anataragni-2010-win-ib 34/57
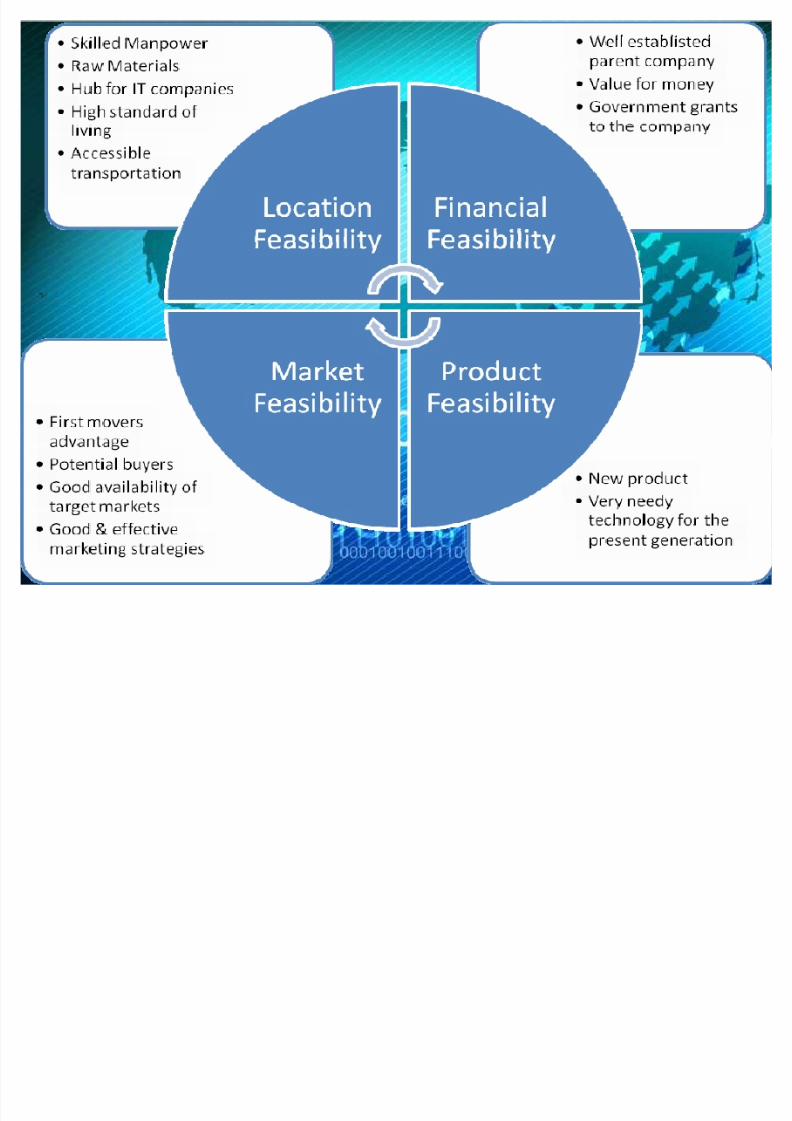
FEASIBILITY ANALYSIS
8/7/2019 ANATARAGNI 2010 - W.I.N - i.b
http://slidepdf.com/reader/full/anataragni-2010-win-ib 35/57

8/7/2019 ANATARAGNI 2010 - W.I.N - i.b
http://slidepdf.com/reader/full/anataragni-2010-win-ib 36/57
FINANCIALS
8/7/2019 ANATARAGNI 2010 - W.I.N - i.b
http://slidepdf.com/reader/full/anataragni-2010-win-ib 37/57
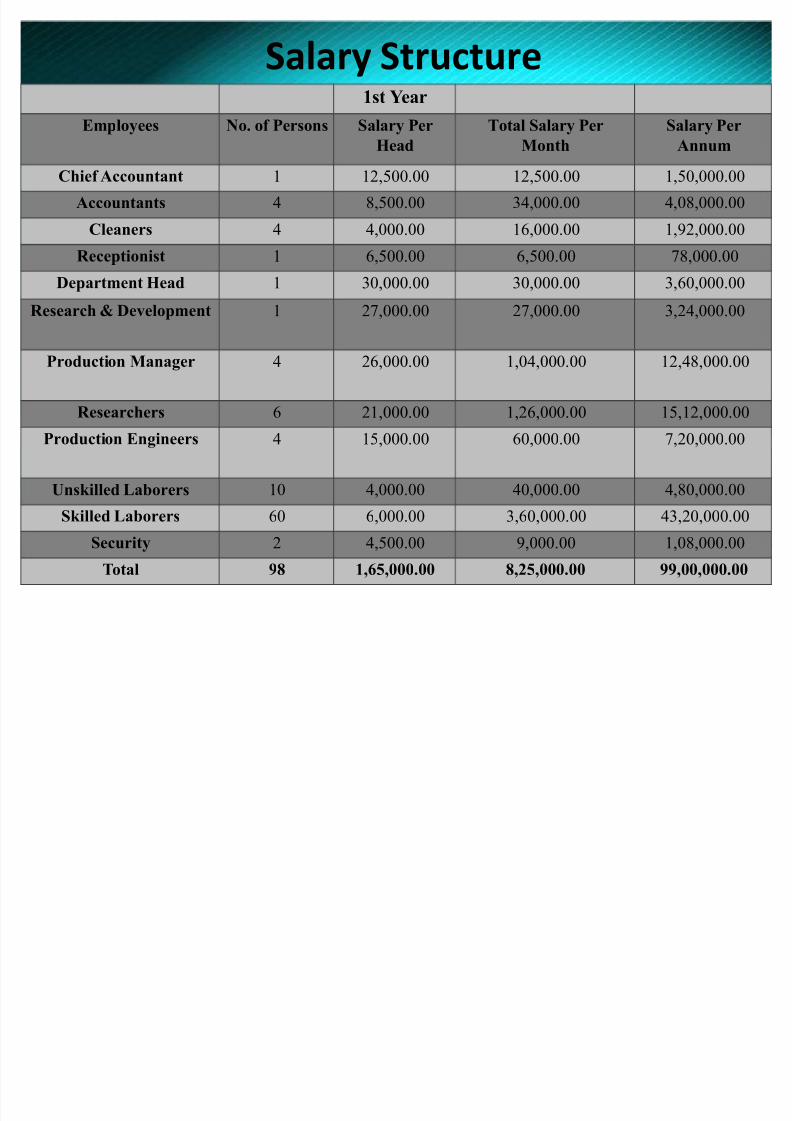
Salary Structure1st Year
Employees No. of Persons Salary Per
Head
Total Salary Per
Month
Salary Per
Annum
Chief Accountant 1 12,500.00 12,500.00 1,50,000.00
Accountants 4 8,500.00 34,000.00 4,08,000.00
Cleaners 4 4,000.00 16,000.00 1,92,000.00
Receptionist 1 6,500.00 6,500.00 78,000.00
Department Head 1 30,000.00 30,000.00 3,60,000.00
Research & Development 1 27,000.00 27,000.00 3,24,000.00
Production Manager 4 26,000.00 1,04,000.00 12,48,000.00
Researchers 6 21,000.00 1,26,000.00 15,12,000.00Production Engineers 4 15,000.00 60,000.00 7,20,000.00
Unskilled Laborers 10 4,000.00 40,000.00 4,80,000.00
Skilled Laborers 60 6,000.00 3,60,000.00 43,20,000.00
Security 2 4,500.00 9,000.00 1,08,000.00
Total 98 1,65,000.00 8,25,000.00 99,00,000.00
8/7/2019 ANATARAGNI 2010 - W.I.N - i.b
http://slidepdf.com/reader/full/anataragni-2010-win-ib 38/57
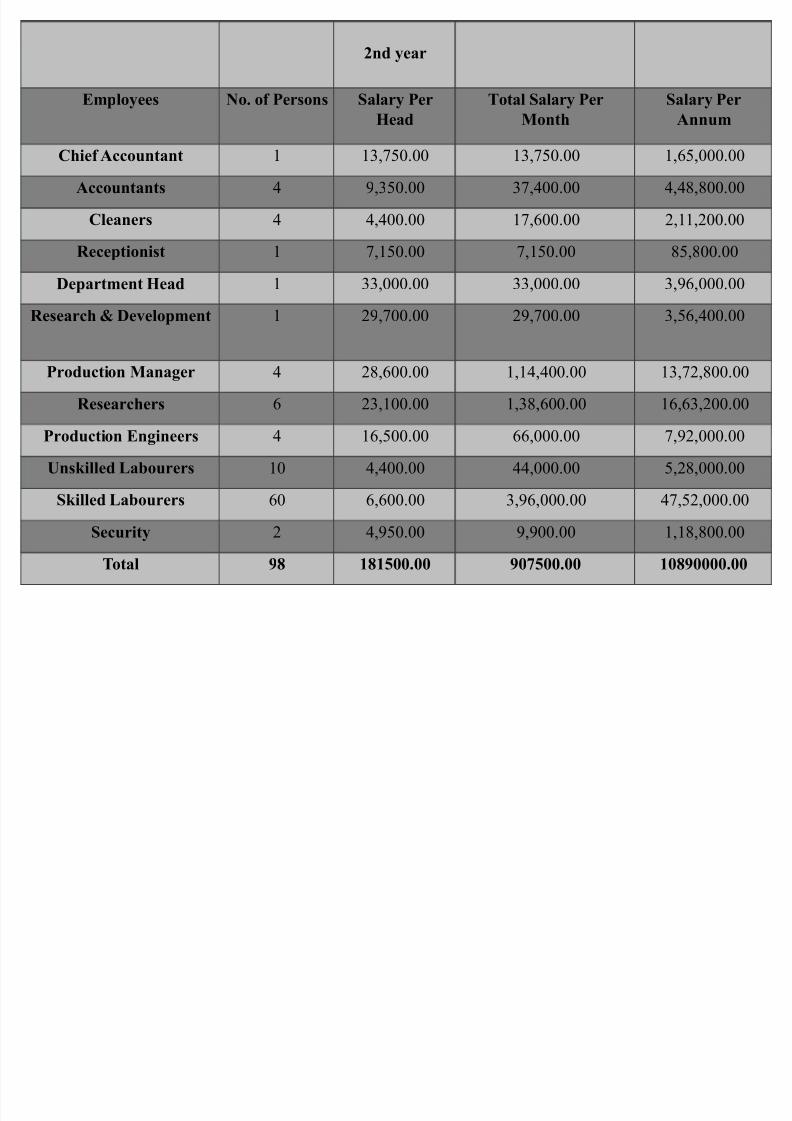
2nd year
Employees No. of Persons Salary Per
Head
Total Salary Per
Month
Salary Per
Annum
Chief Accountant 1 13,750.00 13,750.00 1,65,000.00
Accountants 4 9,350.00 37,400.00 4,48,800.00
Cleaners 4 4,400.00 17,600.00 2,11,200.00
Receptionist 1 7,150.00 7,150.00 85,800.00
Department Head 1 33,000.00 33,000.00 3,96,000.00
Research & Development 1 29,700.00 29,700.00 3,56,400.00
Production Manager 4 28,600.00 1,14,400.00 13,72,800.00
Researchers 6 23,100.00 1,38,600.00 16,63,200.00
Production Engineers 4 16,500.00 66,000.00 7,92,000.00
Unskilled Labourers 10 4,400.00 44,000.00 5,28,000.00
Skilled Labourers 60 6,600.00 3,96,000.00 47,52,000.00
Security 2 4,950.00 9,900.00 1,18,800.00
Total 98 181500.00 907500.00 10890000.00
3 d Y
8/7/2019 ANATARAGNI 2010 - W.I.N - i.b
http://slidepdf.com/reader/full/anataragni-2010-win-ib 39/57
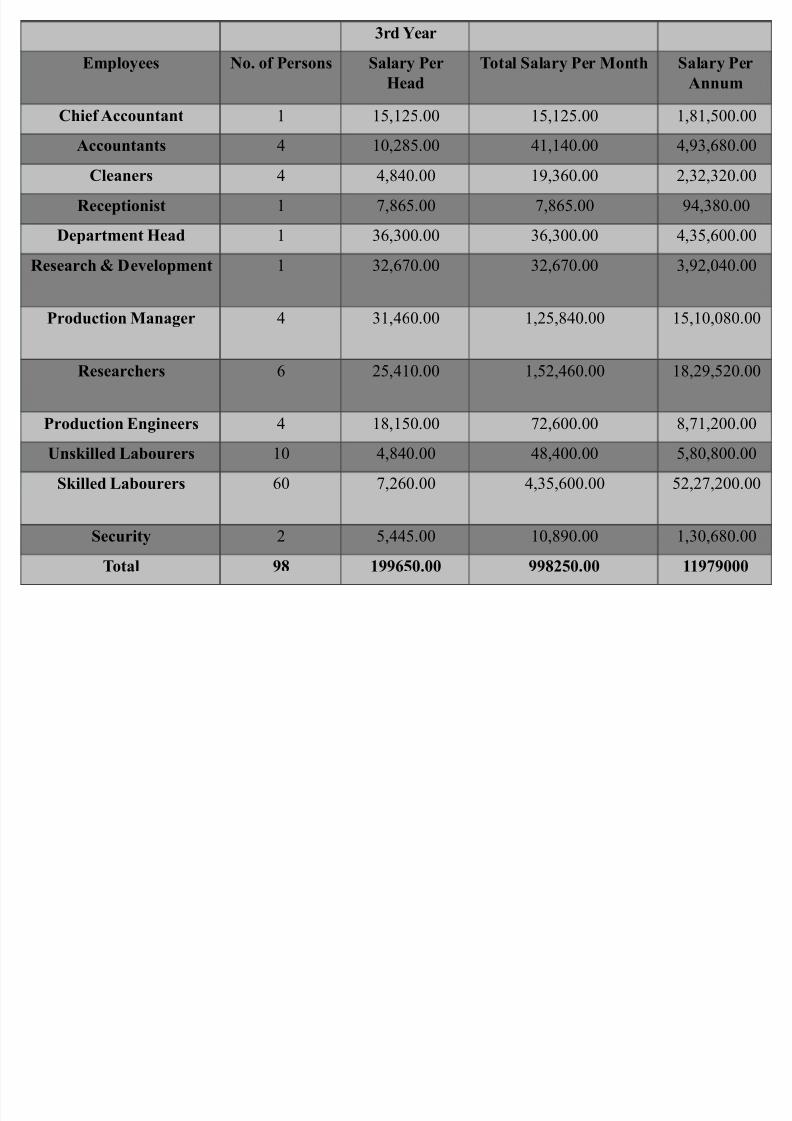
3rd Year
Employees No. of Persons Salary Per
Head
Total Salary Per Month Salary Per
Annum
Chief Accountant 1 15,125.00 15,125.00 1,81,500.00
Accountants 4 10,285.00 41,140.00 4,93,680.00
Cleaners 4 4,840.00 19,360.00 2,32,320.00
Receptionist 1 7,865.00 7,865.00 94,380.00
Department Head 1 36,300.00 36,300.00 4,35,600.00
Research & Development 1 32,670.00 32,670.00 3,92,040.00
Production Manager 4 31,460.00 1,25,840.00 15,10,080.00
Researchers 6 25,410.00 1,52,460.00 18,29,520.00
Production Engineers 4 18,150.00 72,600.00 8,71,200.00
Unskilled Labourers 10 4,840.00 48,400.00 5,80,800.00
Skilled Labourers 60 7,260.00 4,35,600.00 52,27,200.00
Security 2 5,445.00 10,890.00 1,30,680.00
Total 98 199650.00 998250.00 11979000
8/7/2019 ANATARAGNI 2010 - W.I.N - i.b
http://slidepdf.com/reader/full/anataragni-2010-win-ib 40/57
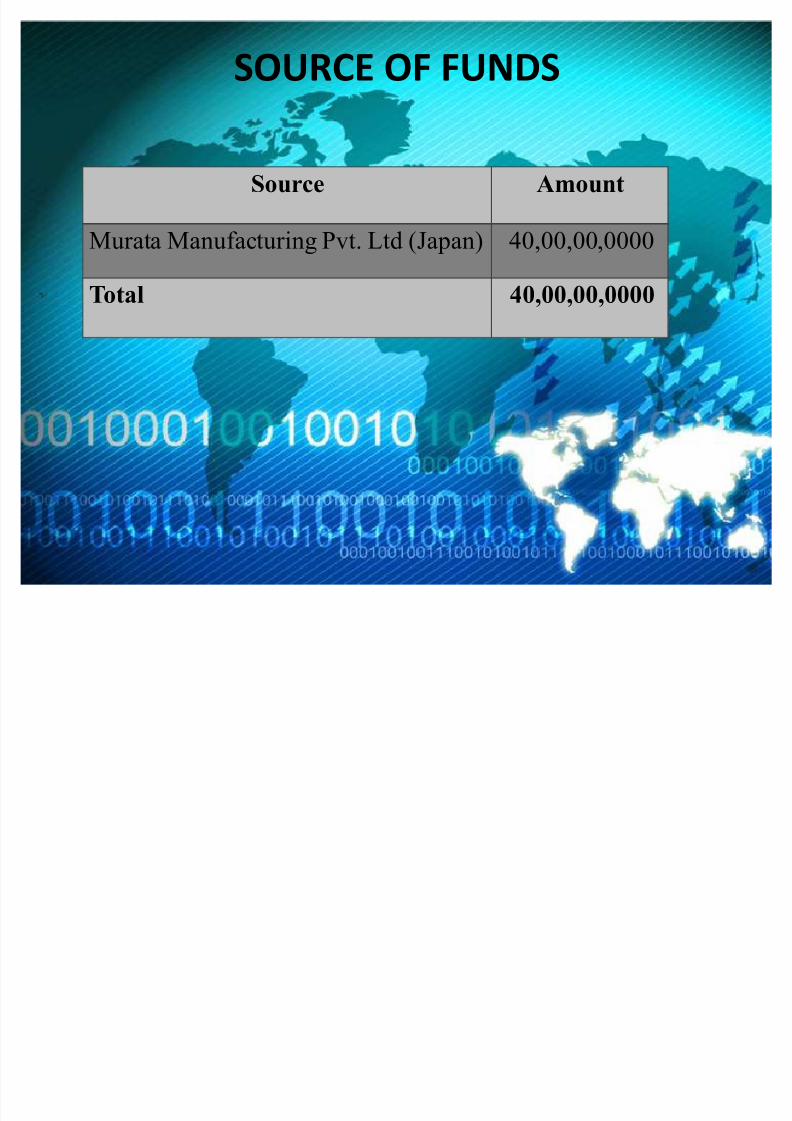
SOURCE OF FUNDS
Source Amount
Murata Manufacturing Pvt. Ltd (Japan) 40,00,00,0000
Total 40,00,00,0000
8/7/2019 ANATARAGNI 2010 - W.I.N - i.b
http://slidepdf.com/reader/full/anataragni-2010-win-ib 41/57
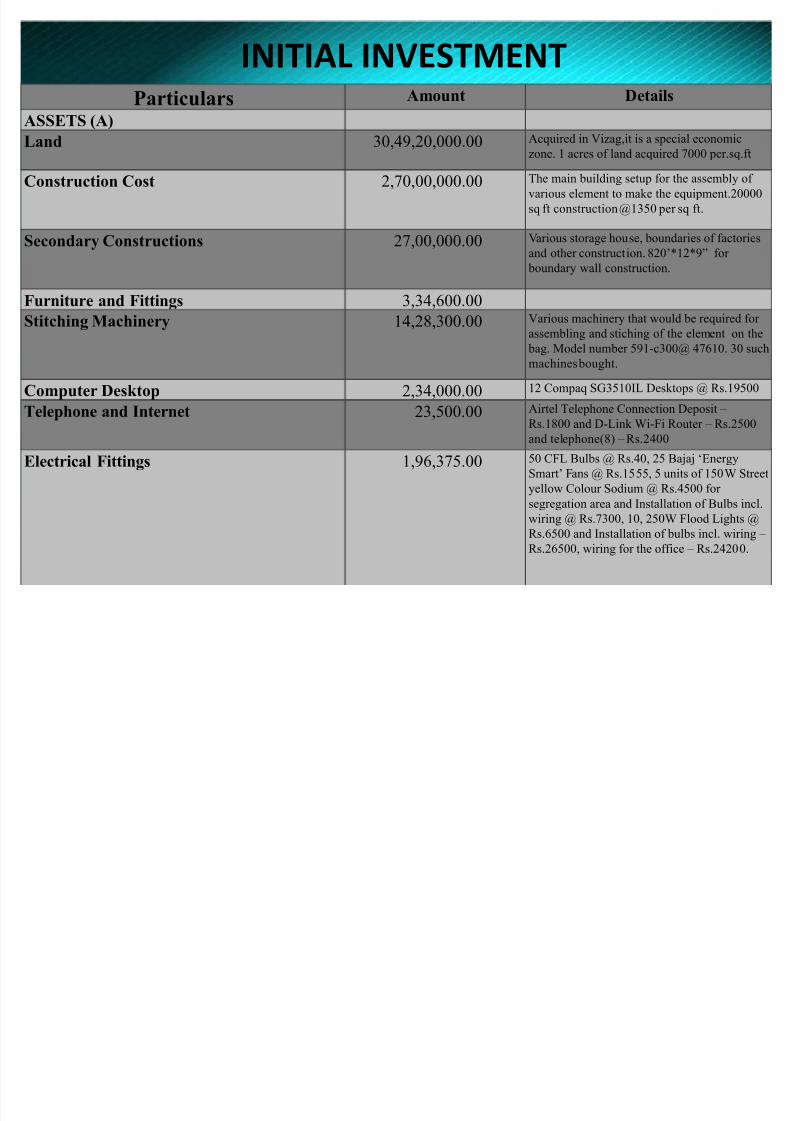
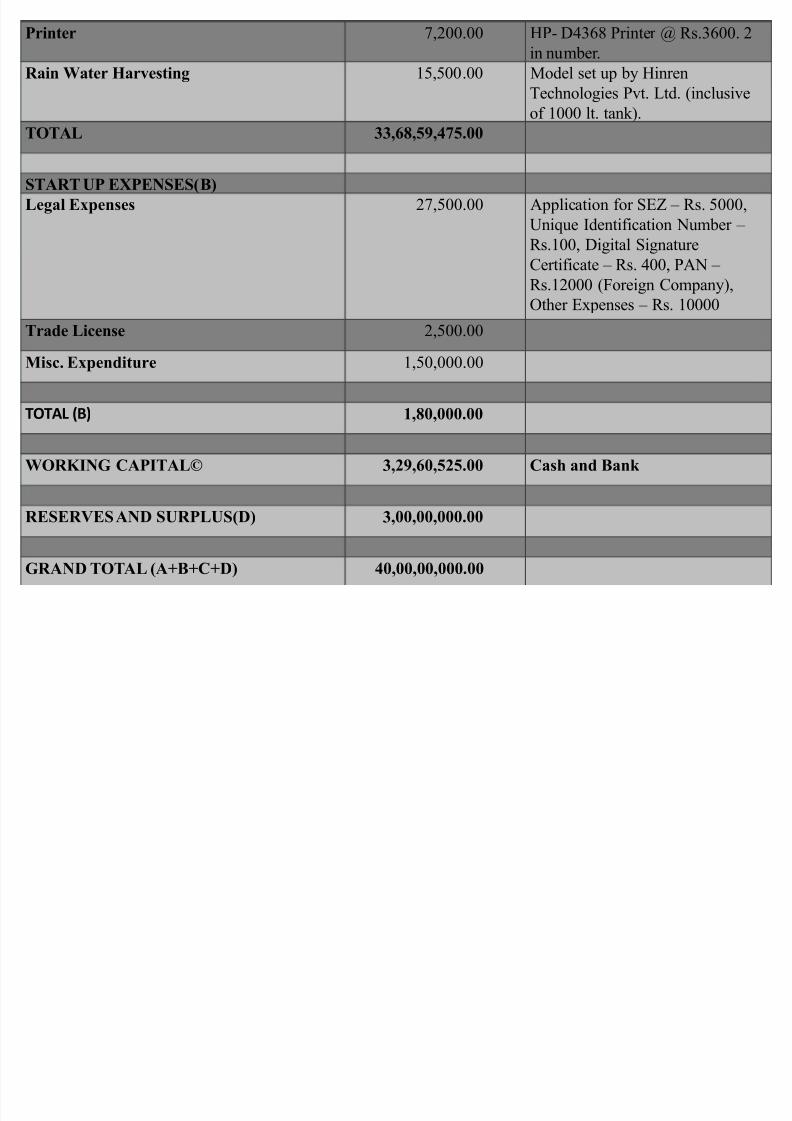
INITIAL INVESTMENTParticulars Amount Details
ASSETS (A)
Land 30,49,20,000.00 Acquired in Vizag,it is a special economiczone. 1 acres of land acquired 7000 per.sq.ft
Construction Cost 2,70,00,000.00 The main building setup for the assembly of
various element to make the equipment.20000
sq ft construction @1350 per sq ft.
Secondary Constructions 27,00,000.00 Various storage house, boundaries of factories
and other construction. 820¶*12*9´ for
boundary wall construction.
Furniture and Fittings 3,34,600.00
Stitching Machinery 14,28,300.00 Various machinery that would be required for
assembling and stiching of the element on the
bag. Model number 591-c300@ 47610. 30 such
machines bought.
Computer Desktop 2,34,000.00 12 Compaq SG3510IL Desktops @ Rs.19500
Telephone and Internet 23,500.00 Airtel Telephone Connection Deposit ±
Rs.1800 and D-Link Wi-Fi Router ± Rs.2500and telephone(8) ± Rs.2400
Electrical Fittings 1,96,375.00 50 CFL Bulbs @ Rs.40, 25 Bajaj µEnergy
Smart¶ Fans @ Rs.1555, 5 units of 150W Street
yellow Colour Sodium @ Rs.4500 for
segregation area and Installation of Bulbs incl.
wiring @ Rs.7300, 10, 250W Flood Lights @
Rs.6500 and Installation of bulbs incl. wiring ±
Rs.26500, wiring for the office ± Rs.24200.
P i t 7 200 00 HP D4368 P i t @ R 3600 2
8/7/2019 ANATARAGNI 2010 - W.I.N - i.b
http://slidepdf.com/reader/full/anataragni-2010-win-ib 42/57
Printer 7,200.00 HP- D4368 Printer @ Rs.3600. 2
in number.
Rain Water Harvesting 15,500.00 Model set up by Hinren
Technologies Pvt. Ltd. (inclusive
of 1000 lt. tank).
TOTAL 33,68,59,475.00
START UP EXPENSES(B)
Legal Expenses 27,500.00 Application for SEZ ± Rs. 5000,
Unique Identification Number ±
Rs.100, Digital Signature
Certificate ± Rs. 400, PAN ±
Rs.12000 (Foreign Company),Other Expenses ± Rs. 10000
Trade License 2,500.00
Misc. Expenditure 1,50,000.00
TOTAL (B) 1,80,000.00
WORKING CAPITAL© 3,29,60,525.00 Cash and Bank
RESERVES AND SURPLUS(D) 3,00,00,000.00
GRAND TOTAL (A+B+C+D) 40,00,00,000.00
8/7/2019 ANATARAGNI 2010 - W.I.N - i.b
http://slidepdf.com/reader/full/anataragni-2010-win-ib 43/57
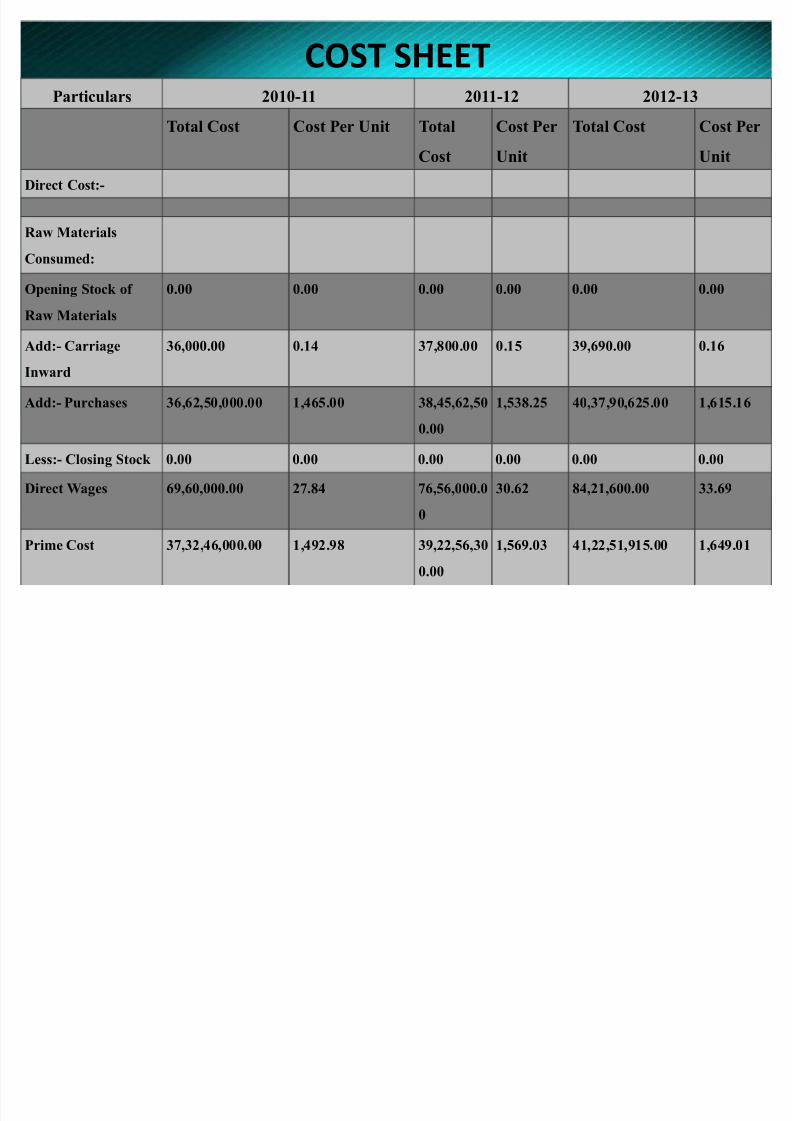
COST SHEETParticulars 2010-11 2011-12 2012-13
Total Cost Cost Per Unit Total
Cost
Cost Per
Unit
Total Cost Cost Per
Unit
Direct Cost:-
Raw Materials
Consumed:
Opening Stock of
Raw Materials
0.00 0.00 0.00 0.00 0.00 0.00
Add:- Carriage
Inward
36,000.00 0.14 37,800.00 0.15 39,690.00 0.16
Add:- Purchases 36,62,50,000.00 1,465.00 38,45,62,50
0.00
1,538.25 40,37,90,625.00 1,615.16
Less:- Closing Stock 0.00 0.00 0.00 0.00 0.00 0.00
Direct Wages 69,60,000.00 27.84 76,56,000.0
0
30.62 84,21,600.00 33.69
Prime Cost 37,32,46,000.00 1,492.98 39,22,56,30
0.00
1,569.03 41,22,51,915.00 1,649.01
8/7/2019 ANATARAGNI 2010 - W.I.N - i.b
http://slidepdf.com/reader/full/anataragni-2010-win-ib 44/57
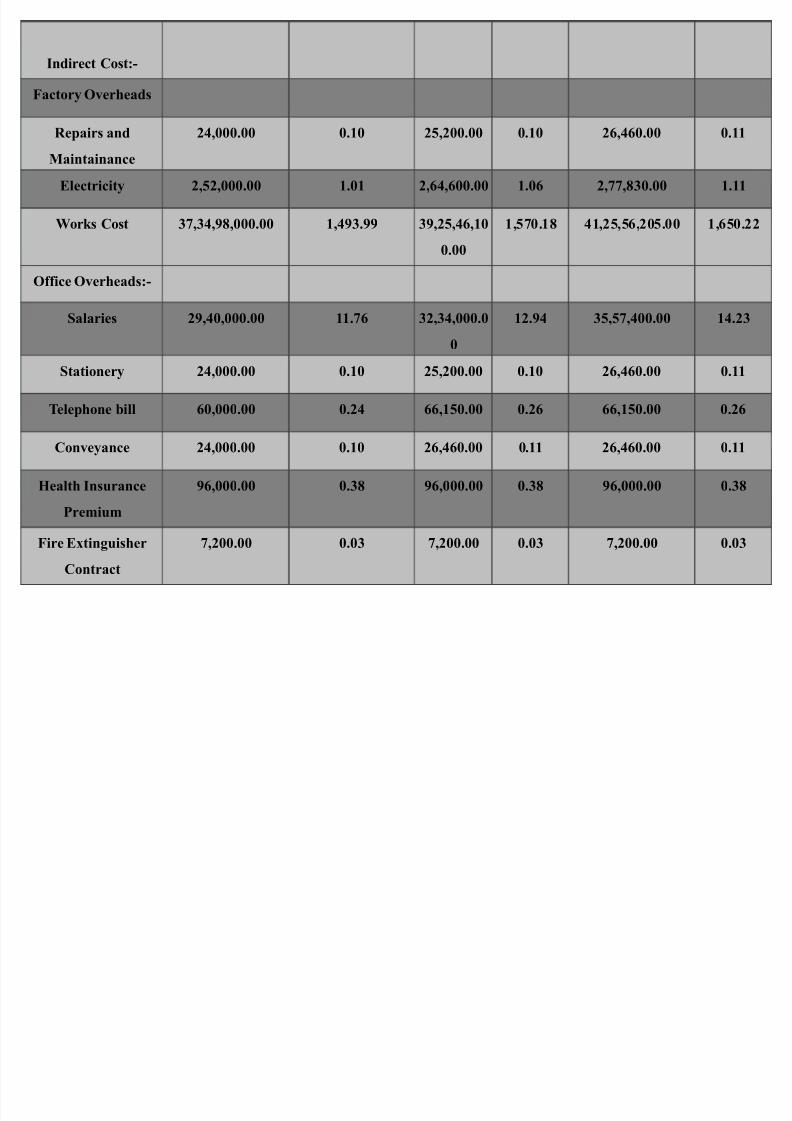
Indirect Cost:-
Factory Overheads
Repairs and
Maintainance
24,000.00 0.10 25,200.00 0.10 26,460.00 0.11
Electricity 2,52,000.00 1.01 2,64,600.00 1.06 2,77,830.00 1.11
Works Cost 37,34,98,000.00 1,493.99 39,25,46,10
0.00
1,570.18 41,25,56,205.00 1,650.22
Office Overheads:-
Salaries 29,40,000.00 11.76 32,34,000.0
0
12.94 35,57,400.00 14.23
Stationery 24,000.00 0.10 25,200.00 0.10 26,460.00 0.11
Telephone bill 60,000.00 0.24 66,150.00 0.26 66,150.00 0.26
Conveyance 24,000.00 0.10 26,460.00 0.11 26,460.00 0.11
Health Insurance
Premium
96,000.00 0.38 96,000.00 0.38 96,000.00 0.38
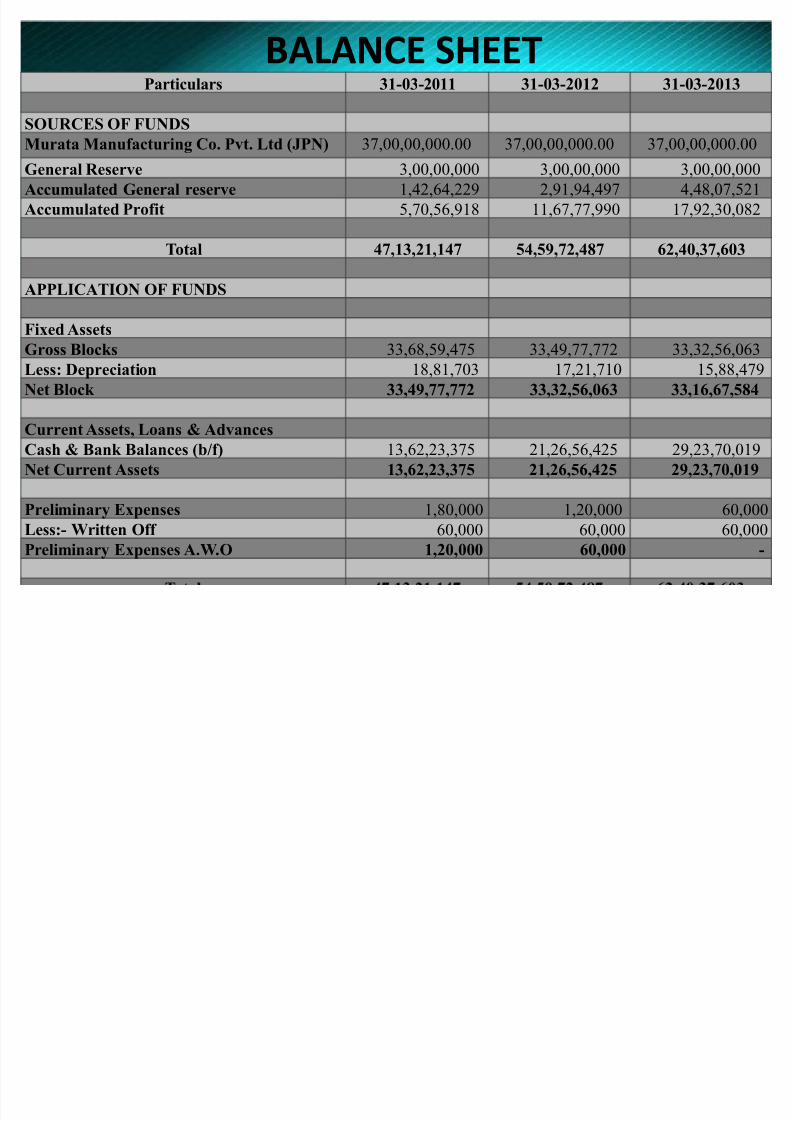
Fire Extinguisher
Contract
7,200.00 0.03 7,200.00 0.03 7,200.00 0.03
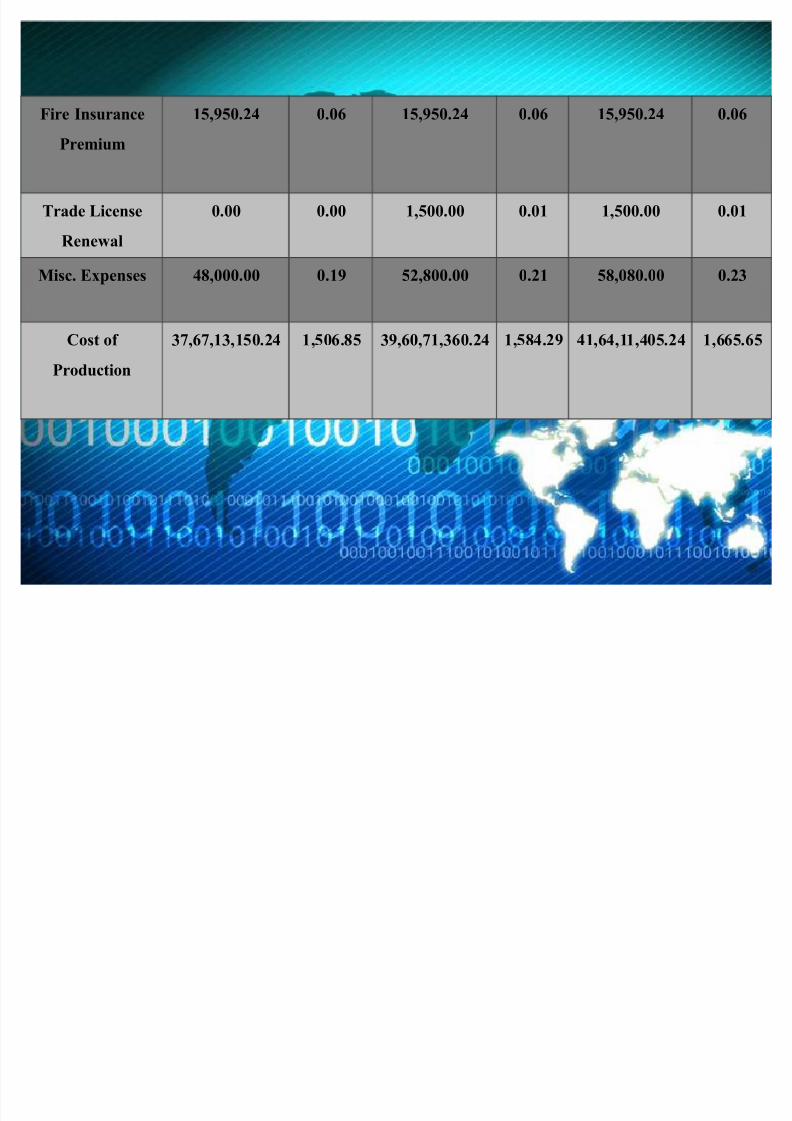
8/7/2019 ANATARAGNI 2010 - W.I.N - i.b
http://slidepdf.com/reader/full/anataragni-2010-win-ib 45/57
Fire Insurance
Premium
15,950.24 0.06 15,950.24 0.06 15,950.24 0.06
Trade License
Renewal
0.00 0.00 1,500.00 0.01 1,500.00 0.01
Misc. Expenses 48,000.00 0.19 52,800.00 0.21 58,080.00 0.23
Cost of
Production
37,67,13,150.24 1,506.85 39,60,71,360.24 1,584.29 41,64,11,405.24 1,665.65
8/7/2019 ANATARAGNI 2010 - W.I.N - i.b
http://slidepdf.com/reader/full/anataragni-2010-win-ib 46/57
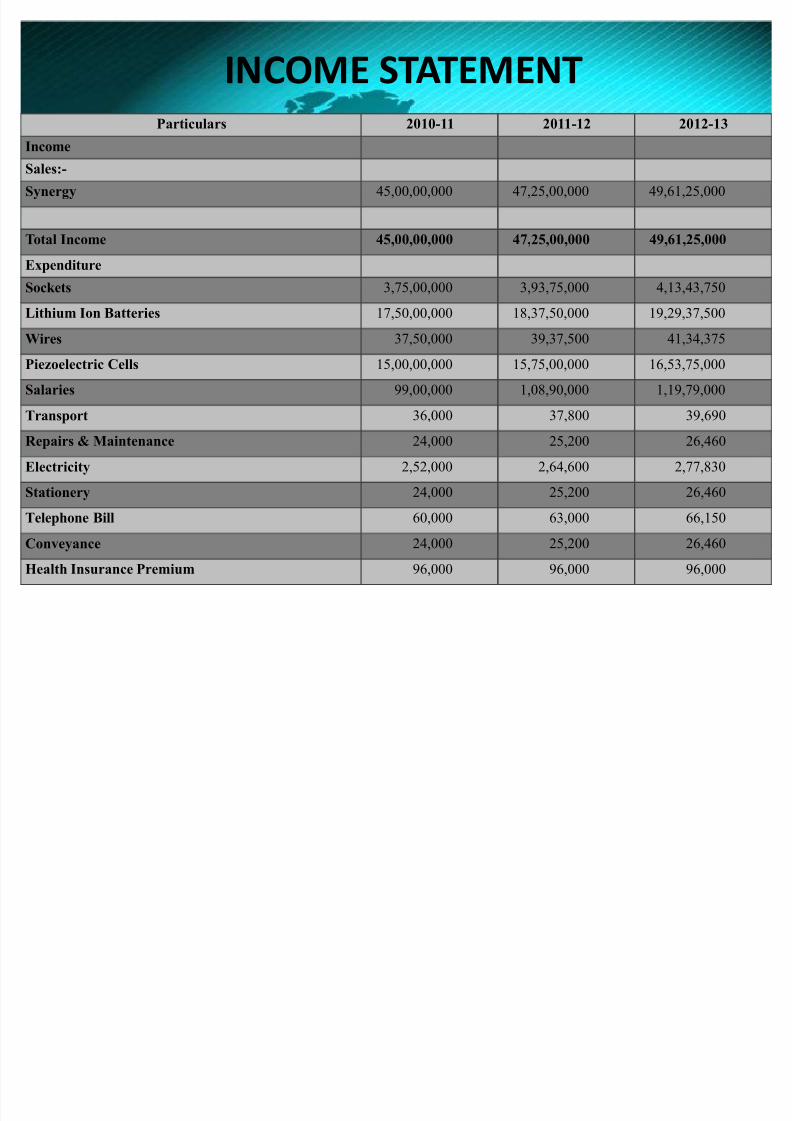
INCOME STATEMENTParticulars 2010-11 2011-12 2012-13
Income
Sales:-
Synergy 45,00,00,000 47,25,00,000 49,61,25,000
Total Income 45,00,00,000 47,25,00,000 49,61,25,000
Expenditure
Sockets 3,75,00,000 3,93,75,000 4,13,43,750
Lithium Ion Batteries 17,50,00,000 18,37,50,000 19,29,37,500
Wires 37,50,000 39,37,500 41,34,375
Piezoelectric Cells 15,00,00,000 15,75,00,000 16,53,75,000
Salaries 99,00,000 1,08,90,000 1,19,79,000
Transport 36,000 37,800 39,690Repairs & Maintenance 24,000 25,200 26,460
Electricity 2,52,000 2,64,600 2,77,830
Stationery 24,000 25,200 26,460
Telephone Bill 60,000 63,000 66,150
Conveyance 24,000 25,200 26,460
Health Insurance Premium 96,000 96,000 96,000
8/7/2019 ANATARAGNI 2010 - W.I.N - i.b
http://slidepdf.com/reader/full/anataragni-2010-win-ib 47/57
8/7/2019 ANATARAGNI 2010 - W.I.N - i.b
http://slidepdf.com/reader/full/anataragni-2010-win-ib 48/57
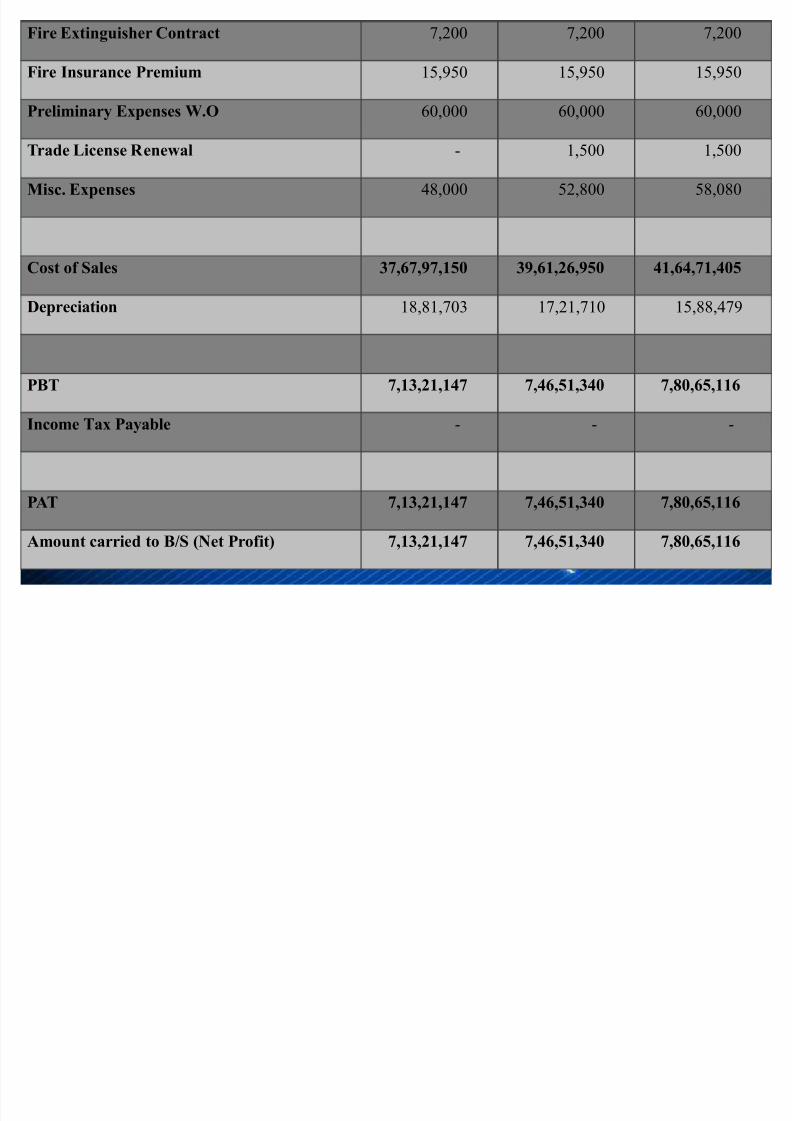
SALES BREAK - UP
1st year
Services Rates No. of Units in the year Total
Synergy 1,800 2,50,000 45,00,00,000
Total 1,800 45,00,00,000
2nd year
Services Rates No. of Units in the year Total
Synergy 1,800 2,62,500 47,25,00,000
Total 1,800 2,62,500 47,25,00,000
3rd year
Services Rates No. of Units in the year Total
Synergy 1,800 2,75,625 49,61,25,000
Total 1,800 2,75,625 49,61,25,000
8/7/2019 ANATARAGNI 2010 - W.I.N - i.b
http://slidepdf.com/reader/full/anataragni-2010-win-ib 49/57
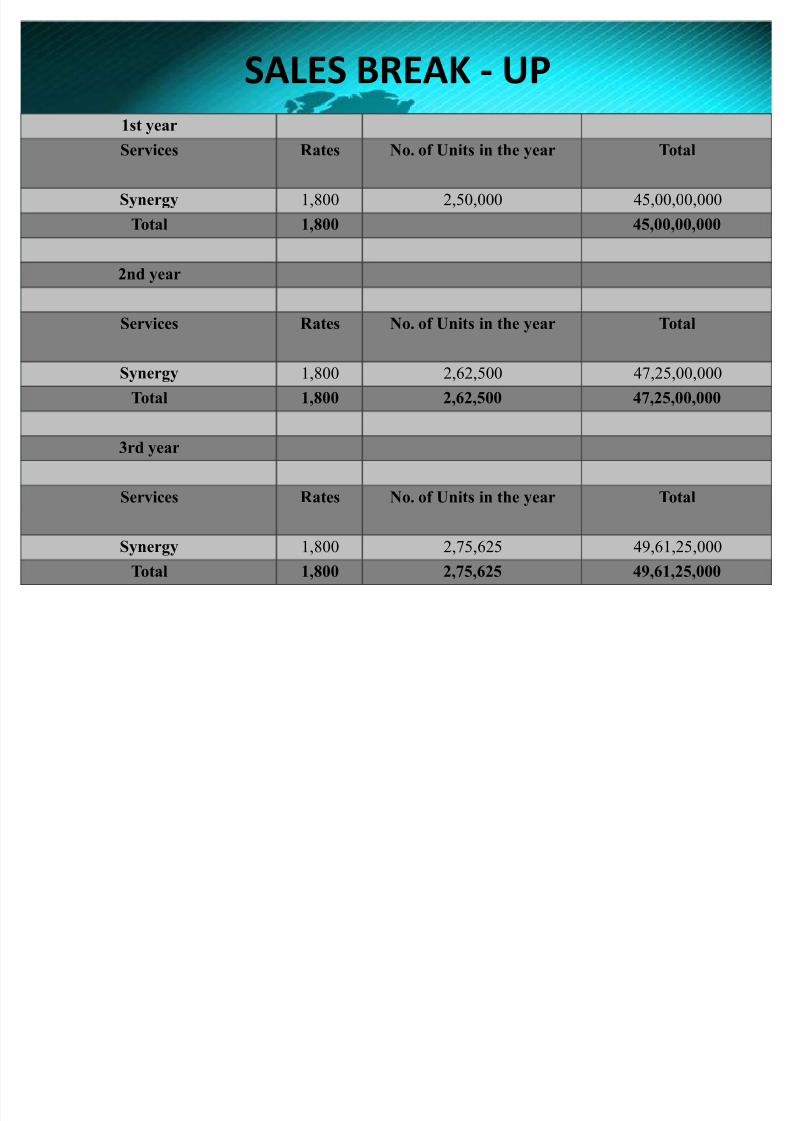
BALANCE SHEETParticulars 31-03-2011 31-03-2012 31-03-2013
SOURCES OF FUNDS
Murata Manufacturing Co. Pvt. Ltd (JPN) 37,00,00,000.00 37,00,00,000.00 37,00,00,000.00General Reserve 3,00,00,000 3,00,00,000 3,00,00,000
Accumulated General reserve 1,42,64,229 2,91,94,497 4,48,07,521
Accumulated Profit 5,70,56,918 11,67,77,990 17,92,30,082
Total 47,13,21,147 54,59,72,487 62,40,37,603
APPLICATION OF FUNDS
Fixed Assets
Gross Blocks 33,68,59,475 33,49,77,772 33,32,56,063
Less: Depreciation 18,81,703 17,21,710 15,88,479
Net Block 33,49,77,772 33,32,56,063 33,16,67,584
Current Assets, Loans & Advances
Cash & Bank Balances (b/f) 13,62,23,375 21,26,56,425 29,23,70,019
Net Current Assets 13,62,23,375 21,26,56,425 29,23,70,019
Preliminary Expenses 1,80,000 1,20,000 60,000
Less:- Written Off 60,000 60,000 60,000
Preliminary Expenses A.W.O 1,20,000 60,000 -
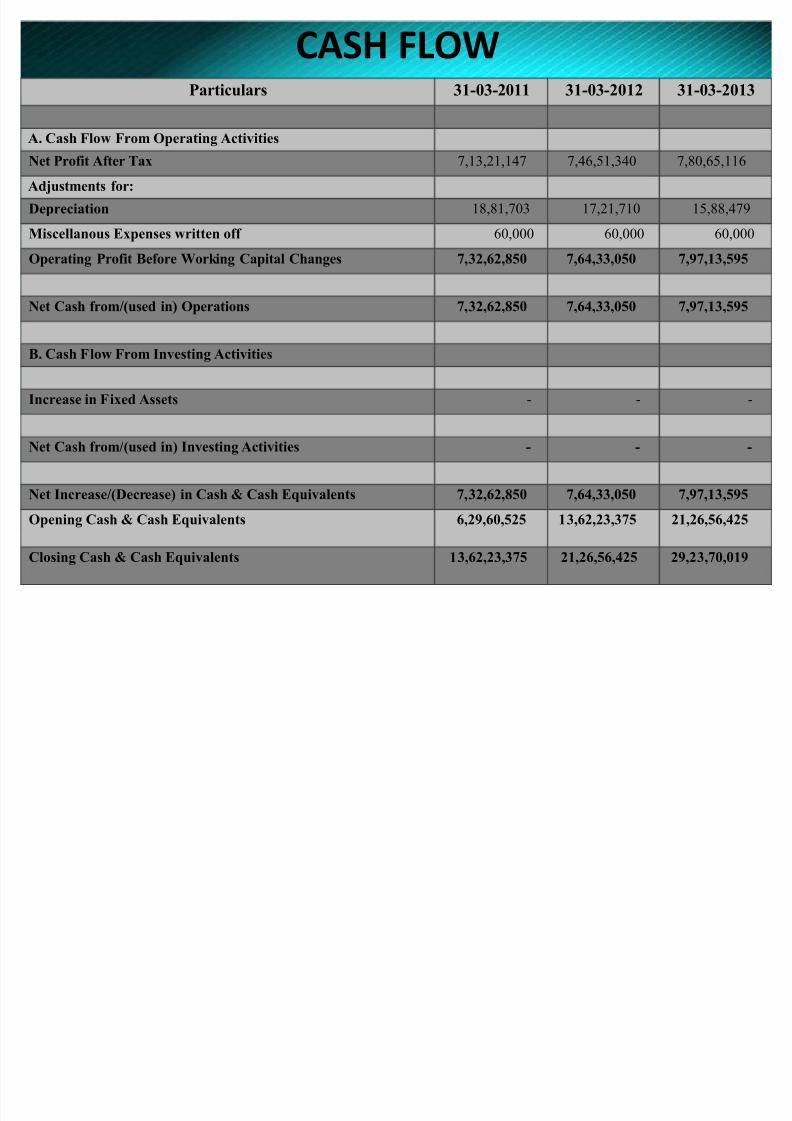
CASH FLOW
8/7/2019 ANATARAGNI 2010 - W.I.N - i.b
http://slidepdf.com/reader/full/anataragni-2010-win-ib 50/57
CASH FLOWParticulars 31-03-2011 31-03-2012 31-03-2013
A. Cash Flow From Operating Activities
Net Profit After Tax 7,13,21,147 7,46,51,340 7,80,65,116
Adjustments for:
Depreciation 18,81,703 17,21,710 15,88,479
Miscellanous Expenses written off 60,000 60,000 60,000
Operating Profit Before Working Capital Changes 7,32,62,850 7,64,33,050 7,97,13,595
Net Cash from/(used in) Operations 7,32,62,850 7,64,33,050 7,97,13,595
B. Cash Flow From Investing Activities
Increase in Fixed Assets - - -
Net Cash from/(used in) Investing Activities - - -
Net Increase/(Decrease) in Cash & Cash Equivalents 7,32,62,850 7,64,33,050 7,97,13,595
Opening Cash & Cash Equivalents 6,29,60,525 13,62,23,375 21,26,56,425
Closing Cash & Cash Equivalents 13,62,23,375 21,26,56,425 29,23,70,019
8/7/2019 ANATARAGNI 2010 - W.I.N - i.b
http://slidepdf.com/reader/full/anataragni-2010-win-ib 51/57
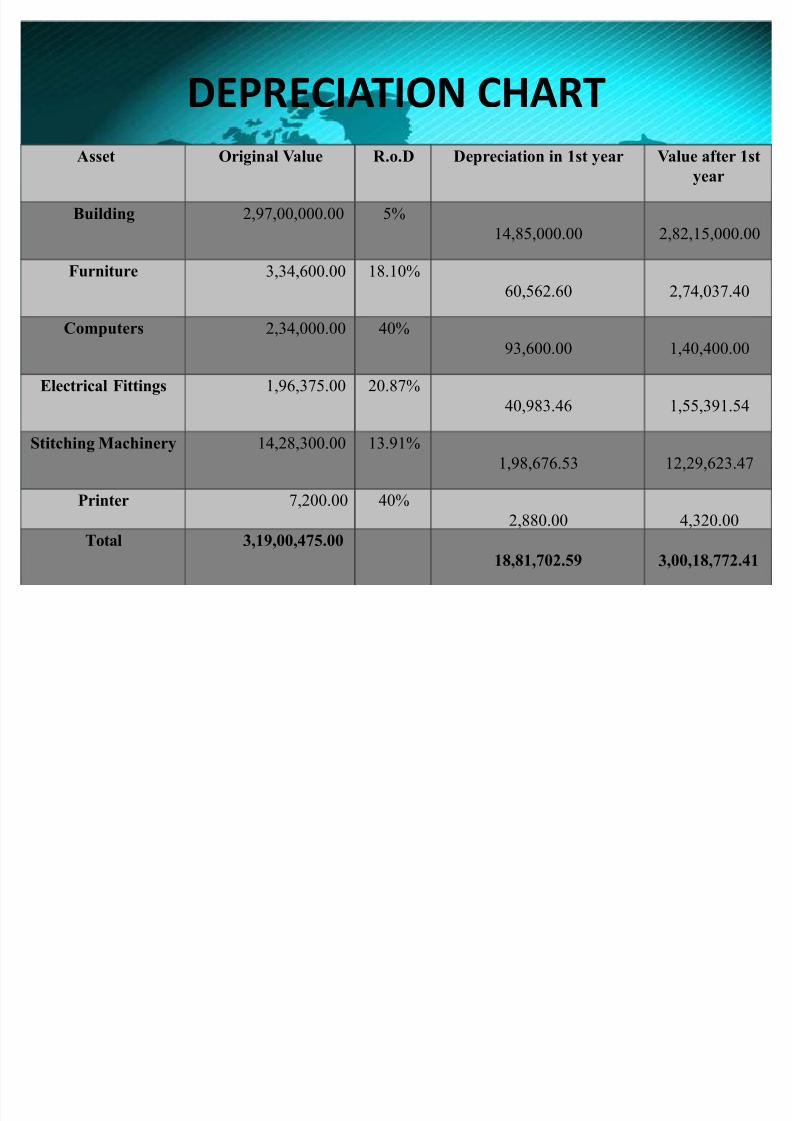
DEPRECIATION CHART
Asset Original Value R.o.D Depreciation in 1st year Value after 1st
year
Building 2,97,00,000.00 5%
14,85,000.00 2,82,15,000.00
Furniture 3,34,600.00 18.10%
60,562.60 2,74,037.40
Computers 2,34,000.00 40%
93,600.00 1,40,400.00
Electrical Fittings 1,96,375.00 20.87%
40,983.46 1,55,391.54
Stitching Machinery 14,28,300.00 13.91%
1,98,676.53 12,29,623.47
Printer 7,200.00 40%
2,880.00 4,320.00
Total 3,19,00,475.00
18,81,702.59 3,00,18,772.41
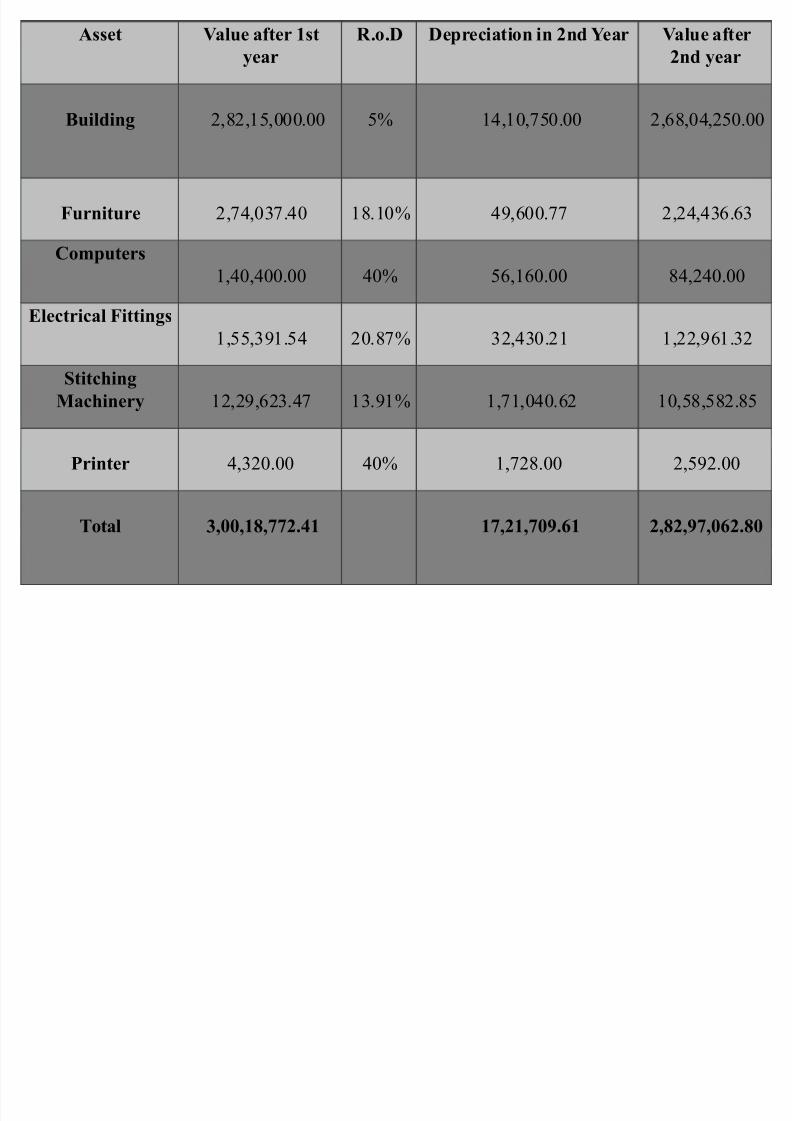
Asset Value after 1st R o D Depreciation in 2nd Year Value after
8/7/2019 ANATARAGNI 2010 - W.I.N - i.b
http://slidepdf.com/reader/full/anataragni-2010-win-ib 52/57
Asset Value after 1st
year
R.o.D Depreciation in 2nd Year Value after
2nd year
Building 2,82,15,000.00 5% 14,10,750.00 2,68,04,250.00
Furniture 2,74,037.40 18.10% 49,600.77 2,24,436.63
Computers
1,40,400.00 40% 56,160.00 84,240.00
Electrical Fittings
1,55,391.54 20.87% 32,430.21 1,22,961.32
Stitching
Machinery 12,29,623.47 13.91% 1,71,040.62 10,58,582.85
Printer 4,320.00 40% 1,728.00 2,592.00
Total 3,00,18,772.41 17,21,709.61 2,82,97,062.80
8/7/2019 ANATARAGNI 2010 - W.I.N - i.b
http://slidepdf.com/reader/full/anataragni-2010-win-ib 53/57
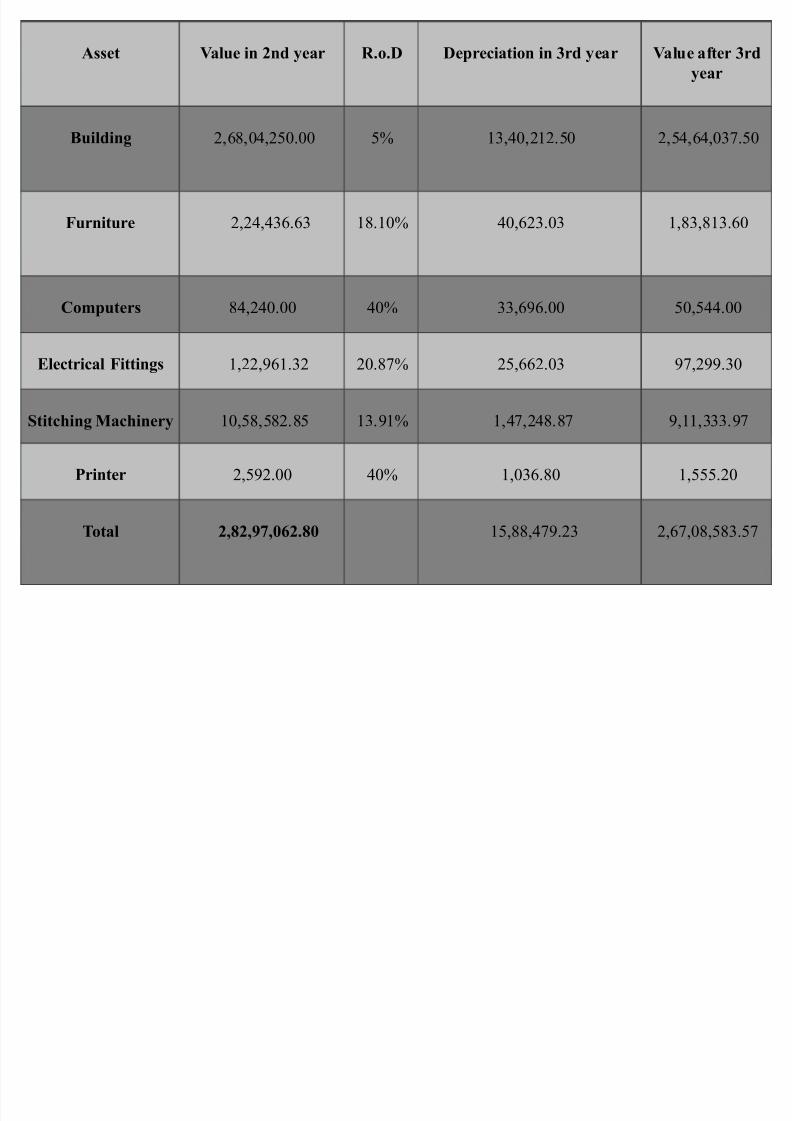
Asset Value in 2nd year R.o.D Depreciation in 3rd year Value after 3rd
year
Building 2,68,04,250.00 5% 13,40,212.50 2,54,64,037.50
Furniture 2,24,436.63 18.10% 40,623.03 1,83,813.60
Computers 84,240.00 40% 33,696.00 50,544.00
Electrical Fittings 1,22,961.32 20.87% 25,662.03 97,299.30
Stitching Machinery 10,58,582.85 13.91% 1,47,248.87 9,11,333.97
Printer 2,592.00 40% 1,036.80 1,555.20
Total 2,82,97,062.80 15,88,479.23 2,67,08,583.57
8/7/2019 ANATARAGNI 2010 - W.I.N - i.b
http://slidepdf.com/reader/full/anataragni-2010-win-ib 54/57
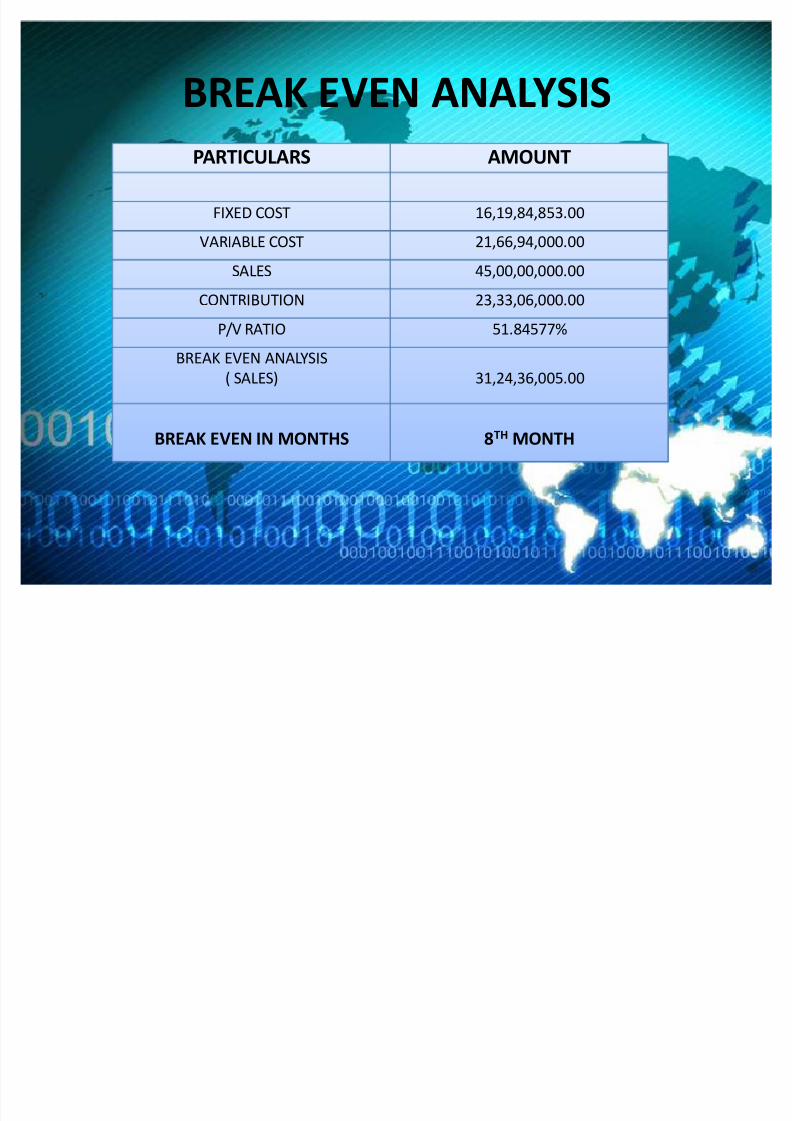
BREAK EVEN ANALYSIS
PARTICULARS AMOUNT
FIXED COST 16,19,84,853.00
VARIABLE COST 21,66,94,000.00
SALES 45,00,00,000.00
CONTRIBUTION 23,33,06,000.00
P/V RATIO 51.84577%
BREAK EVEN ANALYSIS
( SALES) 31,24,36,005.00
BREAK EVEN IN MONTHS 8TH MONTH
8/7/2019 ANATARAGNI 2010 - W.I.N - i.b
http://slidepdf.com/reader/full/anataragni-2010-win-ib 55/57
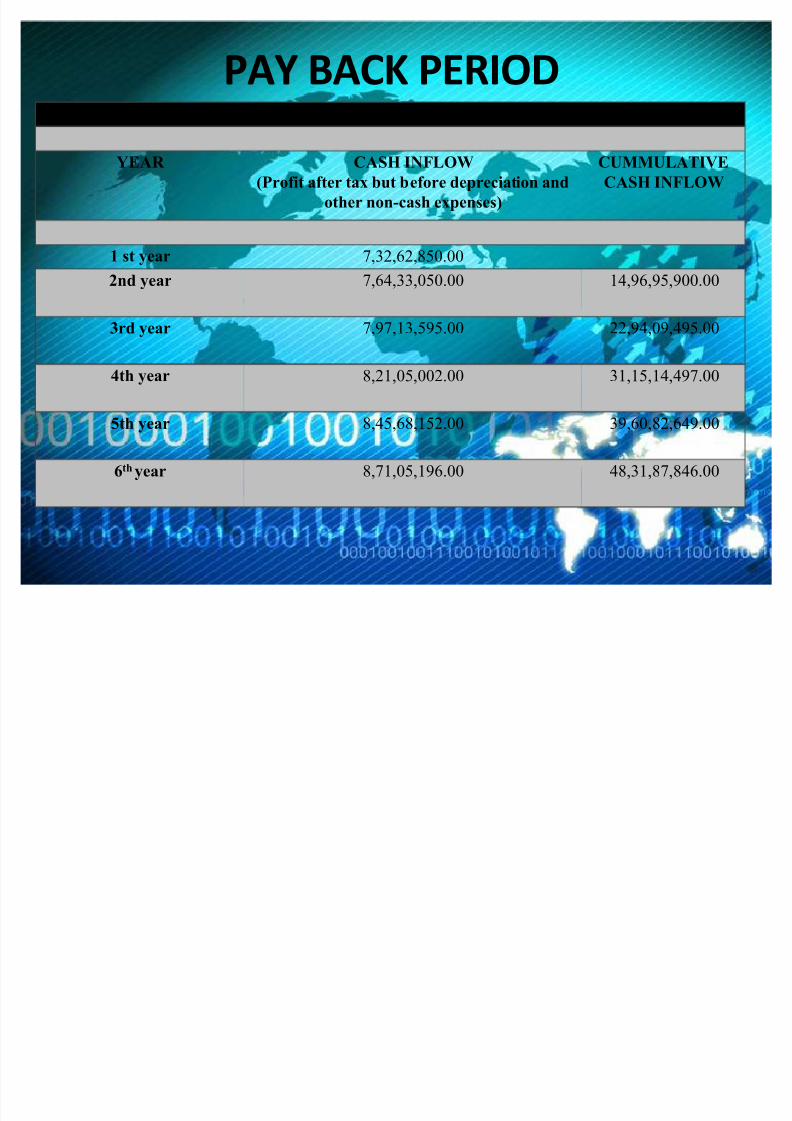
PAY BACK PERIODPAY BACK PERIOD METHOD
YEAR CASH INFLOW
(Profit after tax but before depreciation and
other non-cash expenses)
CUMMULATIVE
CASH INFLOW
1 st year 7,32,62,850.00
2nd year 7,64,33,050.00 14,96,95,900.00
3rd year 7,97,13,595.00 22,94,09,495.00
4th year 8,21,05,002.00 31,15,14,497.00
5th year 8,45,68,152.00 39,60,82,649.00
6th year 8,71,05,196.00 48,31,87,846.00
8/7/2019 ANATARAGNI 2010 - W.I.N - i.b
http://slidepdf.com/reader/full/anataragni-2010-win-ib 56/57
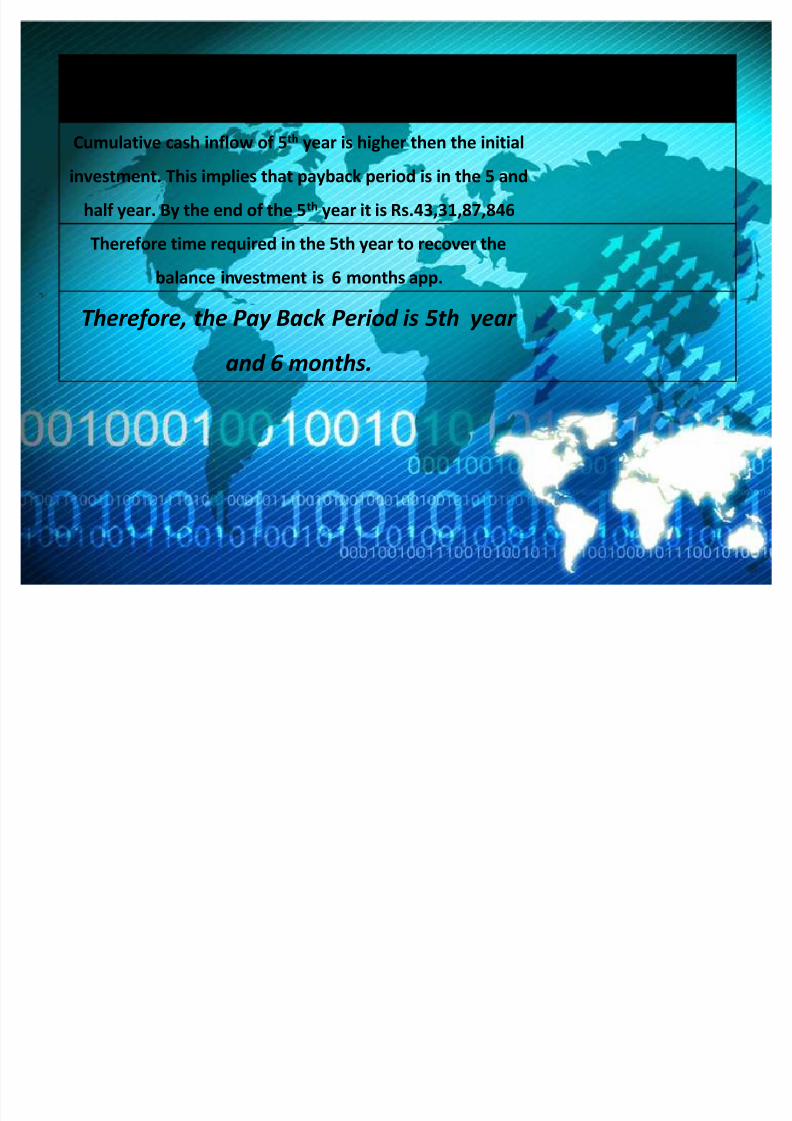
Initial
Investment
40,00,00,000.00
Cumulative cash inflow of 5th
year is higher then the initial
investment. This implies that payback period is in the 5 and
half year. By the end of the 5th year it is Rs.43,31,87,846
Therefore time required in the 5th year to recover the
balance investment is 6 months app.
Therefore, the Pay Back Period is 5th year
and 6 months.

8/7/2019 ANATARAGNI 2010 - W.I.N - i.b
http://slidepdf.com/reader/full/anataragni-2010-win-ib 57/57
THANK YOU
WE ARE NOW OPEN FOR QUERIES